1. Introduction
Direct metal additive manufacturing (AM) technologies, including laser and electron beam powder bed fusion (LPBF and EB-PBF), and directed energy deposition (DED), have drawn great attention for their advantages over conventional processing technologies in the production of complex structural parts. The non-equilibrium solidification processes occurring during the LPBF, EB-PBF, and DED technological processes could potentially be adjusted to tailor material properties to suit specific applications in the aerospace and medical device industries, among others. LPBF is a metal AM technique that was patented as selective laser sintering (SLS) in the 1990s and has since become the most widely adopted direct metal AM technology [
1]. Even though many companies today manufacture LPBF equipment, Electro Optical Systems (EOS GmbH) is the pioneer of the metal LPBF technique [
2] and one of the leading companies offering LPBF systems capable of printing parts from iron, nickel, aluminum, and titanium alloys.
Ti-6Al-4V (Ti64), one of the most common 3D-printed titanium alloys, is characterized by a unique combination of strength, toughness and corrosion resistance, low specific weight, and biocompatibility. The functional properties of Ti64 are determined by diffusion-driven and diffusionless transformations that occur during the thermomechanical history of Ti64 components [
3]. Generally, Ti64 parts contain a mixture of low-temperature hexagonal close-packed (hcp) α phase and high-temperature body-centered cubic (bcc) β phase. The mechanical properties of Ti64 are very sensitive to the geometric arrangement, morphology, size, and volume fraction of these two phases [
3,
4], and in many cases, to the crystallographic texture of a hexagonal α phase [
5]. In Ti64 alloy, vanadium (V) acts as a β stabilizer promoting the presence of small quantities of β phase at room temperature, while aluminum (Al) acts as an α stabilizer; α phase being stronger but less ductile than β phase.
LPBF-Ti64 alloy can manifest a variety of microstructures depending on the solidification rate in different zones of an LPBF part during its manufacture. During rapid solidification in the melt pool (10
5–10
6 °C/s), acicular martensitic α′ phase is formed [
5]. In the case of low to medium solidification rates (10
3–10
5 °C/s), lamellar α or acicular α′ martensite with inlaid β phase, known as the Widmanstätten structure (α
ω), or the α
ω structure variant with thinner lamellae, known as the ‘basket weave’ structure, is formed [
6]. A low solidification rate (≤10
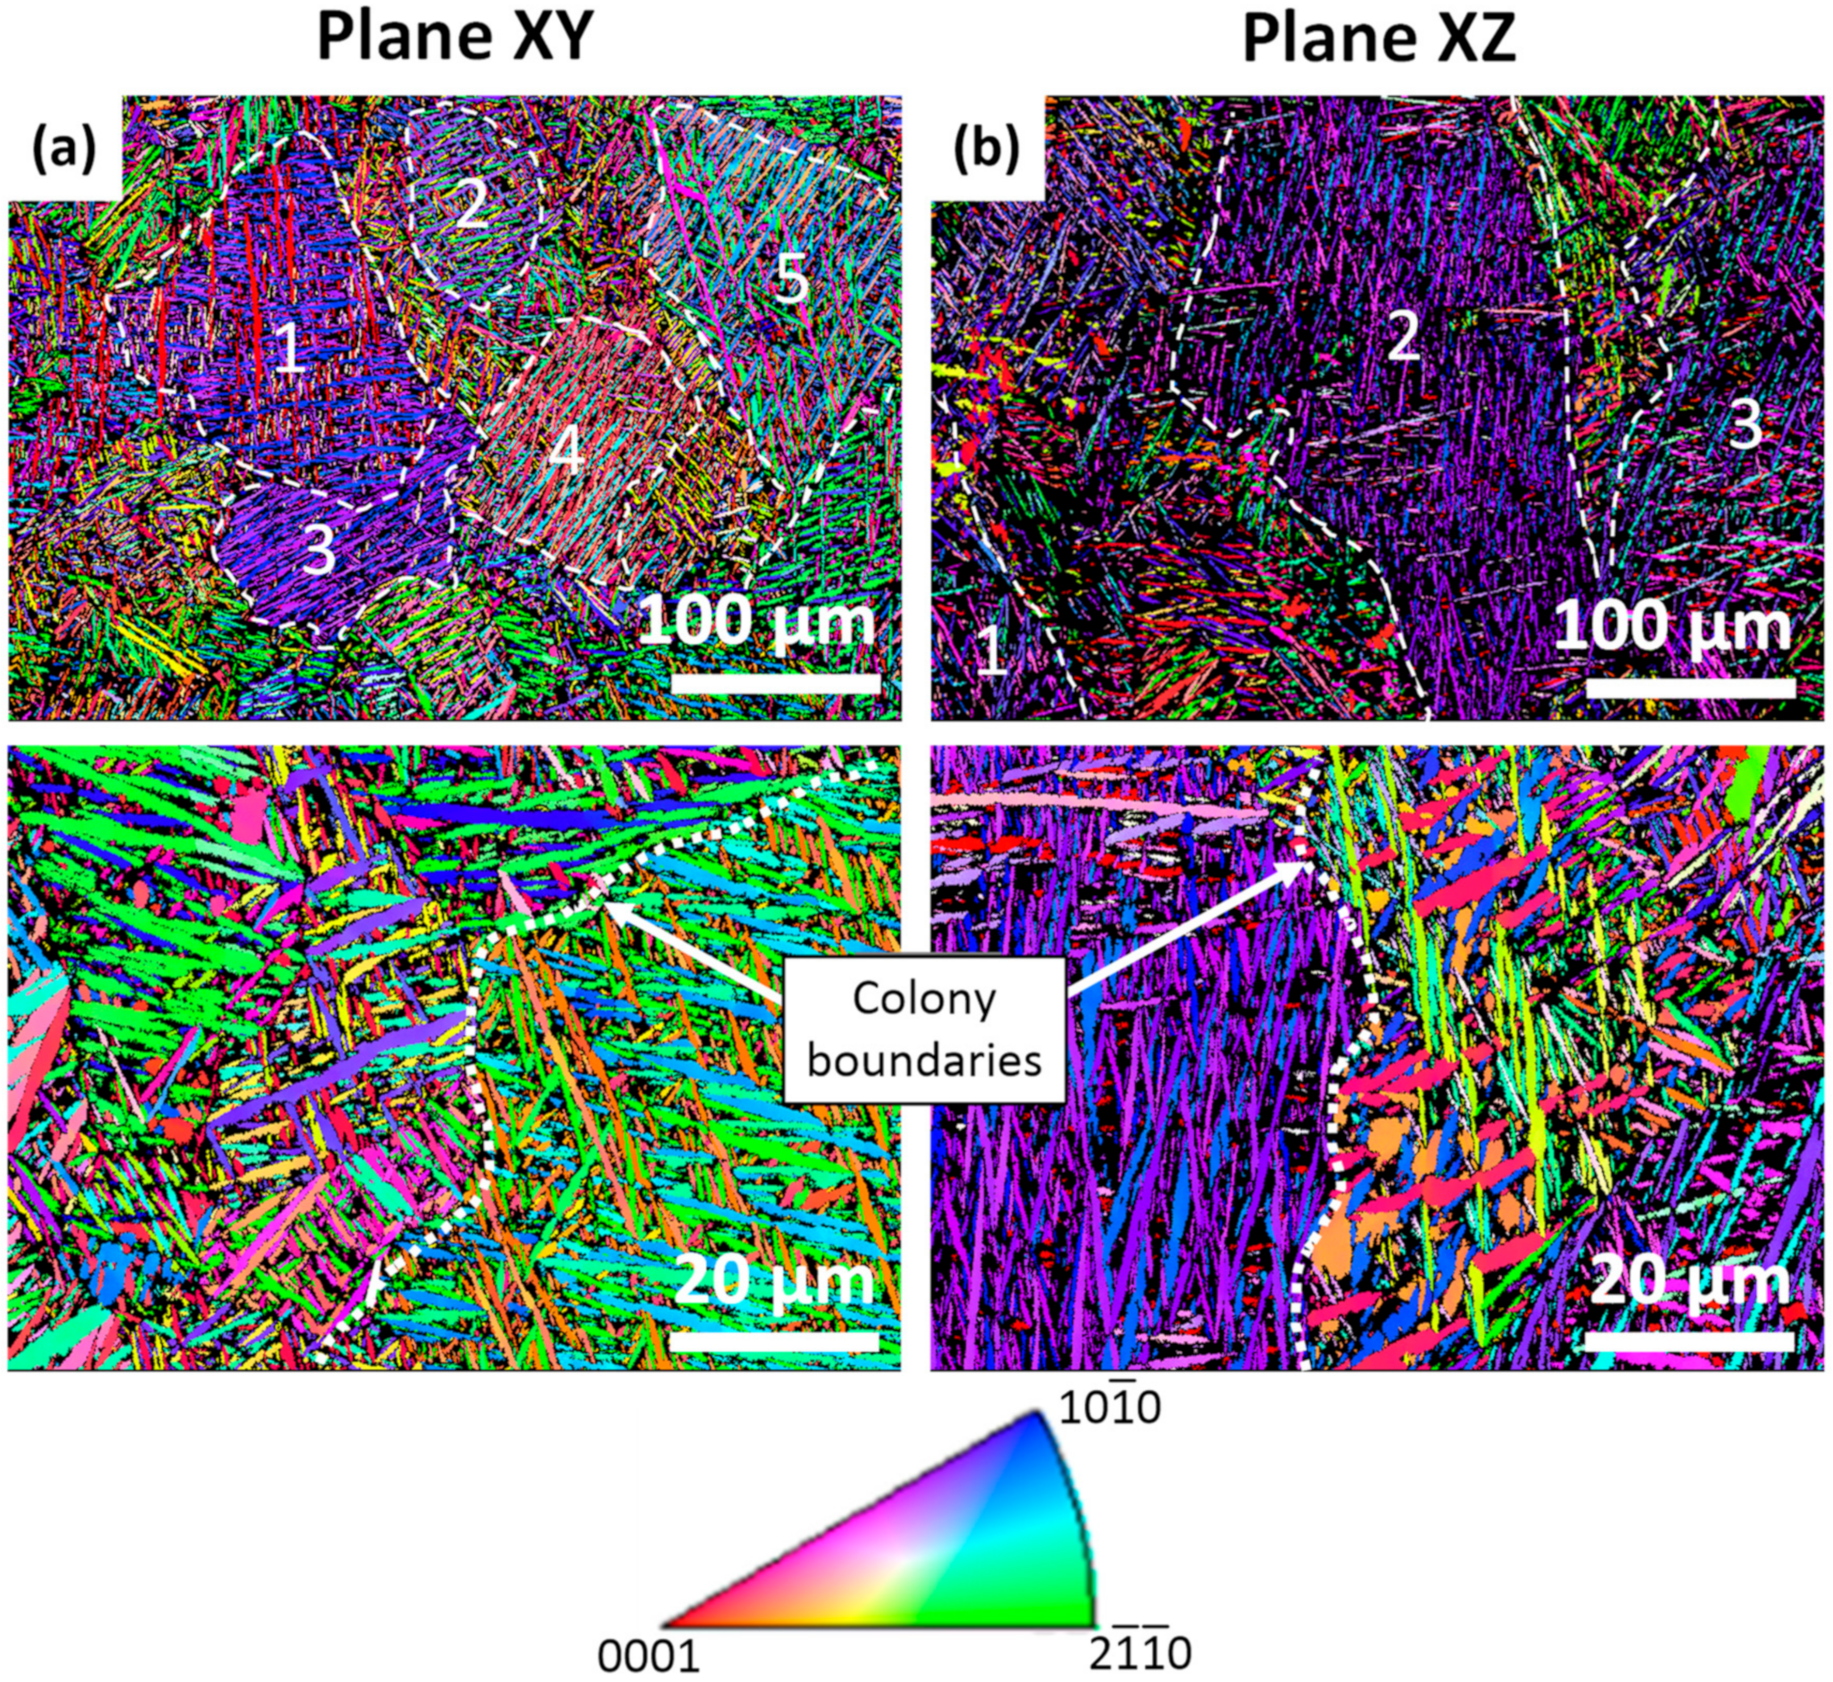
3 °C/s) can lead to the formation of colony-type microstructures where each colony consists of aligned α lamellae having identical crystallographic orientations. Zones separating the neighboring colonies, normally located in the β phase, are considered to be the colony boundaries.
Despite the significant advancements that have occurred in the LPBF technology, some internal defects, such as pores filled with gas or unmelted powder, surface-agglomerated powder particles, cracks, and distortions caused by thermal stresses, are typical for LPBF parts; therefore, after printing, bulk and surface post-treatments are generally required to improve the mechanical properties and the surface quality and geometric fit of manufactured components. Thermal treatments (stress relief annealing, β annealing, β solutioning, and aging) and hot isostatic pressing (HIP) are among the most common bulk post-treatments. Different combinations of post-LPBF thermal and thermomechanical treatments are used to release thermally induced residual stresses, and further consolidate the material by closing processing-induced pores, homogenizing, and optimizing the phase state, morphology, and texture of structural elements and consequently, improve the mechanical performance of as-built parts [
7].
Internal residual stresses are common in LPBF parts due to the highly localized energy input during very short laser-matter interaction time; therefore, stress-relieving heat treatment is one of the most applied post-treatments intended to decrease or completely remove residual stresses in the material. Normally, stress relief is carried out at low temperatures (in the range of 450 to 650 °C for Ti64) to avoid solid-state phase transformations. During post-treatments at higher temperatures, the microstructure and phase transformations occurring in the LPBF Ti64 alloy depend primarily on the as-built material microstructure, heating temperature, holding time (time spent by a sample at a maximum temperature), and cooling rate [
8]. Depending on the heating temperature and holding time applied, decomposition or transformation of martensite to other metastable phases or the formation of stable phases occur [
9,
10].
For the heating temperature, thermal treatments of LPBF Ti64 alloy can be divided into two groups: (i) subtransus heat treatments performed at temperatures below the β transus temperature (995 °C) and (ii) supertransus heat treatments performed at temperatures above the β transus temperature. Results of both heat treatments depend on the specific temperature range and cooling rate applied [
11]. For example, during subtransus heat treatments in the 750–900 °C range, acicular α′ martensite decomposes into fine α needles surrounded by β phase; however, if this decomposition is not completed and cooling to ambient temperature occurs rapidly, then the remaining α′ martensite decomposes into fine α needles surrounded by α″ phase, and once room temperature is reached, both the β and α″ phase products can be retained [
7,
8]. If the subtransus heat treatment is realized in the 900–950 °C temperature range, acicular α′ martensite decomposes into coarse α plates surrounded by the β phase. With an increase in the heat treatment temperature above 950 °C, α plates become coarser, while the β phase is segregated or dispersed within the α phase structure. For LPBF-Ti64 parts, subtransus treatments are especially recommended because they improve the alloy ductility while maintaining its high strength characteristics [
12].
On the other hand, during supertransus treatments, called beta solution treatment (BST), prior columnar β grains transform to recrystallized equiaxed grains. Note, however, that the higher the temperature, the longer the holding time and the slower the cooling rate, the coarser the α structure and the greater the amount of β phase [
10,
11,
13]. Indeed, the size of prior β phase grains influences the size of α colonies: the bigger the prior β grain size, the larger the α colonies. Because of the preceding, the temperature and holding time during supertransus treatments are generally limited to prevent excessive growth of α grains and colonies, and, consequently, to avoid significantly decreasing the static and fatigue resistance of LPBF Ti64 components [
8,
14,
15]. For example, to increase the fracture toughness, thermal stability, and creep resistance of LPBF Ti64 components while slightly compromising their static and fatigue resistance, the holding time is generally varied from 1 to 4 h, thus forming a coarse lamellar α phase structure in the alloy [
13,
16].
To improve the mechanical strength of BST-processed Ti64 alloy parts, they can be quenched to transform the β phase into α′ martensite and decompose the latter to a fine α/β structure during overaging (OA) at T > 600 °C [
17]. A hardening effect after BST of some β Ti alloys can also be obtained by aging in the α + β region (400–650 °C) via the formation of nanometer-sized α
2 (Ti
3Al) particles [
18] or α phase precipitates [
19]. The tensile yield stress of the beta solution treated and overaged cast Ti64 alloys was reported to be almost 4% higher than that of the same alloys in the annealed conditions [
20]; however, since all the thermal treatments of Ti64 must be performed under controlled atmosphere, BST followed by quenching and then overaging poses some technological difficulties from the industrial point of view; therefore, combining BST with OA in a single thermal treatment cycle with a furnace cooling from the BST to the OA temperature can be industrially more relevant than quenching from BST followed by heating to the OA temperature [
20]. In this case, overaging is intended to promote α→β transformation, which would initiate at the α/β boundaries and consume the interface phase formed during the slow cooling step [
21]. As a result, the alloy will exhibit higher elongation and strength characteristics as compared to the BST treatment [
21,
22]. Moreover, high-cycle fatigue testing showed an inverse effect with respect to the quench rate, where the use of higher quench rates (50 °F/min) led to lower runouts than slower quench rates (150 °F/min) [
20].
Hot isostatic pressing (HIP) is another recommended post-processing treatment for LPBF Ti64 alloys. Standard HIP treatment (ASTM F3001) for LPBF Ti64 is conducted below the β transus temperature, and could therefore be classified as a subtransus treatment. Similar to the other subtransus treatments, HIP of the as-built LPBF Ti64 alloys decomposes α′ martensite into more ductile α and β phases [
23]. Moreover, due to the reduction in processing-induced defects and, therefore, the risks of crack initiation, HIP-ed LPBF Ti64 components generally manifest a higher density and better ductility and fatigue resistance than their conventional LPBF counterparts [
24]. Note, however, that even though HIP conditions could be selected to ensure the closure of internal pores, those near the part surface cannot be healed under any circumstances [
7]. Moreover, the longer the HIP treatments, the coarser the microstructures, and the less mechanically resistant the printed part could be.
Clearly, to optimize post-processing treatment conditions, the interrelations between the LPBF Ti64 alloy microstructures formed during such treatments and the alloys’ static and fatigue mechanical properties must be comprehensively investigated; however, the vast majority of studies on post-treatment of LPBF Ti64 alloys have been carried out for different laser powder bed fusion conditions and, therefore, for different as-built microstructures [
5,
12,
13], thus complicating comparisons of the results obtained and making it difficult to select an appropriate post-treatment; therefore, this work aims to study the evolution of the microstructure of Ti64 specimens printed under identical LPBF conditions but subjected to different PTs. The PT protocols selected for this study are designed to determine the most efficient, and yet least complex, alternative adapted for LPBF Ti64 parts. Structural features of the LPBF Ti64 alloy before and after post-treatments are studied using X-ray diffraction (XRD), Scanning Electron Microscopy (SEM), and Electron Backscatter Diffraction (EBSD) techniques, and then correlated with the material hardness, static and fatigue mechanical properties.
2. Materials and Methods
2.1. Specimens Preparation
Specimens of this study were prepared using a gas-atomized Ti-6Al-4V powder with a 20 to 63 μm particle size distribution supplied by AP&C (GE Additive), (Boisbriand, QC, Canada). The powder composition (wt.%) was as follows: Ti: bal., Al: 6.69, V: 3.62, Fe: 0.20, C: 0.06, O: 0.13, H: 0.0022 and N: 0.01, as measured using Inductively Coupled Atomic Emission Spectrometry (ICAP-AES, ASTM E1479), Inert Gas Fusion (IGF, ASTM E1447 and E1409), and Combustion (ASTM E1941) techniques.
The specimens were manufactured using an EOSINT M280 LPBF system (EOS GmbH, Munich, Germany) equipped with a 400 W ytterbium fiber laser (effective beam radius of 40 µm) and a standard EOS ceramic doctor blade. The following EOS recommended LPBF processing parameters were used: laser power 340 W; scanning speed 1250 mm/s; hatching space 120 µm; layer thickness 60 µm.
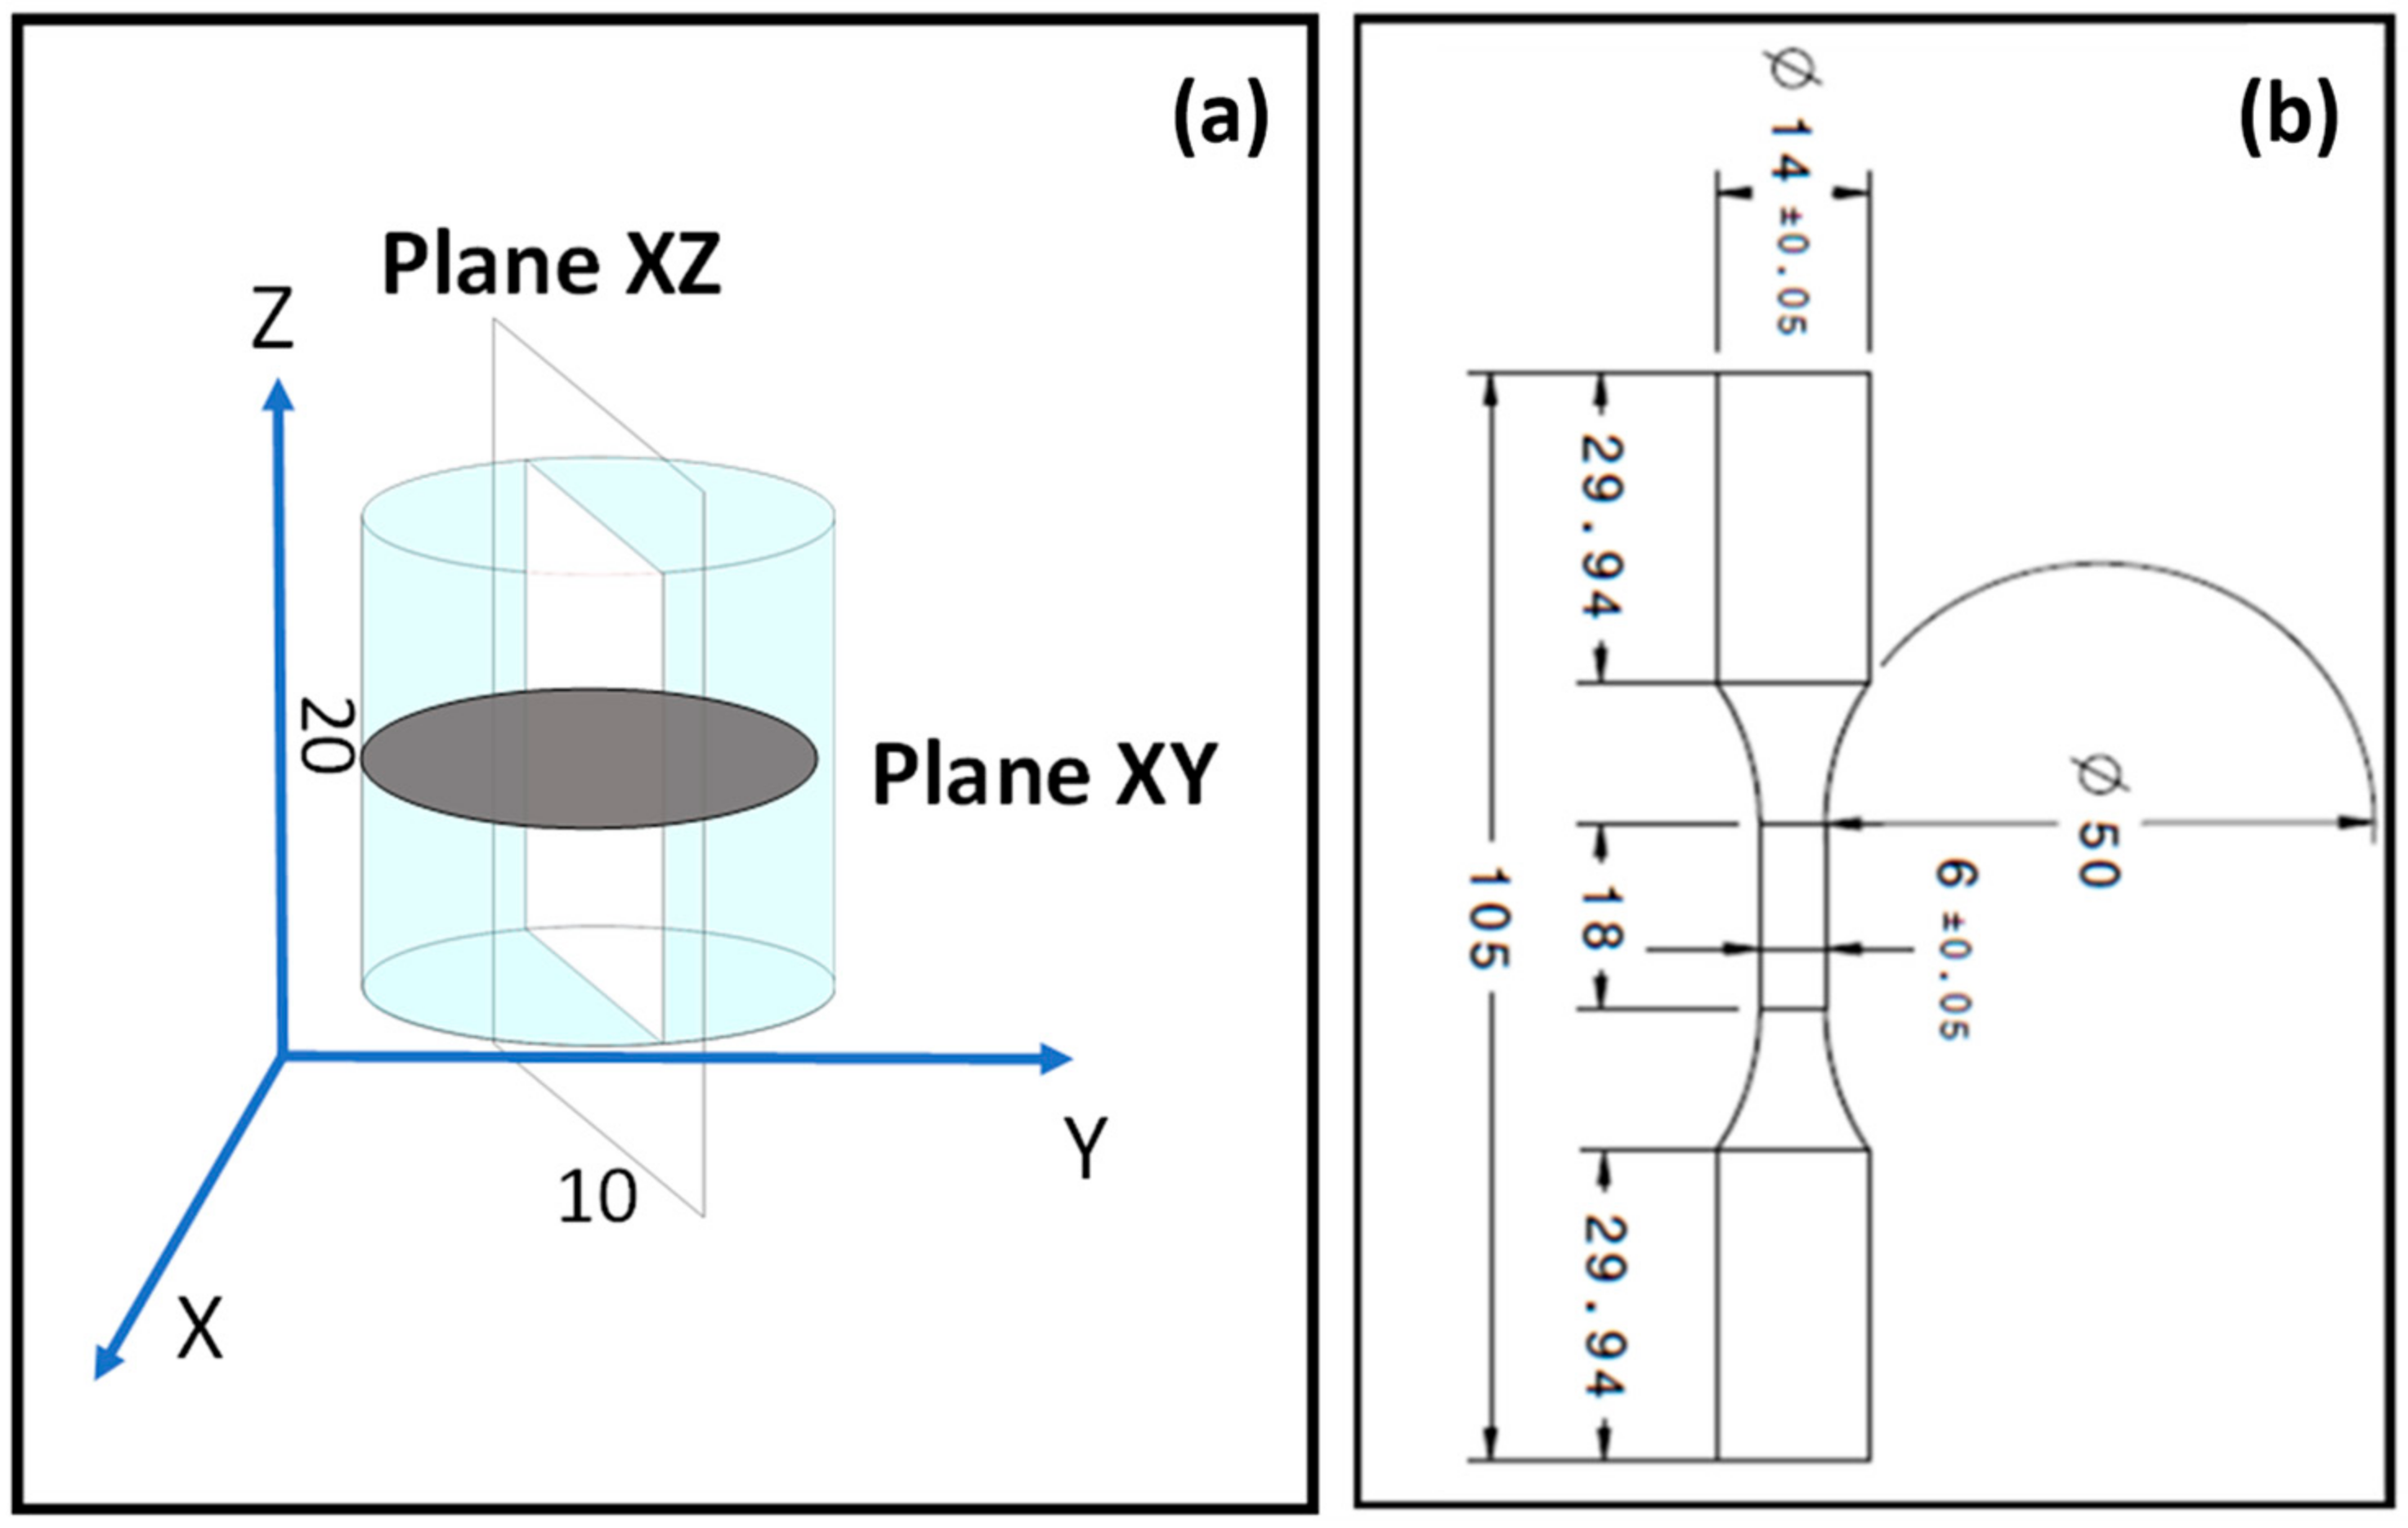
In total, 3 different as-built (AB) specimens were manufactured: (i) cylindrical 10 mm-diameter, 20 mm-height specimens for microstructural analysis (
Figure 1a), and (ii) uniaxial tensile static and fatigue specimens (ASTM E466,
Figure 1b). Note that the static and fatigue testing specimens were manufactured with the Z orientation (perpendicular to the build plate or parallel to the building direction).
After LPBF, the level of processing-induced porosity in the AB specimens was evaluated by X-ray microcomputed tomography (Nikon XT H225 CT, Nikon, Tokyo, Japan): effective voxel size 13 and 7.5 μm, beam energy, current 205 kV and 60 μA, power 12.3 W, exposure 1.41 fps, and gain 24 dB. The porosity level detected in the AB specimens was lower than 0.01%.
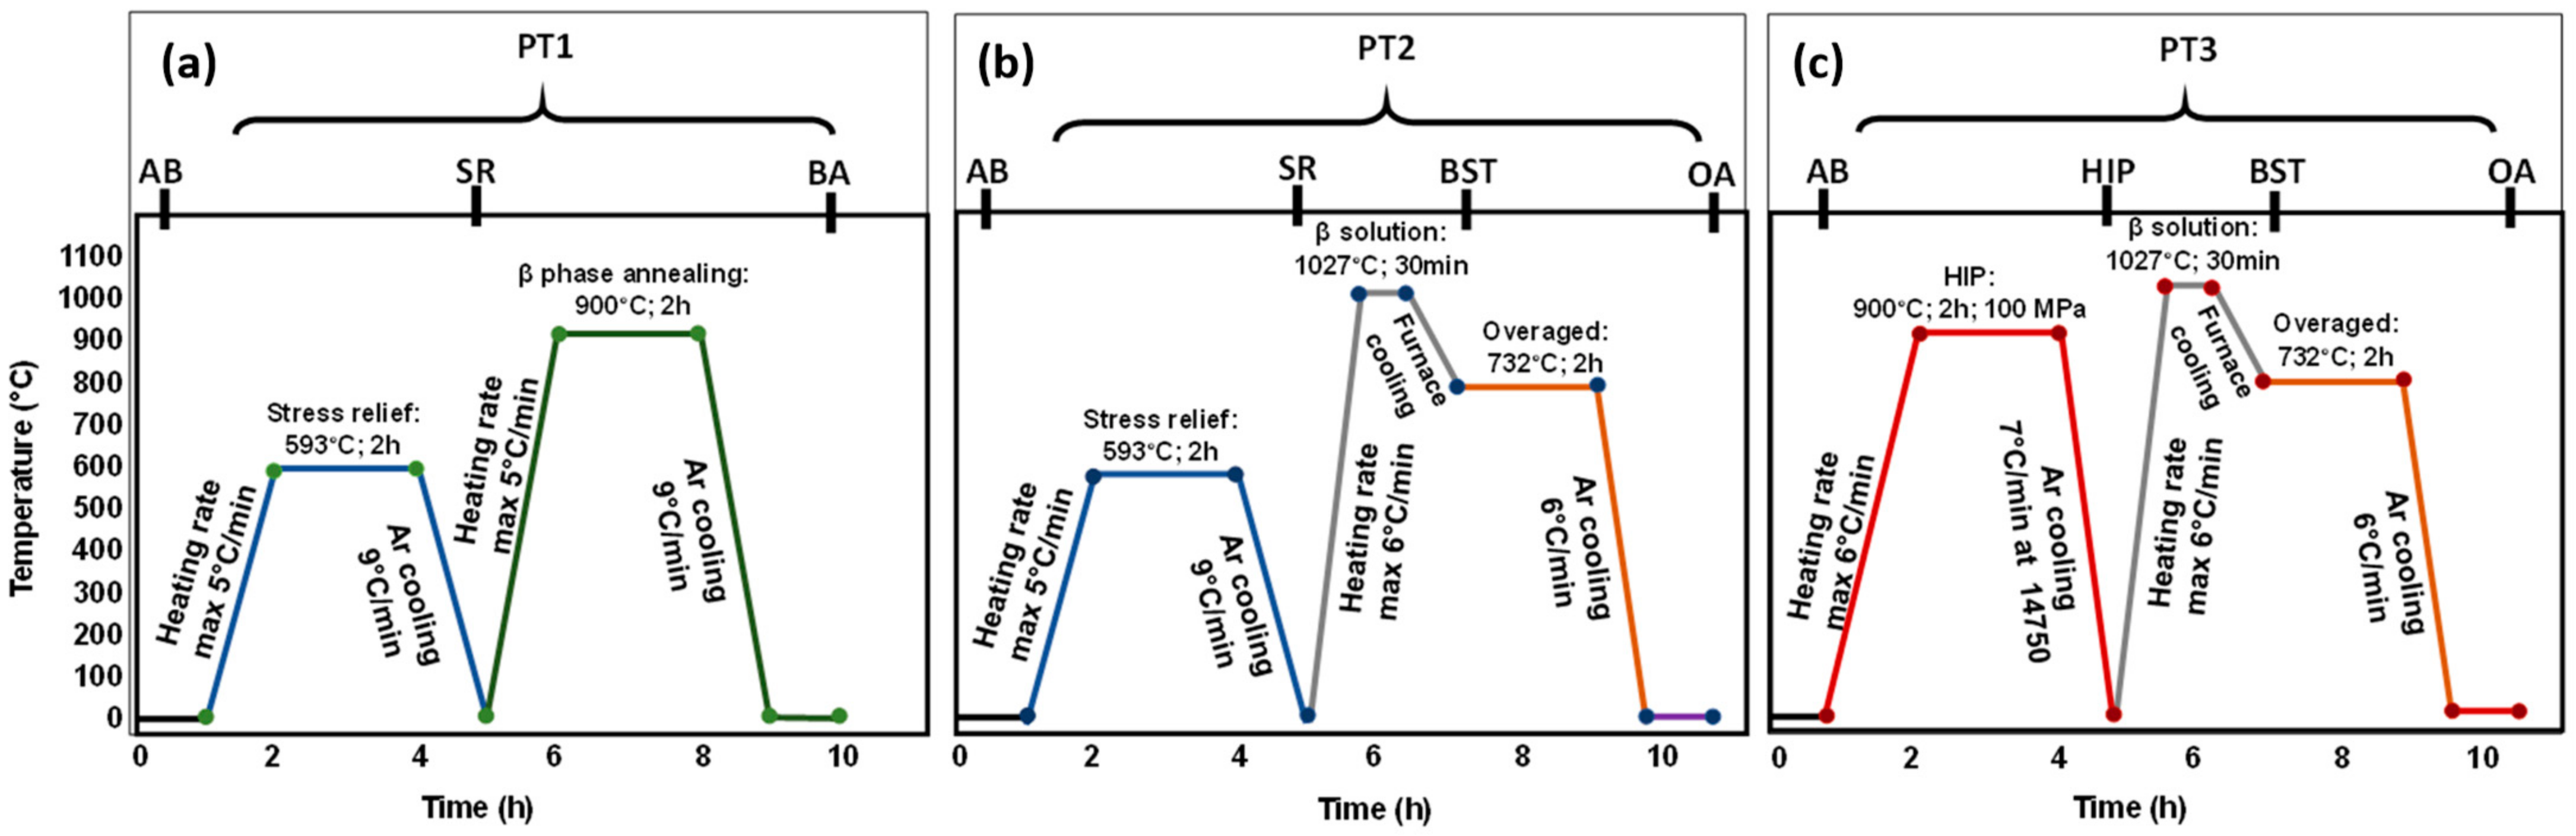
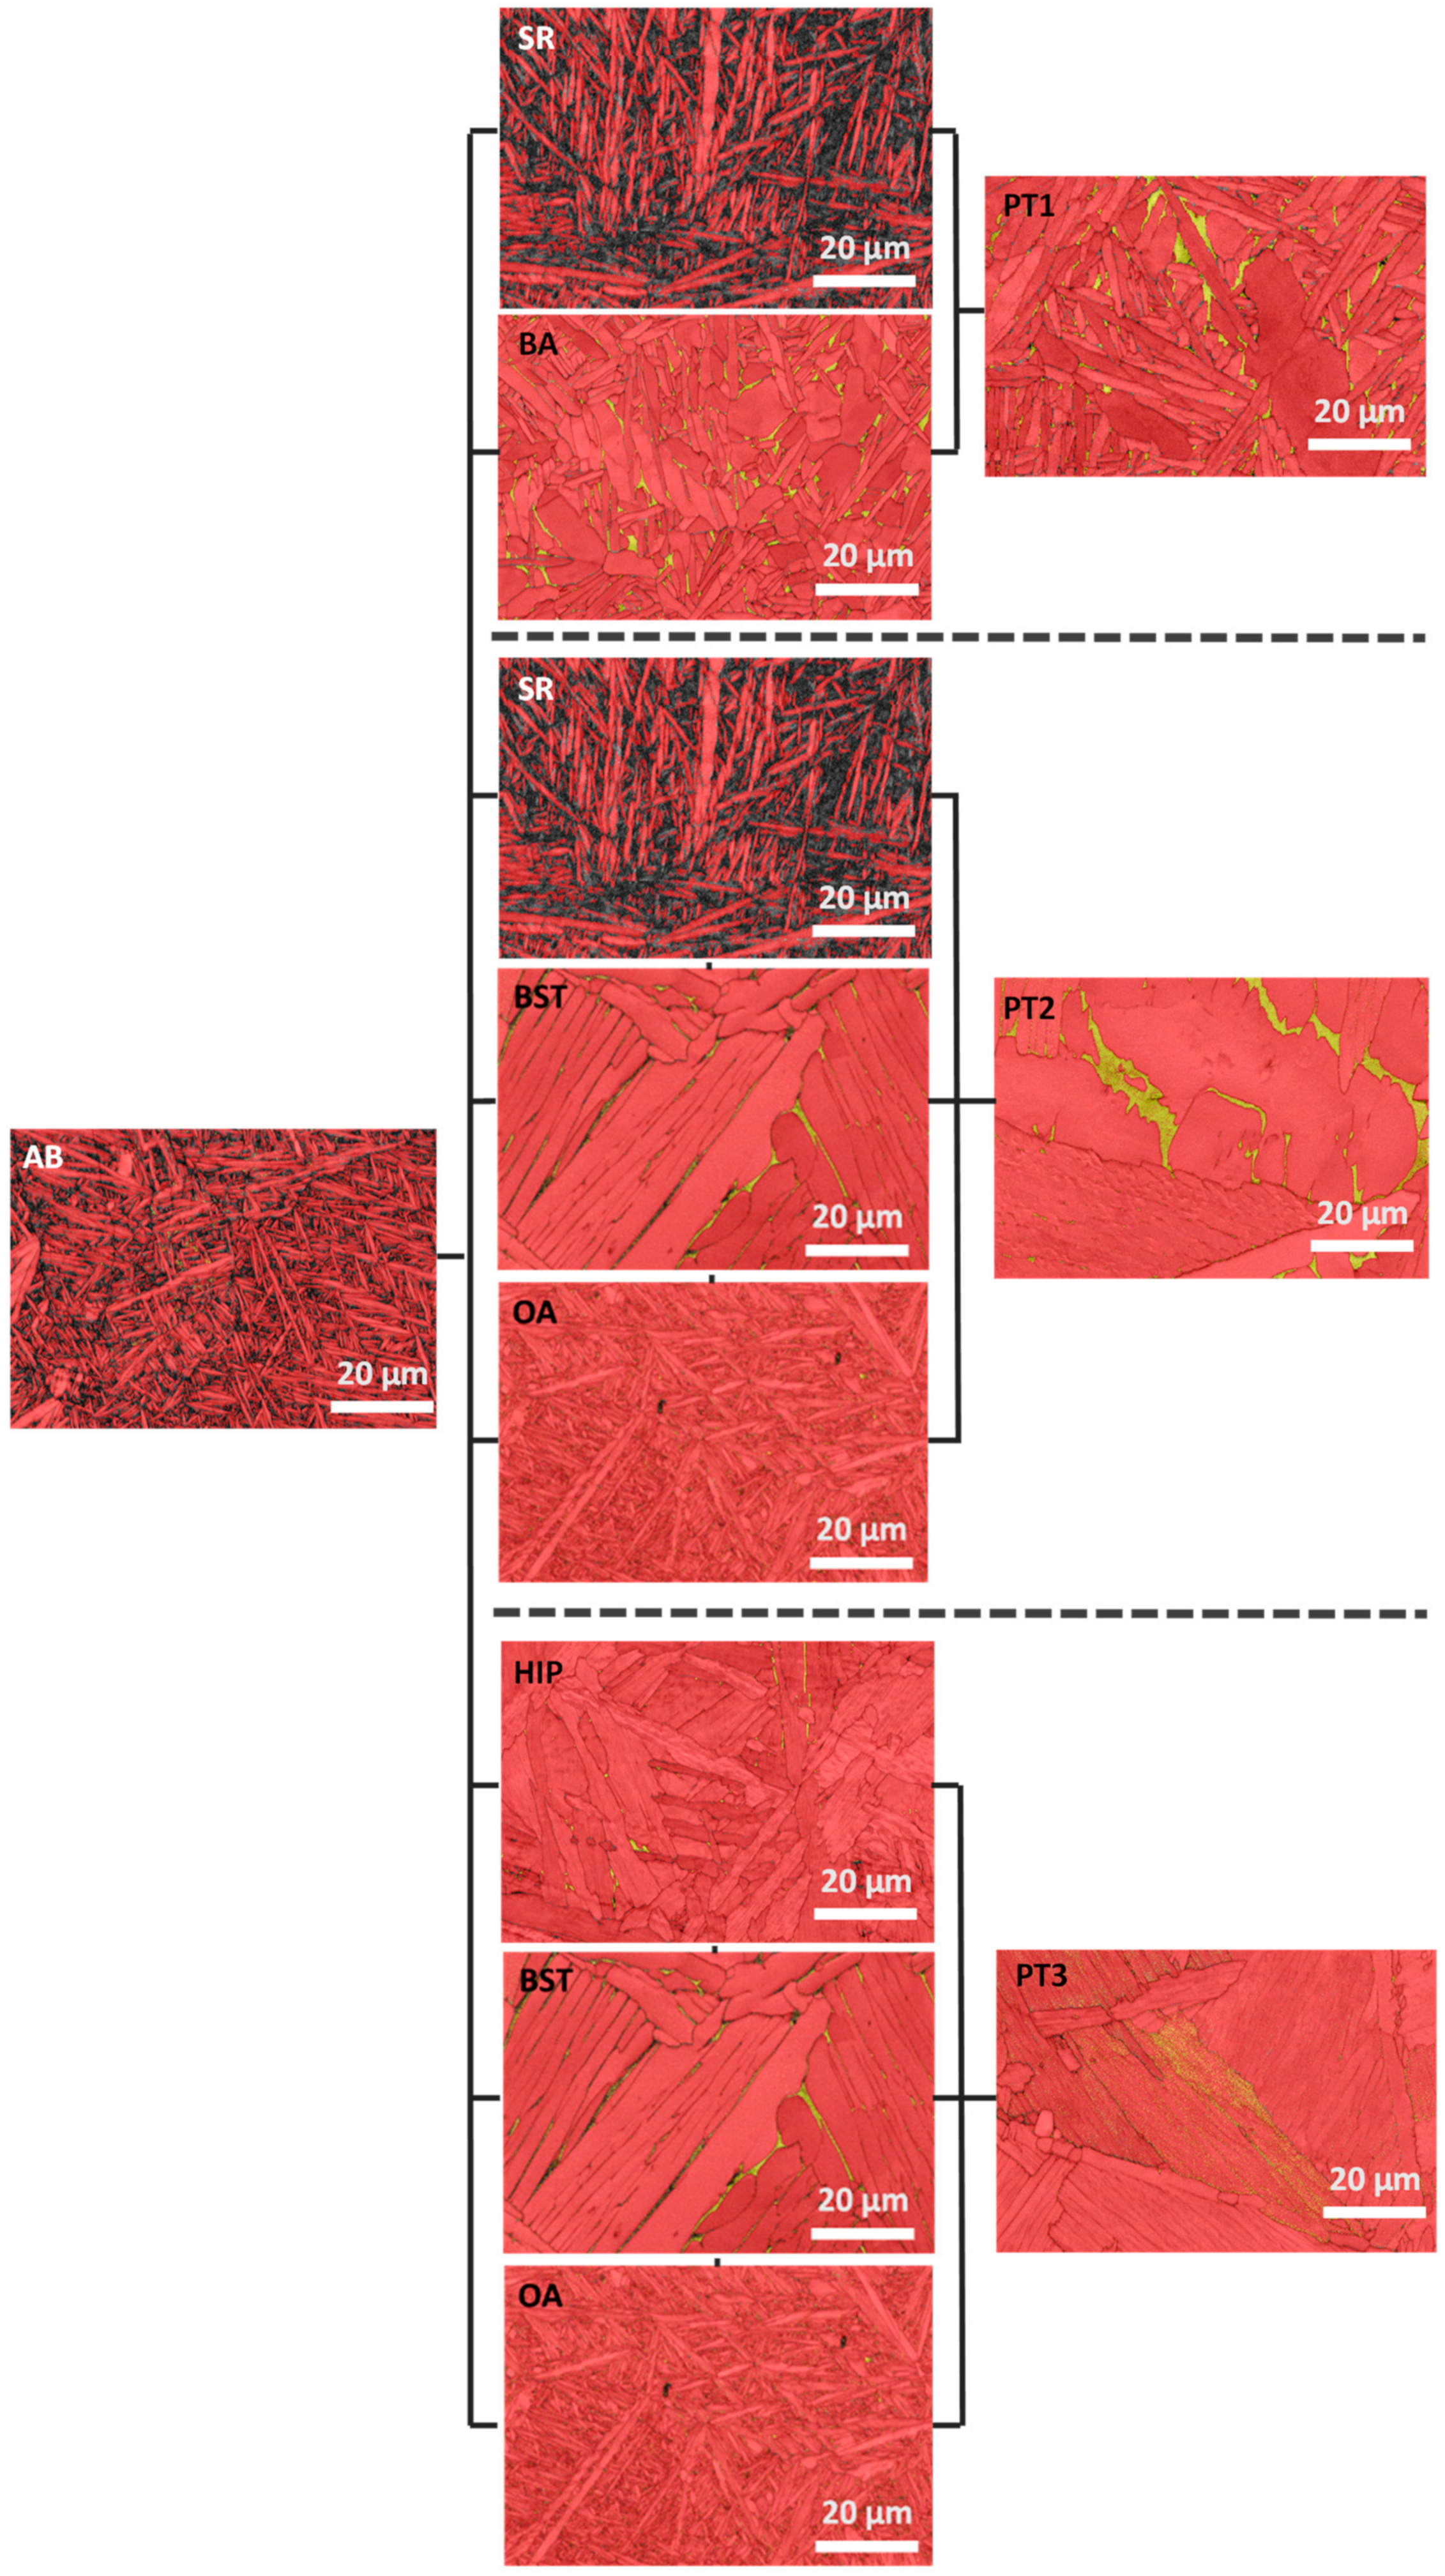
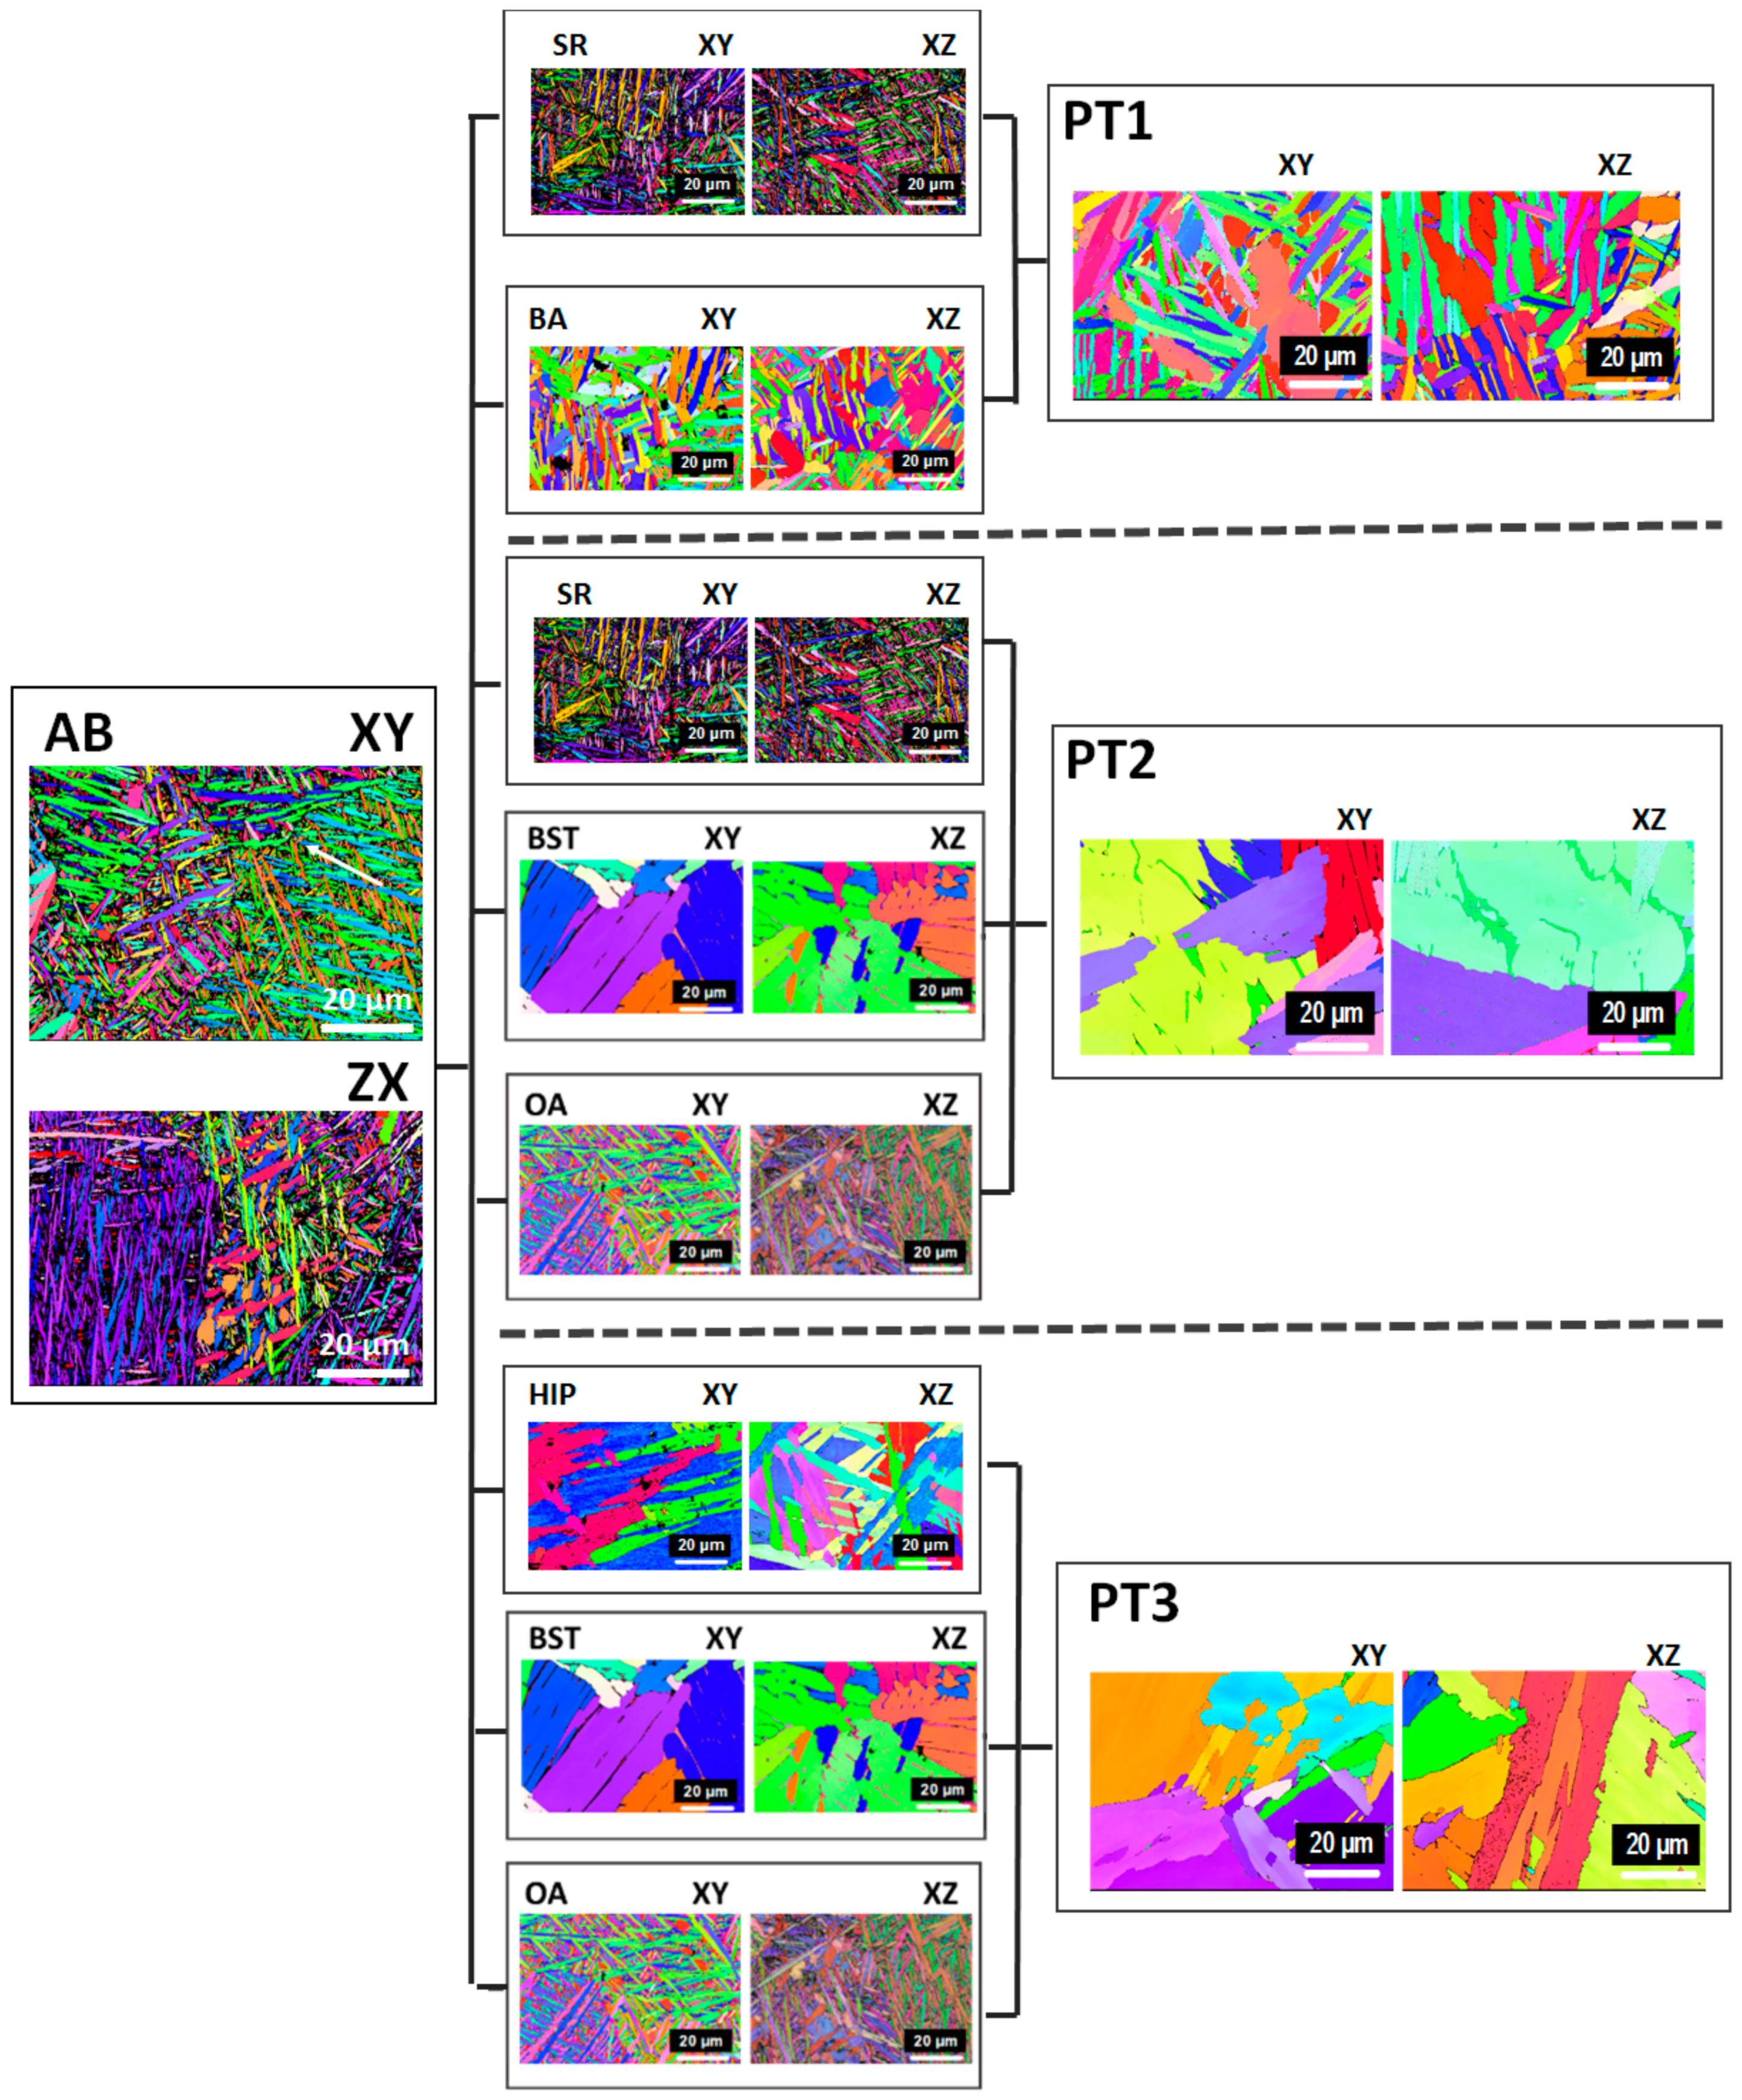
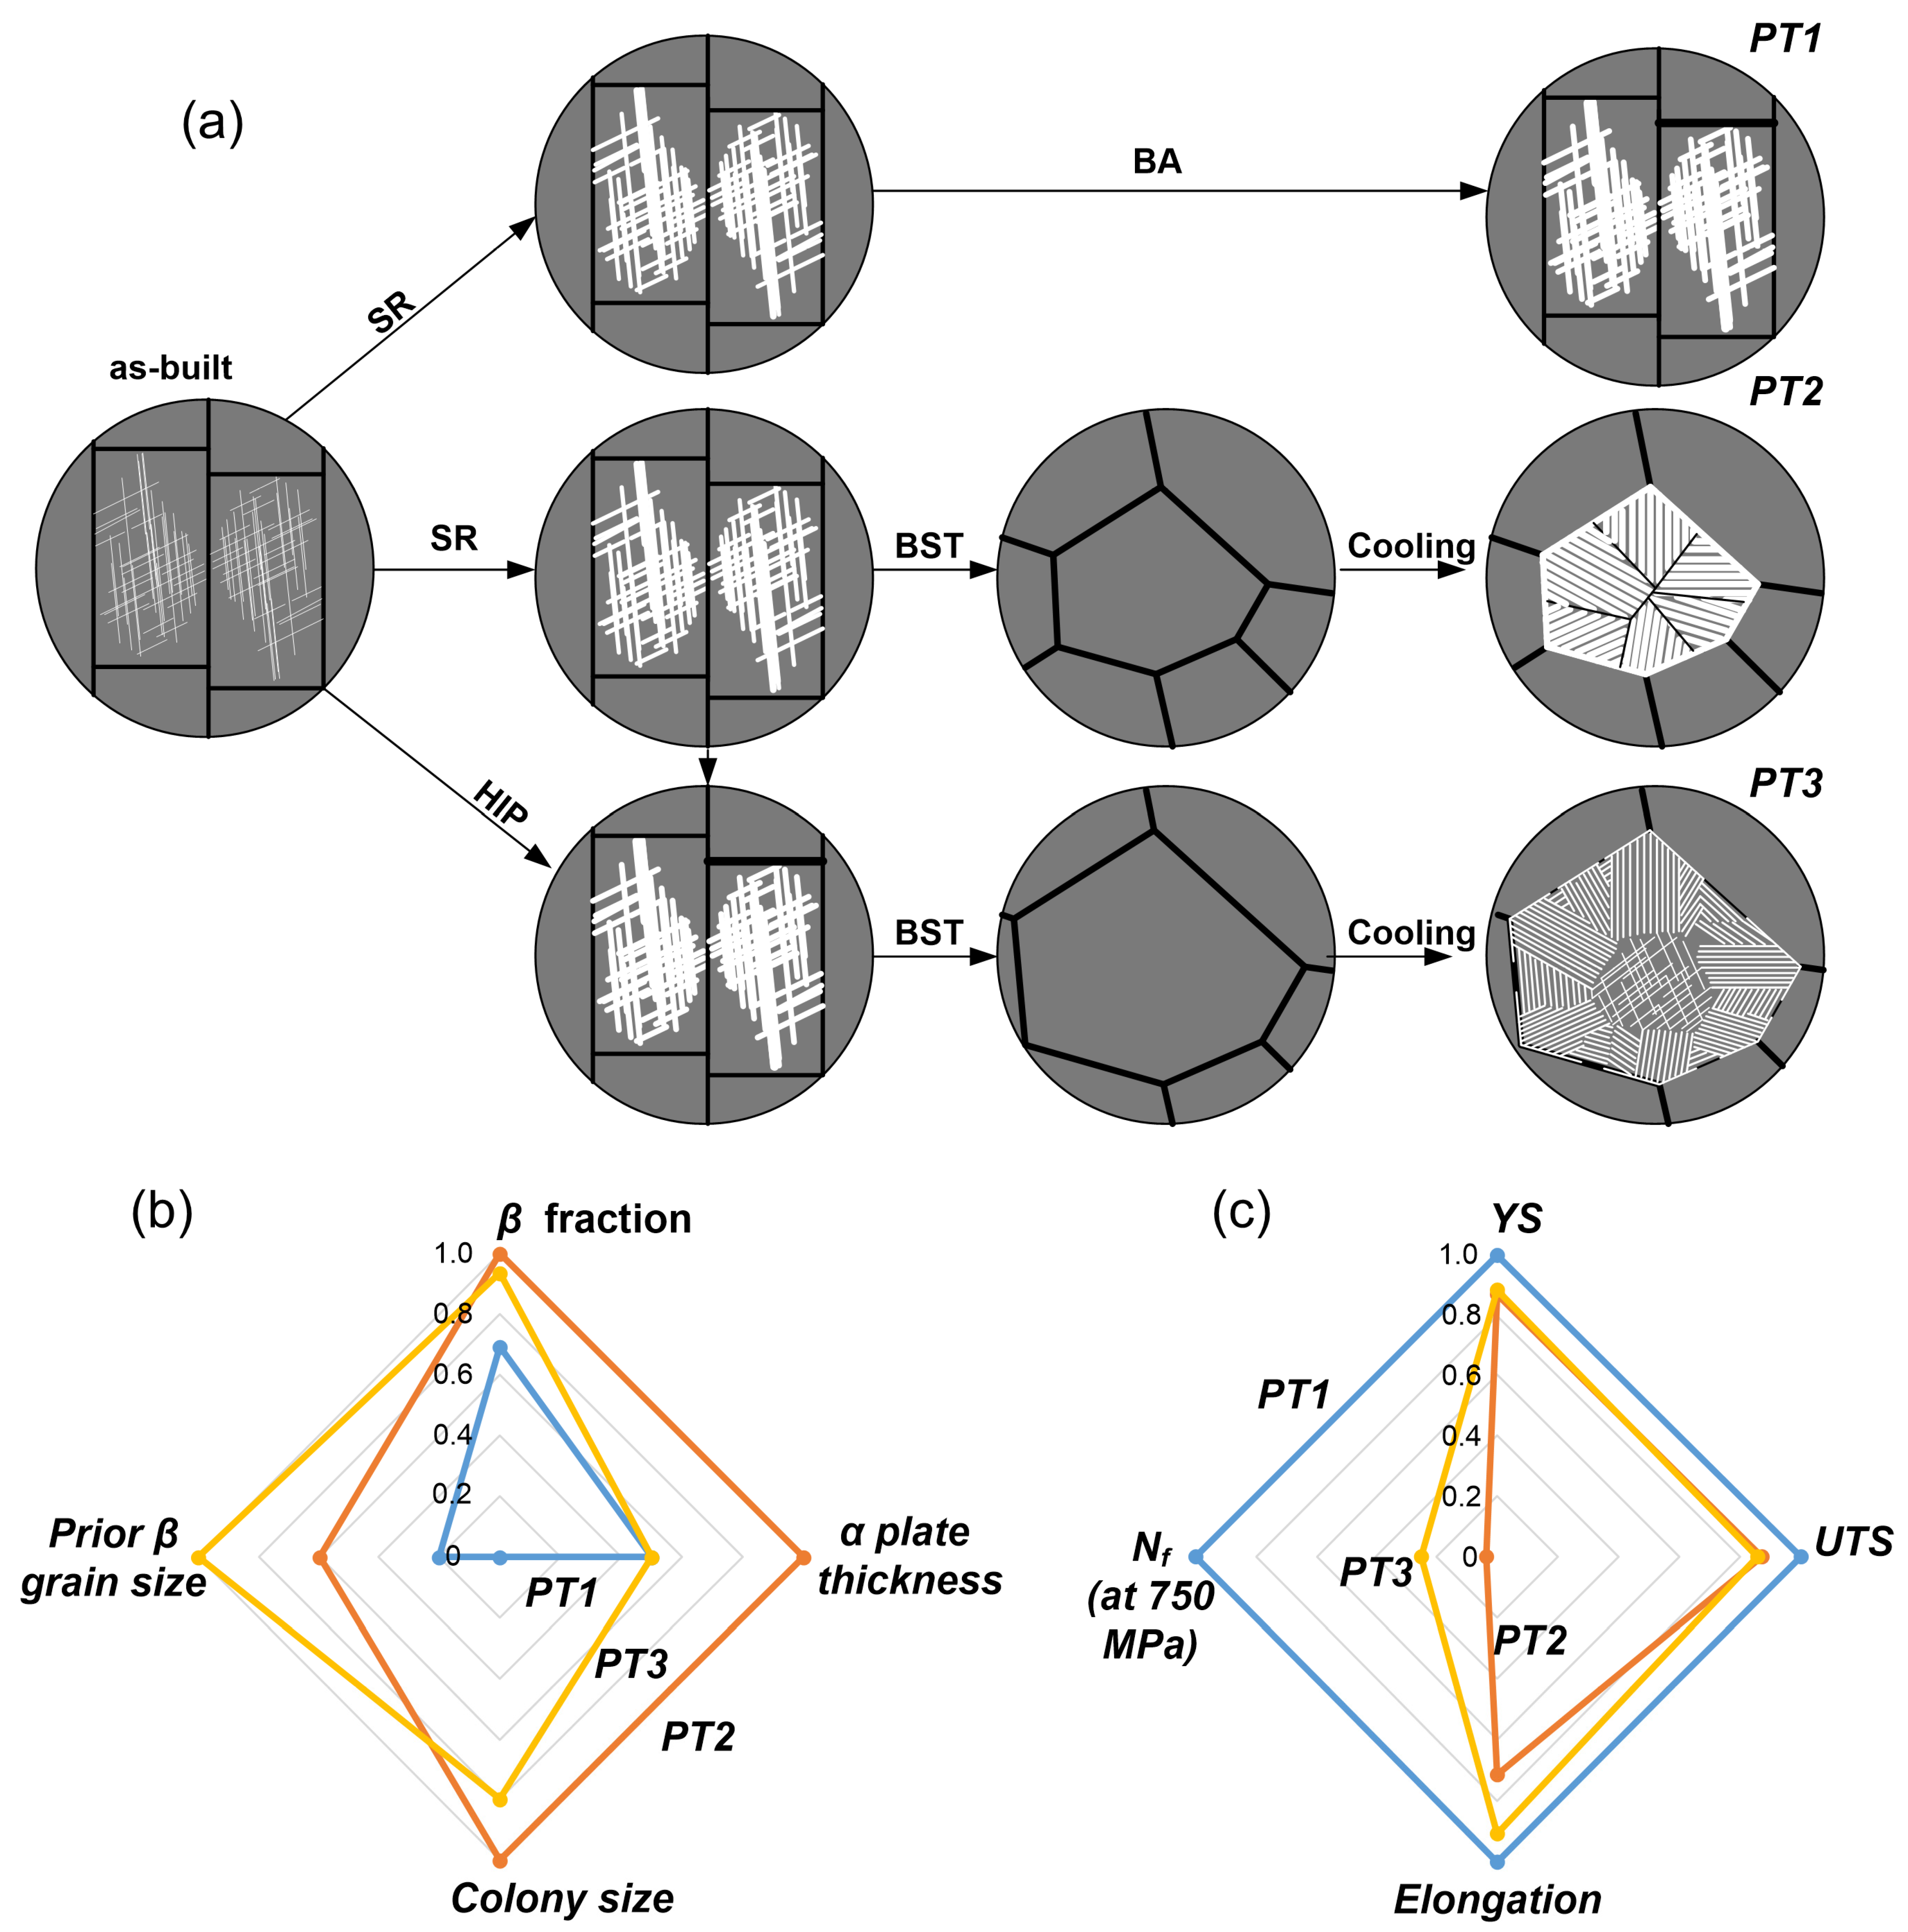
The AB specimens were divided into three sets to follow three different post-treatment protocols, namely, PT1, PT2, and PT3, as indicated in
Figure 2. PT1 included stress relief annealing (SR) for 2 h at 593 °C (1100 °F) followed by beta annealing (BA) for 2 h at 900 °C (1160 °F). Both the SR and BA correspond to subtransus heat treatments. PT2 included the same stress relief annealing as PT1, but in this case, beta annealing was replaced by beta solution treatment (BST, supertransus heat treatment) for 0.5 h at 1027 °C (1880 °F), followed by overaging (OA) for 2 h at 732 °C (1350 °F). Finally, PT3 included the same BST + OA treatments as PT2, but in this case, the SR was replaced by hot isostatic pressing (HIP) for 2 h at 900 °C (1160 °F) under a 100 MPa pressure. Note that all the PTs, including cooling, were performed under an argon atmosphere. The PTs protocols were selected to compare the influence of subtransus (stress relief annealing, beta annealing, HIP, and aging) and supertransus (beta solution) treatments on different phase and structure features, including the phase composition and morphology (grain, plate, lamellae, lath, and colony sizes) and, consequently, on the resulting mechanical properties. Note that in the PT3 protocol, HIP was used instead of SR in order to assess the impact of this material consolidation thermomechanical treatment on the mechanical properties of LPBF Ti64 specimens. The use of a slow cooling rate from the BST temperature was chosen deliberately to bring the heat treatment cycle closer to industrial practice [
20]. The single thermal cycle (BST + OA) is expected to provide a homogenous α/β lamellar structure with a slightly higher fraction of β phase and improved toughness.
To evaluate the impact of each of the PT steps as well as that of their combinations on the alloy microstructure, specimens were regrouped as follows (note that the initial state for each treatment is the as-built state): for the PT1 protocol, the SR and BA specimens corresponded to either the SR or BA states, and the PT1 specimens corresponded to the SR + BA state. Similarly, for the PT2 protocol, the SR, BST, and OA specimens corresponded to either the SR or BST or OA states, and the PT2 specimens corresponded to the SR + BST + OA state. Finally, for the PT3 protocol, the HIP, BST, and OA specimens corresponded to either the HIP or BST or OA states, and the PT3 specimens corresponded to the HIP + BST + OA state.
After different post-processing steps, cylindrical specimens designated for the microstructural analysis (
Figure 1a) were cut in two directions, perpendicular to the building direction (XY plane) and parallel to the building direction (XZ plane). A standard metallographic technique was used to prepare the specimens: (i) mounting in conductive Bakelite; (ii) grounding for 3 to 5 min with p800, p1200, and p2400 SiC papers using water as lubricant; (iii) mirror-like finish polishing on a Buehler’s VibroMet vibratory polisher for 15 h using a polishing cloth and a solution of 90% colloidal silica (0.05 µm) + H
2O
2; (iv) cleaning in an ultrasonic bath first using distilled water and then ethanol, and v) chemical etching for around 30 s with Kroll´s reagent: 2 mL of HF + 5 mL of HNO
3 + 100 mL H
2O. The last step was performed only on specimens used for the SEM observations. For the EBSD analysis, all the specimens followed an extra surface polishing step using a Hitachi IM4000 ion milling (Ar ions) system with a gun voltage of 4 V and an incident angle of 10° for 120 s. The XRD analysis was carried out on specimens before they were cut and mounted in Bakelite.
2.2. Microstructural Analysis
The phase and structure features of all the specimens, before and after the PTs, were analyzed using the XRD, SEM, and EBSD techniques. The names of the specimens correspond to the analyzed treatment state, according to
Figure 2. As indicated earlier, the AB is the initial state immediately after the LPBF printing, while the final states for each protocol are named PT1, PT2, and PT3, corresponding to the combinations of different post-treatment operations.
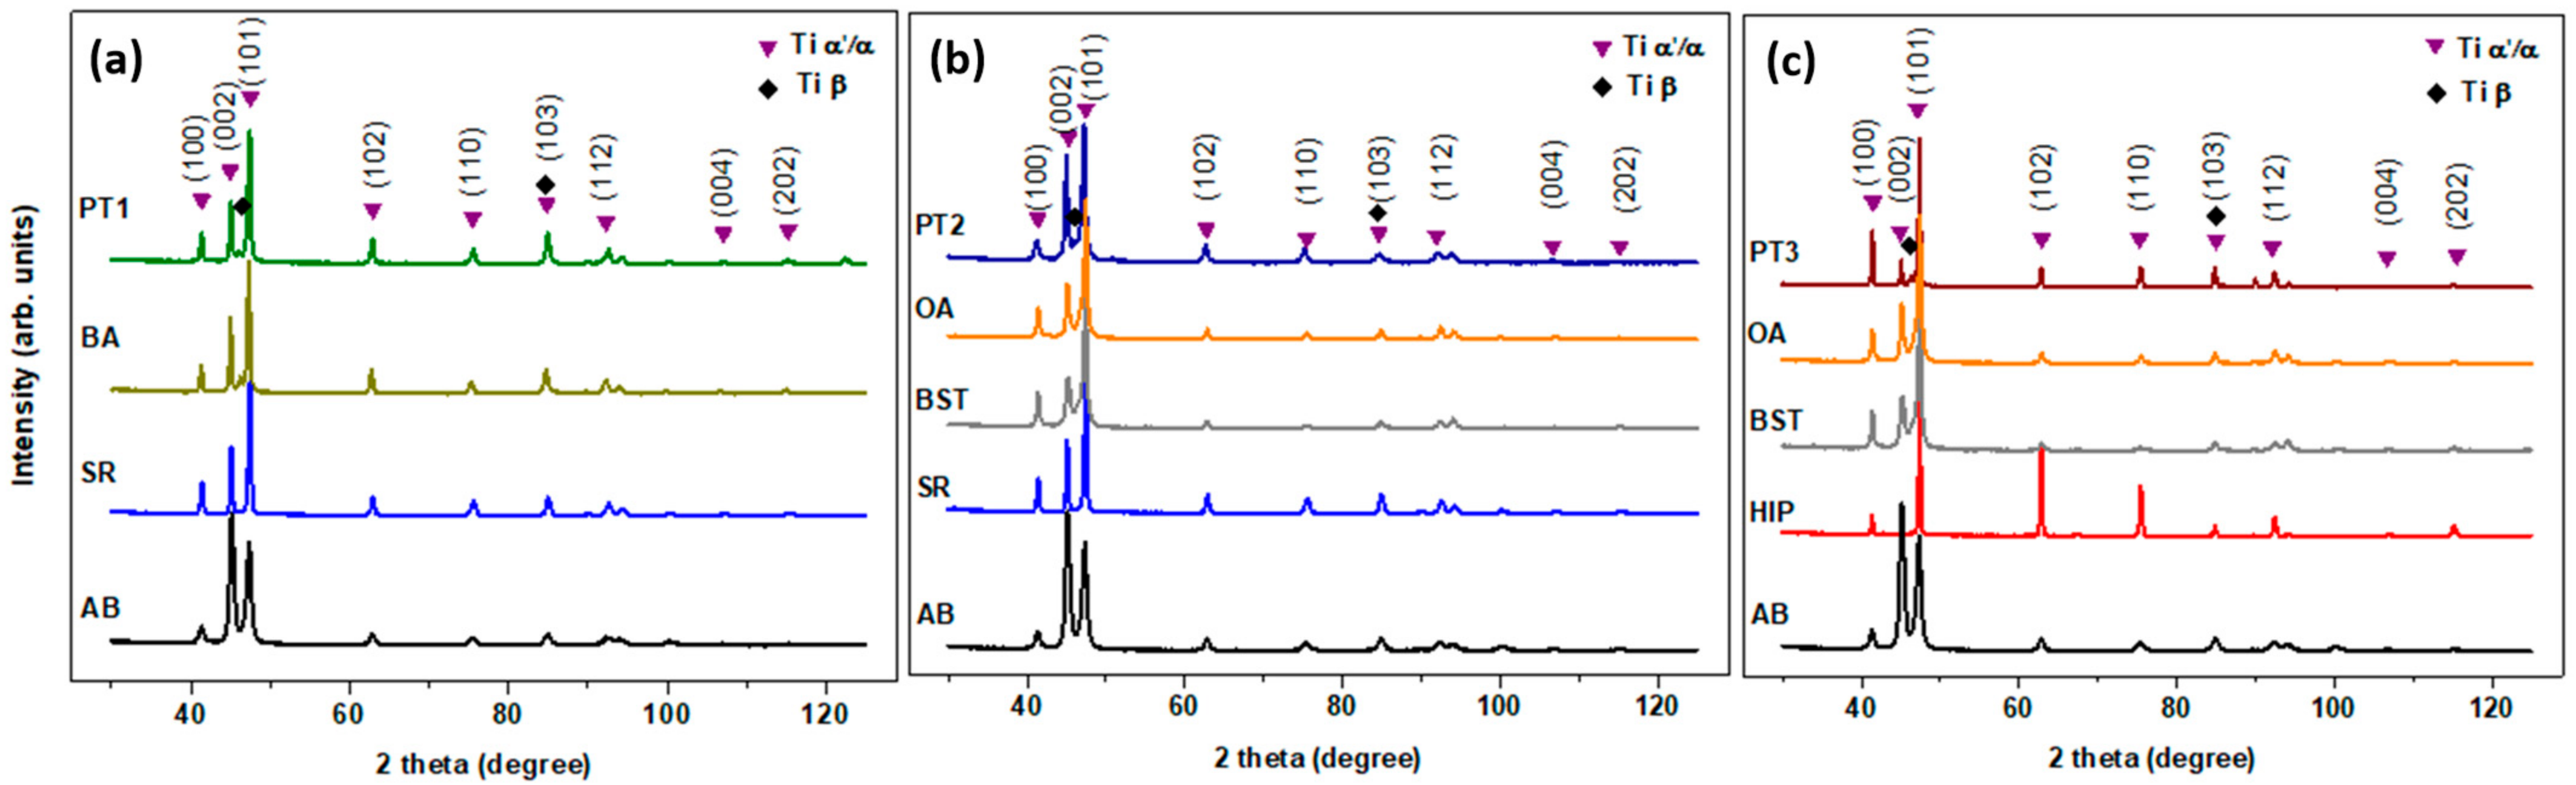
For the phase identification and quantification, XRD analysis was performed using an X’Pert-Pro Panalytical diffractometer with Co-Kα radiation (λ = 1.7902 Å) at 45 kV and 40 mA. The surface of the specimens was polished with 1 μm alumina suspension. The diffractograms in the 30 to 125° 2θ range were acquired with a step size of 0.05°. To obtain a better definition of the β phase peaks and calculate the volume fractions of α and β phases, additional diffractograms with a step size of 0.015° were acquired in the 38 to 51° 2θ range. The analyses of all the diffractograms were realized using HighScore Plus software. The β phase fraction was calculated in the 38 to 51° 2θ range for all the specimens using the relative intensity ratio (RIR) method.
To obtain information on the meso-structure of the LPBF alloy after different PTs, secondary electron (SE) image observations of the XY and XZ planes were conducted using an S3600-N Hitachi SEM. Observations at low (×200) and high (×500, ×1000 and ×3000) magnifications were performed using an accelerating voltage of 15 kV. EBSD and energy-dispersive X-ray spectroscopy (EDS) analyses were carried out using an SU8260 Hitachi SEM, tilting all the samples at 70° and scanning them at 25 kV with different magnifications. To image both the columnar β grains and finer acicular/lamellar structures, low (×300, step size of 0.5 µm) and high (×1500, step size of 0.1 µm) magnification EBSD maps were built for each stage of the PT protocols. Collected data were post-processed and analyzed using Quantax Esprit-Bruker software complemented with an EBSD-Mtex toolbox by indexing the two main phases: α (hcp, P63/mmc, #194) and β (bcc, Imm, #229). Prior β grains in the XZ plane were observed using laser confocal microscopy (LEXT4100, Olympus, Tokyo, Japan). The specimens were etched with Krolls reagent (100 mL distilled water, 2 mL HF, 4 mL HNO3, t = 60 s).
2.3. Mechanical Characterization
To evaluate the level of mechanical anisotropy, hardness measurements were performed on the XY and XZ planes of the AB and post-treated specimens, using a Mitutoyo HR-400 tester with a diamond Rockwell tip. The hardness reported is an average hardness of at least five measurements made on each plane of the specimens, with the corresponding standard deviations.
Tensile testing to failure was carried out on vertically oriented specimens corresponding to the final PT1, PT2, and PT3 states. Tensile testing was carried out at room temperature using a Minibionix 858 system (MTS, Eden Prairie, MN, USA) equipped with an MTS 634.12 extensometer under a crosshead speed of 0.108 mm/min, which corresponds to a strain rate of 2·10−4 s−1. The tensile testing was replicated with three specimens, and for each specimen, the yield strength, YS (MPa), Young’s modulus, E (GPa), the ultimate tensile strength, UTS (MPa), and the elongation at break δ (%) were evaluated, and their average and standard deviation values were calculated.
To build S-N Wohler’s diagrams, stress-controlled fatigue testing was carried out on the specimens corresponding to the final PT1, PT2, and PT3 states. A total of 18 specimens per state were tested using 6 distinct load levels with 3 repetitions, corresponding to a replication level of 66% (ASTM E466). Fatigue testing was performed on an MTS Landmark servohydraulic test system at a frequency of 12 Hz using a stress ratio of R = 0.1 applied in a sinusoidal waveform. Forces and displacements were monitored using an MTS 661.20H-03 force transducer and an MTS LVDT (1000 cycles out of each 2000 cycles were recorded) to ensure a constant force and waveform throughout the tests. The number of cycles to failure was also recorded with a runout set at 107 cycles. After fatigue testing, the fracture surface analysis was carried out using a TM3000 Hitachi SEM.
4. Discussion
In this work, the microstructure evolutions occurring during post-treatments of the LPBF Ti64 alloy involve different combinations of annealing, aging, and hot isostatic pressing stages, as well as their effect on the alloy’s static and fatigue mechanical properties, are studied. As-built specimens, common for all three post-treatment protocols, are used as reference. It must be noted that the effects of thermal and thermomechanical treatments on the microstructure of Ti64 alloys have been investigated extensively in the literature. Numerous post-treatment sequences have been designed to maximize the mechanical properties of these alloys, but since the starting α/β microstructures of conventional Ti64 alloys differ significantly from those of their LPBF counterparts [
22,
28], the relevance of such recommendations needs to be verified.
A specific acicular martensitic structure observed in the as-built LPBF specimens of this work is in line with previous observations [
29,
30]. The formation of ~100 μm-wide colonies with parallel primary martensite laths having the same crystallographic orientation is shown in
Figure 6. Within the colonies, fine α′ martensite 0.4–1.5 µm-wide laths can clearly be seen. The appearance of such a fine martensite structure is the result of rapid cooling from the β field, with a cooling rate estimated at ~10
6 K/s [
5,
26]. For a highly dislocated martensite microstructure with large residual stresses, post-processing heat treatments are required. For as-built LPBF Ti64 components, ASTM F3001-14 recommends stress relief annealing in the 450–650 °C temperature range. Next, to improve the tensile properties of LPBF Ti64 alloy by converting α′ martensite into α/β structure, heat treatments in the α + β phase or β fields are needed [
10]. The results of this study show a significant difference in the microstructure features, such as the α plates width, the α colony size, the β phase fraction, and morphology, for different post-treatments. The morphology of these phases depends on the maximum heat treatment temperature and holding time, but also on the prior thermal history of the material, including the LPBF processing and preceding post-processing conditions.
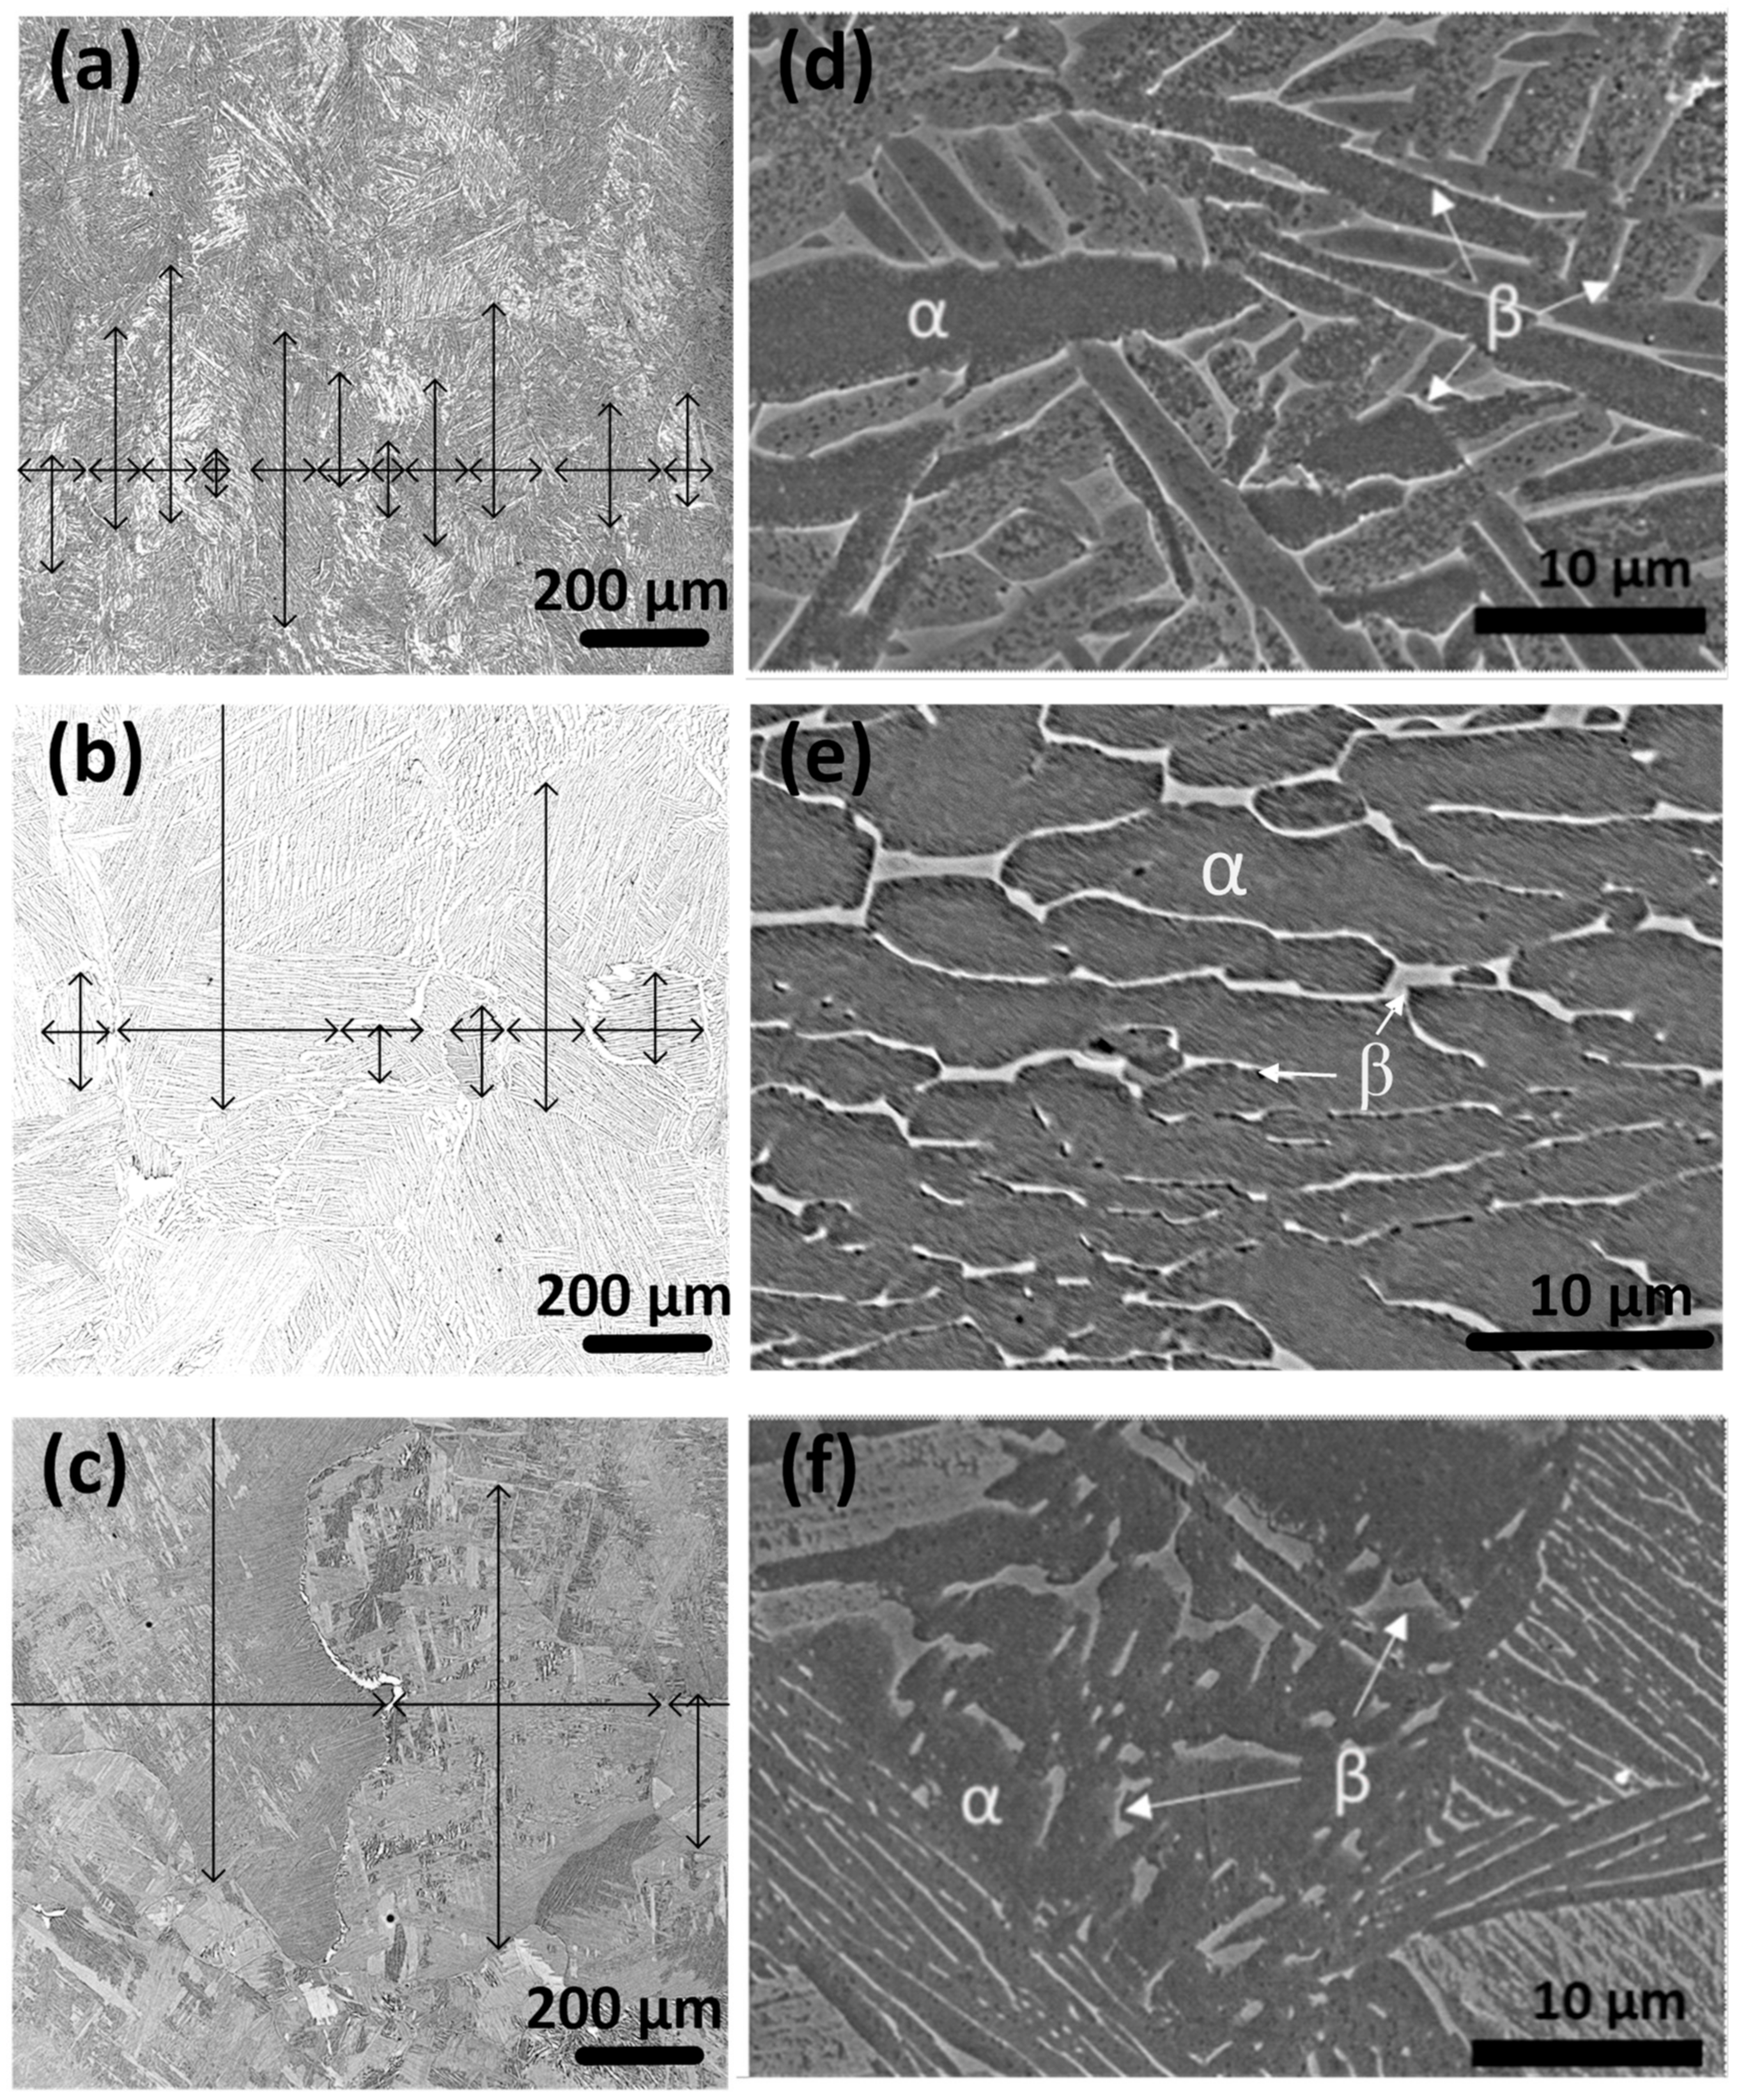
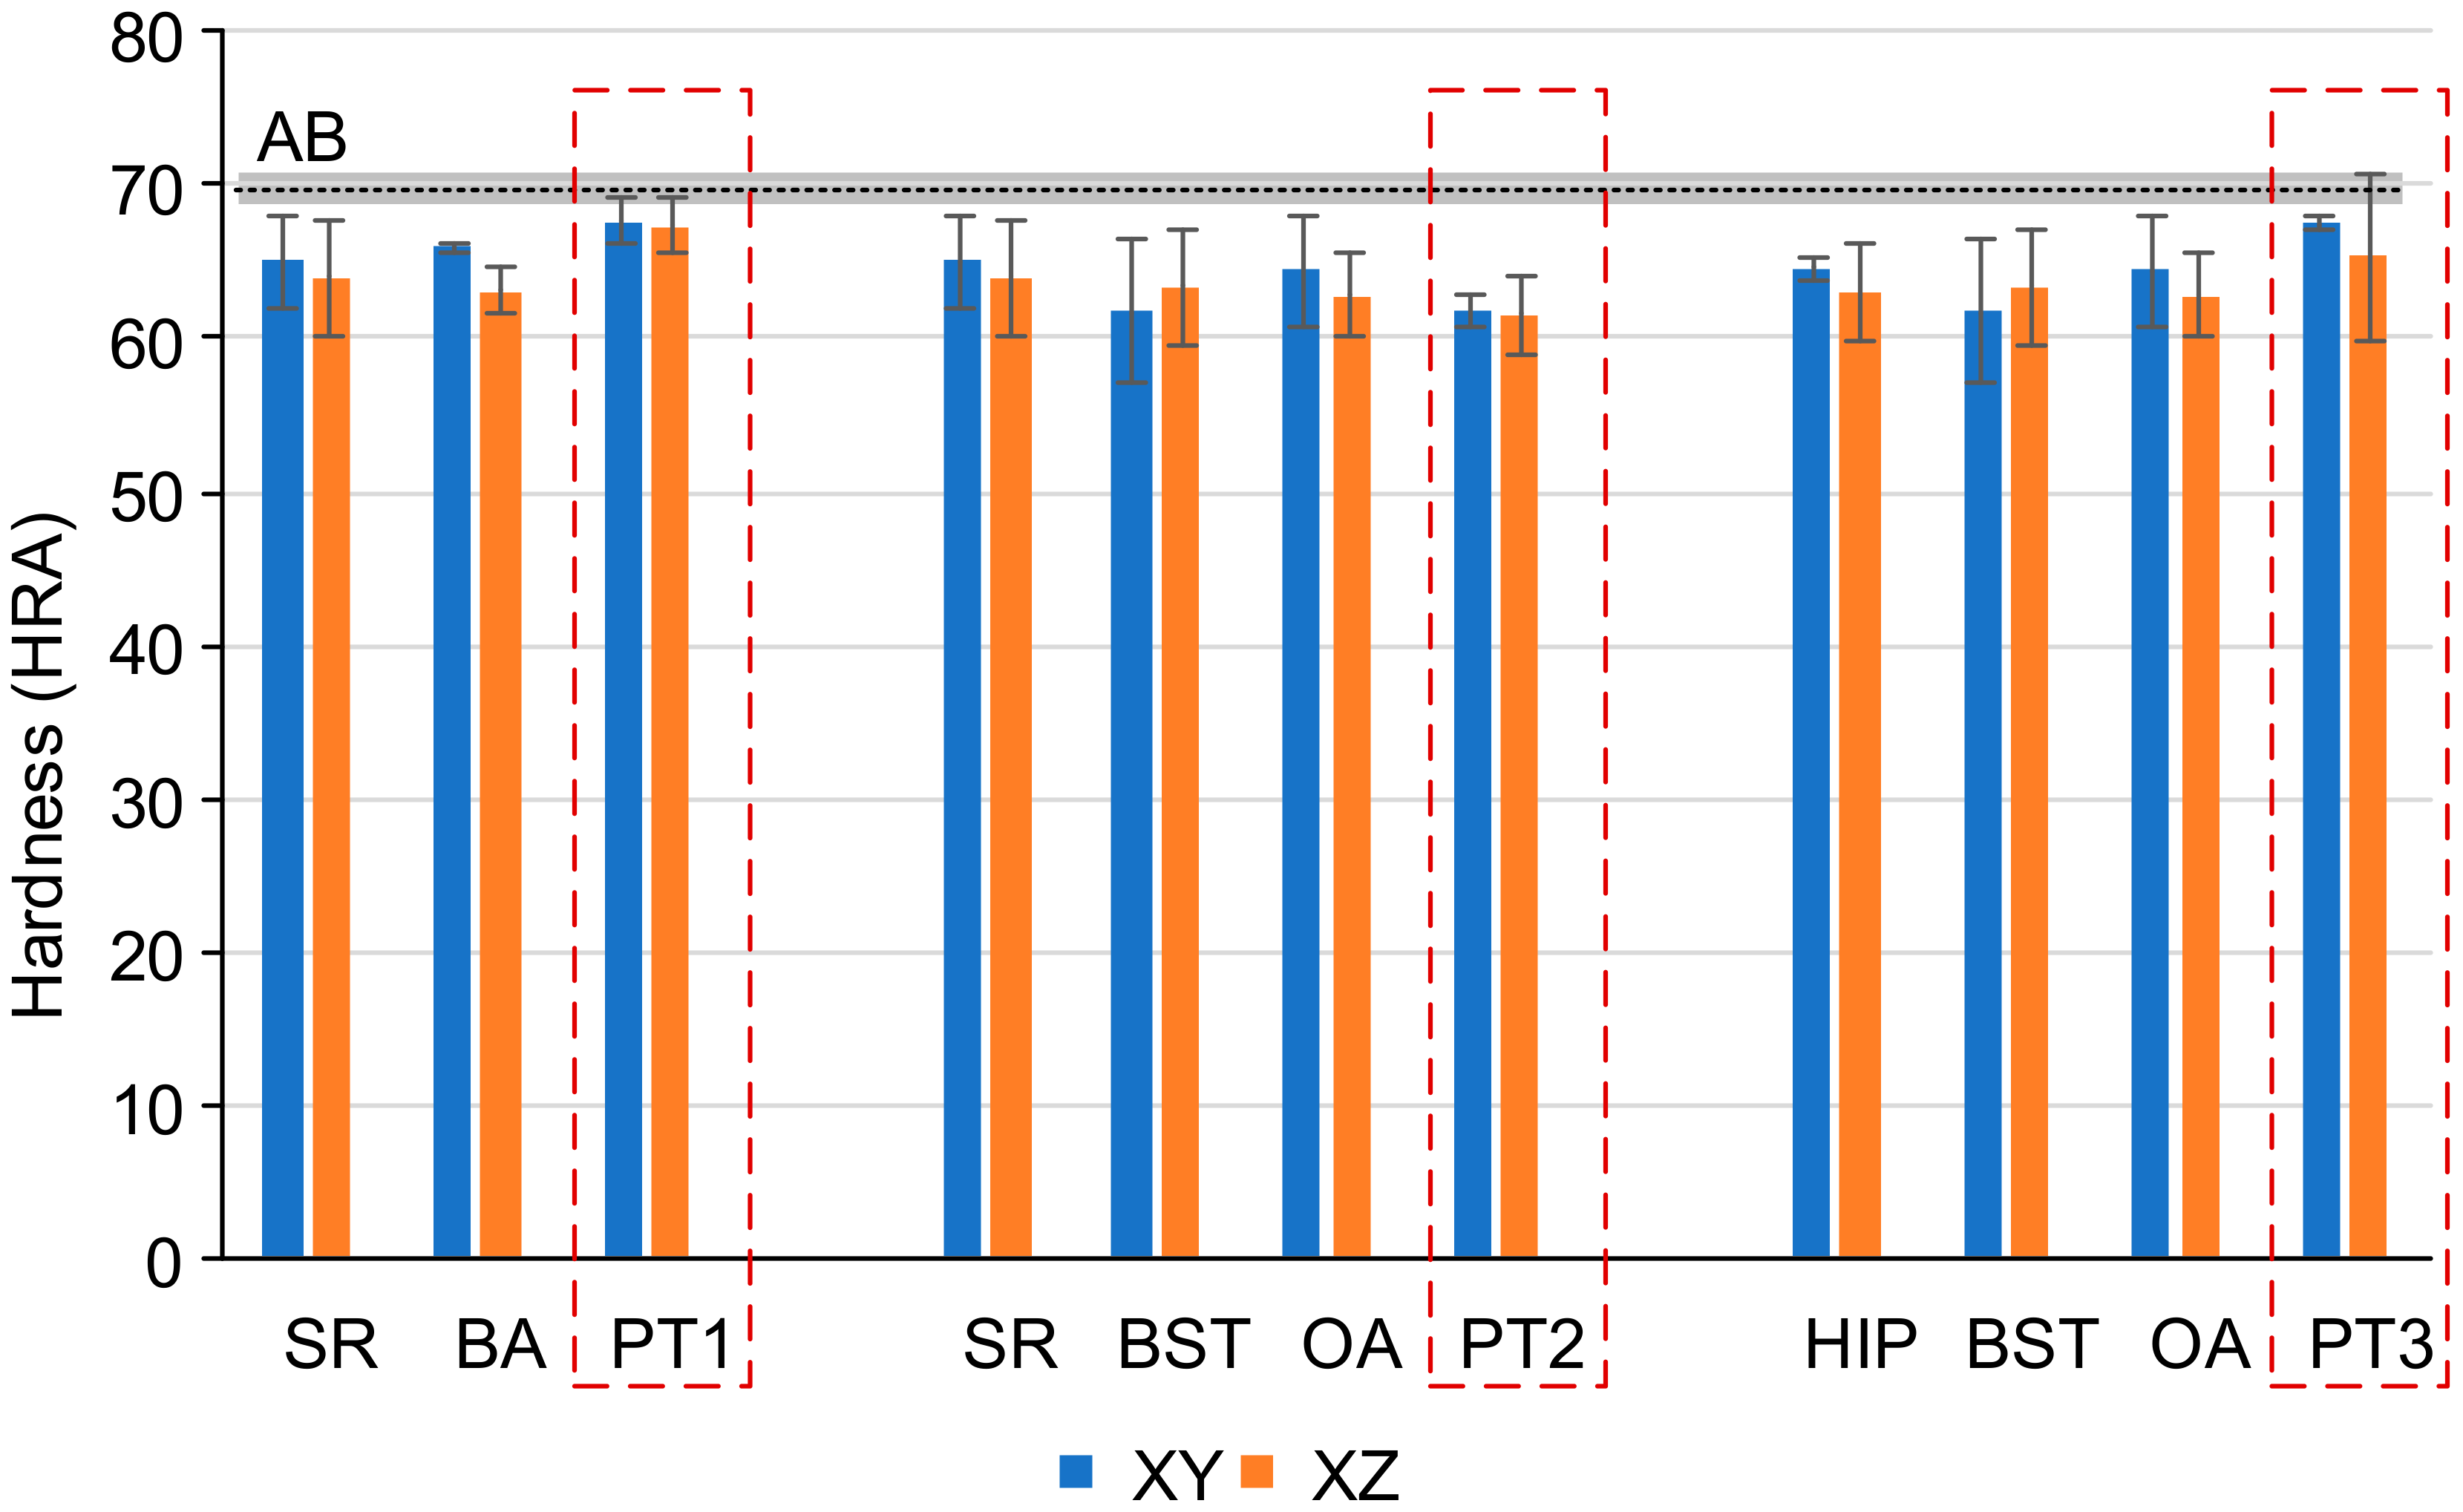
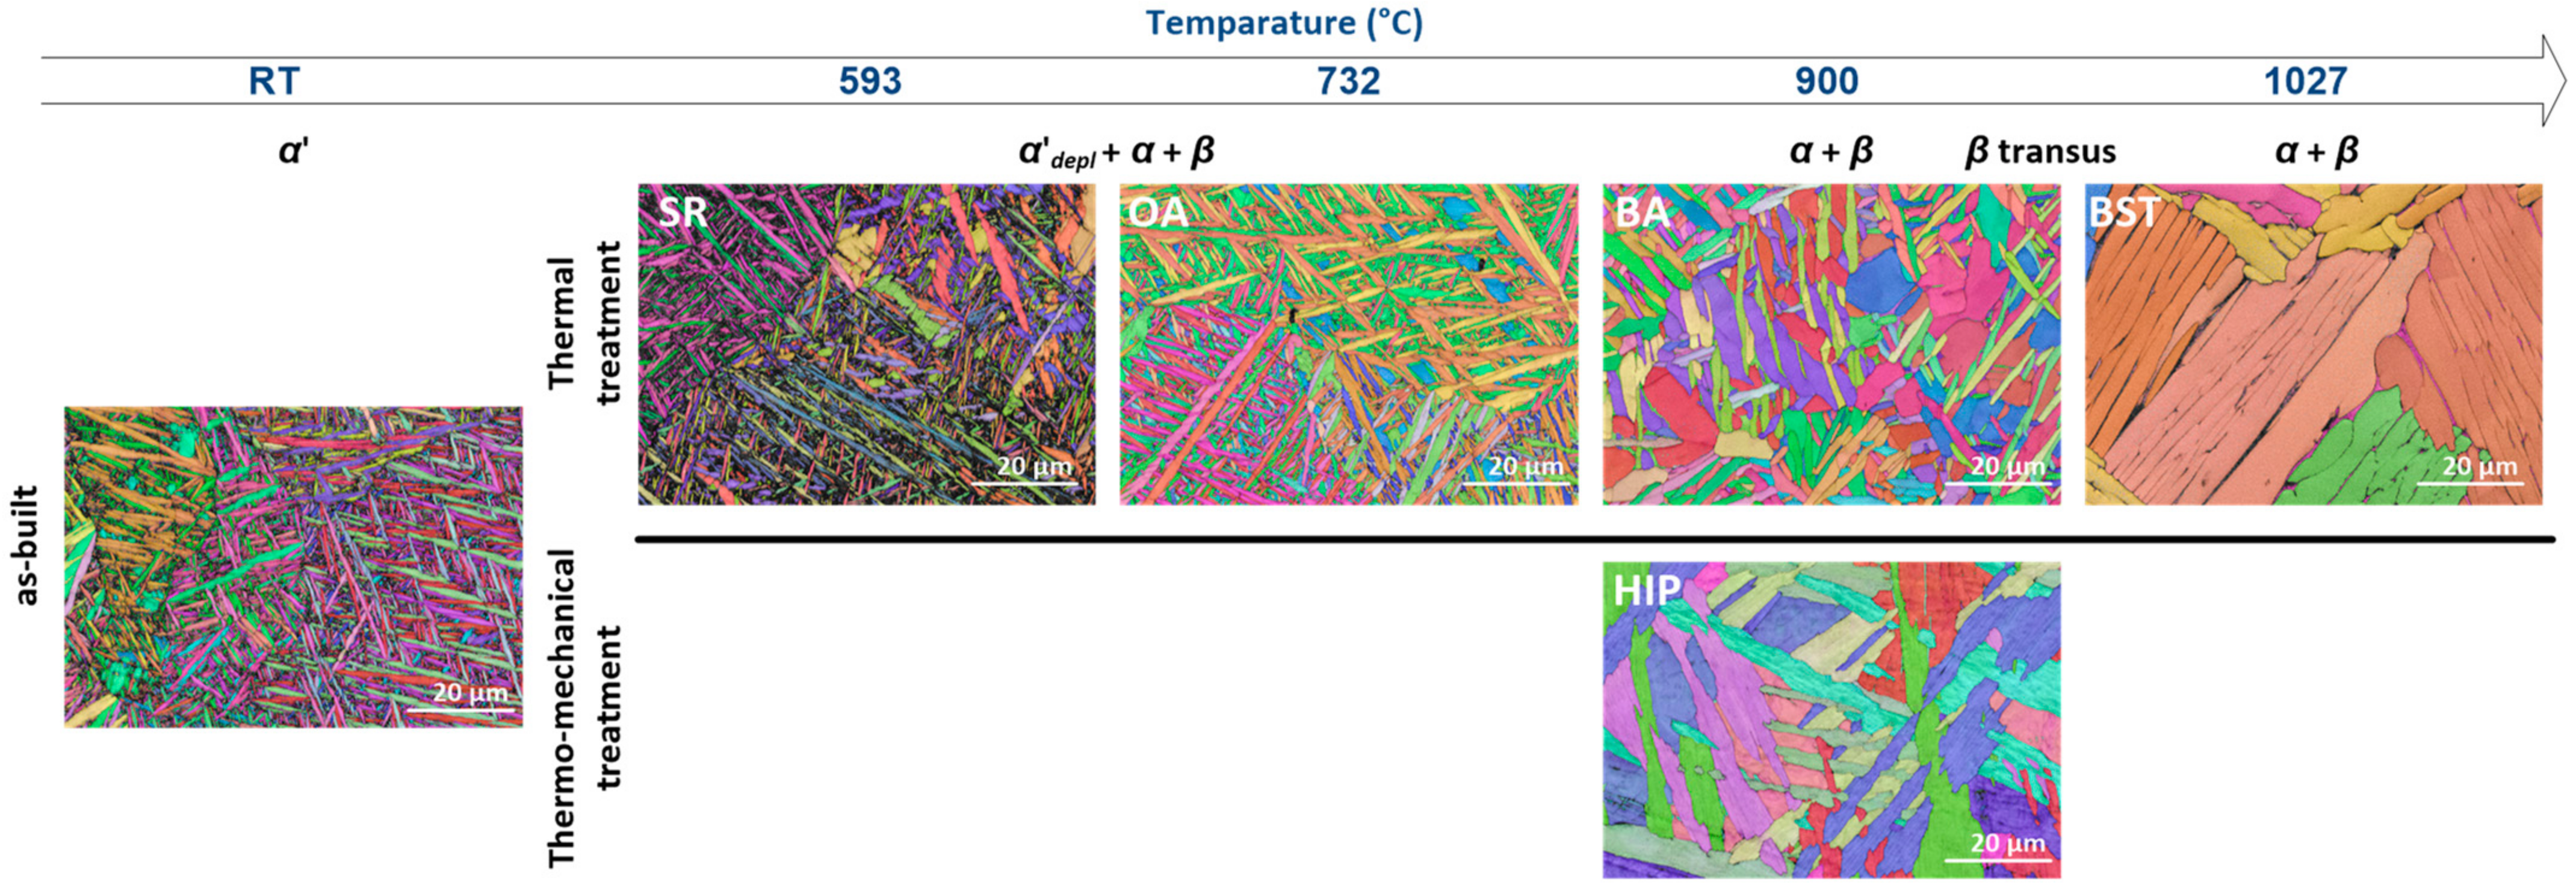
Microstructure and hardness after single-stage treatments. The maximum post-treatment temperature determines the final fraction and morphology of an α/β mixture, especially when the alloy is treated below the β-transus, where higher temperatures result in larger fractions of the lamellar α phase. SR at 593 °C has only a minimal effect on the α′/α plate width and on the amount of β phase (
Figure 13). Similar observations have been reported in [
31]. The phase morphology after SR remains similar to that of the AB specimens. The nucleation of less than 1% of the β phase induced by the SR treatment (
Table 1) indicates a weak impact of this treatment on the microstructure of the LPBF Ti64 alloy. Consequently, the hardness after SR is very close to that of the AB specimens.
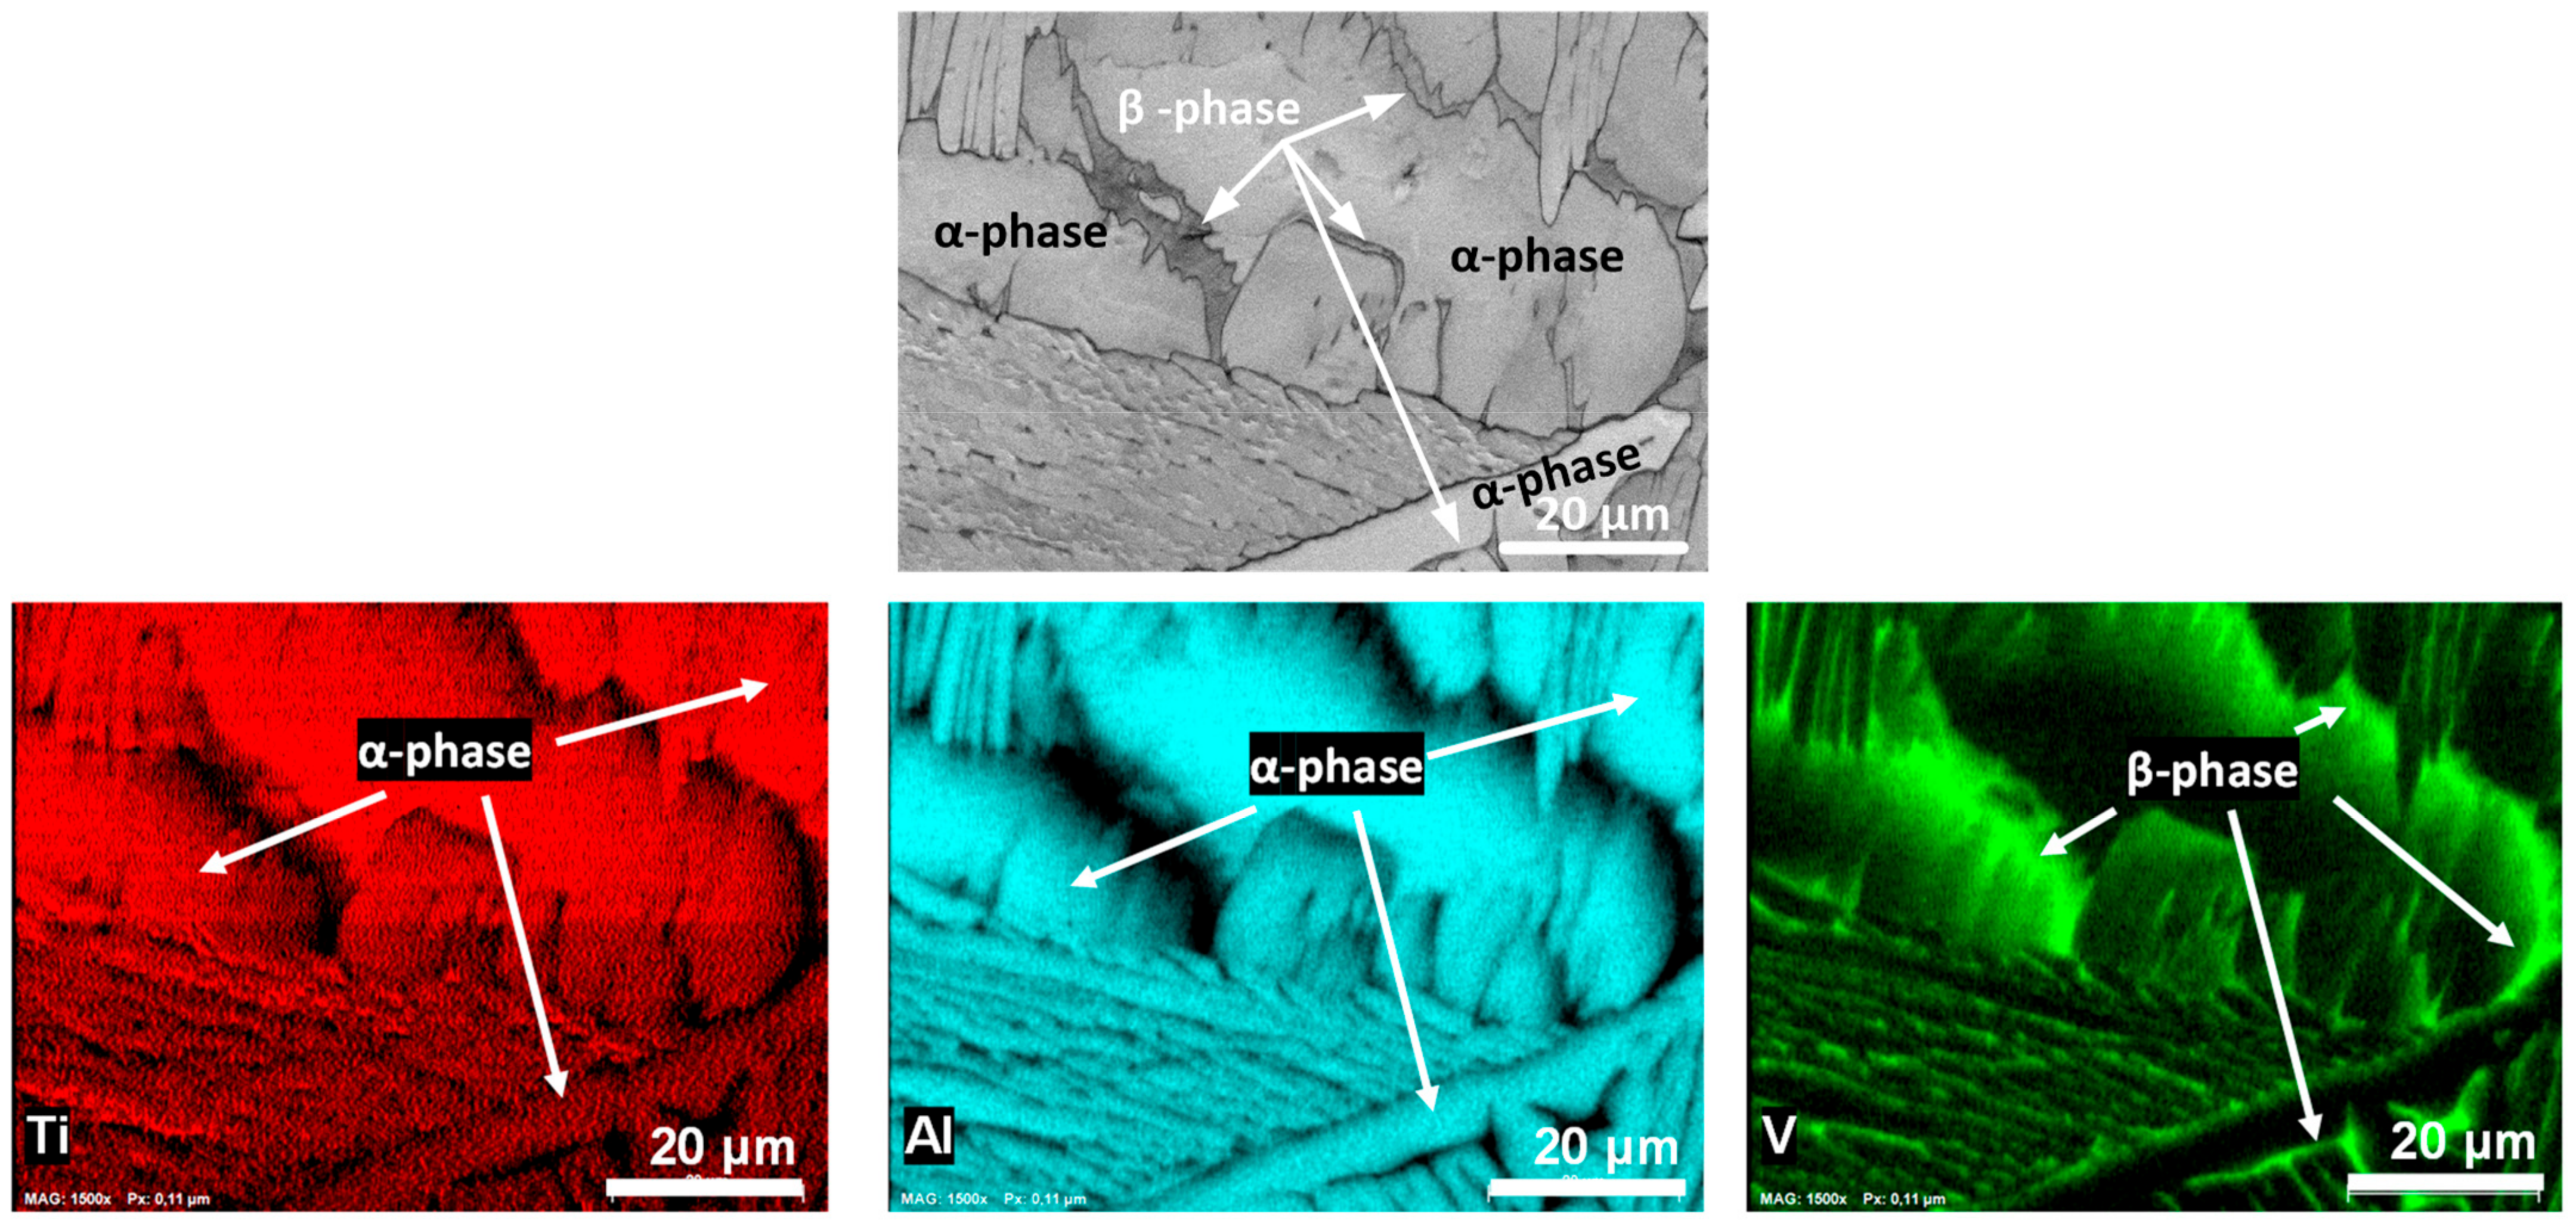
With a further increase in the heat treatment temperature, up to 732 °C and 900 °C for the OA and BA treatments, respectively, vanadium atoms diffuse from α′ phase, α′ phase transforms to α phase and a certain amount of β phase (≤3%) is formed at the α phase boundaries along the vanadium-rich zones (
Figure 13) [
32,
33]. The higher the heat treatment temperature, the thicker the α plates and the higher the amount of β phase [
13,
34]; thus, heat treatment at 900 °C (BA) forms coarser α plates (1.3–6.3 µm) and a higher fraction of β phase (3%) than heat treatment at 732 °C (OA) (1.4–2.2 µm and <1%, respectively). Higher heat treatment temperatures lead to a decrease in the hardness values of both the OA and BA specimens as compared to the AB specimens. Since the HIP treatment was performed under similar temperature-time conditions as the BA treatment, the hardness of HIP and BA specimens remained close.
When the alloy is heated above the β-transus (~950 °C) temperature, α′/α phase transforms to the β phase, and the subsequent cooling provides a more stable α/β lamellar structure. It was also shown that after BST (1027 °C), α colonies with parallel 1.7–16.4 µm wide plates of close crystallographic orientations were observed. The fraction of the β phase is around 3.8–4.0%. In this case, the hardness reaches a minimum value of 59–60 HRA. The microstructure features of the LPBF Ti64 subjected to the SR, BA, BST, HIP, and OA single-stage post-treatments observed in this work are comparable to those found in the literature [
10,
13].
Microstructure and hardness after different PT protocols. Microstructures of the Ti64 alloy subjected to different PT protocols differ from those formed during each individual post-treatment stage due to different starting structures for each of the stages.
Figure 14a presents schematically different microstructures in relation to the transformations occurring during each stage of each PT protocol. The first protocol, PT1 = SR (593 °C) + BA (900 °C), triggers
transformations, and the final microstructure is characterized by a basket weave structure with 1.1–4.2 μm-wide α plates surrounded by β phase inclusions (4.6%) (
Figure 14b); thus, the amount of β phase is slightly higher than that after a single BA treatment (3%). Some coarse α primary plates are also observed after PT1, thus indicating the globalization process. A large number of dislocations is contained in the initial microstructure, thus meaning a high level of internal stresses, which favors the coarsening and globularization of the α phase [
35]. Hardness values of the PT1 specimens with this basket weave structure with some globulized α plates (grains) are similar to those of the AB specimens with a martensitic structure.
The second protocol PT2 involves SR (593 °C) + BST (1027 °C) + OA (732 °C) and corresponds to the following phase transformations:
, the last stage (OA) does not affect the phase composition. The microstructure is presented by 100–500 µm-sized grains, ~50 µm-sized colonies, and 6.4–10 µm-width α plates surrounded by β phase (5.8%)—
Figure 14a,b. The BST promotes the recrystallization of β grains and forms a coarse β grain structure, while a relatively low cooling rate after the BST forms a fully lamellar α/β structure. Aging favors the enrichment of the β phase with a β stabilizer (V). Since the enriched β phase has a lower beta-transus temperature [
37], more retained β is observed after the PT2 as compared to the specimens subjected to the BST only. Despite a higher amount of β phase and coarser α plates after the PT2, the hardness values of the PT2 specimens are close to those of the BST specimens; however, these hardness values of the PT2 specimens are lower than those of their PT1 counterparts because of a coarser microstructure and a higher amount of β phase in the former.
Finally, the third protocol, PT3, includes HIP (900 °C) + BST (1027 °C) + OA (732 °C). In this case, phase transformations occur in the following sequence:
, resulting in a microstructure that is different from that observed after the PT2. Despite a significantly coarse recrystallized β grain structure (in the 200–1000 µm range), the sizes of both the α colonies (10 and 200 µm) and the α plates (1.7–6.5 µm) are smaller as compared to those of the PT2 specimens (
Figure 14a,b). In addition, the microstructure of the PT3 specimens is less uniform than that of the PT2 specimens: it combines areas with a fine basket weave microstructure and those with a coarse lamellar structure. It seems that more nucleation sites for the formation of the α phase under cooling result from the BST stage of the PT3 protocol as compared to the same stage of the PT2 protocol. This leads to a reduction in the average colony size and the appearance of a basket weave microstructure.
Indeed, according to [
37], small prior β grains (<200 µm) of the Ti64 alloy lead to the formation of a uniform coarse colony microstructure, while large prior β grains promote the formation of a mixture of the colony and basket weave microstructures. A colony microstructure forms near the grain boundaries, whereas a basket weave microstructure forms inside larger grains. Another explanation for this difference could be a slightly higher cooling rate in the case of the PT3 specimens as compared to the PT2 specimens (this aspect is difficult to verify, since cooling rate variations as small as 2–10 °C/s could affect the α structure [
36]). The presence of such a heterogeneous structure affects the volume fraction of the β phase and its morphology. In addition to a rod-shaped β phase, some areas contain small β particles distributed in the α structure. The hardness of the PT3 specimens is higher than that of the PT2 specimens. This may be due to the overall finer microstructure (except prior β grains): ~40 µm colonies and ~4 µm α plates after PT3 as compared to the ~50 µm colonies and ~8 µm plates after PT2, and the presence of the basket weave microstructure in the PT3 specimens.
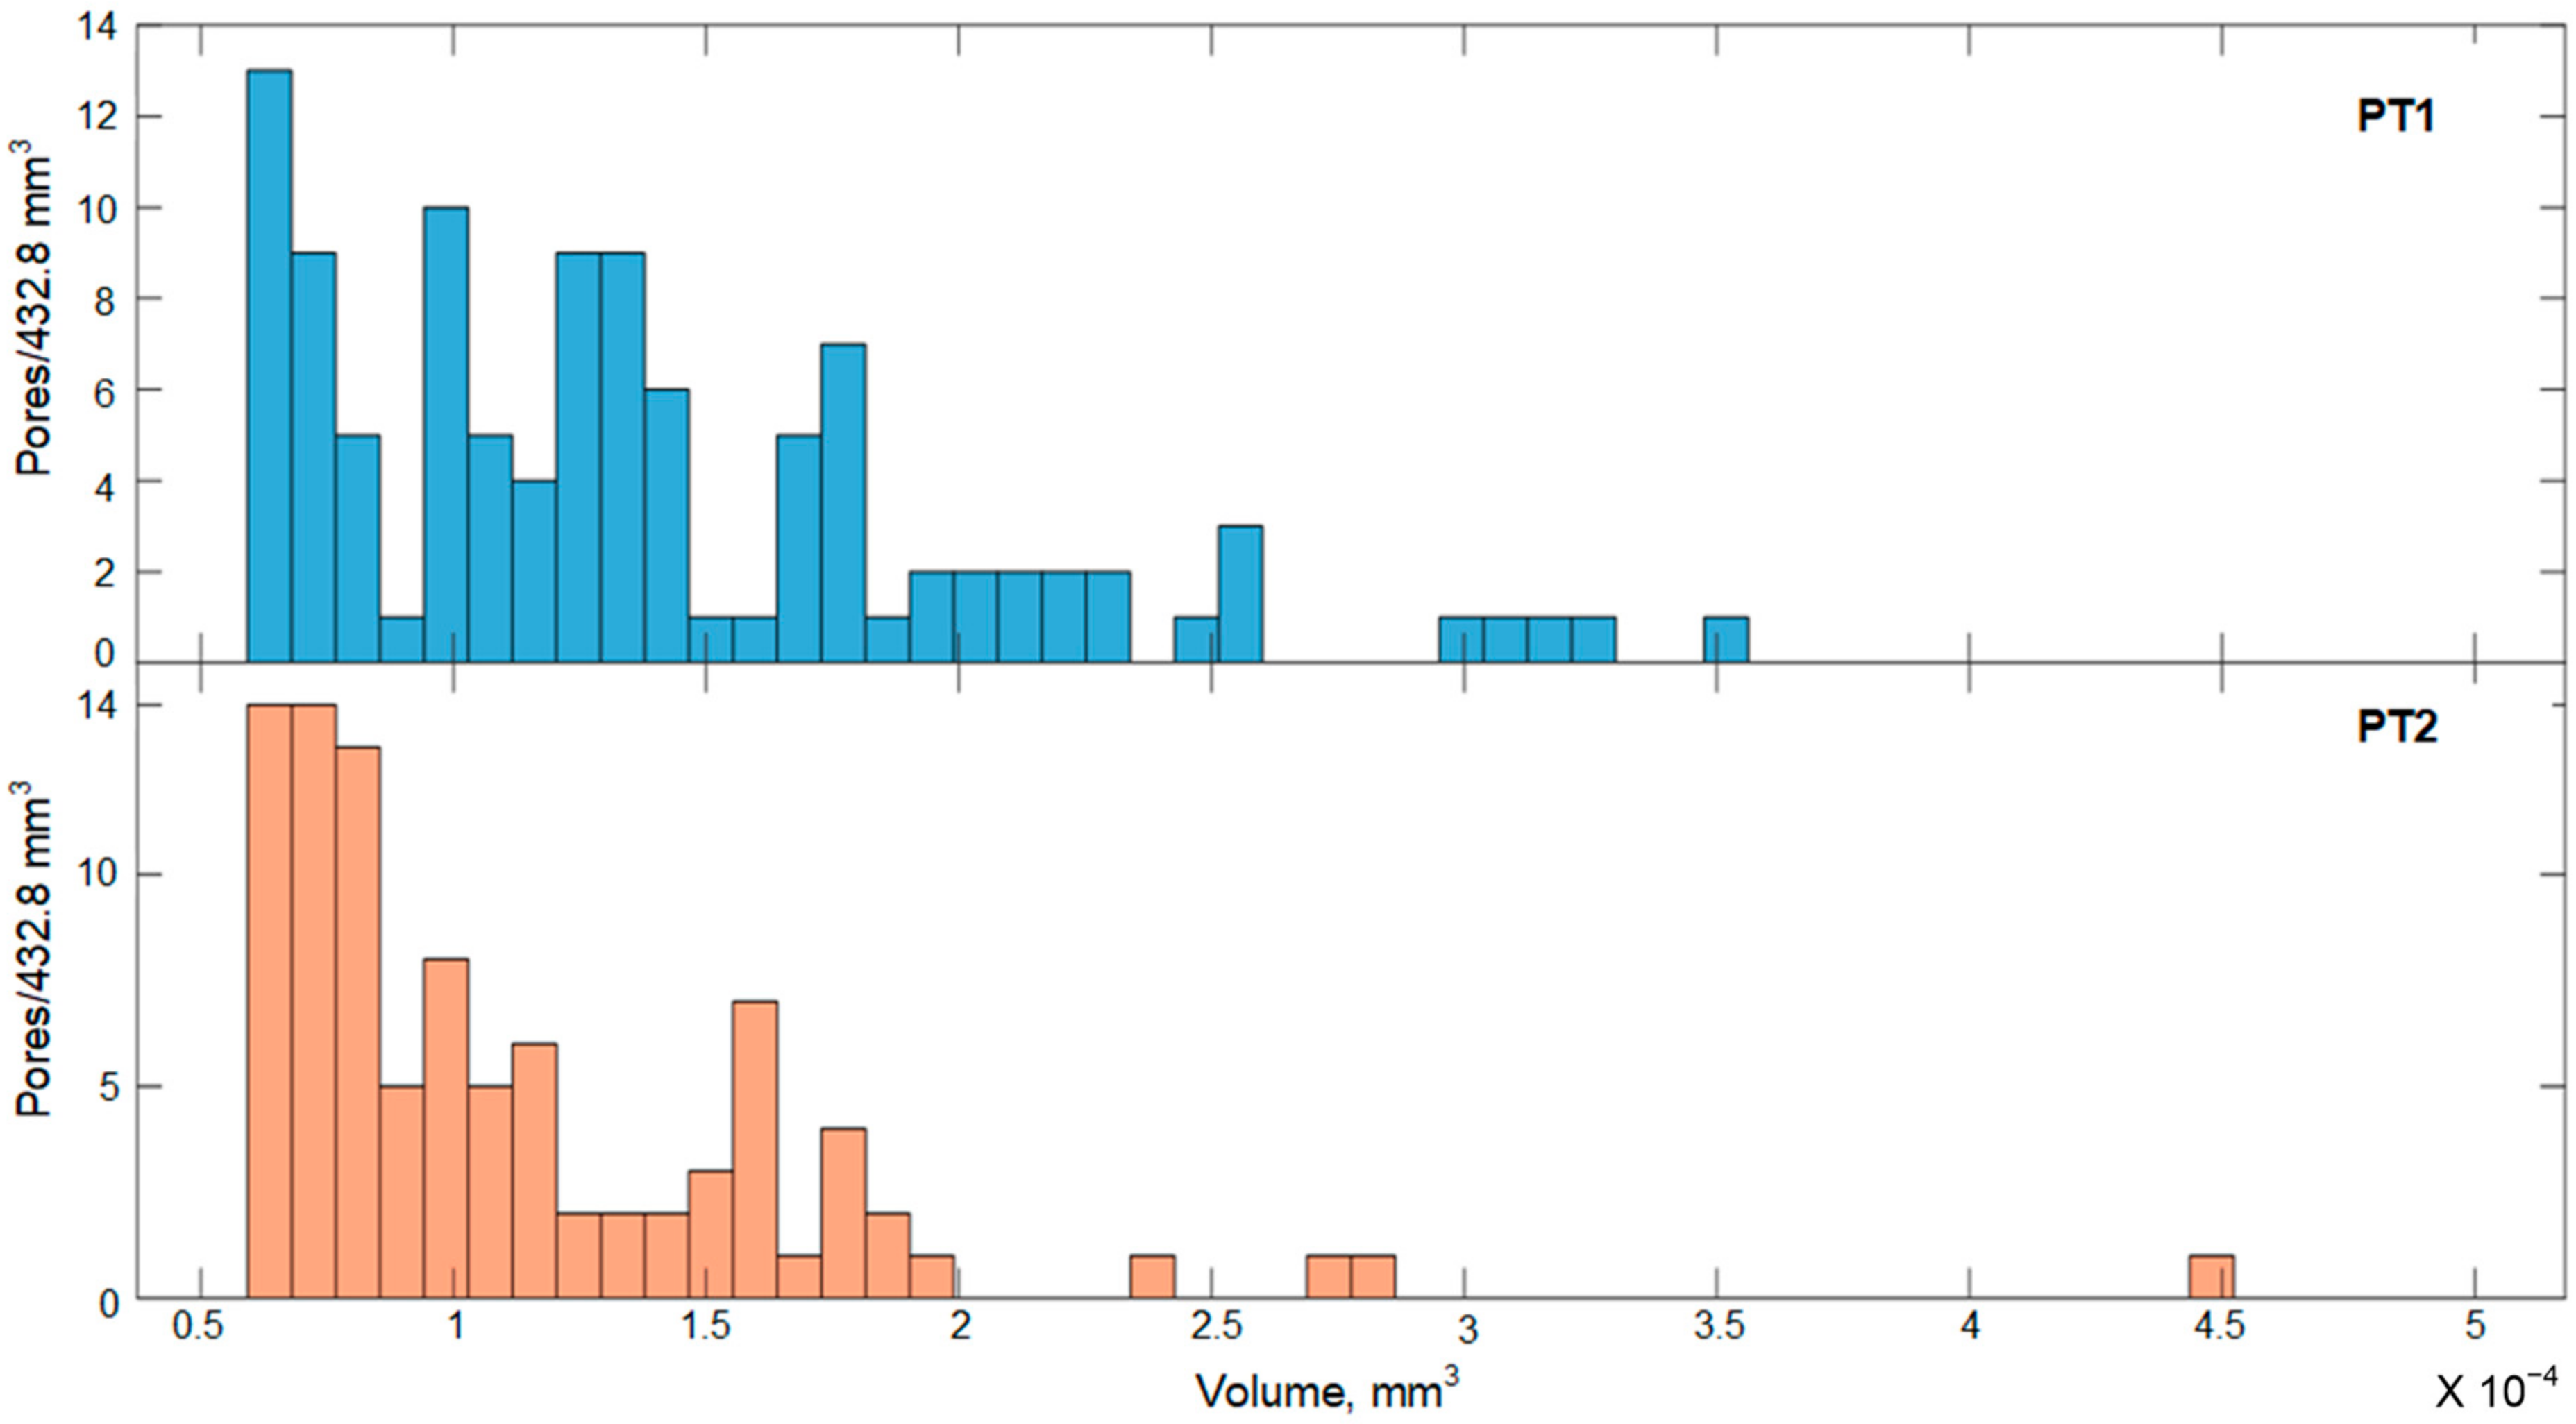
According to the CT measurements, the porosity levels of the PT1 and PT2 specimens are 0.0035 and 0.0033%, respectively (see CT measured pore volume distributions in
Figure 15). The average volumes of individual pores are 1.4·10
−4 and 1.1·10
−4 mm
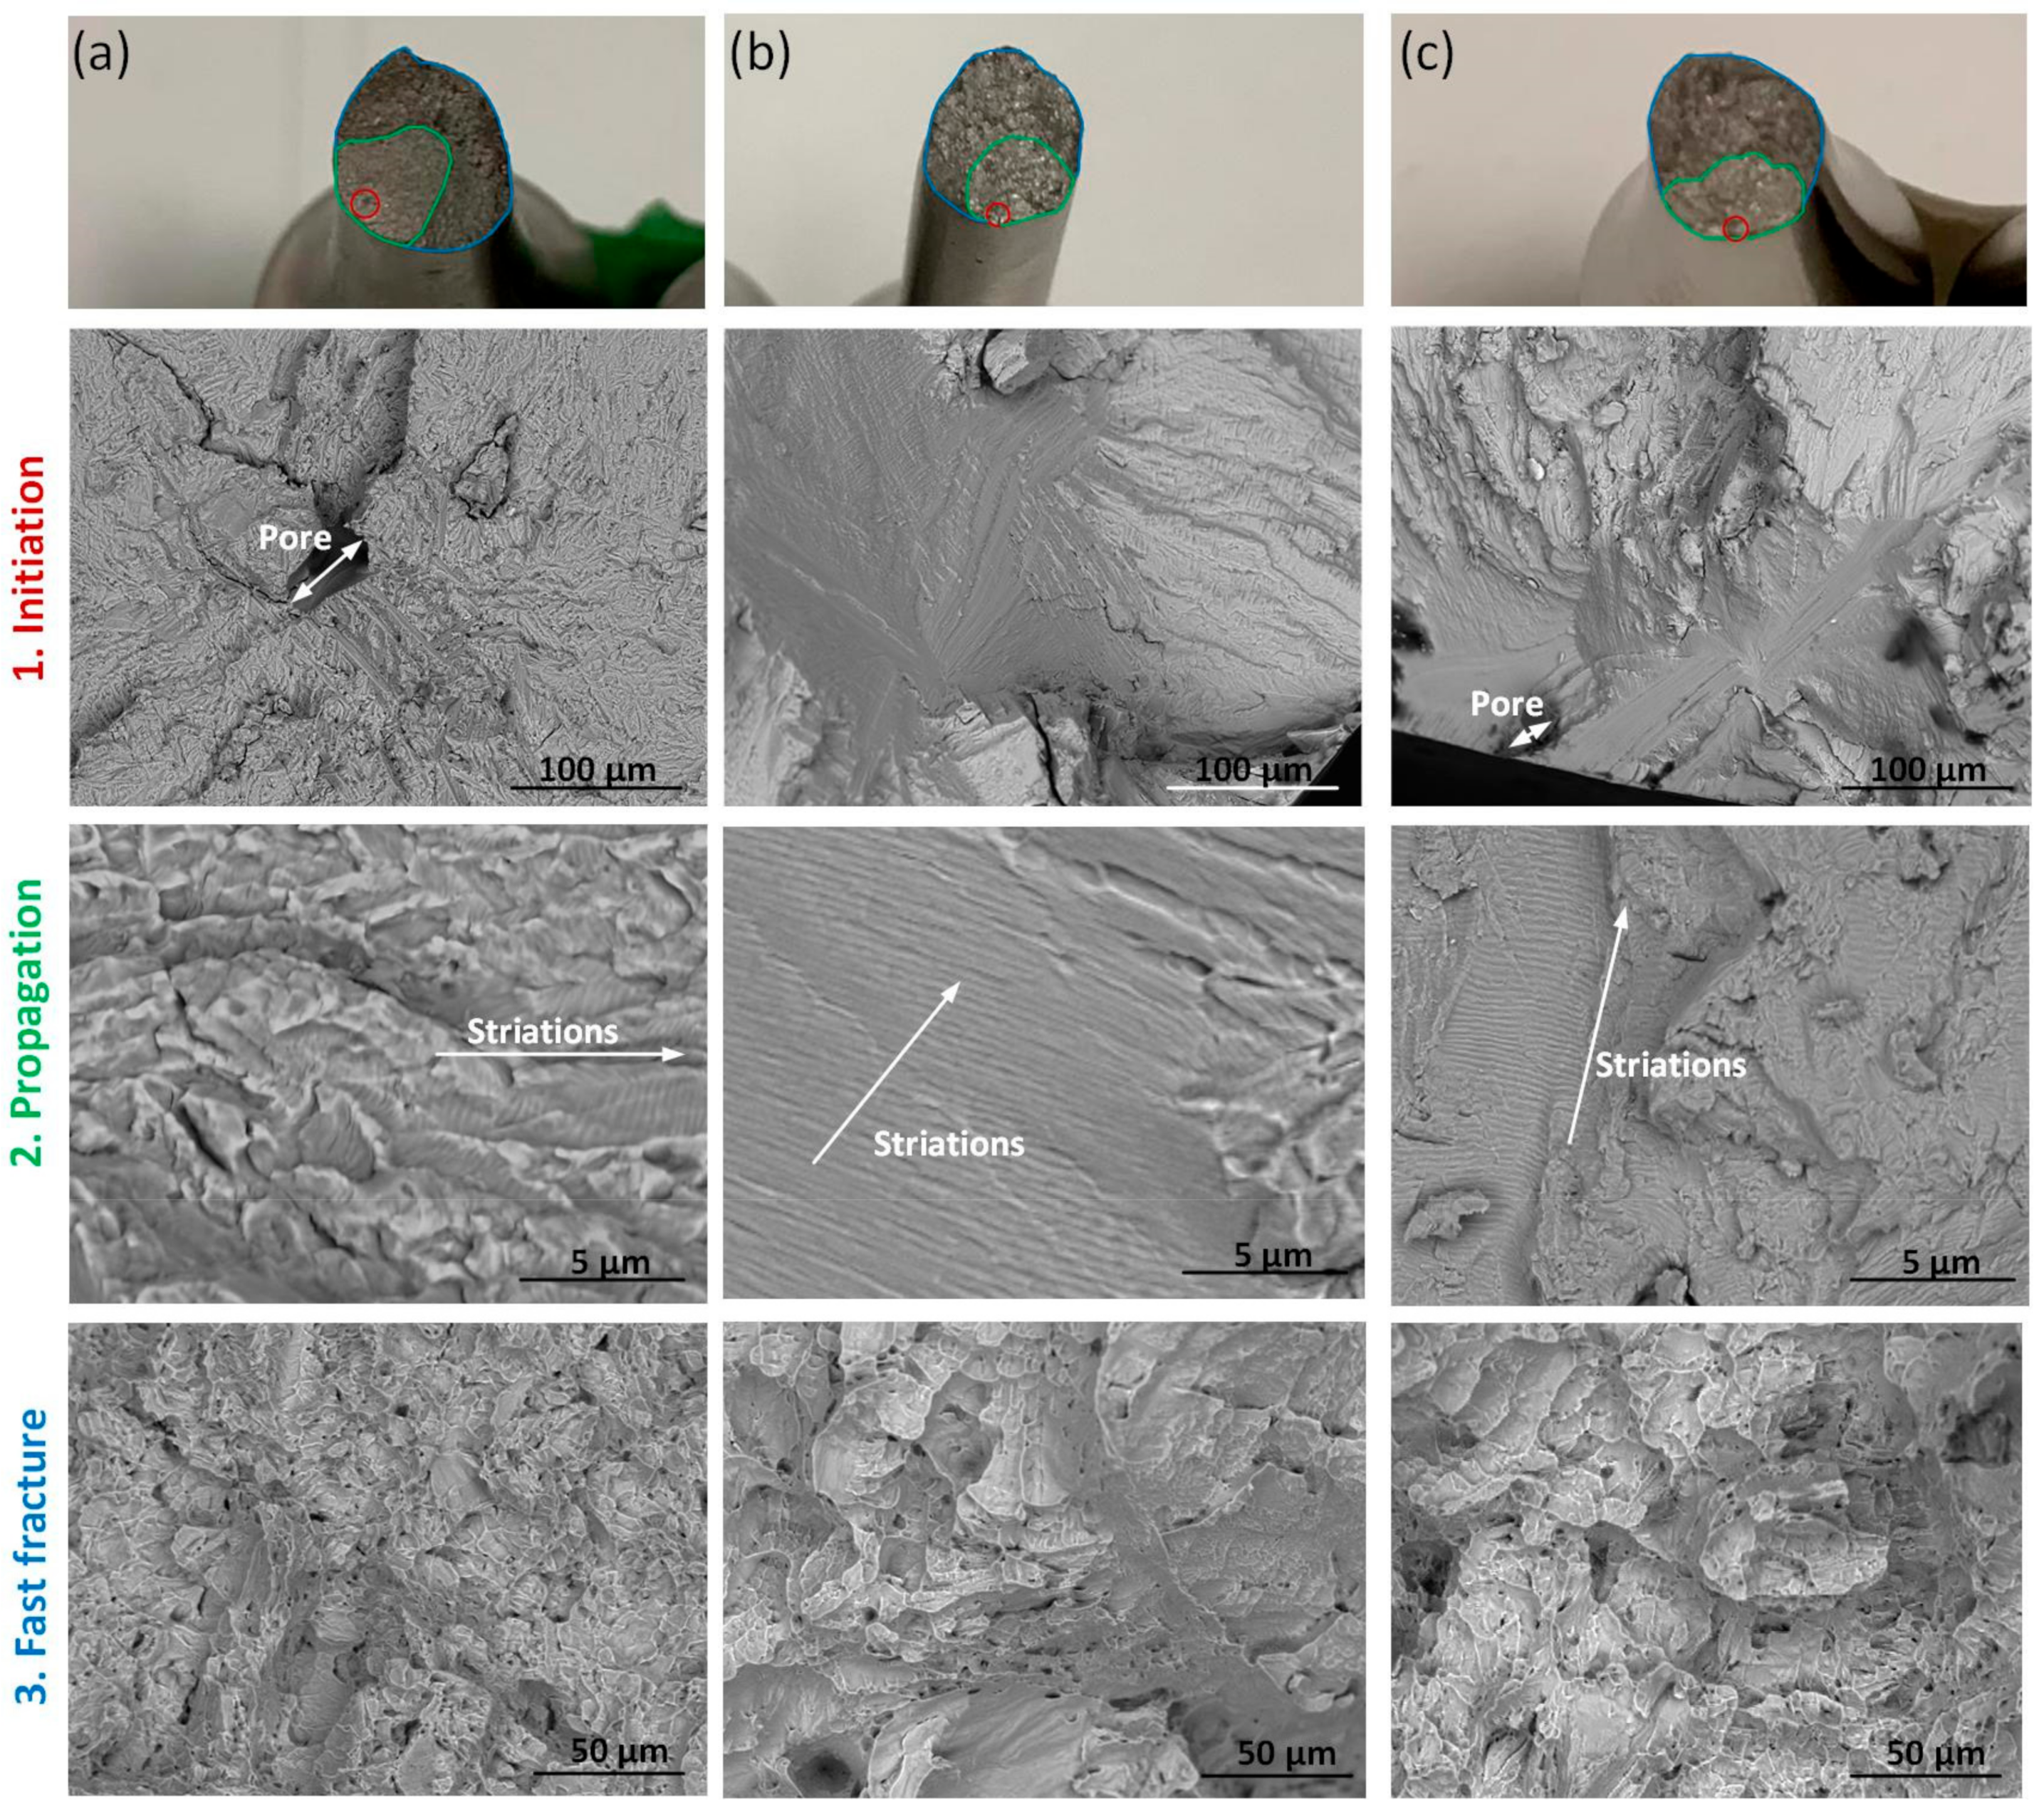
3 (or 64 and 60 µm in pore equivalent diameter) in the PT1 and PT2 specimens, respectively. No pores larger than 7.5 μm (effective voxel size) were detected by CT inspection of the PT3 specimens (note, however, that such small pores were observed near the surface of PT3 specimens during the SEM fractography analysis—
Figure 15). The presence of such small pores should not significantly affect the fatigue resistance of printed Ti64 parts, as shown in [
38].
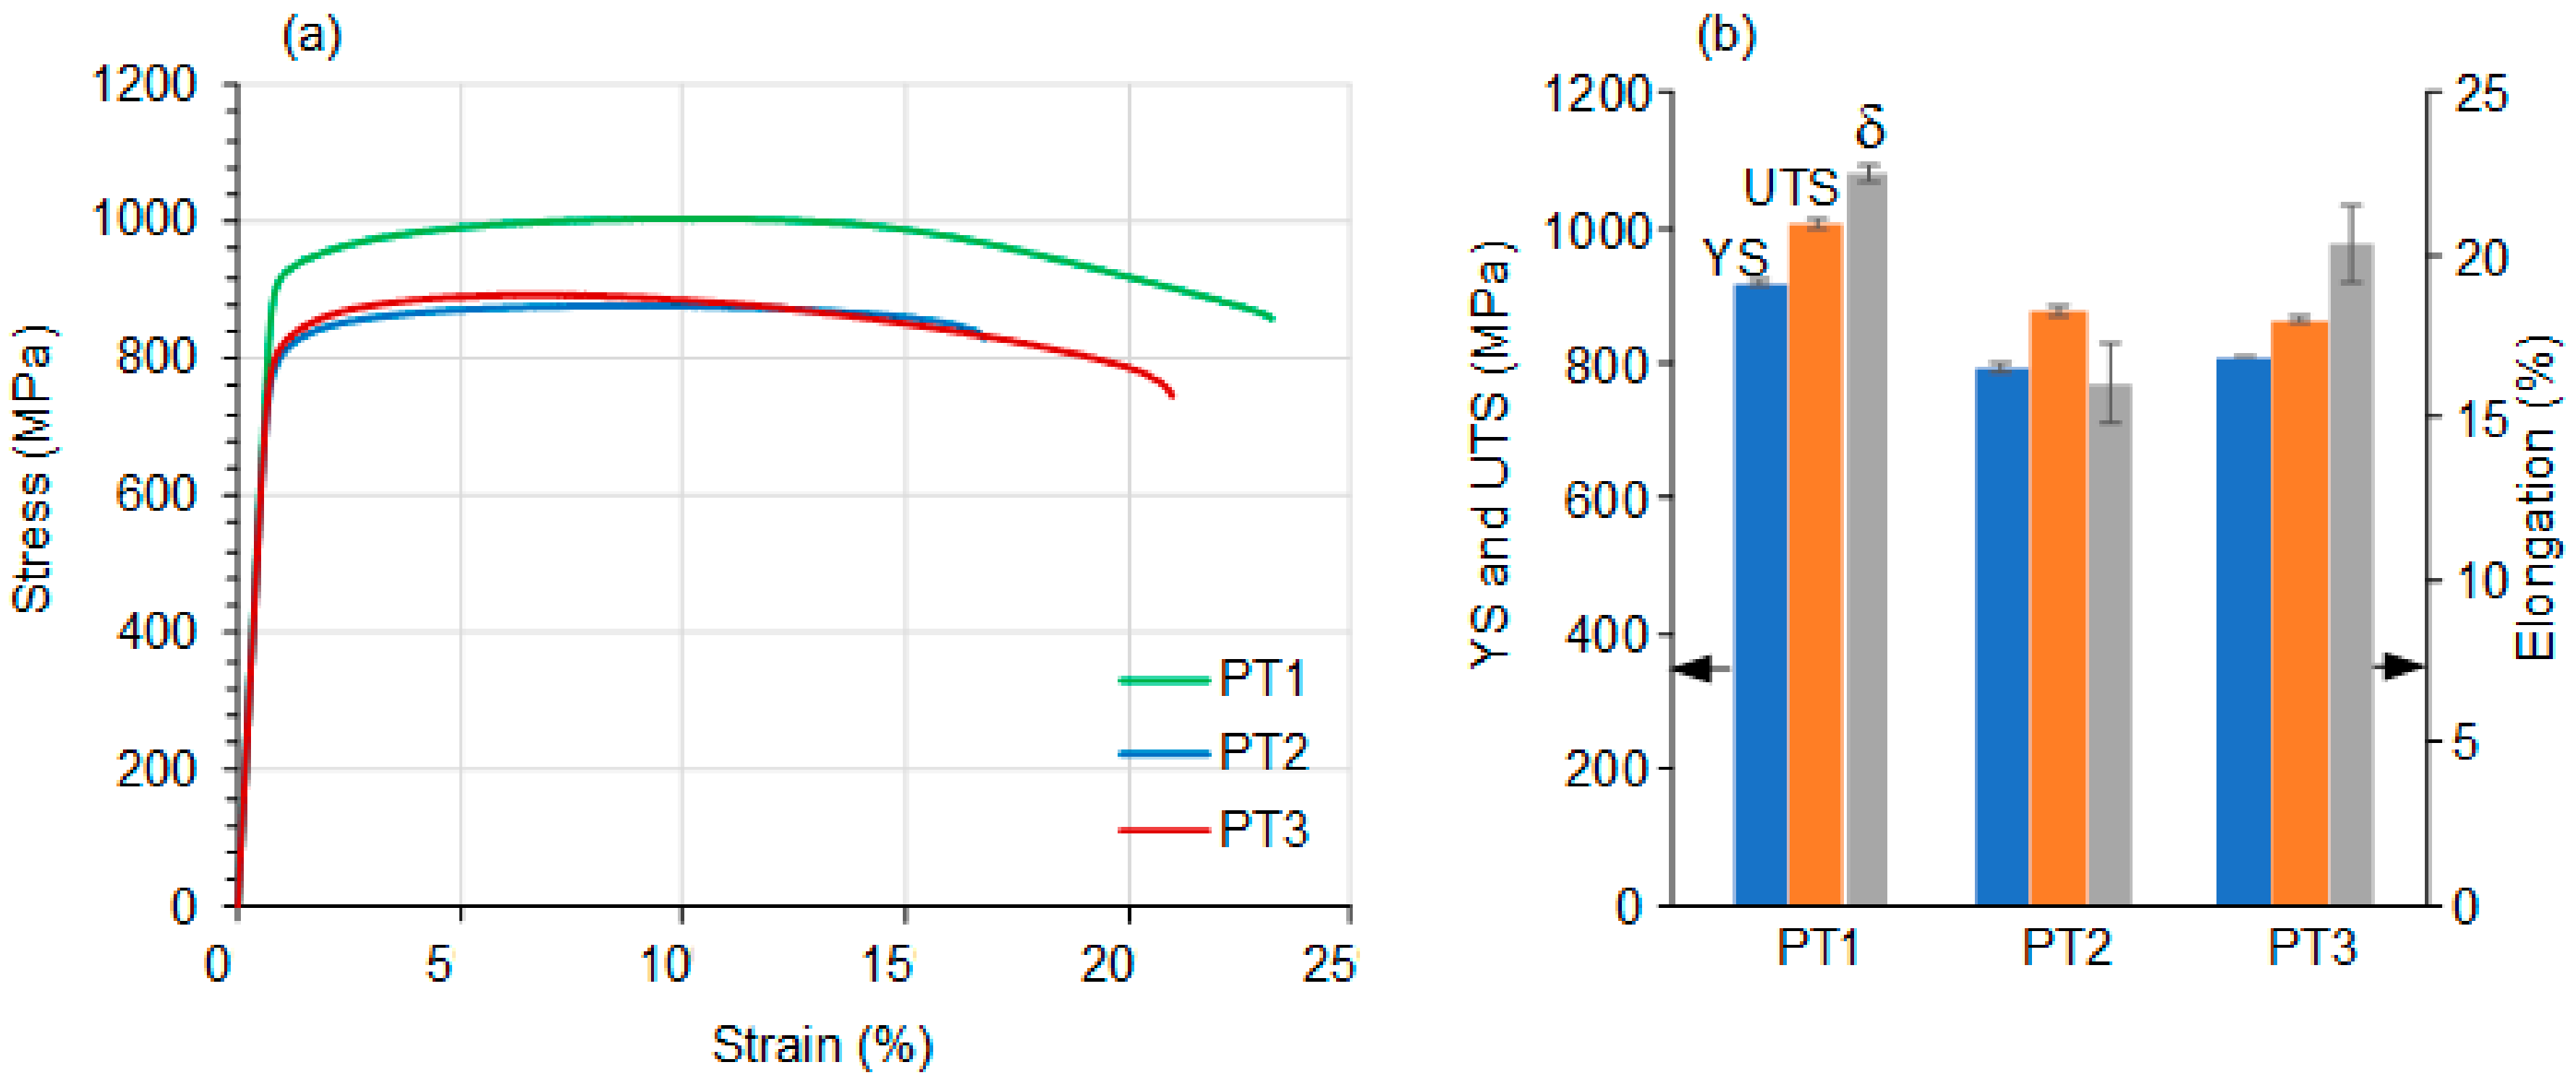
Tensile and fatigue properties. The best combination of tensile properties was found in the case of PT1 specimens manifesting the highest mechanical strength (YS = 918 ± 4.5 MPa and UTS = 1006 ± 6.6 MPa) and elongation to failure (22.5 ± 0.26%). This is due to a combination of a fine basket weave α phase lamellar structure with a relatively low amount of β phase formed inside columnar β grains. The elongation provided by a fine basket weave lamellar microstructure is much higher compared to that provided by the colony-based structures obtained after PT2 and PT3. As well as the α plate width, the size of α lamellae colonies impacts the mechanical properties significantly since they are commensurate with the effective slip length [
14,
39]. Colonies of large α lamellae behave as separate structural elements expected to adversely affect the tensile strength and fatigue crack growth resistance [
40]. This is indeed the case when comparing PT2 and PT3, where the microstructure (colony size) coarsening results in a decrease of YS from 791 (PT2) to 781 MPa (PT3), UTS from 868 (PT2) to 856 MPa (PT3), and elongation from 9.2 (PT2) to 7.9% (PT3).
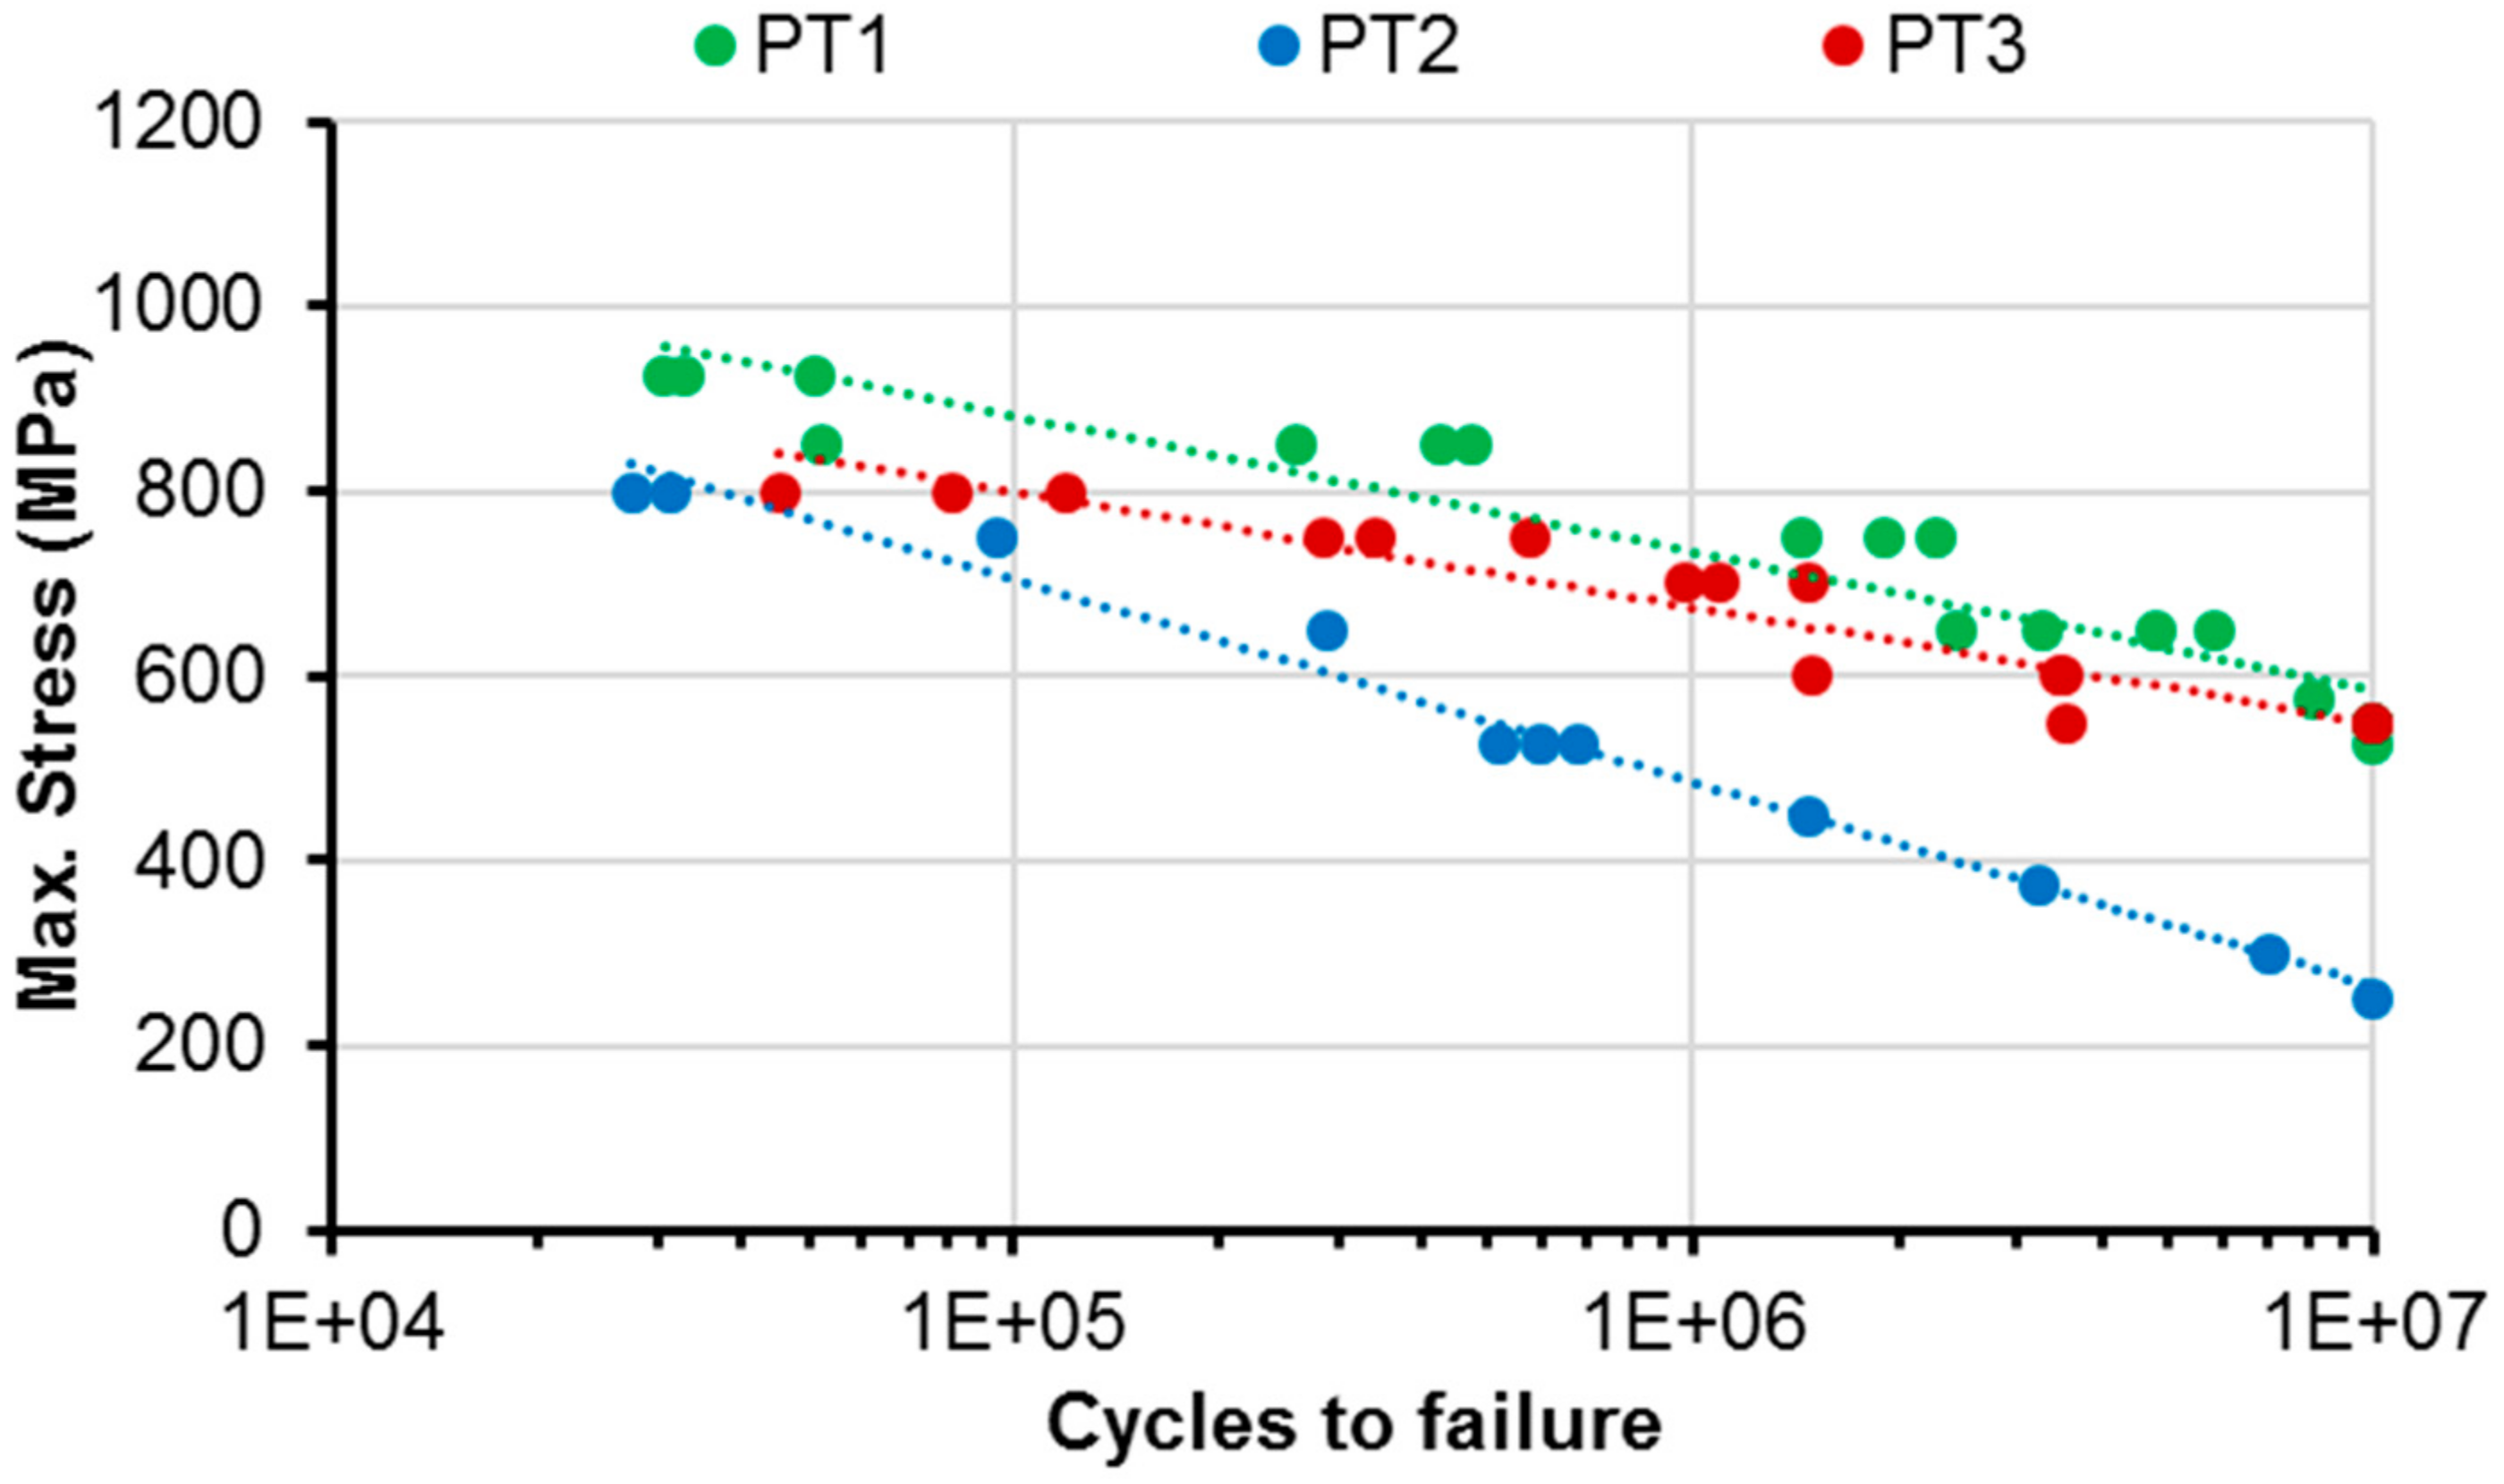
Beta-annealing usually leads to improved fracture toughness, but a lower elongation [
17]; however, the PT1 specimens display superior fatigue properties, with a higher 10
7 cycle (high-cycle regime) endurance as compared to the PT2 and PT3 specimens. This is consistent with the highest tensile strength of these specimens. At shorter lifetimes in the low-cycle fatigue regime, they are still the PT1 specimens that show the best fatigue properties, which is consistent with their higher ductility exhibited during static testing. Fracture surface analysis showed that the fatigue cracks start from the outer surface or subsurface containing defects for the specimens. While for the PT2 and PT3 specimens, fatigue cracks start from either defects or α colony in the region close to the outer surface of the specimen. Numerous secondary cracks found in the PT1 specimen indicate the retardation of the main crack propagation process due to the energy dispersion to multi-branch cracks [
41]. In addition, the crack tip in the PT1 specimens could potentially be deflected inside a fine lamellar structure, thus leading to a zig-zag crack path, a rougher fracture surface, and a higher fatigue life [
42].
As mentioned above, the BST and OA treatments were successfully used for the cast and HIP-ed Ti64 alloys (standard 1550°F mill anneal) to prevent property loss through microstructure refinement within the grains. In this case, according to [
20], the YS and UTS values reached 848–876 MPa and 938–965 MPa, respectively, and the elongation to failure ranged from 5.5 to 9.7%. Comparing these results with those obtained in the present study, it is clear that the BST + OA treatments do not affect the mechanical properties of the LPBF Ti64 alloys in the same way as they do those of their mill-annealed counterparts. The discrepancy is due to the difference in the initial microstructures: basket weave α lamellar structure within columnar β grains observed after SR and HIP of LPBF alloys versus homogenous equiaxed α grain structure of conventional alloys. On the other hand, the PT1 protocol, including the SR and BA thermal treatments, allows for obtaining higher mechanical properties of the LPBF Ti64 as compared to those of the mill-annealed Ti64 alloys: they are 3–5% higher in terms of mechanical resistance and 30–60% higher, in terms of ductility. Finally, since the application of the SR + BA thermal treatment (PT1) results in a higher static and fatigue resistance of the LPBF Ti64 alloy, as compared to the SR (HIP) + BST + OA combinations (PT2 and PT3), the PT1 treatment can be recommended for future use.
5. Conclusions
Non-heat treated (as-built) Ti46 alloy produced by laser powder bed fusion (LPBF) contains fine acicular martensite inside the columnar grains. Single-stage heat treatments, such as stress relief (SR), beta-phase annealing (BA), hot isostatic pressing (HIP), the beta-solution (BST), and the over aging (OA) performed in the 593–1027 °C temperature range result in the relaxation of residual stresses, partial or complete transformation of the acicular martensite into α phase, and the formation of variable α + β phases structures. The higher the temperature of heat treatment, the greater the amount of α/β lamellar structures and the lower the hardness of the alloy. The high-temperature treatment (BST) leads to a more stable and uniform α/β lamellar structure.
The lamellar structures and the mechanical properties of the LPBF Ti64 alloy were also compared after three multi-stage heat treatments: (1) stress relief + beta annealing (PT1 = SR + BA), (2) stress relief + beta solution + overaging (PT2 = SR + BST + OA), and (3) hot isostatic pressing + beta solution + overaging (PT3 = HIP + BST + OA). It can be concluded that the mechanical properties of Ti64 alloy strongly depend on the morphology of phases, the type of structure (lamellar or coarse), and the size and shape of structural components. The main differences were observed in the (a) β phase contents, (b) α/β structure arrangement, and (c) α/β structure homogeneity. As far as the β phase content is concerned, it was 2% higher for specimens subjected to supertransus SR + BST + OA and HIP + BST + OA treatments as compared to a subtransus SR + BA treatment. As far as the α/β structure arrangement is concerned, a basket weave structure with some globular α grains was observed after SR + BA as compared to α colonies observed after SR + BST + OA and HIP + BST + OA. Finally, a greater structure homogeneity is observed after SR + BA and SR + BST + OA as compared to HIP + BST + OA (heterogeneous mixture of basket weave structure and colonies). The results of mechanical testing show that a two-step PT1 = SR + BA treatment provides the LPBF Ti64 alloy with a higher static and fatigue resistance than triple-step PT3 = SR (HIP) + BST + OA treatments, making it appropriate for post-processing of LPBF Ti64 components when fatigue life is of primary concern.


