Article

Assessment of the Health Status of Old Trees of Platycladus orientalis L. Using UAV Multispectral Imagery

1
College of Forestry, Northwest A&F University, Yangling 712100, China
2
Research Center for the Conservation and Breeding Engineering of Ancient Trees, Yangling 712100, China
*
Author to whom correspondence should be addressed.
Drones 2024, 8(3), 91; https://doi.org/10.3390/drones8030091
Submission received: 9 January 2024 / Revised: 24 February 2024 / Accepted: 28 February 2024 / Published: 7 March 2024

Abstract

:
Assessing the health status of old trees is crucial for the effective protection and health management of old trees. In this study, we utilized an unmanned aerial vehicle (UAV) equipped with multispectral cameras to capture images for the rapid assessment of the health status of old trees. All trees were classified according to health status into three classes: healthy, declining, and severe declining trees, based on the above-ground parts of the trees. Two traditional machine learning algorithms, Support Vector Machines (SVM) and Random Forest (RF), were employed to assess their health status. Both algorithms incorporated selected variables, as well as additional variables (aspect and canopy area). The results indicated that the inclusion of these additional variables improved the overall accuracy of the models by 8.3% to 13.9%, with kappa values ranging from 0.166 and 0.233. Among the models tested, the A-RF model (RF with aspect and canopy area variables) demonstrated the highest overall accuracy (75%) and kappa (0.571), making it the optimal choice for assessing the health condition of old trees. Overall, this research presents a novel and cost-effective approach to assessing the health status of old trees.

1. Introduction

Old trees hold great significance as living cultural relics, serving as invaluable historical, cultural, scientific, and ecological resources. They are keystone structures in forests, woodlands, savannas, agricultural landscapes, and urban areas, playing unique ecological roles not provided by younger, smaller trees [1]. Furthermore, they have an important place in the human psyche and have many human cultural and aesthetic values [2]. Within ancient tree communities, multiple single or diverse tree species grow together in a relatively concentrated manner, highlighting their exceptional significance and value. However, the survival of old trees is constantly threatened by various abiotic and biotic factors. Hence, it becomes essential to ensure the accurate and timely monitoring of stand and tree health status for the effective health management of old trees [3,4]. Traditionally, the assessment of the health status of trees relies on time-consuming field sampling and observations of symptoms exhibited on the trunks and foliage of trees, with a high degree of uncertainty, only feasible at the plot-scale [5]. Remote sensing enables the acquisition of forest health indicators based on spectral or structural features derived from sensor data in an objective, quantitative, and repetitive manner at multiple spatial scales [6]. In forests of old trees, up-to-date and regularly acquired information becomes a key requirement. Besides timeliness, a very high spatial resolution is also critical in sustainable forest management [7].
Unmanned aerial vehicles (UAVs) offer a promising solution to this issue, as they enable high-intensity data collection at a lower operational cost, providing a more frequent and comprehensive method for assessing the health of old trees [8]. Minařík and Langhammer [9] used a UAV equipped with a multispectral sensor to distinguish the boundary categories represented by healthy and dead trees, which presents a new methodological approach for the assessment of spatial and qualitative aspects of forest health. Nguyen et al. [10] used UAV images and deep learning to identify individual sick fir trees (Abies marriesii) in insect-infested forests and managed to correctly detect/classify 78.59% of all tree classes (39.64% for sick fir).
From the literature survey, in the field of forest health assessment based on UAVs, the remaining works have mainly focused on detecting forest damage [11,12] rather than individual trees, specifically old trees. Most are solely based on RGB sensors [13,14] and limited to spectral and texture information [15,16]. Studies have been conducted on low tree density and low levels of structural complexity, but forest conditions may pose unique challenges for detection [16]. In forests, many large branches overlap, which affects the segmentation of individual trees, and some studies have errors in the acquisition of spectral features due to the angle of elongation. With respect to the aforementioned studies and their limitations, we propose a more diverse and detailed methodological framework, using a combination of spectral and textural information and two algorithms (support vector machines (SVM) and random forest (RF)), followed by introducing additional variables to improve performance and mapping.
Machine learning algorithms are widely used to classify the health of individual trees [5]. Random forest (RF) and support vector machine (SVM) are representative [17]. RF is a machine learning method with a large data processing capacity, fast operation speed, high noise immunity, and an ability to suppress overfitting, based on the generation of classification trees and on the aggregation of their results [18]. SVM is one of the classic machine learning techniques that learns by example to assign labels to objects based on statistical learning theory [19]. SVM is preferred for its ability to perform better with limited training samples. It utilizes only the subset of the training samples that define the location of the SVM optimum hyperplane.
Large old trees are among the most imperiled organisms on earth, and their protection demands innovative approaches to management and monitoring over unprecedented time frames [2]. This study provides useful information for assessing–mapping the health status of old trees aiming to support precision health management and decision making for individual old trees. Here, based on multispectral data collected by a small UAV, our research aims to (1) verify the performance of the rapid health assessment of old trees framework based on UAVs; (2) compare the advantages and disadvantages of different algorithms.

2. Material and Methods
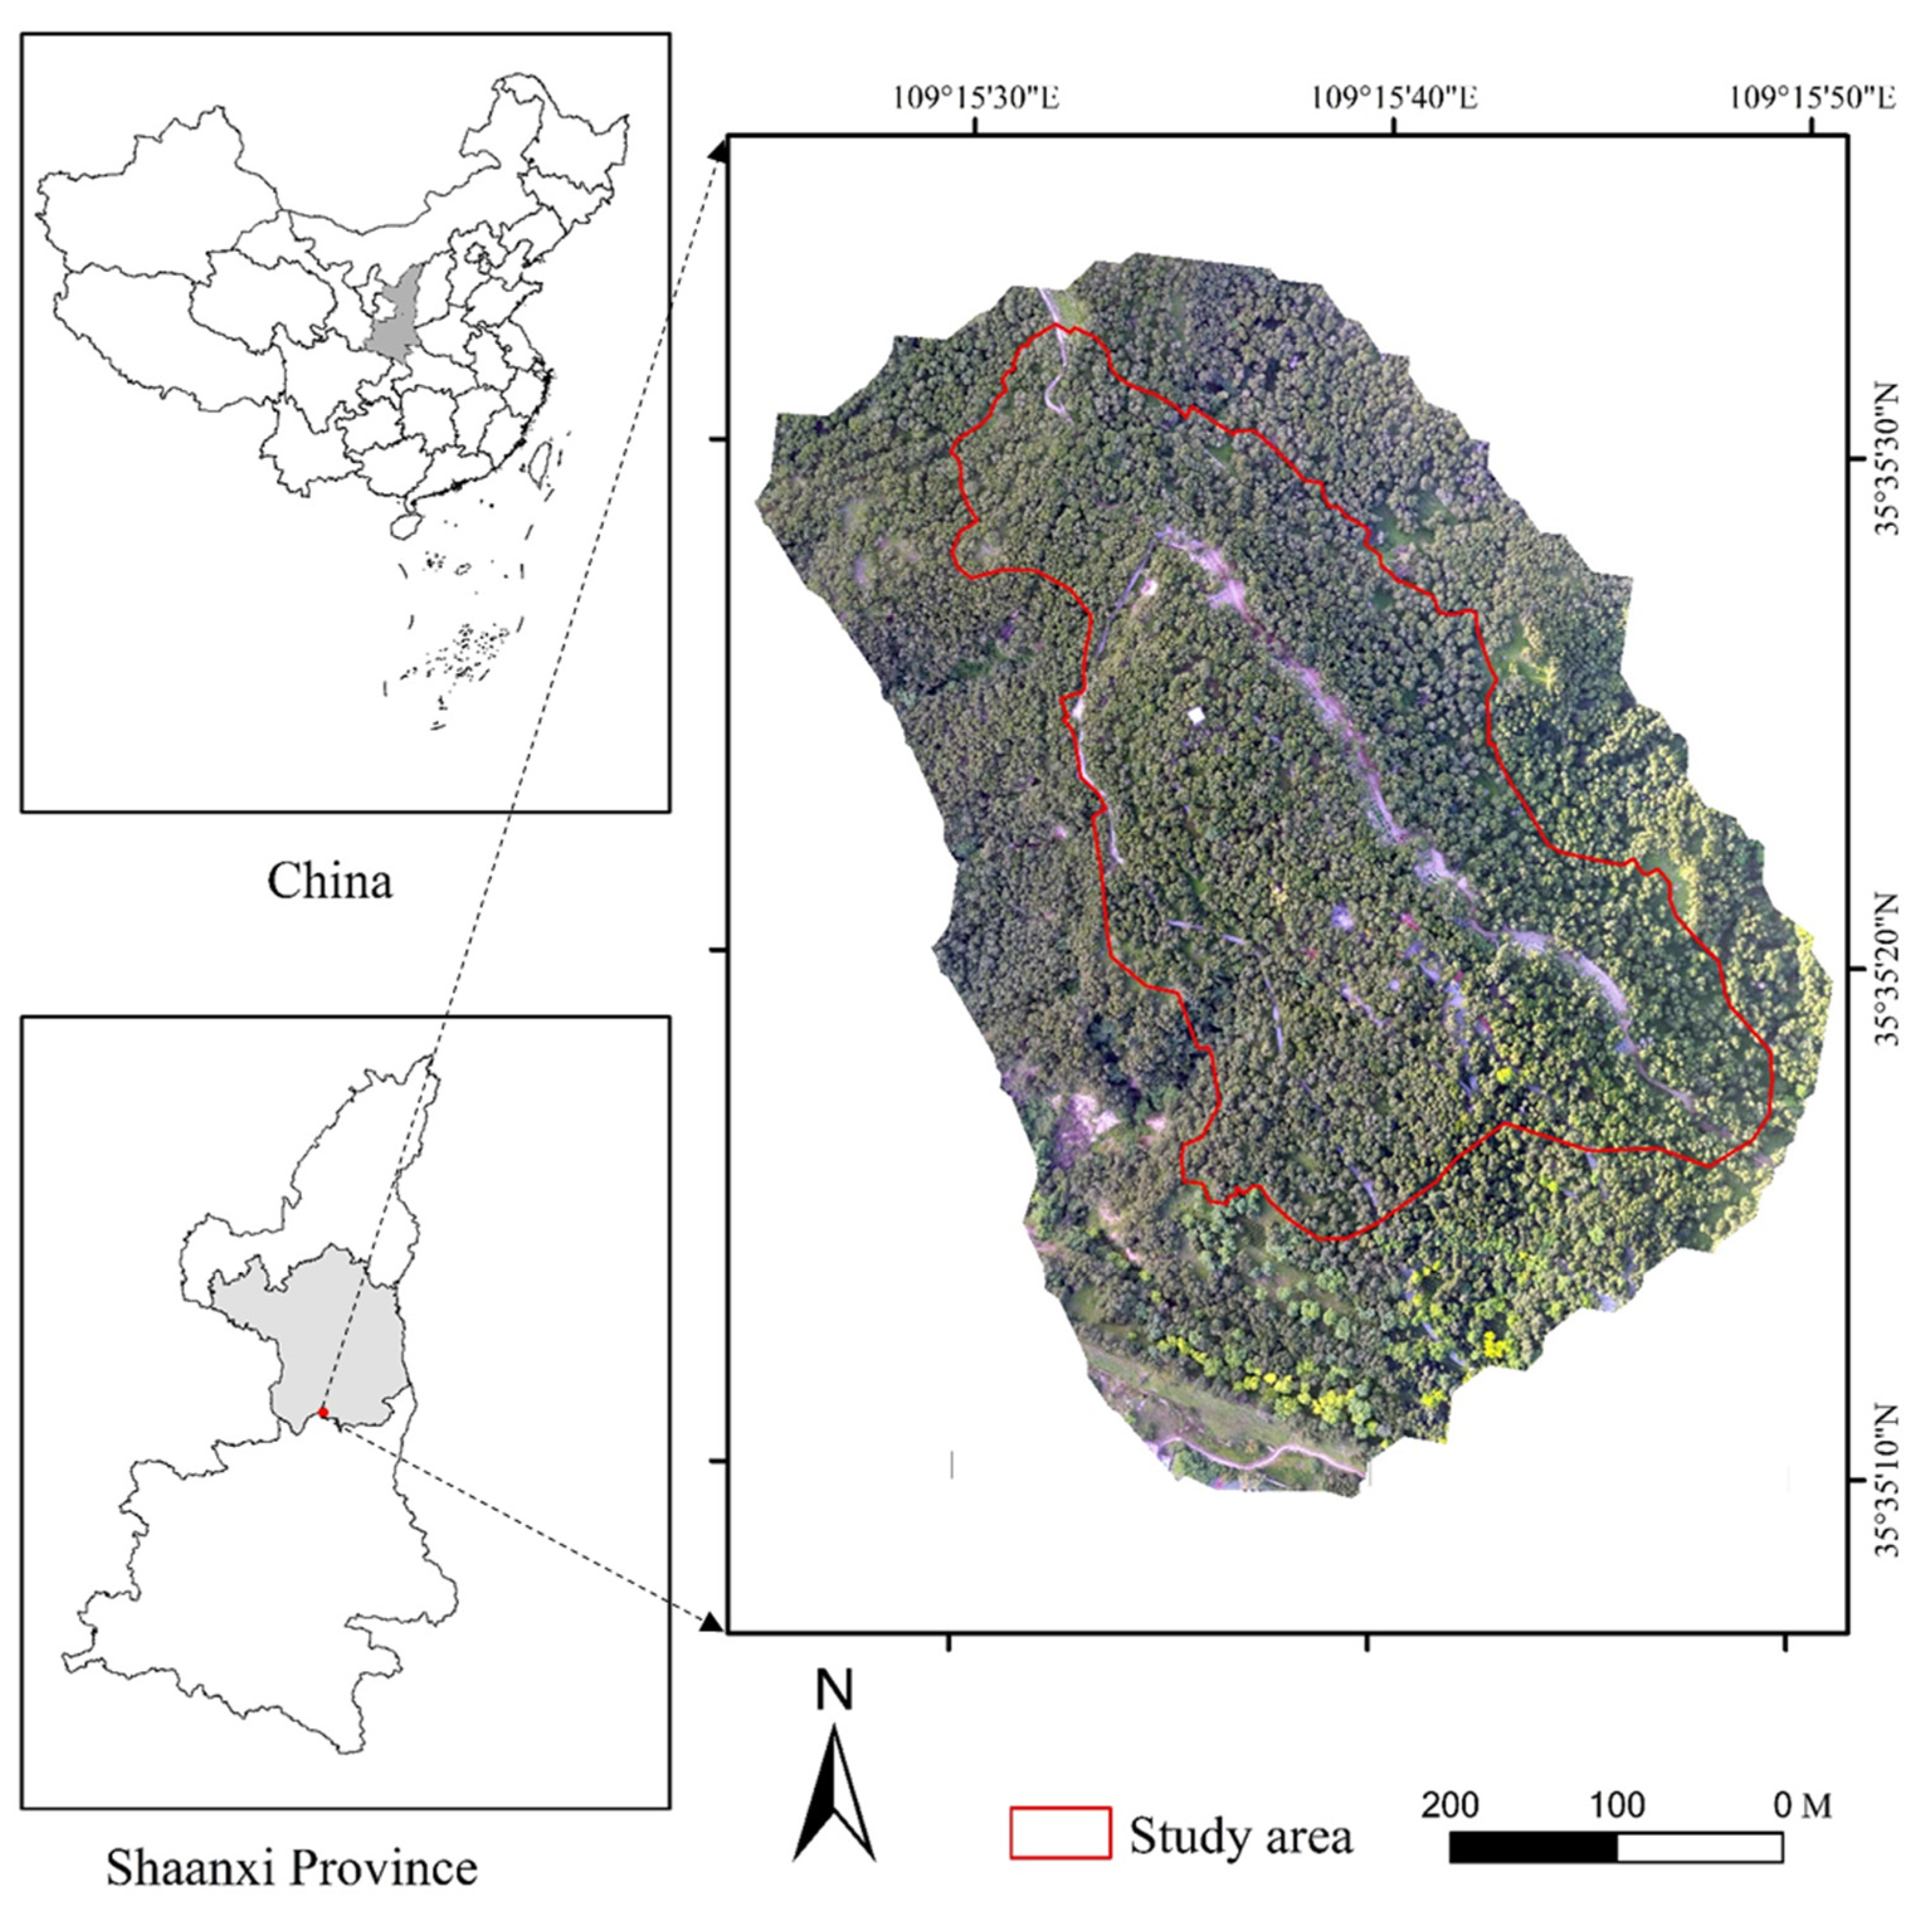
2.1. Study Area

The central part of the Huangling National Forest Park (Figure 1), located in the southern area of Yan’an City, Shaanxi Province, Northwestern China (35°35′33″–35°35′14″ N, 109°15′29″–109°15′50″ E), was selected as the test area. There are more than 200 centenarian trees here. The total area of the study area is 130,000 m2, and the altitude is 940–965 m. It belongs to the temperate continental monsoon climate, with an average annual temperature of 9.4 °C and an average annual rainfall of 568.8 mm. In the study area, the high-density forest is mainly composed of Platycladus orientalis.

2.2. Field Measurement Data

Field-based sampling was carried out to provide reference data for each forest health status. In the field, 142 old trees were positionally located using a high-precision South RTK GPS (Yinhe Plus 1), and their heights, diameters at breast height, sites and crown widths in the east–west and north–south directions were recorded. The field survey was conducted in July 2022. To assess the health of each sampled tree, twelve parameters were used to evaluate crown vigor and degradation [20]. Each parameter had five-level evaluation criteria, ranging from 0 (best) to 4 (worst), and the evaluation criteria for each level had well-defined visual characteristics of trees. The standardized data of the 12 evaluation indices were subjected to the Kaiser–Meyer–Olkin (KMO) test and the Bartlett spherical test to determine the suitability of principal component analysis. The common factor variance of each index was calculated by principal component analysis, and the proportion of the variance of each common factor to the sum of the common factor variance was further calculated, which was used as the weight of the assessment index. The overall health score of each tree was then obtained. The K-means clustering method was used to evaluate the health status of the old trees, and the ancient trees were divided into three categories: healthy, declining, and severe declining (Table 1). The field data were used as a reference for modelling the predicted tree health status. In the above process, Excel was used for statistical tabulation and IBM SPSS Statistics 27 for data analysis and processing.

2.3. UAV-Based Multispectral Data

The multispectral imagery was collected by a multispectral UAV (DJI Phantom 4, Shenzhen, China) equipped with a real-time kinematic (RTK) module. The integrated multispectral imaging system includes one visible light (RGB) camera and five multispectral cameras, blue light (B), green light (G), red light (R), red edge, and near infrared (NIR), responsible for visible light imaging and multispectral imaging, respectively.
The multispectral data were acquired from 10:00 to 11:30 on 22–23 July 2022 in the study area. The weather was clear, and the surface temperature was about 25–30 °C. The flight height was 80 m, and the front and side overlap were set to 80% and 75%, respectively. When processing the UAV data, we transformed the projection coordinate system to WGS 1984 UTM Zone 49 N. The digital surface model (DSM) and orthophotos of the study area were generated by Terra v2.3.3. In this study, the canopy height model (CHM), subtracting the digital elevation model (DEM) from the digital surface model (DSM), as extracted from the DSM using tools in ArcMap 10.8 [21]. Compared with object-oriented image segmentation, object segmentation based stereoscopic information is more conducive to the recognition of single tree structural features, and the marker-controlled watershed algorithm (MCWS) was used for individual tree segments [22]. We depicted the crown shape of 142 old trees as a reference value to verify the results of single tree segmentation (Figure 2a). Then, the segmentation states were divided into true positive (TP), false positive (FP), false negative (FN). Two indexes were used to evaluate the accuracy of results: overall accuracy and F-score. Finally, we obtained a high accuracy (0.836) and an available F-score (0.882). The individual tree segmentation was based on R Studio 4.2 (Figure 2b).

2.4. Feature Extraction

We extracted candidate explanatory variables from the UAV data at the canopy scale, including both spectral and 3D structural features of the tree canopy.
We used the set of 31 selected vegetation indices to extract canopy values, and we used eight grey level co-occurrence matrices (GLCMs) to extract the texture variables NDVI and DSM, which are useful for describing canopy structure (Table 2) [23]. Mean values were then calculated using all pixels within the canopy. All of the texture variables were calculated using a window size of 3 × 3 pixels and a shift of 45 degrees. All of the above data processing and analysis steps were carried out using the ArcMap 10.8 software and the ENVI 5.4 software.
The variables were further analyzed using the Boruta feature selection algorithm [48], which can reduce the influence of a large number of explanatory variables. The Boruta algorithm consists of the following steps [48]: 1. Extend the information system by adding copies of all variables (the information system is always extended by at least five shadow attributes, even if the number of attributes in the original set is lower than 5); 2. Shuffle the added attributes to remove their correlations with the response; 3. Run a random forest classifier on the extended information system and gather the Z scores computed; 4. Find the maximum Z score among shadow attributes (MZSA), and then assign a hit to every attribute that scored better than MZSA; 5. For each attribute with undetermined importance perform a two-sided test of equality with the MZSA; 6. Deem the attributes which have importance significantly lower than MZSA ‘unimportant’ and permanently remove them from the information system; 7. Deem the attributes which have importance significantly higher than MZSA ‘important’; 8. Remove all shadow attributes; 9. Repeat the procedure until importance is assigned for all the attributes or the algorithm has reached the previously set limit of the random forest runs. We introduced aspect and crown area as additional variables. The aspect was divided into four types (Figure 3.) based on DEM data from DSM in individual tree segmentation [49], and we set two data sets (selected variables, selected and additional variables) to build RF and SVM models separately.
Training/validation data extraction at the crown level was based on the identification and manual delineation on the RGB orthomosaics of the 142 old trees surveyed in the field and stored as polygon vectors. Pixel values of the candidate explanatory variables were retrieved for each tree crown polygon using the extraction function embedded in ArcMap 10.8. The extracted values were used to calculate the mean of the variables for each individual canopy. The derived statistics were stored in a database and used as the input data for further analysis using RF and SVM classifiers.

2.5. Tree Health Status Modelling and Mapping of P. orientalis Health Status

SVM and RF were used to assess the health status of old trees. The two models were implemented with the “e1071”, and “random Forest” packages in R, version 4.2.1, respectively. During model building, the field measurement data were randomly divided into a training set (75%) and a validation set (25%). The training set was used to build scoring models, and the validation set was used to validate the models. Confusion matrices were constructed using the validation samples and corresponding classification results from the four scenarios described in Section 2.4. A confusion matrix is a table layout that allows a visualization of the performance of a supervised learning algorithm. Each column of the matrix represents the instances in a predicted class, while each row represents the instances in an actual class. Producer’s accuracy (PA), user’s accuracy (UA), overall accuracy (OA), and kappa coefficients were calculated and used to assess accuracy. Producer accuracy is the probability that ground truth reference data for the category is correctly classified. User accuracy is the probability that a target is correctly classified in a category. Overall precision is the number of all correct classifications as a percentage of the total number of extractions. The kappa coefficient is a metric used to test consistency. By comparing the classification accuracies of the different scenarios, the optimal scenario of the feature combination and classification algorithm was determined and then used to predict the health status of old trees in the whole area.

3. Result

3.1. Field Health Assessment

We used principal component analysis (PCA) to obtain the overall health score of old trees, and we obtained KMO = 0.878 > 0.5, Bartlett’s test of sphericity p < 0.001, representing a suitable candidate for principal component analysis. Based on the criterion of eigenvalue greater than 1, three common factors were extracted using principal component analysis and using the maximum variance method; the eigenvalue of component 1 was 6.107, the eigenvalue of component 2 was 1.234, and the eigenvalue of component 3 was 1.034, and the variance contribution ratio of these three was 69.80% (Table 3). The weights of the components and the overall health score were obtained by calculation (Table 2). Then, after K-means clustering, they were divided into three categories, healthy, declining, and severe declining, and the numbers were 53, 68, and 21, respectively.

3.2. Feature Selection

In the feature selection, the Z score of the most important shadow attribute clearly separates important and unimportant attributes. Red, yellow, and green boxplots represent Z scores of, respectively, rejected, tentative, and confirmed attributes. Four variables were selected, including three vegetation indices (NDVIredge, NDGI, and rbNDVI) and one texture measure (DSM-mean) (Figure 4).

3.3. Model Comparison

SVM performed better than RF with the same selected features in terms of overall accuracy and kappa coefficient. As shown in Table 4, the overall accuracies and kappa values based on selected features were 55.6% and 0.197 for SVM and 61.1% and 0.338 for RF. In SVM, the main errors came from a misclassification of the healthy and severe declining as declining, resulting in low PA for the healthy (0.14) and severe declining (0.4). In RF, the main error came from misclassifying severe declining as declining, resulting in a low PA for severe declining (0.2).

3.4. Models with Crown Area and Aspect Variables

For the models with crown area and aspect variables, accuracy was improved in terms of both overall accuracy and kappa (Table 5). The overall accuracy of A-SVM and A-RF was 63.9% and 75%, respectively, showing an increase of 8.3% and 13.9%. The kappa coefficients of A-SVM and A-RF were 0.363 and 0.571, representing an increase of 0.166 and 0.233, respectively. After adding variables, all categories performed better, including UA and PA. The A-RF model, which had the higher OA (75%) and kappa (0.571), was considered optimal for estimating the health status of old trees.

3.5. Spatial Distribution of Old Trees with Different Health Conditions

The A-RF model, based on a combination of crown area and aspect characteristics, was applied to the whole study area and produced a spatial distribution of the health status of old P. orientalis trees (Figure 5). The number and proportion of old trees in each health category was summarized in Table 6. About two-fifths of old trees were healthy, and more than half were in decline. It is necessary to take urgent measures for the declining old trees.

4. Discussion

To our knowledge, this is the first study to assess the tree-level health status of old trees using UAVs; although there are limitations, our study may lead to improving the health management of old trees.

4.1. Health Status and Management of Old Tree

In our study, the number of healthy and declining trees was more than 40%, and the number of severe declining trees was 349, over 10%. Although incorporated into the park management system, it was open to tourists. Habitat alteration associated with park establishment activities (e.g., road access and soil compaction) and increased numbers of visitors may have a negative impact on the growth of trees in these sites [50]. Old trees can be susceptible to disease, insect attack, and dieback [51,52] and are at risk of decline [53]. Therefore, more than half were in the declining and severe declining categories. For trees in decline, we should take timely mitigation measures according to the actual situation. Introducing symbiotic organisms, both below ground and in the above-ground forest microbiome, has the potential to facilitate plant growth [54]. The system developed by Osnabriick for the further protection of crowns threatened by possible failure was a useful path to reduce the breakage of crown parts and large branches [55]. Some large cavities should be filled with special materials, such as zinc- and copper-based nanocompounds [56], to prevent further damage.

4.2. Selecting Variables

Vegetation Indices and texture measures derived from multispectral UAV imagery are widely used for assessing health status. In our study, we chose 47 variables, including 31 vegetation indices and 16 texture measures. In order to remove redundant features as well as reduce overfitting, we used the Boruta feature selection algorithm to select variables. Three vegetation indices (NDVIredge, NDGI, and rbNDVI) and one texture measure (DSM-mean) were selected. The spectra of problematic canopies will differ significantly from the reflectance spectra of normal canopies [16]. NDVI redge and rbNDVI are considered to be a good vigor indicator [57]. NDGI is an indicator of changes in the status quo of the vegetation [58]. They have been widely used to characterize canopy status [59,60]. Texture is a tool for documenting stand structure. We extracted texture features from DSM and NDVI; only DSM-mean was selected, and the results were different from the study by Guerra-Hernández, J. et al. [23]. The window size as well as the orientation of the texture features have a significant effect on the results [61]. Further tests should therefore be carried out.

4.3. Performance of Two Models

In this study, SVM and RF were used to estimate the health status of old trees of P. orientalis by combining texture variables and vegetation indices based on UAV images. Compared to SVM, RF had performed better in terms of both accuracy (61.1%) and kappa values (0.338). When performing multi-classification, RF obtained better classification results [62,63]. RF outperformed SVM in their ability to generalize and handle multi-dimensional data. The training sample set affects the performance of both classifiers SVM and RF [64,65]. RF gave better results when there was a large number of training samples available [15]. Our training samples share of 4% was much larger than 0.25% [62], although SVM had good performance on imbalanced training datasets [16]. However, due to variations in stem density and spacing and the range of tree heights and sizes, there is tremendous variability and overlap in the spectral signature of trees in old-growth P. orientalis stands [66,67], which make the spectrum unusual and low in accuracy. In addition, our health status results were derived from a qualitative analysis of old-growth trees rather than the more traditional discoloration of the canopy [68,69]. Further research needs to be used to improve accuracy.

4.4. Adjusting Models

In the field study, we found that there were significant differences (p < 0.05) in the old-growth forests in terms of aspect and crown areas. Aspect, an important topographic factor, can often create a local microclimate by altering ecological factors such as light, temperature, water, and soil, which affects the health of the community [70]. The canopy is where the tree photosynthesizes, and its area reflects its health in old trees. Therefore, we included aspect and area variables of canopy that influence health status in our estimation models. For models with additional variables, the increase in overall accuracy and kappa value varied from 8.3% to 13.9% and from 0.166 to 0.233, respectively. A-RF performed better in OA (75%) and kappa (0.571), indicating a great potential for incorporating aspect and crown area into old tree health assessment. In the A-RF model, healthy and declining categories were identified with high UA and PA (over 70%). In particular, the PA of the healthy and declining categories were 0.86 and 0.82, showing our results could be used to guide practical forest management. A-RF had low pairwise correlations, and classification accuracy could be significantly improved by aggregating the results of many classifiers that have little bias by averaging or voting [71]. However, the UA and PA of the severe declining category were 0.5 and 0.2, respectively, the reason being that the number of severe declining trees in the study area was small, so there was a high probability of complete misclassification or correct classification [22]. Roope Näsi et al. [72] used hyperspectral imagery to identify mature Norway spruce (Picea abies L. Karst.) trees suffering from infestation, and the best results for the overall accuracy were 76% (Cohen’s kappa 0.60) when using three color classes (healthy, infested, dead). Our study obtained similar accuracy through more low-cost equipment.
Old-growth stands are less structurally diverse [73]. The development of old-growth attributes is modified by site position [74], and characteristics such as the percentage of broken-topped crowns increase with stand age [73]. Therefore, the introduction of aspect, a major site factor influencing the growth and development of a single plant, and canopy area, a direct reflection of the growth status of individual trees, into the health assessment model reflects the health of old trees and significantly improves the estimation accuracy. Studies on the integration of CHM feature [75], normalized digital surface models [10], and canopy cover [76] into the model also proved that the introduction of factors reflecting the growth status can improve the accuracy of health estimation. In the future, hyperspectral and LiDAR data should be obtained and used to assess the health status of old trees of P. orientalis L.

5. Conclusions

In this study, we used two machine learning methods, SVM and RF, to assess the health status of old trees, based on UAV multispectral data. Two models obtained a general performance with traditional methods (only vegetation indices and textures variables), but RF performed better, especially in the detection of declining trees. Furthermore, we introduced two additional variables (aspect and canopy area) in the health assessment models, obtaining a significantly improved performance both in accuracy and kappa value. In the assessment of health status, A-RF (RF with aspect and canopy area variables) with overall accuracy (75%) and kappa (0.571) had a better applicability in the study area. Knowing the health status of old trees is of great importance for forest management. Our study provides a suitable method for assessing the health status of old trees, making it a reality to achieve rapid and reproducible diagnosis which provides a basis for the health management of old trees.

Author Contributions

Z.Z. developed and supervised the work. D.Y. investigated field data, analyzed the data and wrote the paper. Y.C., Y.L. and W.Y. contributed to the field investigation and data analysis. All authors have read and agreed to the published version of the manuscript.

Funding

This work was financially supported by Multifunctional enhancement of acacia forests in hilly and gully areas and stabilisation and maintenance of vegetation on the Loess Plateau Maintenance Technology (Grant No. 2022YFF1300405).

Data Availability Statement

The data presented in this study are available on request from the corresponding author (accurately indicate status).

Conflicts of Interest

The authors declare that they have no known competing financial interests or personal relationships that could have appeared to influence the work reported in this paper.

References

  1. Lindenmayer, D.B.; Laurance, W.F.; Franklin, J.F. Global Decline in Large Old Trees. Science 2012, 338, 1305–1306. [Google Scholar] [CrossRef]
  2. Lindenmayer, D.B.; Laurance, W.F. The ecology, distribution, conservation and management of large old trees. Biol. Rev. 2017, 92, 1434–1458. [Google Scholar] [CrossRef] [PubMed]
  3. Brovkina, O.; Cienciala, E.; Surový, P.; Janata, P. Unmanned aerial vehicles (UAV) for assessment of qualitative classification of Norway spruce in temperate forest stands. Geo-Spat. Inf. Sci. 2018, 21, 12–20. [Google Scholar] [CrossRef]
  4. Zhao, Z. Theory and Technology of Ancient Tree Protection; Science Publishing House: Beijing, China, 2021. [Google Scholar]
  5. Ecke, S.; Dempewolf, J.; Frey, J.; Schwaller, A.; Endres, E.; Klemmt, H.-J.; Tiede, D.; Seifert, T. UAV-Based Forest Health Monitoring: A Systematic Review. Remote Sens. 2022, 14, 3205. [Google Scholar] [CrossRef]
  6. Lausch, A.; Erasmi, S.; King, D.J.; Magdon, P.; Heurich, M. Understanding Forest Health with Remote Sensing-Part II—A Review of Approaches and Data Models. Remote Sens. 2017, 9, 129. [Google Scholar] [CrossRef]
  7. Torresan, C.; Berton, A.; Carotenuto, F.; Di Gennaro, S.F.; Gioli, B.; Matese, A.; Miglietta, F.; Vagnoli, C.; Zaldei, A.; Wallace, L. Forestry applications of UAVs in Europe: A review. Int. J. Remote Sens. 2017, 38, 2427–2447. [Google Scholar] [CrossRef]
  8. Tang, L.; Shao, G. Drone remote sensing for forestry research and practices. J. For. Res. 2015, 26, 791–797. [Google Scholar] [CrossRef]
  9. Minařík, R.; Langhammer, J. Use of a multisoectral UAV photogrammetry for detection and tracking of forest disturbance dynamics. ISPRS—International Archives of the Photogrammetry. Remote Sens. 2016, 41, 711–718. [Google Scholar] [CrossRef]
  10. Nguyen, H.T.; Lopez Caceres, M.L.; Moritake, K.; Kentsch, S.; Shu, H.; Diez, Y. Individual Sick Fir Tree (Abies mariesii) Identification in Insect Infested Forests by Means of UAV Images and Deep Learning. Remote Sens. 2021, 13, 260. [Google Scholar] [CrossRef]
  11. Cardil, A.; Vepakomma, U.; Brotons, L. Assessing Pine Processionary Moth Defoliation Using Unmanned Aerial Systems. Forests 2017, 8, 402. [Google Scholar] [CrossRef]
  12. Guimarães, N.; Pádua, L.; Marques, P.; Silva, N.; Peres, E.; Sousa, J.J. Forestry Remote Sensing from Unmanned Aerial Vehicles: A Review Focusing on the Data, Processing and Potentialities. Remote Sens. 2020, 12, 1046. [Google Scholar] [CrossRef]
  13. Syifa, M.; Park, S.-J.; Lee, C.-W. Detection of the Pine Wilt Disease Tree Candidates for Drone Remote Sensing Using Artificial Intelligence Techniques. Engineering 2020, 6, 919–926. [Google Scholar] [CrossRef]
  14. Sun, Z.; Wang, Y.; Pan, L.; Xie, Y.; Zhang, B.; Liang, R.; Sun, Y. Pine wilt disease detection in high-resolution UAV images using object-oriented classification. J. For. Res. 2022, 33, 1377–1389. [Google Scholar] [CrossRef]
  15. Klouček, T.; Komárek, J.; Surový, P.; Hrach, K.; Janata, P.; Vašíček, B. The Use of UAV Mounted Sensors for Precise Detection of Bark Beetle Infestation. Remote Sens. 2019, 11, 1561. [Google Scholar] [CrossRef]
  16. Abdollahnejad, A.; Panagiotidis, D. Tree Species Classification and Health Status Assessment for a Mixed Broadleaf-Conifer Forest with UAS Multispectral Imaging. Remote Sens. 2020, 12, 3722. [Google Scholar] [CrossRef]
  17. Torres, P.; Rodes-Blanco, M.; Viana-Soto, A.; Nieto, H.; García, M. The Role of Remote Sensing for the Assessment and Monitoring of Forest Health: A Systematic Evidence Synthesis. Forests 2021, 12, 1134. [Google Scholar] [CrossRef]
  18. Genuer, R.; Poggi, J.-M. Random Forests. In Random Forests with R; Genuer, R., Poggi, J.-M., Eds.; Springer International Publishing: Cham, Switzerland, 2020; pp. 33–55. [Google Scholar]
  19. Noble, W.S. What is a support vector machine. Nat. Biotechnol. 2006, 24, 1565–1567. [Google Scholar] [CrossRef] [PubMed]
  20. Zhou, Q.; Jiang, Z.; Zhang, X.; Zhang, T.; Zhu, H.; Cui, B.; Li, Y.; Zhao, F.; Zhao, Z. Leaf anatomy and ultrastructure in senescing ancient tree, Platycladus orientalis L. (Cupressaceae). PeerJ 2019, 7, 6766. [Google Scholar] [CrossRef]
  21. Hao, Z.; Lin, L.; Post, C.J.; Jiang, Y.; Li, M.; Wei, N.; Yu, K.; Liu, J. Assessing tree height and density of a young forest using a consumer unmanned aerial vehicle (UAV). New For. 2021, 52, 843–862. [Google Scholar] [CrossRef]
  22. Wang, X.; Wang, Y.; Zhou, C.; Yin, L.; Feng, X. Urban forest monitoring based on multiple features at the single tree scale by UAV. Urban For. Urban Green. 2021, 58, 126958. [Google Scholar] [CrossRef]
  23. Guerra-Hernández, J.; Díaz-Varela, R.A.; Ávarez-González, J.G.; Rodríguez-González, P.M. Assessing a novel modelling approach with high resolution UAV imagery for monitoring health status in priority riparian forests. For. Ecosyst. 2021, 8, 61. [Google Scholar] [CrossRef]
  24. Rouse, J.W.; Haas, R.H.; Schell, J.A.; Deering, D.W. Monitoring vegetation systems in the Great Plains with ERTS. NASA Spec. Pub. 1974, 351, 309. [Google Scholar]
  25. Gao, B.-C. NDWI—A normalized difference water index for remote sensing of vegetation liquid water from space. Remote Sens. Environ. 1996, 58, 257–266. [Google Scholar] [CrossRef]
  26. de Castro, A.I.; Ehsani, R.; Ploetz, R.C.; Crane, J.H.; Buchanon, S. Detection of Laurel Wilt Disease in Avocado Using Low Altitude Aerial Imaging. PLoS ONE 2015, 10, e0124642. [Google Scholar] [CrossRef] [PubMed]
  27. Jordan, C.F. Derivation of Leaf-Area Index from Quality of Light on the Forest Floor. Ecology 1969, 50, 663–666. [Google Scholar] [CrossRef]
  28. Qi, J.; Chehbouni, A.; Huete, A.R.; Kerr, Y.H.; Sorooshian, S. A modified soil adjusted vegetation index. Remote Sens. Environ. 1994, 48, 119–126. [Google Scholar] [CrossRef]
  29. Chen, S.F.; Goodman, J. An empirical study of smoothing techniques for language modeling. Comput. Speech Lang. 1999, 13, 359–394. [Google Scholar] [CrossRef]
  30. Gamon, J.A.; Peñuelas, J.; Field, C.B. A narrow-waveband spectral index that tracks diurnal changes in photosynthetic efficiency. Remote Sens. Environ. 1992, 41, 35–44. [Google Scholar] [CrossRef]
  31. Pearson, R.L.; Miller, L.D. Remote mapping of standing crop biomass for estimation of the productivity of the shortgrass prairie. Proc. Eighth Int. Symp. Remote Sens. Environ. 1972, 2, 1357–1381. [Google Scholar]
  32. Huete, A.R. A soil-adjusted vegetation index (SAVI). Remote Sens. Environ. 1988, 25, 295–309. [Google Scholar] [CrossRef]
  33. Gitelson, A.A. Wide Dynamic Range Vegetation Index for Remote Quantification of Biophysical Characteristics of Vegetation. J. Plant Physiol. 2004, 161, 165–173. [Google Scholar] [CrossRef]
  34. Kaufman, Y.J.; Tanre, D. Atmospherically resistant vegetation index (ARVI) for EOS-MODIS. IEEE Trans. Geosci. Remote Sens. 1992, 30, 261–270. [Google Scholar] [CrossRef]
  35. Datt, B.; McVicar, T.R.; Van Niel, T.G.; Jupp, D.L.; Pearlman, J.S. Preprocessing EO-1 Hyperion hyperspectral data to support the application of agricultural indexes. IEEE Trans. Geosci. Remote Sens. 2003, 41, 1246–1259. [Google Scholar] [CrossRef]
  36. Tucker, C.J.; Elgin, J.H.; McMurtrey, J.E.; Fan, C.J. Monitoring corn and soybean crop development with hand-held radiometer spectral data. Remote Sens. Environ. 1979, 8, 237–248. [Google Scholar] [CrossRef]
  37. Ahamed, T.; Tian, L.; Zhang, Y.; Ting, K.C. A review of remote sensing methods for biomass feedstock production. Biomass Bioenergy 2011, 35, 2455–2469. [Google Scholar] [CrossRef]
  38. Miura, T.; Yoshioka, H.; Fujiwara, K.; Yamamoto, H. Inter-Comparison of ASTER and MODIS Surface Reflectance and Vegetation Index Products for Synergistic Applications to Natural Resource Monitoring. Sensors 2008, 8, 2480–2499. [Google Scholar] [CrossRef] [PubMed]
  39. Jiang, Z.; Huete, A.R.; Didan, K.; Miura, T. Development of a two-band enhanced vegetation index without a blue band. Remote Sens. Environ. 2008, 112, 3833–3845. [Google Scholar] [CrossRef]
  40. Gitelson, A.A.; Kaufman, Y.J.; Merzlyak, M.N. Use of a green channel in remote sensing of global vegetation from EOS-MODIS. Remote Sens. Environ. 1996, 58, 289–298. [Google Scholar] [CrossRef]
  41. Wang, F.-m.; Huang, J.-f.; Tang, Y.-l.; Wang, X.-z. New Vegetation Index and Its Application in Estimating Leaf Area Index of Rice. Rice Sci. 2007, 14, 195–203. [Google Scholar] [CrossRef]
  42. Baret, F.; Guyot, G. Potentials and limits of vegetation indices for LAI and APAR assessment. Remote Sens. Environ. 1991, 35, 161–173. [Google Scholar] [CrossRef]
  43. Jurgens, C. The modified normalized difference vegetation index (mNDVI) a new index to determine frost damages in agriculture based on Landsat TM data. Int. J. Remote Sens. 1997, 18, 3583–3594. [Google Scholar] [CrossRef]
  44. Gitelson, A.A.; Merzlyak, M.N. Signature Analysis of Leaf Reflectance Spectra: Algorithm Development for Remote Sensing of Chlorophyll. J. Plant Physiol. 1996, 148, 494–500. [Google Scholar] [CrossRef]
  45. Zebarth, B.; Younie, M.; Paul, J.; Bittman, S. Evaluation of leaf chlorophyll index for making fertilizer nitrogen recommendations for silage corn in a high fertility environment. Commun. Soil Sci. Plant Anal. 2002, 33, 665–684. [Google Scholar] [CrossRef]
  46. Barnes, E.; Clarke, T.; Richards, S.; Colaizzi, P.; Haberland, J.; Kostrzewski, M.; Waller, P.; Choi, C.; Riley, E.; Thompson, T. Coincident detection of crop water stress, nitrogen status and canopy density using ground based multispectral data. In Proceedings of the Fifth International Conference on Precision Agriculture, Bloomington, MN, USA, 16–19 July 2000; p. 6. [Google Scholar]
  47. Rondeaux, G.; Steven, M.; Baret, F. Optimization of soil-adjusted vegetation indices. Remote Sens. Environ. 1996, 55, 95–107. [Google Scholar] [CrossRef]
  48. Kursa, M.B.; Rudnicki, W.R. Feature Selection with the Boruta Package. J. Stat. Softw. 2010, 36, 1–13. [Google Scholar] [CrossRef]
  49. Ye, Q.; Yu, S.; Liu, J.; Zhao, Q.; Zhao, Z. Aboveground biomass estimation of black locust planted forests with aspect variable using machine learning regression algorithms. Ecol. Indic. 2021, 129, 107948. [Google Scholar] [CrossRef]
  50. Li, Y.; Zhang, Q.-B. History of tree growth declines recorded in old trees at two sacred sites in northern China. Front. Plant Sci. 2017, 8, 1779. [Google Scholar] [CrossRef]
  51. Palik, B.J.; Ostry, M.E.; Venette, R.C.; Abdela, E. Fraxinus nigra (black ash) dieback in Minnesota: Regional variation and potential contributing factors. For. Ecol. Manag. 2011, 261, 128–135. [Google Scholar] [CrossRef]
  52. Simard, M.; Powell, E.N.; Raffa, K.F.; Turner, M.G. What explains landscape patterns of tree mortality caused by bark beetle outbreaks in Greater Yellowstone? Glob. Ecol. Biogeogr. 2011, 21, 556–567. [Google Scholar] [CrossRef]
  53. Romanuk, T.N.; Silva, L.C.R.; Anand, M.; Leithead, M.D. Recent Widespread Tree Growth Decline Despite Increasing Atmospheric CO2. PLoS ONE 2010, 5, 11543. [Google Scholar] [CrossRef]
  54. Busby, P.E.; Newcombe, G.; Neat, A.S.; Averill, C. Facilitating Reforestation Through the Plant Microbiome: Perspectives from the Phyllosphere. Annu. Rev. Phytopathol. 2022, 60, 337–356. [Google Scholar] [CrossRef] [PubMed]
  55. Stobbe, H.; Dujesiefken, D.; Schröder, K. Tree Crown Stabilization with the Doublebelt System Osnabrück. Arboric. Urban For. 2000, 26, 270–274. [Google Scholar] [CrossRef]
  56. Mantanis, G.; Terzi, E.; Kartal, S.N.; Papadopoulos, A.N. Evaluation of mold, decay and termite resistance of pine wood treated with zinc- and copper-based nanocompounds. Int. Biodeterior. Biodegrad. 2014, 90, 140–144. [Google Scholar] [CrossRef]
  57. Gallardo-Salazar, J.L.; Pompa-García, M. Detecting Individual Tree Attributes and Multispectral Indices Using Unmanned Aerial Vehicles: Applications in a Pine Clonal Orchard. Remote Sens. 2020, 12, 4144. [Google Scholar] [CrossRef]
  58. Vivar-Vivar, E.D.; Pompa-García, M.; Martínez-Rivas, J.A.; Mora-Tembre, L.A. UAV-Based Characterization of Tree-Attributes and Multispectral Indices in an Uneven-Aged Mixed Conifer-Broadleaf Forest. Remote Sens. 2022, 14, 2775. [Google Scholar] [CrossRef]
  59. Deng, X.; Zhu, Z.; Yang, J.; Zheng, Z.; Huang, Z.; Yin, X.; Wei, S.; Lan, Y. Detection of Citrus Huanglongbing Based on Multi-Input Neural Network Model of UAV Hyperspectral Remote Sensing. Remote Sens. 2020, 12, 2678. [Google Scholar] [CrossRef]
  60. Zeng, T.; Zhang, H.; Li, Y.; Yin, C.; Liang, Q.; Fang, J.; Fu, W.; Wang, J.; Zhang, X. Monitoring the Severity of Rubber Tree Infected with Powdery Mildew Based on UAV Multispectral Remote Sensing. Forests 2023, 14, 717. [Google Scholar] [CrossRef]
  61. Gini, R.; Sona, G.; Ronchetti, G.; Passoni, D.; Pinto, L. Improving Tree Species Classification Using UAS Multispectral Images and Texture Measures. ISPRS Int. J. Geo-Inf. 2018, 7, 315. [Google Scholar] [CrossRef]
  62. Colditz, R.R. An Evaluation of Different Training Sample Allocation Schemes for Discrete and Continuous Land Cover Classification Using Decision Tree-Based Algorithms. Remote Sens. 2015, 7, 9655–9681. [Google Scholar] [CrossRef]
  63. Yu, J.-W.; Yoon, Y.-W.; Baek, W.-K.; Jung, H.-S. Forest Vertical Structure Mapping Using Two-Seasonal Optic Images and LiDAR DSM Acquired from UAV Platform through Random Forest, XGBoost, and Support Vector Machine Approaches. Remote Sens. 2021, 13, 4282. [Google Scholar] [CrossRef]
  64. Dalponte, M.; Ørka, H.O.; Ene, L.T.; Gobakken, T.; Næsset, E. Tree crown delineation and tree species classification in boreal forests using hyperspectral and ALS data. Remote Sens. Environ. 2014, 140, 306–317. [Google Scholar] [CrossRef]
  65. Du, P.; Samat, A.; Waske, B.; Liu, S.; Li, Z. Random Forest and Rotation Forest for fully polarized SAR image classification using polarimetric and spatial features. ISPRS J. Photogramm. Remote Sens. 2015, 105, 38–53. [Google Scholar] [CrossRef]
  66. Leckie, D.G.; Gougeon, F.A.; Tinis, S.; Nelson, T.; Burnett, C.N.; Paradine, D. Automated tree recognition in old growth conifer stands with high resolution digital imagery. Remote Sens. Environ. 2005, 94, 311–326. [Google Scholar] [CrossRef]
  67. Leckie, D.G.; Tinis, S.; Nelson, T.; Burnett, C.; Gougeon, F.A.; Cloney, E.; Paradine, D. Issues in species classification of trees in old growth conifer stands. Can. J. Remote Sens. 2005, 31, 175–190. [Google Scholar] [CrossRef]
  68. Ganthaler, A.; Losso, A.; Mayr, S. Using image analysis for quantitative assessment of needle bladder rust disease of Norway spruce. Plant Pathol. 2018, 67, 1122–1130. [Google Scholar] [CrossRef]
  69. Potter, K.M.; Conkling, B.L. Forest Health Monitoring: National Status, Trends, and Analysis 2021; U.S. Department of Agriculture, Forest Service, Southern Research Station: Asheville, NC, USA, 2022.
  70. Cantón, Y.; Del Barrio, G.; Solé-Benet, A.; Lázaro, R. Topographic controls on the spatial distribution of ground cover in the Tabernas badlands of SE Spain. CATENA 2004, 55, 341–365. [Google Scholar] [CrossRef]
  71. Cutler, D.R.; Edwards Jr, T.C.; Beard, K.H.; Cutler, A.; Hess, K.T.; Gibson, J.; Lawler, J.J. Random forests for classification in ecology. Ecology 2007, 88, 2783–2792. [Google Scholar] [CrossRef]
  72. Näsi, R.; Honkavaara, E.; Lyytikäinen-Saarenmaa, P.; Blomqvist, M.; Litkey, P.; Hakala, T.; Viljanen, N.; Kantola, T.; Tanhuanpää, T.; Holopainen, M. Using UAV-Based Photogrammetry and Hyperspectral Imaging for Mapping Bark Beetle Damage at Tree-Level. Remote Sens. 2015, 7, 15467–15493. [Google Scholar] [CrossRef]
  73. Spies, T.A.; Franklin, J.F. The Structure of Natural Young, Mature, and Old-Growth Douglas-Fir Forests in Oregon and Washington. In Wildlife and Vegetation of Unmanaged Douglas-Fir Forests; U.S. Department of Agriculture, Forest Service, Pacific Northwest Research Station: Portland, OR, USA, 1991; pp. 91–109. [Google Scholar]
  74. Morgantini, L.E.; Kansas, J.L. Differentiating mature and old-growth forests in the Upper Foothills and Subalpine Subregions of west-central Alberta. For. Chronicle. 2003, 3, 602–612. [Google Scholar] [CrossRef]
  75. Windrim, L.; Carnegie, A.J.; Webster, M.; Bryson, M. Tree Detection and Health Monitoring in Multispectral Aerial Imagery and Photogrammetric Pointclouds Using Machine Learning. IEEE J. Sel. Top. Appl. Earth Obs. Remote Sens. 2020, 13, 2554–2572. [Google Scholar] [CrossRef]
  76. Qin, S.; Wang, H.; Li, X.; Gao, J.; Jin, J.; Li, Y.; Lu, J.; Meng, P.; Sun, J.; Song, Z.; et al. Enhancing Landsat image based aboveground biomass estimation of black locust with scale bias-corrected LiDAR AGB map and stratified sampling. Geo-Spat. Inf. Sci. 2023, 1–14. [Google Scholar] [CrossRef]
Figure 1. Location of the study area.
Drones 08 00091 g001
Figure 2. Health status of old trees and individual tree segments. (a) The distribution of health status of old trees; (b) individual tree segments.
Drones 08 00091 g002
Figure 3. Schematic diagram of aspect division [43].
Drones 08 00091 g003
Figure 4. Boruta result plot for data. Blue boxplots correspond to the minimal, average, and maximum Z score of a shadow attribute. Red, yellow, and green boxplots represent Z scores of, respectively, rejected, tentative, and confirmed attributes.
Drones 08 00091 g004
Figure 5. Spatial distribution of old trees with different health status.
Drones 08 00091 g005
Table 1. Tree health condition evaluation according to above-ground parts and count of old trees.
Assessment ItemsEvaluation Benchmark
01234ScoreWeight (%)
Tree vigorVigorous growthAdversely affectedApparent weaknessExtremely poorAlmost dead 9.62
Tree formNatural tree formNearly natural tree form but some exceptionsNatural tree form partially damagedNatural tree form damaged and deformedNatural tree form damaged completely 10.31
Branch accessNormalHaving a certain but not obvious influenceShorter and thinner branchesBranches extremely shortened, internodes inflatedOnly having lower growth branches 9.76
Upper branches and tree apex mortalityNoneNot obviousManyA great manyNo tree apex and branches 9.08
Lower branches mortalityNoneNot obviousSome and some brokenMany, mostly brokenWithout healthy branches 7.96
Damage of trunk and large branchesNoneRarely and having been restoredObviousObvious and brokenDefect in the upper part 7.26
Foliage densityBranch and leaf density equilibriumNormal foliage densityRelatively sparseFew branches, sparseDead branches 9.07
Size of leaf budsLeaf (bud) is sufficiently largeSome leaves (bud) smallerMost buds smallerAll significantly smallerOnly a small number of buds present and smaller 8.89
Foliage colorsAlmost thick greenGreenSome obvious yellow/brown leavesAlmost light greenAll yellow/brown leaves 9.11
Bark damage (peeled/necrosis)No damageFew holes, no significant damageOld scarsWound decayed significantlyLarge hole or severe peeling 5.14
Bark metabolismFresh bark, strong metabolismMost of the bark fresh, few locations with weak individual metabolismApparent lack of vigor, weak metabolismAlmost all bark without vigorMost of the bark necrotic 5.60
Germination and sproutingLarge amount of foliage, much germination and sproutingLarge amount of foliage, some green shoots sproutingLess foliage, fewer green shoots sproutingLittle foliage, few green shoots sproutingNo germination and sprouting 8.21
Degree of senescence = the sum of the products of the indicator scores and their weightsFinal score
Final score<1.401.40–1.671.67–2.202.20–2.48>2.48
GradeIIIIIIIVV
Senescent degreeHealthyDecliningSevere declining
Count536821
Table 2. Vegetation indices and texture variables with their corresponding formula and reference.
ClassVariableFormulaReference
Vegetation indicesNDVI(Nir − R)/(Nir + R)[24]
NDWI(Rededge − Nir)/(Rededge + Nir)[25]
RGR/G[26]
GBG/B[26]
DVINir-R[27]
MSAVI0.5[(2Nir + 1) − √(2Nir + 1)2 − 8(Nir − R)][28]
MSR(Nir/R − 1)/√Nir/R + 1[29]
NDGI(G − R)/(G + R)[30]
RVINir/R[31]
SAVI1.5(Nir − R)/(Nir + R + 0.5)[32]
WDEVI(0.1Nir − R)/(0.1Nir + R)[33]
ARVI(Nir − 2R + B)/(Nir + 2R − B)[34]
ARVI2−0.18 + 0.17(Nir − R)/(Nir + R)[34]
WBRVI(0.2Nir − R)/(0.2Nir + R)[33]
CVINir × R/G2[35]
GDVINir − G[36]
EVI2.5(Nir − R)/(Nir + 6R − 7.5B + 1)[37]
EVI22.4(Nir − R)/(Nir + R + 1)[38]
EVI2-22.5(Nir − R)/(Nir + 2.4R + 1)[39]
GARI[Nir − (G − (B − R))]/[Nir − (G + (B − R))][40]
GBNDVI(Nir − (G + B))/(Nir + (G + B))[41]
GRNDVI(Nir − (G + R))/(Nir + (G + R))[41]
MRVI(RVI − 1)/(RVI + 1)[42]
ANDVI(0.5Nir − R)/(0.5Nir + R)[43]
RDNDVI(Rededge − R)/(Rededge + R)[44]
PNDVI(Nir − (R + G + B))/(Nir + (R + G + B))[41]
RBNDVI(Nir − (R+B))/(Nir + (R + B))[41]
LCI(Nir − Rededge)/(Nir + R)[45]
NDRE(Nir − Rededge)/(Nir + Rededge)[46]
OSAVI(Nir − R)/(Nir + R + 0.16)[47]
GNDVI(Nir − G)/(Nir + G)[40]
TextureDSM_GLCM and NDVI_GLCM(window size of 3  ×  3 pixels and a 45 degree shift)“mean”, “variance”, “homogeneity”, “contrast”, “dissimilarity”, “entropy”, “second_ moment”, “correlation”[23]
Note: R, G, B, Nir and Rededge represent spectral reflectance of red, green, blue, near-infrared and red edge bands, respectively.
Table 3. Total Variance Explained.
ComponentInitial Eigenvalue Extract the Sum of the Squares of the LoadsRotational Load Sum of Squares
TotalPercentage of VarianceAccumulated %TotalPercentage of VarianceAccumulated %TotalPercentage of VarianceAccumulated %
16.10750.89450.8946.10750.89450.8943.20326.69426.694
21.23410.28361.1771.23410.28361.1773.03825.31652.011
31.0348.6269.7971.0348.6269.7972.13417.78769.797
40.7486.23176.029
50.6715.59581.623
60.5924.93786.56
70.4393.65990.219
80.3442.86593.083
90.2712.2695.344
100.2231.86297.206
110.2181.81699.022
120.1170.978100
Table 4. Accuracies of old tree health conditions based on selected features with Support Vector Machine (SVM) and Random Forest (RF) algorithms.
Data and MethodClassified LevelsReference DataTotalUA
HealthyDecliningSevere Declining
Selected with SVMHealthy21030.67
Declining12163310.52
Severe declining00221
Total1417536
PA0.140.940.40
OA55.6%Kappa0.197
Selected with RFHealthy1161180.61
Declining3103160.62
Severe declining01120.50
Total1417536
PA0.780.590.2
OA61.1%Kappa0.338
Table 5. Accuracies of old tree health conditions based on selected and added features with Support Vector Machine (SVM) and Random Forest (RF) algorithms.
Data and MethodClassified LevelsReference DataTotalUA
HealthyDecliningSevere Declining
Selected & Area & Asp with SVM(A-SVM)Healthy41050.8
Declining10162280.57
Severe declining00331.0
Total1417536
PA0.280.940.60
OA63.9%Kappa0.363
Selected & Area & Asp with RF(A-RF)Healthy1231160.75
Declining1143180.78
Severe declining10120.50
Total1417536
PA0.860.820.2
OA75%Kappa0.571
Table 6. The number and proportion of old trees at different health conditions.
Health StatusNumber of TreesPercentage of Study Area (%)
Healthy112543.4
Declining112143.2
Severe declining34913.4
Total2595100
Disclaimer/Publisher’s Note: The statements, opinions and data contained in all publications are solely those of the individual author(s) and contributor(s) and not of MDPI and/or the editor(s). MDPI and/or the editor(s) disclaim responsibility for any injury to people or property resulting from any ideas, methods, instructions or products referred to in the content.

