

Improvement of Treetop Displacement Detection by UAV-LiDAR Point Cloud Normalization: A Novel Method and A Case Study
 , ,
, ,
Abstract
:1. Introduction
2. Materials
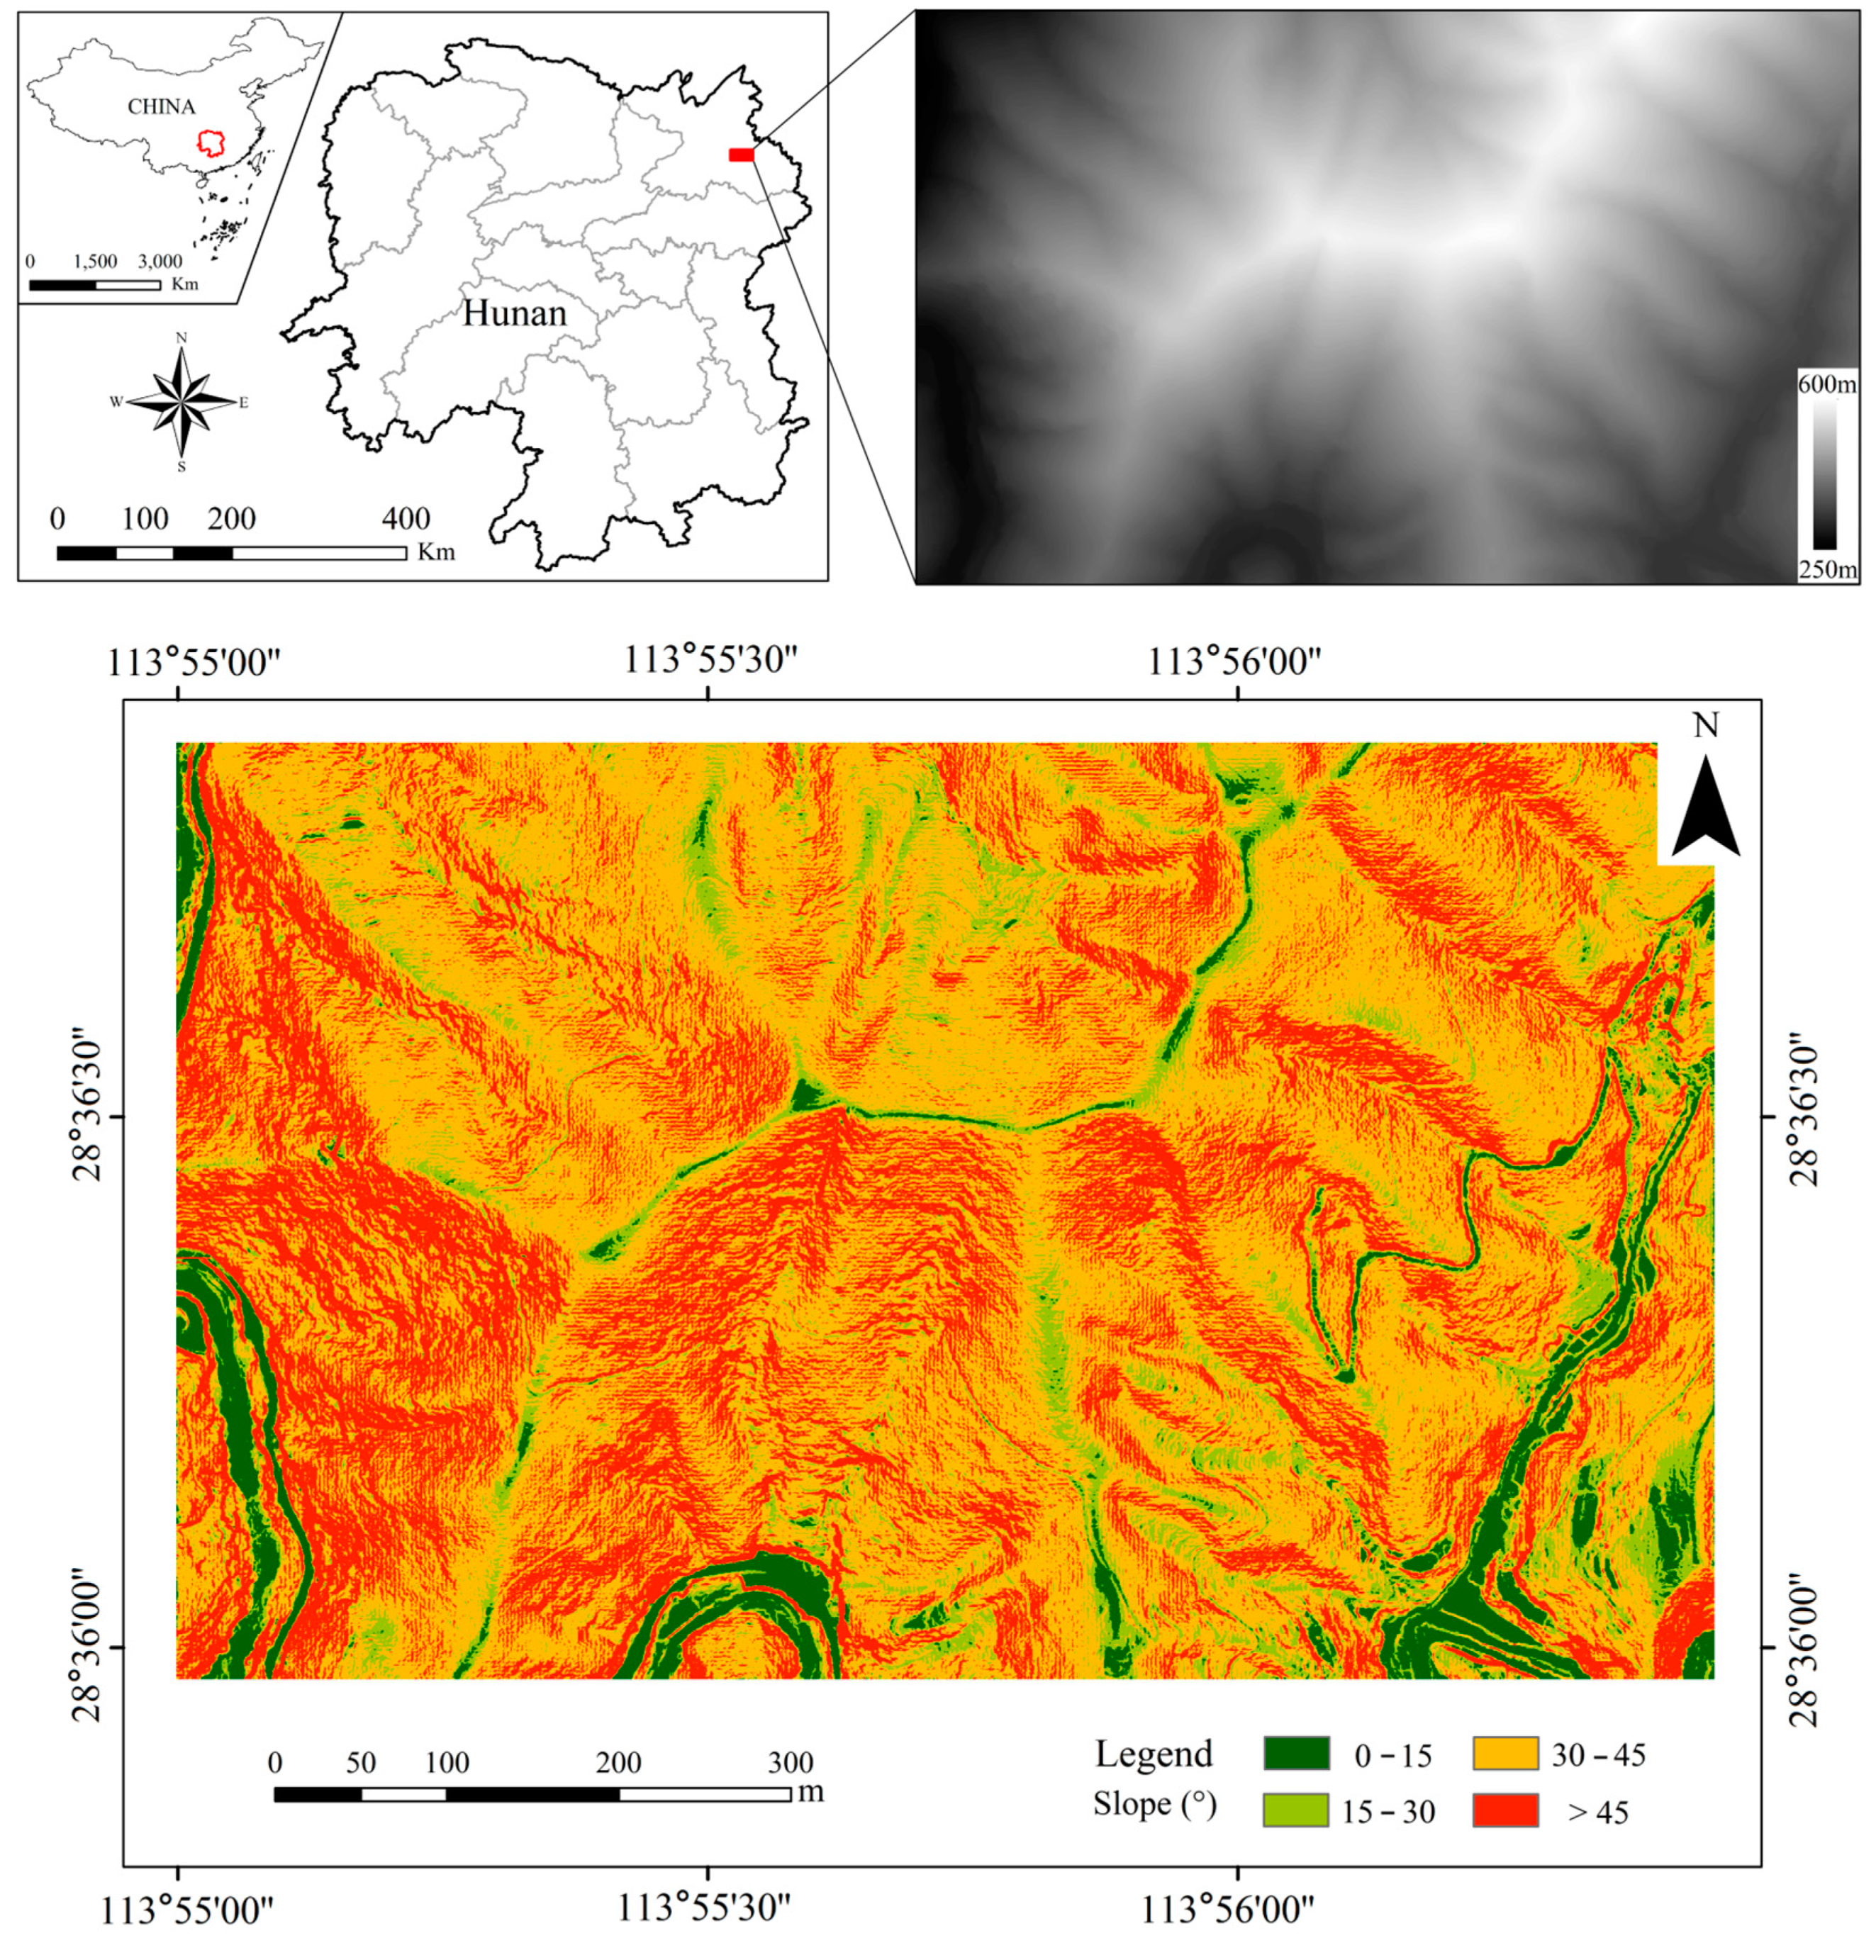
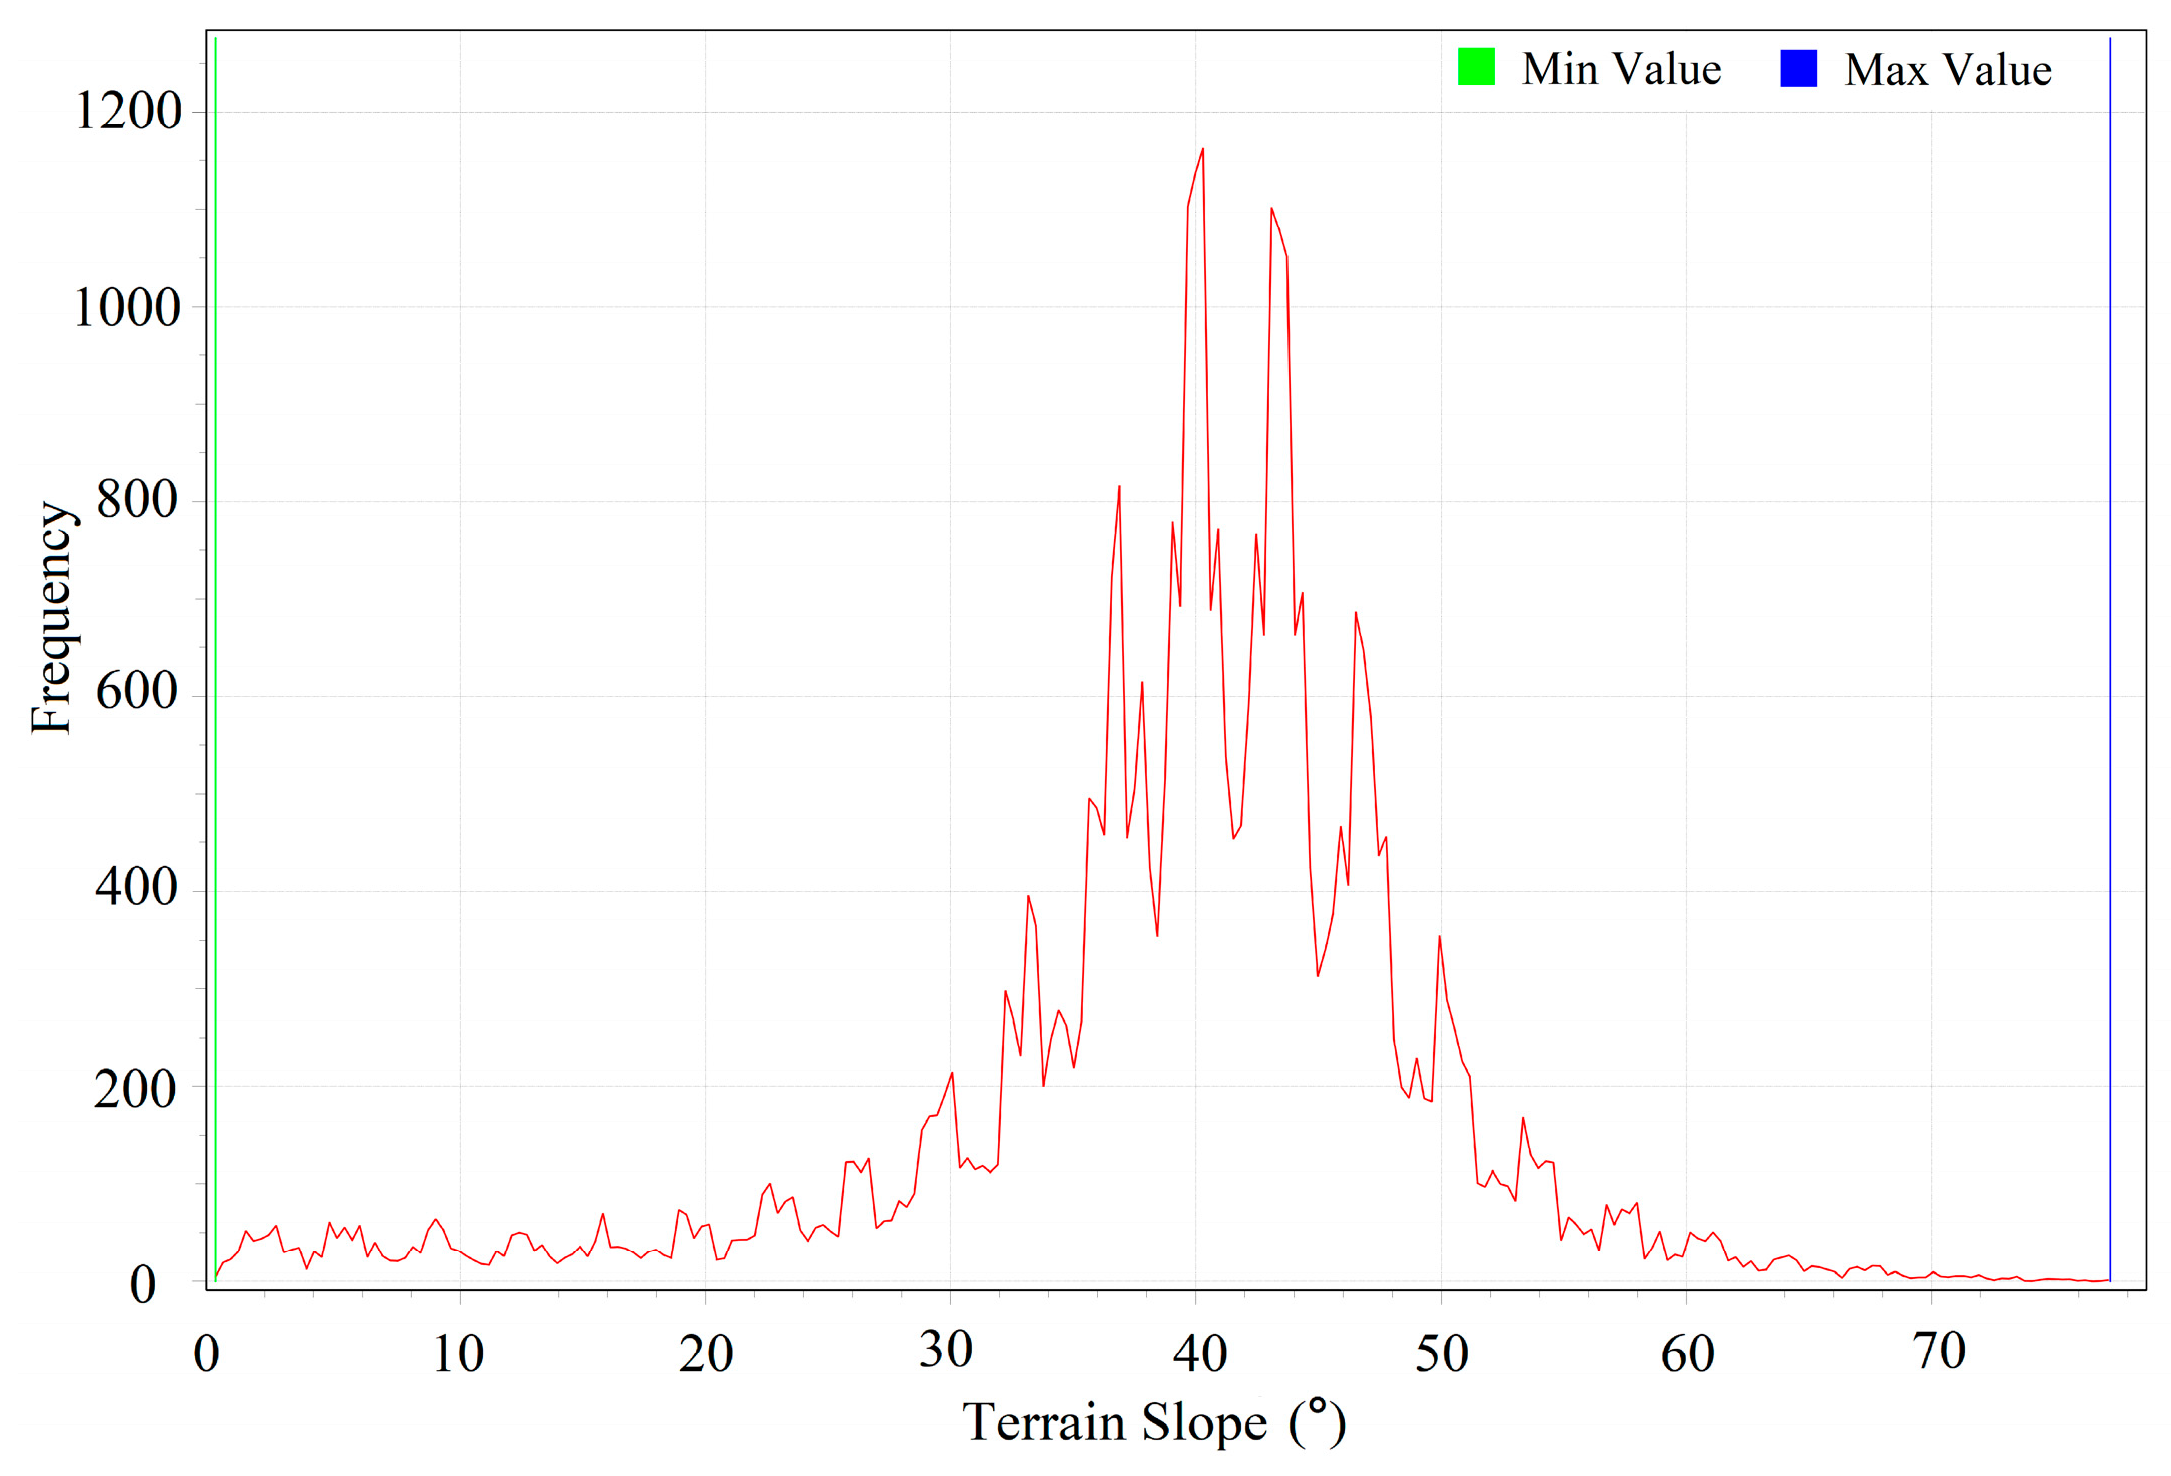
2.1. Study Area
2.2. LiDAR Data Collection and Preprocessing
2.3. Reference Data
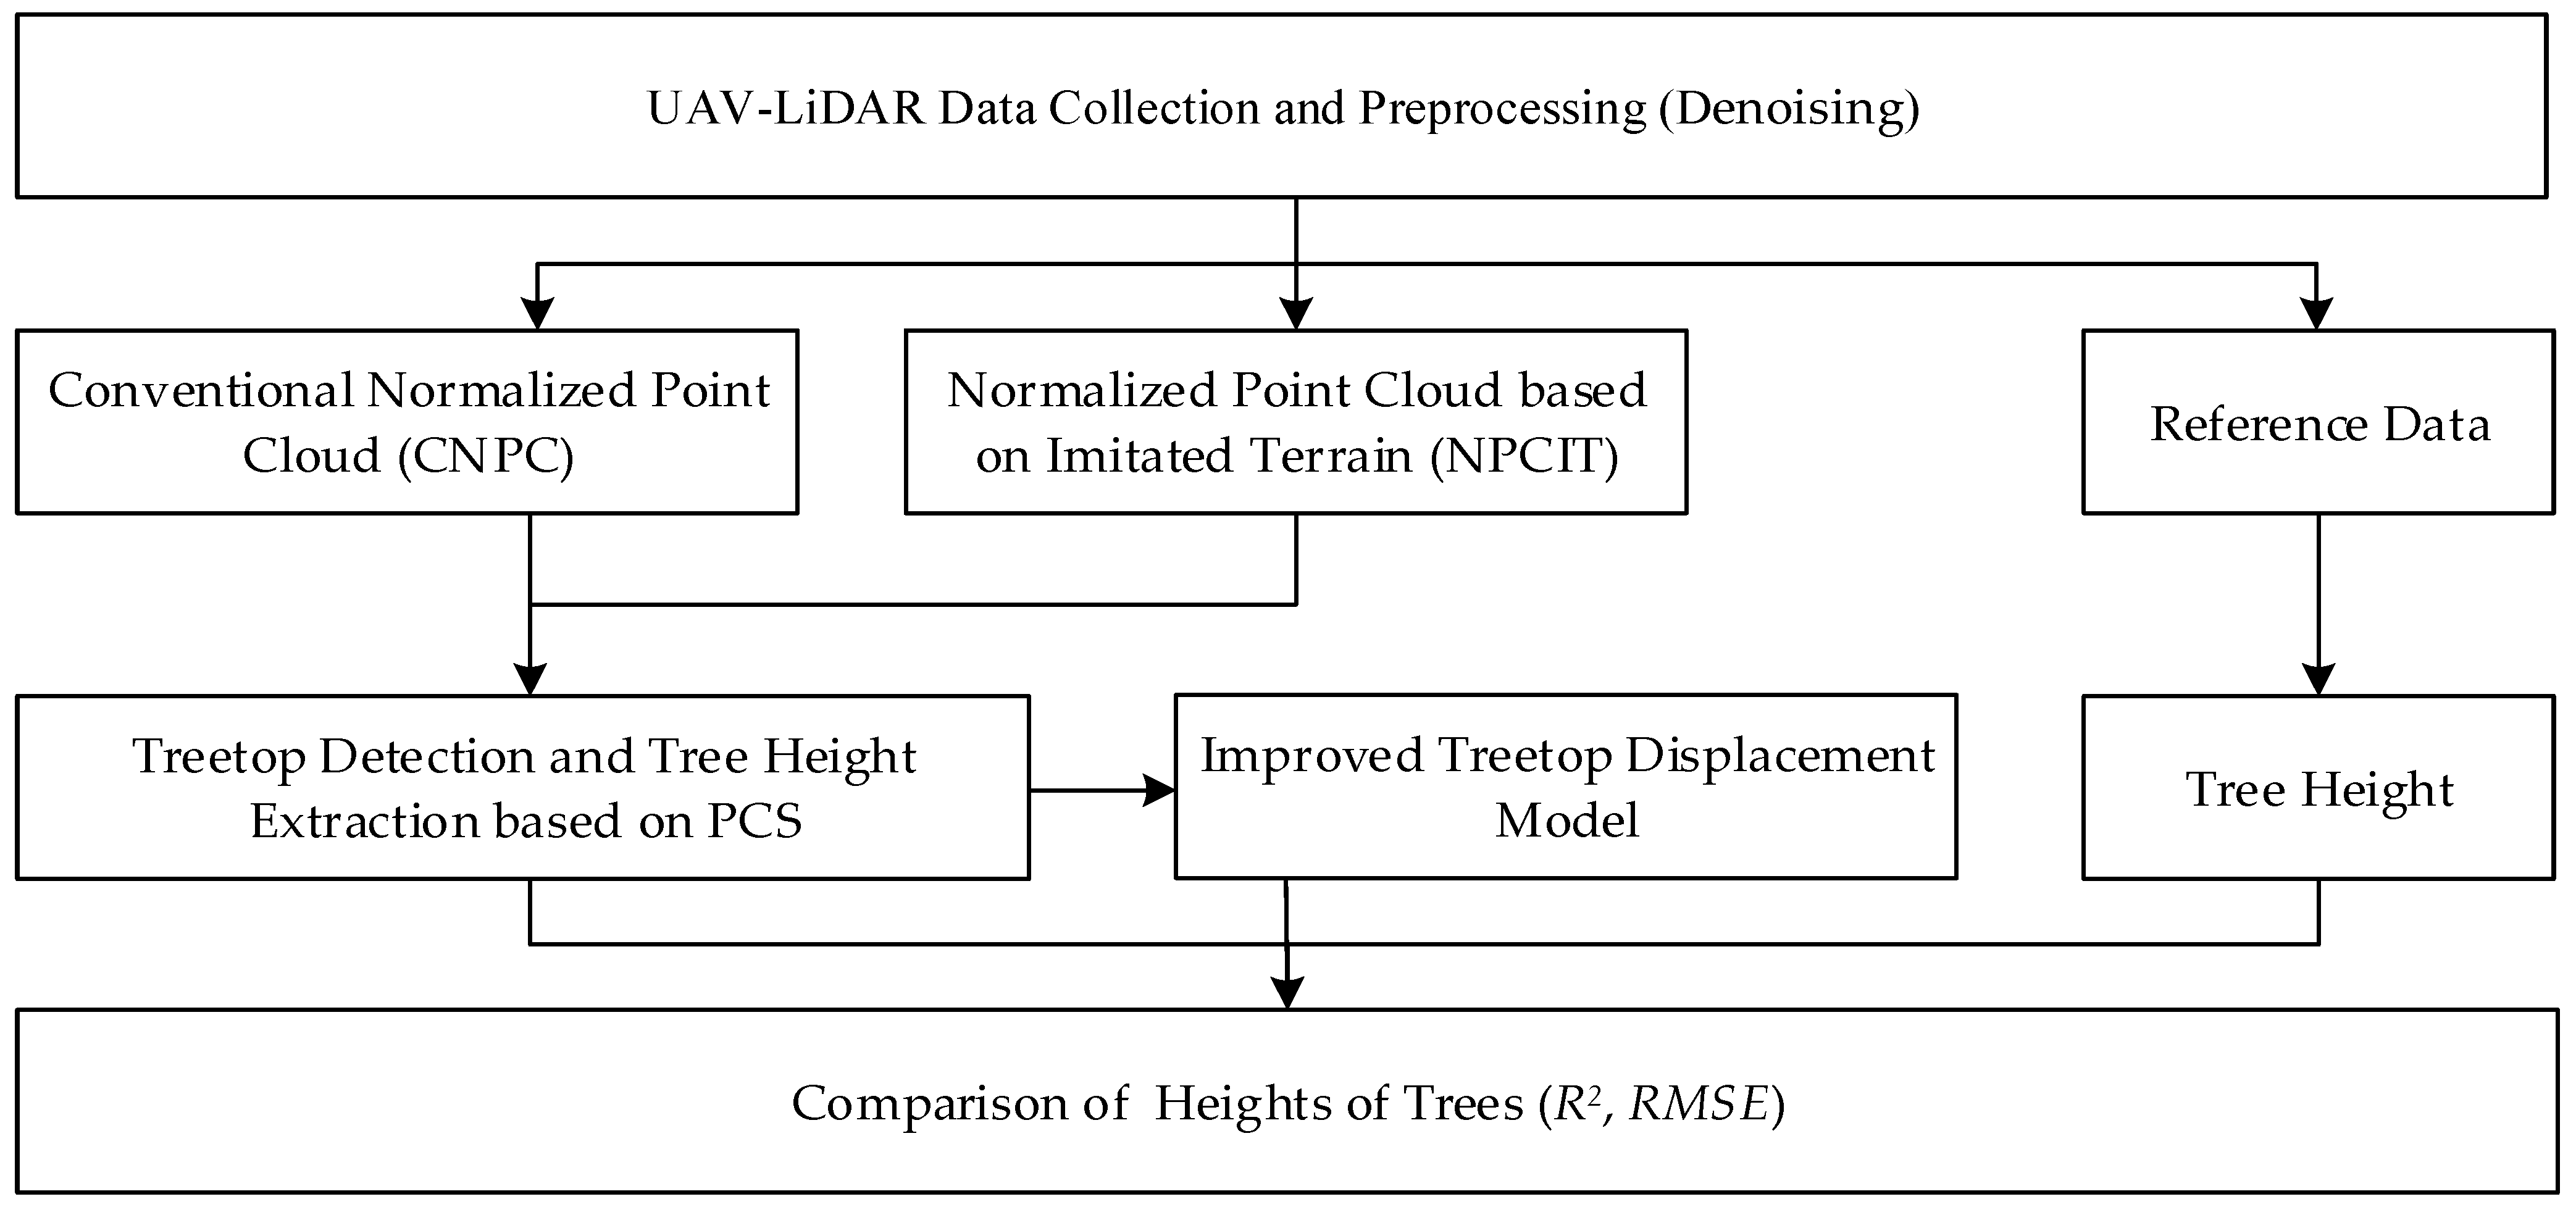
3. Methodology
3.1. Point Cloud Normalization
3.1.1. Triangular Mesh Construction
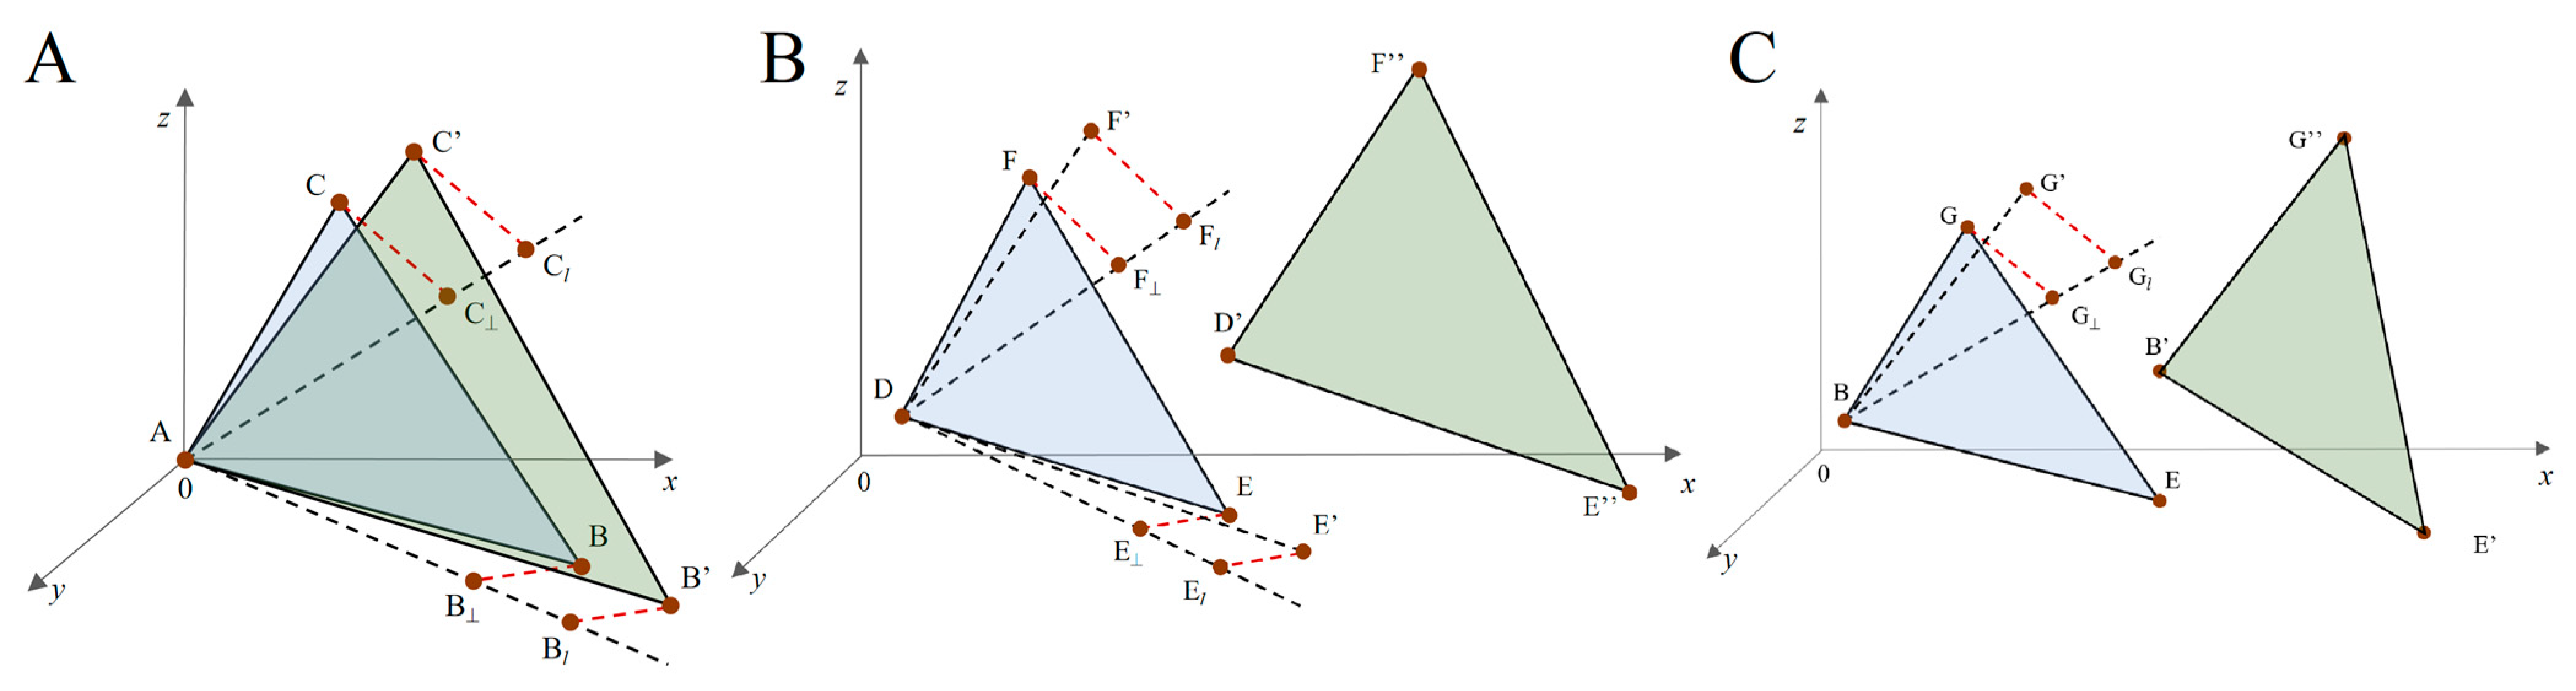
3.1.2. Isometric Mesh Transformation
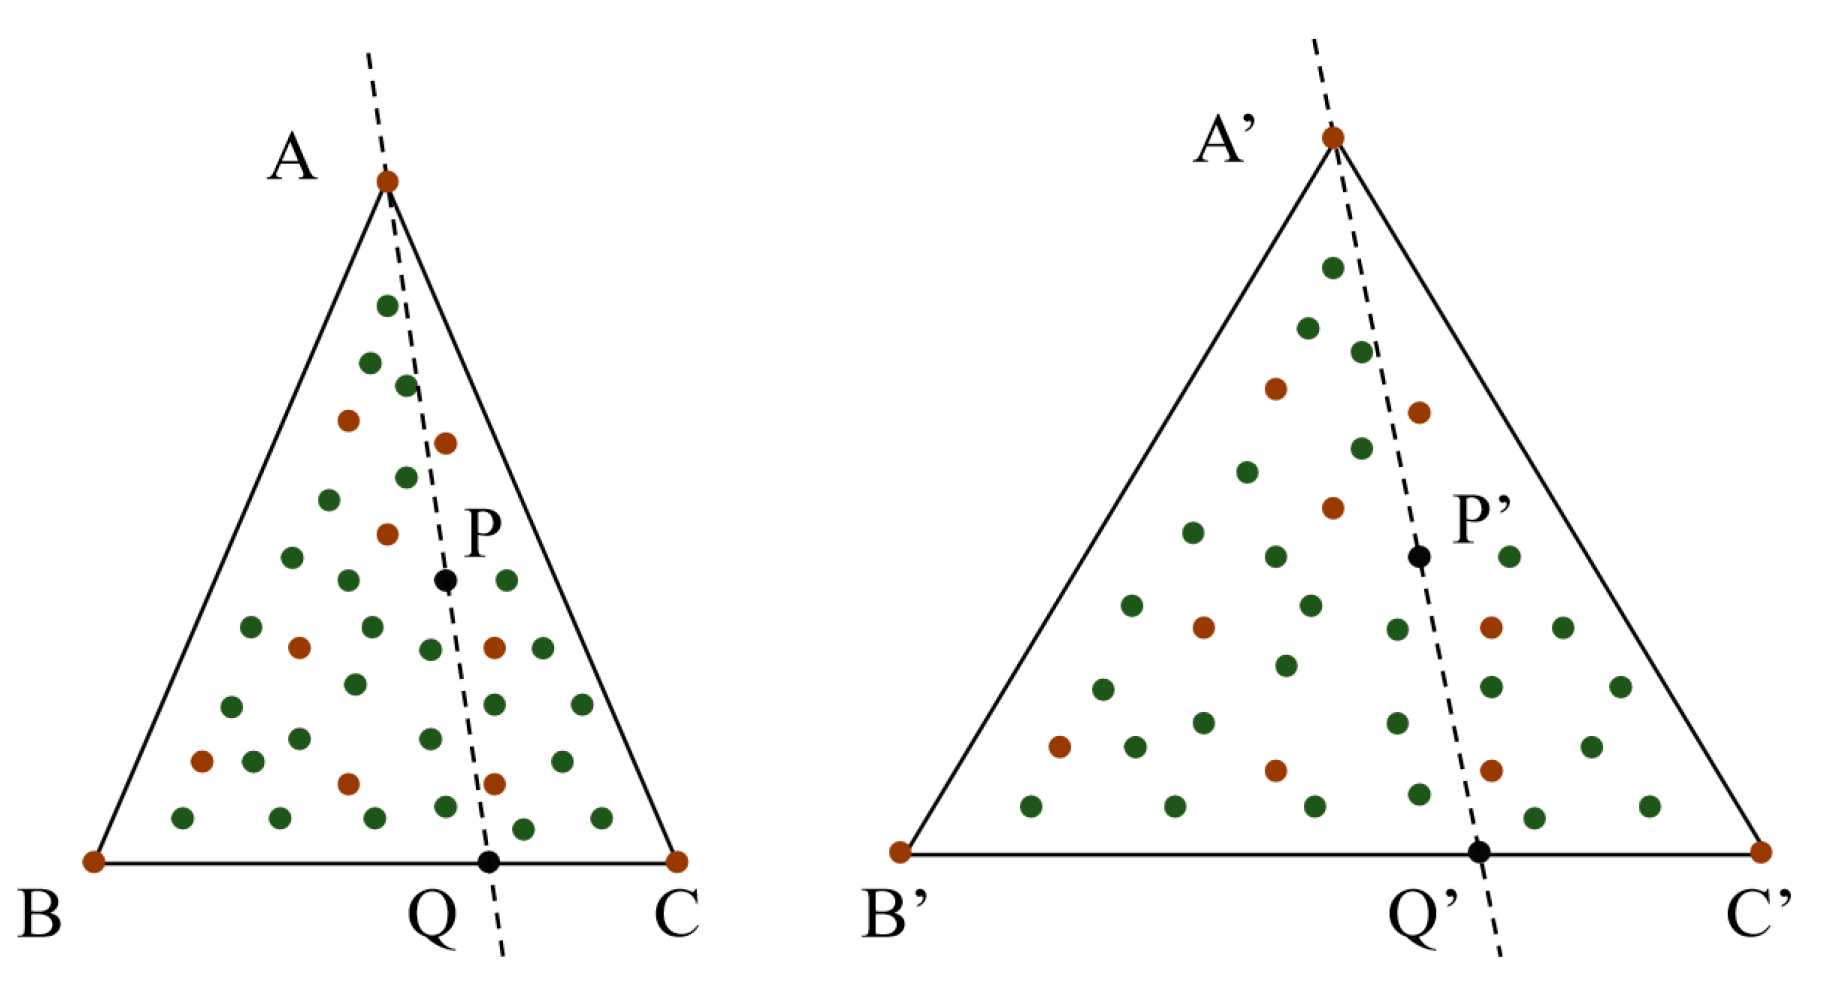
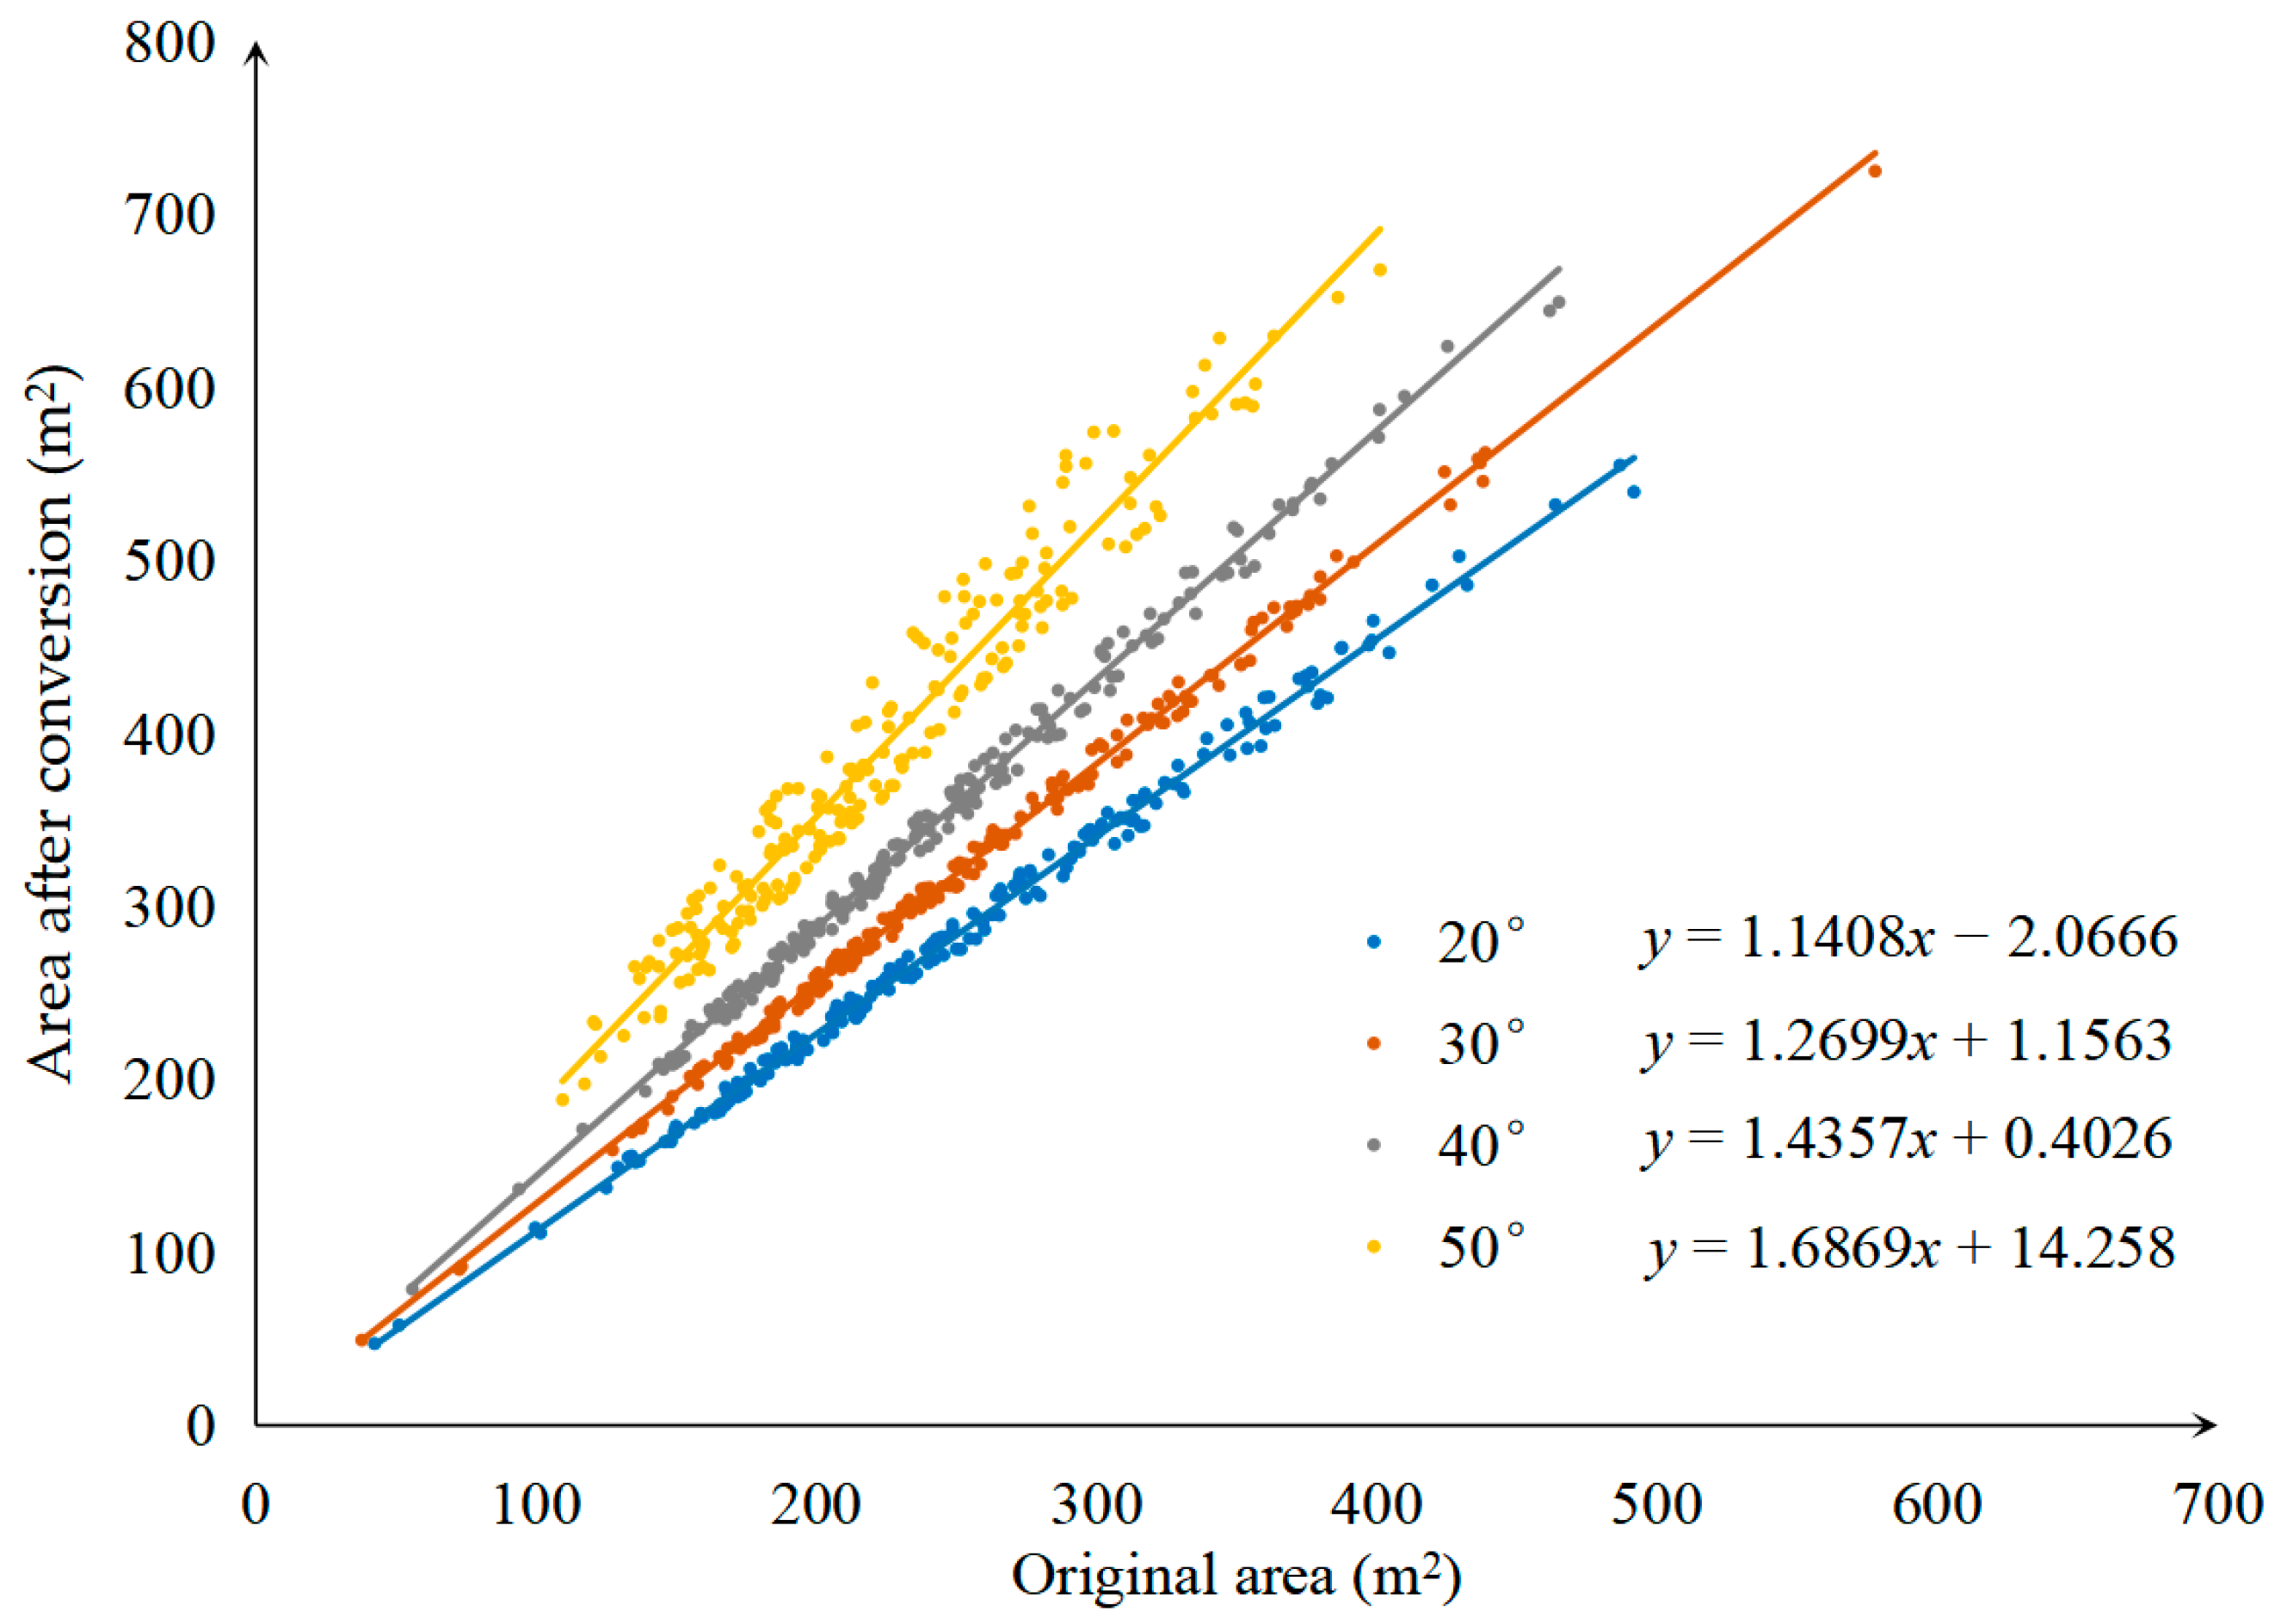
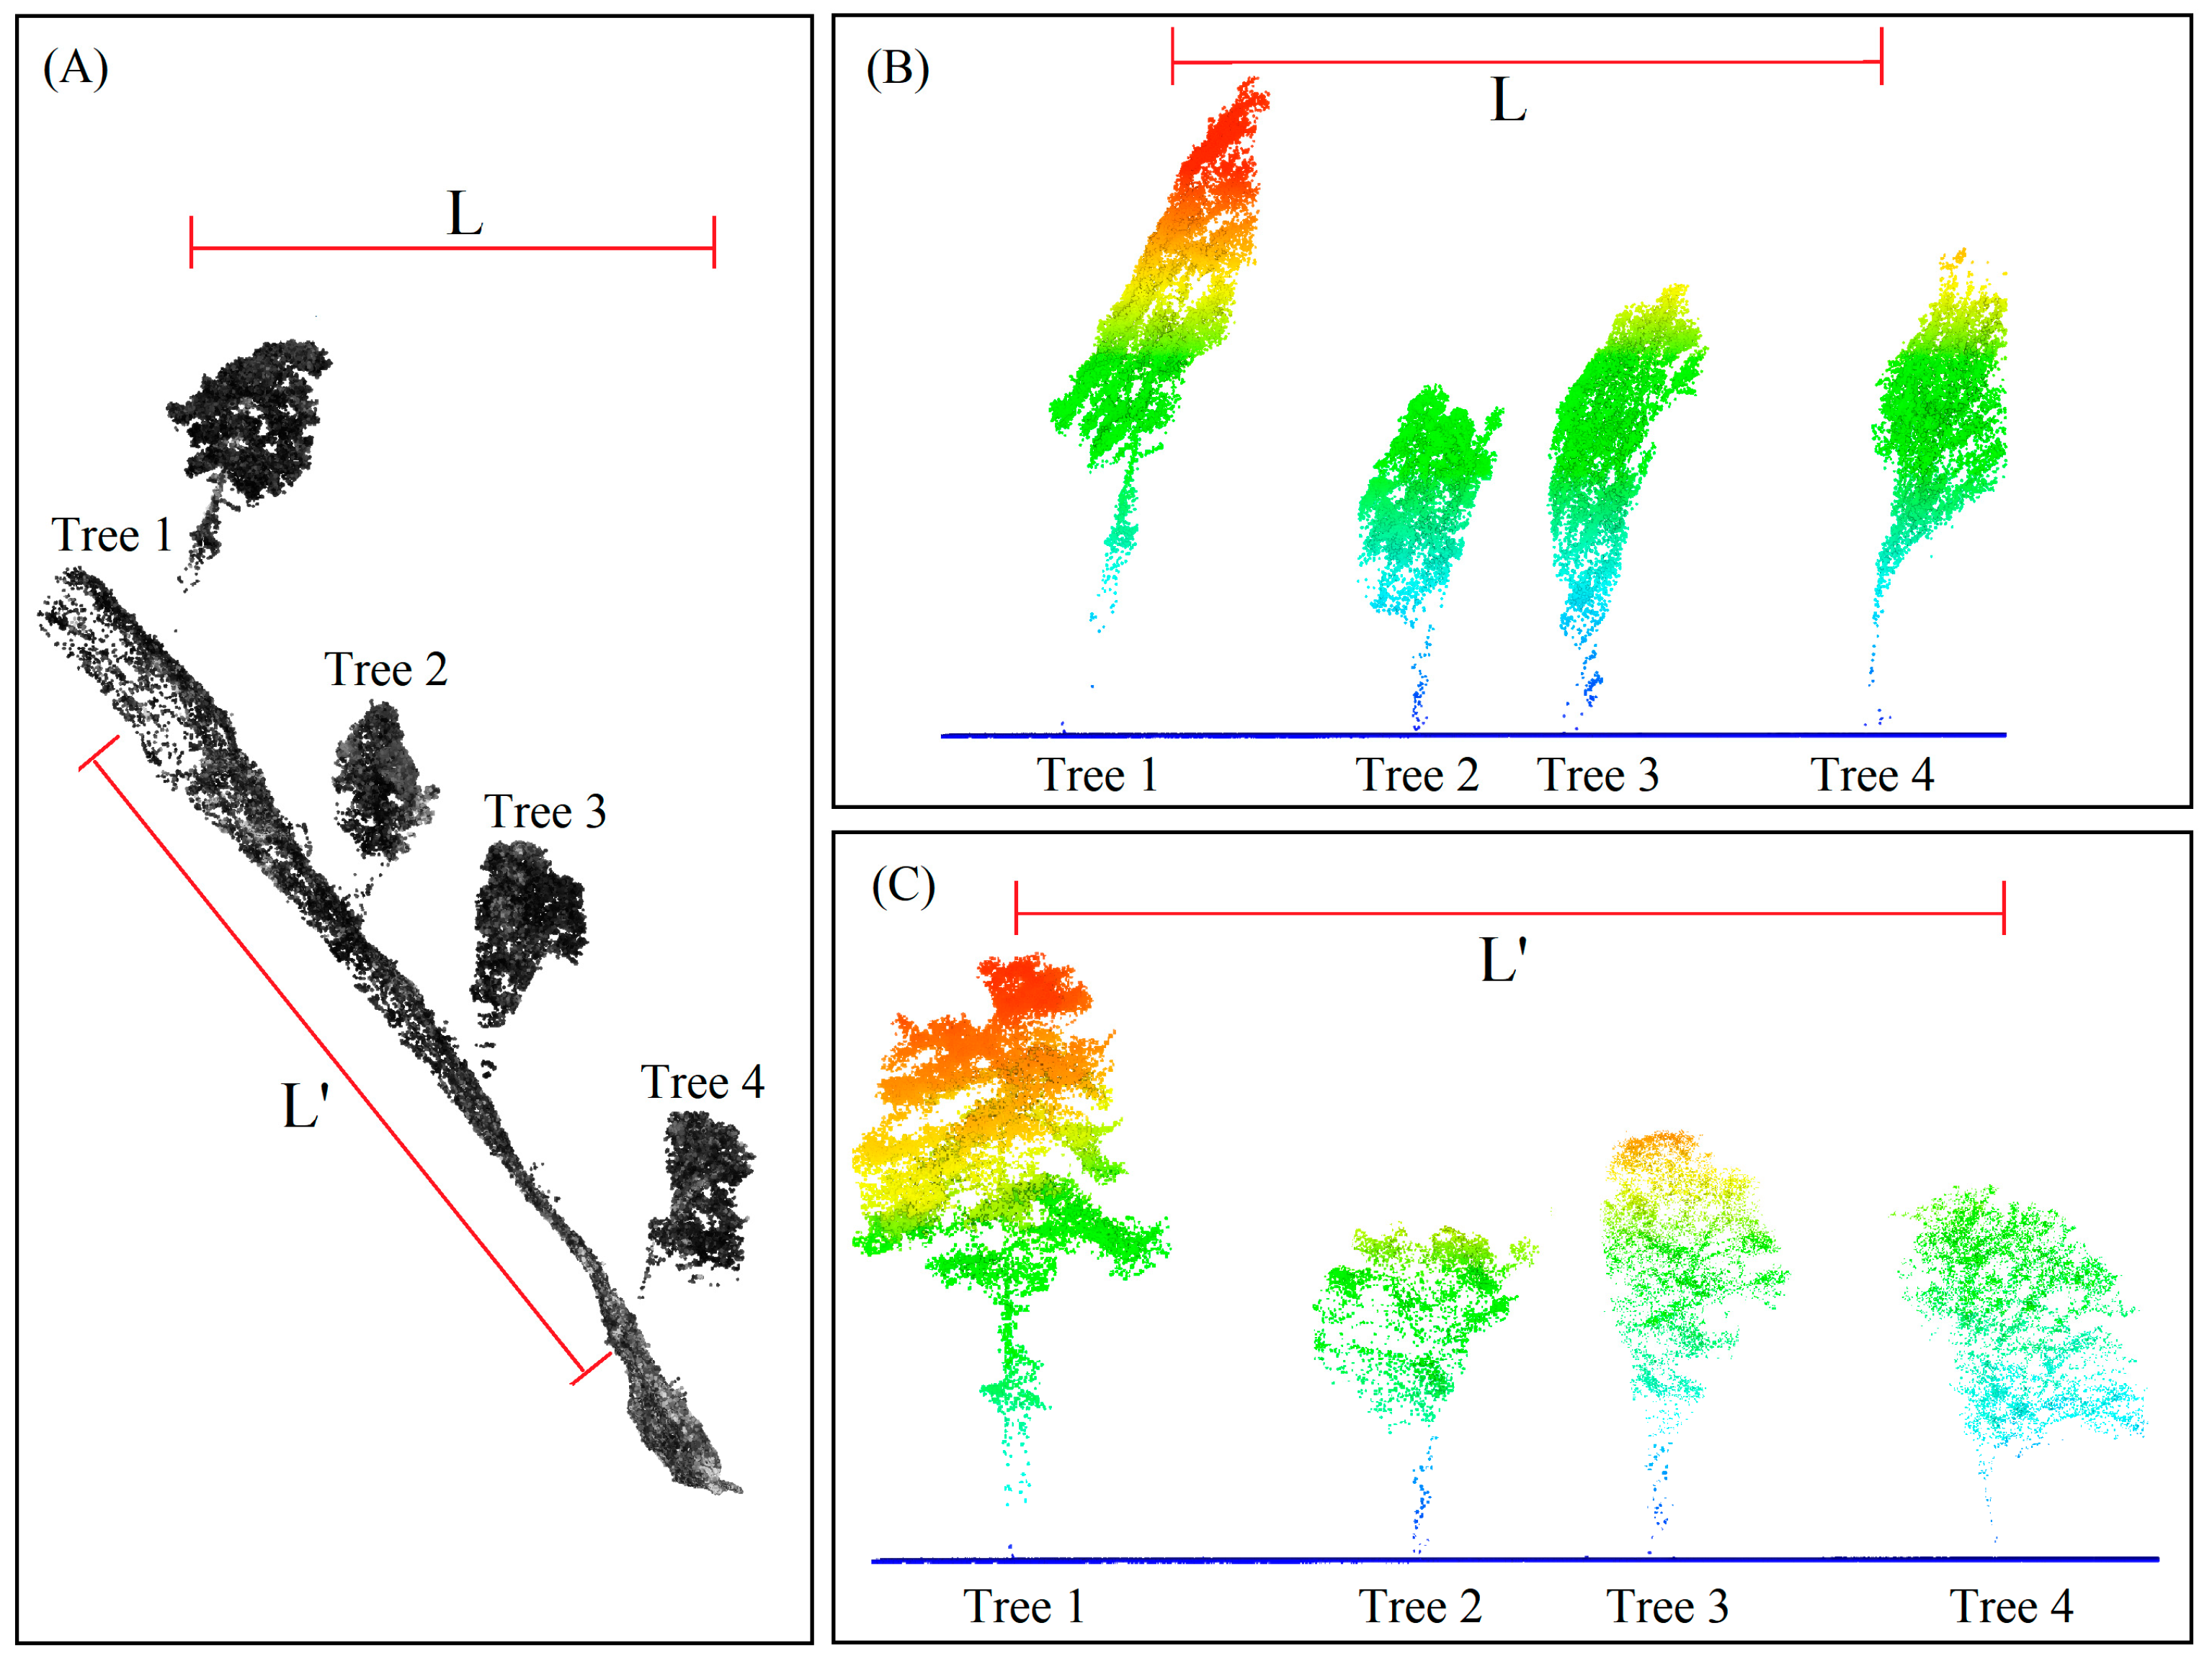
3.1.3. Equidistant Conversion of Point Clouds within the Meshes
3.1.4. Normalization
3.1.5. Algorithm Implementation
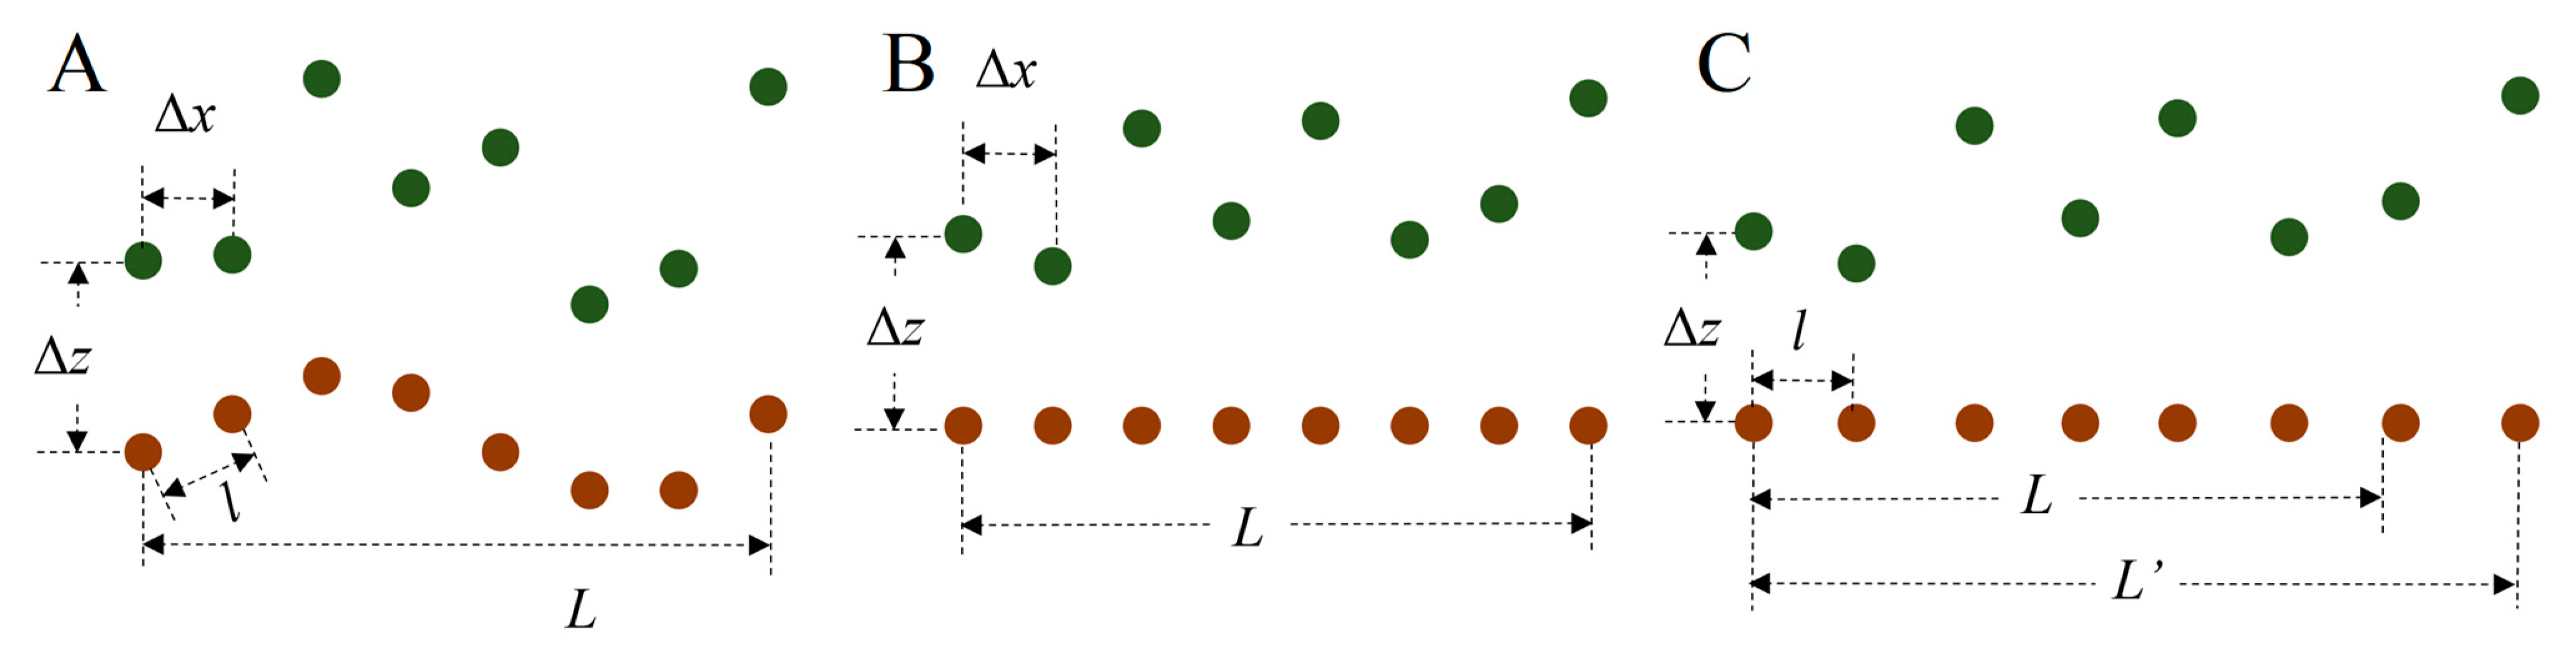
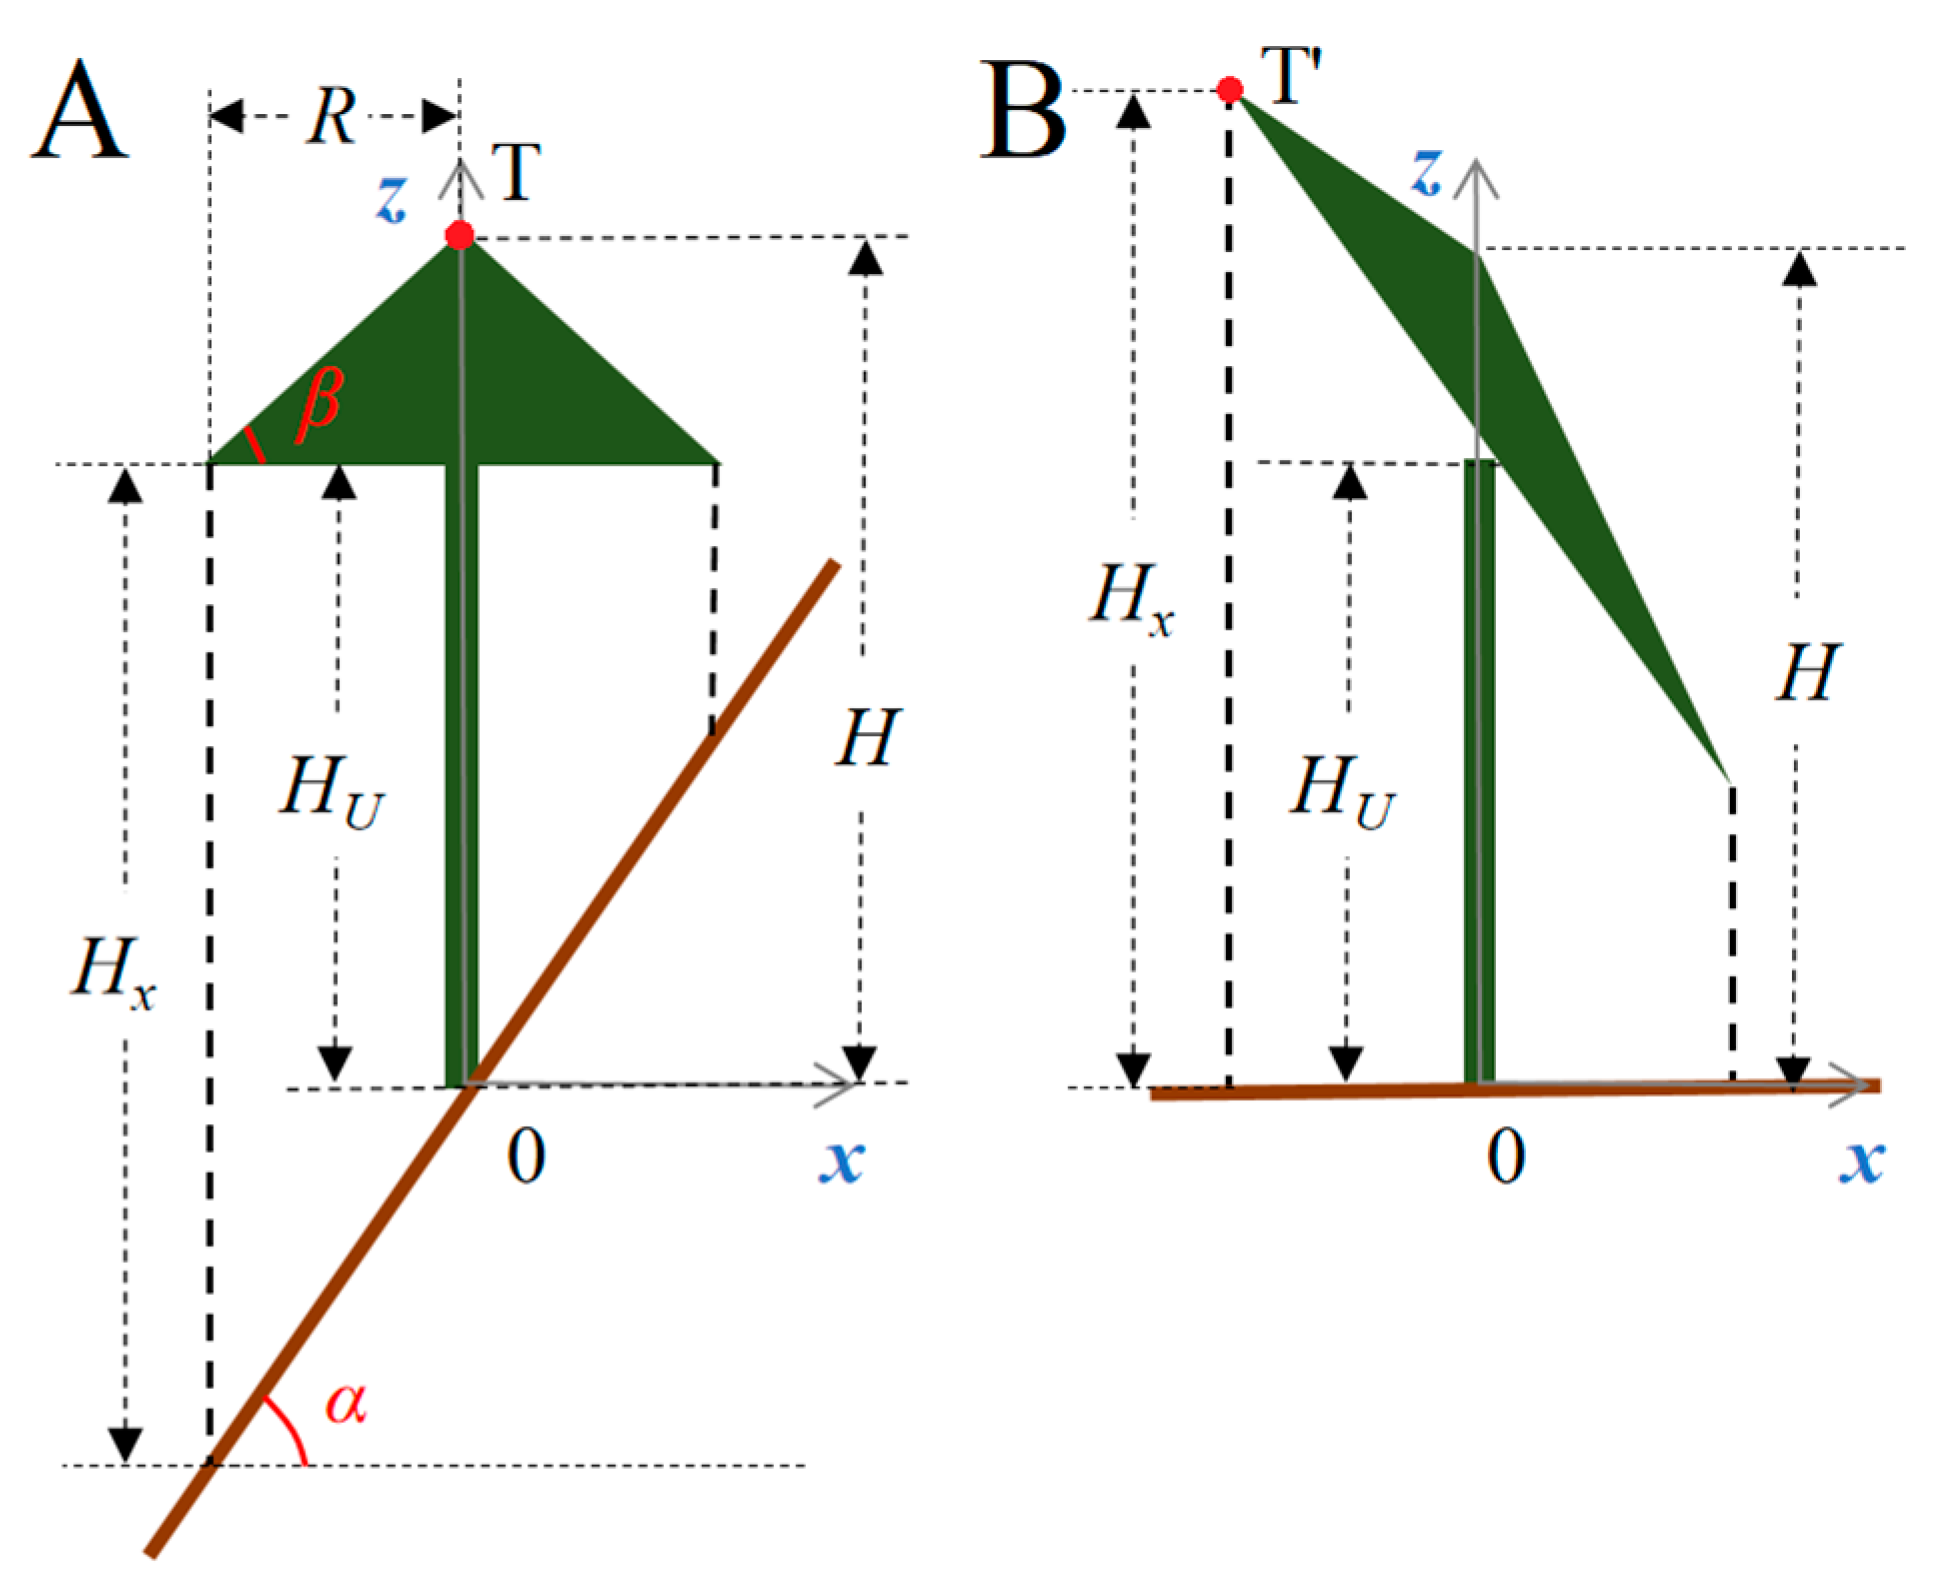
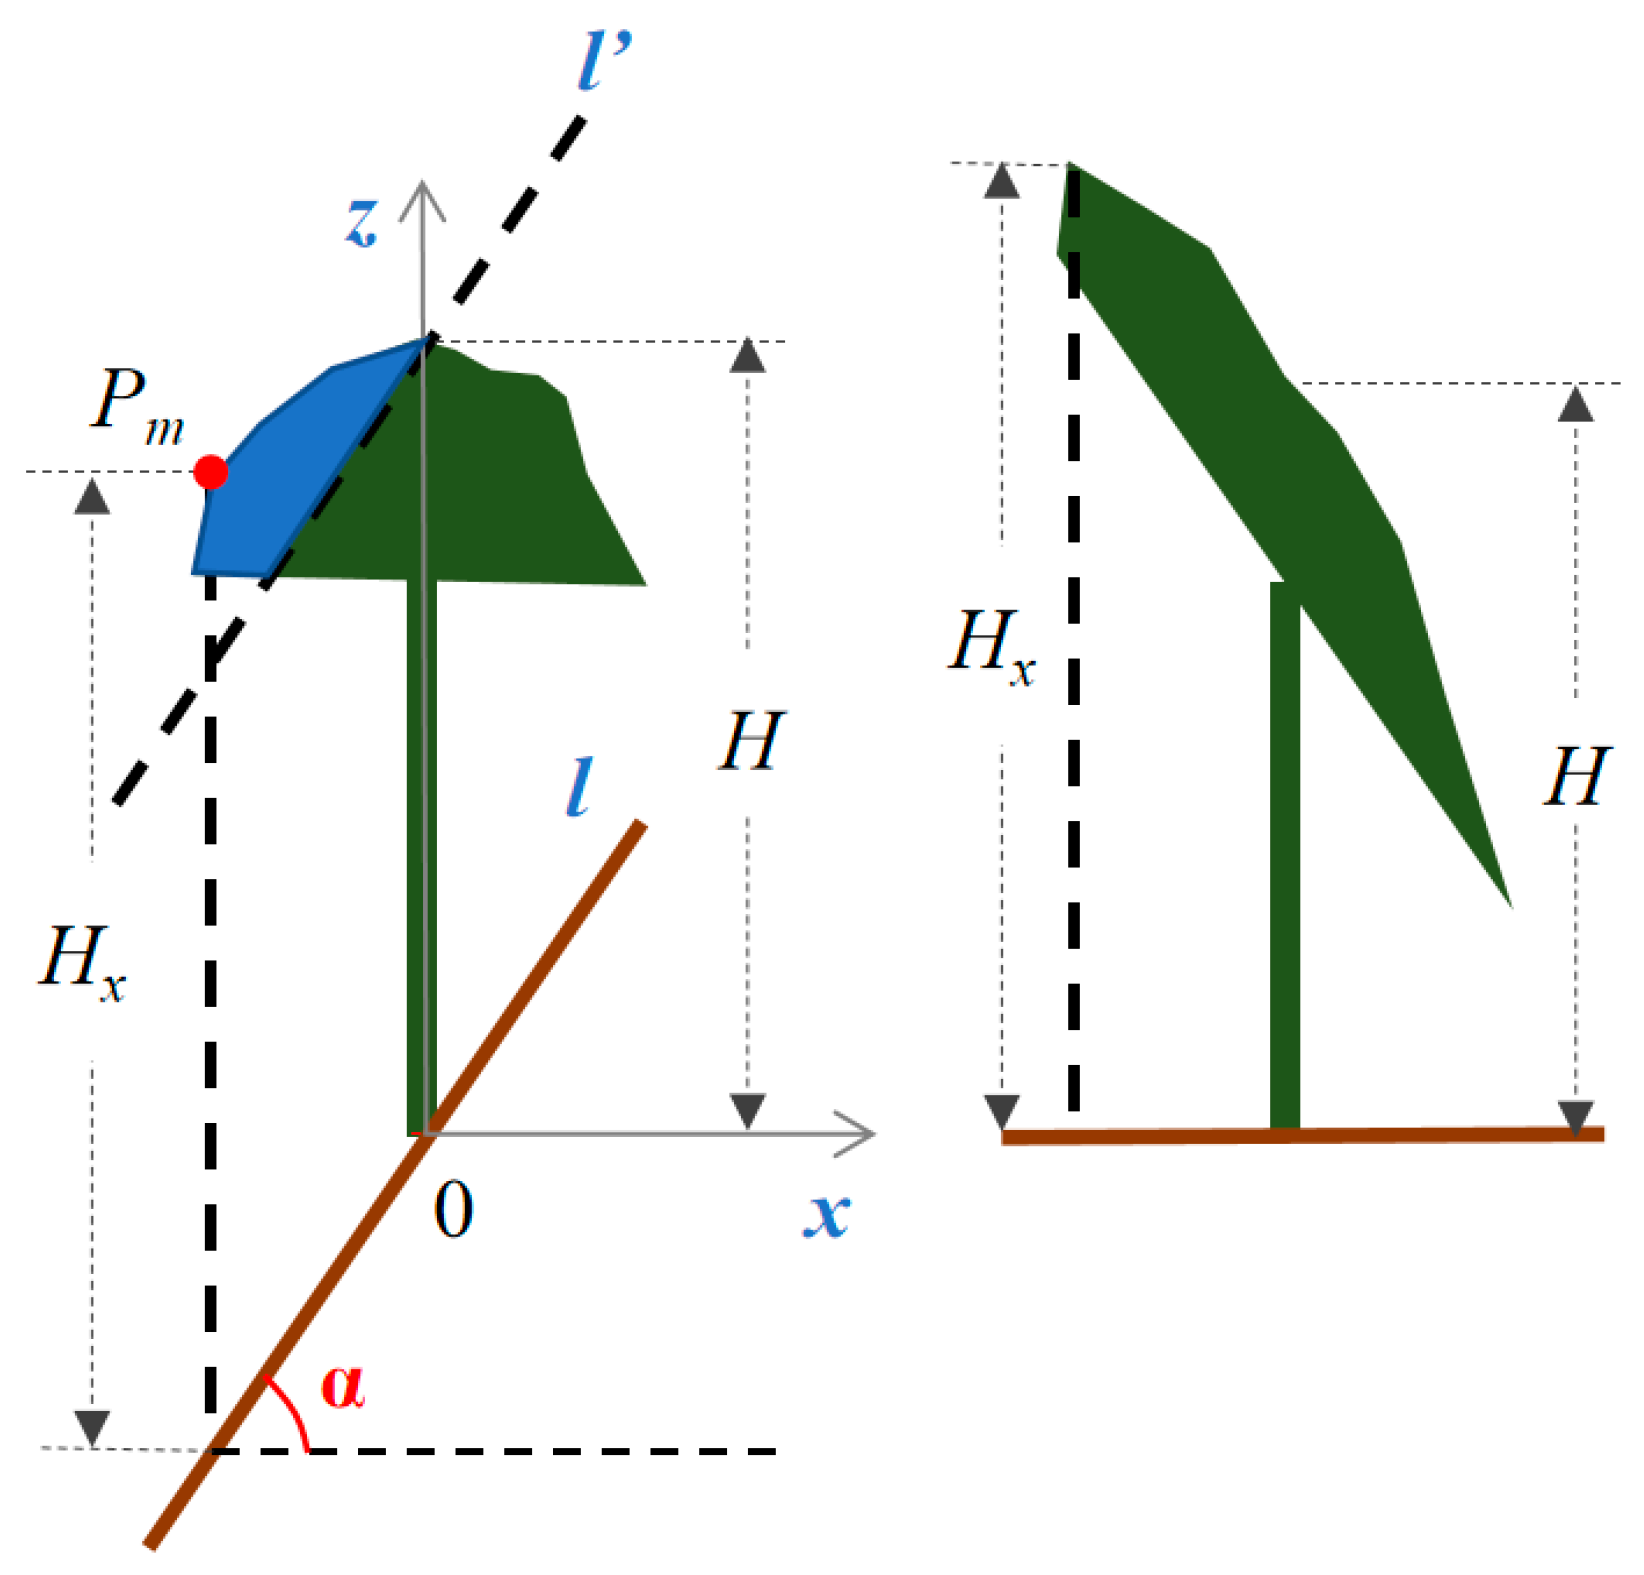
3.2. Theoretical Model of Treetop Displacement
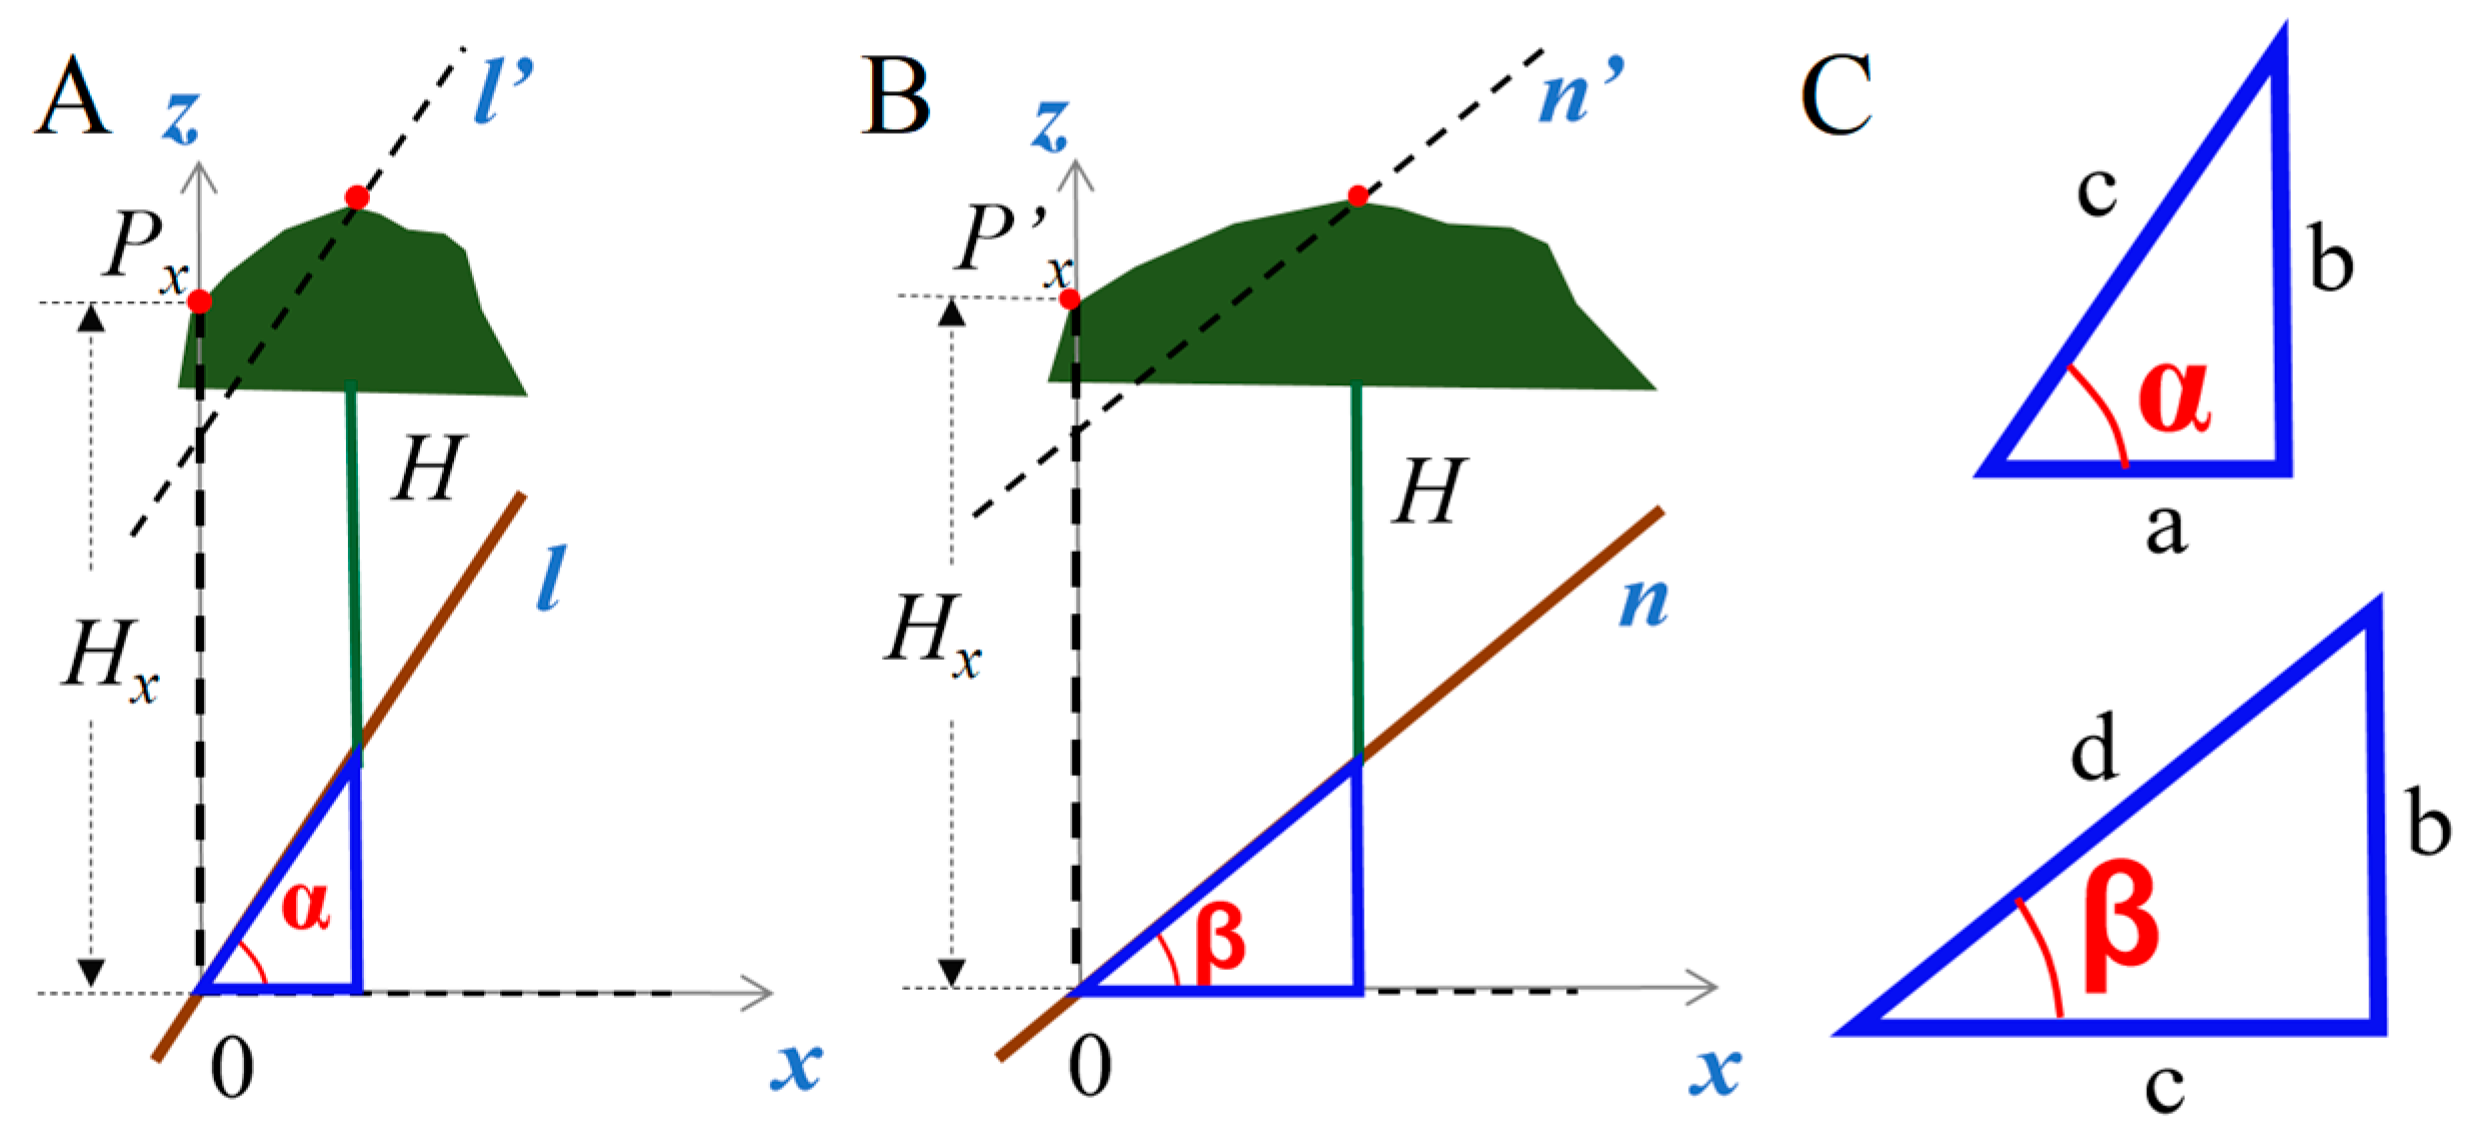
3.2.1. Original Model
3.2.2. Improved Model
3.2.3. Treetop Displacement Comparison between CNPC and NPCIT
3.3. Treetop Detection and Tree Height Extraction
3.4. Comparison of the Locations and Heights of Trees
4. Results
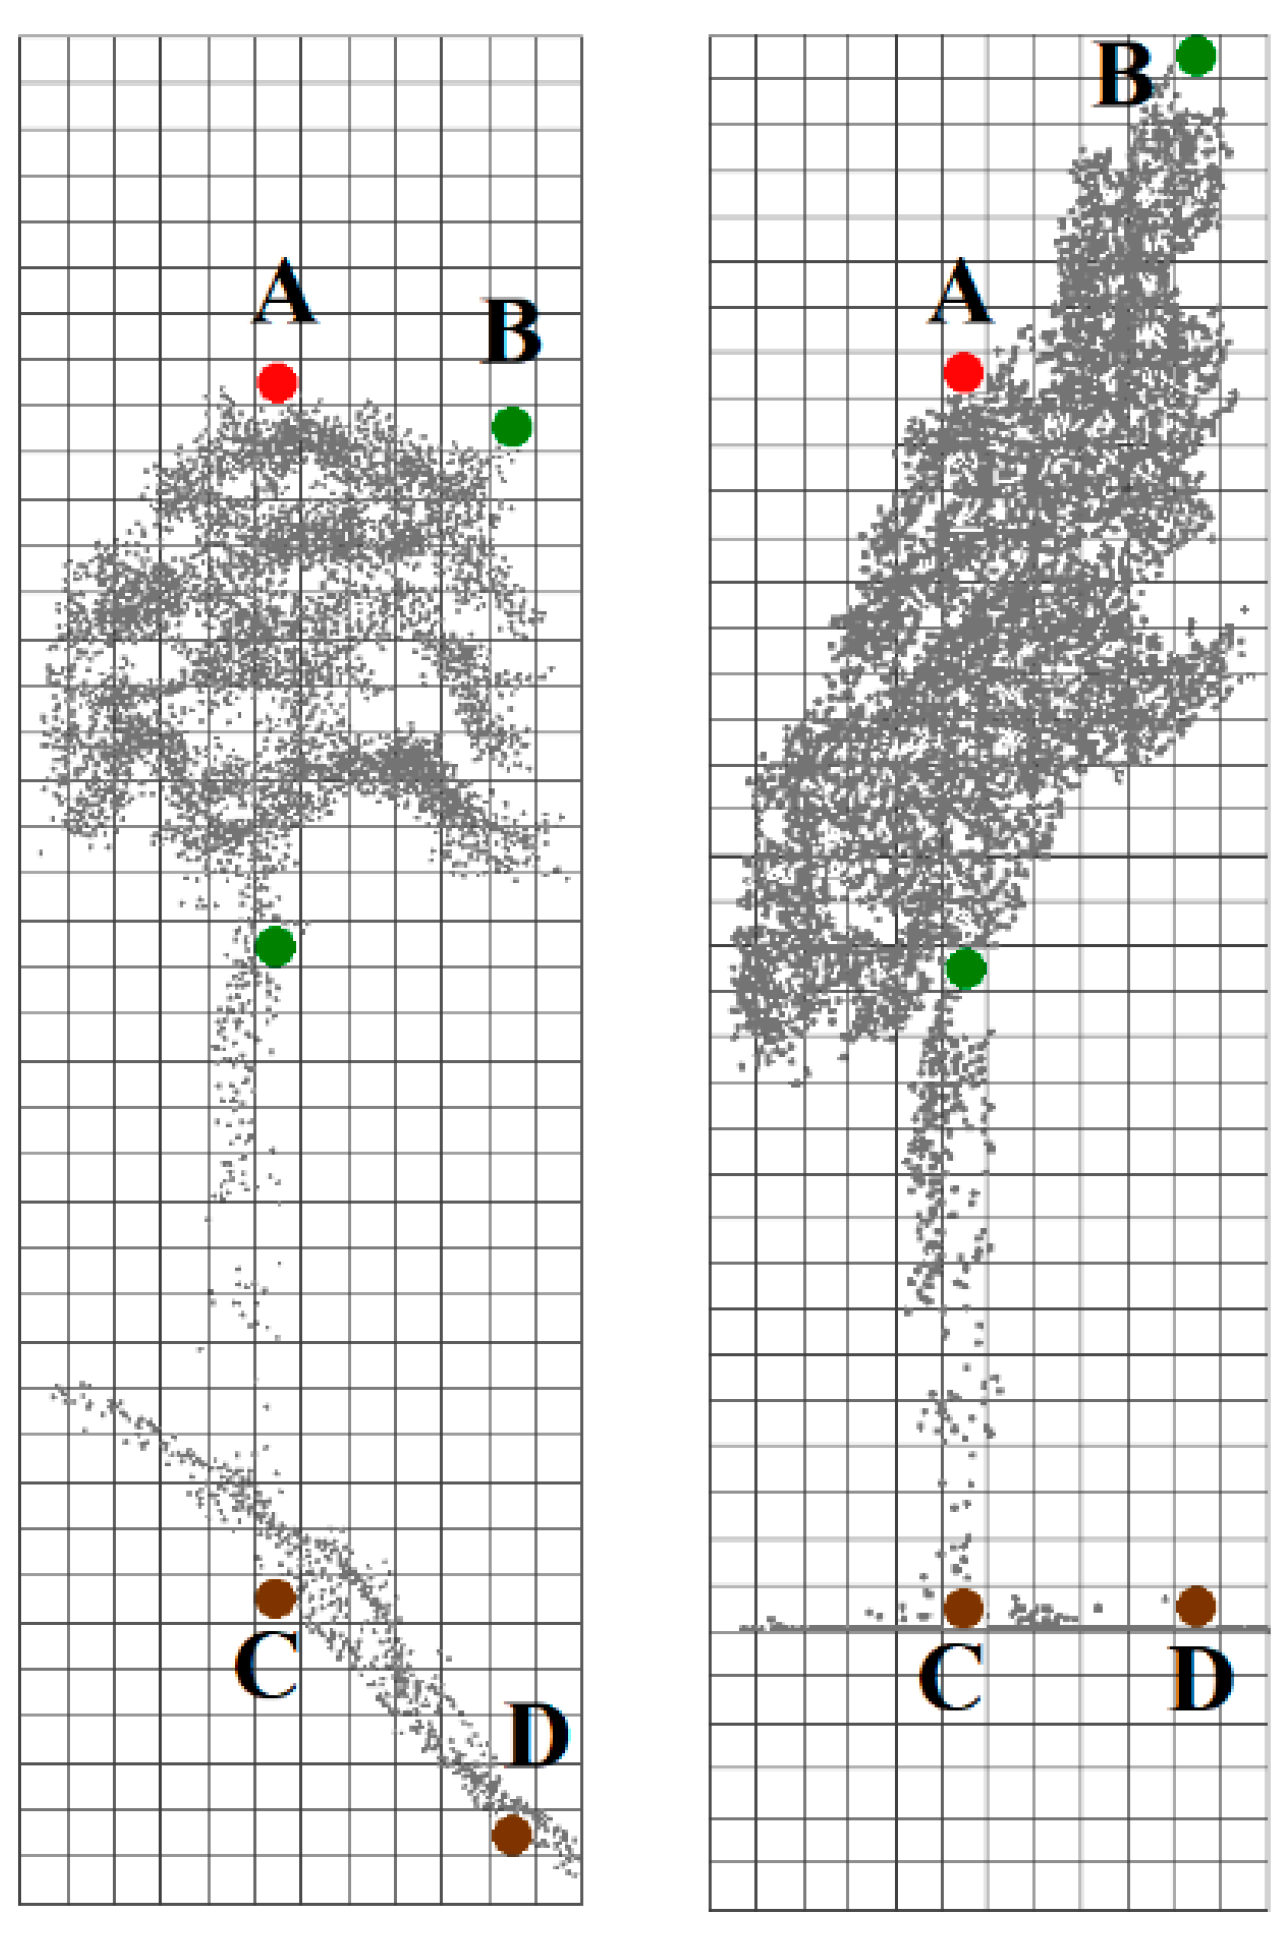
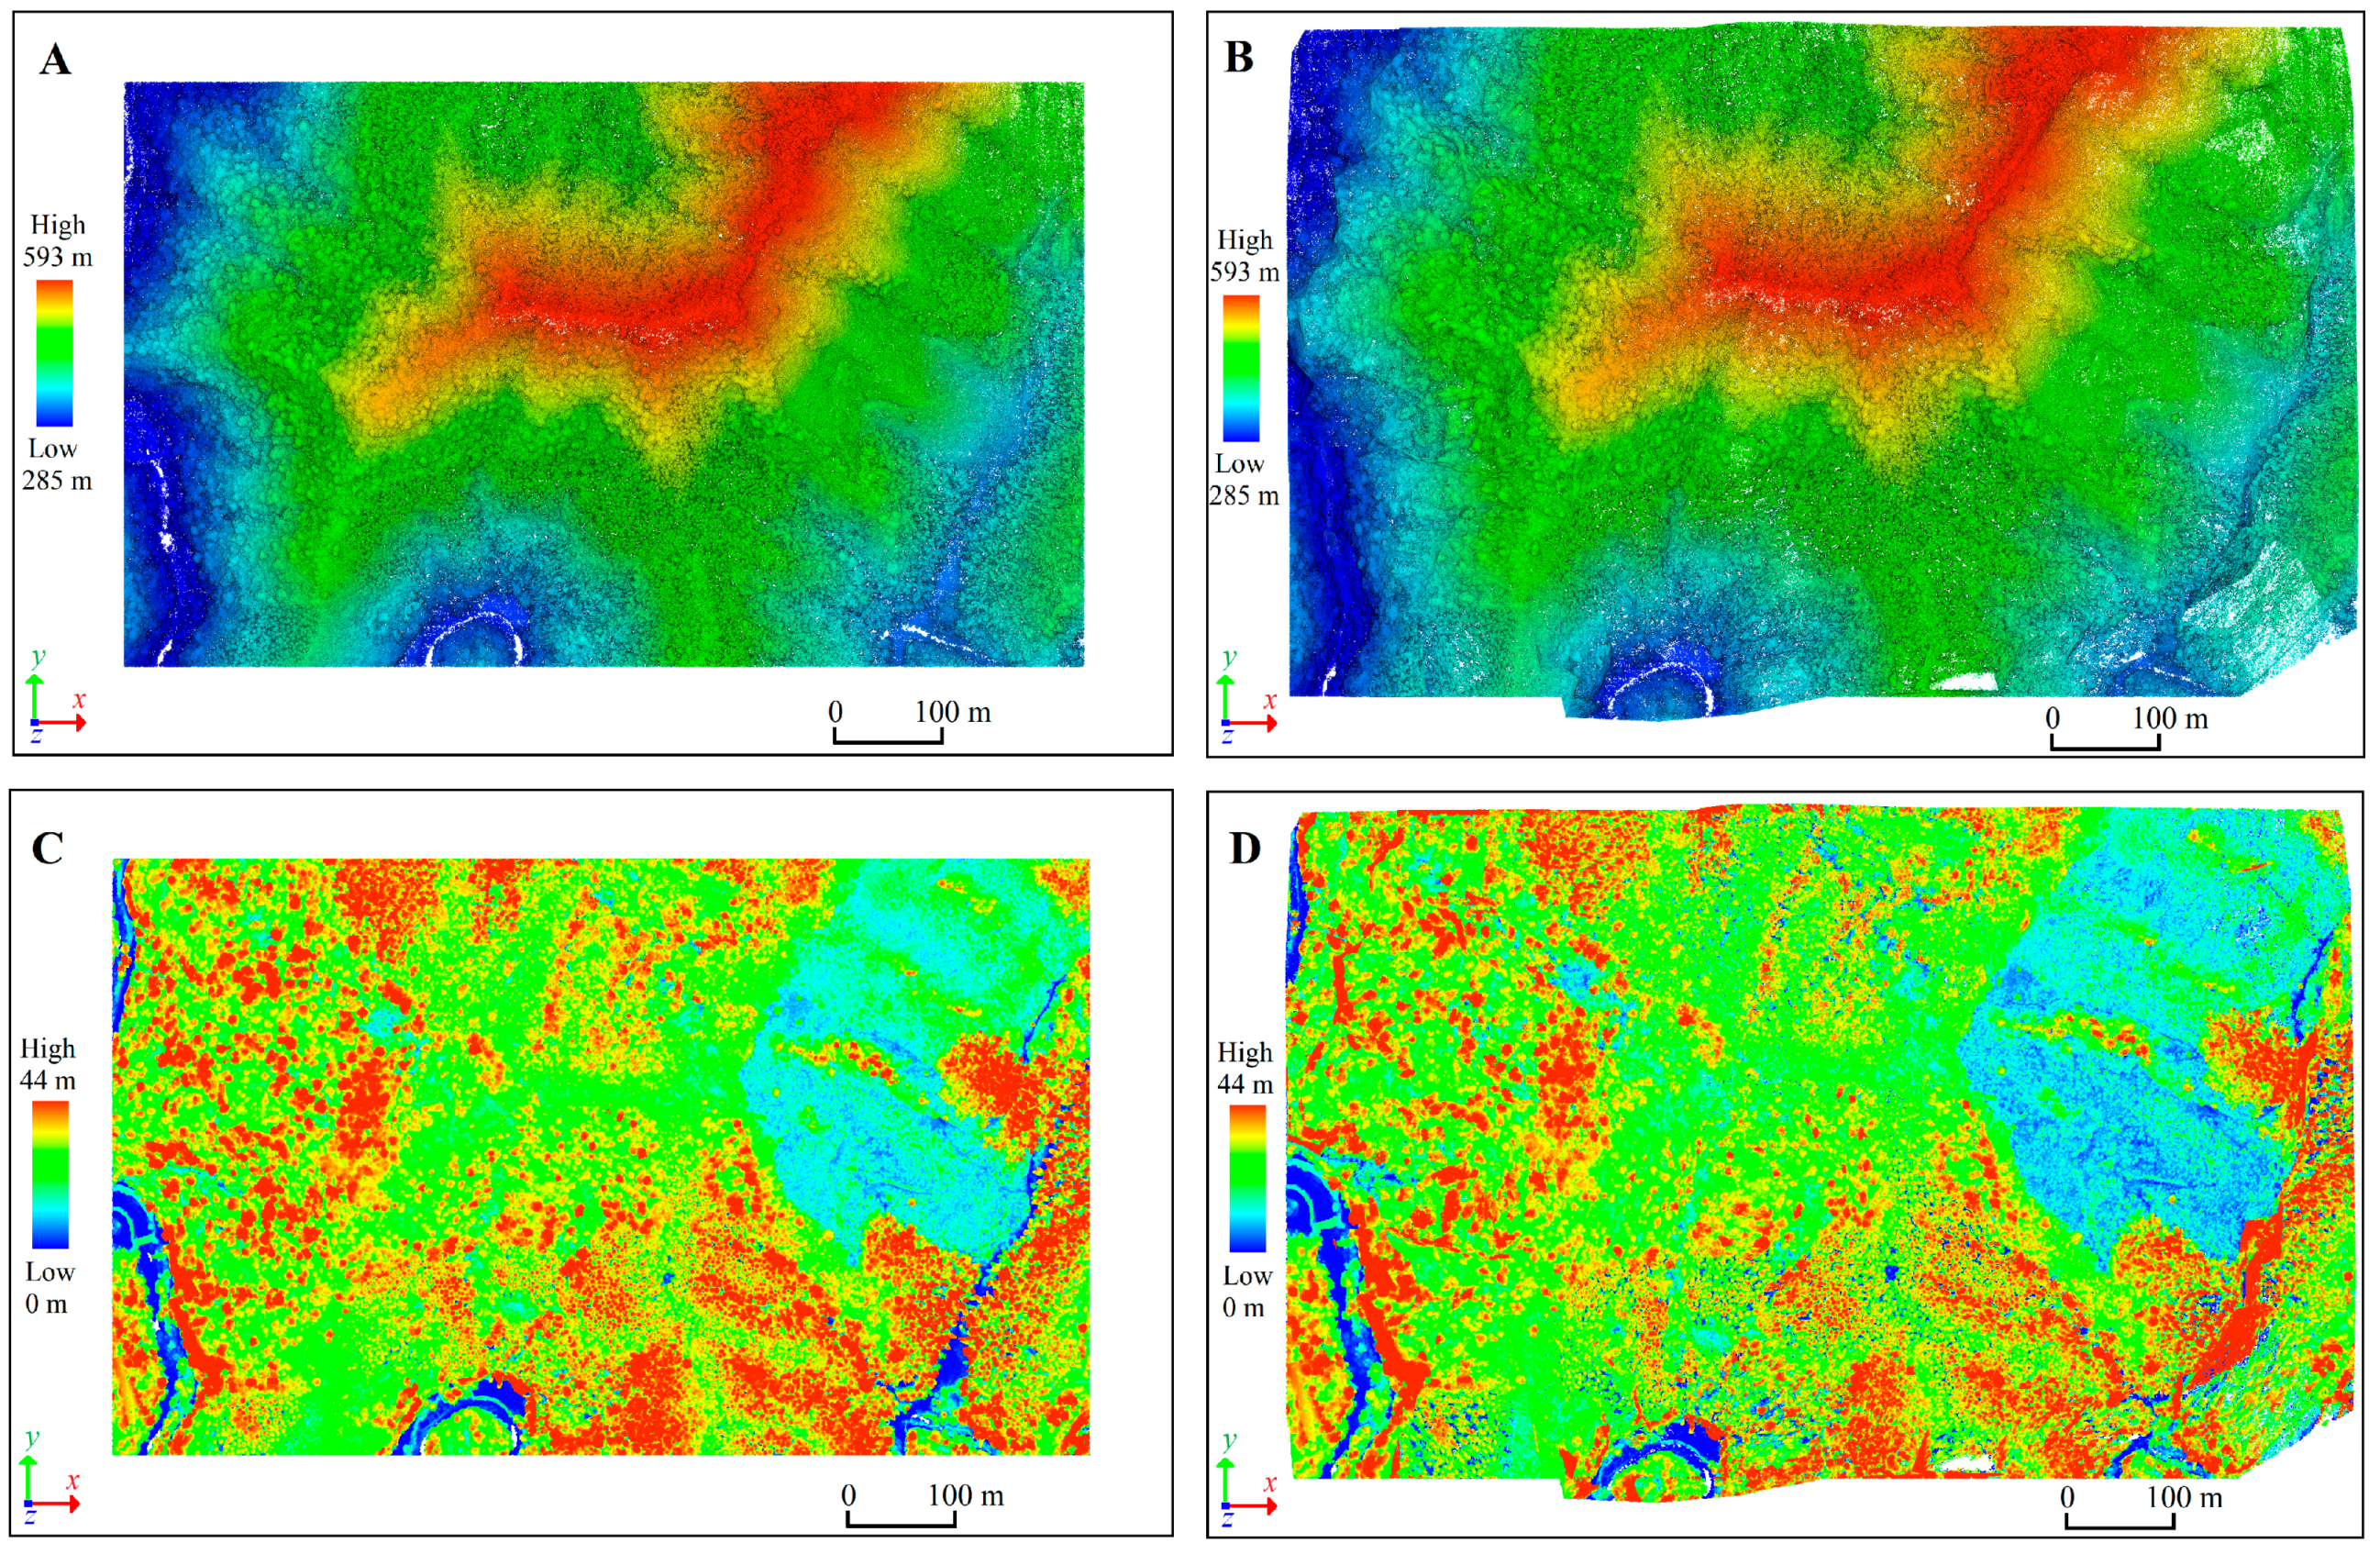
4.1. Topographic Normalization Based on the NPCIT Method
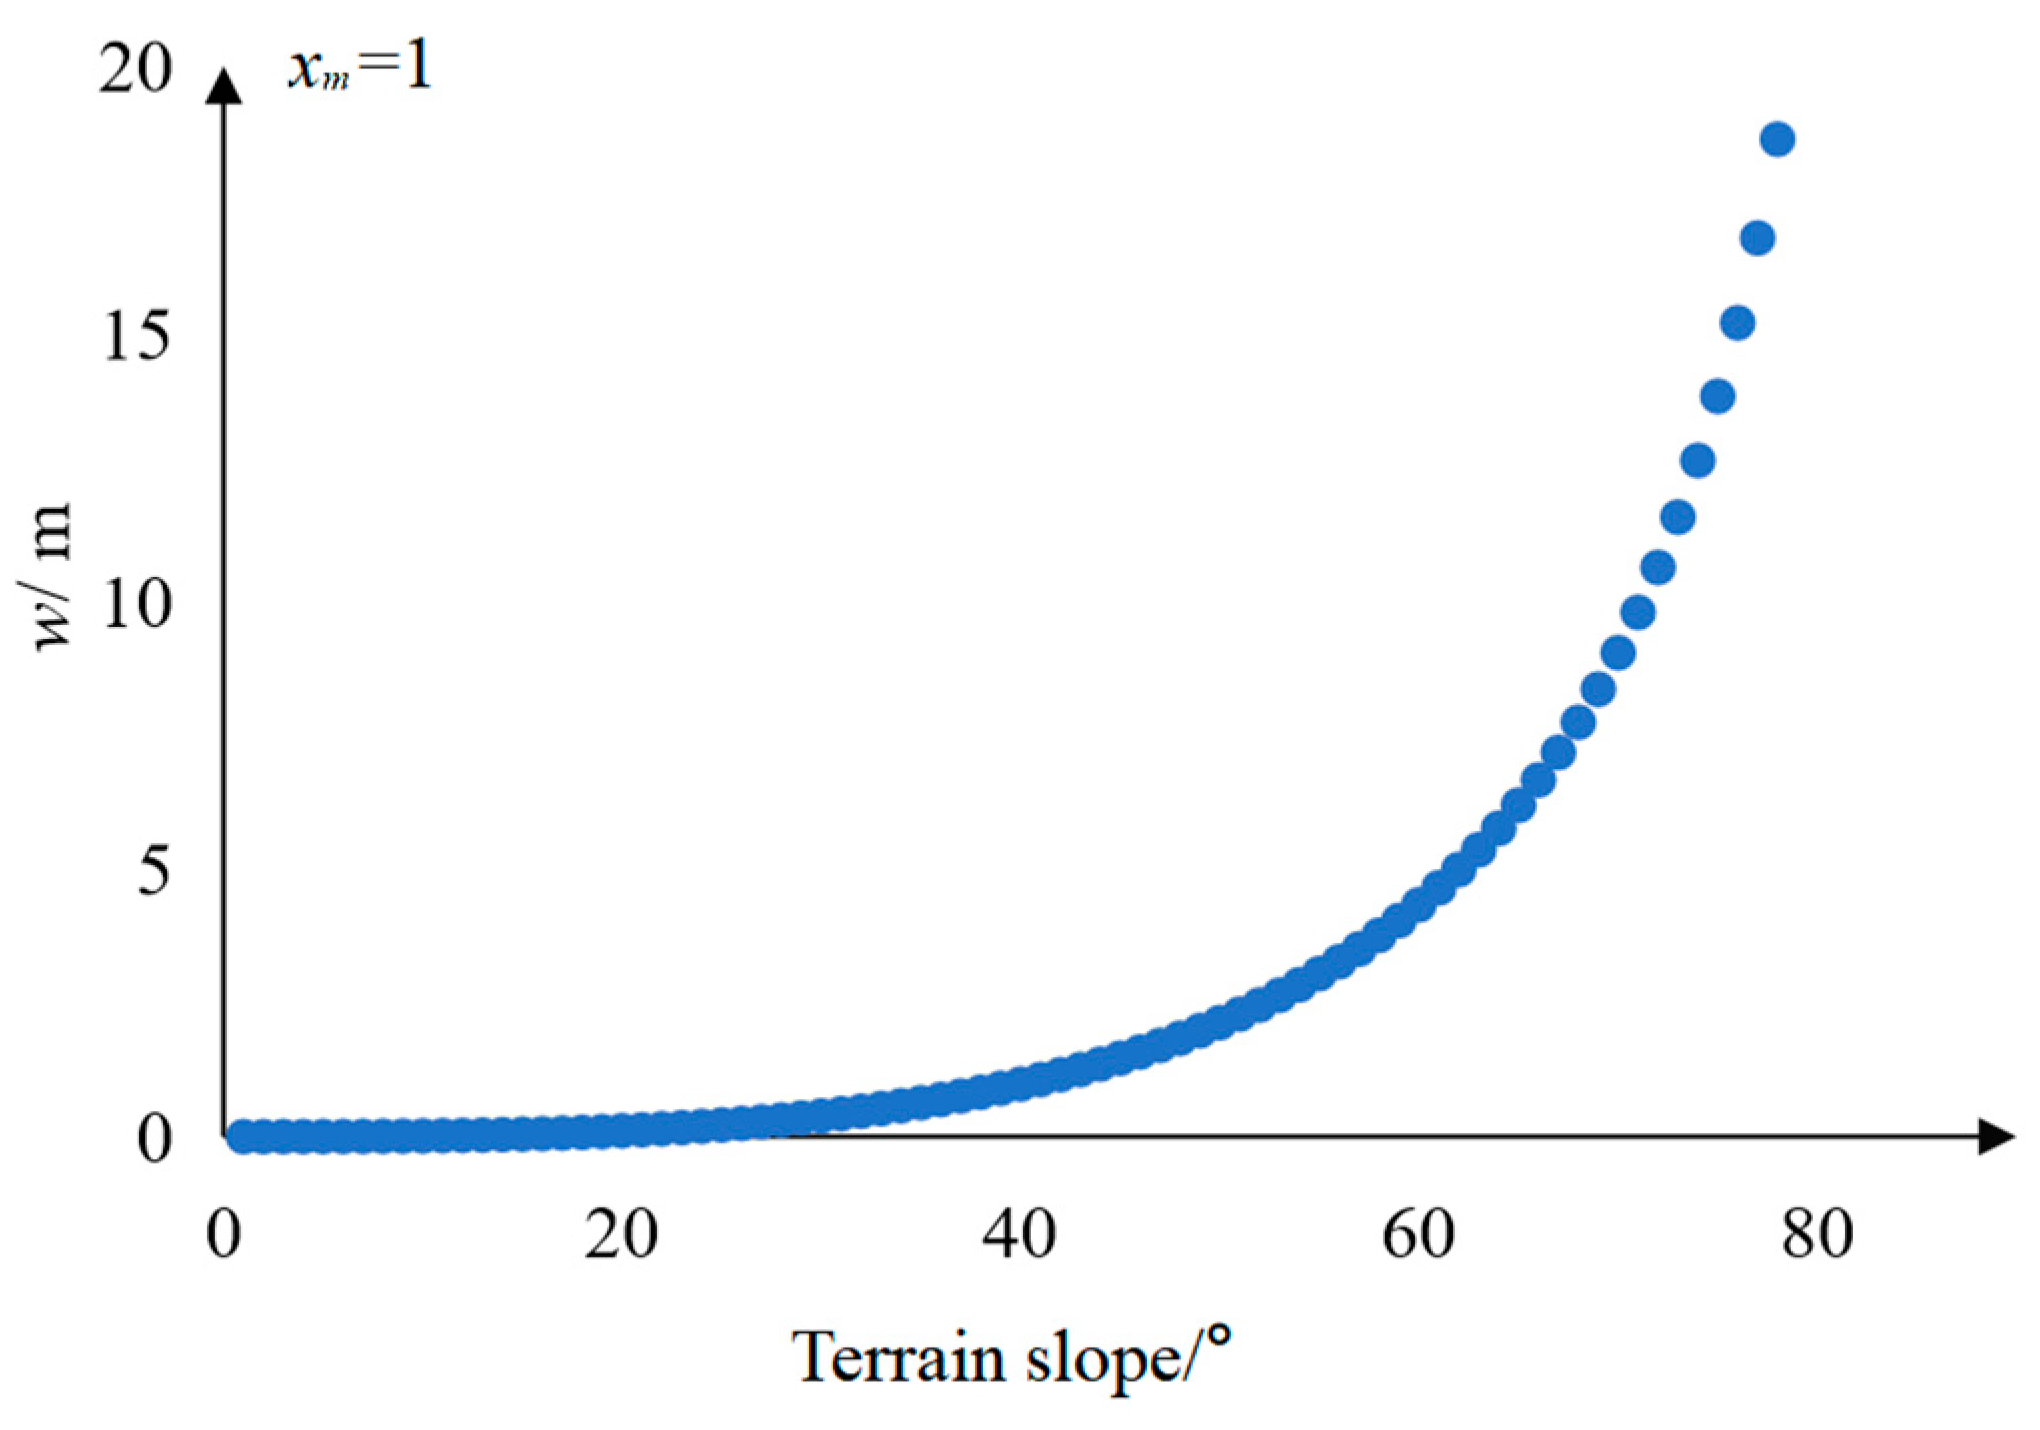
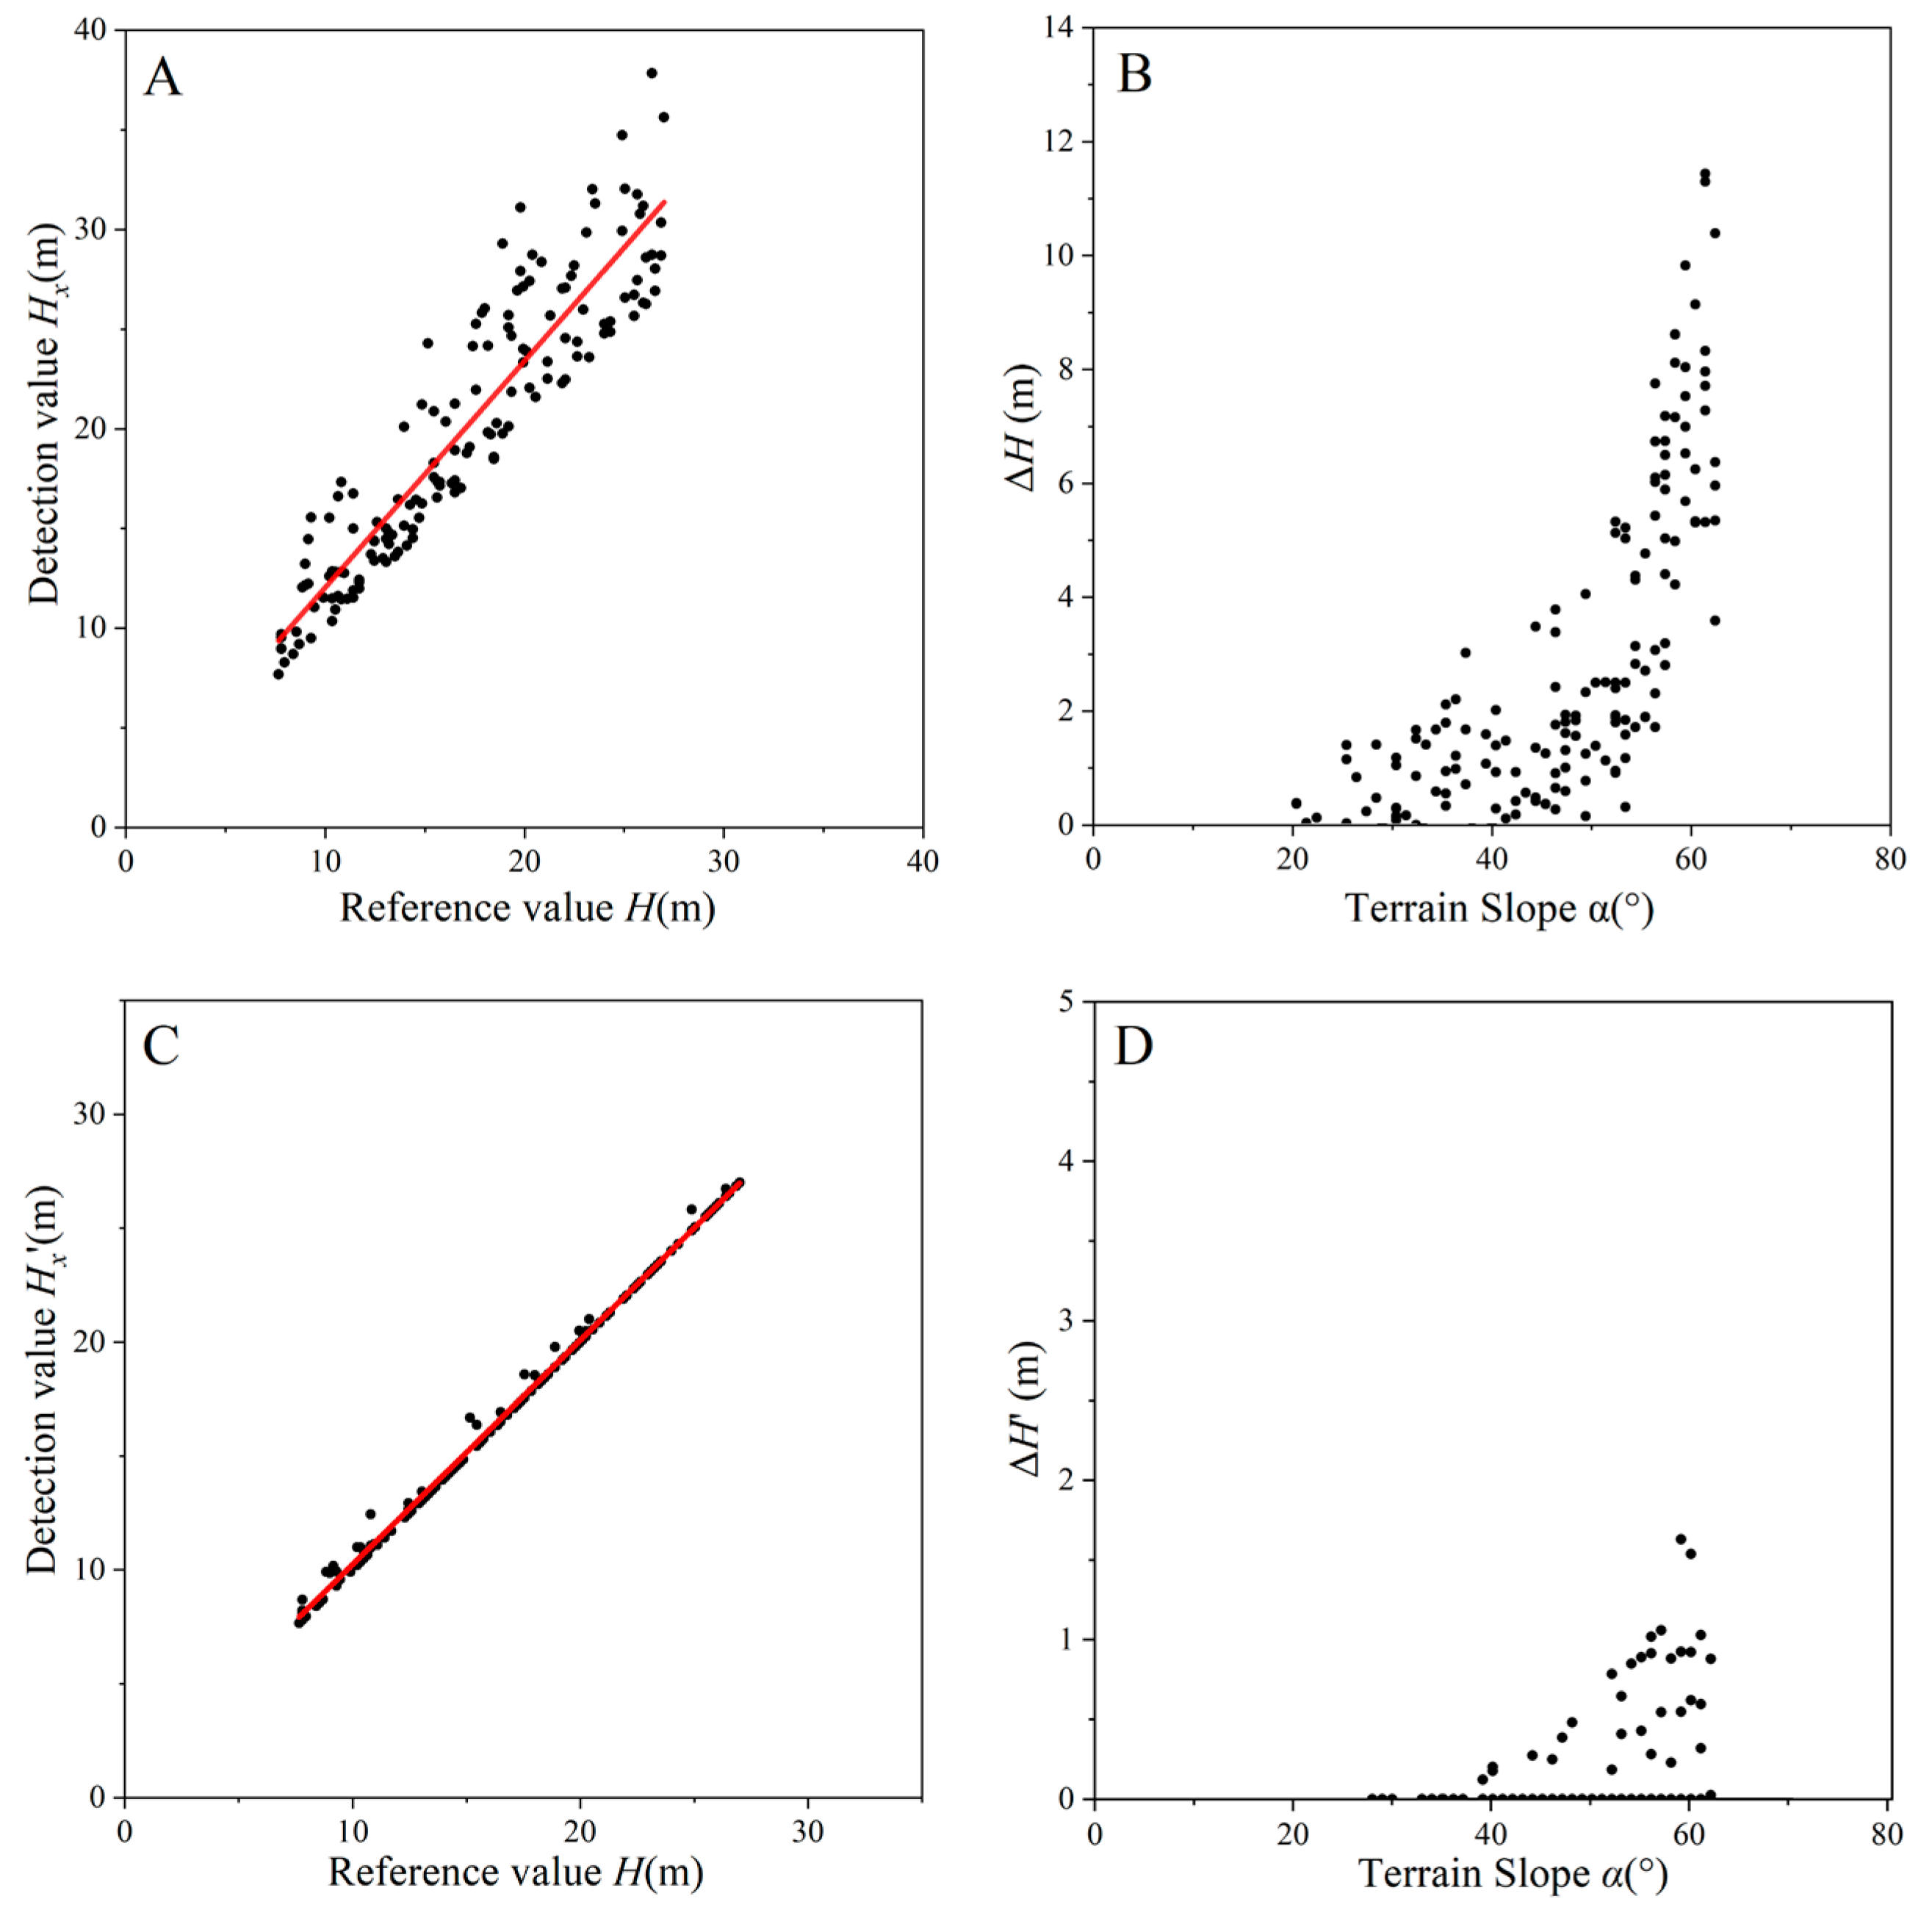
4.2. Influence of the Slope Gradient on Treetop Detection Displacement
5. Discussion
6. Conclusions
Author Contributions
Funding
Data Availability Statement
Conflicts of Interest
References
- Maurizio, S.; Oliver, C.; Johan, E. Dynamics of the Swedish forest carbon pool between 2010 and 2015 estimated from satellite L-band SAR observations. Remote Sens. Environ. 2022, 270, 112846. [Google Scholar]
- Waldeland, A.U.; Øivind, D.T.; Salberg, A. Forest mapping and monitoring in Africa using Sentinel-2 data and deep learning. Int. J. Appl. Earth Obs. Geoinf. 2022, 111, 102840. [Google Scholar] [CrossRef]
- Katsuto, S.; Tomohiro, N.; Fumiaki, K.; Keiko, F.; Hideki, S. Integrating terrestrial laser scanning and unmanned aerial vehicle photogrammetry to estimate individual tree attributes in managed coniferous forests in Japan. Int. J. Appl. Earth Obs. Geoinf. 2022, 106, 102658. [Google Scholar]
- Hyyppä, J.; Hyyppä, D.; Leckie, F.; Gougeon, X.; Yu, F.; Maltamo, M. Review of methods of small-footprint airborne laser scanning for extracting forest inventory data in boreal forests. Int. J. Remote Sens. 2008, 29, 1339–1366. [Google Scholar] [CrossRef]
- Abegg, M.; Kükenbrink, D.; Zell, J.; Schaepman, M.E.; Morsdorf, F. Terrestrial laser scanning for forest inventories-tree diameter distribution and scanner location impact on occlusion. Forests 2017, 8, 184. [Google Scholar] [CrossRef] [Green Version]
- Persson, H.J.; Olofsson, K.; Holmgren, J. Two-phase forest inventory using very-high-resolution laser scanning. Remote Sens. Environ. 2022, 271, 112909. [Google Scholar] [CrossRef]
- De Almeida, D.R.A.; Broadbent, E.N.; Ferreira, M.P.; Meli, P.; Maria, A.; Zambrano, A.; Gorgens, E.B.; Resende, A.F.; De Almeida, C.T.; do Amaral, C.H.; et al. Monitoring restored tropical forest diversity and structure through UAV-borne hyperspectral and lidar fusion. Remote Sens. Environ. 2021, 264, 112582. [Google Scholar] [CrossRef]
- Liu, K.; Wang, A.; Zhang, S.; Zhu, Z.; Bi, Y.; Wang, Y.; Du, X. Tree species diversity mapping using UAS-based digital aerial photogrammetry point clouds and multispectral imageries in a subtropical forest invaded by moso bamboo (Phyllostachys edulis). Int. J. Appl. Earth Obs. 2021, 104, 102587. [Google Scholar] [CrossRef]
- Dong, Z.; Liang, F.; Yang, B.; Xu, Y.; Zang, Y.; Li, J.; Wang, Y.; Dai, W.; Fan, H.; Hyyppä, J.; et al. Registration of large-scale terrestrial laser scanner point clouds: A review and benchmark. ISPRS J. Photogramm. Remote Sens. 2020, 163, 327–342. [Google Scholar]
- Vega, C.; Hamrouni, A.; El Mokhtari, S.; Morel, J.; Bock, J.; Renaud, J.P.; Bouvier, M.; Durrieu, S. PTrees: A point-based approach to forest tree extraction from lidar data. Int. J. Appl. Earth Observ. Geoinf. 2014, 33, 98–108. [Google Scholar] [CrossRef]
- Ma, K.; Chen, Z.; Fu, L.; Tian, W.; Jiang, F.; Yi, J.; Du, Z.; Sun, H. Performance and sensitivity of individual tree segmentation methods for UAV-LiDAR in multiple forest types. Remote Sens. 2022, 14, 298. [Google Scholar] [CrossRef]
- Liang, X.; Kankare, V.; Hyyppä, J.; Wang, Y.; Kukko, A.; Haggrén, H.; Yu, X.; Kaartinen, H.; Jaakkola, A.; Guan, F.; et al. Terrestrial laser scanning in forest inventories. ISPRS J. Photogramm. Remote Sens. 2016, 115, 63–77. [Google Scholar] [CrossRef]
- Luo, L.; Zhai, Q.; Su, Y.; Ma, Q.; Kelly, M.; Guo, Q. Simple method for direct crown base height estimation of individual conifer trees using airborne LiDAR data. Opt. Express. 2018, 26, A562–A578. [Google Scholar] [CrossRef] [PubMed]
- Duncanson, L.I.; Cook, B.D.; Hurtt, G.C.; Dubayah, R.O. An efficient, multi–layered crown delineation algorithm for mapping individual tree structure across multiple ecosystems. Remote Sens. Environ. 2014, 154, 378–386. [Google Scholar] [CrossRef]
- Fan, L.; Powrie, W.; Smethurst, J.; Atkinson, P.M.; Einstein, H. The Effect of Short Ground Vegetation on Terrestrial Laser Scans at a Local Scale. ISPRS J. Photogramm. Remote Sens. 2014, 95, 42–52. [Google Scholar] [CrossRef] [Green Version]
- Oshio, H.; Asawa, T.; Hoyano, A.; Miyasaka, S. Estimation of the leaf area density distribution of individual trees using high-resolution and multi-return airborne LiDAR data. Remote Sens. Environ. 2015, 166, 116–125. [Google Scholar] [CrossRef]
- Liu, J.; Skidmore, A.K.; Heurich, M.; Wang, T. Significant effect of topographic normalization of airborne LiDAR data on the retrieval of plant area index profile in mountainous forests. ISPRS J. Photogramm. Remote Sens. 2017, 132, 77–87. [Google Scholar] [CrossRef]
- Lu, X.; Guo, Q.; Li, W.; Flanagan, J. A bottom-up approach to segment individual deciduous trees using leaf-off LiDAR point cloud data. ISPRS J. Photogramm. Remote Sens. 2014, 94, 1–12. [Google Scholar] [CrossRef]
- Marinelli, D.; Paris, C.; Bruzzone, L. A Triangulation-Based Technique for Tree-Top Detection in Heterogeneous Forest Structures Using High Density LiDAR Data. IEEE Geosci. Remote Sens. Lett. 2022, 19, 1–5. [Google Scholar] [CrossRef]
- Hao, Y.S.; Widagdo, F.R.A.; Liu, X.; Liu, Y.S.; Dong, L.H.; Li, F.G. A Hierarchical Region-Merging Algorithm for 3-D Segmentation of Individual Trees Using UAV-LiDAR Point Clouds. IEEE Trans. Geosci. Remote Sens. 2022, 60, 1–16. [Google Scholar] [CrossRef]
- Wang, L.; Gong, P.; Biging, G.S. Individual tree-crown delineation and treetop detection in high-spatial-sesolution aerial imagery. Photogramm. Eng. Remote Sens. 2004, 70, 351–357. [Google Scholar] [CrossRef] [Green Version]
- Hu, X.; Chen, W.; Xu, W. Adaptive mean shift-based identification of individual trees using airborne LiDAR data. Remote Sens. 2017, 9, 148. [Google Scholar] [CrossRef] [Green Version]
- MA, K.; Xiong, Y.; Jiang, F.; Chen, S.; Sun, H. A novel vegetation point cloud density tree-segmentation model for overlapping crowns using UAV LiDAR. Remote Sens. 2021, 13, 1442. [Google Scholar] [CrossRef]
- Kaartinen, H.; Hyyppä, J.; Yu, X.; Vastaranta, M.; Hyyppä, H.; Kukko, A.; Holopainen, M.; Heipke, C.; Hirschmugl, M.; Morsdorf, F.; et al. An international comparison of individual tree detection and extraction using airborne laser scanning. Remote Sens. 2012, 4, 950–974. [Google Scholar] [CrossRef] [Green Version]
- Wang, Y.; Hyyppä, J.; Liang, X.; Kaartinen, H.; Yu, X.; Lindberg, E.; Holmgren, J.; Qin, Y.; Mallet, C.; Ferraz, A. International benchmarking of the individual tree detection methods for modeling 3-D canopy structure for silviculture and forest ecology using airborne laser scanning. IEEE Trans. Geosci. Remote Sens. 2016, 54, 5011–5027. [Google Scholar] [CrossRef] [Green Version]
- Fan, W.; Yang, B.; Dong, Z.; Liang, F.; Xiao, J.; Li, F. Confidence-guided roadside individual tree extraction for ecological benefit estimation. Int. J. Appl. Earth Obs. Geoinf. 2021, 102, 102368. [Google Scholar] [CrossRef]
- Haala, N.; Brenner, C. Extraction of buildings and trees in urban environments. ISPRS J. Photogramm. Remote Sens. 1999, 54, 130–137. [Google Scholar] [CrossRef]
- Holmgren, J.; Persson, A. Identifying Species of Individual Trees Using Airborne Laser Scanner. Remote Sens. Environ. 2004, 90, 415–423. [Google Scholar] [CrossRef]
- Véga, C.; Durrieu, S. Multi-level filtering segmentation to measure individual tree parameters based on LiDAR data: Application to a mountainous forest with heterogeneous stands. Int. J. Appl. Earth Obs. Geoinf. 2011, 13, 646–656. [Google Scholar] [CrossRef] [Green Version]
- Duan, Z.; Zhao, D.; Li, Z.; Zhao, Y.; Wu, B.; Zhu, J. Assessing and correcting topographic effects on forest canopy height retrieval using airborne LiDAR data. Sensors. 2015, 15, 12133–12155. [Google Scholar] [CrossRef]
- Khosravipour, A.; Skidmore, A.K.; Wang, T.; Isenburg, M.; Khoshelham, K. Effect of slope on treetop detection using a LiDAR canopy height model. ISPRS J. Photogram. Remote Sens. 2015, 104, 44–52. [Google Scholar] [CrossRef]
- Alexander, C.; Korstjens, A.H.; Hill, R.A. Influence of micro-topography and crown characteristics on tree height estimations in tropical forests based on LiDAR canopy height models. Int. J. Appl. Earth Observ. Geoinf. 2018, 65, 105–113. [Google Scholar] [CrossRef]
- Nie, S.; Wang, C.; Xi, X.H.; Luo, S.Z.; Zhu, X.X.; Li, G.Y.; Liu, H.; Tian, J.Y.; Zhang, S. Assessing the impacts of various factors on treetop detection using LiDAR-derived canopy height models. IEEE Trans. Geosci. Remote Sens. 2019, 57, 10099–10115. [Google Scholar] [CrossRef]
- RIEGL VUX-1UAV Data Sheet, RIEGL Laser Measurement Systems GmbH, Horn, Austria. 2022. Available online: http://www.riegl.com/nc/products/airbornescanning/produktdetail/product/scanner/49/ (accessed on 10 March 2023).
- Silva, V.S.; Silva, C.A.; Mohan, M.; Cardil, A.; Rex, F.E.; Loureiro, G.H.; Almeida, D.R.A.D.; Broadbent, E.N.; Gorgens, E.B.; Dalla, C.A.P.; et al. Combined impact of sample size and modeling approaches for predicting stem volume in eucalyptus spp. forest plantations using field and LiDAR data. Remote Sens. 2020, 12, 1438. [Google Scholar] [CrossRef]
- Liang, X.; Hyyppä, J.; Kaartinen, H.; Lehtomäki, M.; Pyörälä, J.; Pfeifer, N.; Holopainen, M.; Brolly, G.; Francesco, P.; Hackenberg, J.; et al. International benchmarking of terrestrial laser scanning approaches for forest inventories. ISPRS J. Photogramm. Remote Sens. 2018, 144, 137–179. [Google Scholar] [CrossRef]
- Zhao, X.; Guo, Q.; Su, Y.; Xue, B. Improved progressive TIN densification filtering algorithm for airborne LiDAR data in forested areas. ISPRS J. Photogramm. Remote Sens. 2016, 117, 79–91. [Google Scholar] [CrossRef] [Green Version]
- Wang, C.; Ji, M.; Wang, J.; Wen, W.; Li, T.; Sun, Y. An improved DBSCAN method for LiDAR data segmentation with automatic Eps estimation. Sensors 2019, 19, 172. [Google Scholar] [CrossRef] [PubMed] [Green Version]
- Mohan, M.; Silva, C.; Klauberg, C.; Jat, P.; Catts, G.; Cardil, A.; Hudak, A.T.; Dia, M. Individual tree detection from unmanned aerial vehicle (UAV) derived canopy height model in an open canopy mixed conifer forest. Forests 2017, 8, 340. [Google Scholar] [CrossRef] [Green Version]
- Kutner, M.H.; Nachtsheim, C.J.; Neter, J.; Wasserman, W. Linear regression with one predictor variable. In Applied Linear Statistical Models, 5th ed.; McGraw-Hill/Irwin: Chicago, IL, USA, 2004; Volume 1, pp. 1–5. [Google Scholar]
- Dai, W.; Yang, B.; Dong, Z.; Shaker, A. A new method for 3D individual tree extraction using multispectral airborne LiDAR point clouds. ISPRS J. Photogram. Remote Sens. 2018, 144, 400–411. [Google Scholar] [CrossRef]
- López Serrano, F.R.; Rubio, E.; García Morote, F.A.; Andrés Abellán, M.; Picazo Córdoba, M.I.; García Saucedo, F.; Martínez García, E.; Sánchez García, J.M.; Serena Innerarity, J.; Carrasco Lucas, L.; et al. Artificial intelligence-based software (AID-FOREST) for tree detection: A new framework for fast and accurate forest inventorying using LiDAR point clouds. Int. J. Appl. Earth Obs. Geoinf. 2022, 113, 103014. [Google Scholar] [CrossRef]
- Han, X.; Dong, Z.; Yang, B. A point-based deep learning network for semantic segmentation of MLS point clouds. ISPRS J. Photogram. Remote Sens. 2021, 175, 199–214. [Google Scholar] [CrossRef]
- Liang, X.; Wang, Y.; Pyörälä, J.; Lehtomäki, M.; Yu, X.; Kaartinen, H.; Kukko, A.; Honkavaara, E.; Issaoui, A.E.I.; Nevalainen, O.; et al. Forest in situ observations using unmanned aerial vehicle as an alternative of terrestrial measurements. For. Ecosyst. 2019, 6, 1–16. [Google Scholar] [CrossRef] [Green Version]
- Mengesha, T.; Hawkins, M.; Nieuwenhuis, M. Validation of terrestrial laser scanning data using conventional forest inventory methods. Eur. J. Forest Res. 2015, 134, 211–222. [Google Scholar] [CrossRef]
- Khosravipour, A.; Skidmore, A.; Isenburg, M.; Wang, T.; Hussin, Y. Generating Pit-free Canopy Height Models from Airborne Lidar. Photogramm. Eng. Remote Sens. 2014, 80, 863–872. [Google Scholar] [CrossRef]
- Chen, Q.; Wang, H.; Zhang, H.; Sun, M.; Liu, X. A point cloud filtering approach to generating DTMs for steep mountainous areas and adjacent residential areas. Remote Sens. 2016, 8, 71. [Google Scholar] [CrossRef] [Green Version]
- Kükenbrink, D.; Schneider, F.D.; Leiterer, R.; Schaepman, M.E.; Morsdorf, F. Quantification of hidden canopy volume of airborne laser scanning data using a voxel traversal algorithm. Remote Sens. Environ. 2017, 194, 424–436. [Google Scholar] [CrossRef]


| Slope Class (°) | Number of Trees | CNPC-Detected Treetops with Displacement | NPCIT-Detected Treetops with Displacement | ||||||||||||
|---|---|---|---|---|---|---|---|---|---|---|---|---|---|---|---|
| n (%) | Horizontal (m) | Vertical (m) | n (%) | Horizontal (m) | Vertical (m) | ||||||||||
| Min | Max | Mean | Min | Max | Mean | Min | Max | Mean | Min | Max | Mean | ||||
| <20 | 108 | 4 (3.7) | 1.3 | 3.4 | 2.78 | 0.04 | 0.4 | 0.21 | 0 | - | - | - | - | - | - |
| 20–34 | 78 | 31 (39.7) | 1.6 | 4.5 | 2.94 | 0.01 | 2.21 | 0.87 | 0 | - | - | - | - | - | - |
| 35–49 | 69 | 47 (68.1) | 0.9 | 4.5 | 2.78 | 0.11 | 4.06 | 1.43 | 7 (10.1) | 0.9 | 2.4 | 1.66 | 0.12 | 0.48 | 0.27 |
| >50 | 62 | 62 (100) | 1.1 | 5.2 | 3.27 | 0.31 | 8.62 | 4.48 | 25 (40.3) | 1.3 | 5.2 | 2.96 | 0.03 | 1.63 | 0.73 |
Disclaimer/Publisher’s Note: The statements, opinions and data contained in all publications are solely those of the individual author(s) and contributor(s) and not of MDPI and/or the editor(s). MDPI and/or the editor(s) disclaim responsibility for any injury to people or property resulting from any ideas, methods, instructions or products referred to in the content. |
© 2023 by the authors. Licensee MDPI, Basel, Switzerland. This article is an open access article distributed under the terms and conditions of the Creative Commons Attribution (CC BY) license (https://creativecommons.org/licenses/by/4.0/).
Share and Cite
Ma, K.; Li, C.; Jiang, F.; Xu, L.; Yi, J.; Huang, H.; Sun, H. Improvement of Treetop Displacement Detection by UAV-LiDAR Point Cloud Normalization: A Novel Method and A Case Study. Drones 2023, 7, 262. https://doi.org/10.3390/drones7040262
Ma K, Li C, Jiang F, Xu L, Yi J, Huang H, Sun H. Improvement of Treetop Displacement Detection by UAV-LiDAR Point Cloud Normalization: A Novel Method and A Case Study. Drones. 2023; 7(4):262. https://doi.org/10.3390/drones7040262
Chicago/Turabian StyleMa, Kaisen, Chaokui Li, Fugen Jiang, Liangliang Xu, Jing Yi, Heqin Huang, and Hua Sun. 2023. "Improvement of Treetop Displacement Detection by UAV-LiDAR Point Cloud Normalization: A Novel Method and A Case Study" Drones 7, no. 4: 262. https://doi.org/10.3390/drones7040262