3.1. Experimental Results
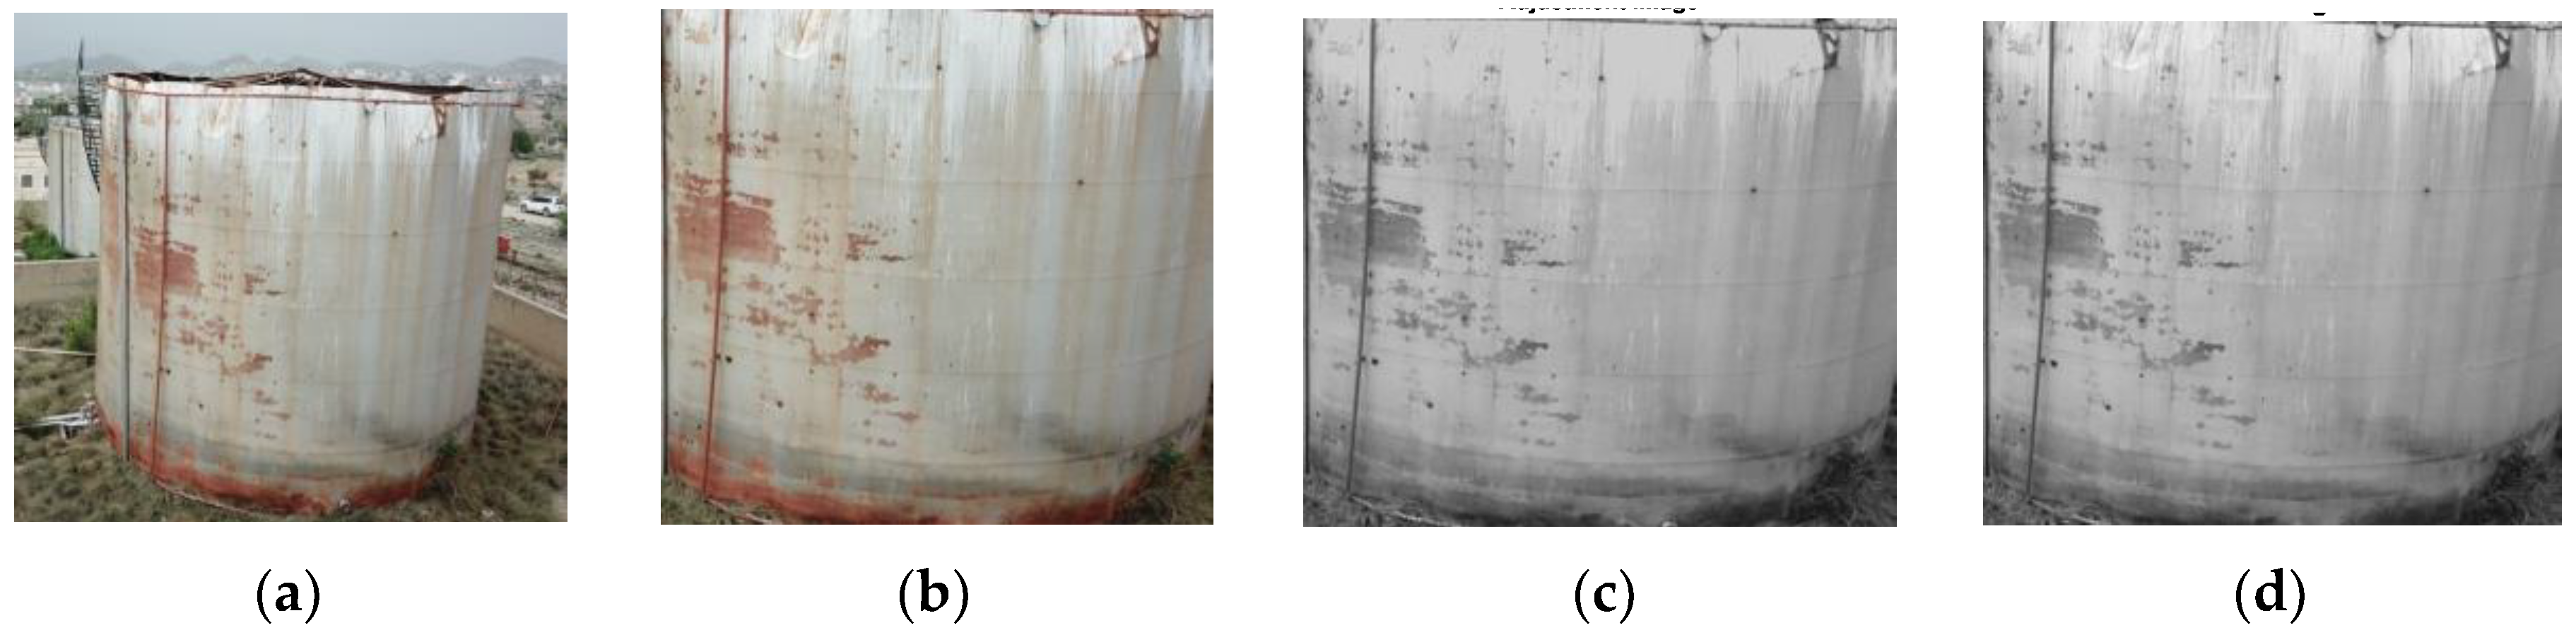
To check the performance of the inspection system, it must be tested on a wide range of samples with different parameters with several tests run under different conditions. Hence, several tests for the inspection system were conducted during different hours of the day as well as testing the system on tanks of different colors, shapes, and sizes. The worst inspection cases dealt with those parameters that show the limitations of the proposed algorithms.
Although several experiments were performed before making a decision, only the significant and important cases will be discussed. The samples presented in this sub-section have the following features: One contains pure defects and low noise, which is one of the easiest inspection cases that the system can detect. Another contains all low, medium, and high noise levels in different regions with different levels of defects, which is one of the worst cases of inspection due to it being difficult for the system to detect, which made us focus on it more during the inspection.
As shown in
Figure 24, the results indicate that there is no noise in the middle region of the tank in all images, while some defects may exist without any noise. As shown in
Figure 24b,d,e,f, the lower regions are the lowest noise regions, and in
Figure 24a,c the lower areas and the tank corners are the lowest noise areas. The three noise levels may not combine into one sample in real systems.
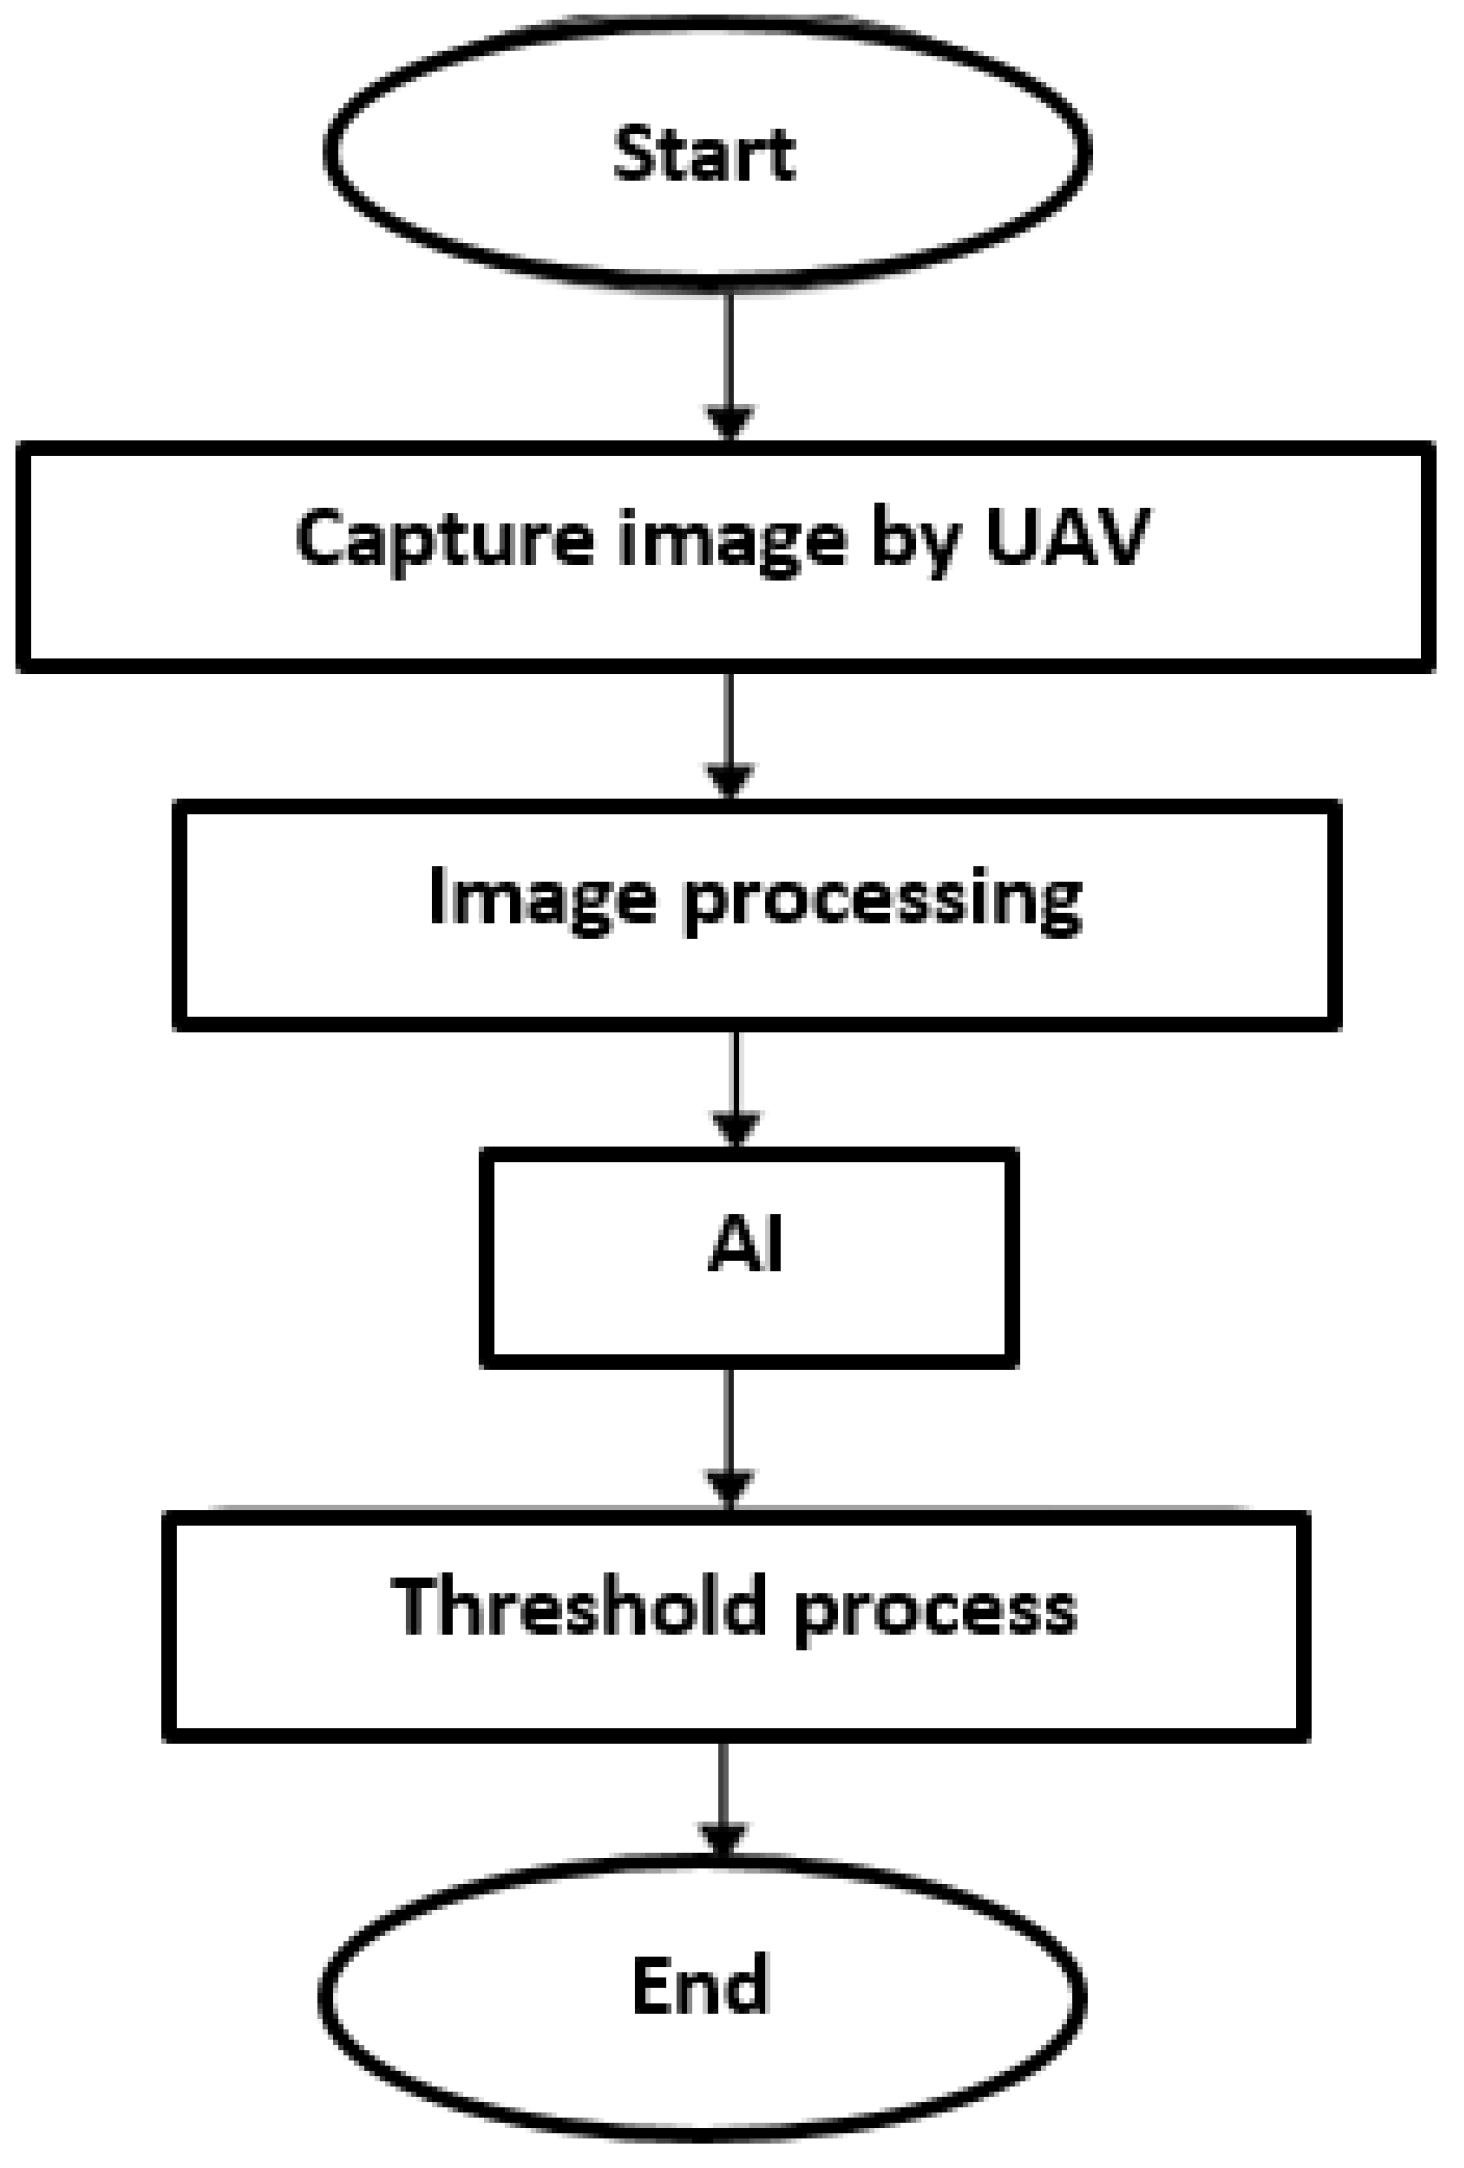
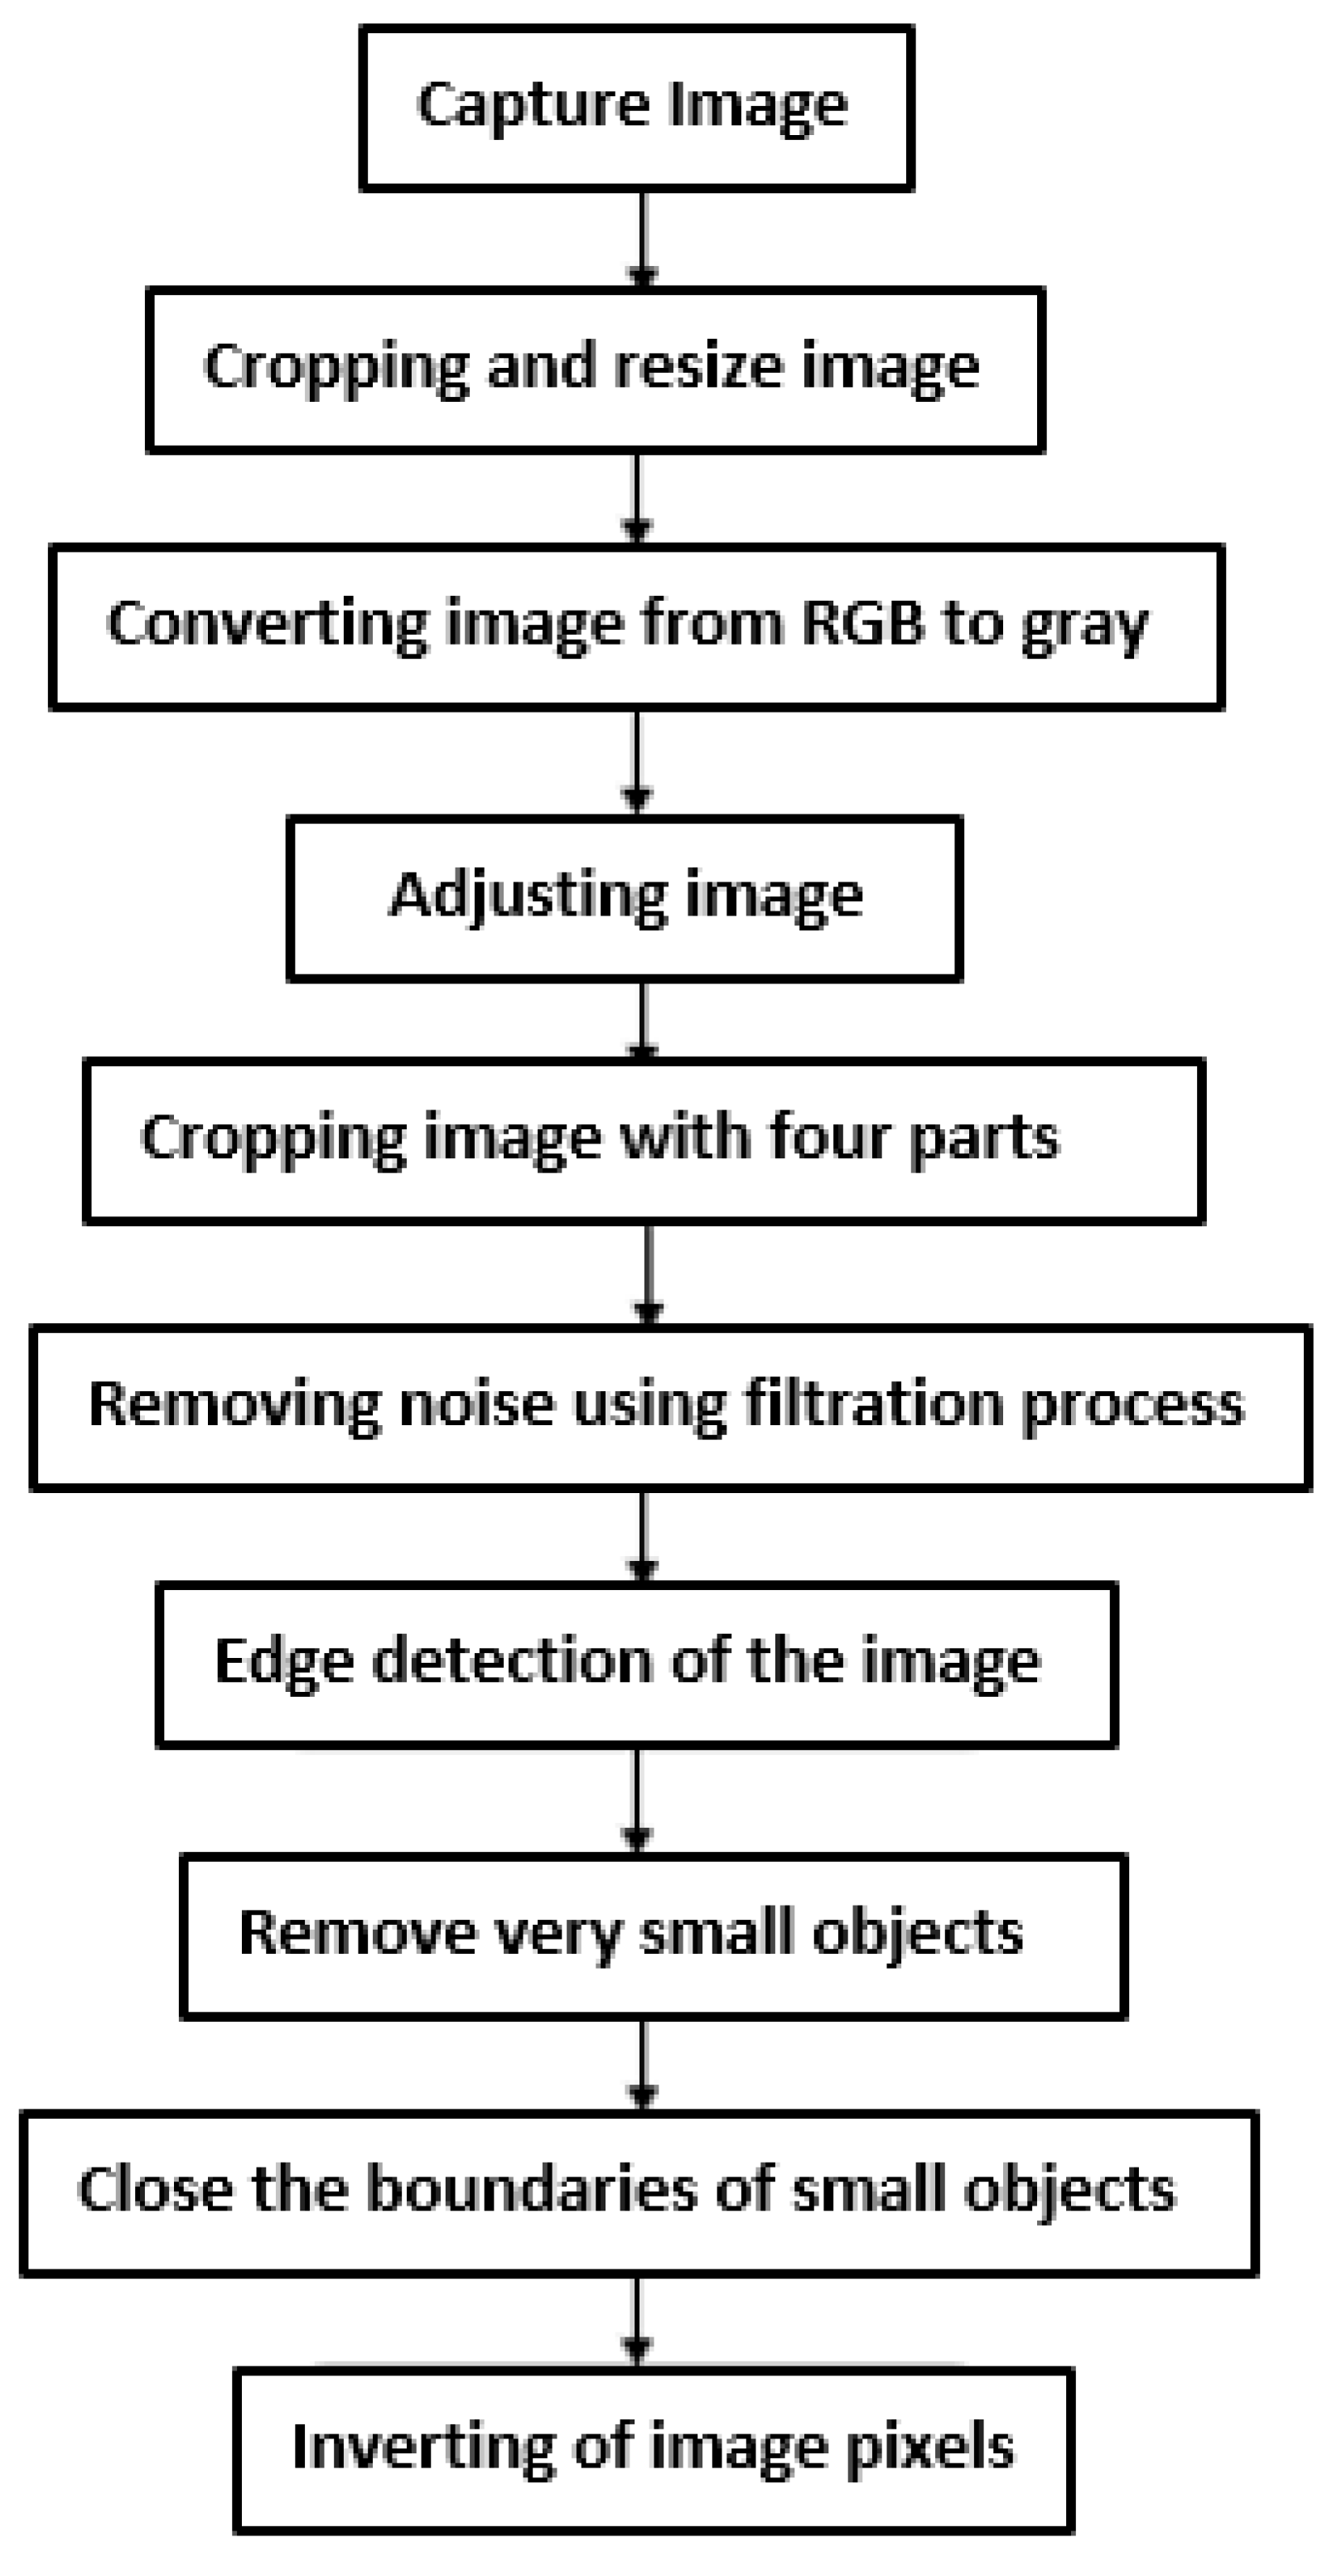
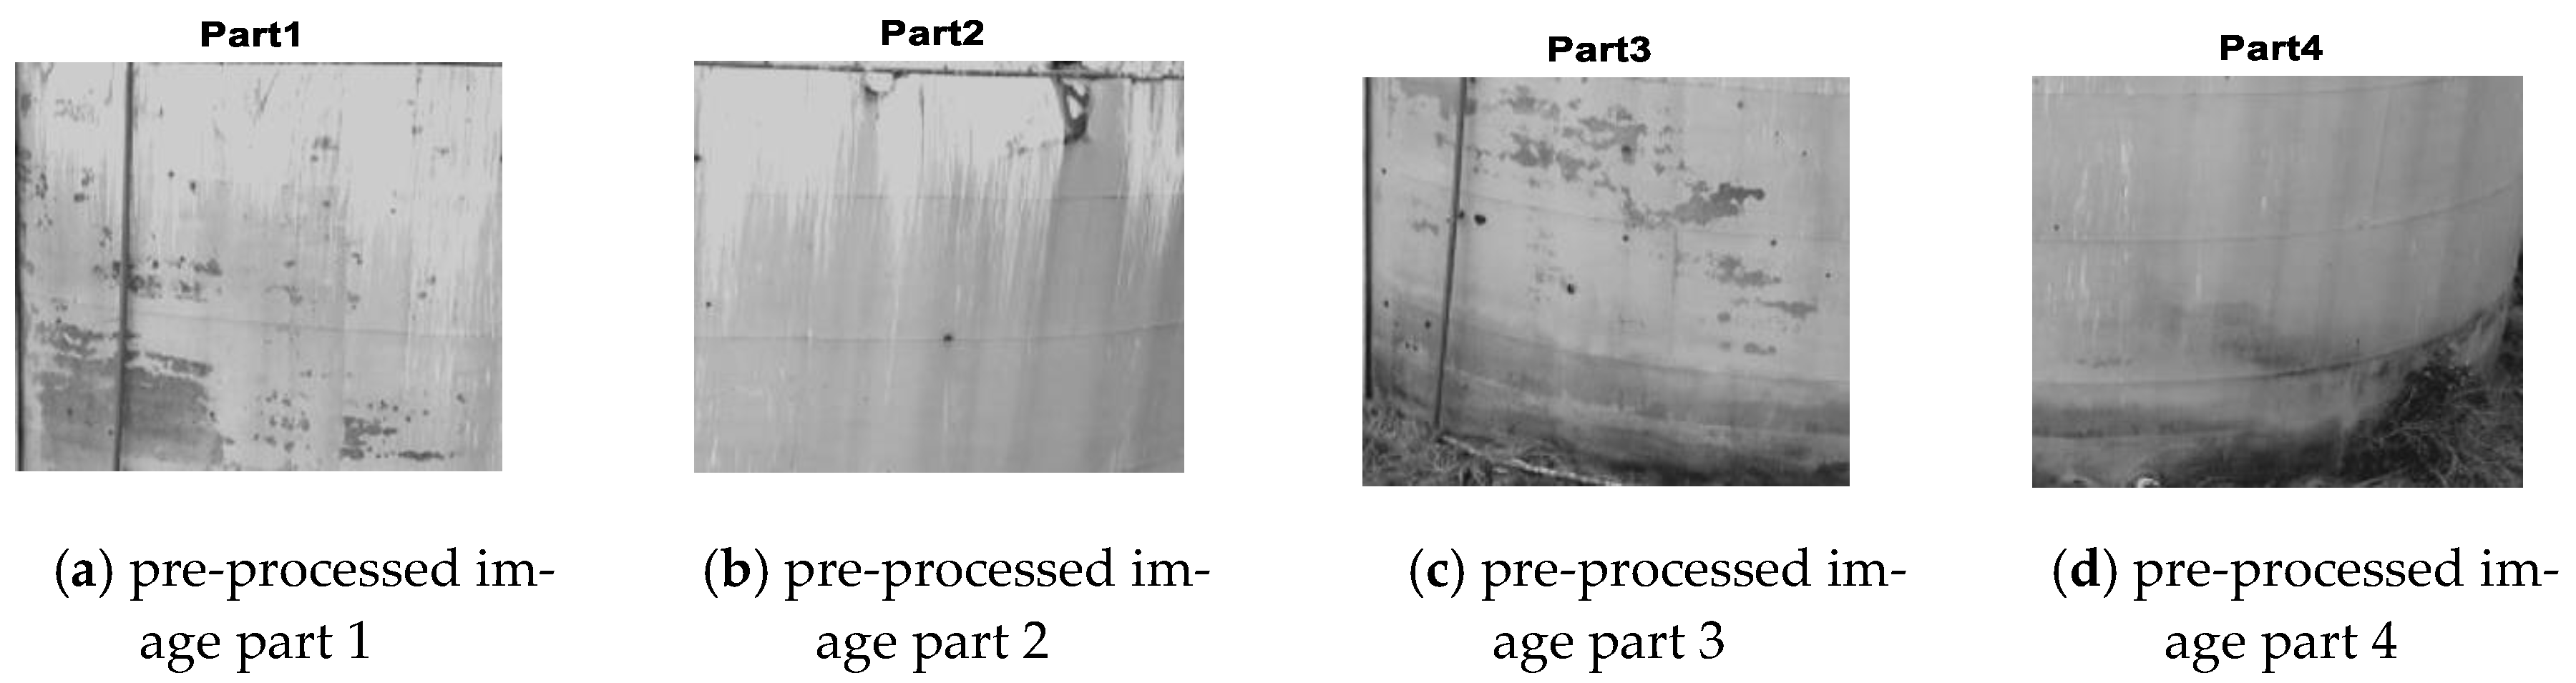
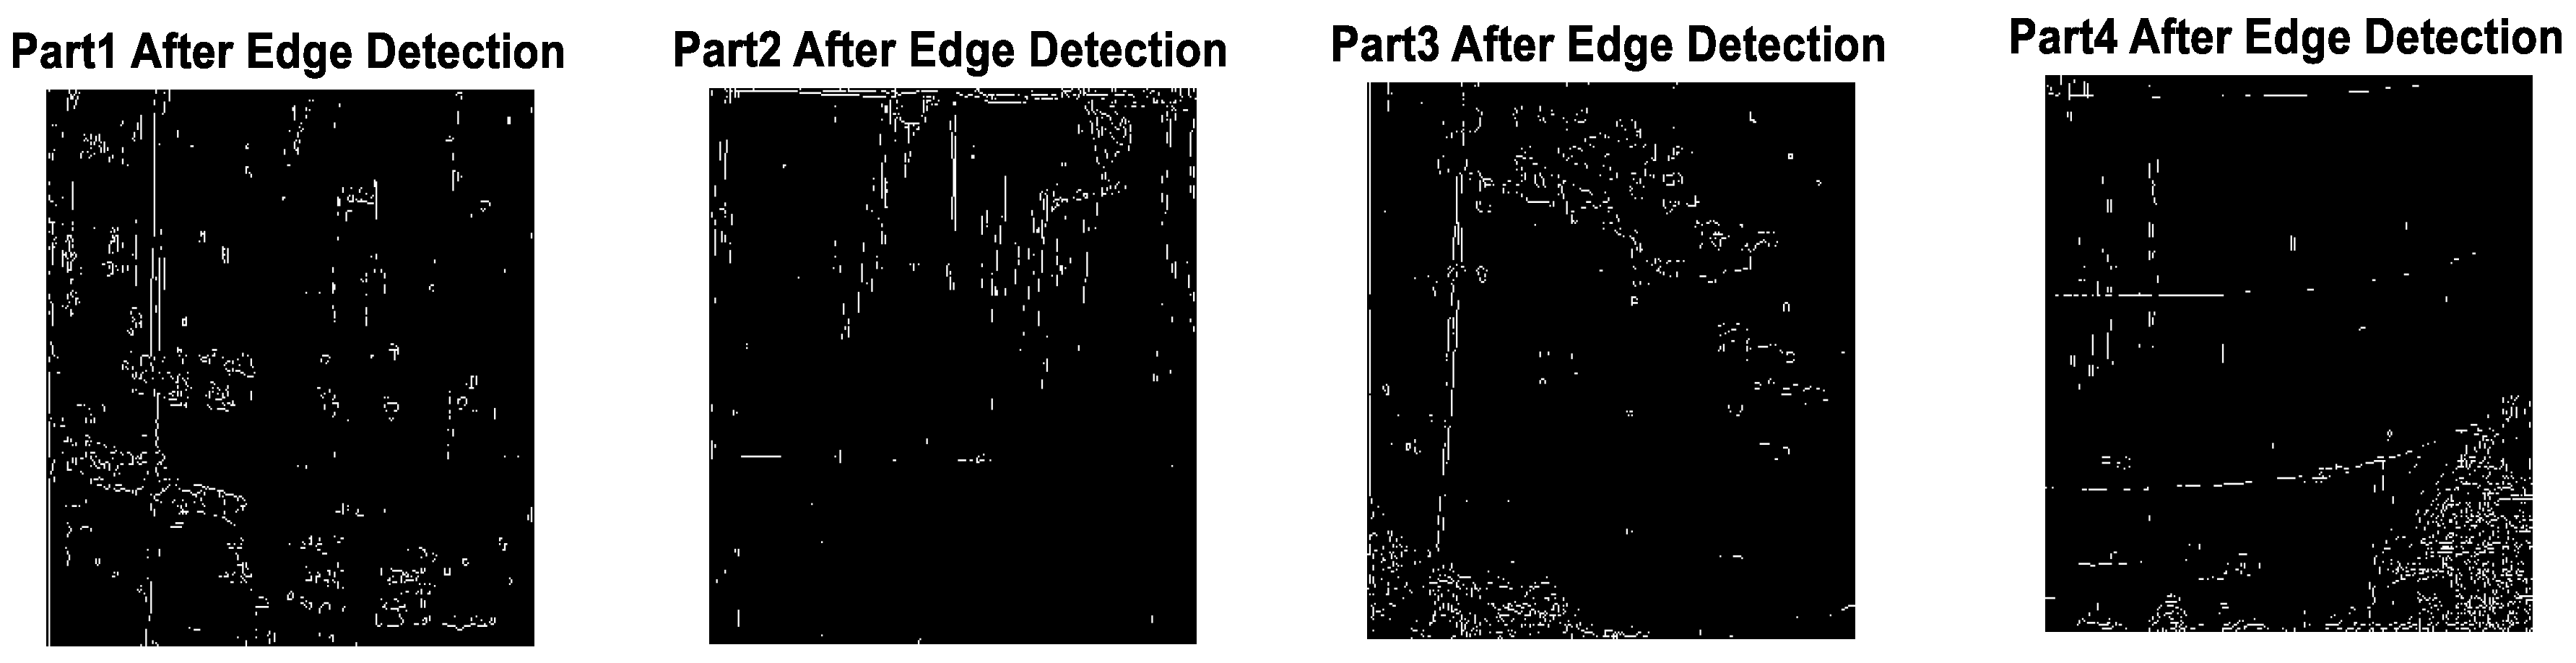
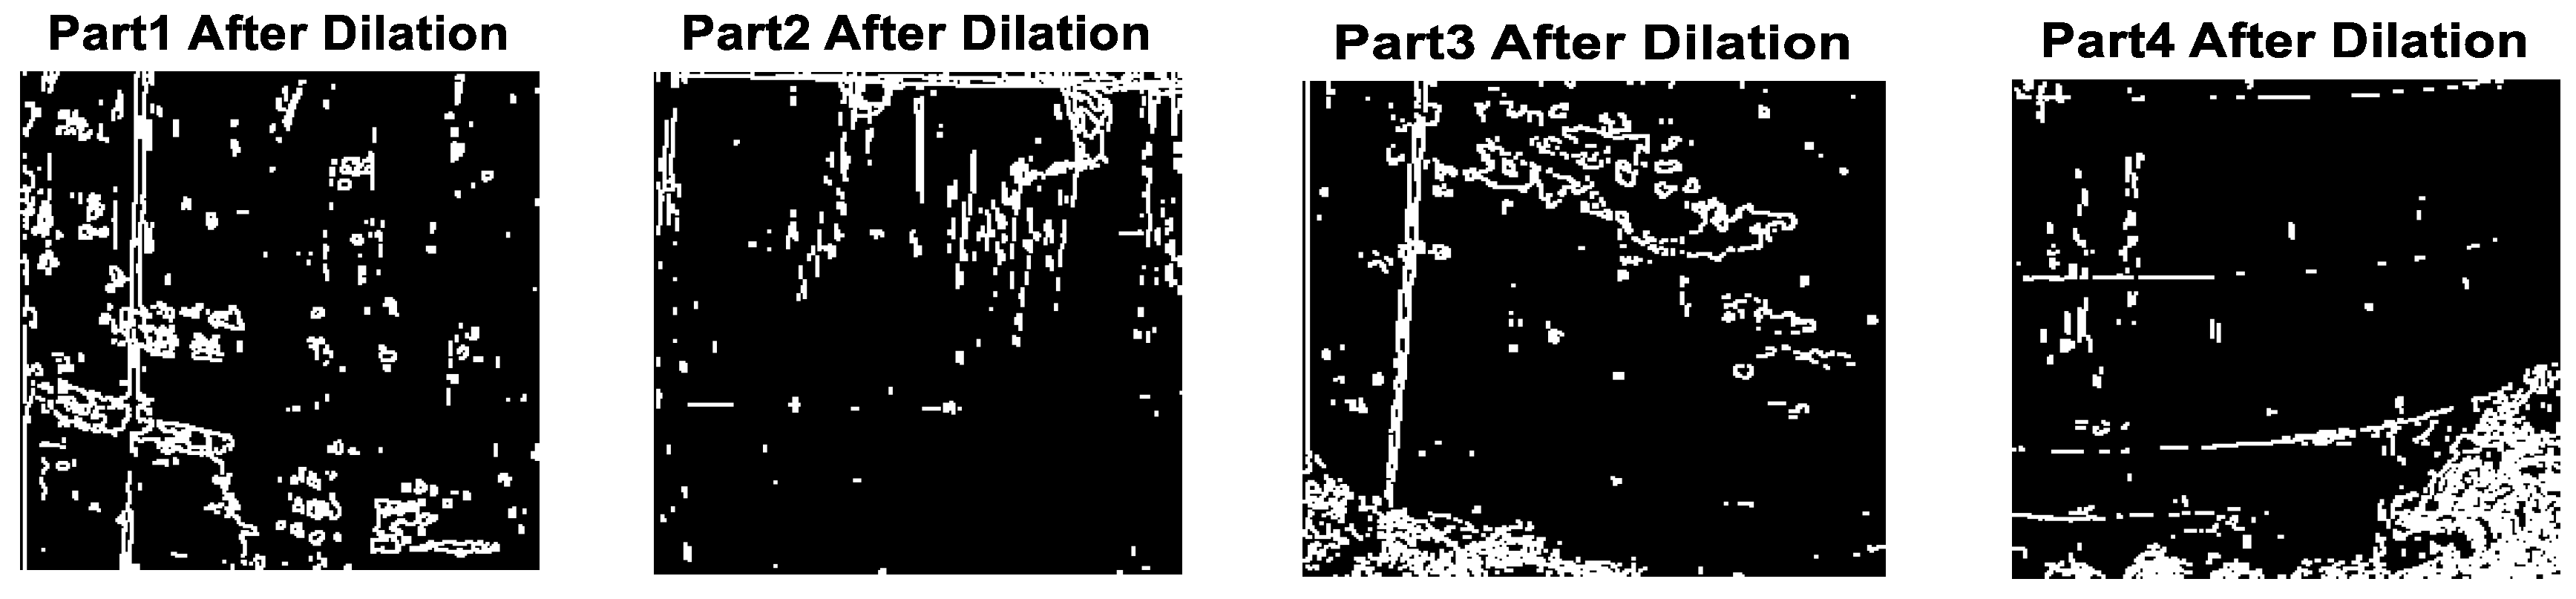
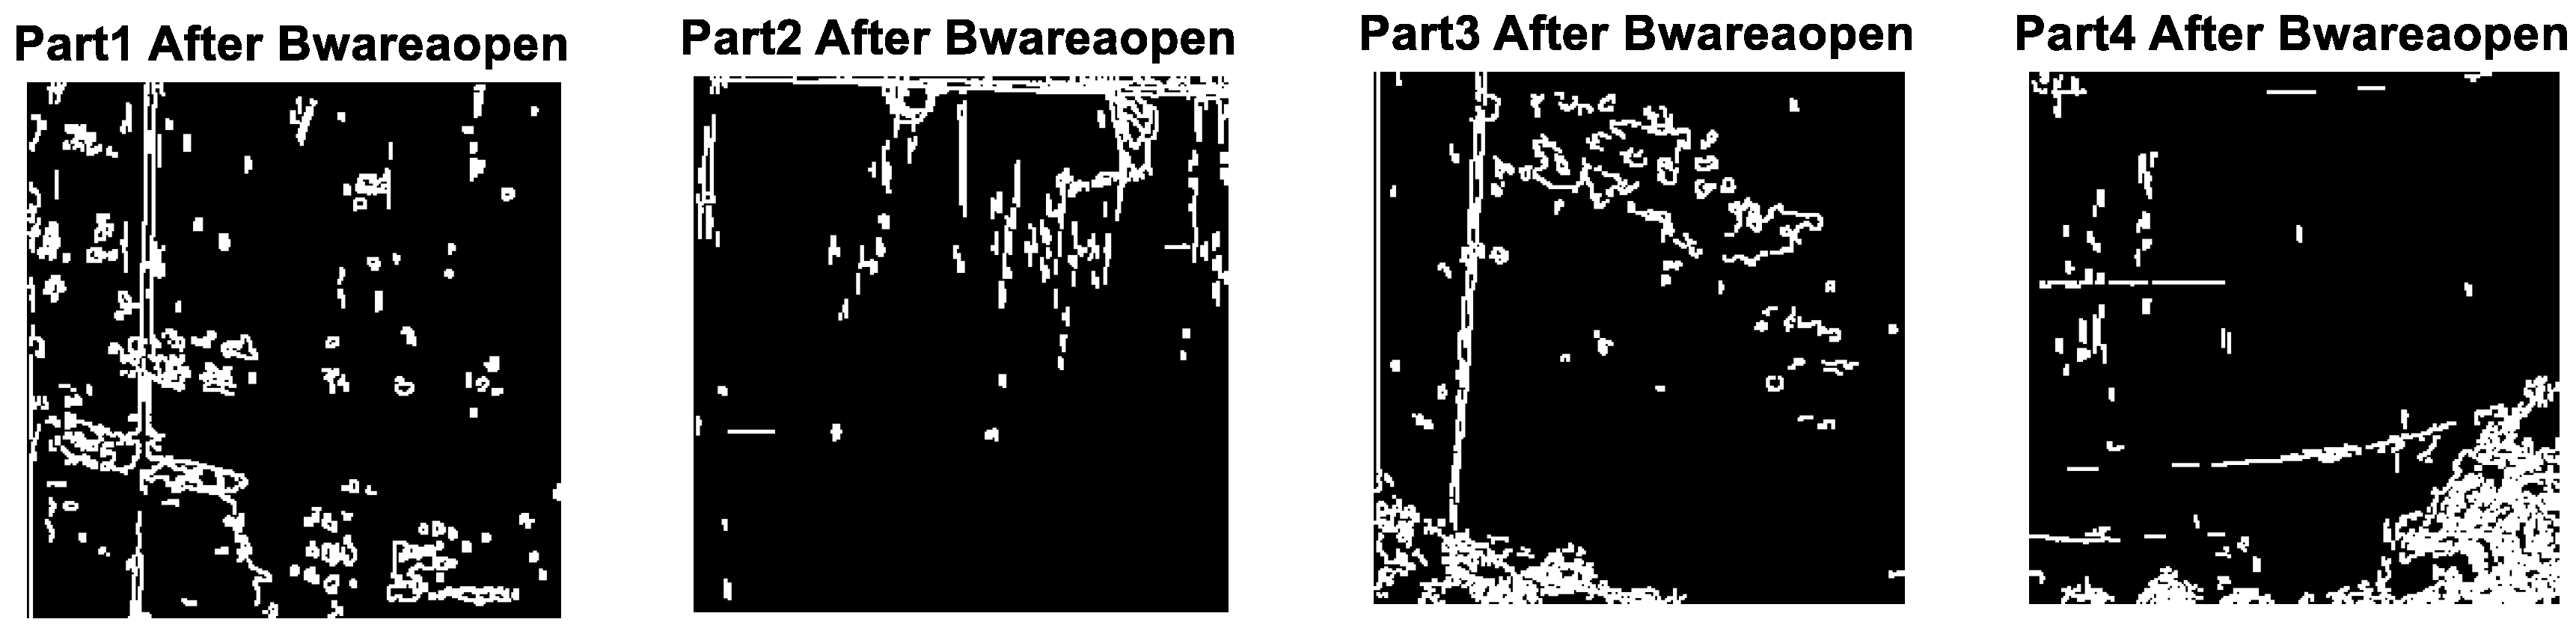
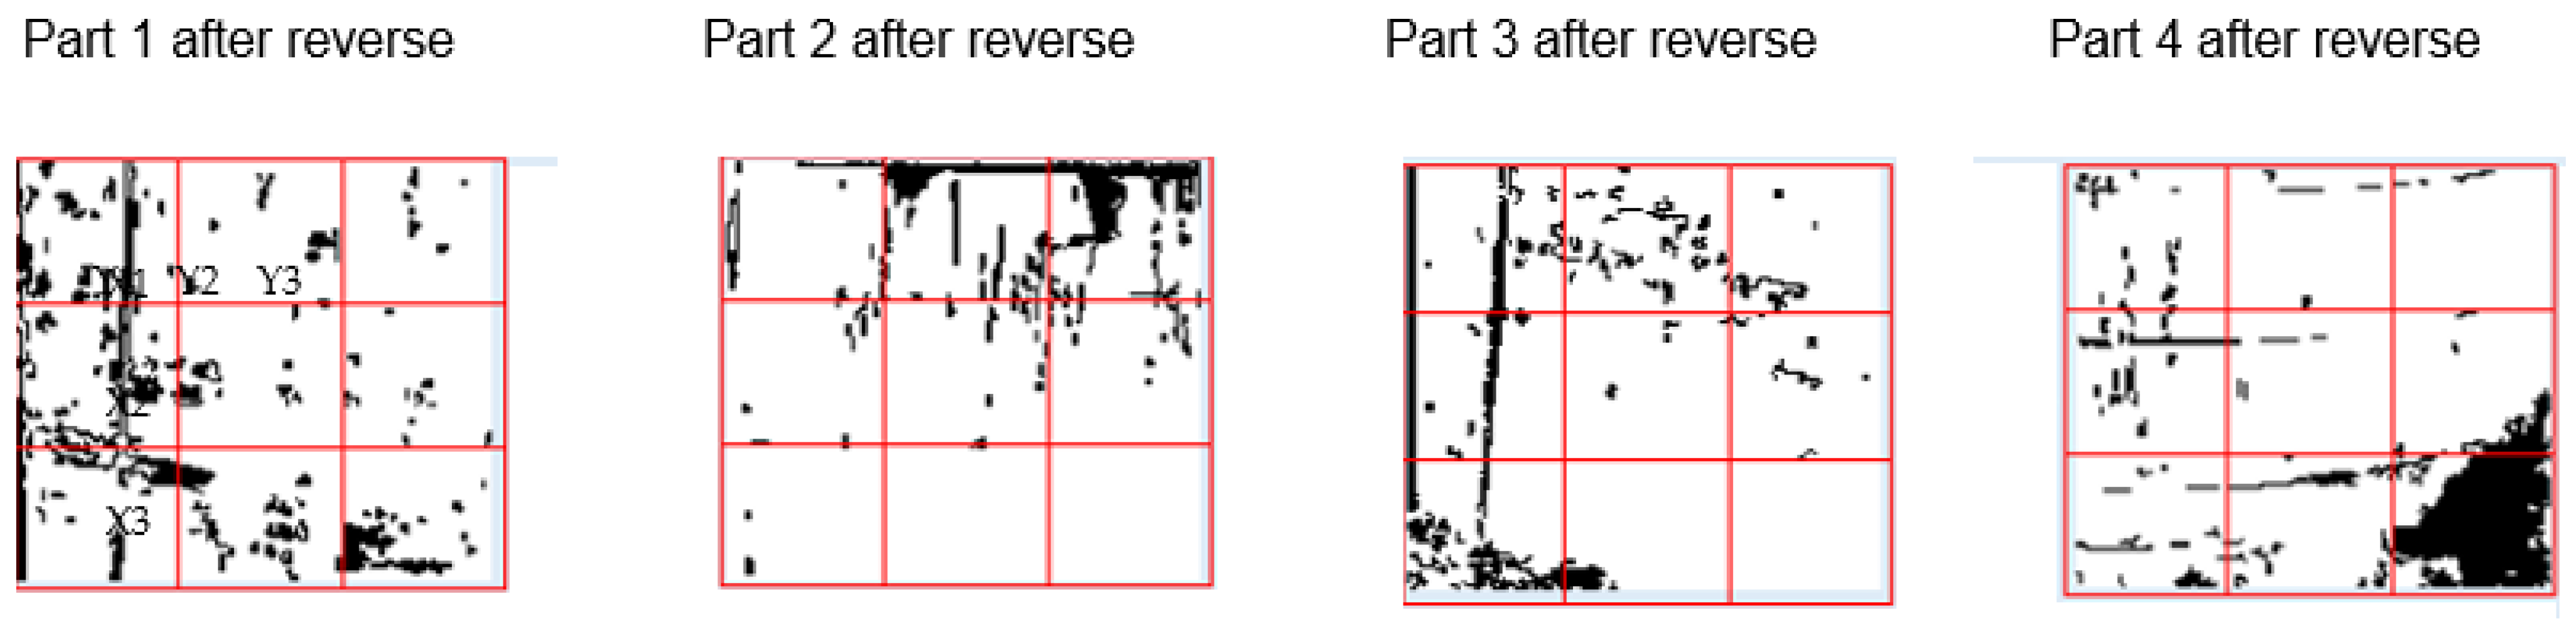
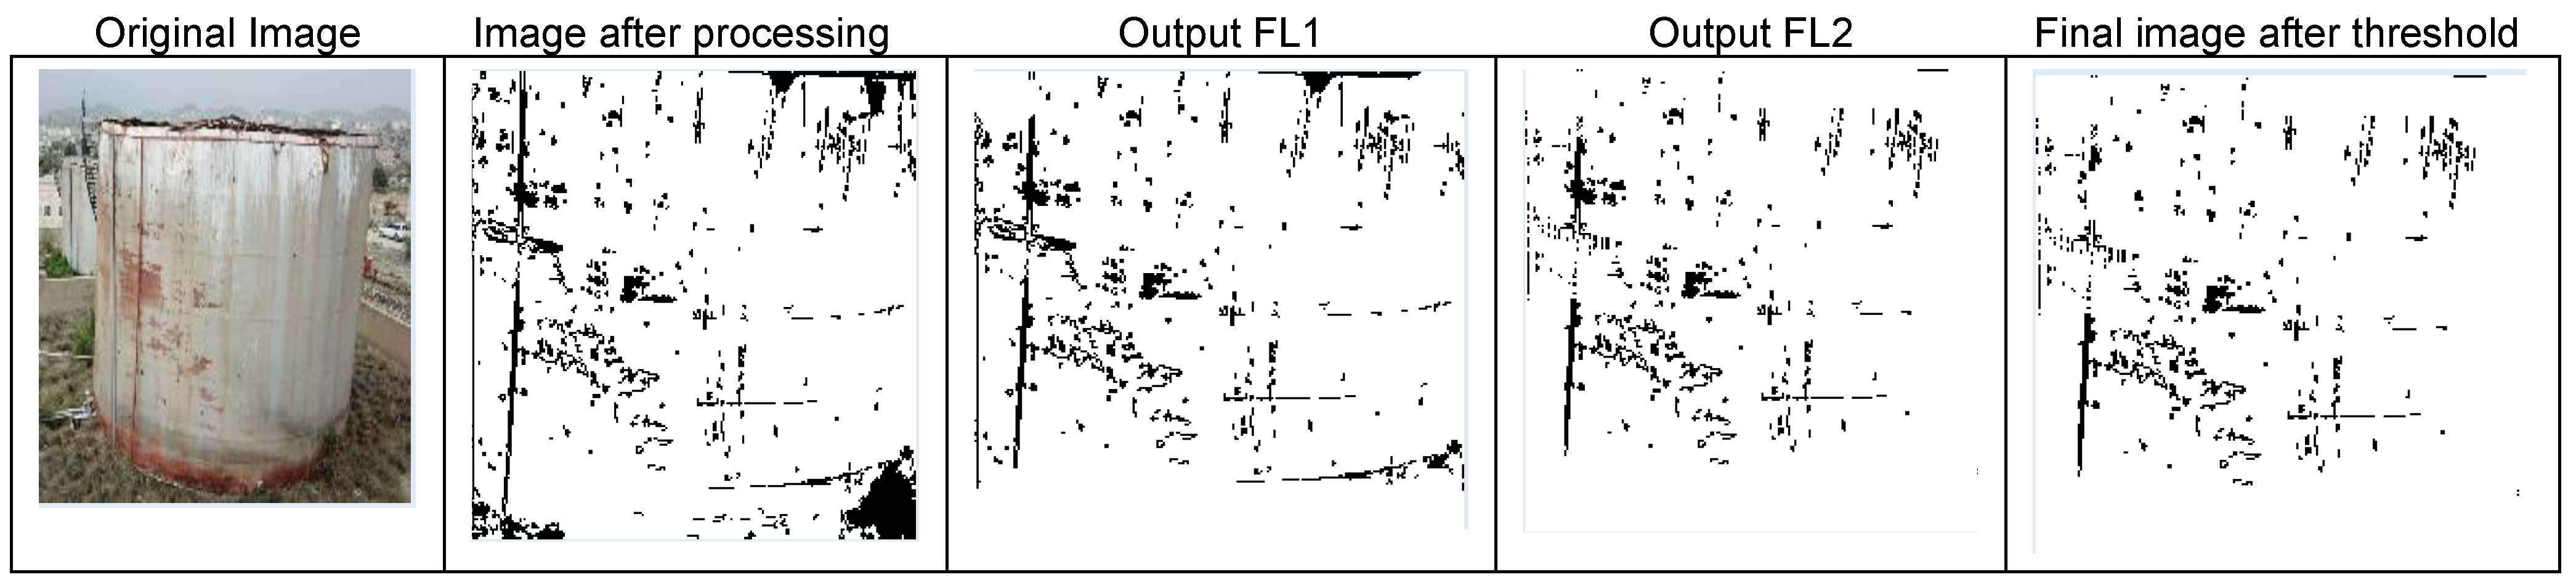
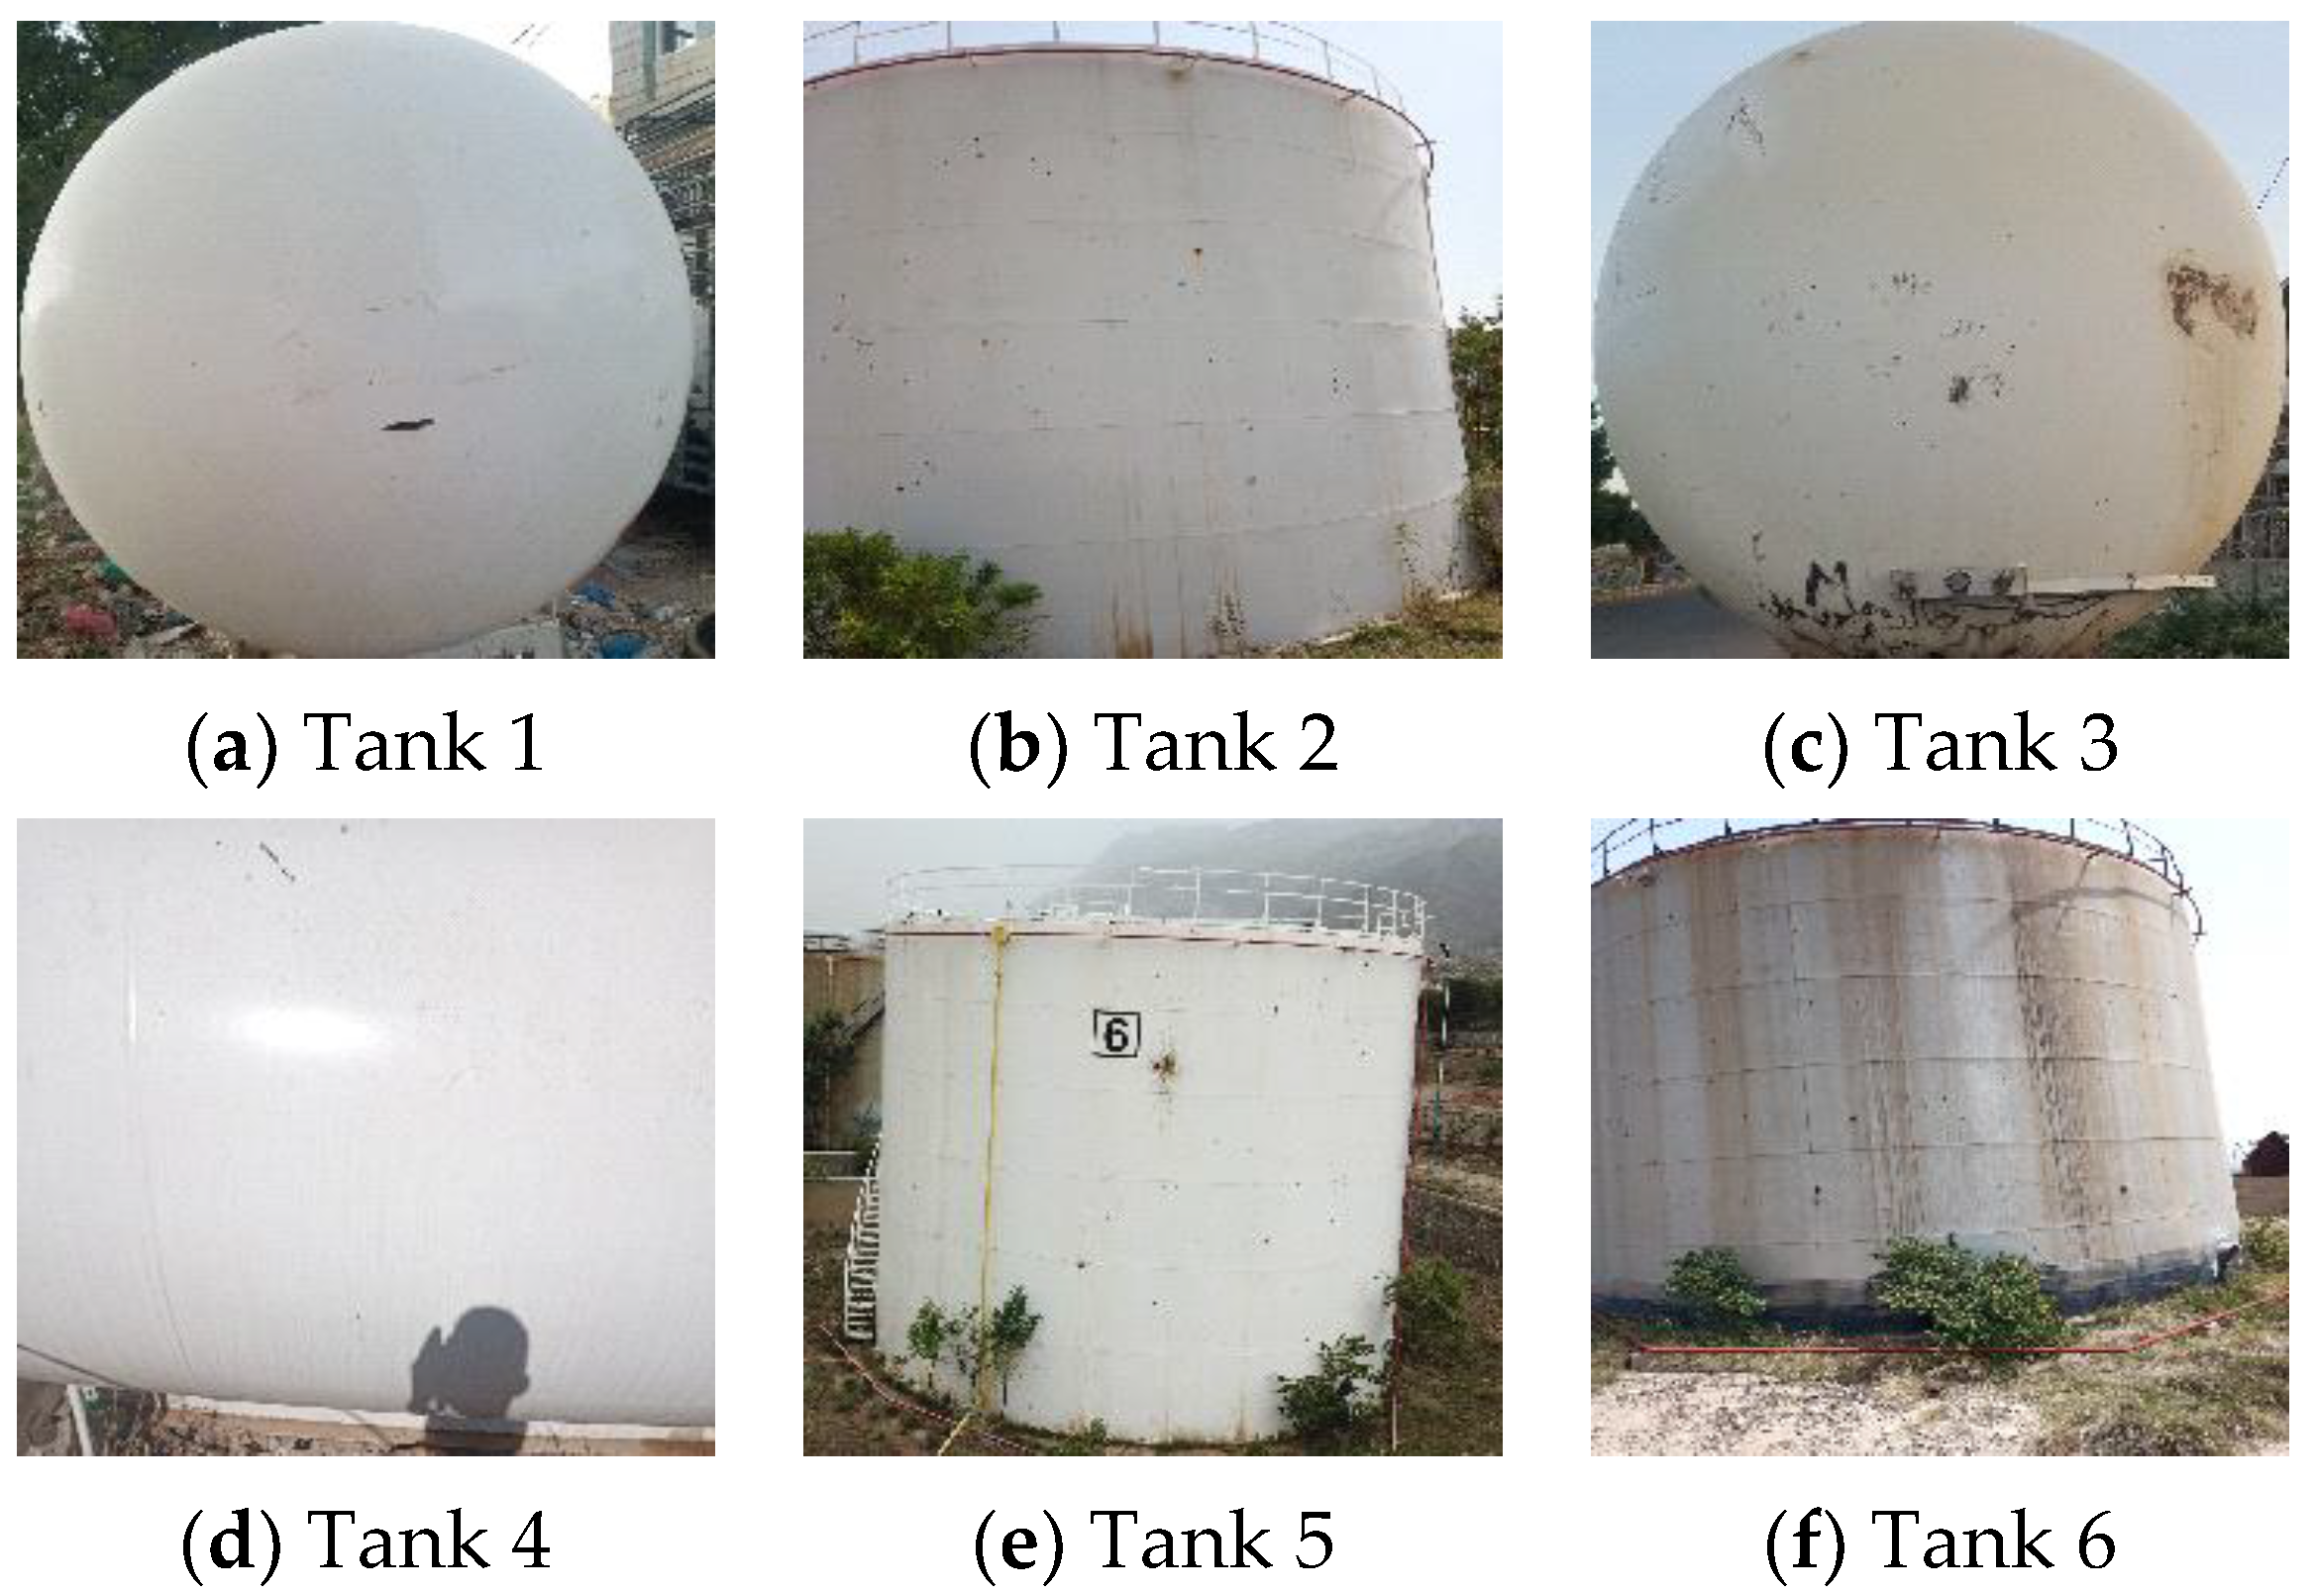
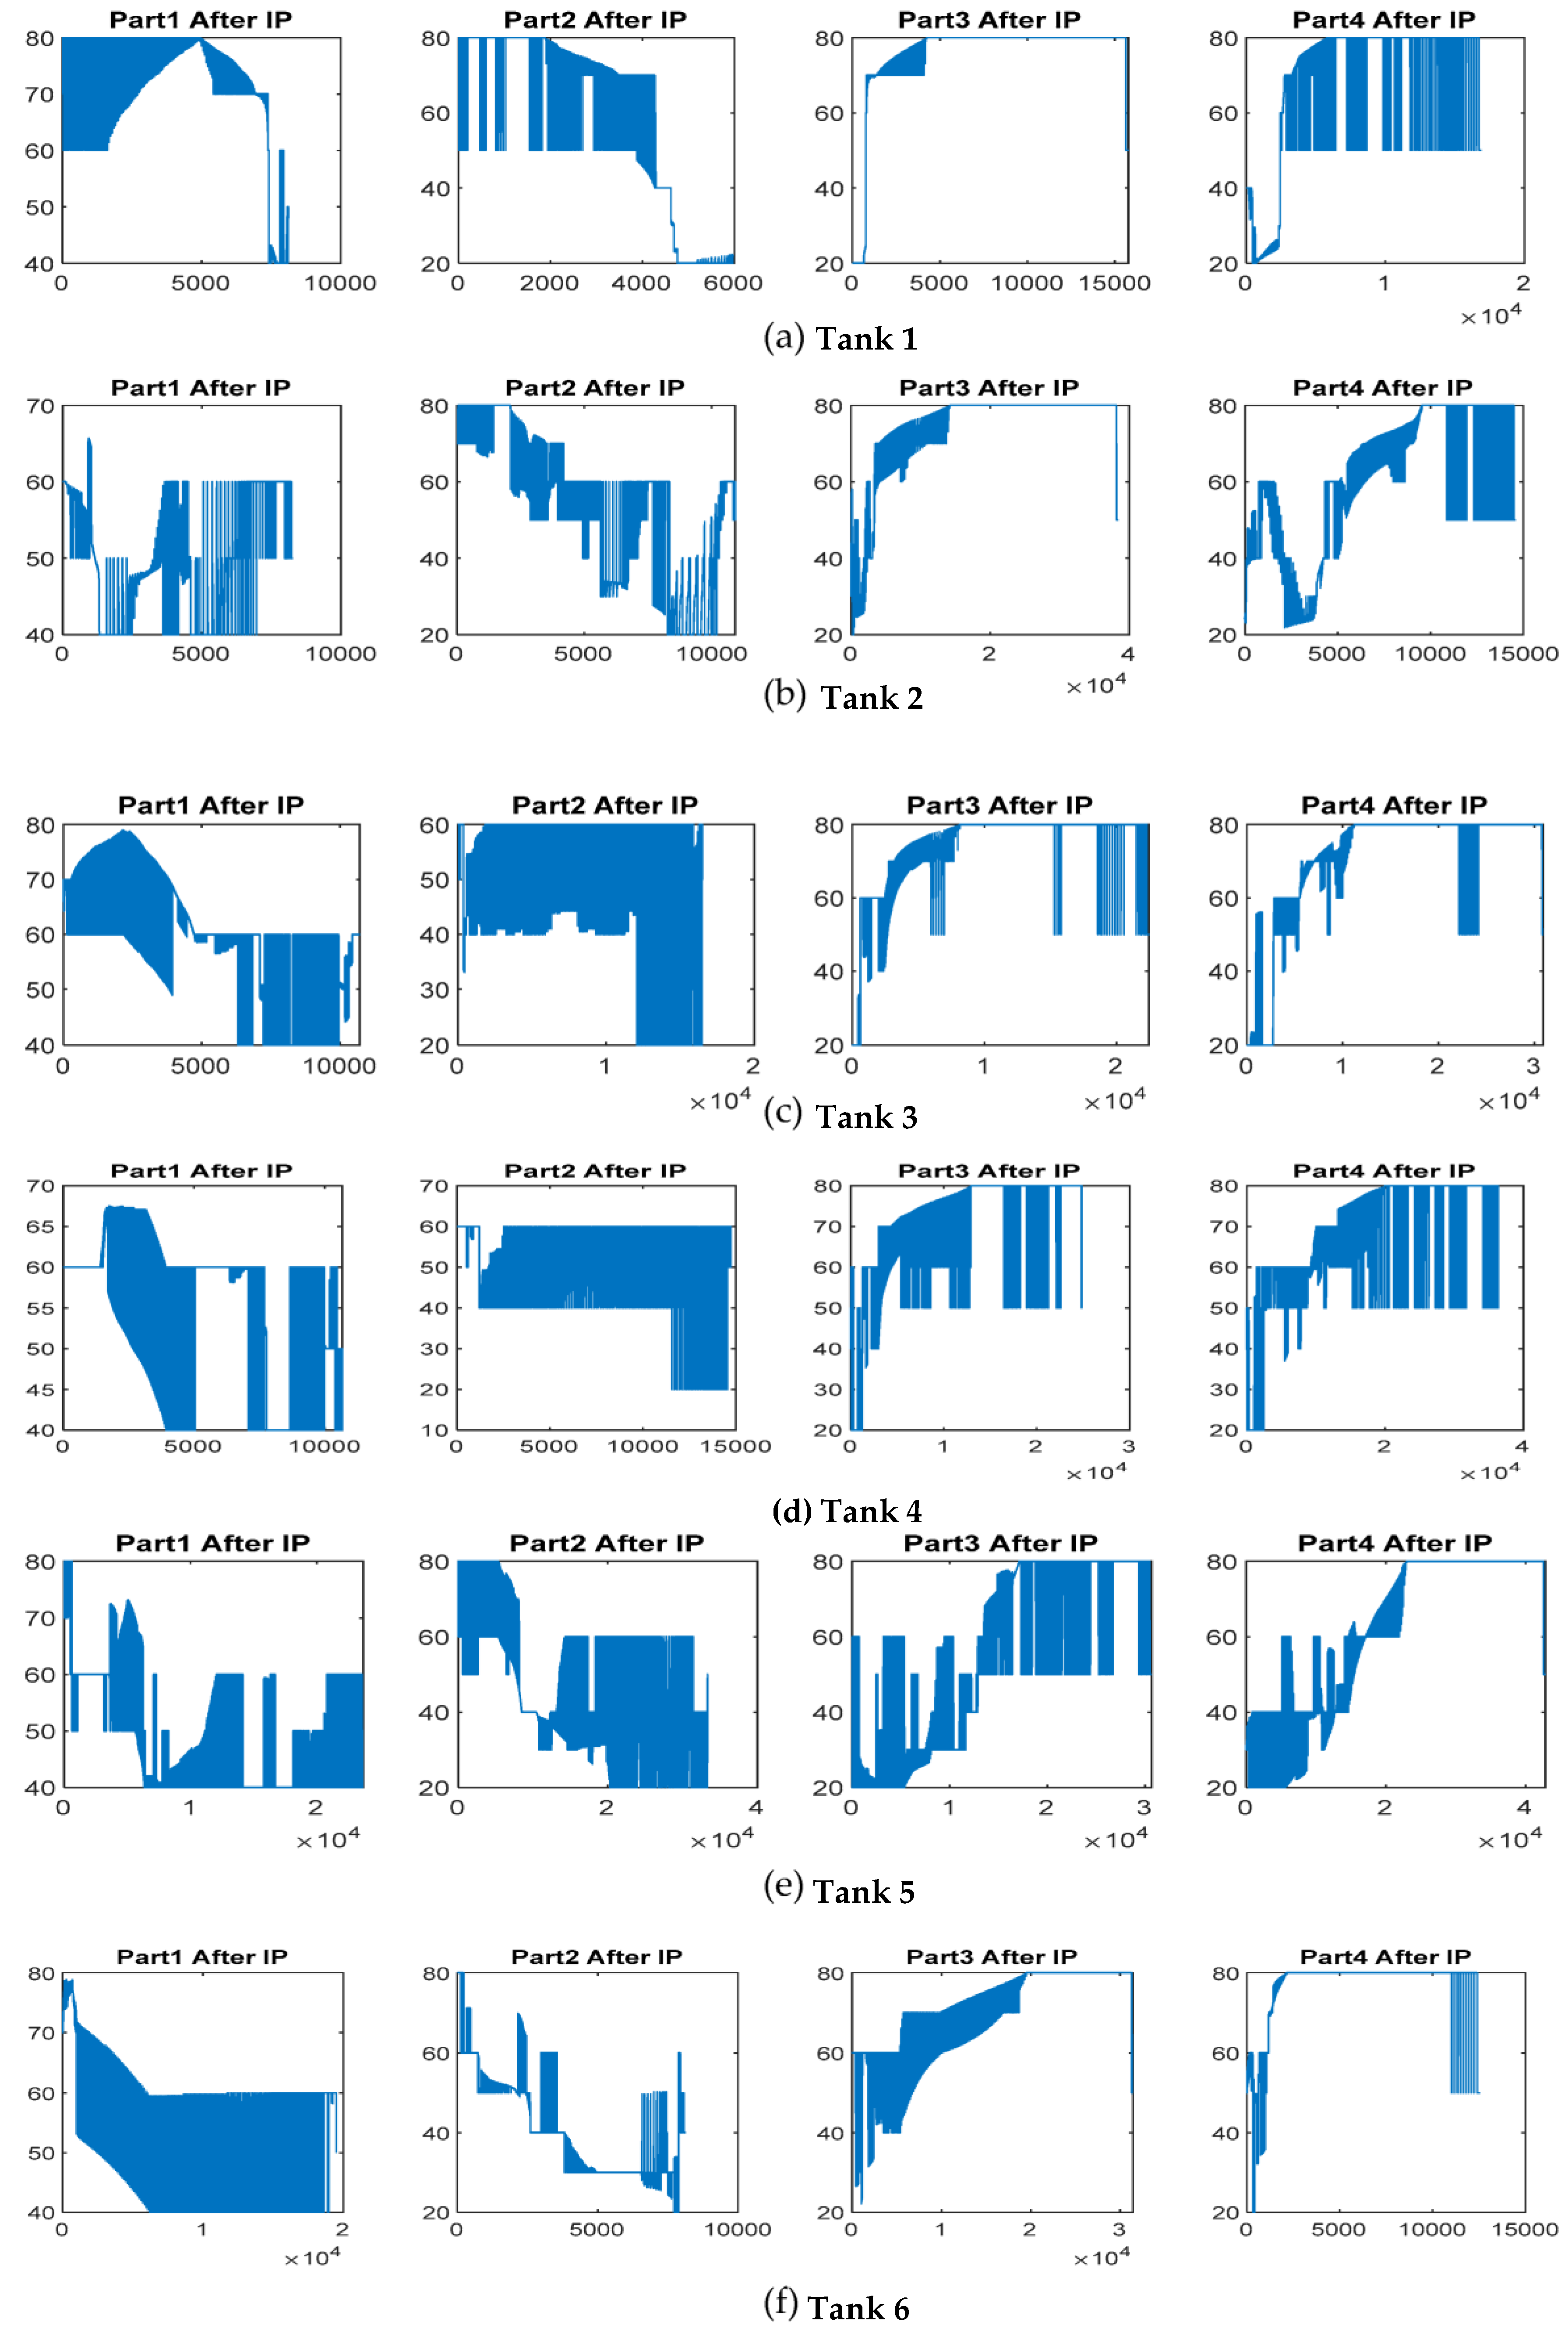
The algorithm of image processing as described in
Section 2.2 was implemented to detect the surface defects of the six types of oil tanks in
Figure 23. The image processing results for all samples are shown in
Figure 24.
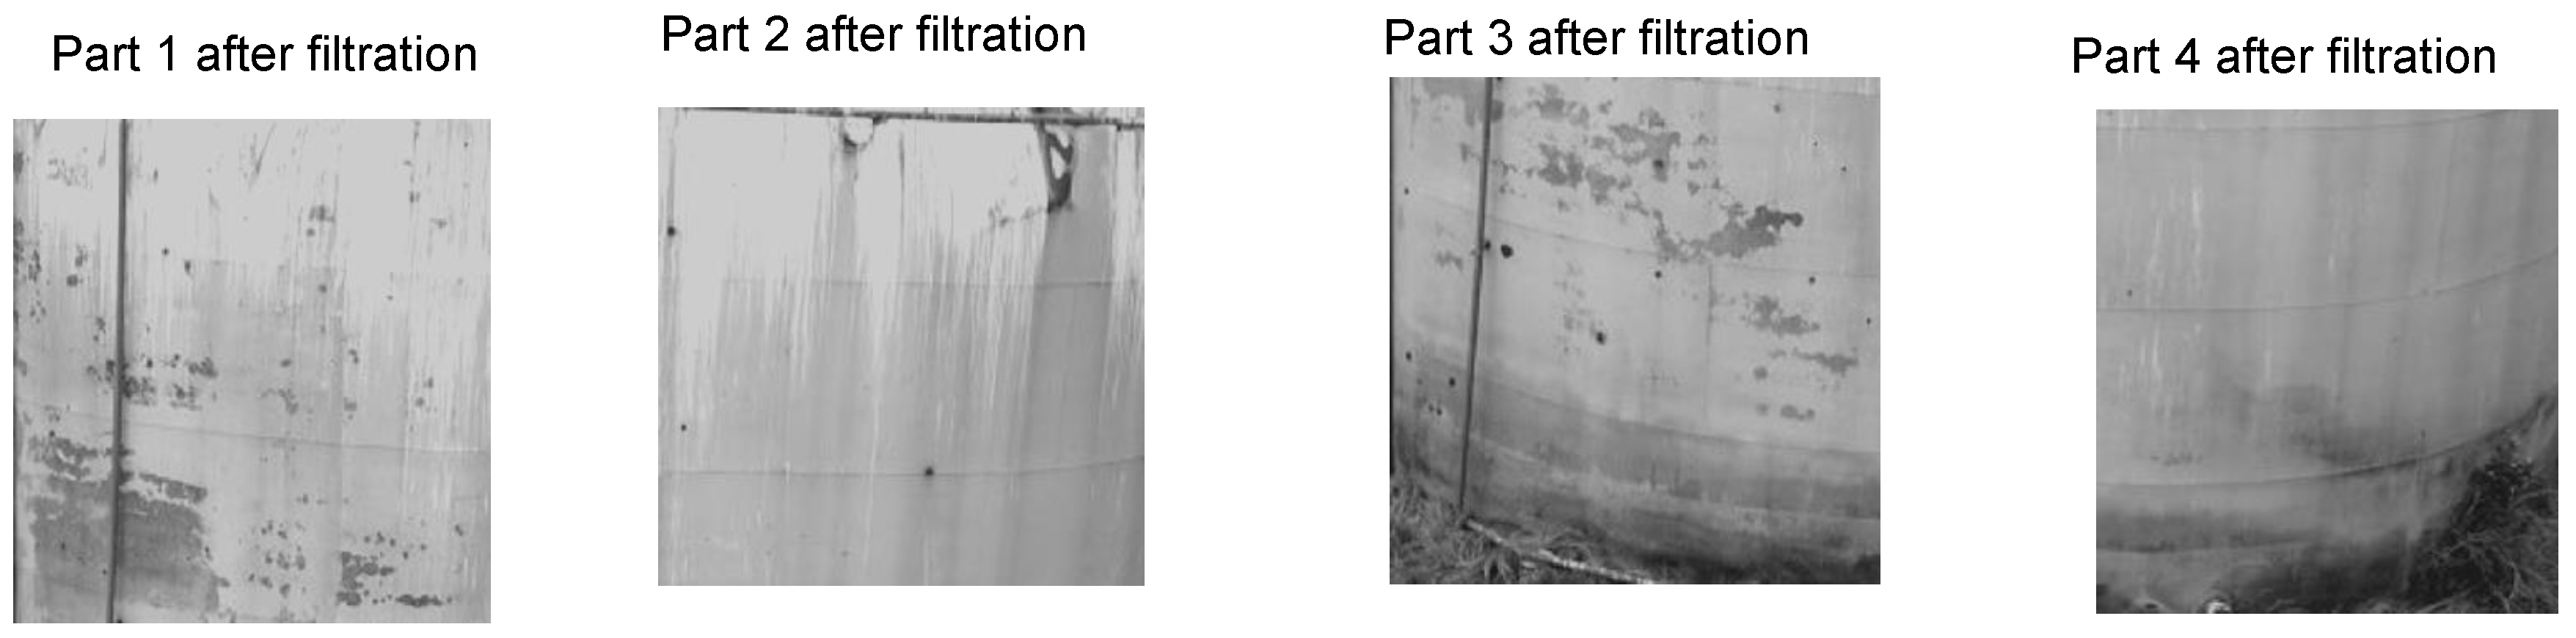
As mentioned above, the image processing algorithm cannot eliminate all noise from an image and thus is unable to make a definitive decision if the tank has defects or noise. Noises affecting the classification process have been divided into three different levels, namely, low, medium, and high noise. These noises cannot be eliminated completely by the image processing algorithm due to several factors affecting the processing, such as heterogeneity of illumination on the surface of the tank, the presence of objects appearing on the surface of the tank, and the presence of sediments or dirt on the surface of the tank.
It is clear that the peripheral, lower regions, and corners of the tanks are strongly affected by noise as shown in
Figure 23. In
Figure 24, the results indicate that there is no noise in the middle region of the tank in all images, while some defects may exist without any noise affecting it. As shown in
Figure 24, the lower regions are the noisiest regions (low noise), while the tank corners are the lowest noise regions. One cannot distinguish between defects and the three levels of noise until the algorithms of cascading fuzzy logic and the thresholding have been implemented on the image.
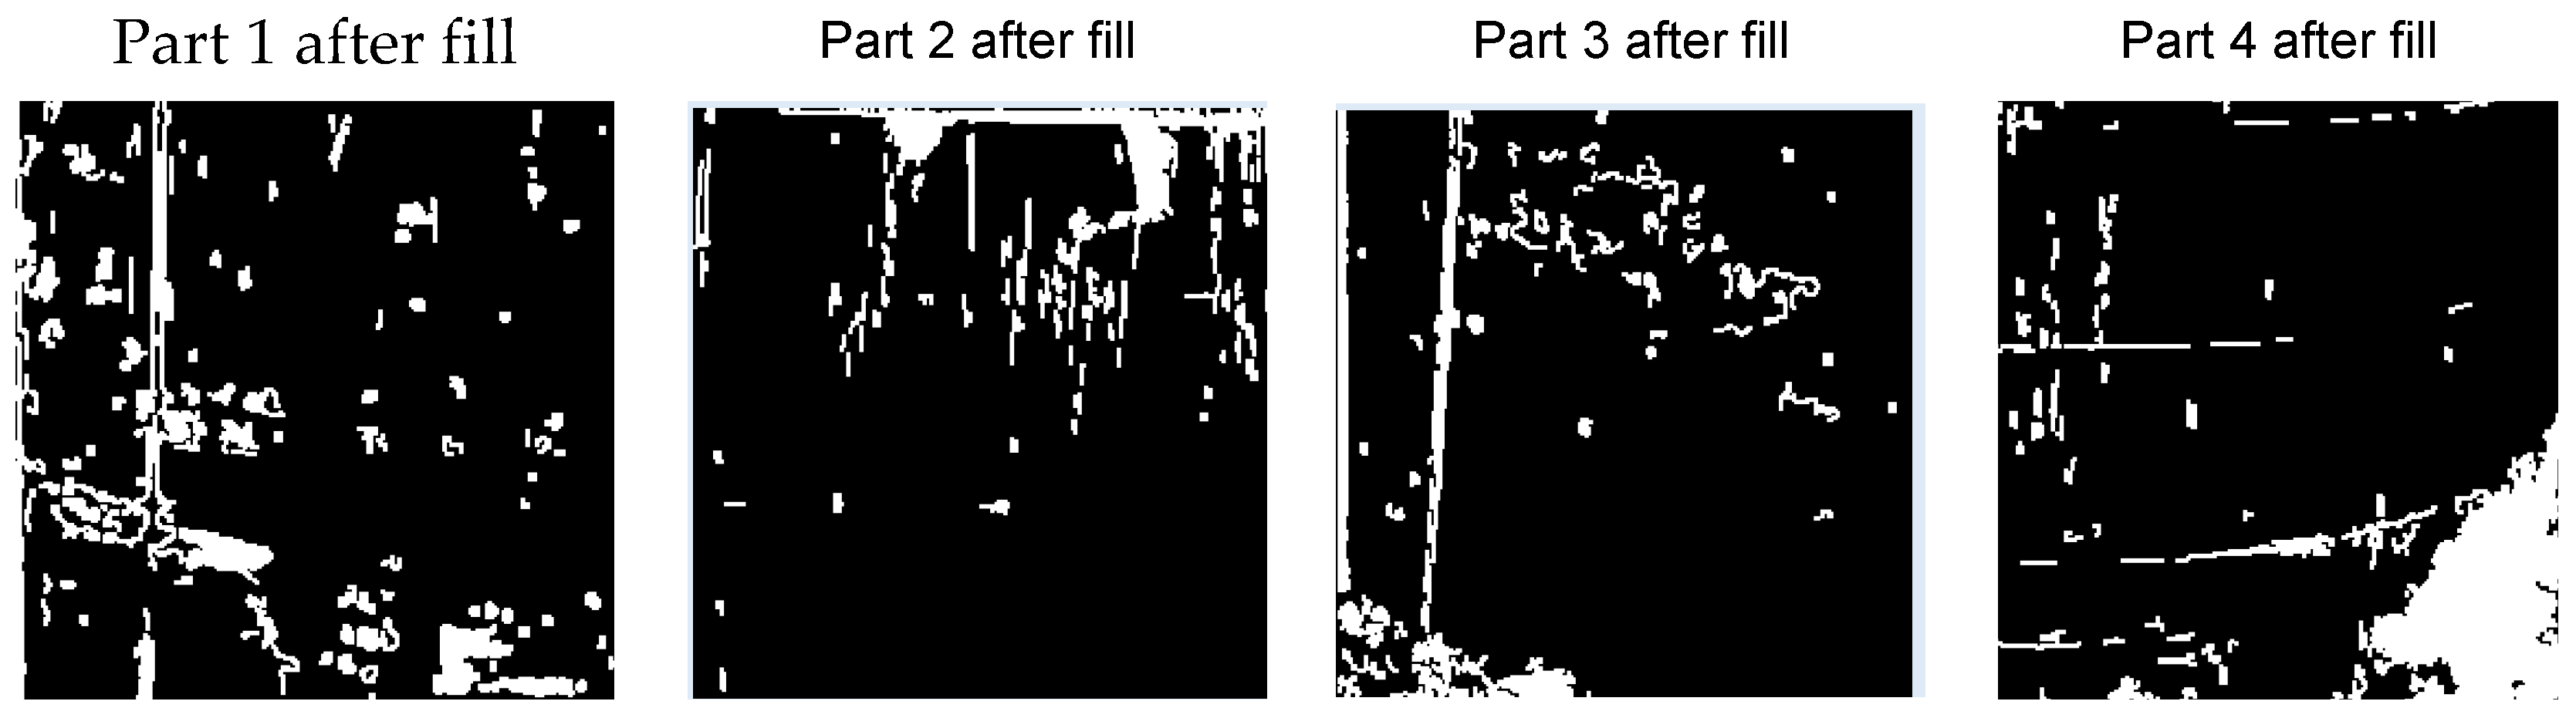
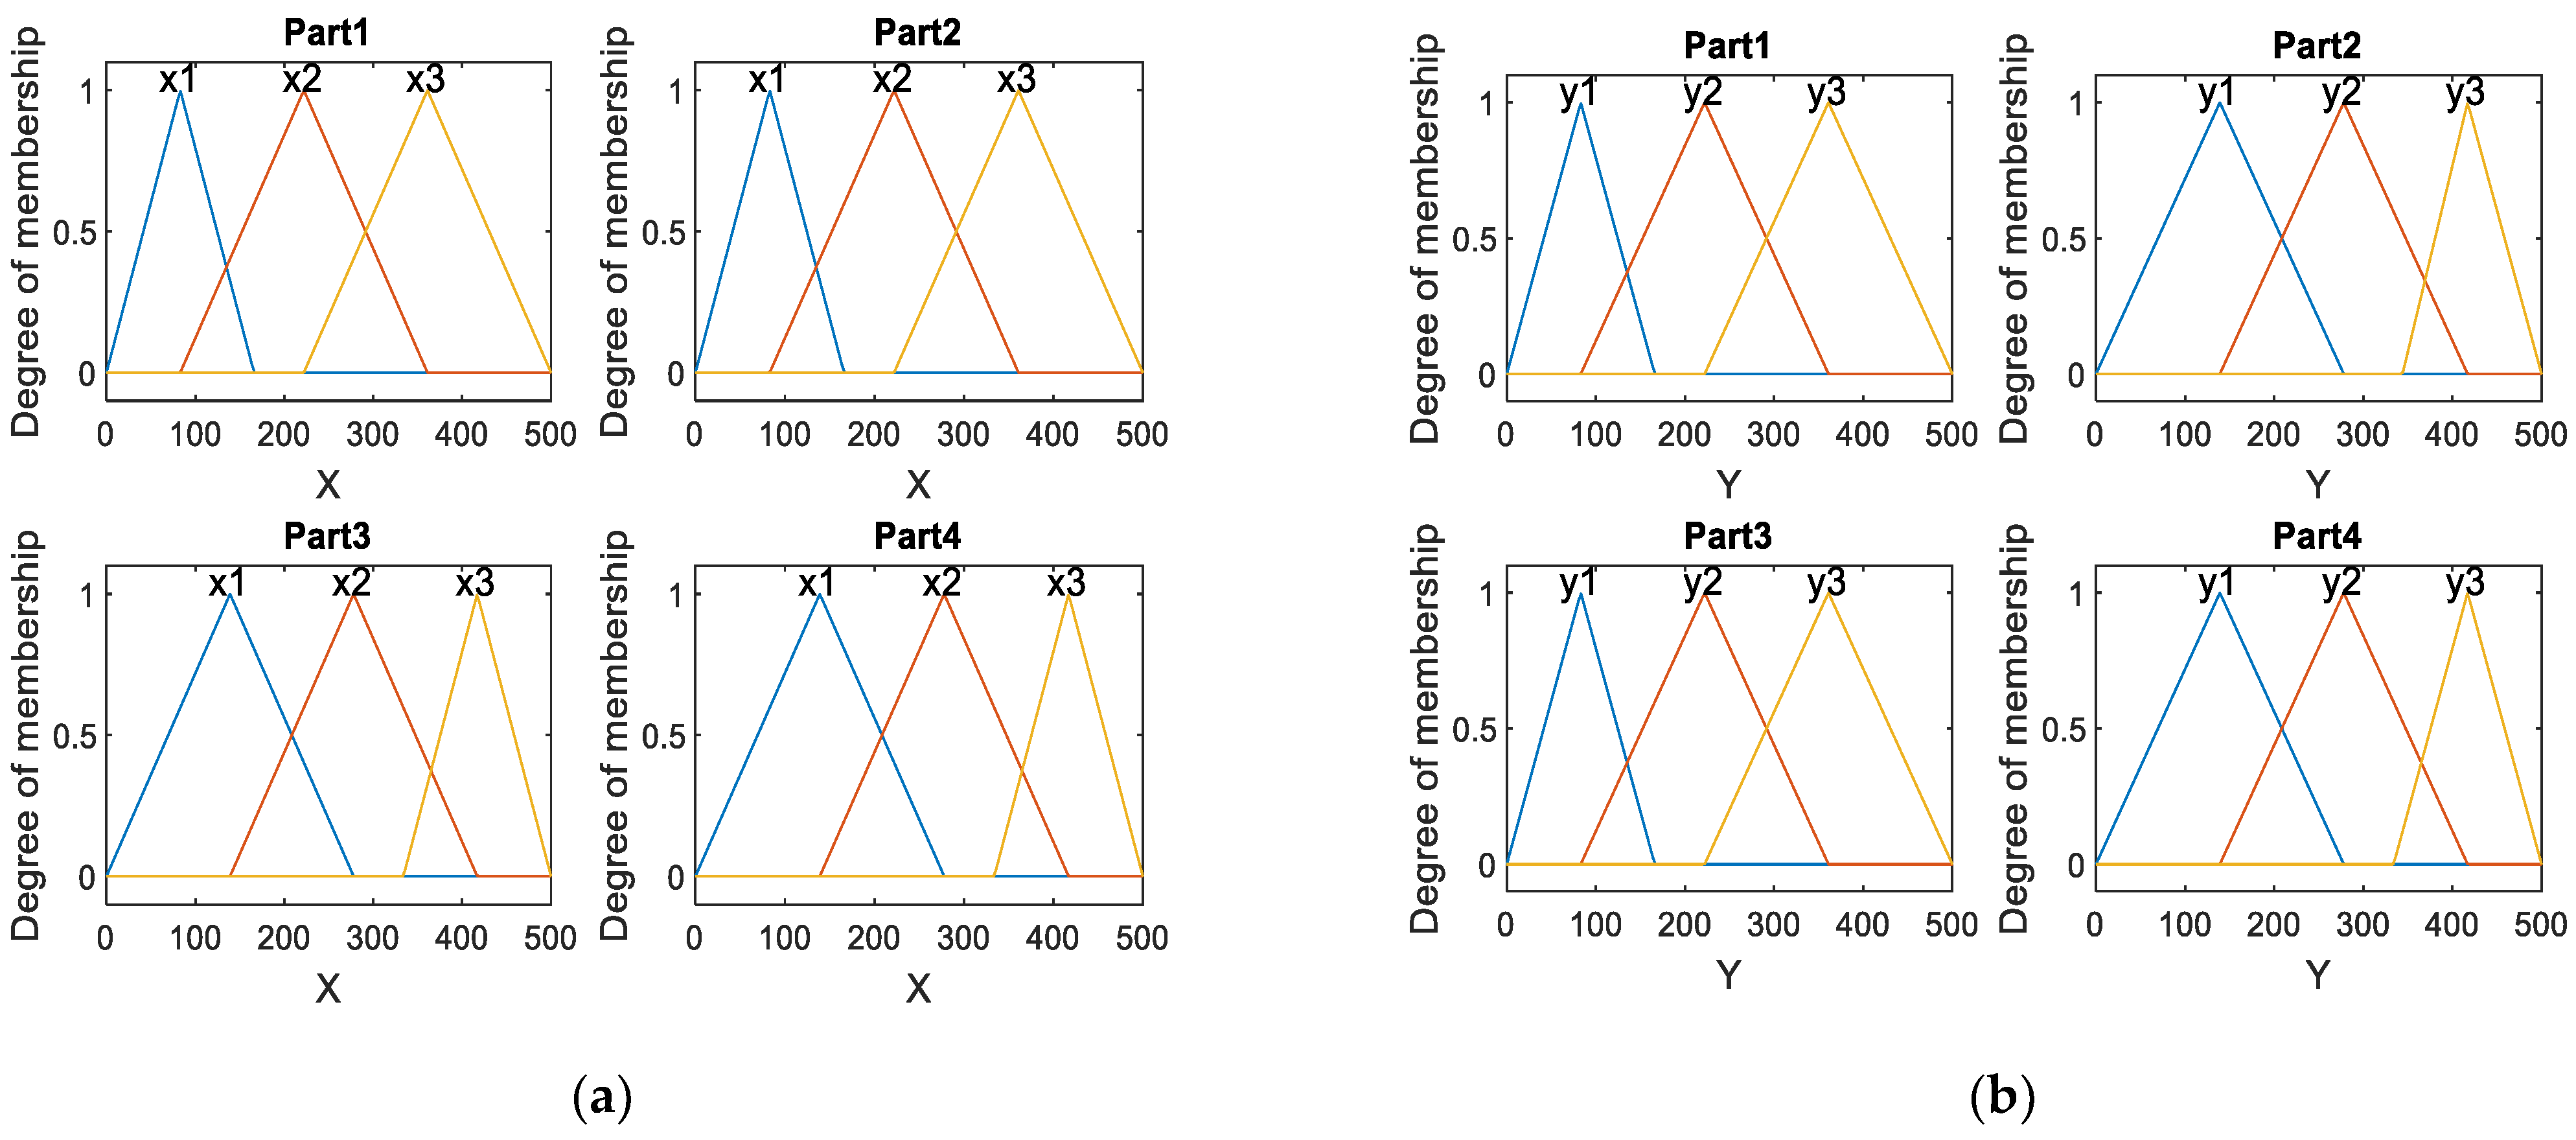
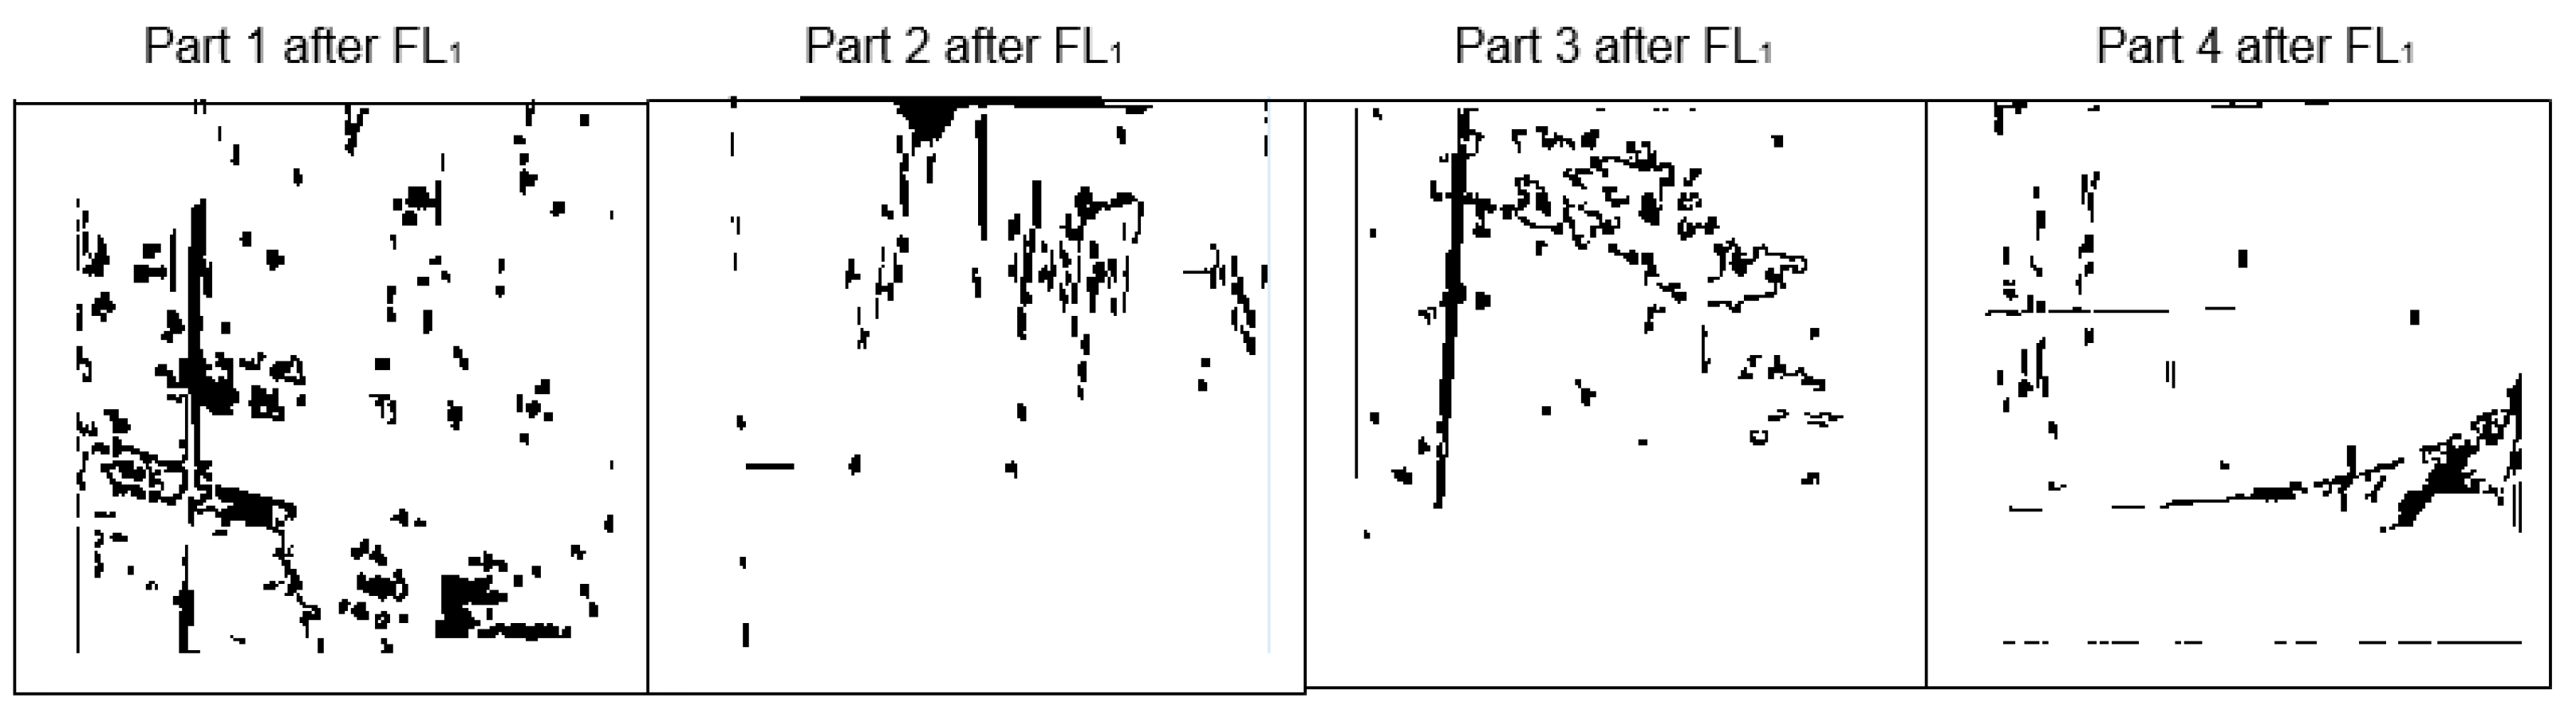
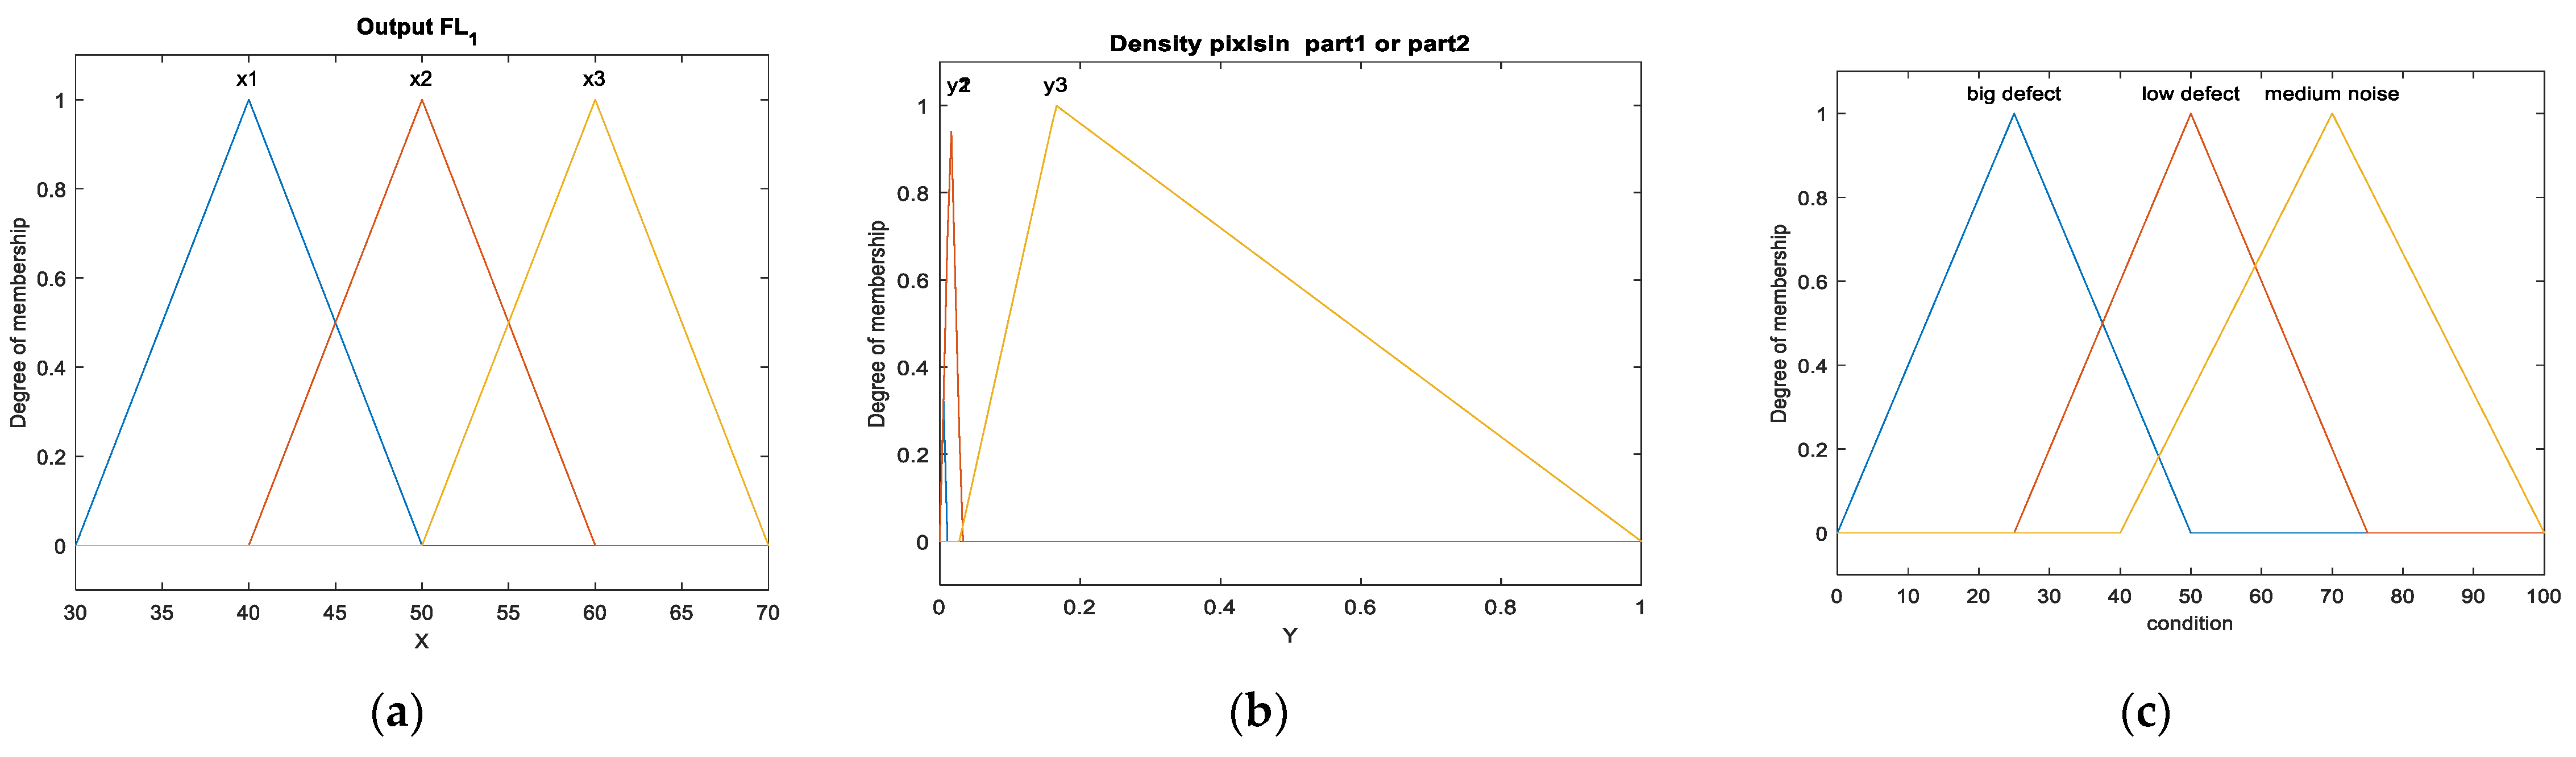
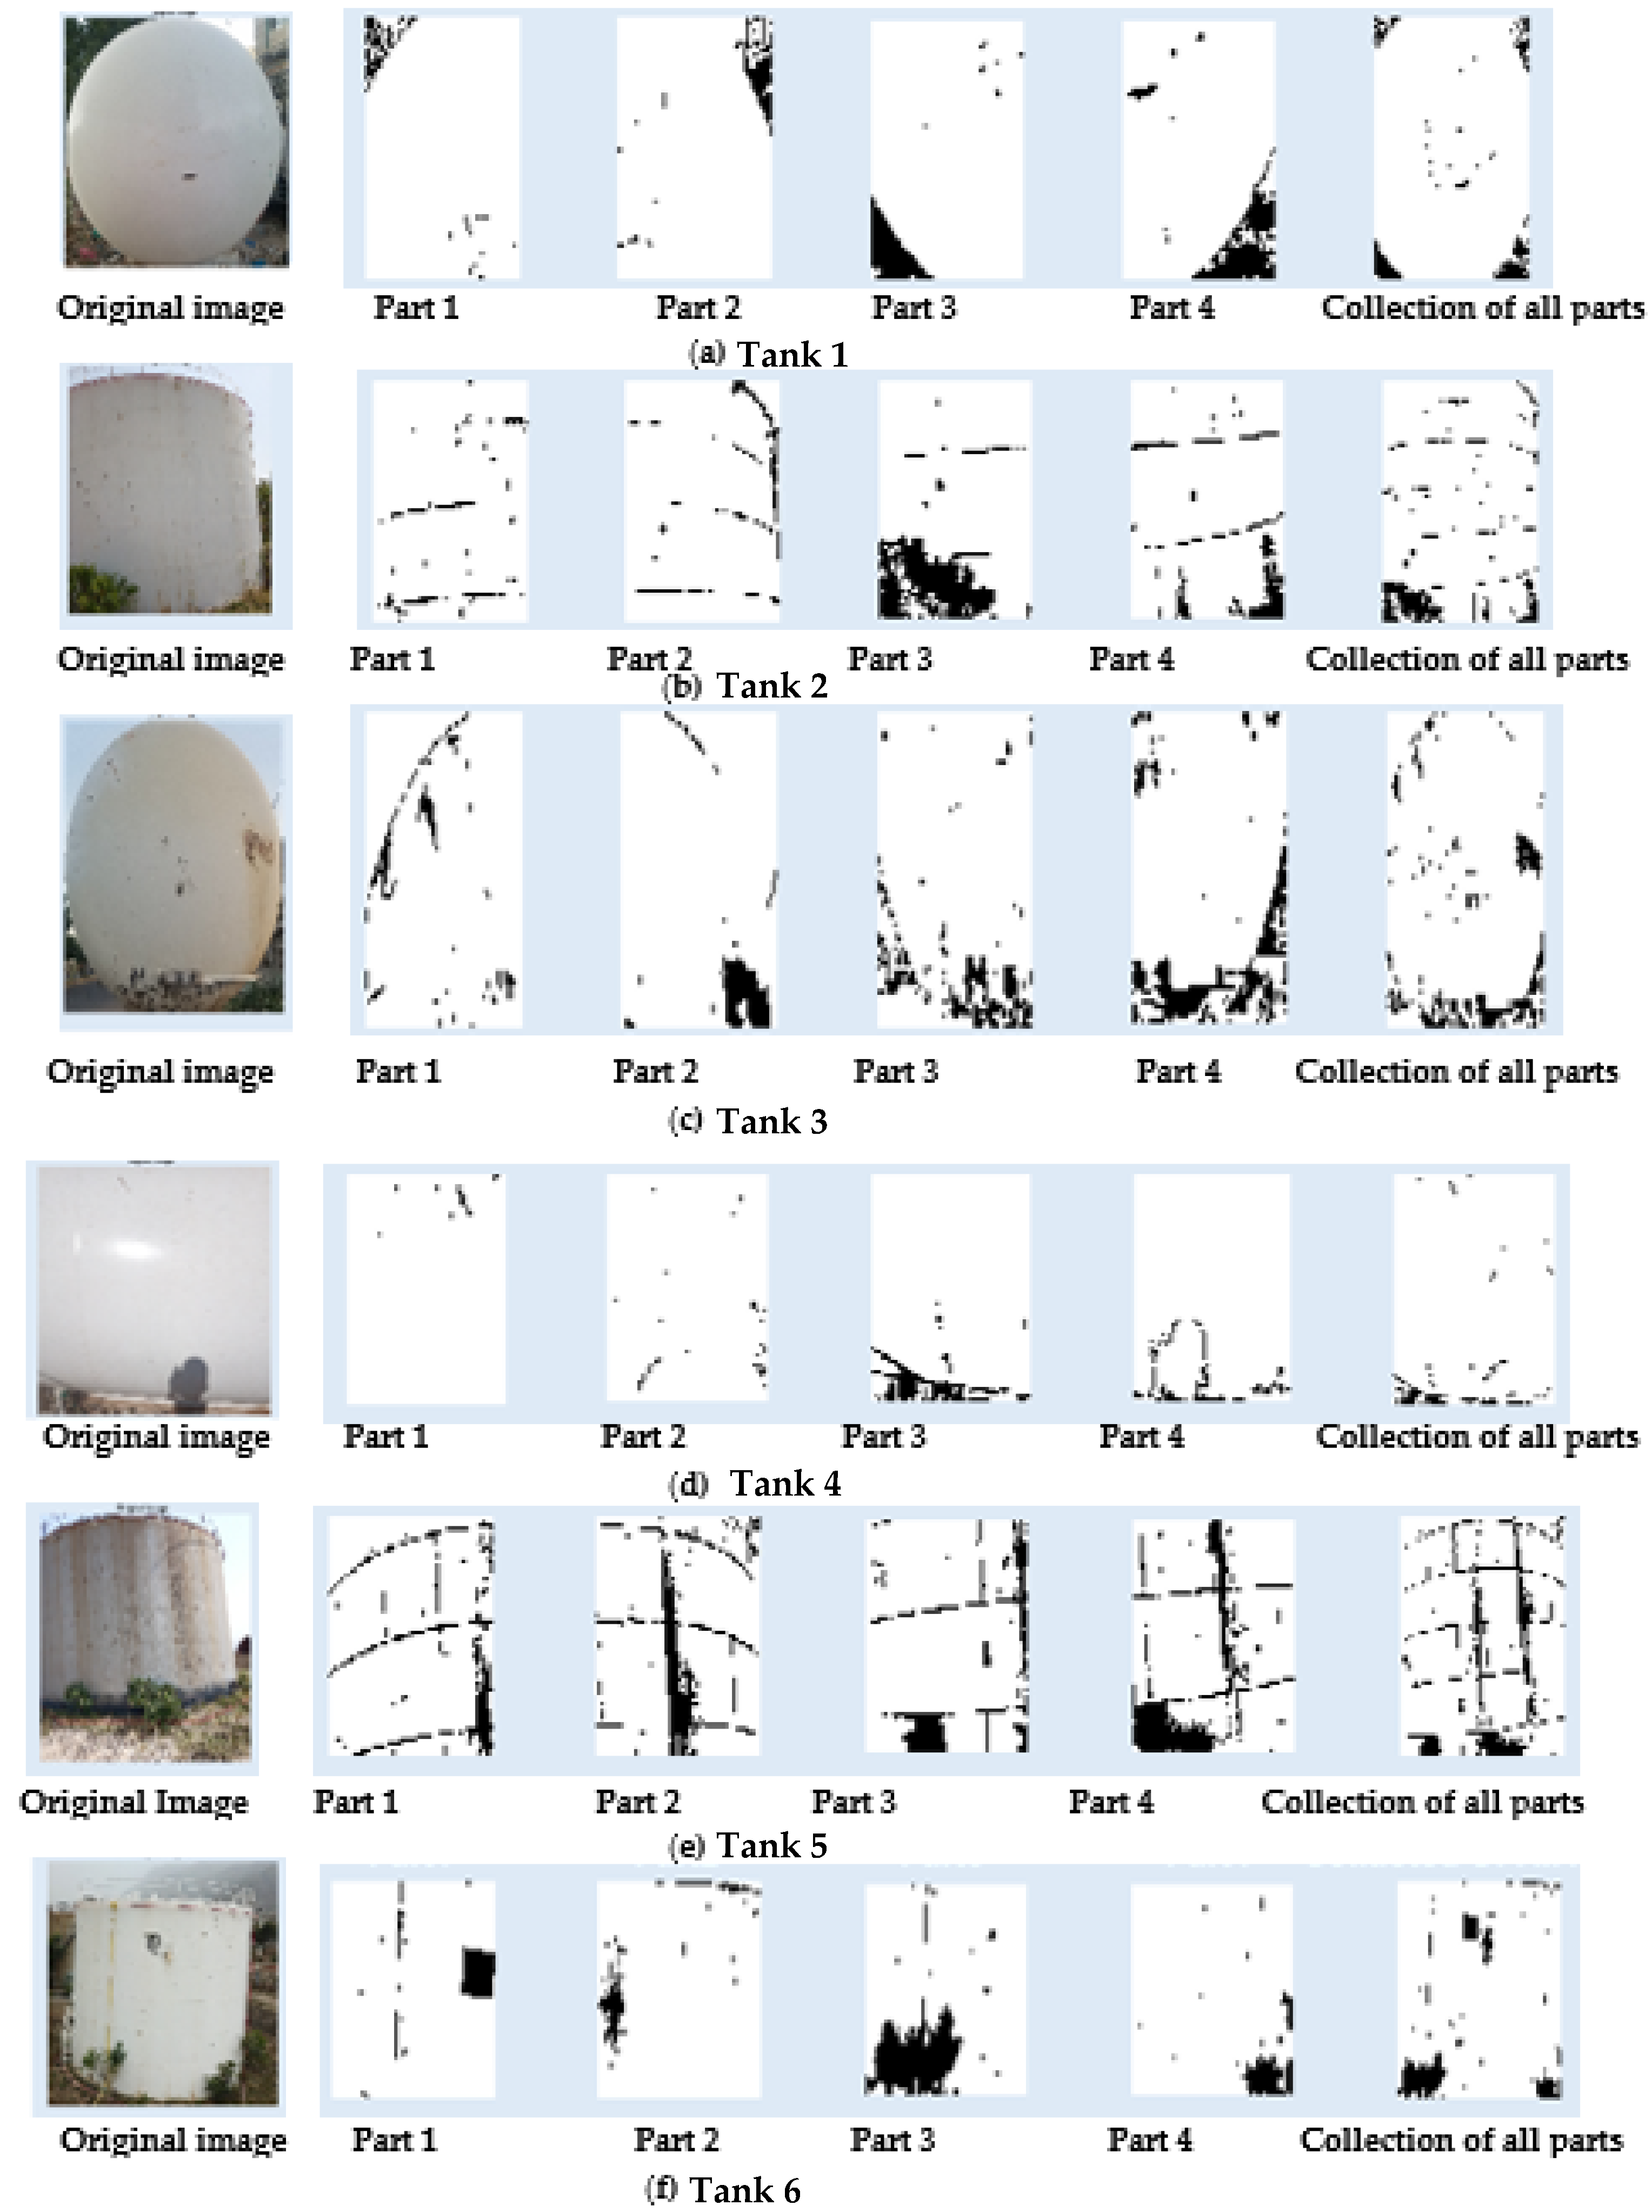
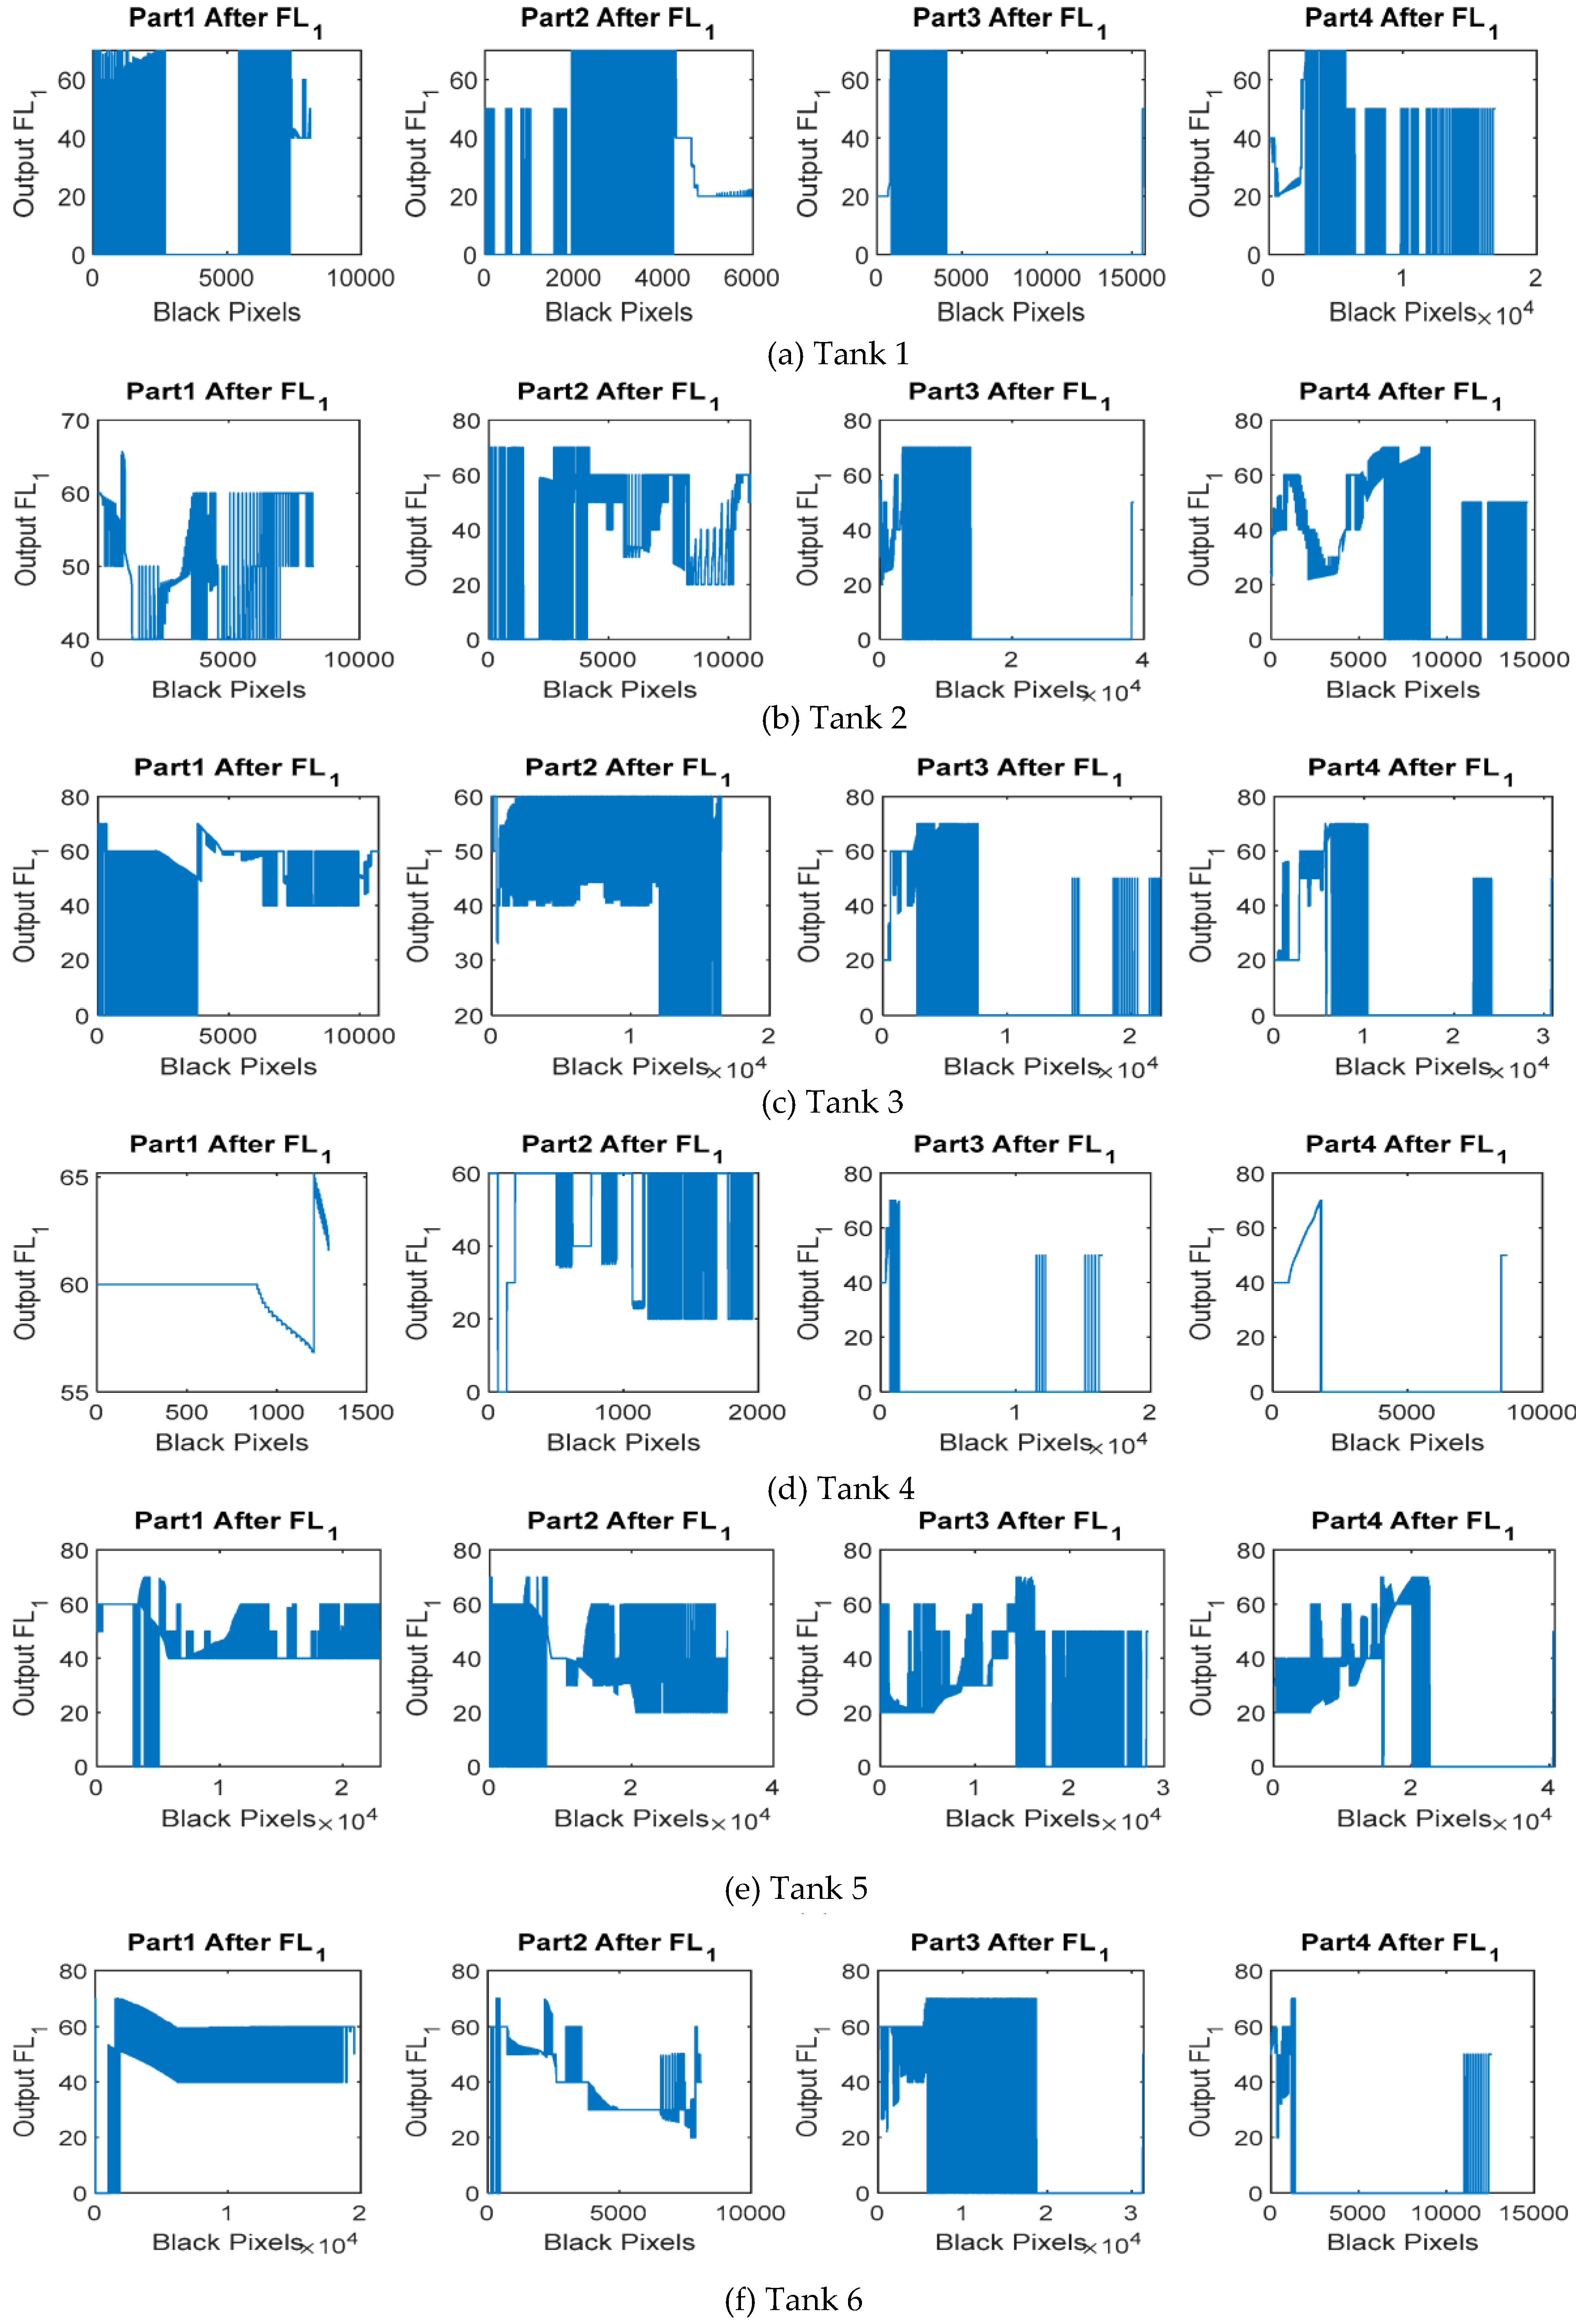
The fuzzy logic inference system as designed in
Section 2.3 is applied to remove the noise effects caused by the appearance of the above-mentioned factors on the surface of the tank. The fuzzy logic first stage aims to remove the low noise as shown in
Figure 25. All the outputs of the first stage of fuzzy logic have values between 30 and 70% which means that values below 30% can be classified as pure defects, while those above 70% can be classified as low noise. All the samples shown in
Figure 23 will have the same output values that are between 30 and 70% during the implementation of the first stage of the fuzzy logic as shown in
Figure 25. In the first sample as shown in
Figure 25a, the first part has output values confined between 40 and 80%, which indicates the presence of low noise and the absence of pure defects, whereas the second, third, and fourth parts have the same output values confined between 20 and 80%, indicating the presence of pure defects and low noise.
Similarly, in the second sample as shown in
Figure 25b, the first part has output values confined between 40 and 65% which indicates that there is no low noise and pure defects, while the second, third, and fourth parts have the same output values confined between 20 and 80%, and this indicates the presence of pure defects and low noise.
In the third sample as shown in
Figure 25c, the first part has output values confined between 40 and 78%, (indicates the presence of low noise with no pure defects); the second part has output values confined between 20 and 60% (indicates the presence of pure defects with no low noise), while the third and fourth parts have the same output values, ranging from 20 to 80% (indicates the presence of pure defects and low noise).
In the fourth sample as shown in
Figure 25d, the first part has output values confined between 40 and 67% (indicates the absence of any low noise and pure defects), the second part has output values confined between 22 and 60% (indicates the presence of pure defects with no low noise), the third and fourth parts have the same output values, which range between 20 and 80% (indicates the presence of pure defects and low noise).
In the fifth sample as shown in
Figure 25e, the first part has output values confined between 40 and 80% (indicates the presence of low noise with no pure defects), however, the second, third, and fourth parts have confined output values between 20 and 80% (indicates the presence of pure defects and low noise).
In the sixth sample shown in
Figure 25f, the first part has output values confined between 40 and 78% (indicates the presence of low noise with no pure defects), and the second, third, and fourth parts have confined output values between 20 and 80% (indicates the presence of pure defects and low noise).
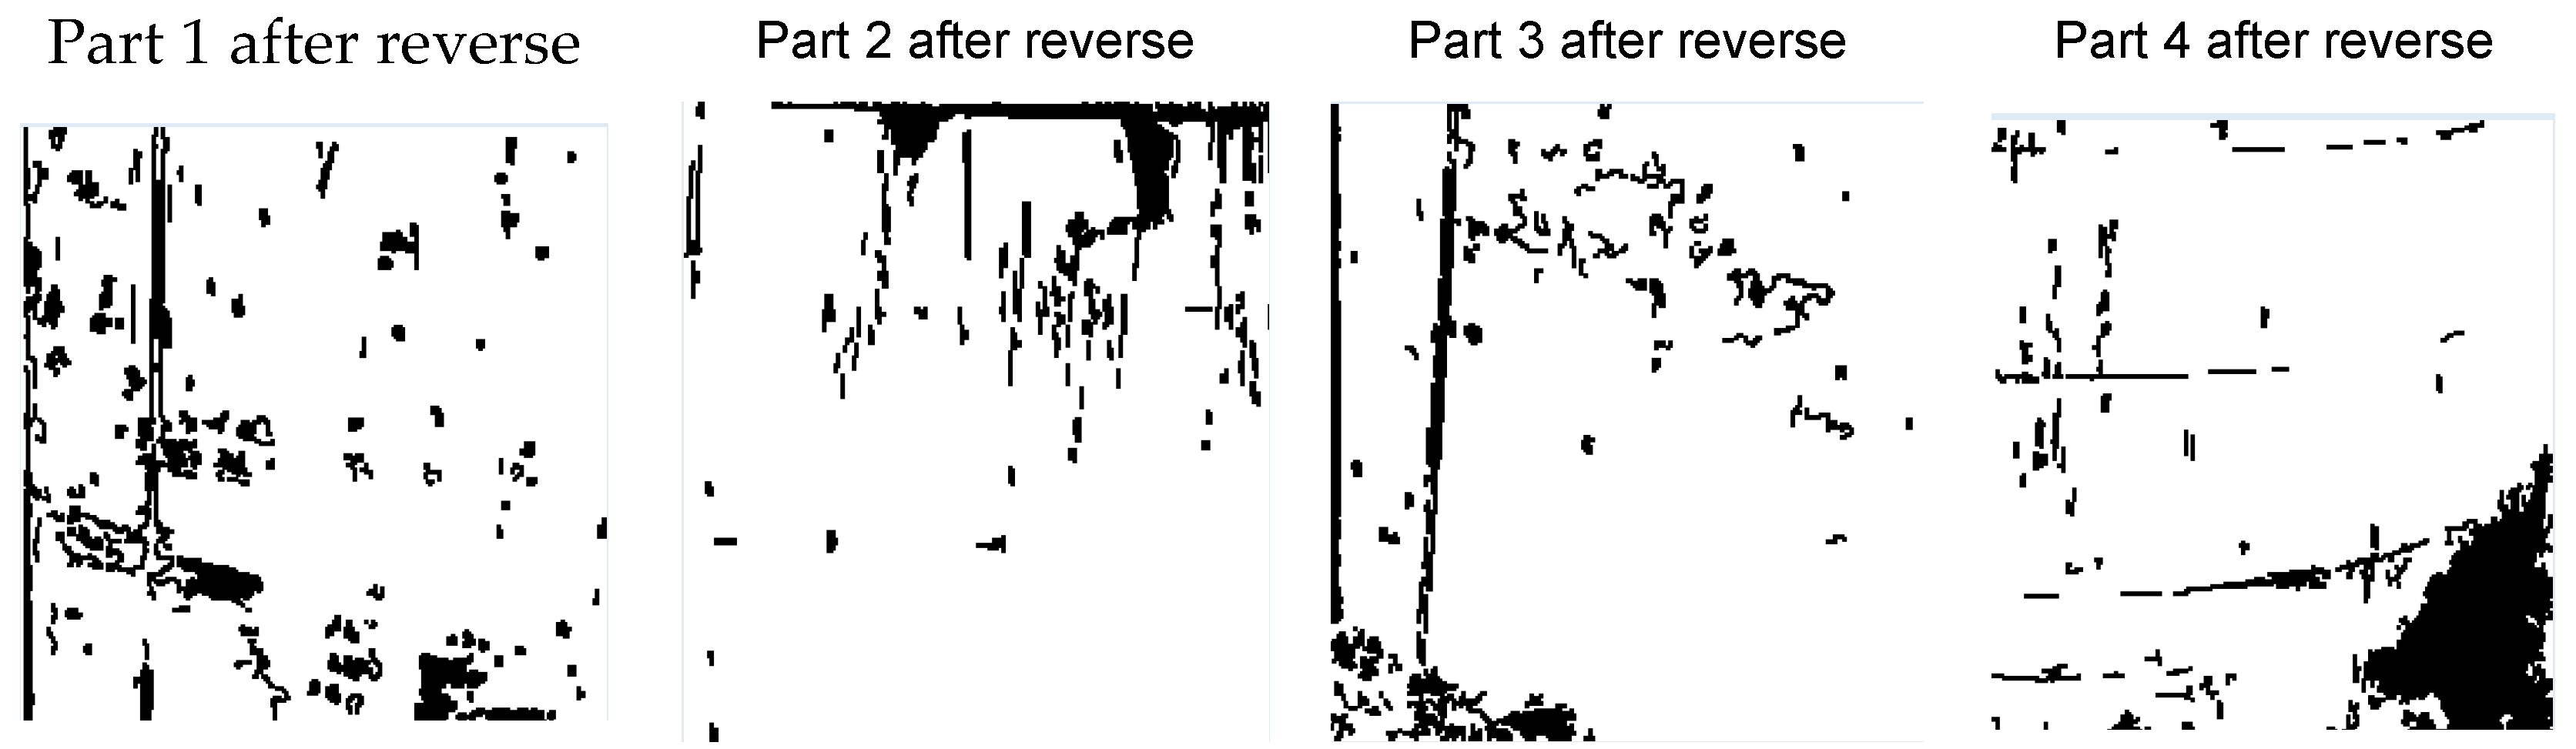
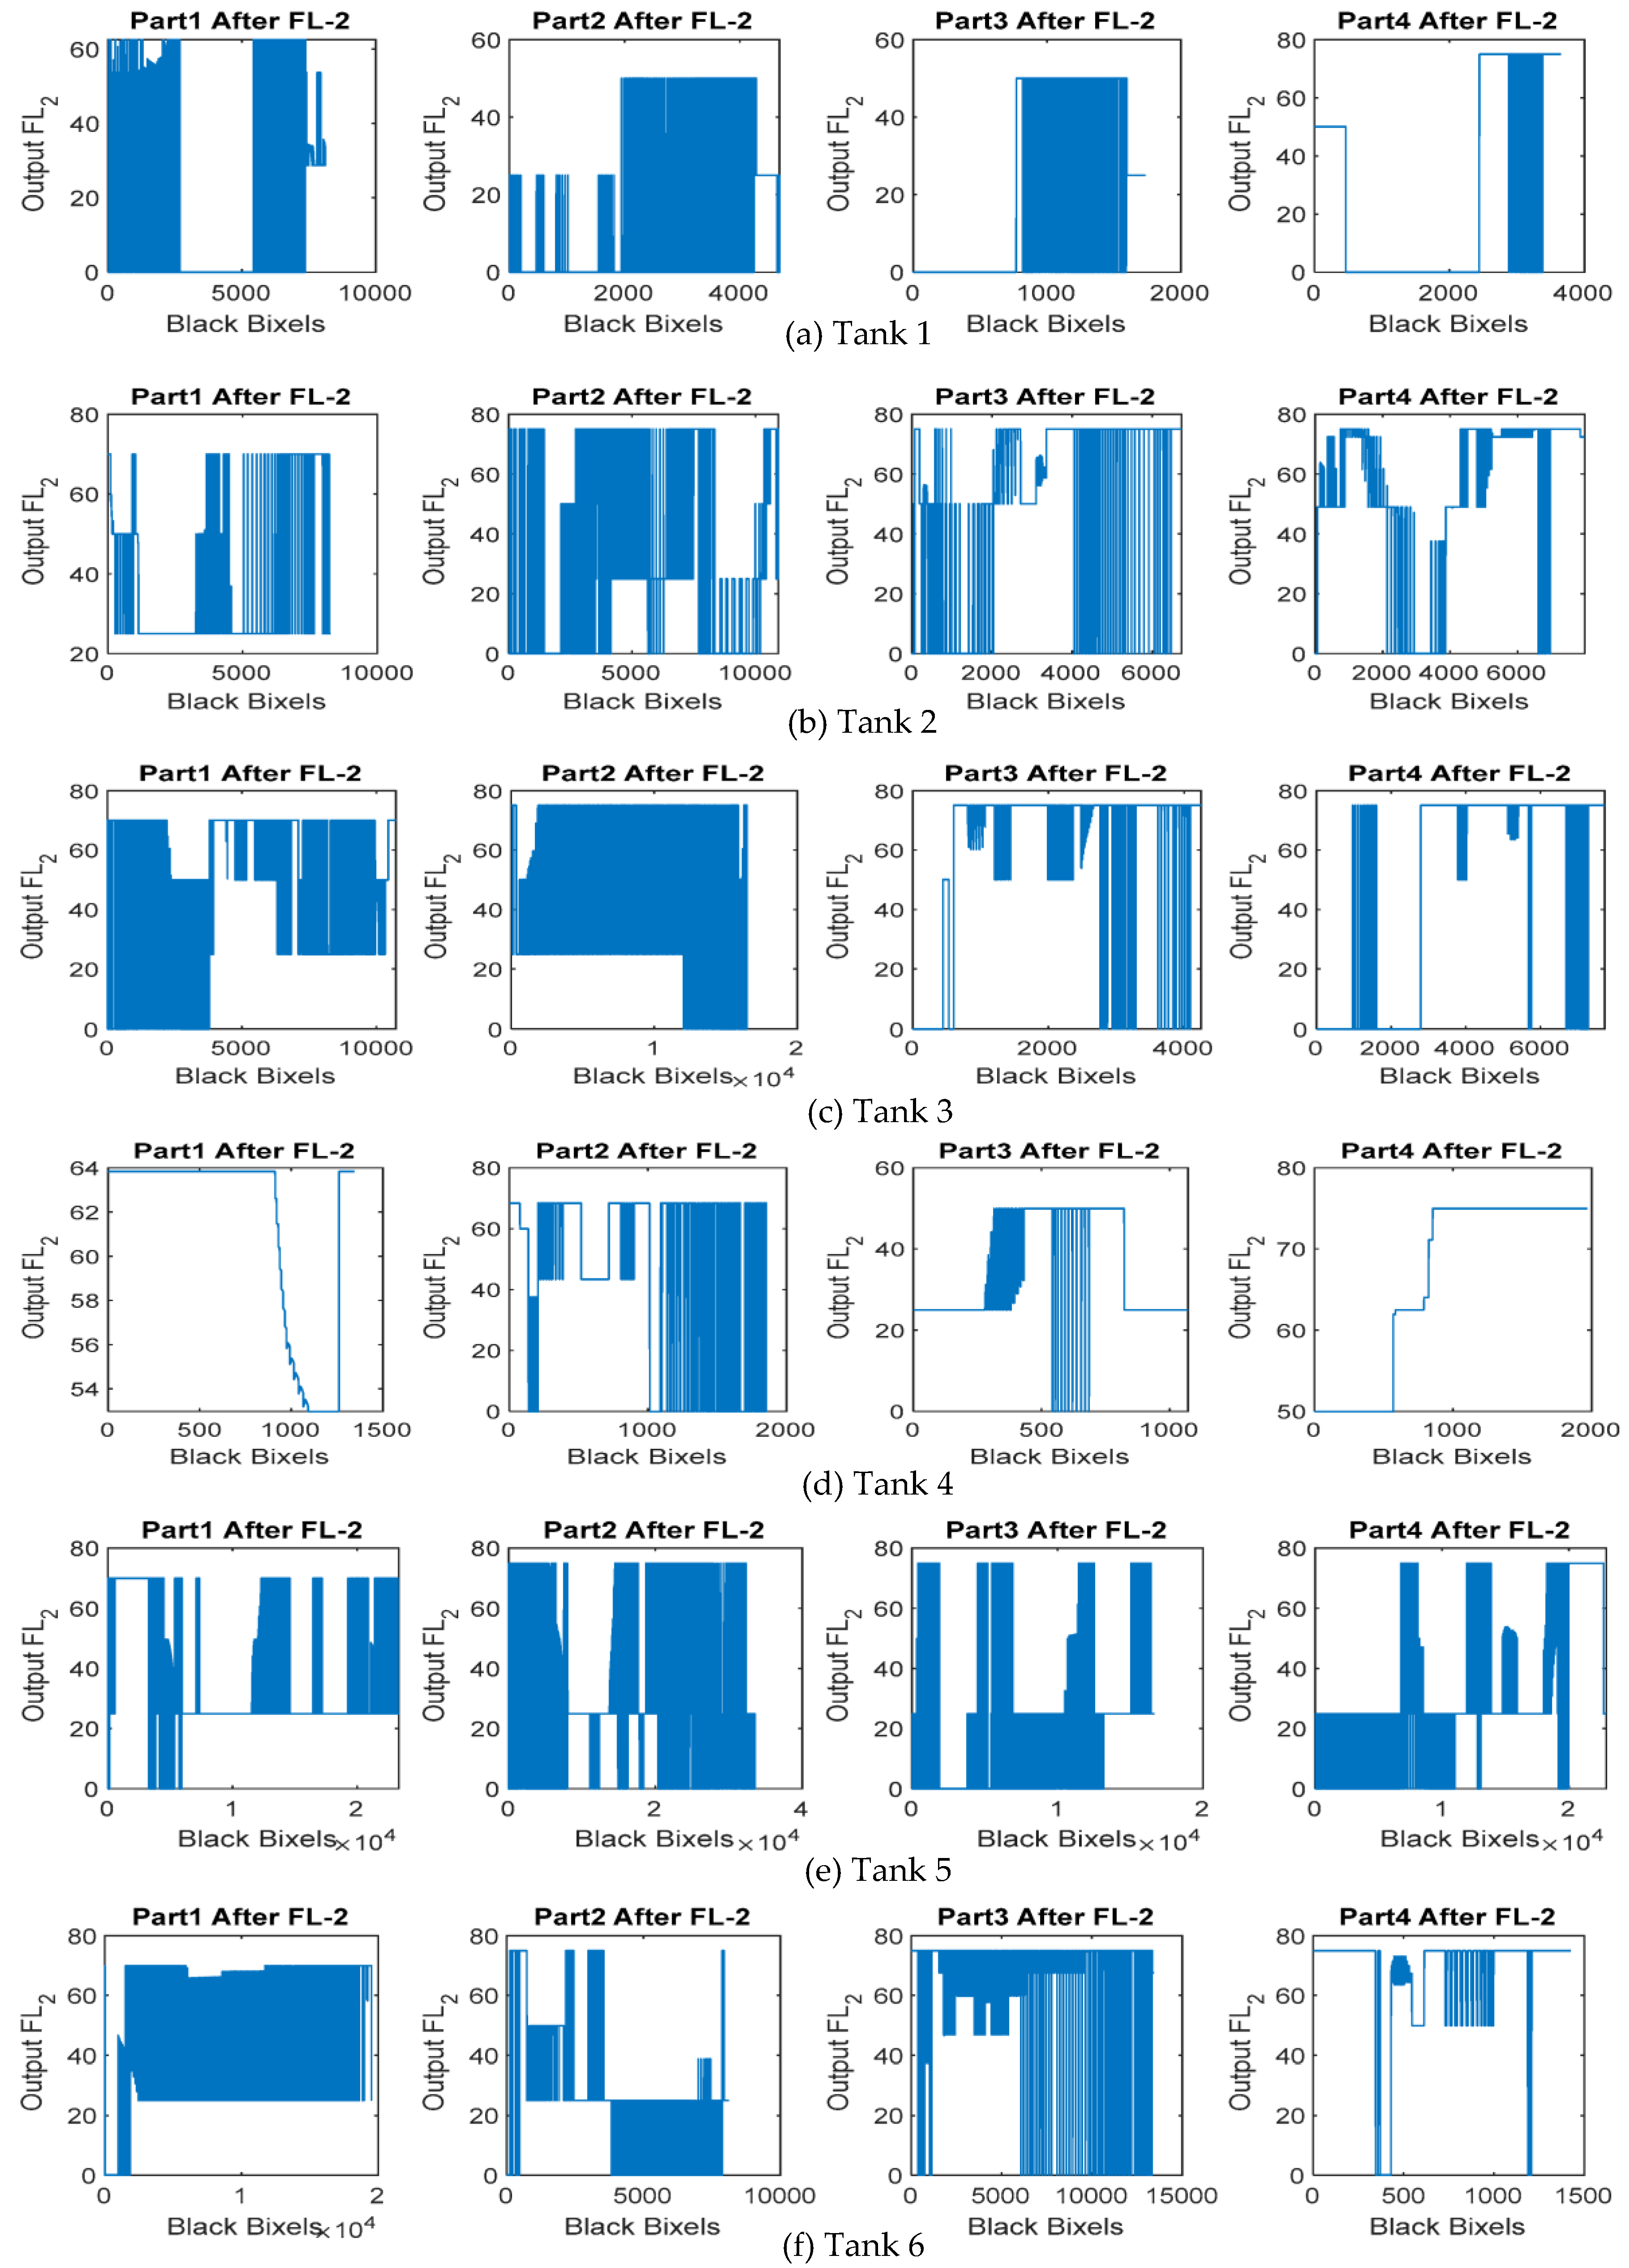
As shown in
Figure 26, the results indicate that there is some medium noise which exists between the output values of the first stage of the fuzzy logic located between 30 and 70%. The regions around the central region of the tank are the most difficult to differentiate between defects and medium noise.
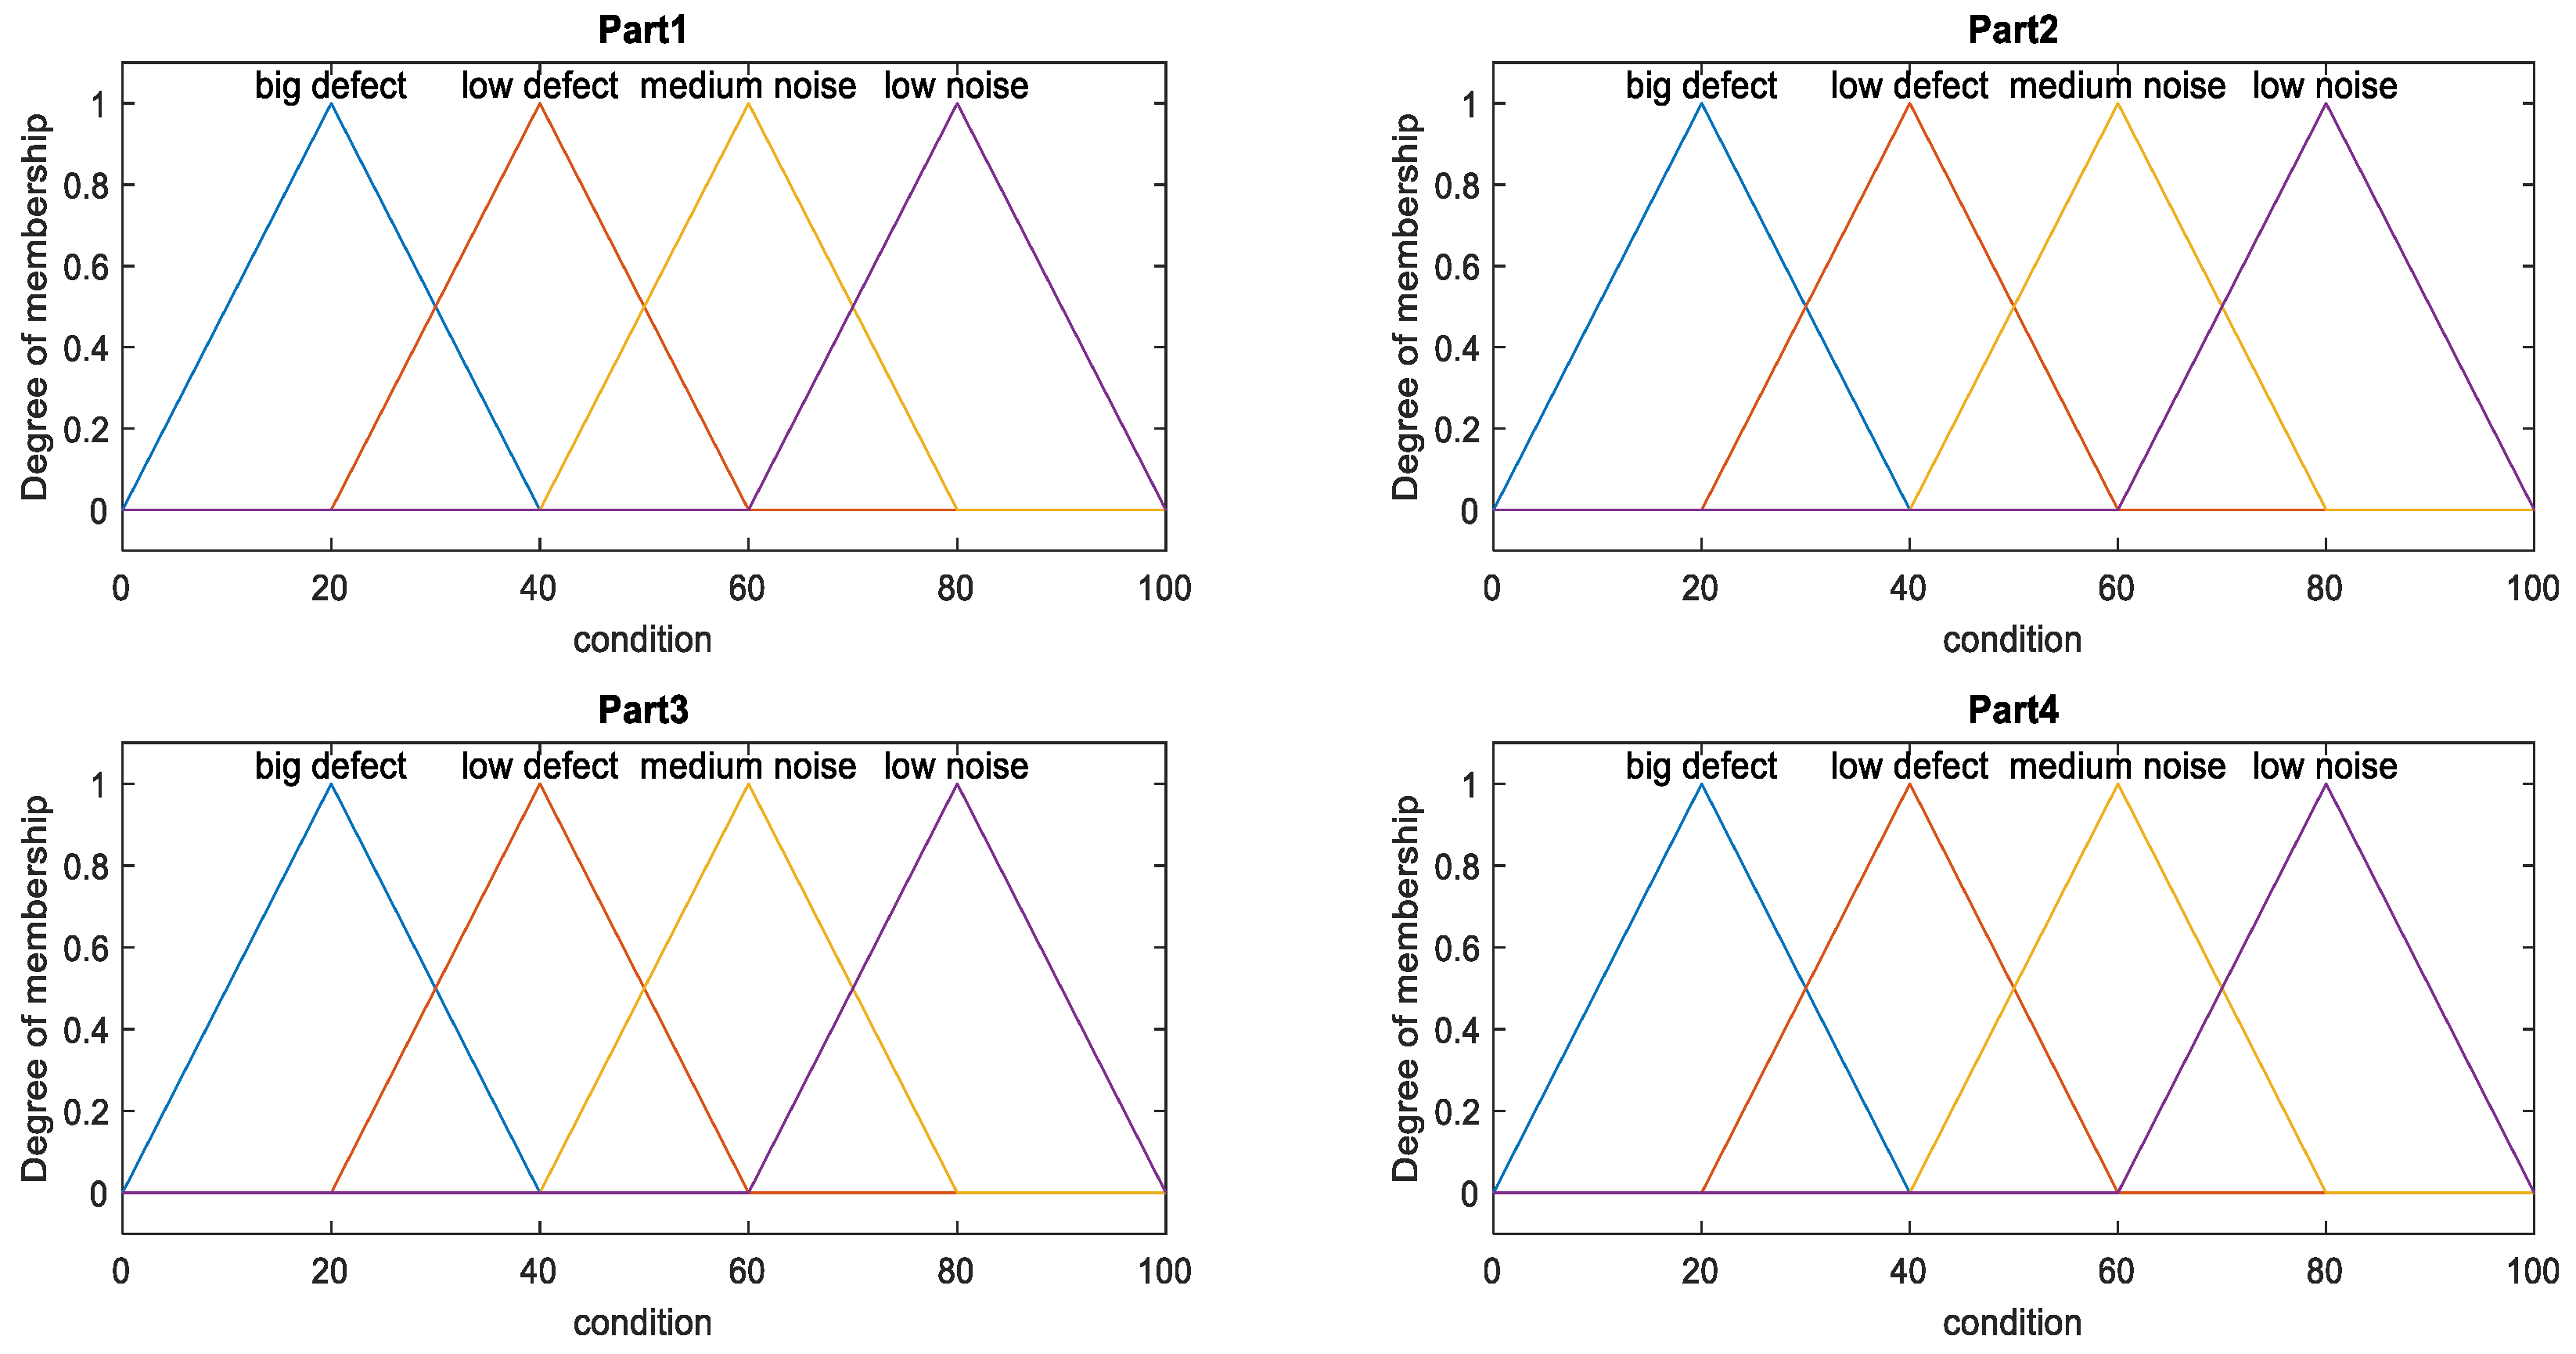
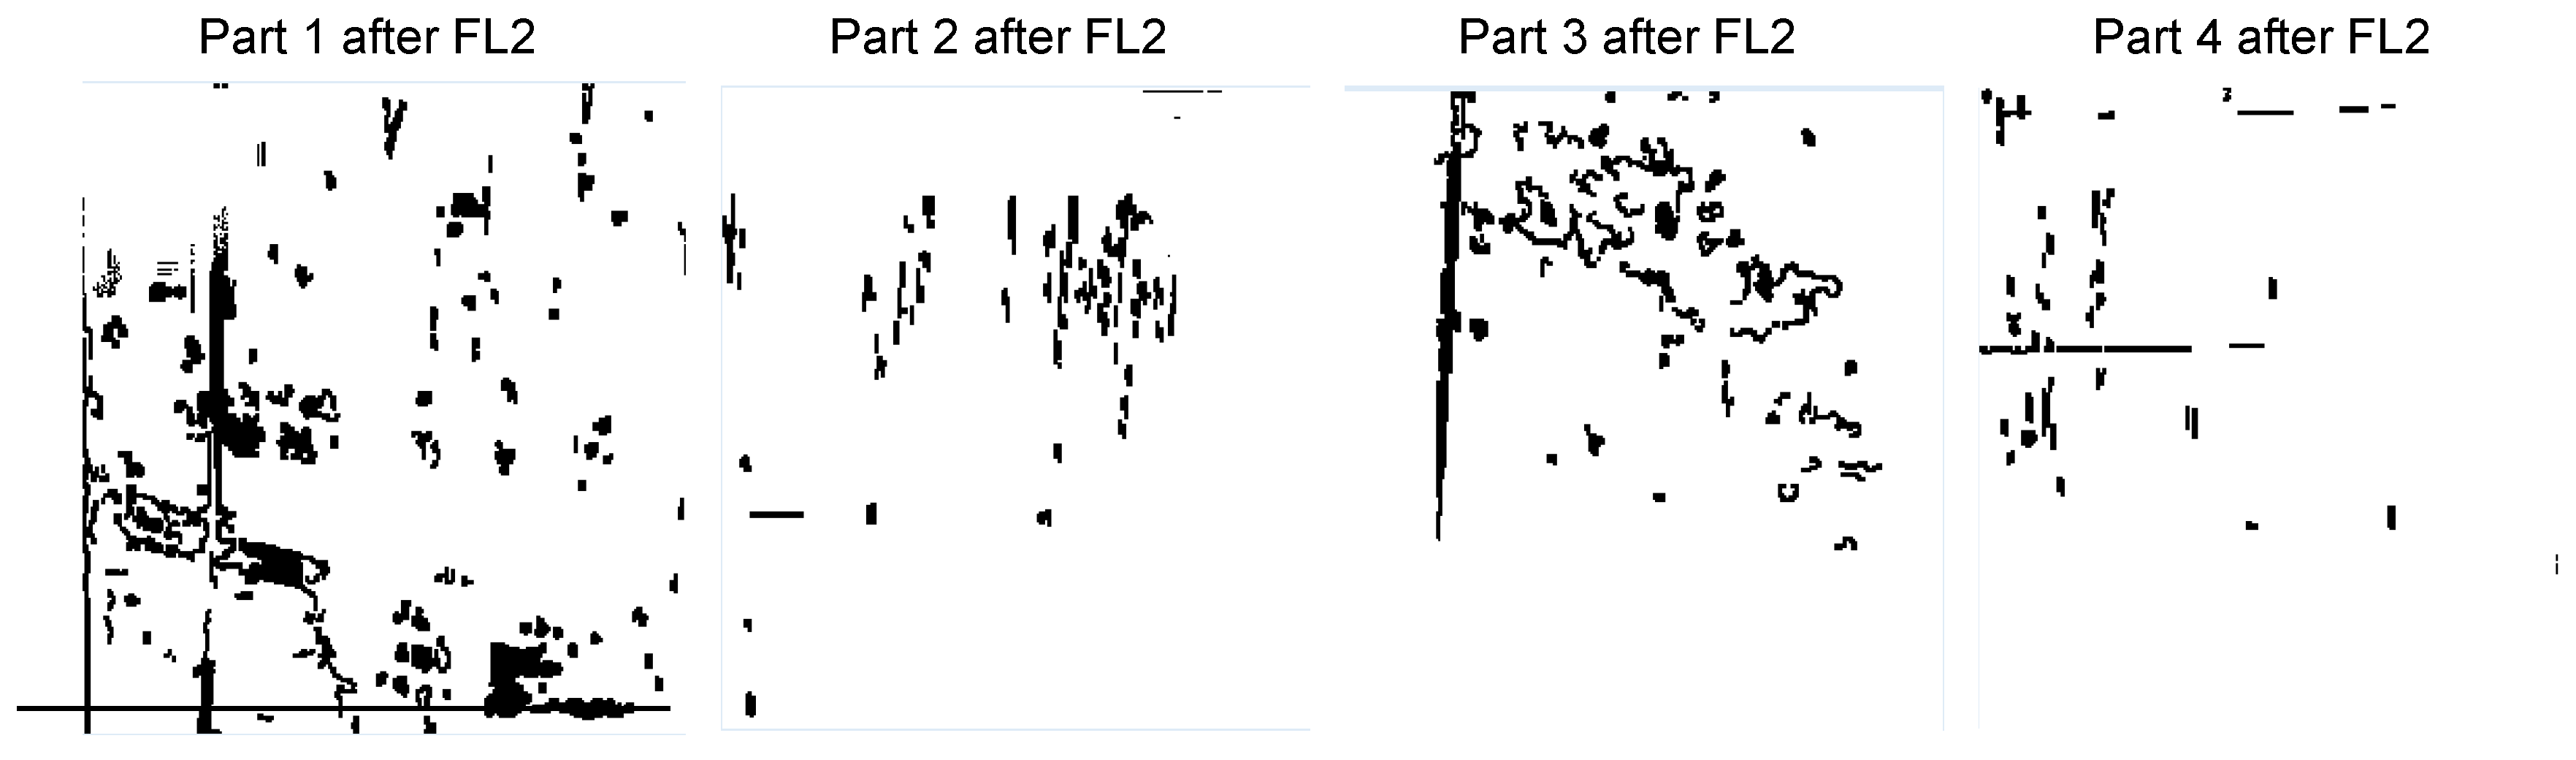
The second stage of the fuzzy logic inference system as designed in
Section 2.3.2, was applied to remove the medium noise effects caused by small dirt, heterogeneity in lighting, and the appearance of small objects on the surface of the tank. The fuzzy logic second stage aims to eliminate medium-scale noise as illustrated in
Figure 27. All the outputs of the fuzzy logic second stage have values between 0 and 70% and this means that values less than 70% can be classified as defects, while values above 70% can be classified as medium noise.
All samples, as shown in
Figure 23, have the same output values between 0 and 70% after the second stage of fuzzy logic was executed. In the first sample as shown in
Figure 27a, only the fourth part contains output values greater than 70%, which indicates the presence of medium noise. In the second and third samples, as shown in
Figure 27b,c, the second, third, and fourth parts have output values greater than 70%, which indicates the presence of medium noise. In the fourth sample, as shown in
Figure 27d, only the fourth part contains output values greater than 70%, indicating the presence of medium noise. In the fifth and sixth sample, as shown in
Figure 27e,f, the second, third, and fourth parts have output values greater than 70% (indicates the presence of medium noise).
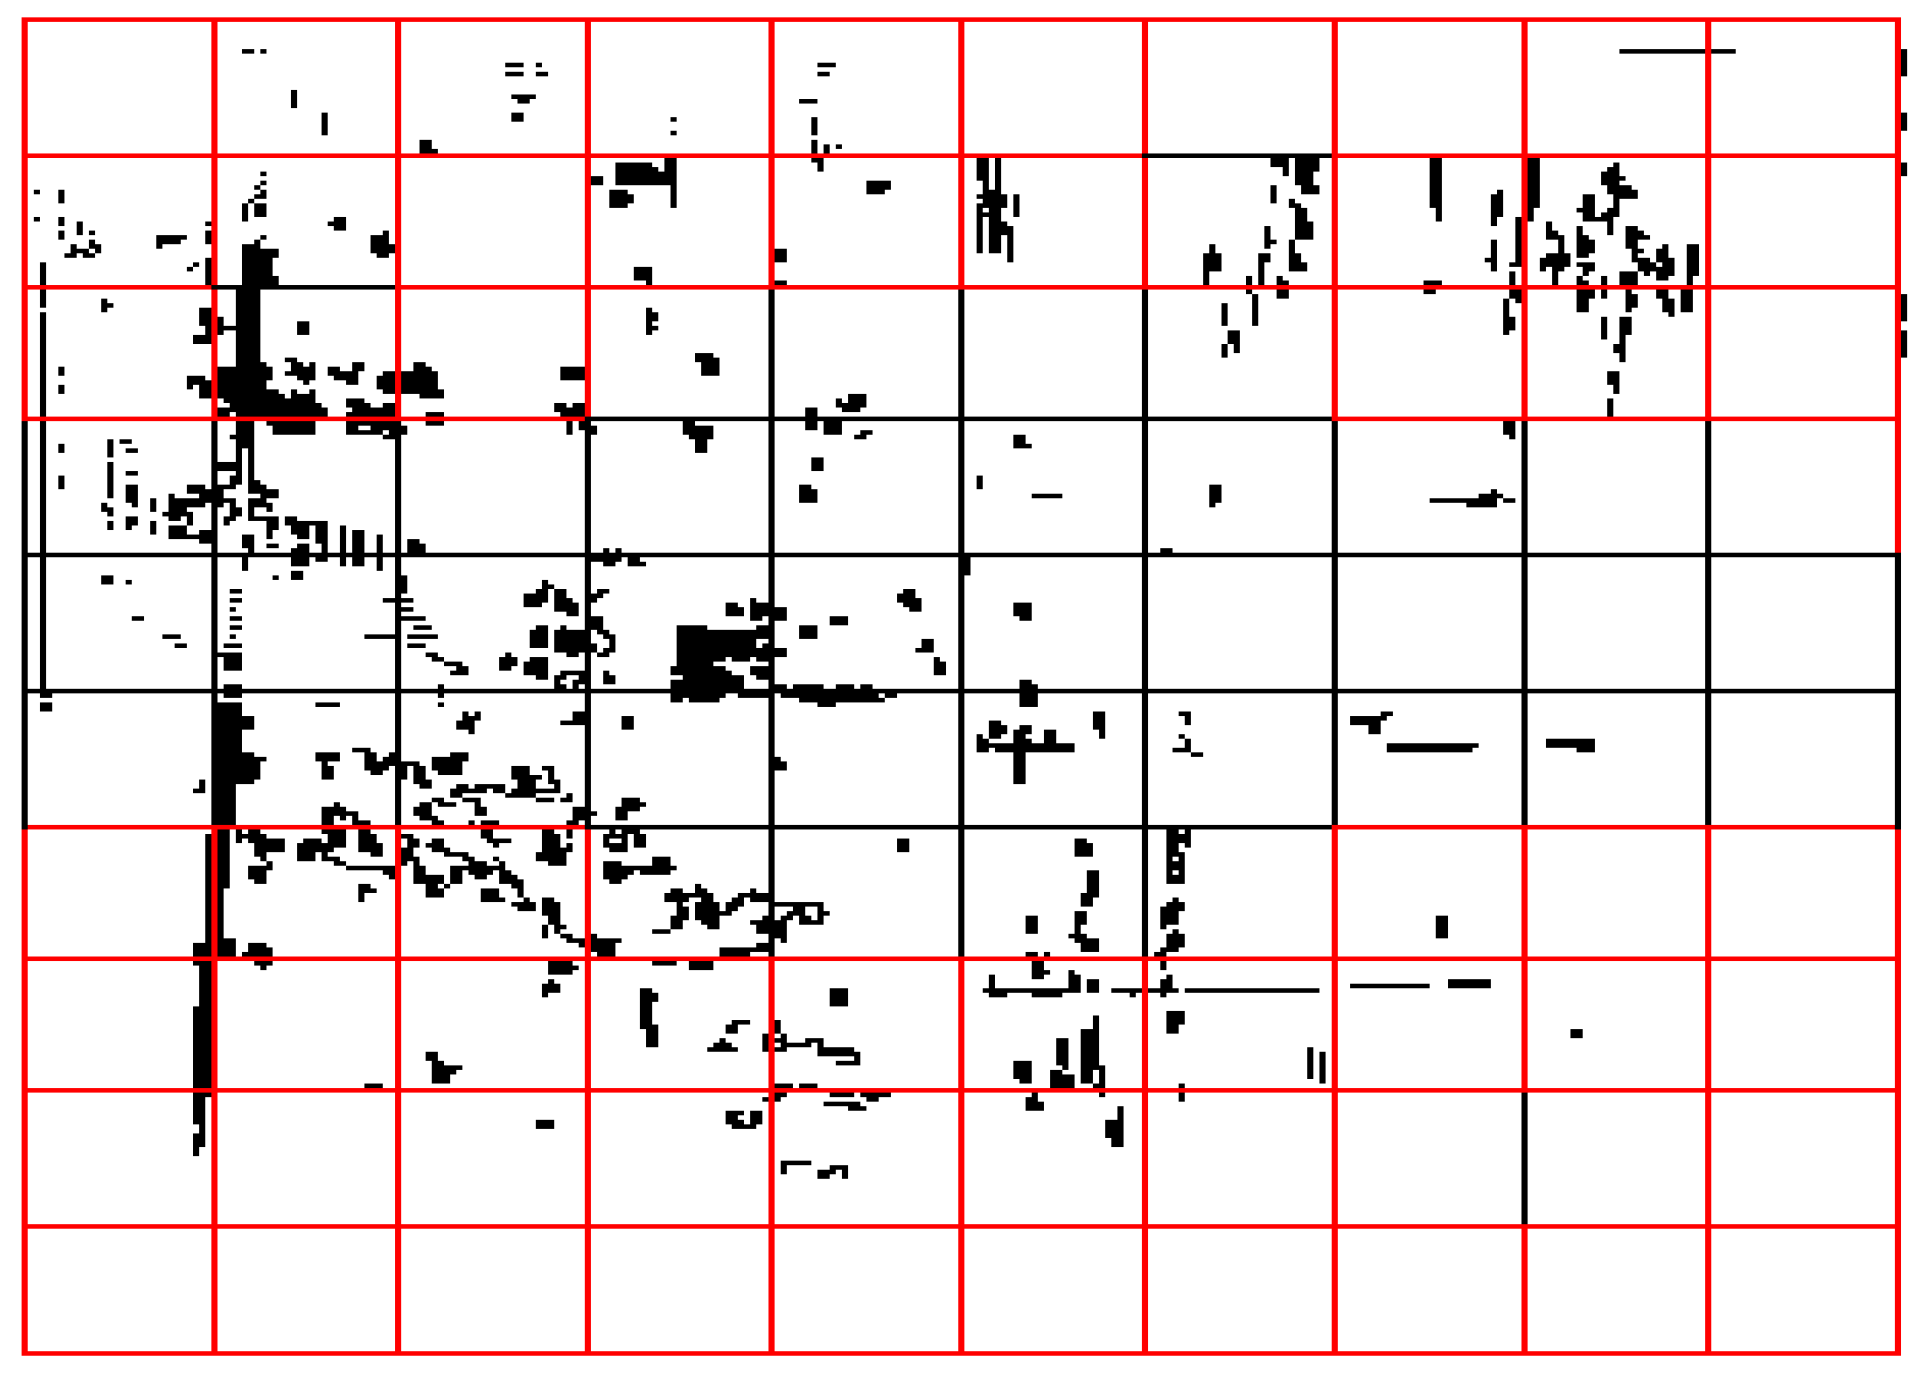
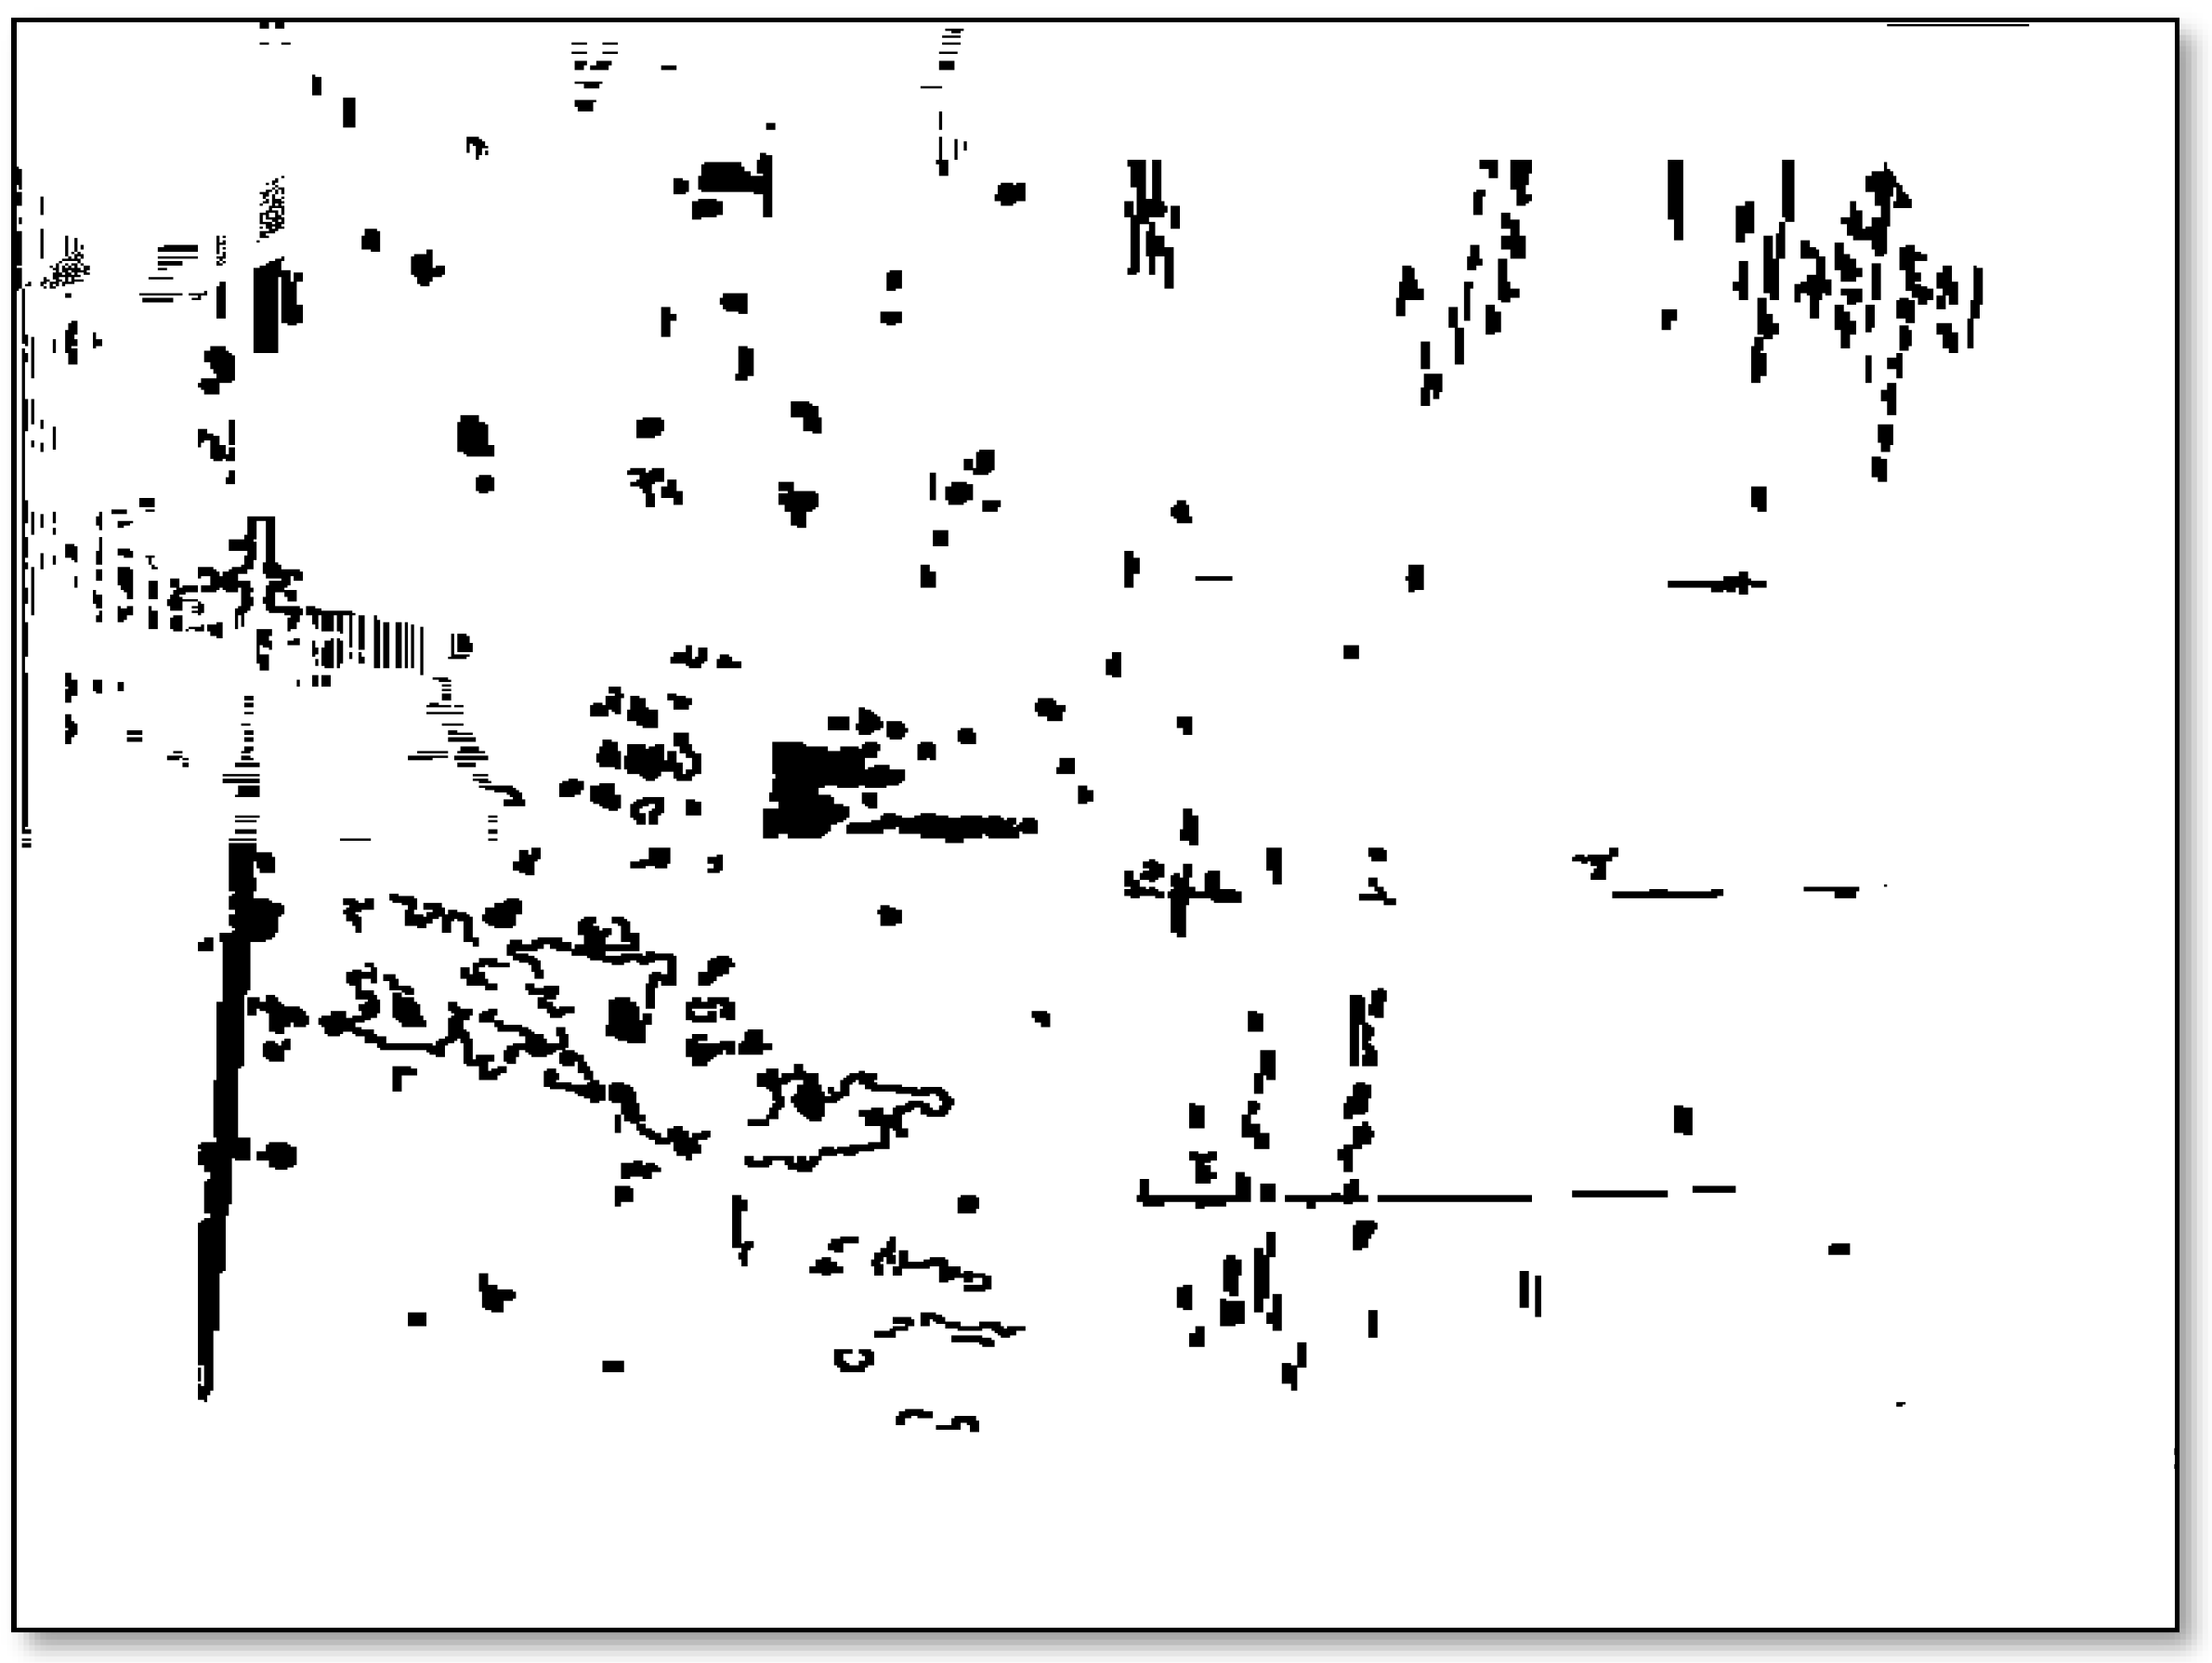
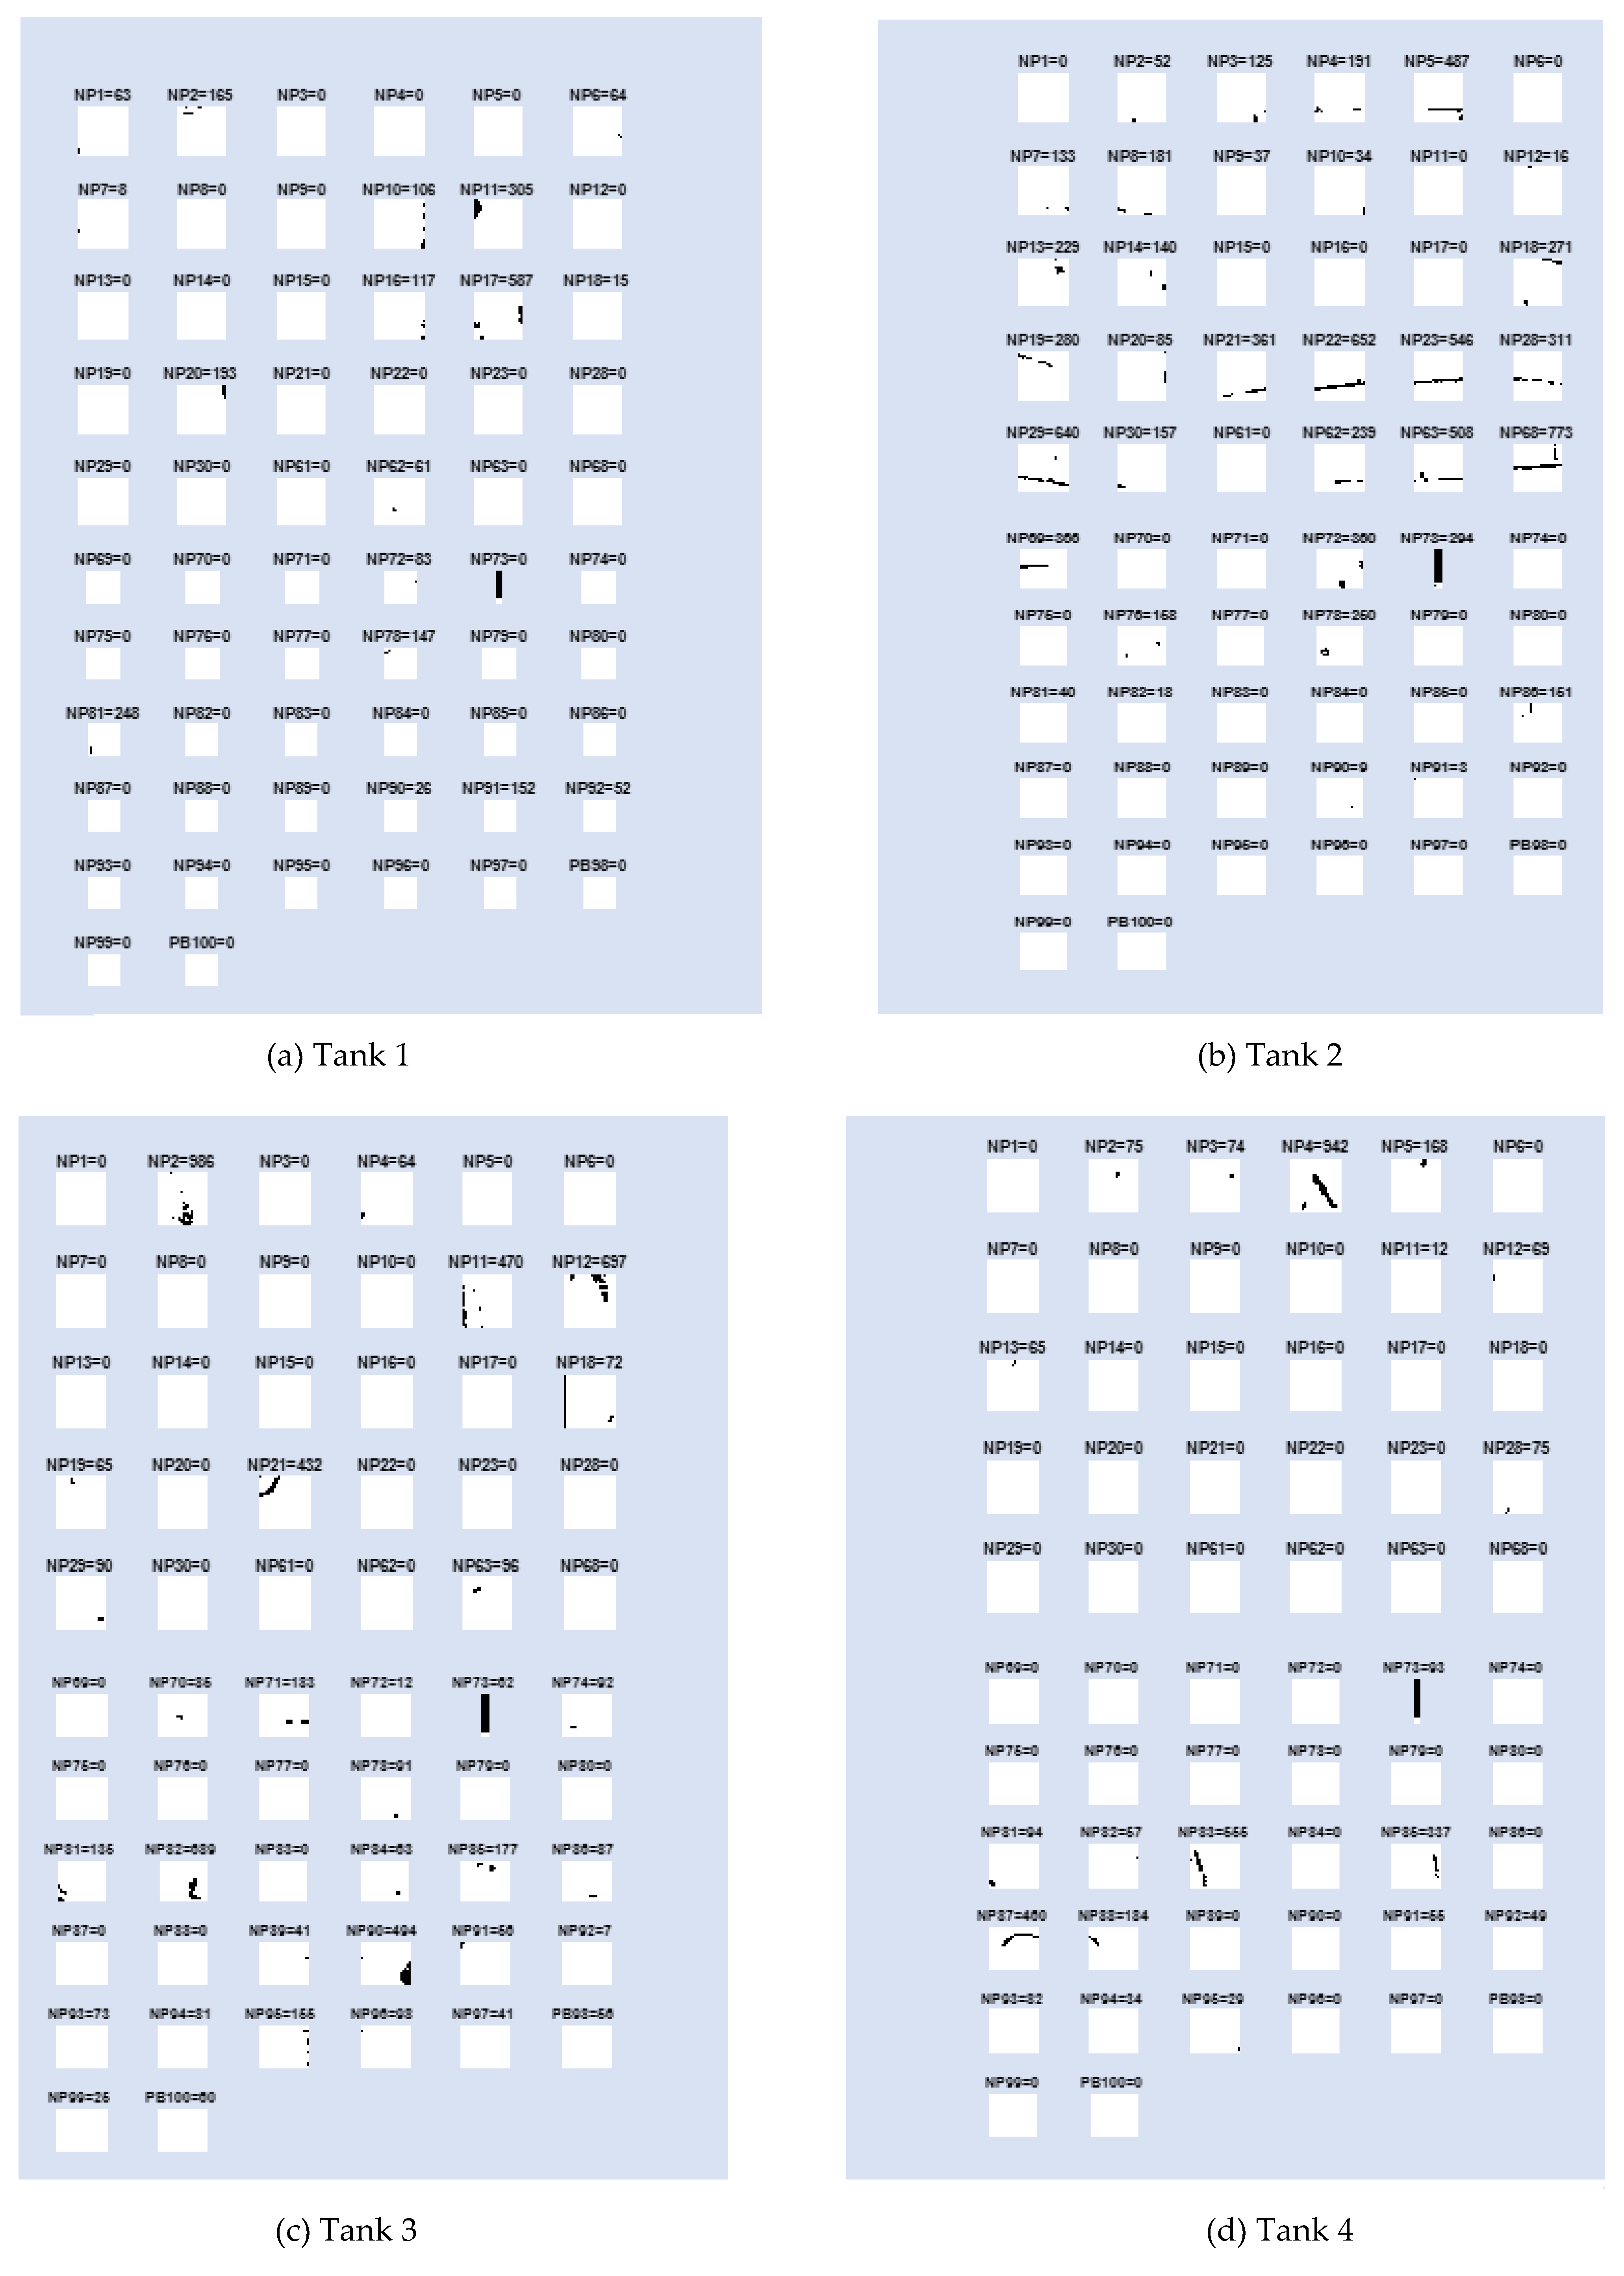
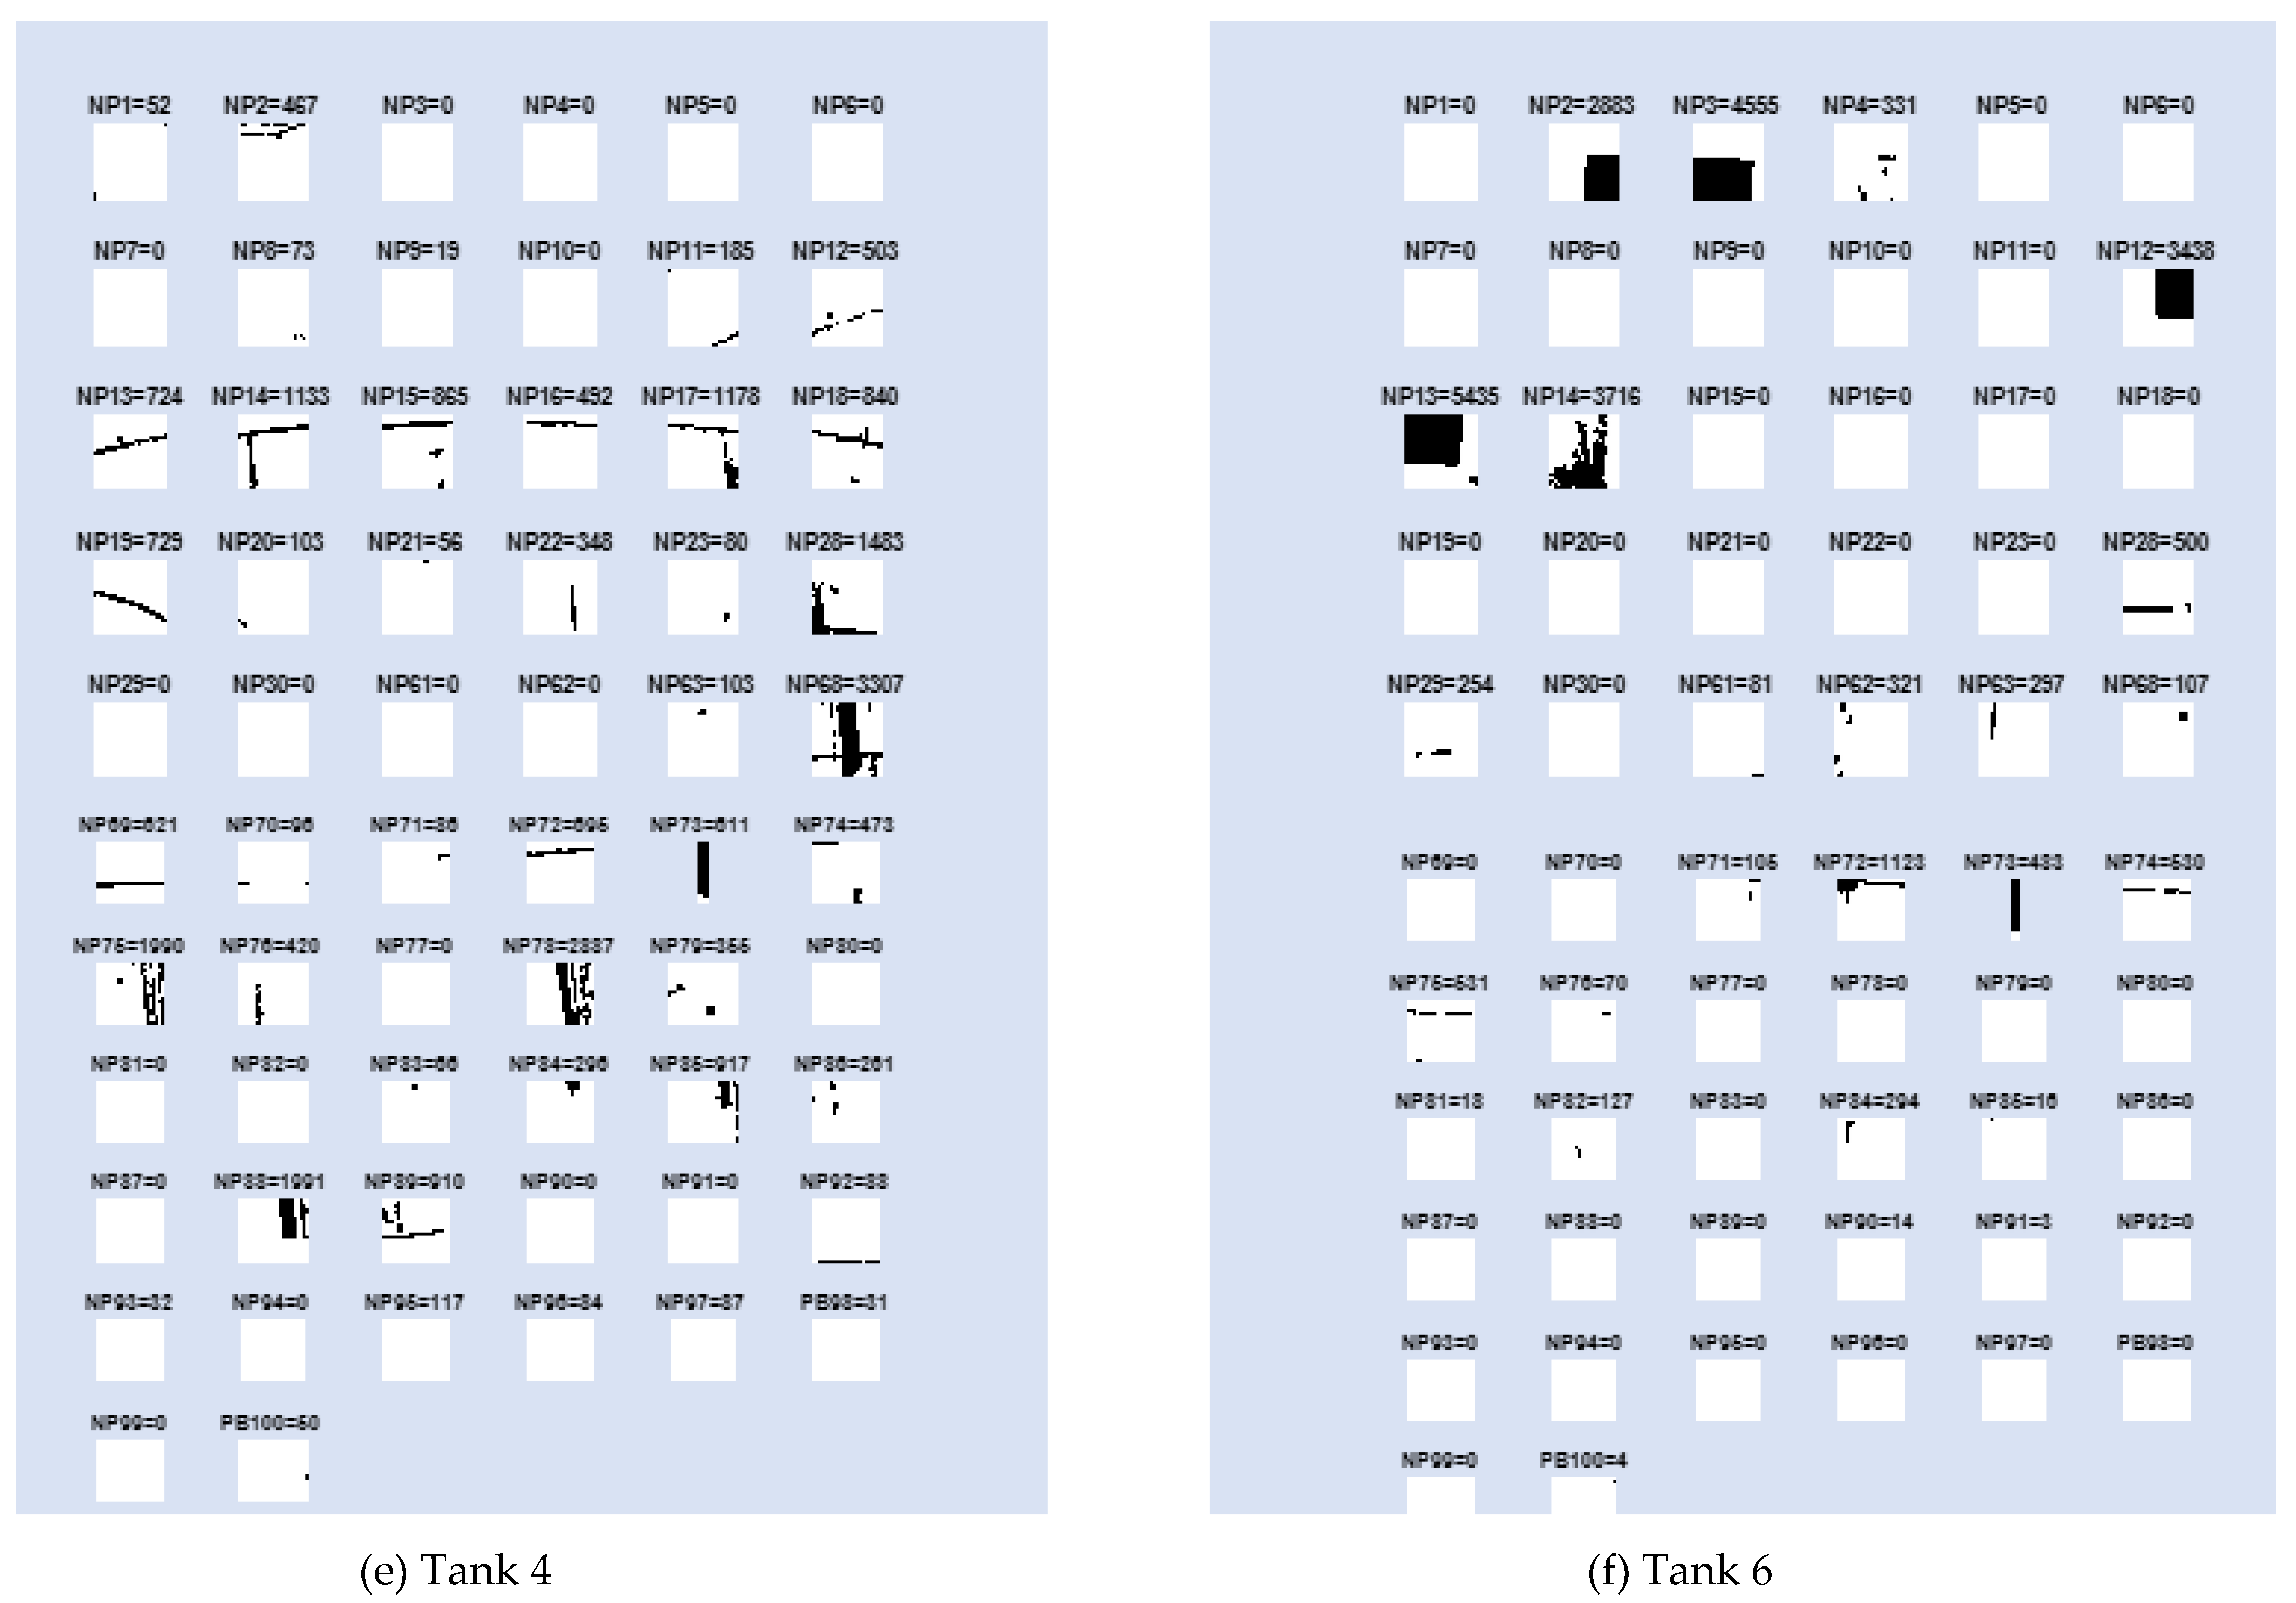
Figure 23 shows the presence of high noise in some images. The results indicate the presence of some high noise caused by large sediment or dirt on the surface of the tank as shown in
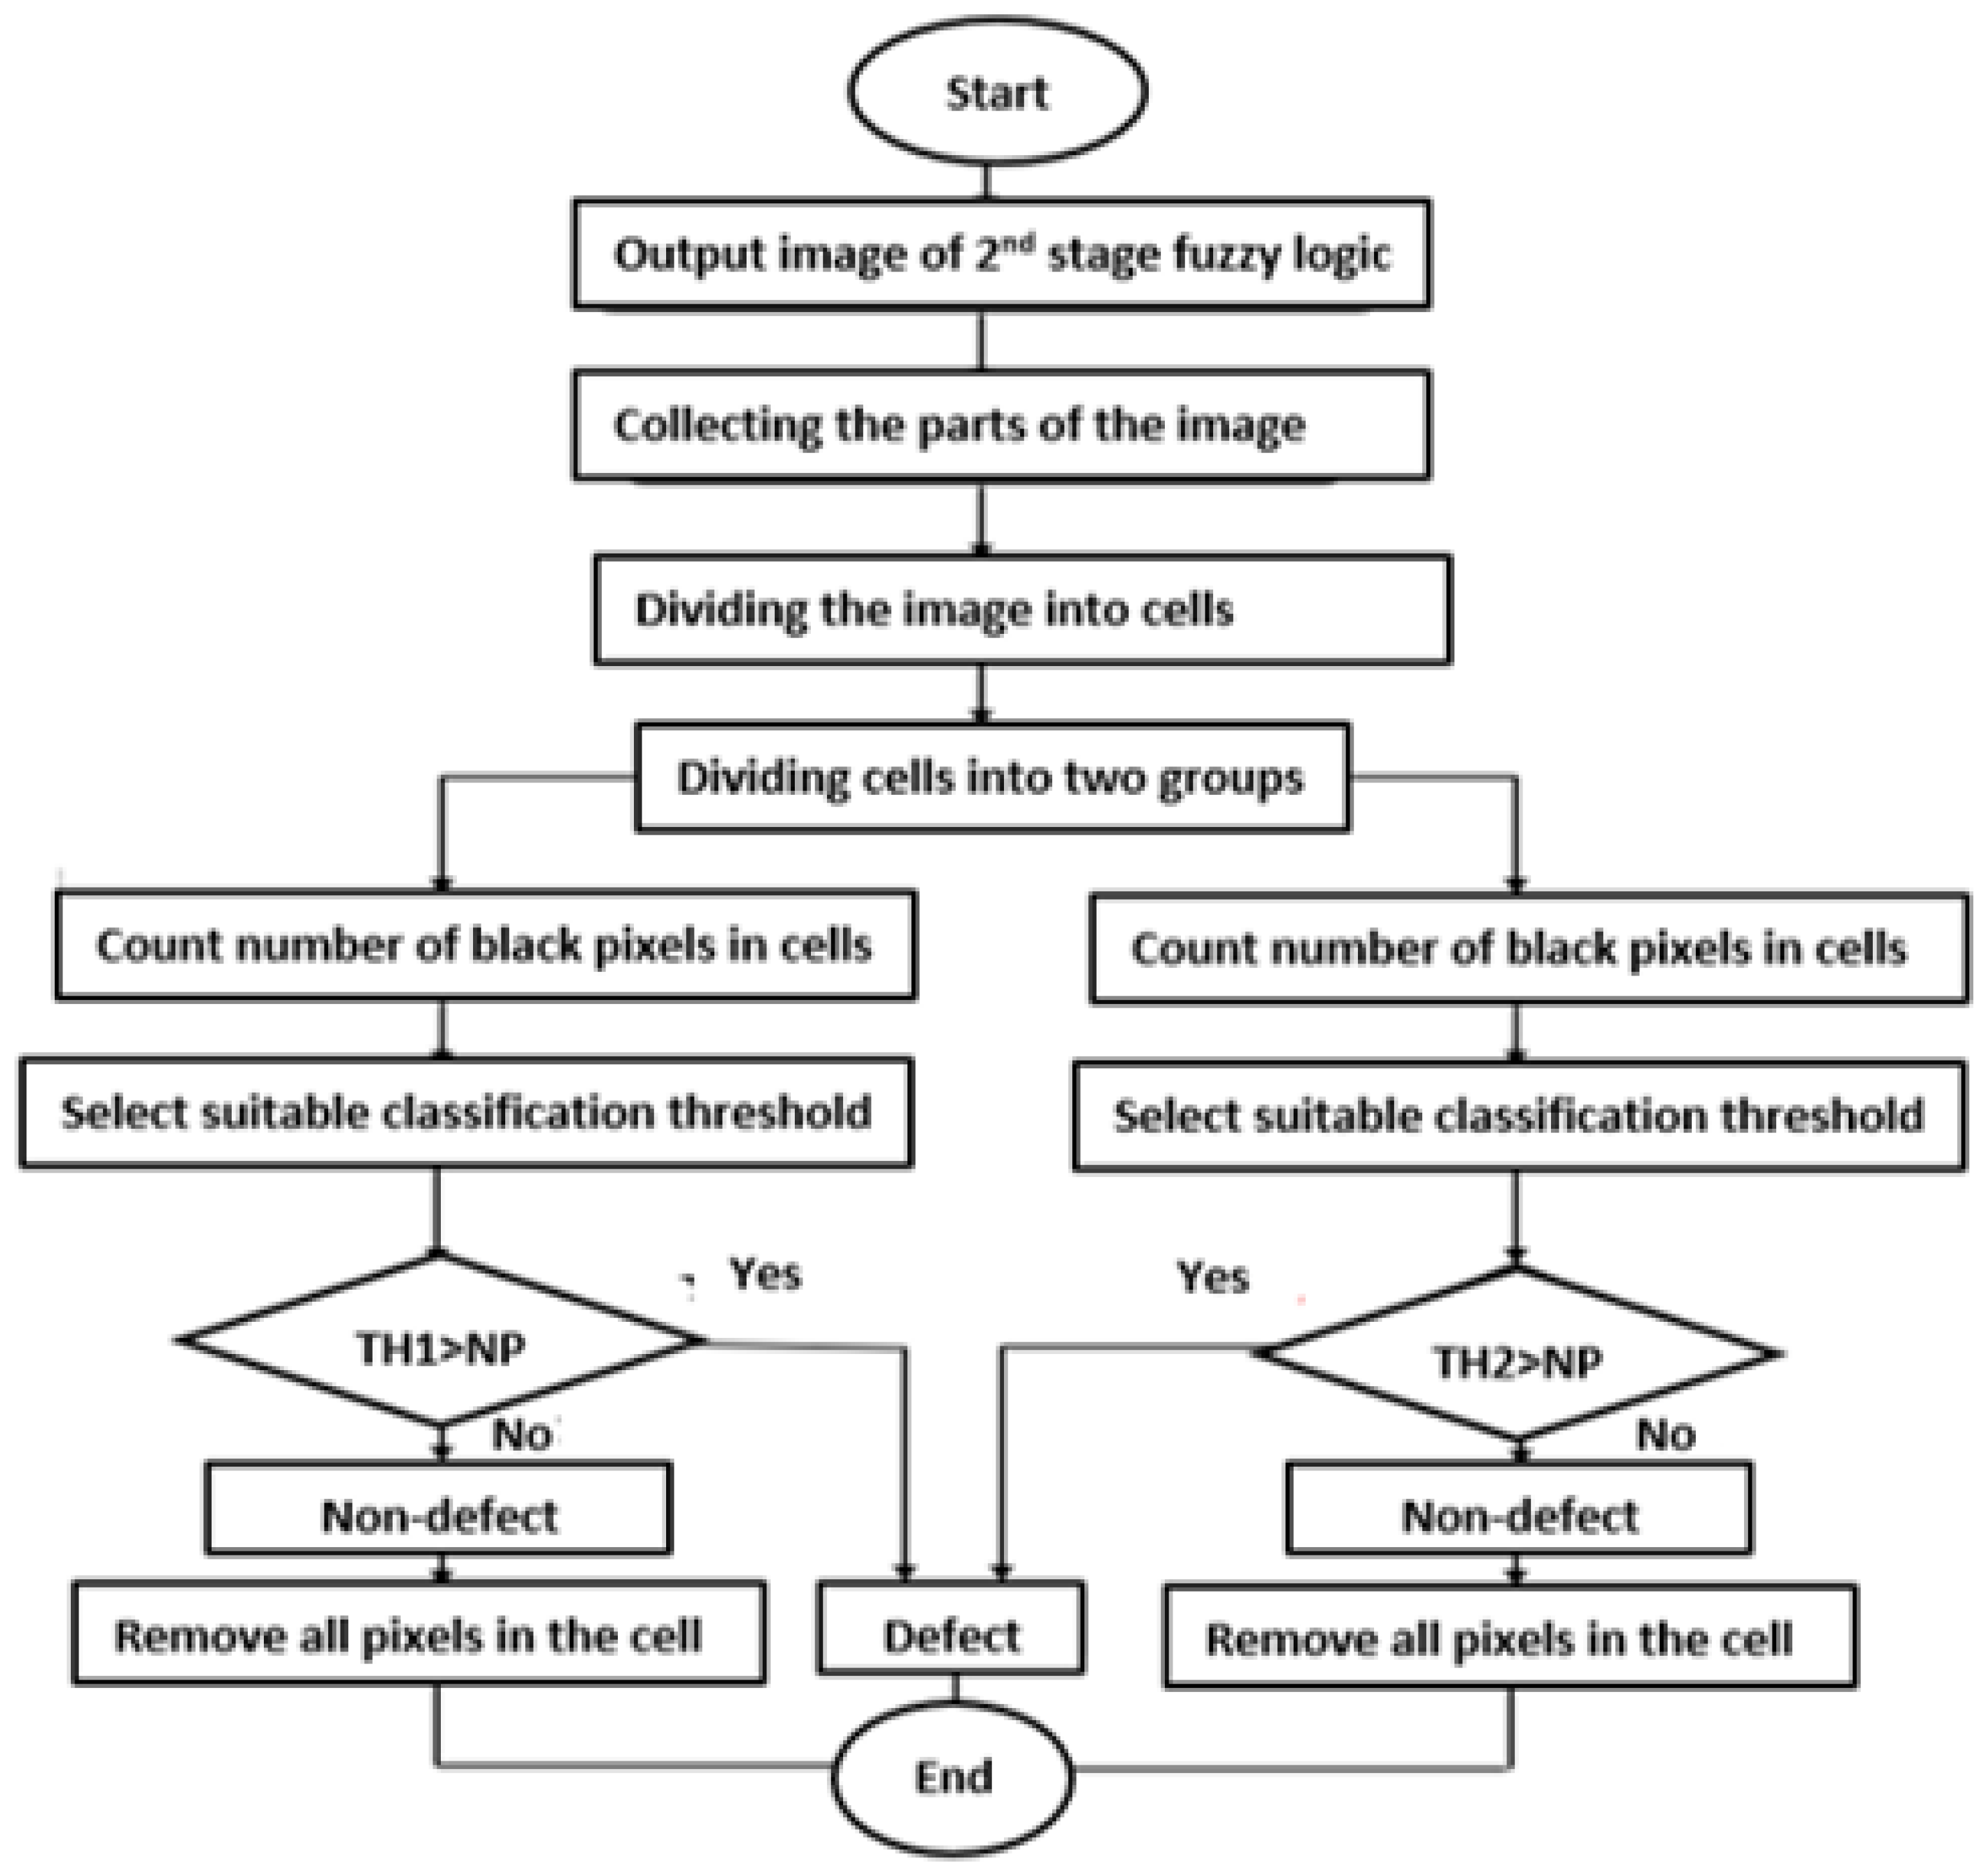
Figure 28. The third stage of the threshold algorithm aims to remove the high noise that can be located above and below the tank as shown in
Section 2.4. As shown in
Figure 28, there are numbers of cells that show black pixel density.
The threshold value in the cells located above the tank is estimated at 3500 black pixels, while those located below the tank are estimated at 3000 black pixels. Cells in which the black pixel exceeds the threshold value are classified as high noise, while others are classified as defects.
In the first, second, third, and fourth samples, as shown in
Figure 28a–d, there are no cells where the number of black pixels exceeds the threshold value, indicating the absence of high noise. In the fifth sample, as shown in
Figure 28e, cell 68 is the only one where the number of black pixels exceeds the threshold value, and this indicates the presence of high noise in this cell. In the sixth sample, as shown in
Figure 28f, there are several cells (2,3,12,13,14) where the number of black pixels exceeds the threshold value, which indicates the presence of high noise.
3.2. Results Discussion and Evaluation
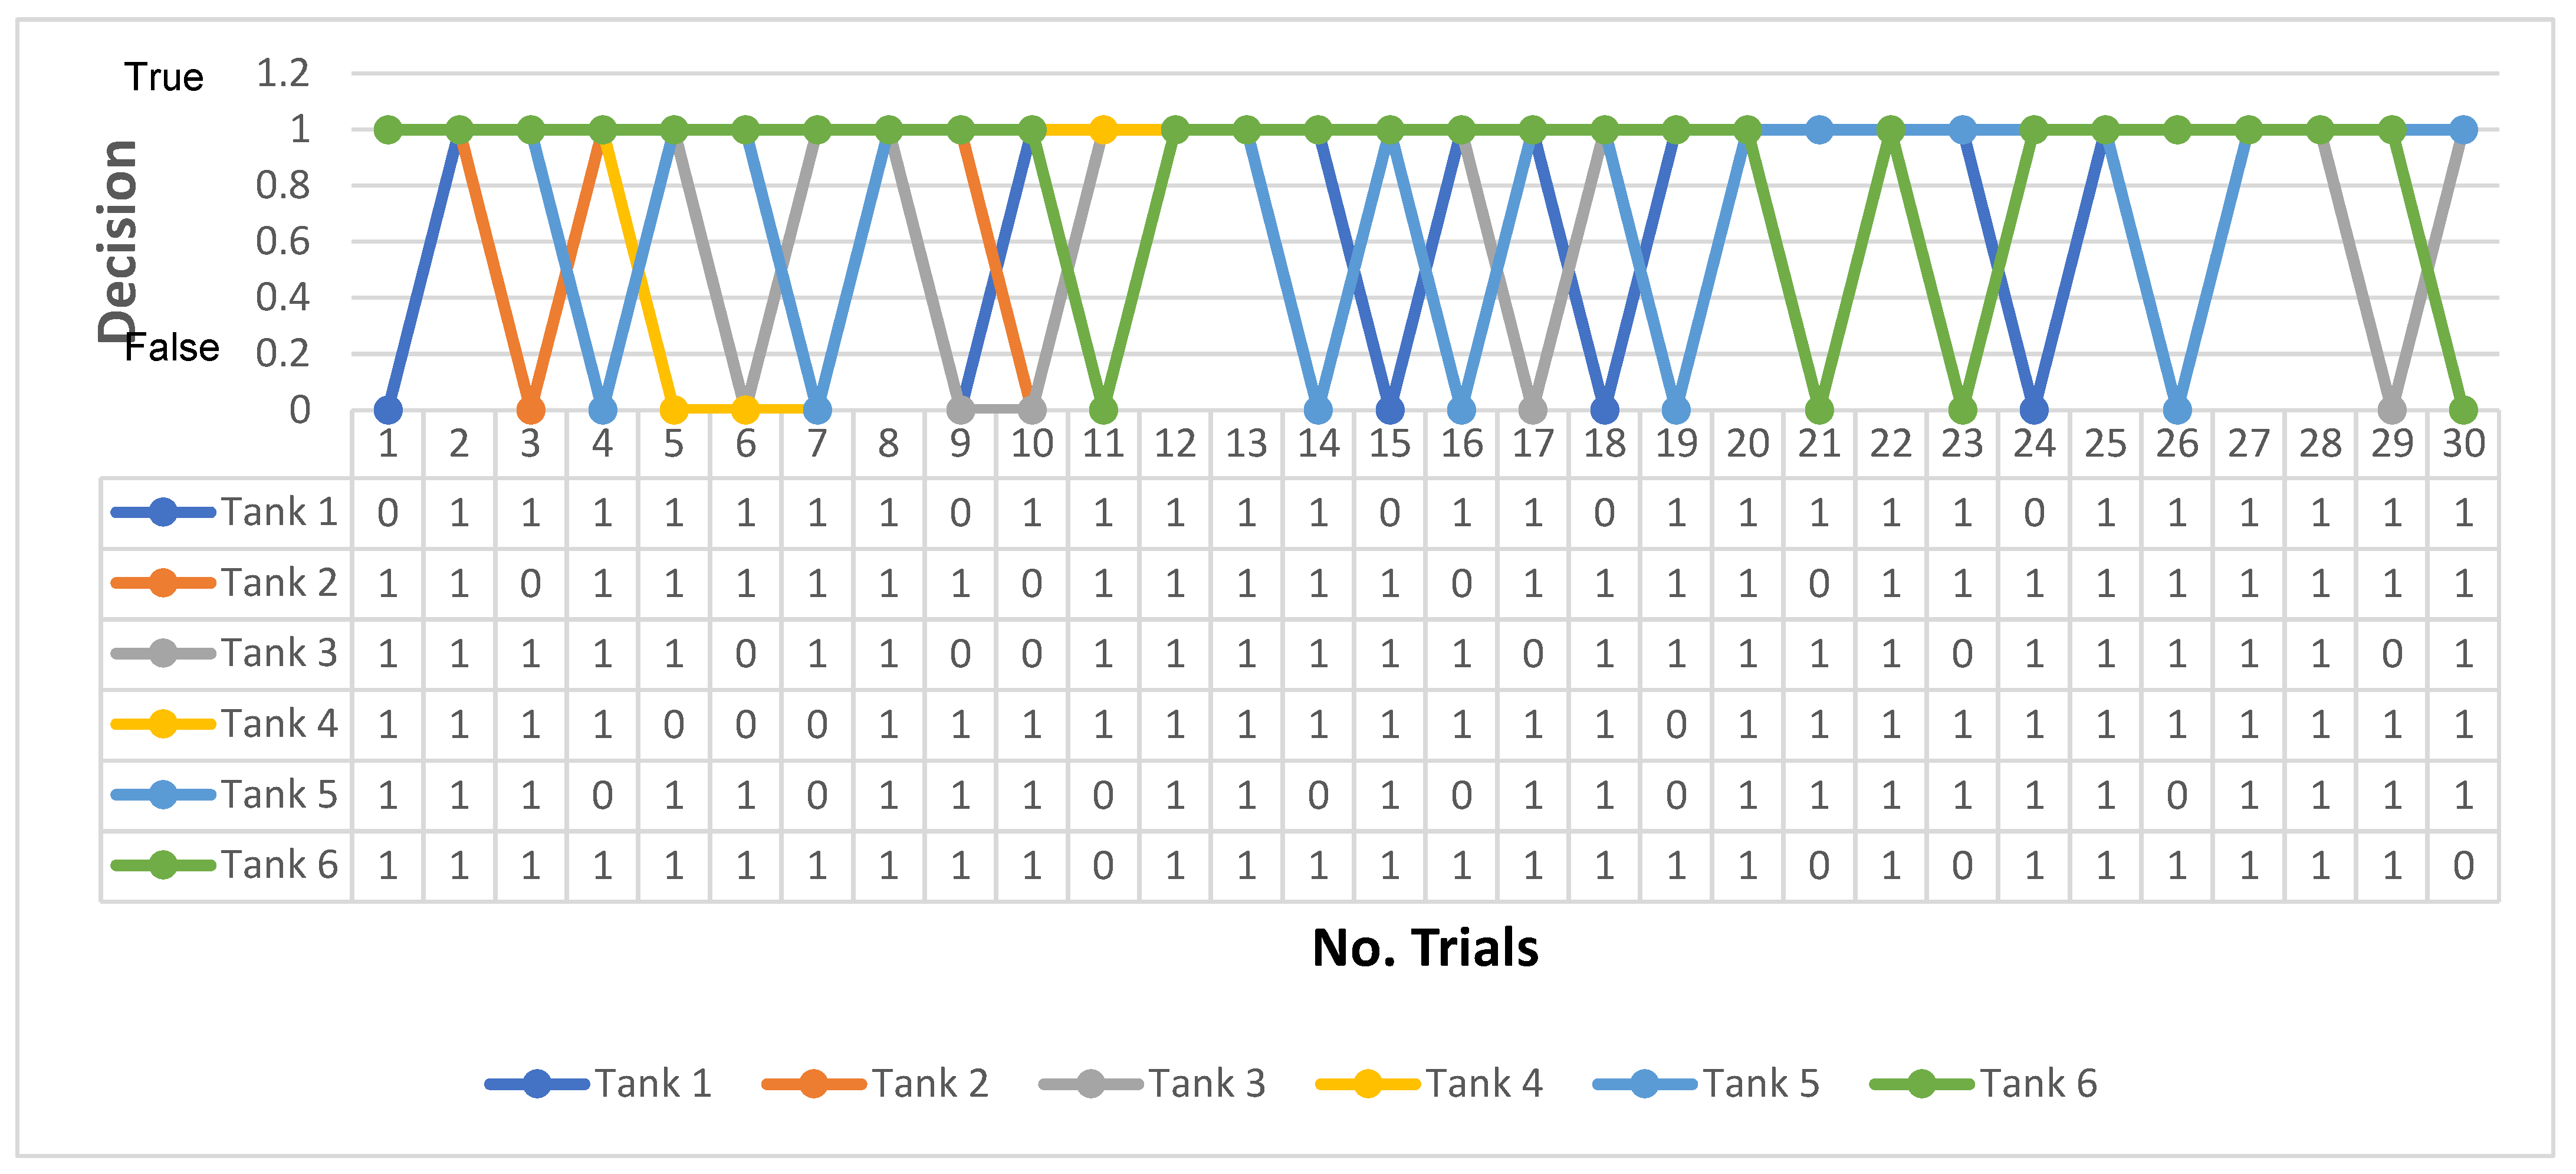
To measure the reliability and accuracy of the proposed UAV-based inspection process, the experiments for all the above cases were repeated 30 times for each tank with a total of 180 trials. This test shows the limits of the visual inspection system capability to detect defects and distinguish them from noise. The final classification process was performed by visually viewing the samples and classifying them into defective pure or defective impure samples.
Pure defects are those that are free of any noise while impure defects still contain some noise. The current study of the samples shown in
Figure 23 proves that the first, second, third, fourth, and sixth samples contain pure defects and only the fifth sample contains impure defects.
Figure 29 shows the classification results after executing the three stages of processing for each tank with 30 trials, in which the proposed algorithms gave an average of the right decisions equal to 83.33%, 86.66%, 80%, 86.66%, 76.66%, and 86.66% for trials in tanks 1, 2, 3, 4, 5, and 6, respectively, as shown in
Figure 29. Thus, a successful classification accuracy among all trials in the six tanks is around 83.33%.
An average of 26.77% of the trials were associated with big noise that was wrongly classified, even though most of the noise was removed. The reasons behind the incorrect classification results are as follows: Some of the noise from the first stage of processing still remained in the second stage and was wrongly classified as less than 30% or higher than 70%, so such noise was not entered into second stage.
There are some failures that appear as a result of the uncontrolled and random cropping process. In order to overcome this dilemma, the input image must be cropped with a strong focus, making it more proportional and compatible with the specified restrictions, so it is necessary to crop an exact image during the execution of this process.
The fuzzy logic inference system as designed in
Section 2.2 was applied to remove the noise effects. The fuzzy logic first stage was aimed at eliminating the effects of the low-scale noise as depicted in
Figure 25.

 ,
, 


