
Towards a Quantitative Approach for Determining DAA System Risk Ratio

Abstract
:1. Introduction
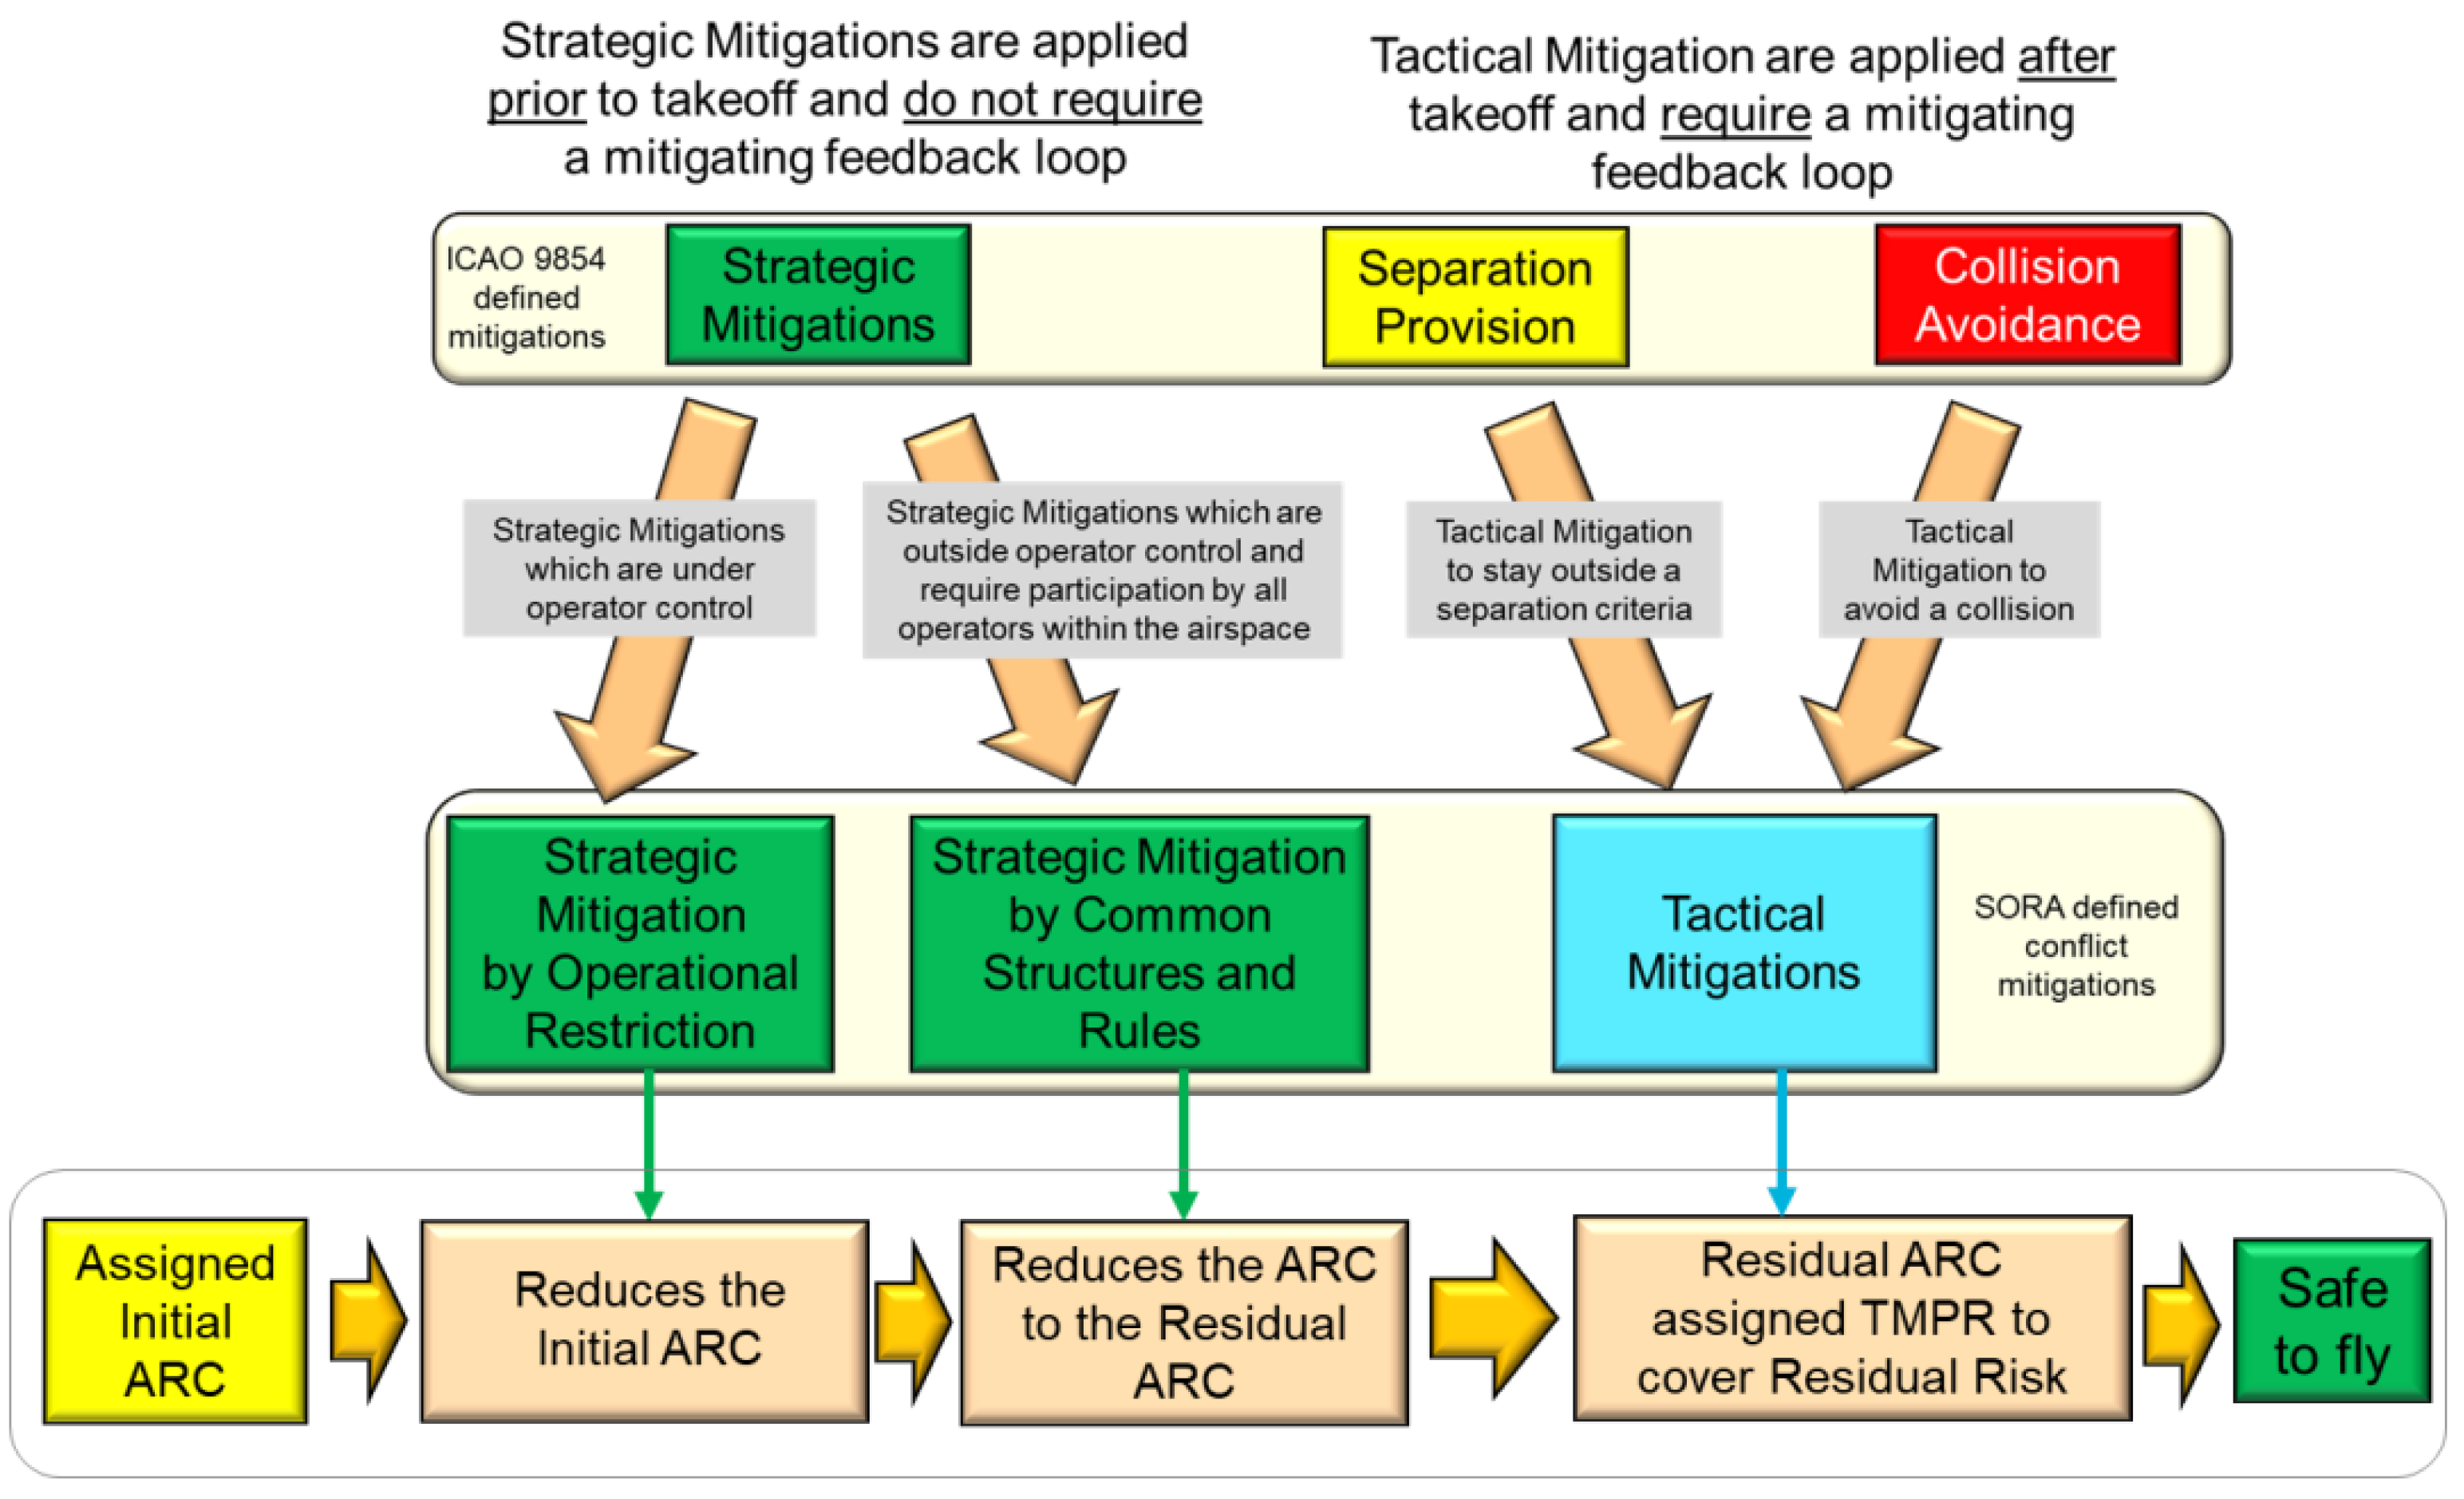
2. SORA Overview
- 1.
- Four Air Risk Classes (ARC): ARC-a thru ARC-d, where ARC-a is generally defined as airspace where the risk of collision between an RPAS and traditional aircraft is acceptable without the addition of any tactical mitigation. ARC-b, ARC-c, ARC-d generally define airspace with increasing risk of mid air collision. ARC can be considered as a generalized qualitative classification of the rate at which a RPA would encounter traditional aviation in the specified airspace environment.
- 2.
- Ten Ground Risk Classes (GRC): 1 thru 10, with increasing risk of persons on the ground being injured by the RPAS.
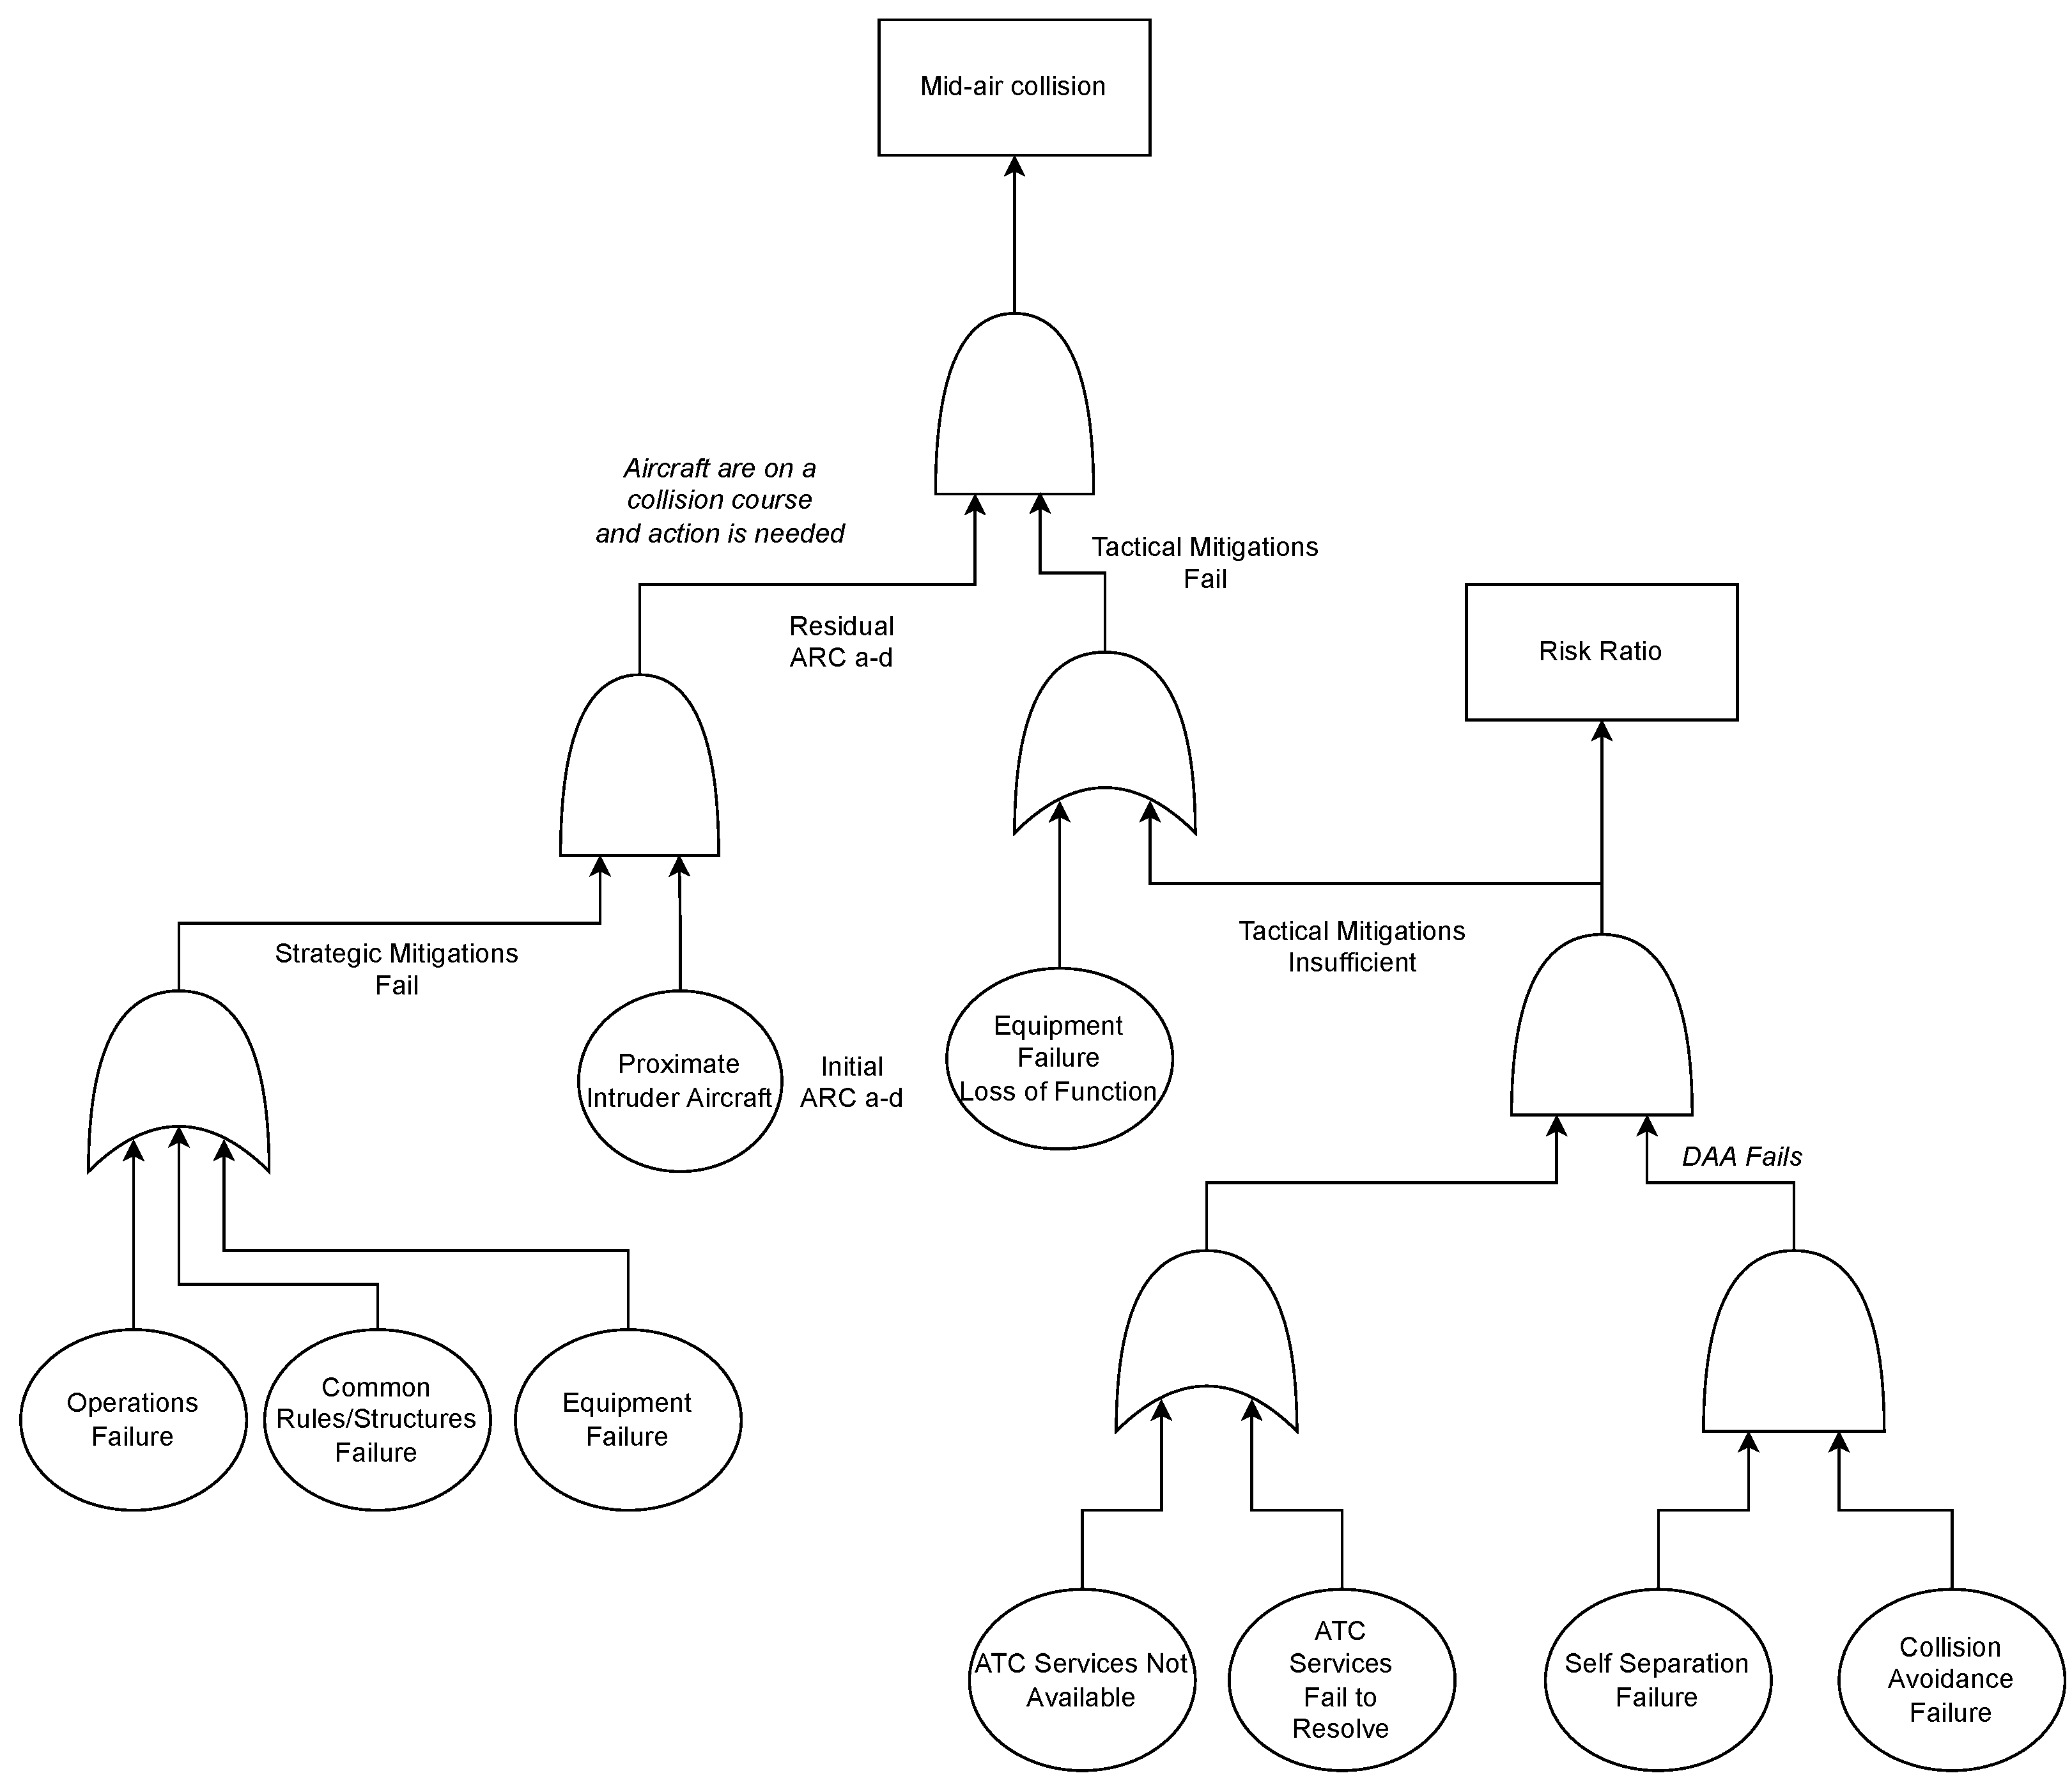
3. Determining Risk Ratio
3.1. Detection Volume
- 1.
- The RPA speed and collision avoidance maneuver performance;
- 2.
- Human factors, and command and control link latency in initiating the avoidance maneuver; and
- 3.
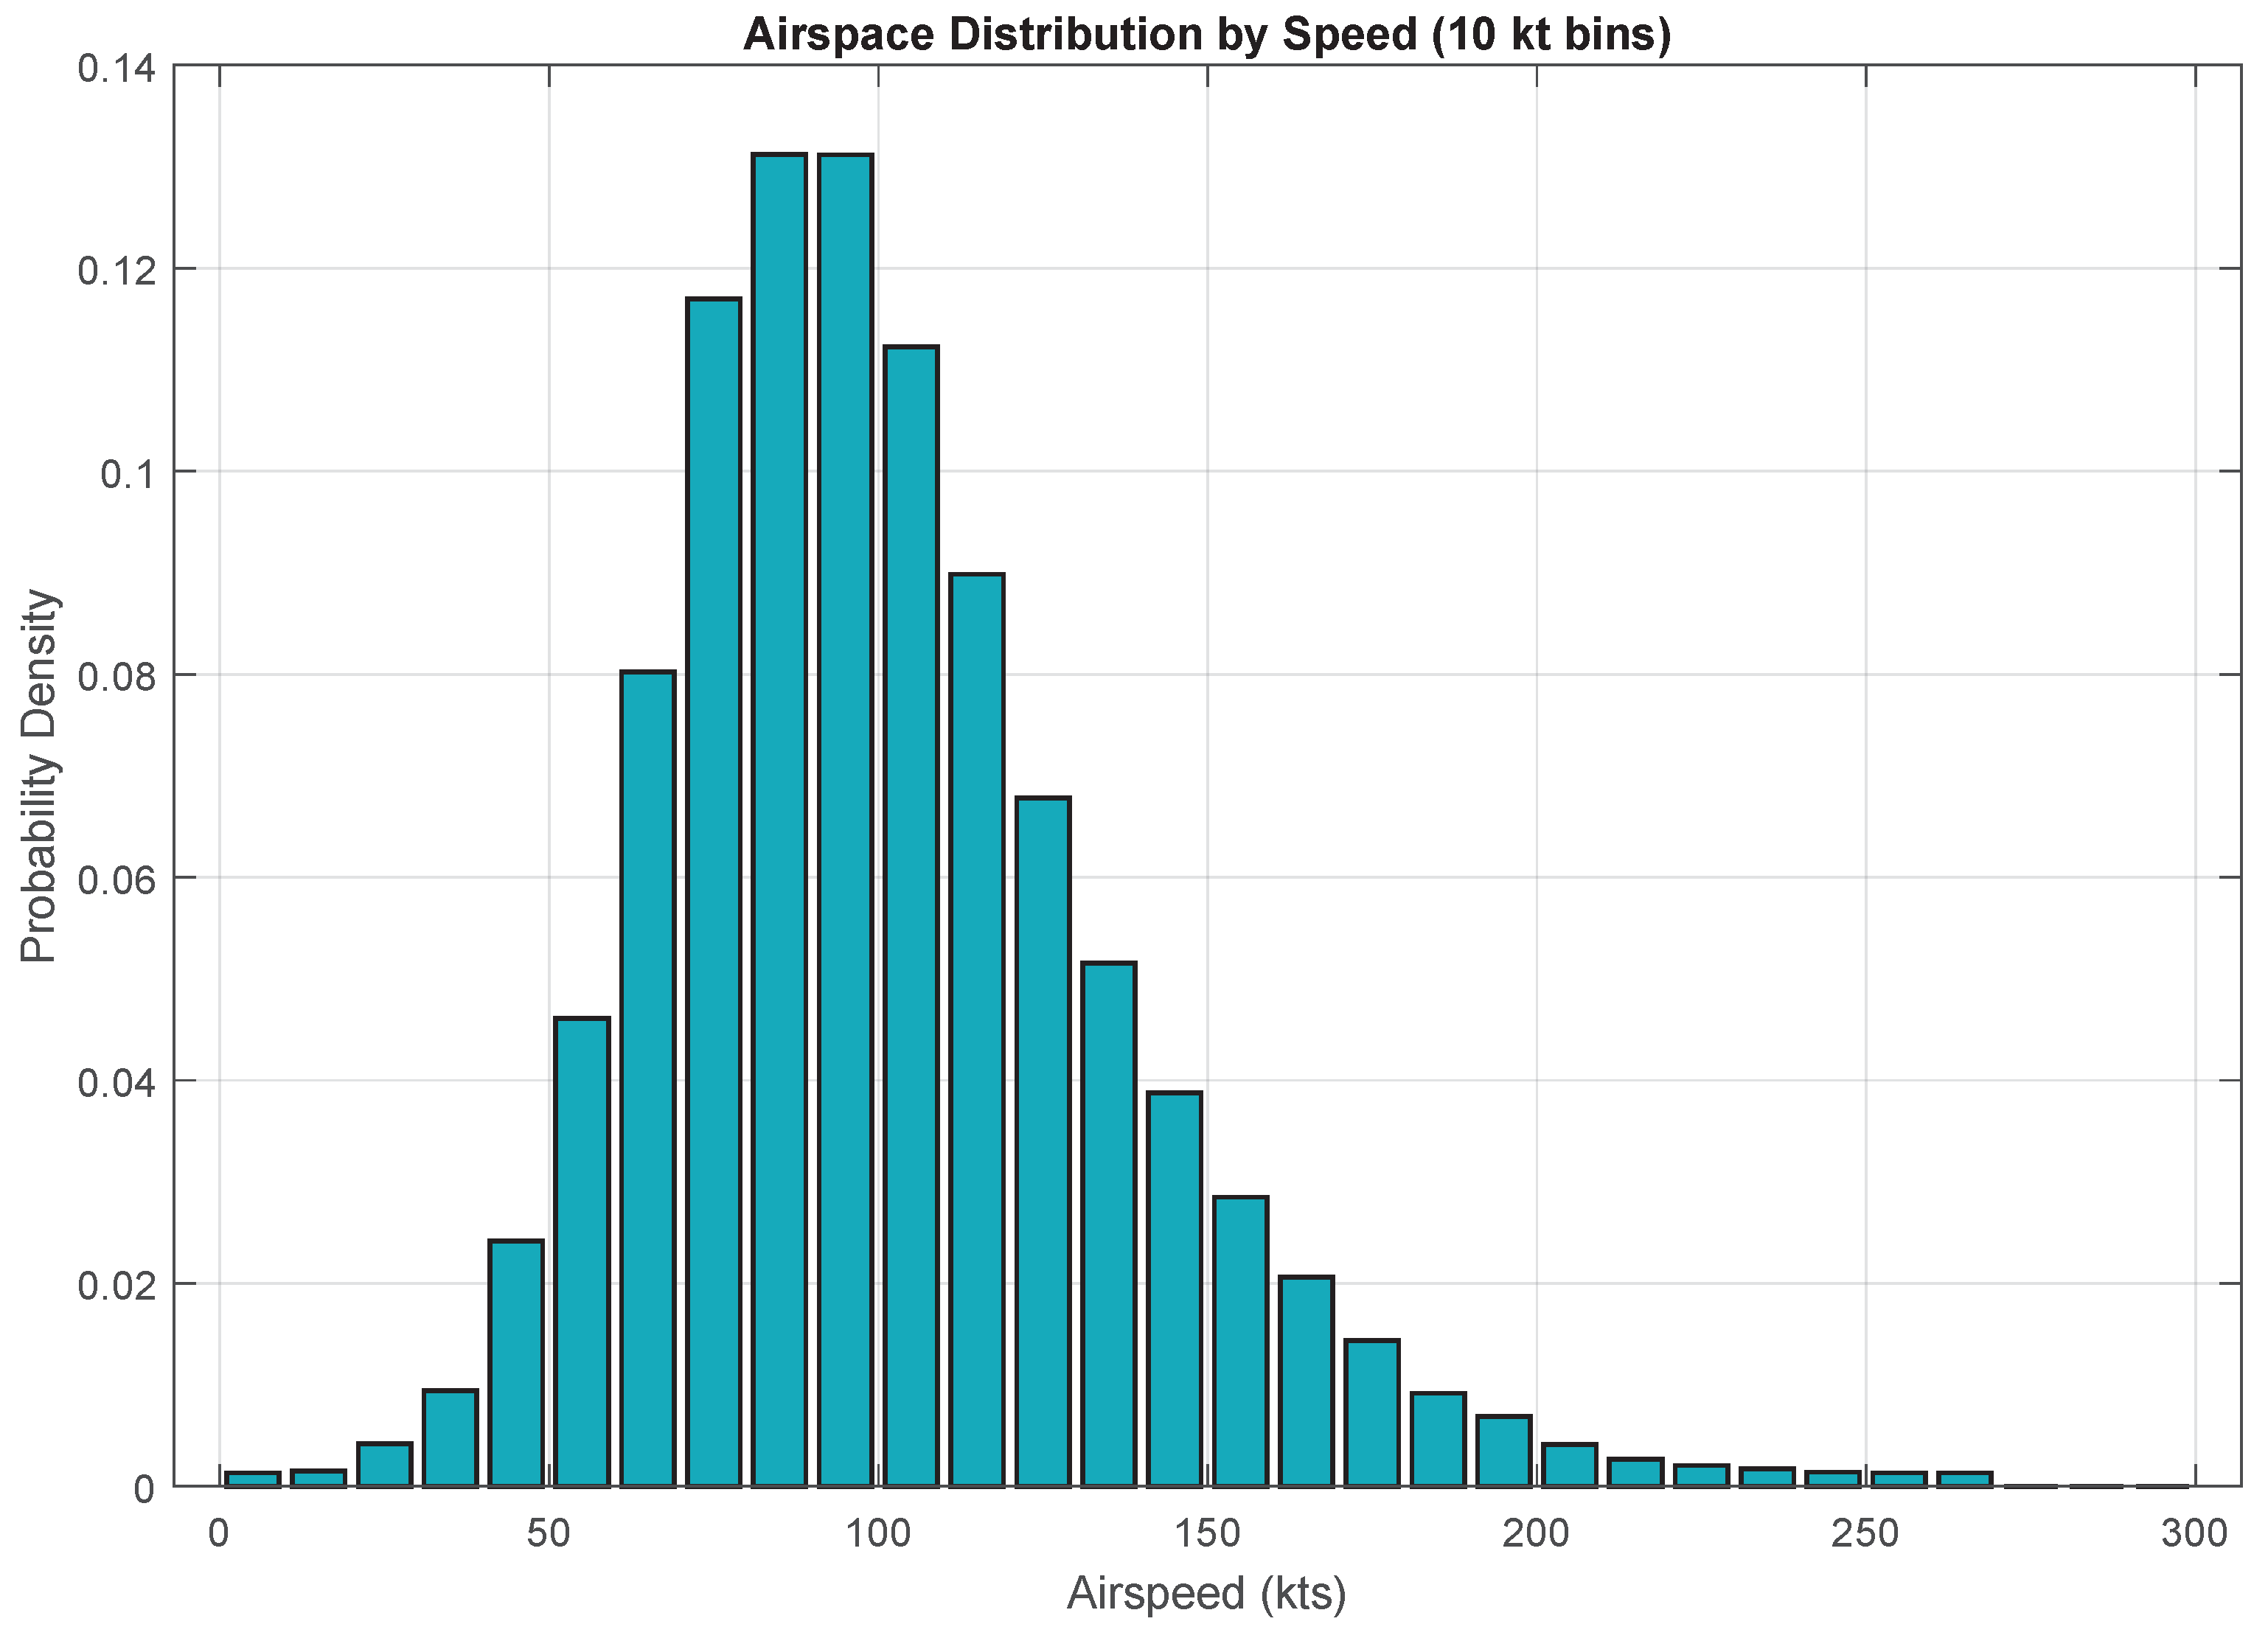
- A probability distribution of aircraft speeds in the airspace in which the operation is planned.
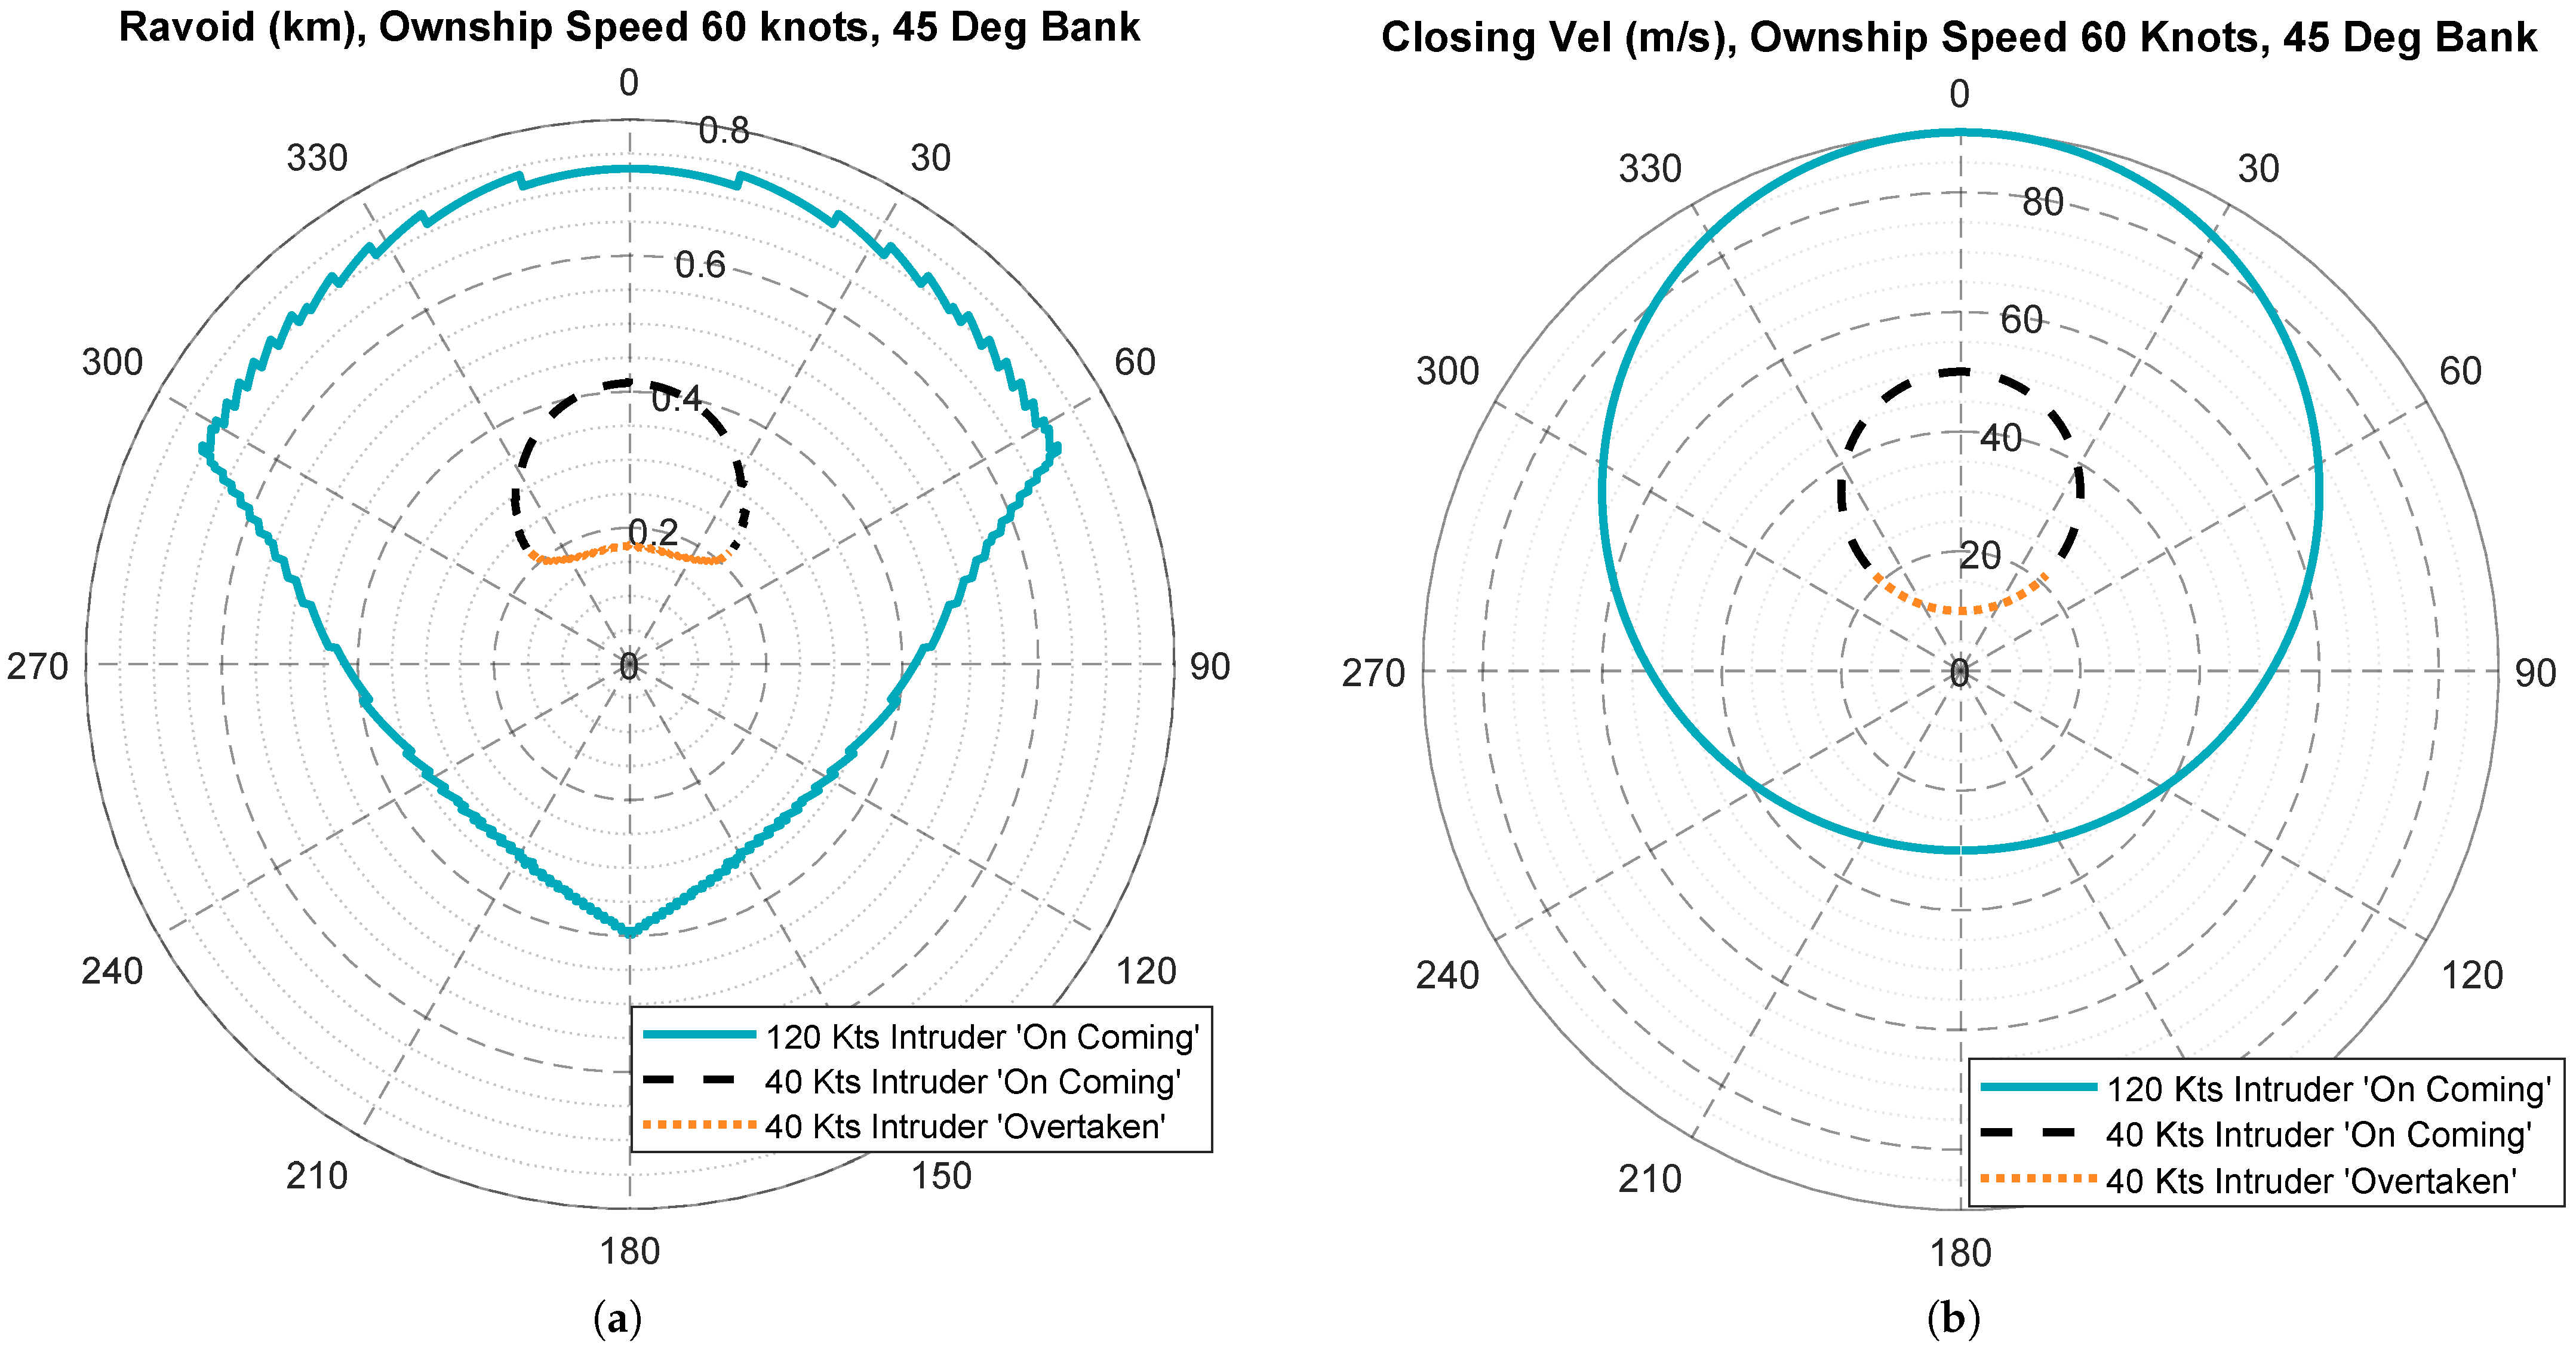
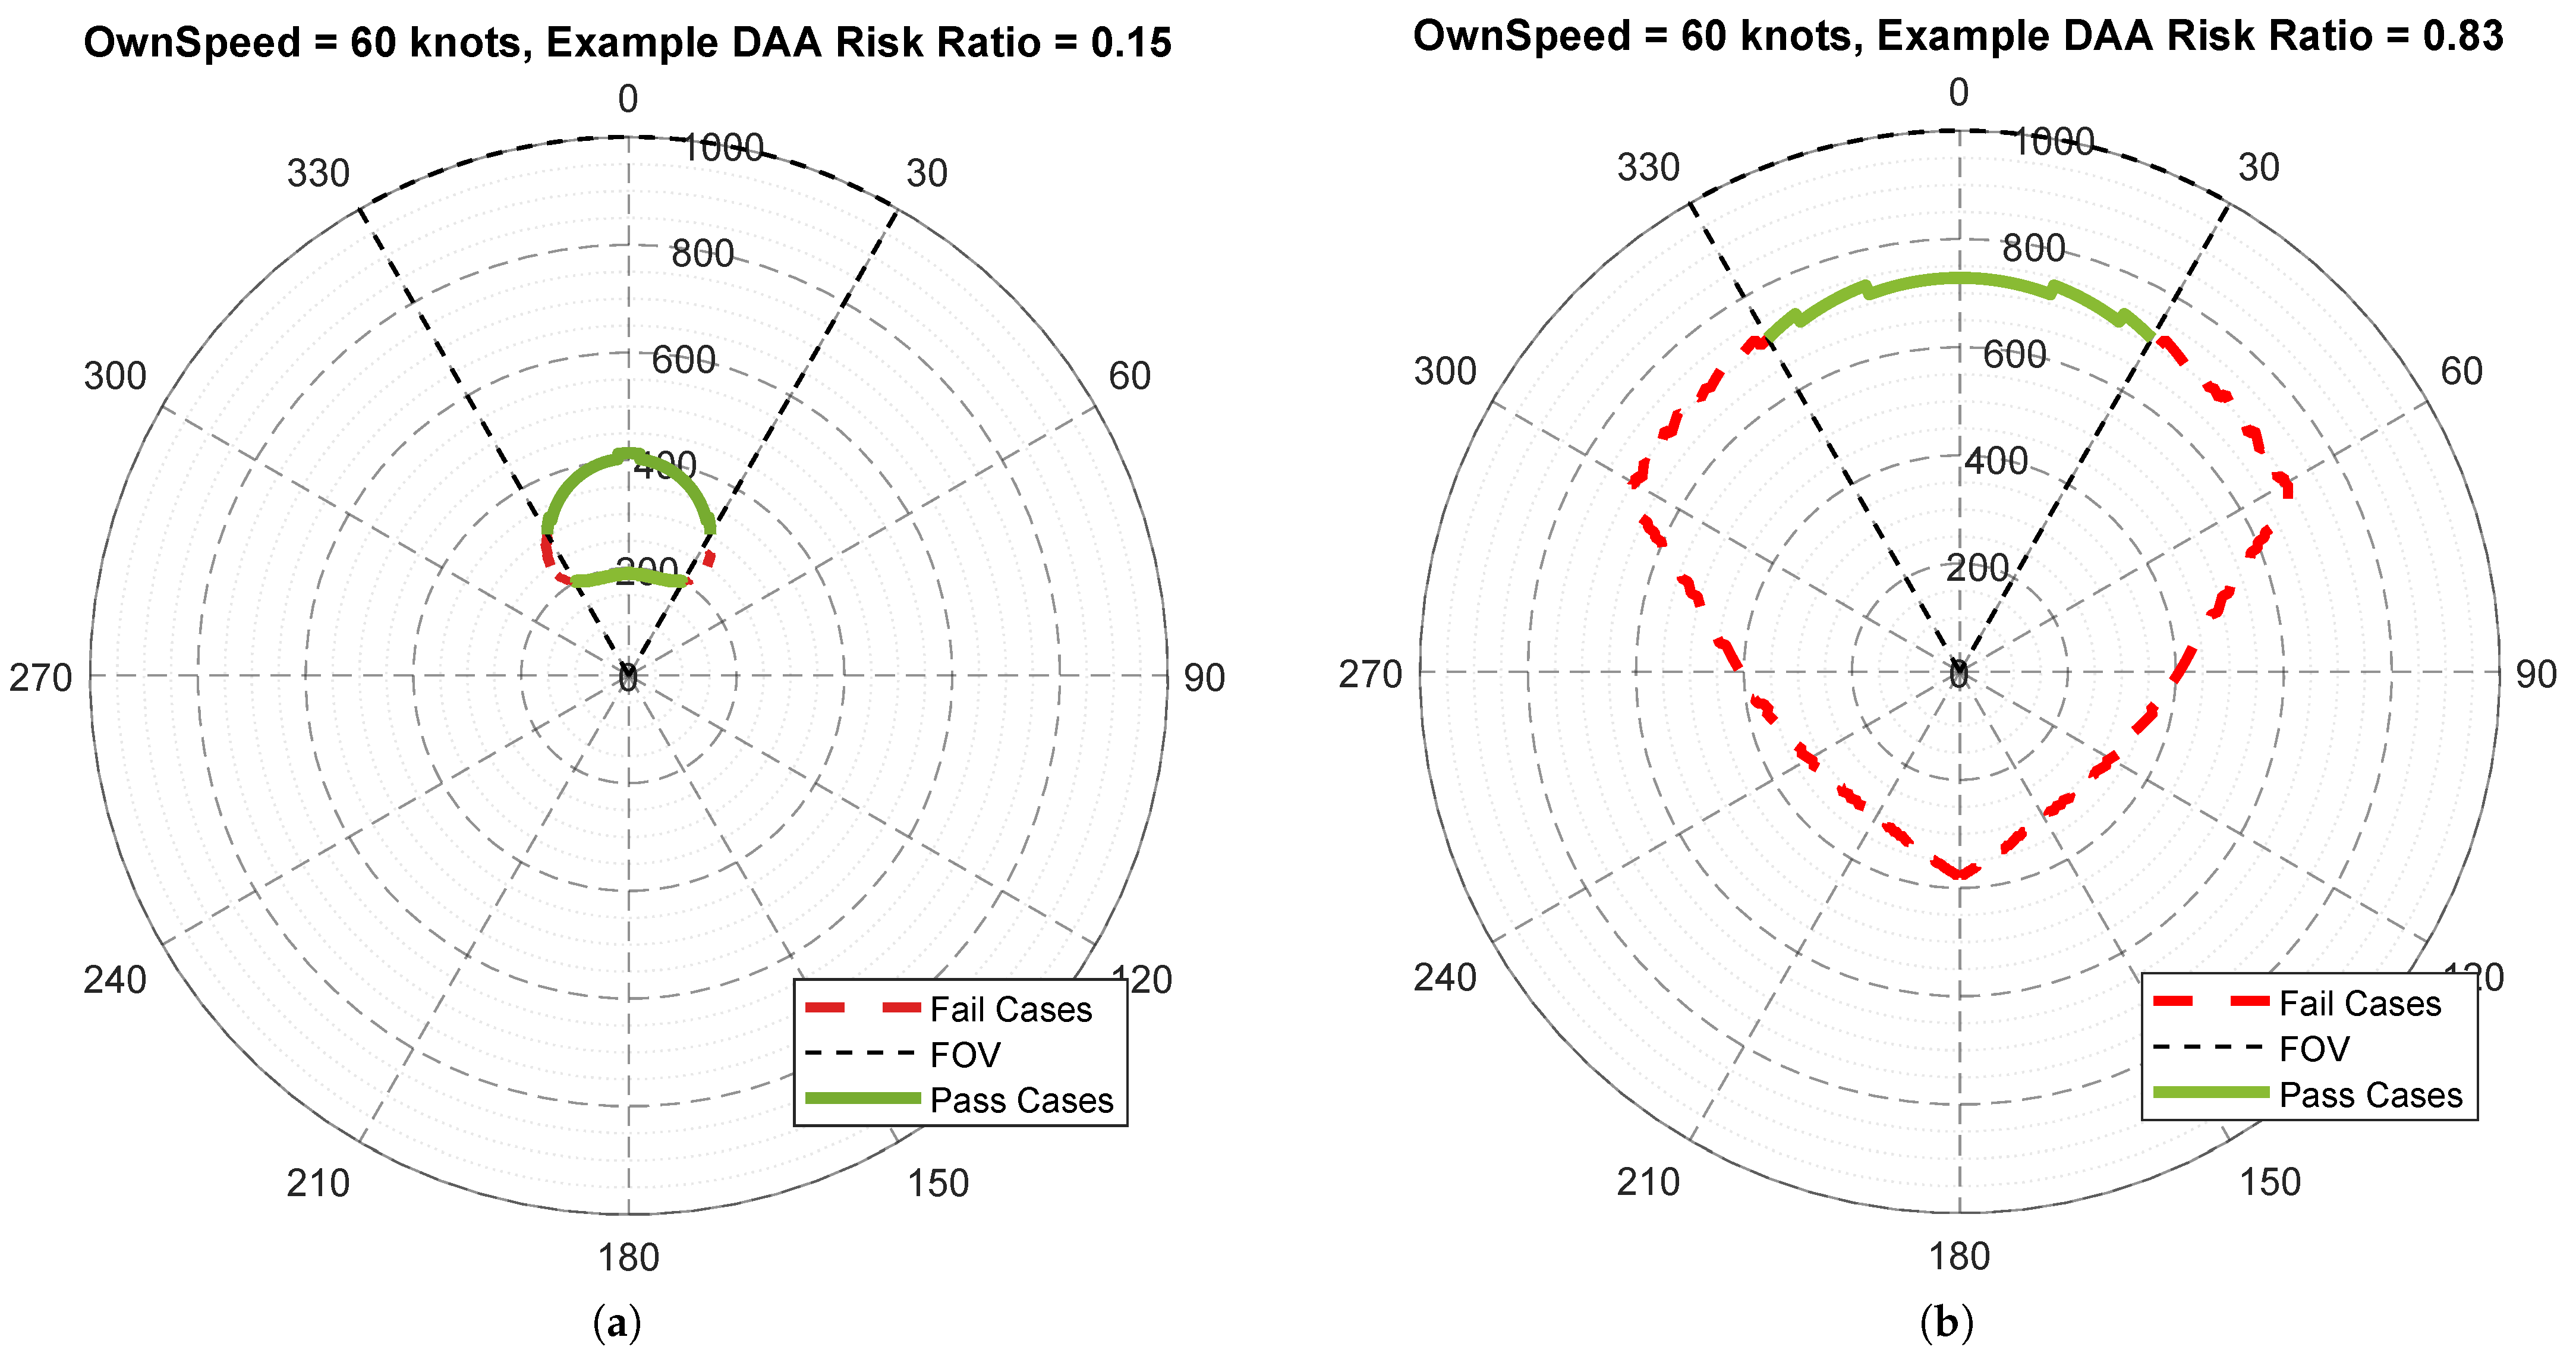
3.2. Determining the Avoidance Volume
- 1.
- A single non-maneuvering, level flight intruder aircraft;
- 2.
- A level flight ownship RPA prior to the avoidance maneuver;
- 3.
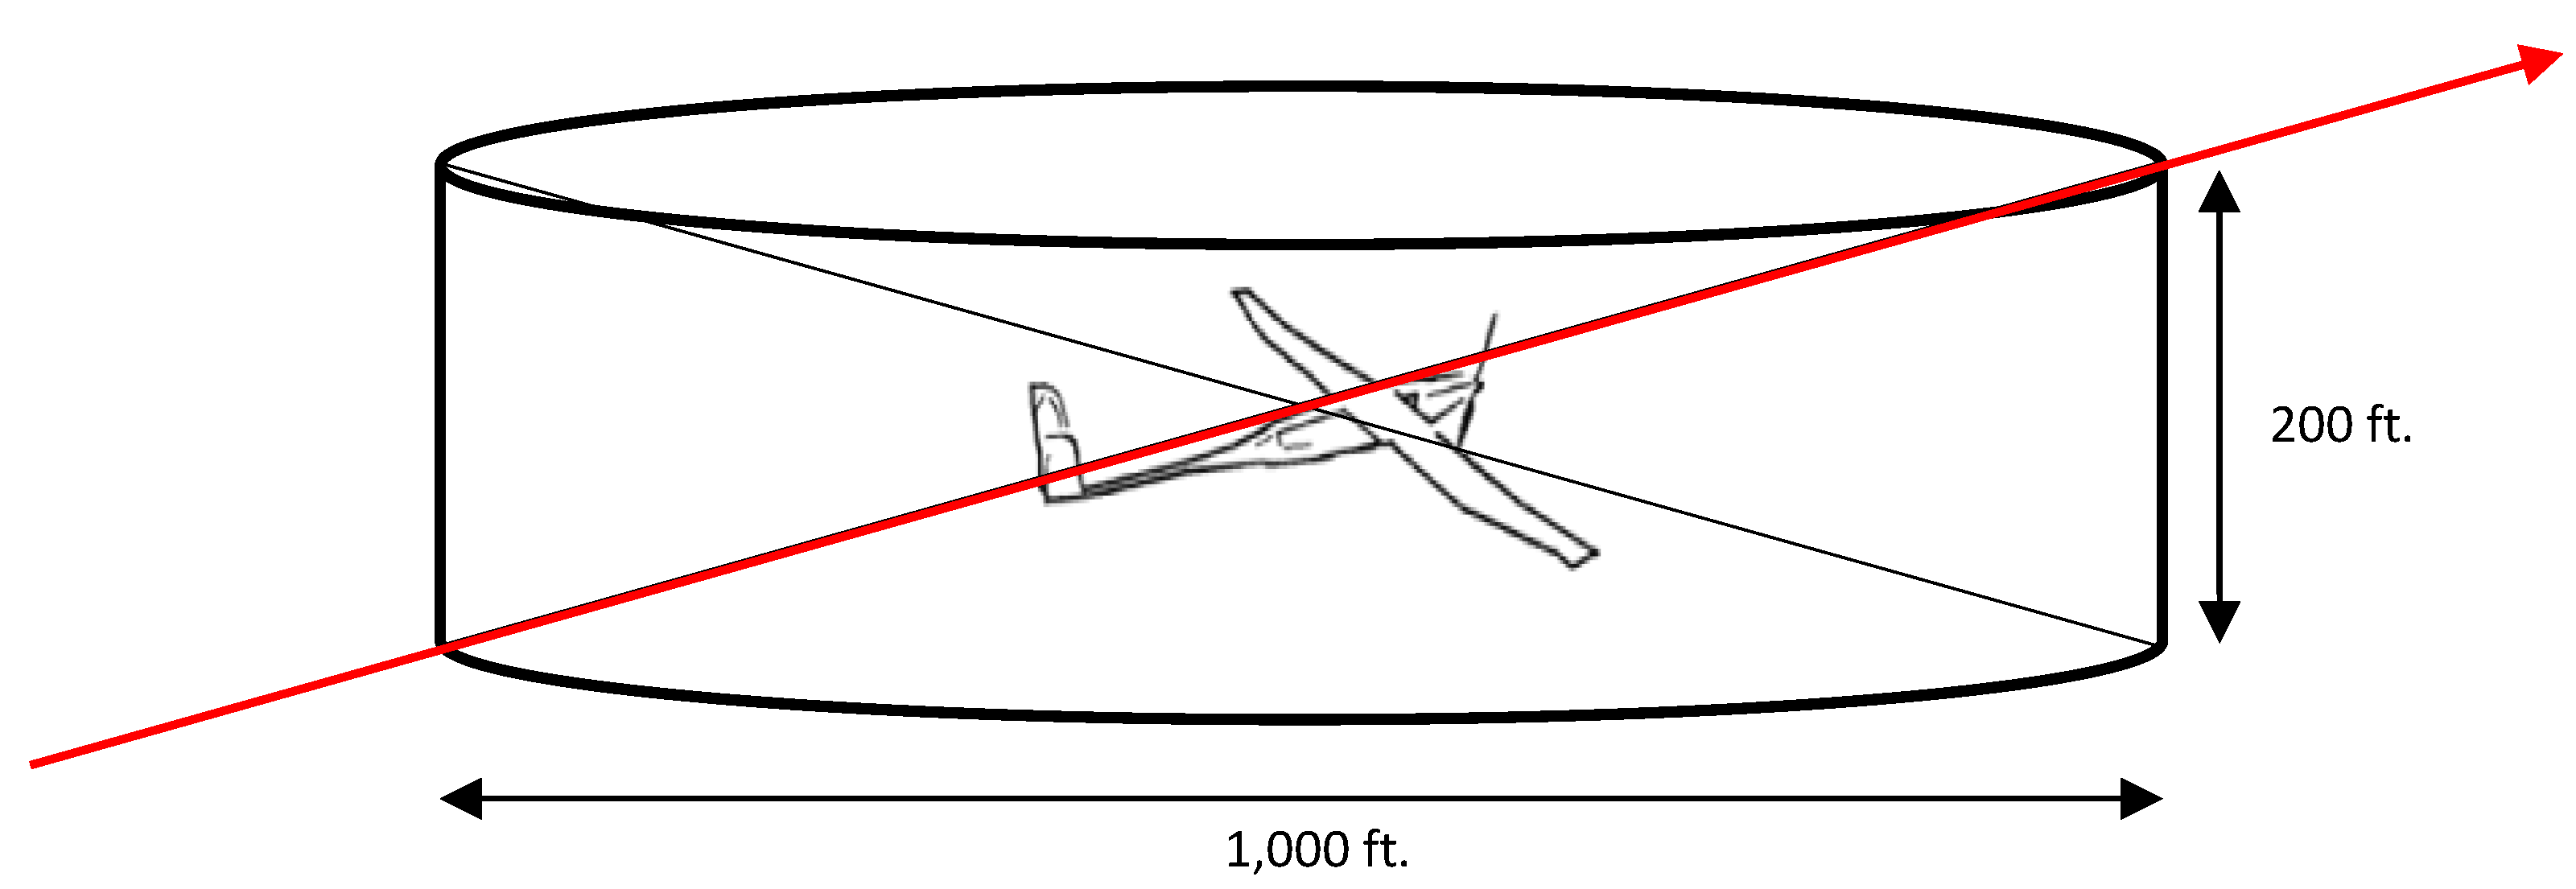
- A fixed volume of space around the RPA, known as the Collision Volume (CV), is protected;
- 4.
- A uniform distribution of intruder aircraft initial positions and directions;
- 5.
- A horizontal avoidance maneuver is automatically performed by the RPA, as per the algorithm described in [11].
- 1.
- 2.
- Establishing a collision volume based on a combination of the maximum dimensions of the RPA and the nominal/mean intruder aircraft in the airspace of the operation.
- 1.
- Sensor FOV—60 degrees
- 2.
- Detection range—1 km;
- 3.
- Ownship RPA speed—60 knots;
- 4.
- Automatically executed NRC Horizontal collision avoidance maneuver (constant-rate horizontal turn to a new track angle) [11];
- 5.
- Maximum bank angle—45 degrees;
- 6.
- Maximum roll rate—10 degrees per second;
- 7.
- RPA wingspan—1.5 m.
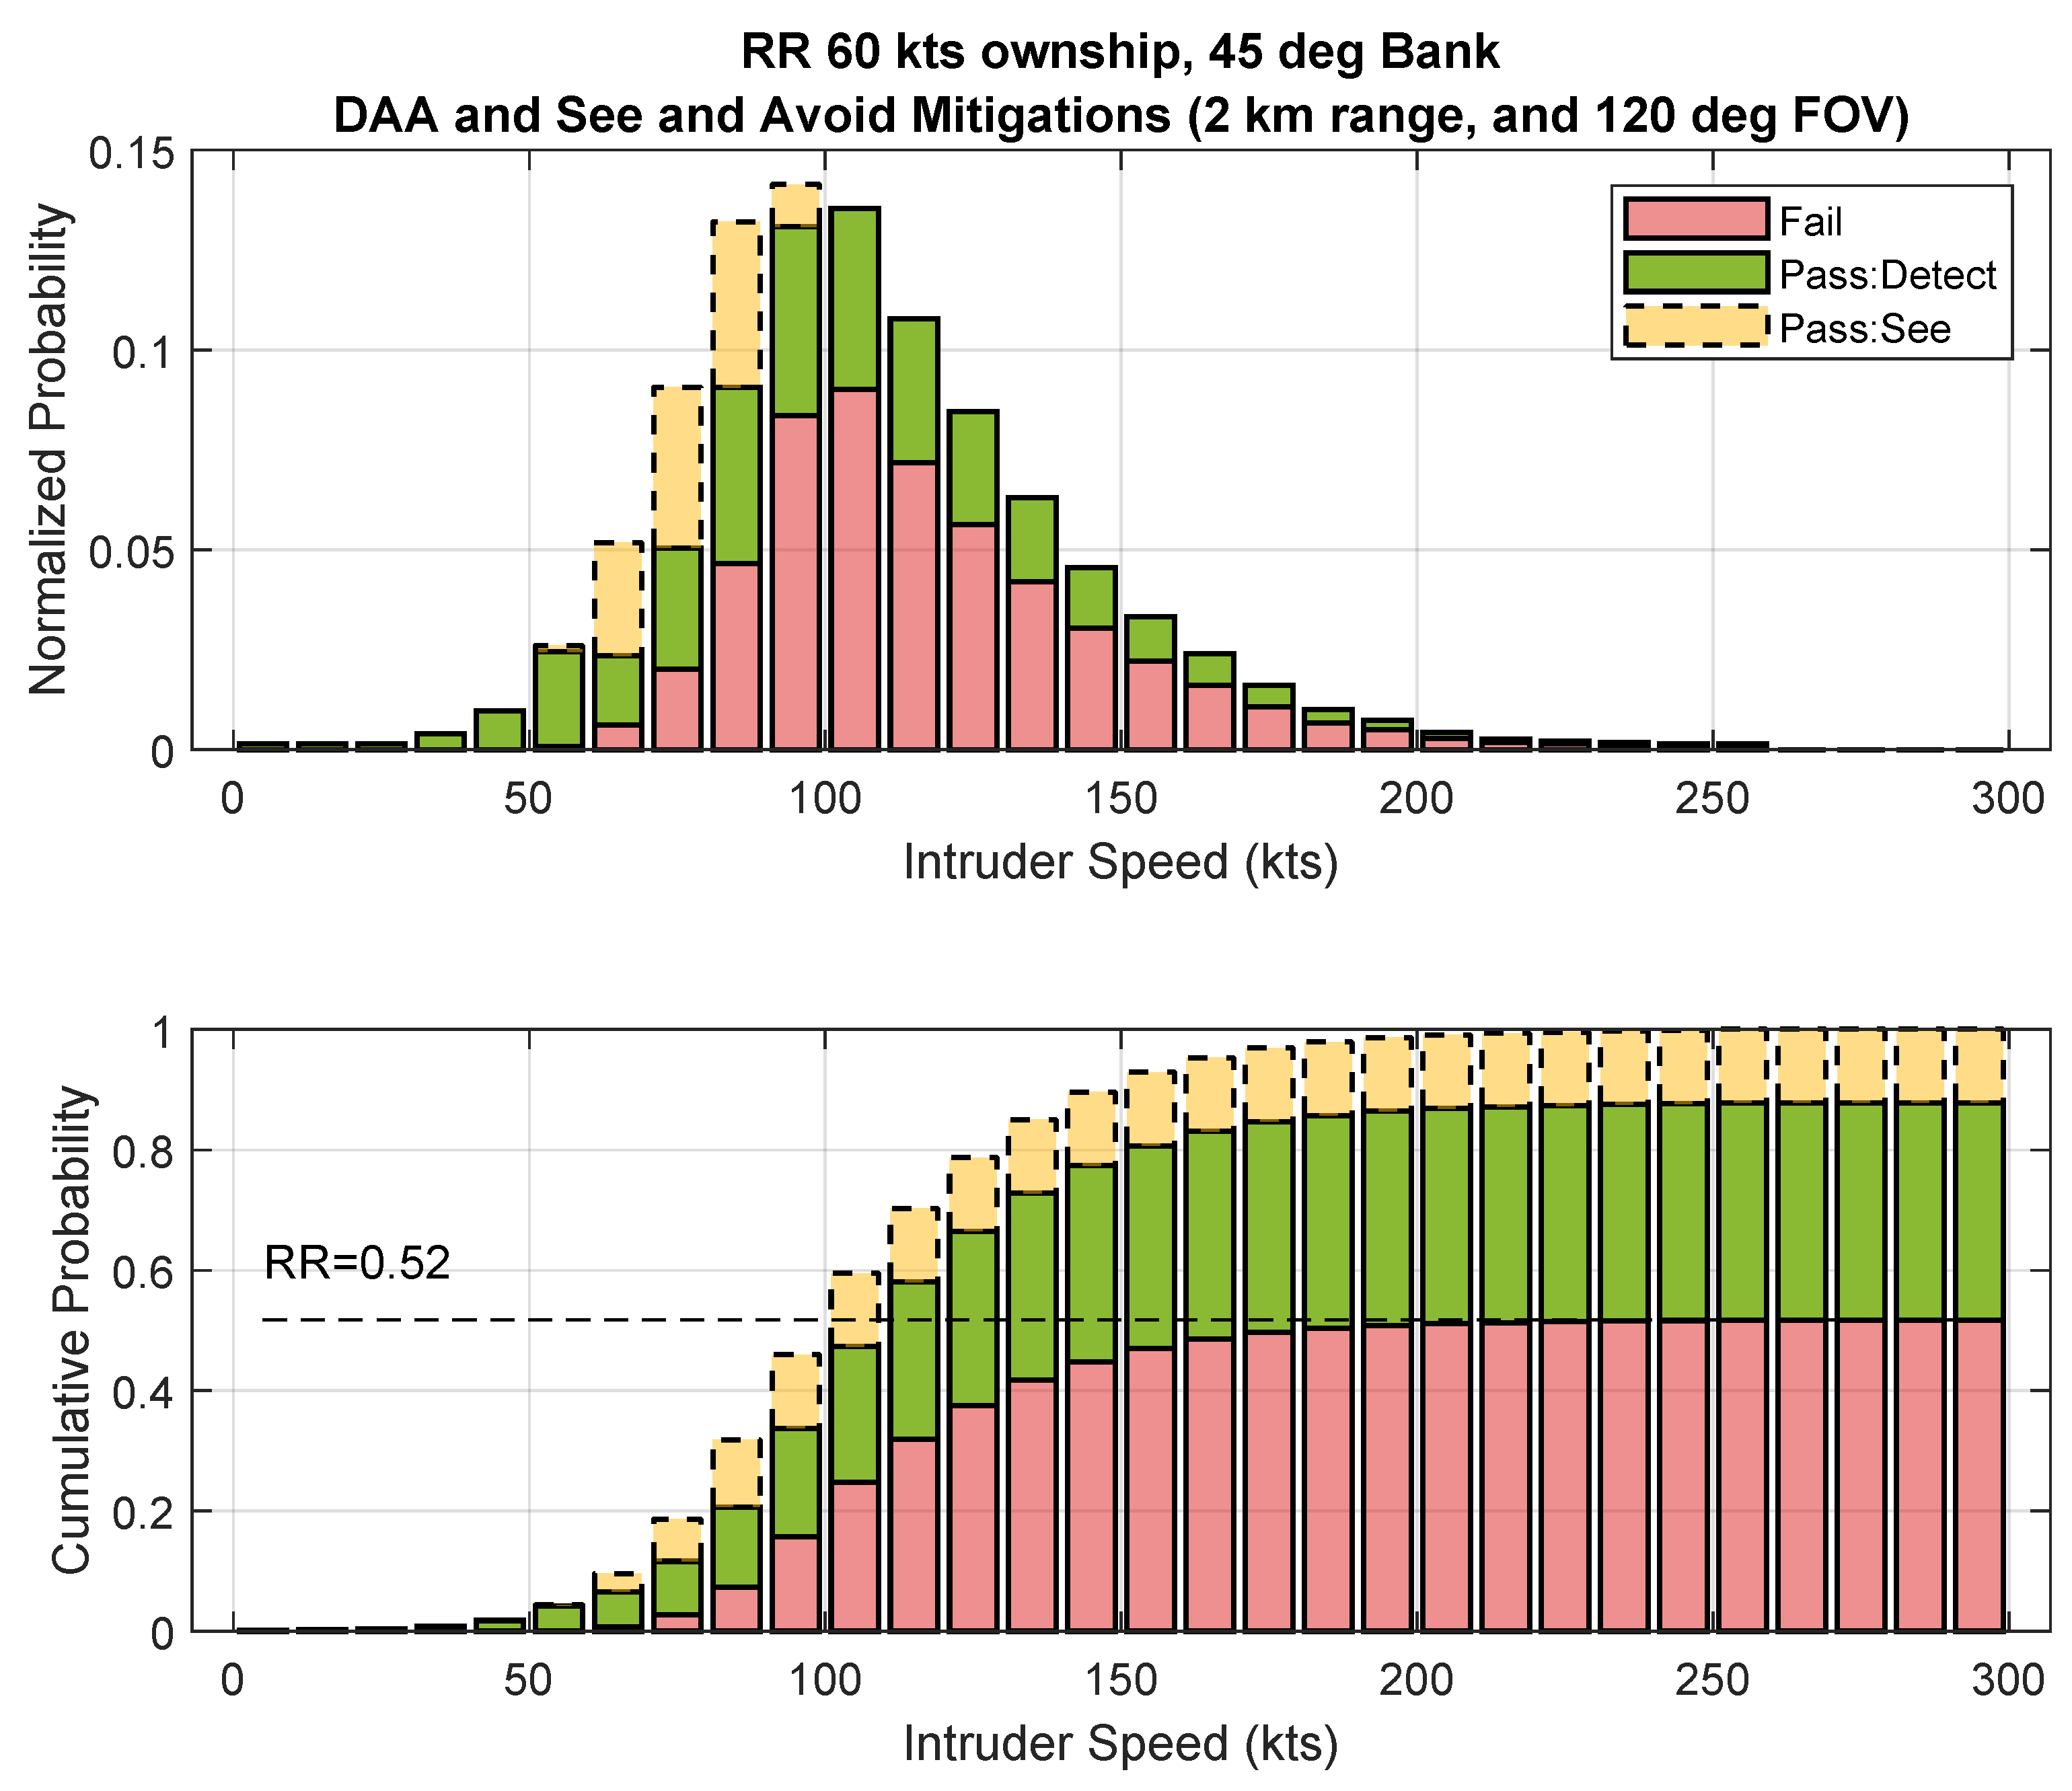
3.3. Airspeed Probability Distribution Model
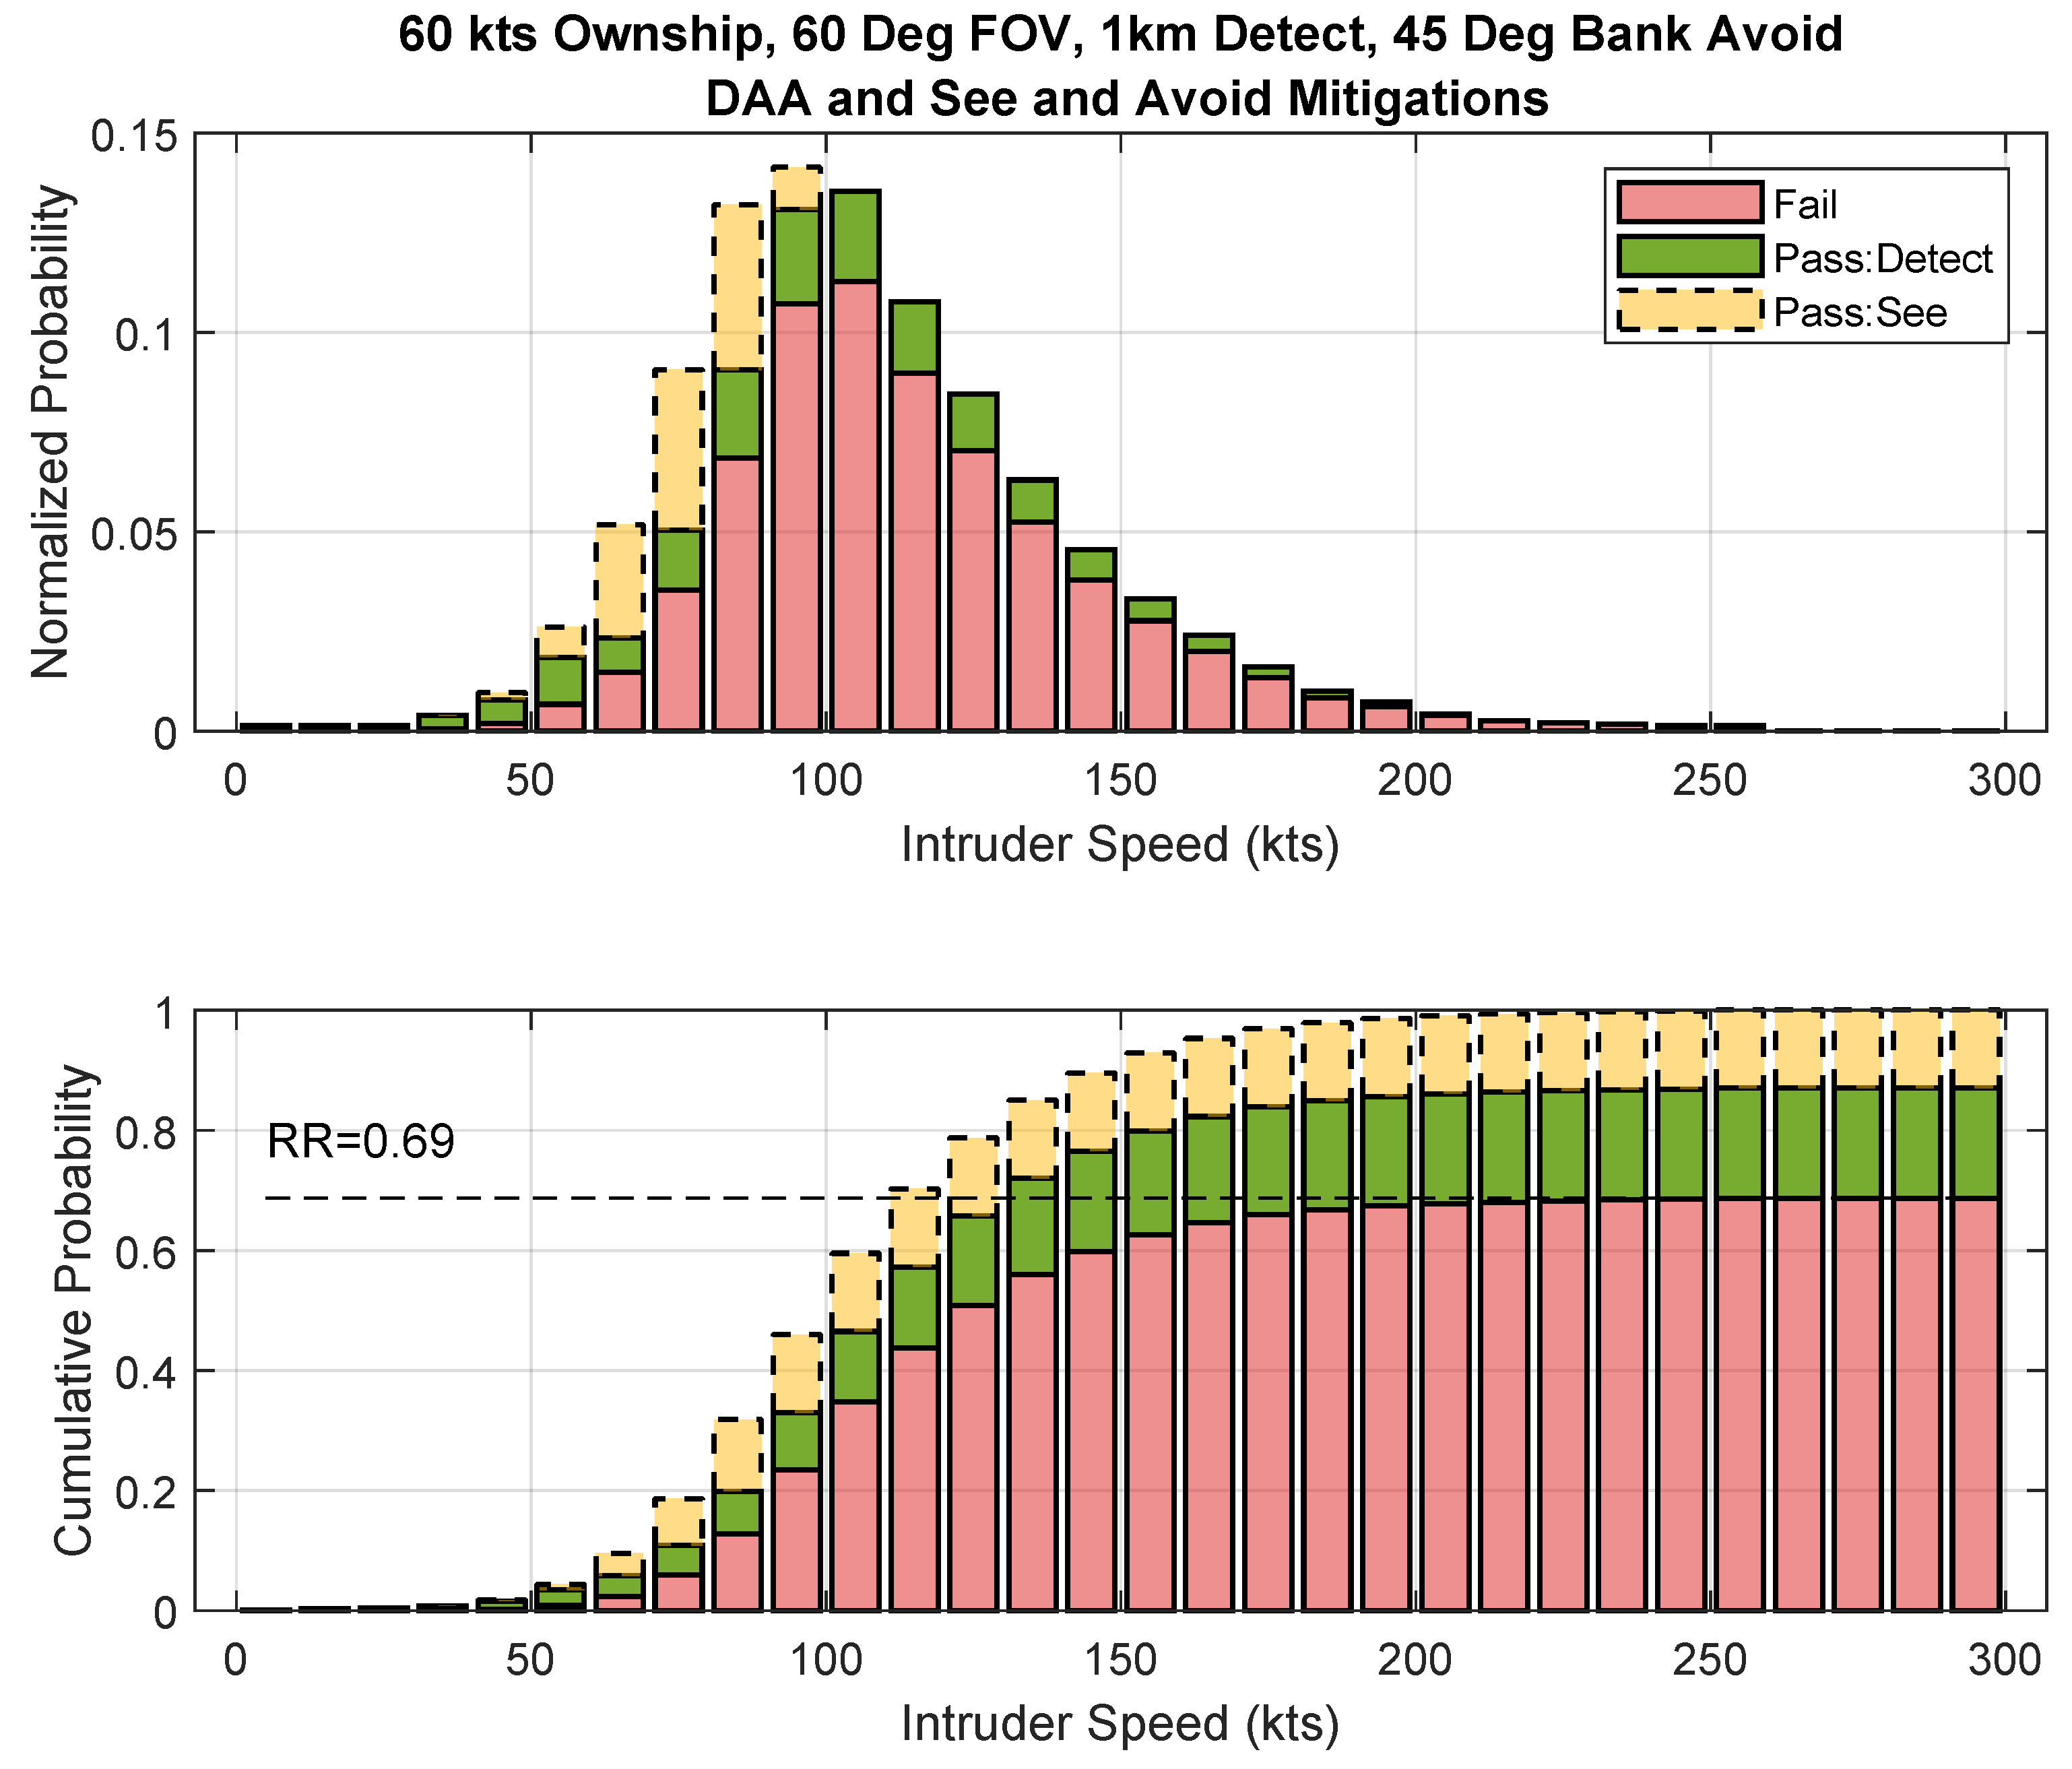
3.4. Accounting for See and Avoid
- 1.
- The size of the RPA;
- 2.
- Whether the RPA is detected above or below the horizon (penalty factor for below the horizon due to ground clutter);
- 3.
- Closure rate between the RPA and intruder;
- 4.
- The Field of View from the intruder aircraft.
- 1.
- Targets with visual angles less than one arc minute are unlikely to be seen;
- 2.
- Targets with visual angles greater than 10 arc-minutes are likely to be detected (but not necessarily recognized);
- 3.
- Targets become recognizable between 30–40% of the time when they render a visual angle of 15 arc minutes or more;
- 4.
- In four of the six models, targets become recognizable 50–100% of the time when the visual angle exceeds 30 arc-minutes.
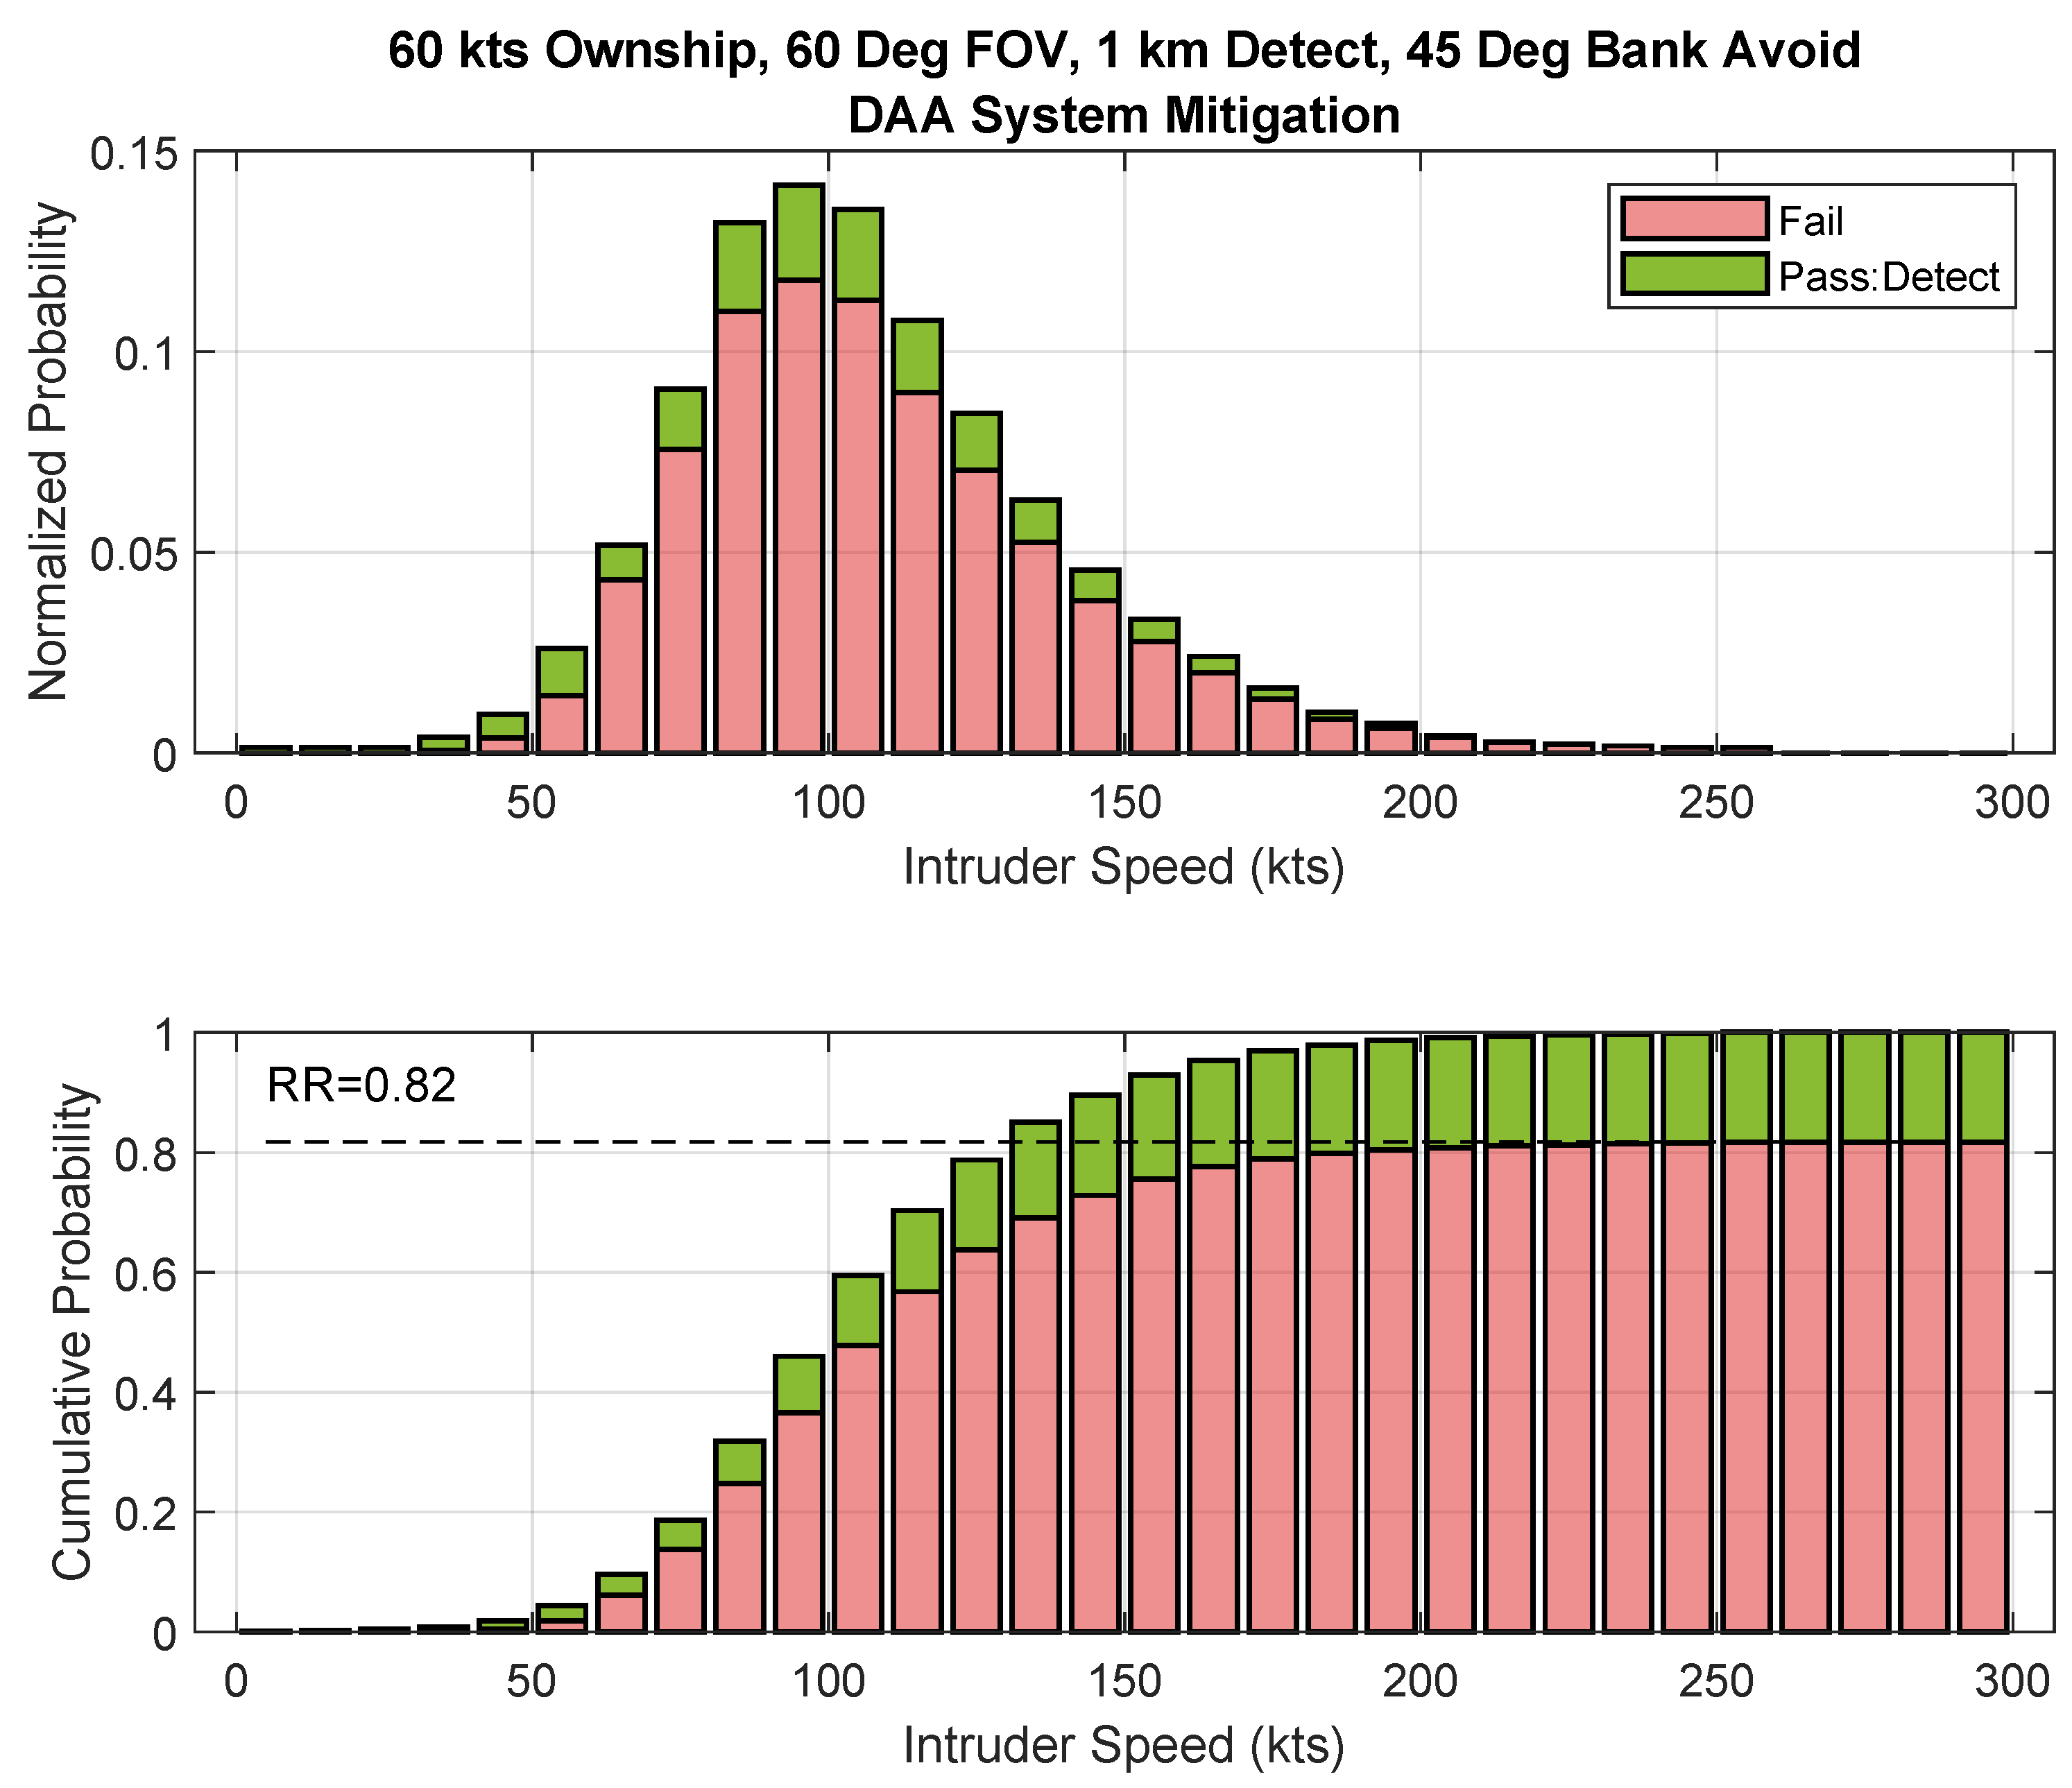
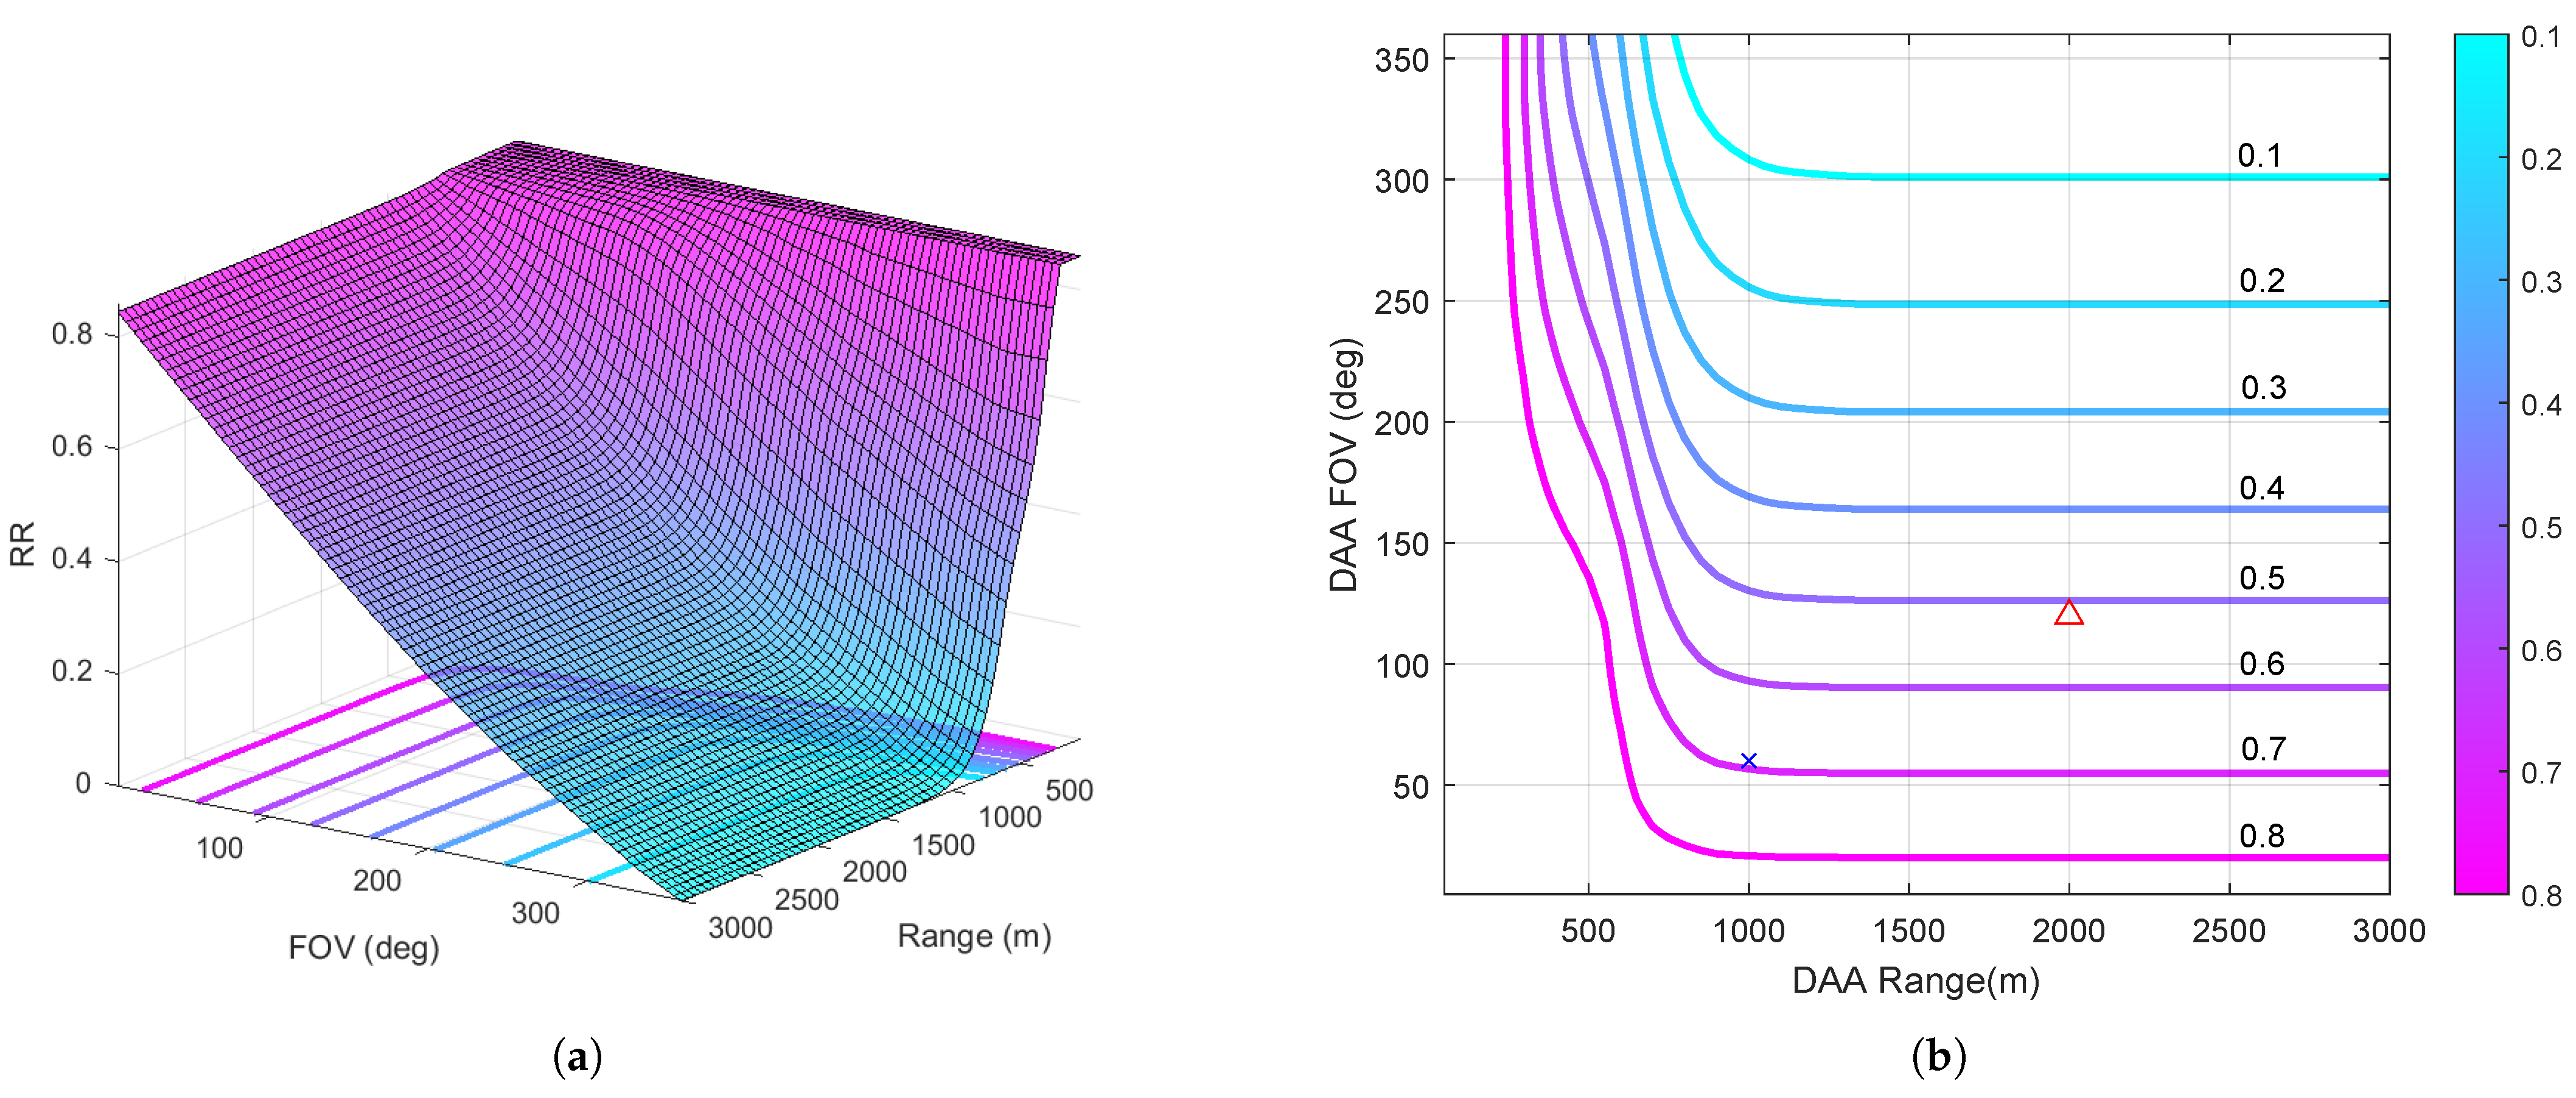
3.5. DAA System Design Parameter Sensitivity
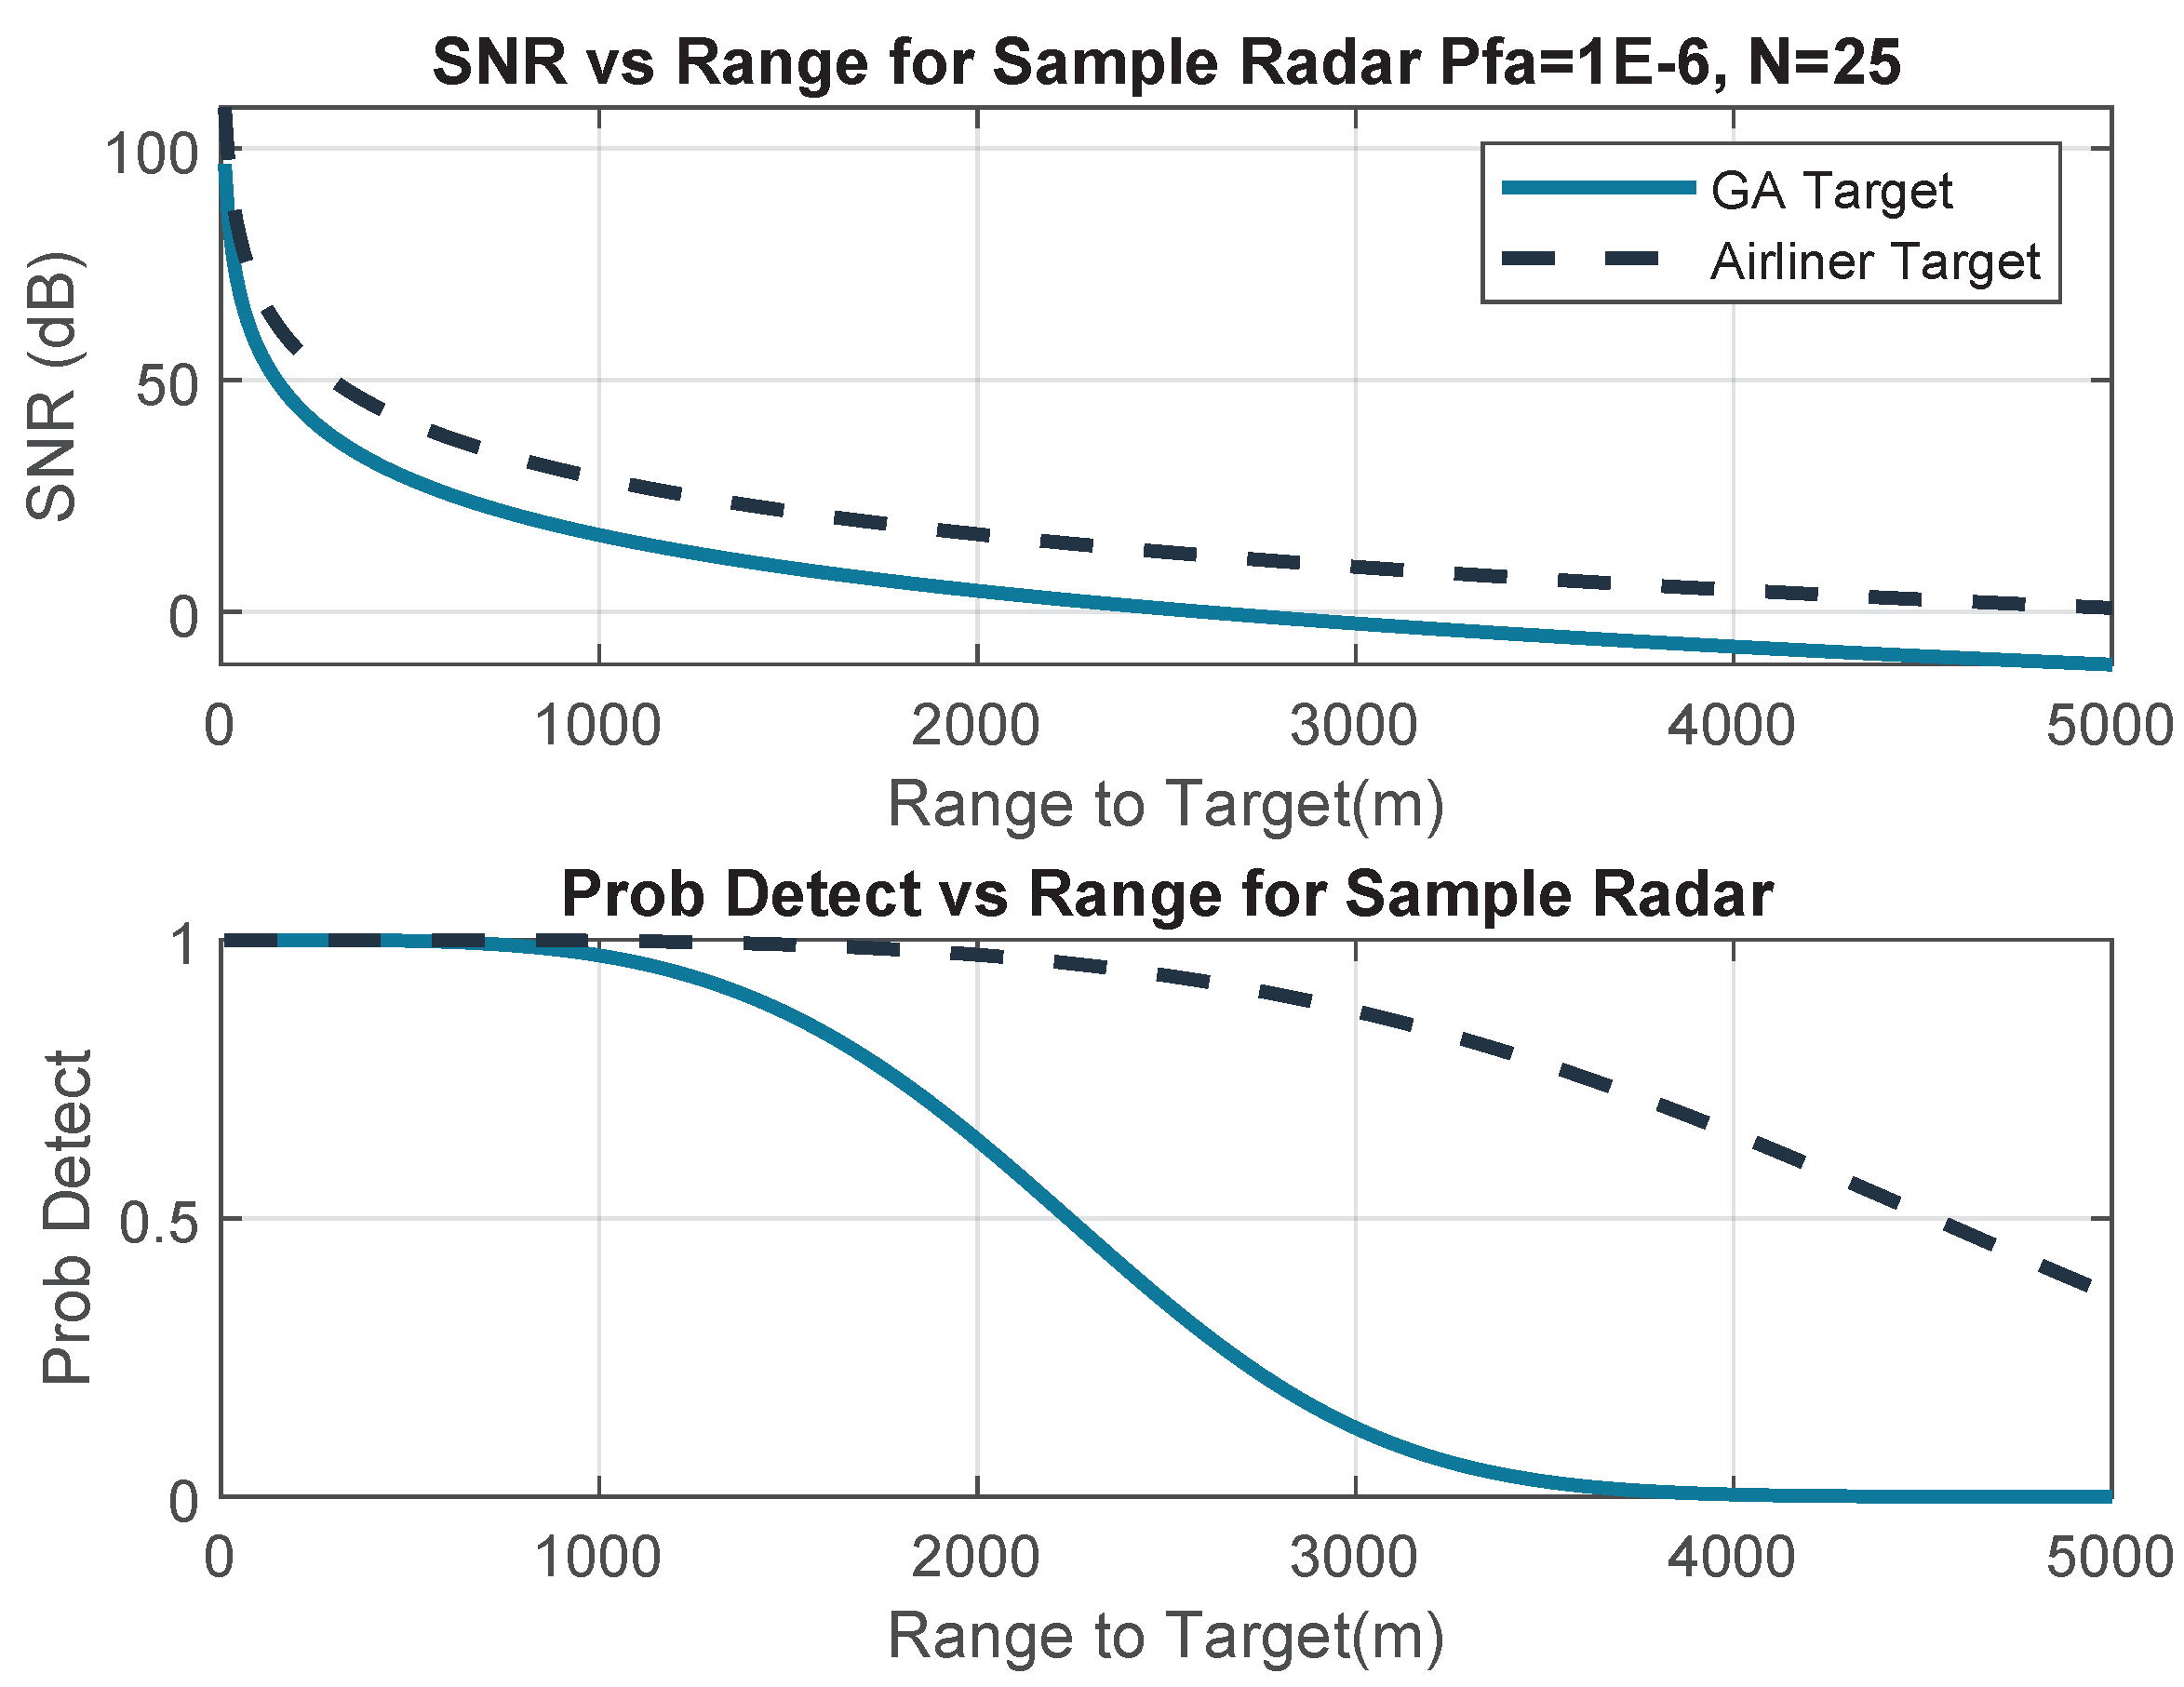
3.6. Accounting for Probability of Detection
- : transmit power, 2 Watts;
- G: antenna and receiver gain, 60 dB;
- Frequency, 24 GHz;
- : Pulse width, 0.4 μs;
- : Effective antenna temperature, 300 K;
- Probability of false alarm, 10−6;
- Number of pulses, 25.
4. Discussion
- 1.
- Avoidance Algorithm and RPA maneuvering performance—these characteristics establish the families of curves against which the sensor range and FOV may be evaluated, and as such play a dominant role in the system Risk Ratio;
- 2.
- RPA speed—slower RPAs will require greater sensor FOV relative to faster RPAs, while faster RPAs will require greater sensor range. At slower speeds, vertical maneuvering may be preferred for VTOL RPAs, owing to the collision volume being smaller in the vertical direction. The speed of the RPA may also change over the course of a mission. The effect on Risk Ratio may be accounted for by partitioning the mission duration into different speed regimes, evaluating each regime separately, and combining into an aggregate by weighting based on time spent in each regime;
- 3.
- RPA size—larger RPAs increase the range of detection for “See and Avoid”. The larger size will likely also result in a higher Ground Risk Class;
- 4.
- Sensor detection range in excess of —can be used to improve the probability of detection. A sensor with a theoretical detection range well in excess of is likely to have improved probability of detection at . It is important to note that, although this analysis did not consider the effect of false positives, manufacturers and system integrators must strive to strike the appropriate balance between detection range sensitivity and the likelihood of false alarms.
- 1.
- The notion of a Collision Volume is not defined in TC’s AC 903-001. It is a notable absence, and could lead to each DAA system developer/integrator adopting their own definition for what volume is protected by their system. The authors note that, in the JARUS SORA Appendix I [19], the Risk Ratio definition directly refers to Near Mid Air Collisions (NMAC) with a Collision Volume definition consistent with that of Figure 3. It is recommended that TC adopts an NMAC Risk Ratio definition consistent with the JARAS SORA;
- 2.
- While a target DAA Risk Reduction ratio of 0.5 may seem easy to meet at the outset, the authors suspect there will be significant challenges as there appears to be an implicit relationship between the Risk Ratio requirement and the Field of View of the sensor for slower moving RPAs. Taken to an extreme, one could see that even a “perfect” DAA system (infinite range) would require an FOV of at least 324 degrees to achieve a Risk Ratio of ≤0.1 if the RPA hovers at 0 m/s velocity. In the hover condition, all cases are ‘on-coming’ with constant closure rate equal to the intruder’s velocity; thus, to mitigate 90% of all cases, a 90% FOV (324 degrees) is required. It is believed that this relationship between Risk Ratio and FOV will vary as a function of RPA speed, with the higher FOV requirements being for the slower RPAs. Conversely, faster RPAs may require less FOV; however, a longer range to ensure that avoidance maneuvers can be conducted within sufficient time;
- 3.
- The effectiveness of the developed method heavily relies on the quality of available models. Standards bodies such as ASTM F38 WG 62669 on Testing Methods are currently exploring modeling and simulation as a primary approach to verify whether a DAA system meets the RR criteria, since flight testing a DAA system is expensive and requires experience and expertise to safely conduct collision intercepts [20,21]. This necessitates generically applicable, community-supplied, and well-understood models being publicly available, such as those identified in Annex A;
- 4.
- Is “See and avoid” a tactical or strategic mitigation? The approach presented in this paper includes “See and avoid” in RR reduction (tactical mitigation). However, one can argue that making an RPAS of brighter color or equipping it with lights to make it more visible to human pilots takes place prior to take-off and could be interpreted as a strategic mitigation for ARC reduction. However, there are only four ARC levels defined in the SORA, requiring the “See and avoid” safety gain to be significant if it is to reduce the residual ARC level. Including “See and Avoid” into the Risk Ratio calculation of a DAA system could be a better option due to the infinite granularity of Risk Ratios. Alternatively, the use of the Risk Ratio calculation approach for See and Avoid may be a means to allow for "partial credit" for the effects of “See and avoid” when combined with other strategic mitigations as was outlined in Section 3.4;
- 5.
- The Probability of Detection for appropriate target types needs to be factored into the determination of Risk Ratio. The approach outlined in this paper underscores the need for manufacturer supplied sensor models that describe the Probability of Detection as a function of range and other target characteristics that are available in the airspace model (e.g., RCS). It is recommended that this requirement be considered as a best practice by groups developing sensor test standards;
- 6.
- Airspace models are essential for establishing the DAA system Risk Ratio for the operations in the specific airspace. The airspace models must be region specific to be effective. Furthermore, Section 3.6 highlights the value of airspace models parameterized by aircraft type as target characteristics affect Probability of Detection. The National Research Council of Canada is working in collaboration with TC, Carleton University, and NAV Canada on the development of statistical airspace models for Canadian airspace. These models will include terminal and en-route models, mixed models as well as aircraft types (helicopter, General Aviation, airliner, etc.).
5. Conclusions
Author Contributions
Funding
Data Availability Statement
Conflicts of Interest
Abbreviations
| ADS-B | Automatic Dependent Surveillance—Broadcast |
| ARC | Air Risk Class |
| ATC | Air Traffic Control |
| BVLOS | Beyond Visual Line of Sight |
| CA | Collision Avoidance |
| CPA | Closest Point of Approach |
| CV | Collision Volume |
| DAA | Detect and Avoid |
| DEGAS | DAA Evaluation of Guidance, Alerting, and Surveillance |
| FOR | Field of Regard—The total area perceived by the sensor (FOV plus range) |
| FOV | Field of View—The angular cone perceived by the sensor |
| GA | General Aviation |
| GRC | Ground Risk Class |
| JARUS | Joint Authority on Rulemaking for Unmanned Systems |
| MDPI | Multidisciplinary Digital Publishing Institute |
| MOPS | Minimum Operational Performance Standards |
| NAS | National Airspace System |
| NMAC | Near Mid-Air Collision |
| NRC | National Research Council (of Canada) |
| RCS | Radar Cross Section |
| RPA | Remotely Piloted Aircraft |
| RPAS | Remotely Piloted Aircraft System |
| RR | Risk Ratio |
| RTCA | Radio Technical Commission for Aeronautics |
| RWC | Remain Well Clear |
| SNR | Signal to Noise Ratio |
| SORA | Specific Operations Risk Assessment |
| TC | Transport Canada |
| TMPR | Tactical Mitigation Performance Requirements |
| VLOS | Visual Line of Sight |
References
- Angelov, P. Sense and Avoid in UAS: Research and Applications; John Wiley and Sons: Hoboken, NJ, USA, 2012. [Google Scholar]
- RTCA DO-365; Minimum Operational Performance Standards (MOPS) for Detect and Avoid Systems. Radio Technical Commission for Aeronautics: Washington, DC, USA, 2017.
- Regulation (EU) 9232012; Rules of the Air. International Civil Aviation Association: Montreal, QC, Canada, 2005. Available online: https://www.caa.co.uk/commercial-industry/airspace/rules-of-the-air/standardised-european-rules-of-the-air/ (accessed on 3 February 2023).
- AC 903-001; Remotely Piloted Aircraft Systems Operational Risk Assessment. Advisory Circular, Transport Canada, Civil Aviation, Remotely Piloted Aircraft Systems Task Force: Ottawa, ON, Canada, 2021. Available online: https://tc.canada.ca/en/aviation/reference-centre/advisory-circulars/advisory-circular-ac-no-903-001 (accessed on 3 February 2023).
- JAR-DEL-WG6-D.04; JARUS Guidelines on Specific Operations Risk Assessment (SORA). Joint Authority for Rulemaking on UAS, 2019. Available online: http://jarus-rpas.org/sites/jarus-rpas.org/files/jar_doc_06_jarus_sora_v2.0.pdf (accessed on 3 February 2023).
- ARP4754A; Guidelines for Development of Civil Aircraft and Systems. Society of Automotive Engineers: Warrendale, PA, USA, 2010.
- Joint Authority for Rulemaking on UAS. JARUS Guidelines on SORA Annex C: Strategic Mitigation Collision Risk Assessment. 2019. Available online: http://jarus-rpas.org/sites/jarus-rpas.org/files/jar_doc_06_jarus_sora_annex_c_v1.0.pdf (accessed on 3 February 2023).
- Joint Authority for Rulemaking on UAS. JARUS Guidelines on SORA Annex D: Tactical Mitigation Collision Risk Assessment. 2019. Available online: http://jarus-rpas.org/sites/jarus-rpas.org/files/jar_doc_06_jarus_sora_annex_d_v1.0.pdf (accessed on 3 February 2023).
- Sense and Avoid (SAA) for Unmanned Aircraft Systems (UAS); Technical Report; FAA Sponsored “Sense and Avoid” Workshop: Washington DC, US, 2009.
- Tabassum, A.; Sabatini, R.; Gardi, A. Probabilistic Safety Assessment for UAS Separation Assurance and Collision Avoidance Systems. Aerospace 2019, 6, 19. [Google Scholar] [CrossRef]
- Borshchova, I.; Ellis, K. DAAMSIM: A simulation framework for establishing detect and avoid system requirements. Drone Syst. Appl. 2022, 10, 266–286. [Google Scholar] [CrossRef]
- Weinert, A.J.; Harkleroad, E.P.; Grith, J.; Edwards, M.W.; Kochenderfer, M.J. Uncorrelated Encounter Model of the National Airspace System; Version 2.0; Technical Report; MIT Lincoln Laboratory: Lexington, MA, USA, 2013. [Google Scholar]
- Minwalla, C.; Ellis, K. Experimental Evaluation of PICAS: An Electro-Optical Array for Non-Cooperative Collision Sensing on Unmanned Aircraft Systems. In Proceedings of the AIAA Information Systems-AIAA Infotech @ Aerospace, Grapevine, TX, USA, 9–13 January 2017. [Google Scholar]
- Andrews, J. Air-To-Air Visual Acquisition Handbook; Project Report ATC-151; Massachusetts Institute of Technology, Lincoln Laboratory: Lexington, MA, USA, 1991. [Google Scholar]
- Advisory Circular AC 90-48E; Pilots’ Role in Collision Avoidance. Federal Aviation Administration: Washington, DC, USA, 2022.
- Greening, C.P. Mathematical Modeling of Air-to-Ground Target Acquisition. Hum. Factors 1976, 18, 111–148. [Google Scholar] [CrossRef]
- Budge, M.; German, S. Basic Radar Analysis, 2nd ed.; Artech House: Norwood, MA, USA, 2020. [Google Scholar]
- Meyer, D.; Mayer, H. Radar Target Detection: Handbook of Theory and Practice; Electrical Science Series; Academic Press: Cambridge, MA, USA, 1973. [Google Scholar]
- Joint Authority for Rulemaking on UAS. JARUS Guidelines on SORA Annex I: Glossary of Terms. 2019. Available online: http://jarus-rpas.org/sites/jarus-rpas.org/files/jar_doc_06_jarus_sora_annex_i_v1.0.pdf (accessed on 3 February 2023).
- Keillor, J.; Ellis, K.; Craig, G.; Rozovski, D.; Erdos, R. Studying Collision Avoidance by Nearly Colliding: A Flight Test Evaluation. Proc. Hum. Factors Ergon. Soc. Annu. Meet. 2011, 55, 41–45. [Google Scholar] [CrossRef]
- Ellis, K.; Borshchova, I.; Jennings, S.; Paleske, C. A comparison of two novel approaches for conducting detect and avoid flight test. J. Unmanned Veh. Syst. 2021, 9, 149–165. [Google Scholar] [CrossRef]


| Residual ARC | DAA Performance | DAA Robustness | DAA Risk Ratio |
|---|---|---|---|
| ARC-d | High | High | ≤0.1 |
| ARC-c | Medium | Medium | ≤0.33, or 0.3 * |
| ARC-b | Low | Low | ≤0.66, or 0.5 * |
| ARC-a | No Requirement | No Requirement | ≤1.0 |
Disclaimer/Publisher’s Note: The statements, opinions and data contained in all publications are solely those of the individual author(s) and contributor(s) and not of MDPI and/or the editor(s). MDPI and/or the editor(s) disclaim responsibility for any injury to people or property resulting from any ideas, methods, instructions or products referred to in the content. |
© 2023 by the authors. Licensee MDPI, Basel, Switzerland. This article is an open access article distributed under the terms and conditions of the Creative Commons Attribution (CC BY) license (https://creativecommons.org/licenses/by/4.0/).
Share and Cite
Ellis, K.; Borshchova, I. Towards a Quantitative Approach for Determining DAA System Risk Ratio. Drones 2023, 7, 127. https://doi.org/10.3390/drones7020127
Ellis K, Borshchova I. Towards a Quantitative Approach for Determining DAA System Risk Ratio. Drones. 2023; 7(2):127. https://doi.org/10.3390/drones7020127
Chicago/Turabian StyleEllis, Kris, and Iryna Borshchova. 2023. "Towards a Quantitative Approach for Determining DAA System Risk Ratio" Drones 7, no. 2: 127. https://doi.org/10.3390/drones7020127