Article

SunMap: Towards Unattended Maintenance of Photovoltaic Plants Using Drone Photogrammetry

by
David Hernández-López
1,
Esteban Ruíz de Oña
2,
Miguel A. Moreno
1 and
Diego González-Aguilera
2,*
1
Institute for Regional Development, University of Castilla la Mancha, Campus Universitario s/n, 02071 Albacete, Spain
2
Department of Cartographic and Land Engineering, Higher Polytechnic School of Avila, University of Salamanca, Hornos Caleros 50, 05003 Avila, Spain
*
Author to whom correspondence should be addressed.
Drones 2023, 7(2), 129; https://doi.org/10.3390/drones7020129
Submission received: 11 January 2023 / Revised: 31 January 2023 / Accepted: 8 February 2023 / Published: 10 February 2023

Abstract

:
Global awareness of environmental issues has boosted interest in renewable energy resources, among which solar energy is one of the most attractive renewable sources. The massive growth of PV plants, both in number and size, has motivated the development of new approaches for their inspection and monitoring. In this paper, a rigorous drone photogrammetry approach using optical Red, Green and Blue (RGB) and Infrared Thermography (IRT) images is applied to detect one of the most common faults (hot spots) in photovoltaic (PV) plants. The latest advances in photogrammetry and computer vision (i.e., Structure from Motion (SfM) and multiview stereo (MVS)), together with advanced and robust analysis of IRT images, are the main elements of the proposed methodology. We developed an in-house software application, SunMap, that allows automatic, accurate, and reliable detection of hot spots on PV panels. Along with the identification and geolocation of malfunctioning PV panels, SunMap provides high-quality cartographic products by means of 3D models and true orthophotos that provide additional support for maintenance operations. Validation of SunMap was performed in two different PV plants located in Spain, generating positive results in the detection and geolocation of anomalies with an error incidence lower than 15% as validated by the manufacturer’s standard electrical tests.

1. Introduction

1.1. Motivation

Conventional electricity grids are based on management principles and technologies developed for a centralized generation system. This involves the large-scale generation of electricity at centralized facilities using a distribution network optimized for supply reliability. These classical network solutions, however, fail to meet growing demand, end users’ expectations, and the need for data security and reliability, among other requirements. Due to the requirements of the Kyoto Protocol and subsequent international agreements (Paris COP21, Glasgow COP26), which focused on reducing greenhouse gas emissions, the transition to renewable energies based on decentralized energy systems and the implementation of energy efficiency are mandatory [1]. To this end, management tools at all levels must change towards more intelligent systems that incorporate automatic exploitation of increasingly abundant information and new operation and maintenance models based on renewable energies and are adapted to new technological elements that are available at lower cost.
With the proliferation of drones [2] and artificial intelligence [3], as well as with the development of sensors combined with image processing capabilities [4], the range of possibilities for driving this transformation towards the intelligent inspection and management of renewable energy generation plants (e.g., solar, wind, hydroelectric, etc.) is broad. These critical infrastructures require periodic inspection to ensure their effective and efficient operation, but these facilities are sometimes difficult to access, and thus inspection can be dangerous for the operator. Therefore, unattended maintenance through the use of robotic techniques (i.e., drones) and non-invasive sensors (e.g., cameras, LiDAR, etc.) is most cost-effective [5]. To this end, recent years have seen the development of an official standard (IEC TS 62446-3) for the testing, documentation, and maintenance of PV modules and plants using drones and infrared thermography [6]. In the case of photovoltaic (PV) plants, adequate inspection of PV installations requires the acquisition of different types of data, from geometric data that allow a dimensional analysis of the facility and its assets (e.g., the distance between PV panels and vegetation, the height of vegetation, etc.), to radiometric data (i.e., multispectral imagery) that allow advanced analysis of the images for the automatic identification of faults in PV panels. This inspection is enhanced by the use of multiple spectral bands, mainly near, medium and thermal infrared, since they allow the identification of faults that are not perceived visually, such as defects in non-operative cells, discoloration, oxidation/corrosion, etc. [7]. Nevertheless, integrated interpretation of all the data acquired during the inspection requires the precise detection of each fault, as well as the identification and quantification of the type and severity of the fault. Therefore, it is clear that the development of tools that allow monitoring, diagnosing, and even forecasting these faults in PV plants is necessary in order to improve efficiency during their complete lifecycle, and these tools will provide important economic and ecological benefits [8].
Advancing the automation of faults in PV plants entails a series of difficulties [9]: (i) the automatic extraction and semantic recognition of the PV panels and their elements based on imagery (i.e., arrays, panels, modules and cells); (ii) the incidence of false positives due to detection of the same fault in different images; (iii) the incidence of false positives outside the PV panels; (iv) problems associated with reflections at the edges of PV panels; and (v) the precise geolocation of faults in the PV panels.

1.2. Literature Review
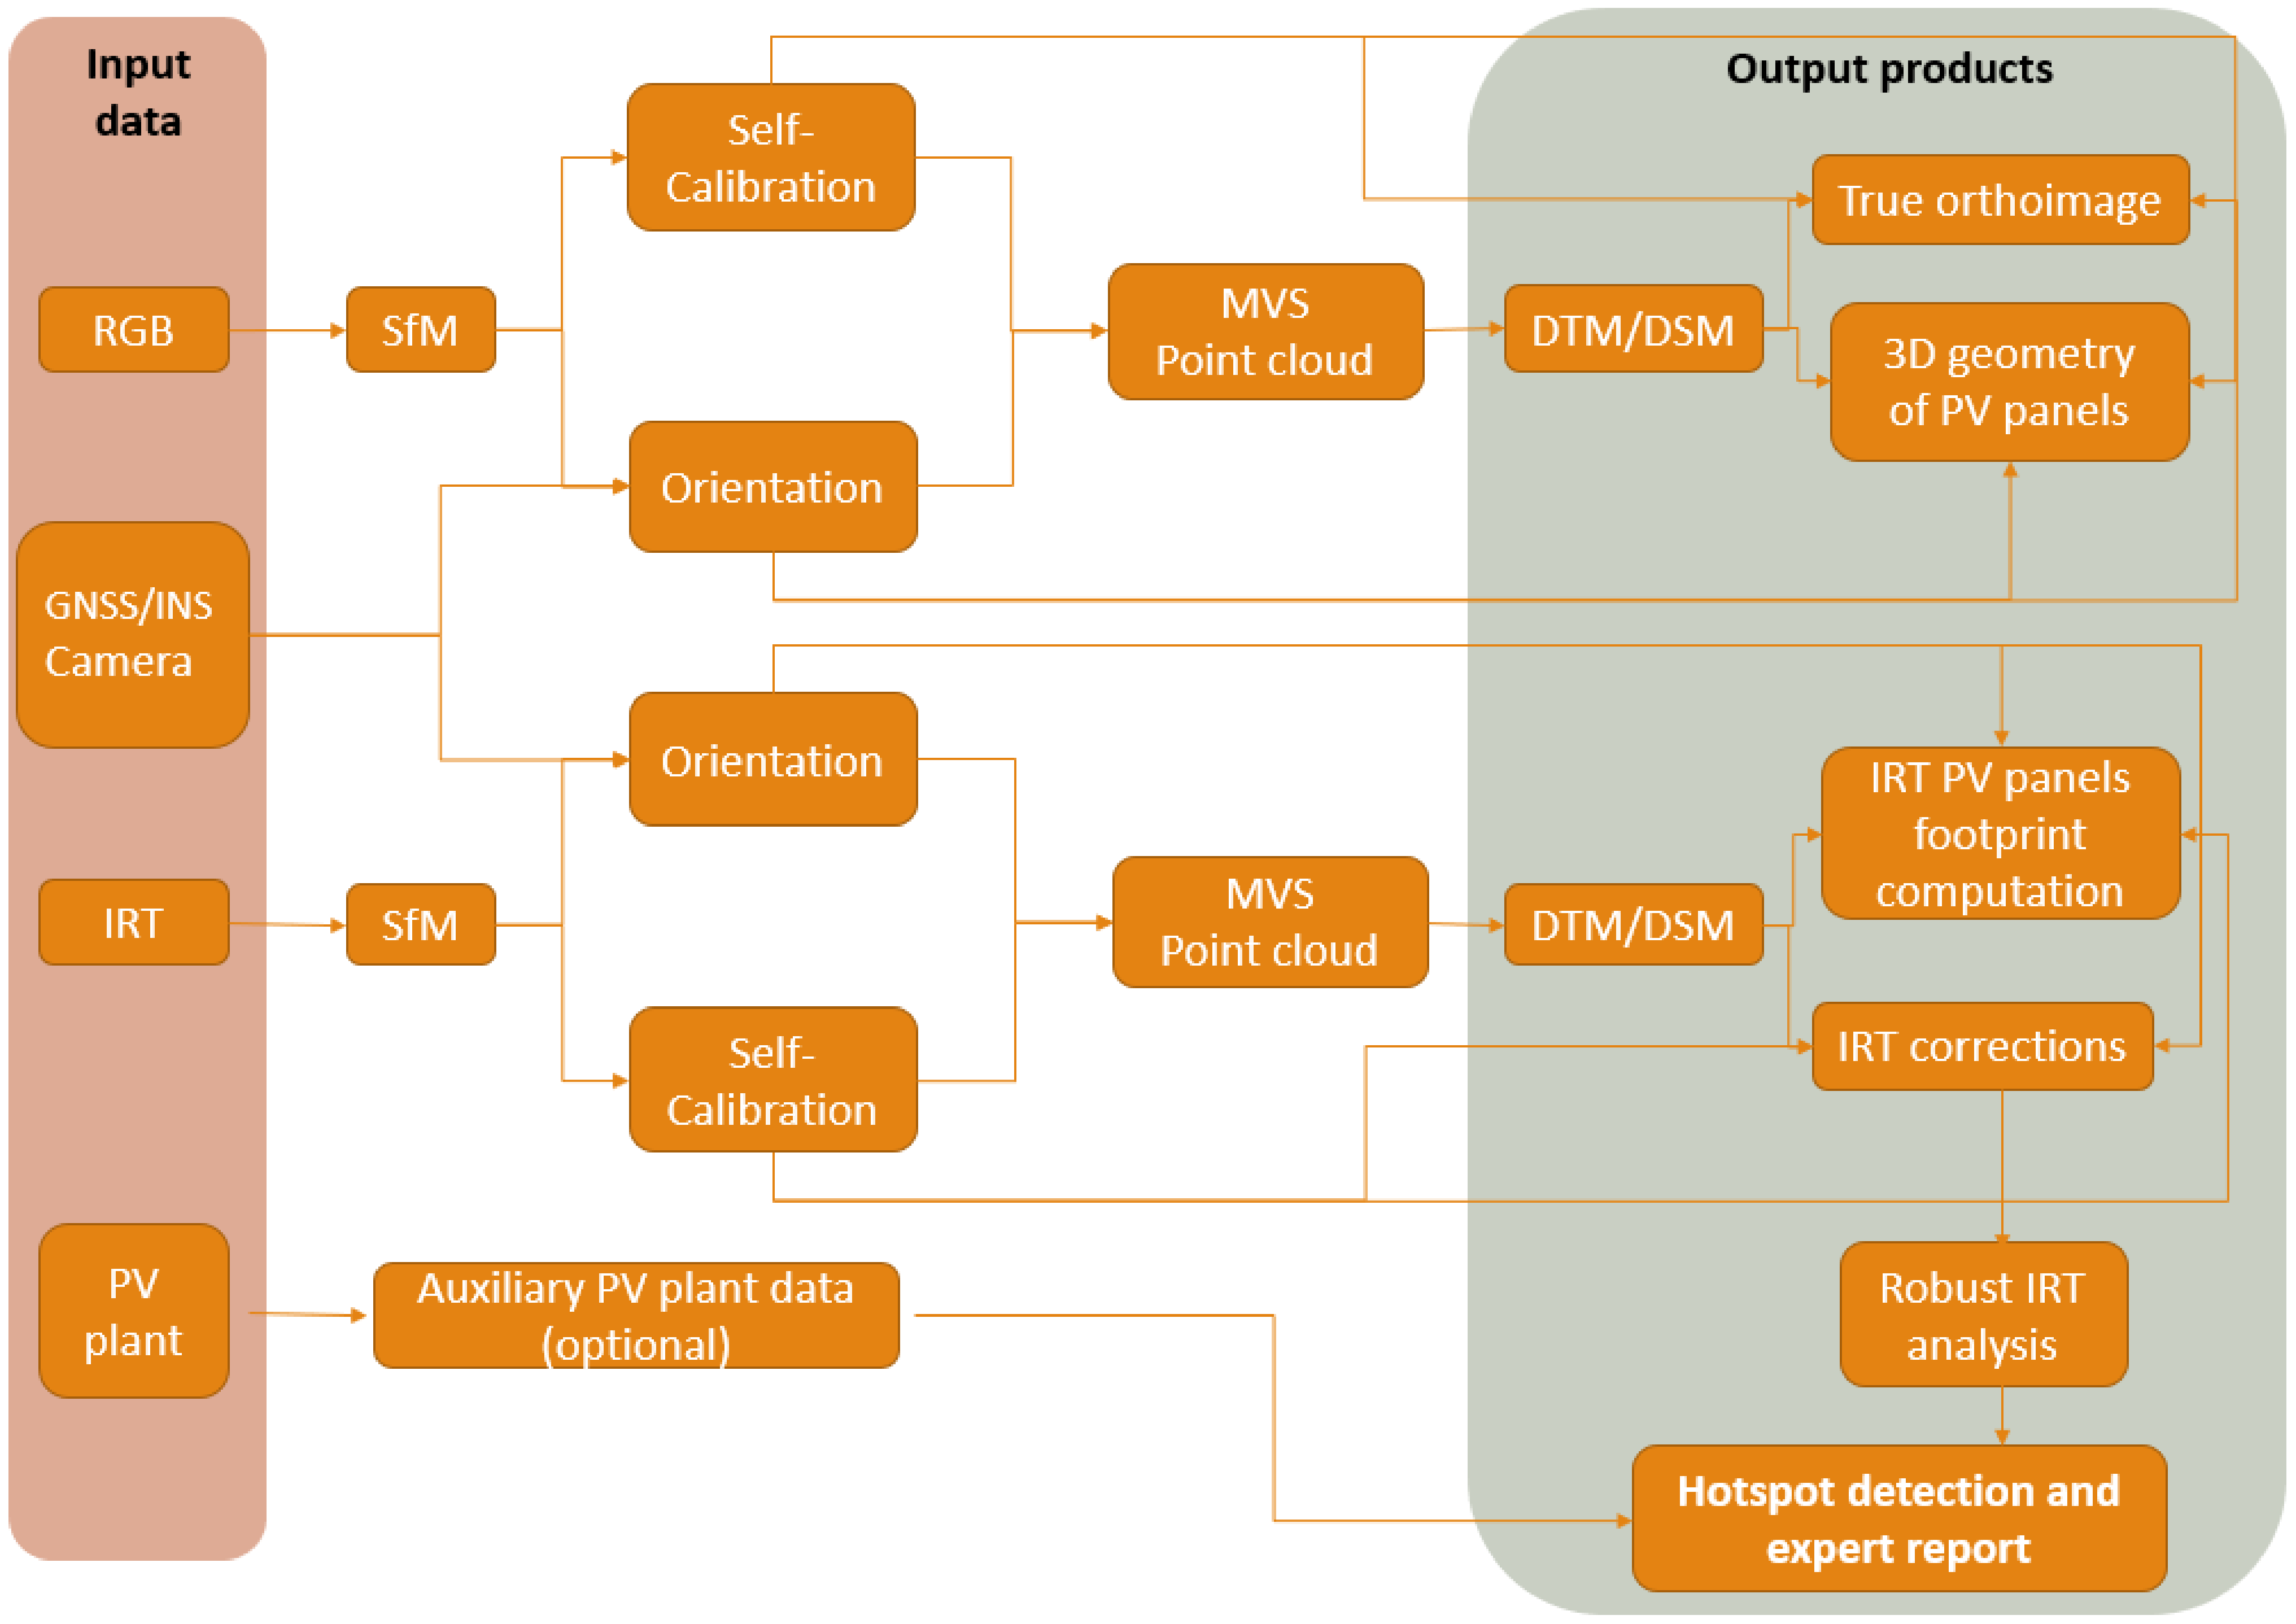
Although there are several approaches in the scientific community to dealing with PV faults based on imagery [10,11], most of them are semi-automatic or time-consuming, so their monitoring and management still require manual user interaction. According to [10,11] and their reviews, although there are many algorithms and hardware tools available, the remote and online monitoring of PV plants is still at a low technology-readiness level (i.e., prototyping stage). This suggests the need for development of cutting-edge intelligent systems that can overcome the current challenges. The key seems to be related to the exploitation of multi-modal imagery (e.g., optical RGB, IRT, ultraviolet fluorescence (UVF) imaging, etc.) and aerial drones that can enhance the detection and classification of faults in PV panels. Of course, intelligent and automatic approaches for interpreting these images remain crucial. In [12], the authors test and use different types of aerial platforms combined with visible and IRT cameras for detecting faults in PV panels, but they do not provide any automatic approach for its detection. In [13], the authors perform an exhaustive thermographic analysis of three different types of faults in PV panels, but all the tests are carried out in the laboratory. In [14], the authors advance an automatic solution for detecting some faults in PV panels, but the thermographic analysis of images is not rigorous, and they do not provide automatic extraction of geometries. In an attempt to advance the vectorization of PV faults, [15] presents advances in an automatic solution for detecting some faults in PV panels through image processing and Canny edge detection. However, the thermographic analysis of images is performed in the laboratory. More recently, [16] develops a method to recognize hot spots in photovoltaic modules using IRT images and an image processing technique based on the Otsu thresholding method. The average accuracy in hot spot detection is very high, but they provide only the initial experiments of an ongoing research project. Although other authors [17] deal with image analysis for detection PV panels and their structure, they do not generate cartographic products to provide a 3D analysis of the PV plants. In [18], the authors analyse IRT images using the Laplace operator, but again all the analyses are performed in an experimental setup. More recent approaches have been centered around the structure and management of the information of PV plants using Geographical Information Systems (GIS). In [19], the authors provide structured and rigorous information for a PV plant, and in particular, define a conceptual model based on a relational database for the intelligent management of PV plants; however, automatic routines for the extraction of elements and the detection of faults are not included in this approach. Using the same GIS background applied to the management and computation of PV potential, [20] develops a WebGIS tool for the automatic computation of PV potential on rooftops. While these are important advances in the field, automated analysis of images for tasks such as the extraction of roof intersections is still to be developed.
Other recent approaches deal with artificial intelligence [21,22], but require data preparation and augmentation together with model training. In [22], the authors propose a new intelligent PV panel monitoring and fault diagnosis technique using a neural network and a classifier in combination. Unfortunately, they do not adapt a method for use with drones. It is clear that the use of aerial drones based on optical RGB and IRT images constitutes the most efficient way to detect faults, and thus minimize operation and maintenance costs in PV plants [8]. These approaches require rigorous photogrammetric image analysis and thermographic procedures in order to guarantee accurate and timely responses during the detection of faults in PV plants.
To this end, SunMap is presented in this paper based on a series of developments with a similar thread, “from imagery to smart 3D models”, that have been applied successfully in other fields (e.g., industry 4.0 and remote sensing) [23,24]. SunMap provides rigorous photogrammetric and thermographic treatment of images acquired from aerial drones based on the generation of high-quality cartographic products and expert reports containing the precise geolocation of hot spots. The automatic and reliable detection of hot spots in PV panels is based on two conditions: (i) the presence of a hot spot in at least three thermographic images; and (ii) the existence of a thermographic gradient above 10 °C with respect to the hot spot’s neighbours.
SunMap presents the following advantages compared to the similar approaches described above: (i) a rigorous and automatic photogrammetric processing exploiting multiview geometry; (ii) the generation of high-quality cartographic products that integrate visible and thermographic information; (iii) the automatic detection of PV arrays and PV panels based on advanced imagery analysis; (iv) rigorous correction and analysis of thermographic images; (v) robust statistical detection of hot spots integrated with the generation of expert reports based on the official standard IEC TS 62446-3 [6].
This manuscript is structured as follows: Section 2 describes the methodology developed and encoded within the SunMap software; Section 3 validates the software using two different PV plants as pilot cases; and a final section is devoted to outlining conclusions and future research.

2. Methodology

Figure 1 outlines the process codified in the SunMap tool for the detection of hot spots in PV plants using drone photogrammetry. A hot spot fault is a heating effect that exists when at least one PV cell presents a short-circuited current that is much lower than the rest of the cells in the module. This pathology happens when the PV cell is totally or partially fractured or electrically mismatched, resulting in power loss of 2–20% [25]. In Figure 1, the pipeline starts with data acquisition from aerial drones using RGB and IRT images. A photogrammetric and computer vision approach is then applied to perform self-calibration and orientation of the images with the Structure from Motion (SfM) technique and to generate a dense point cloud based on the multiview stereo (MVS) technique. Different cartographic products in 2D (true orthophoto) and 3D (digital terrain and surface models, DTM/DSM) are then obtained to support the detection of hot spots. In particular, a robust analysis of the IRT images is performed to detect hot spots. As a result, the end user can assess the current state of the PV plant regarding hot spots and obtain an expert report with the geolocation of these pathologies on the true orthoimage. Auxiliary PV plant data (e.g., plans, technical specifications of PV panels, etc.) can be added to complete the expert report.

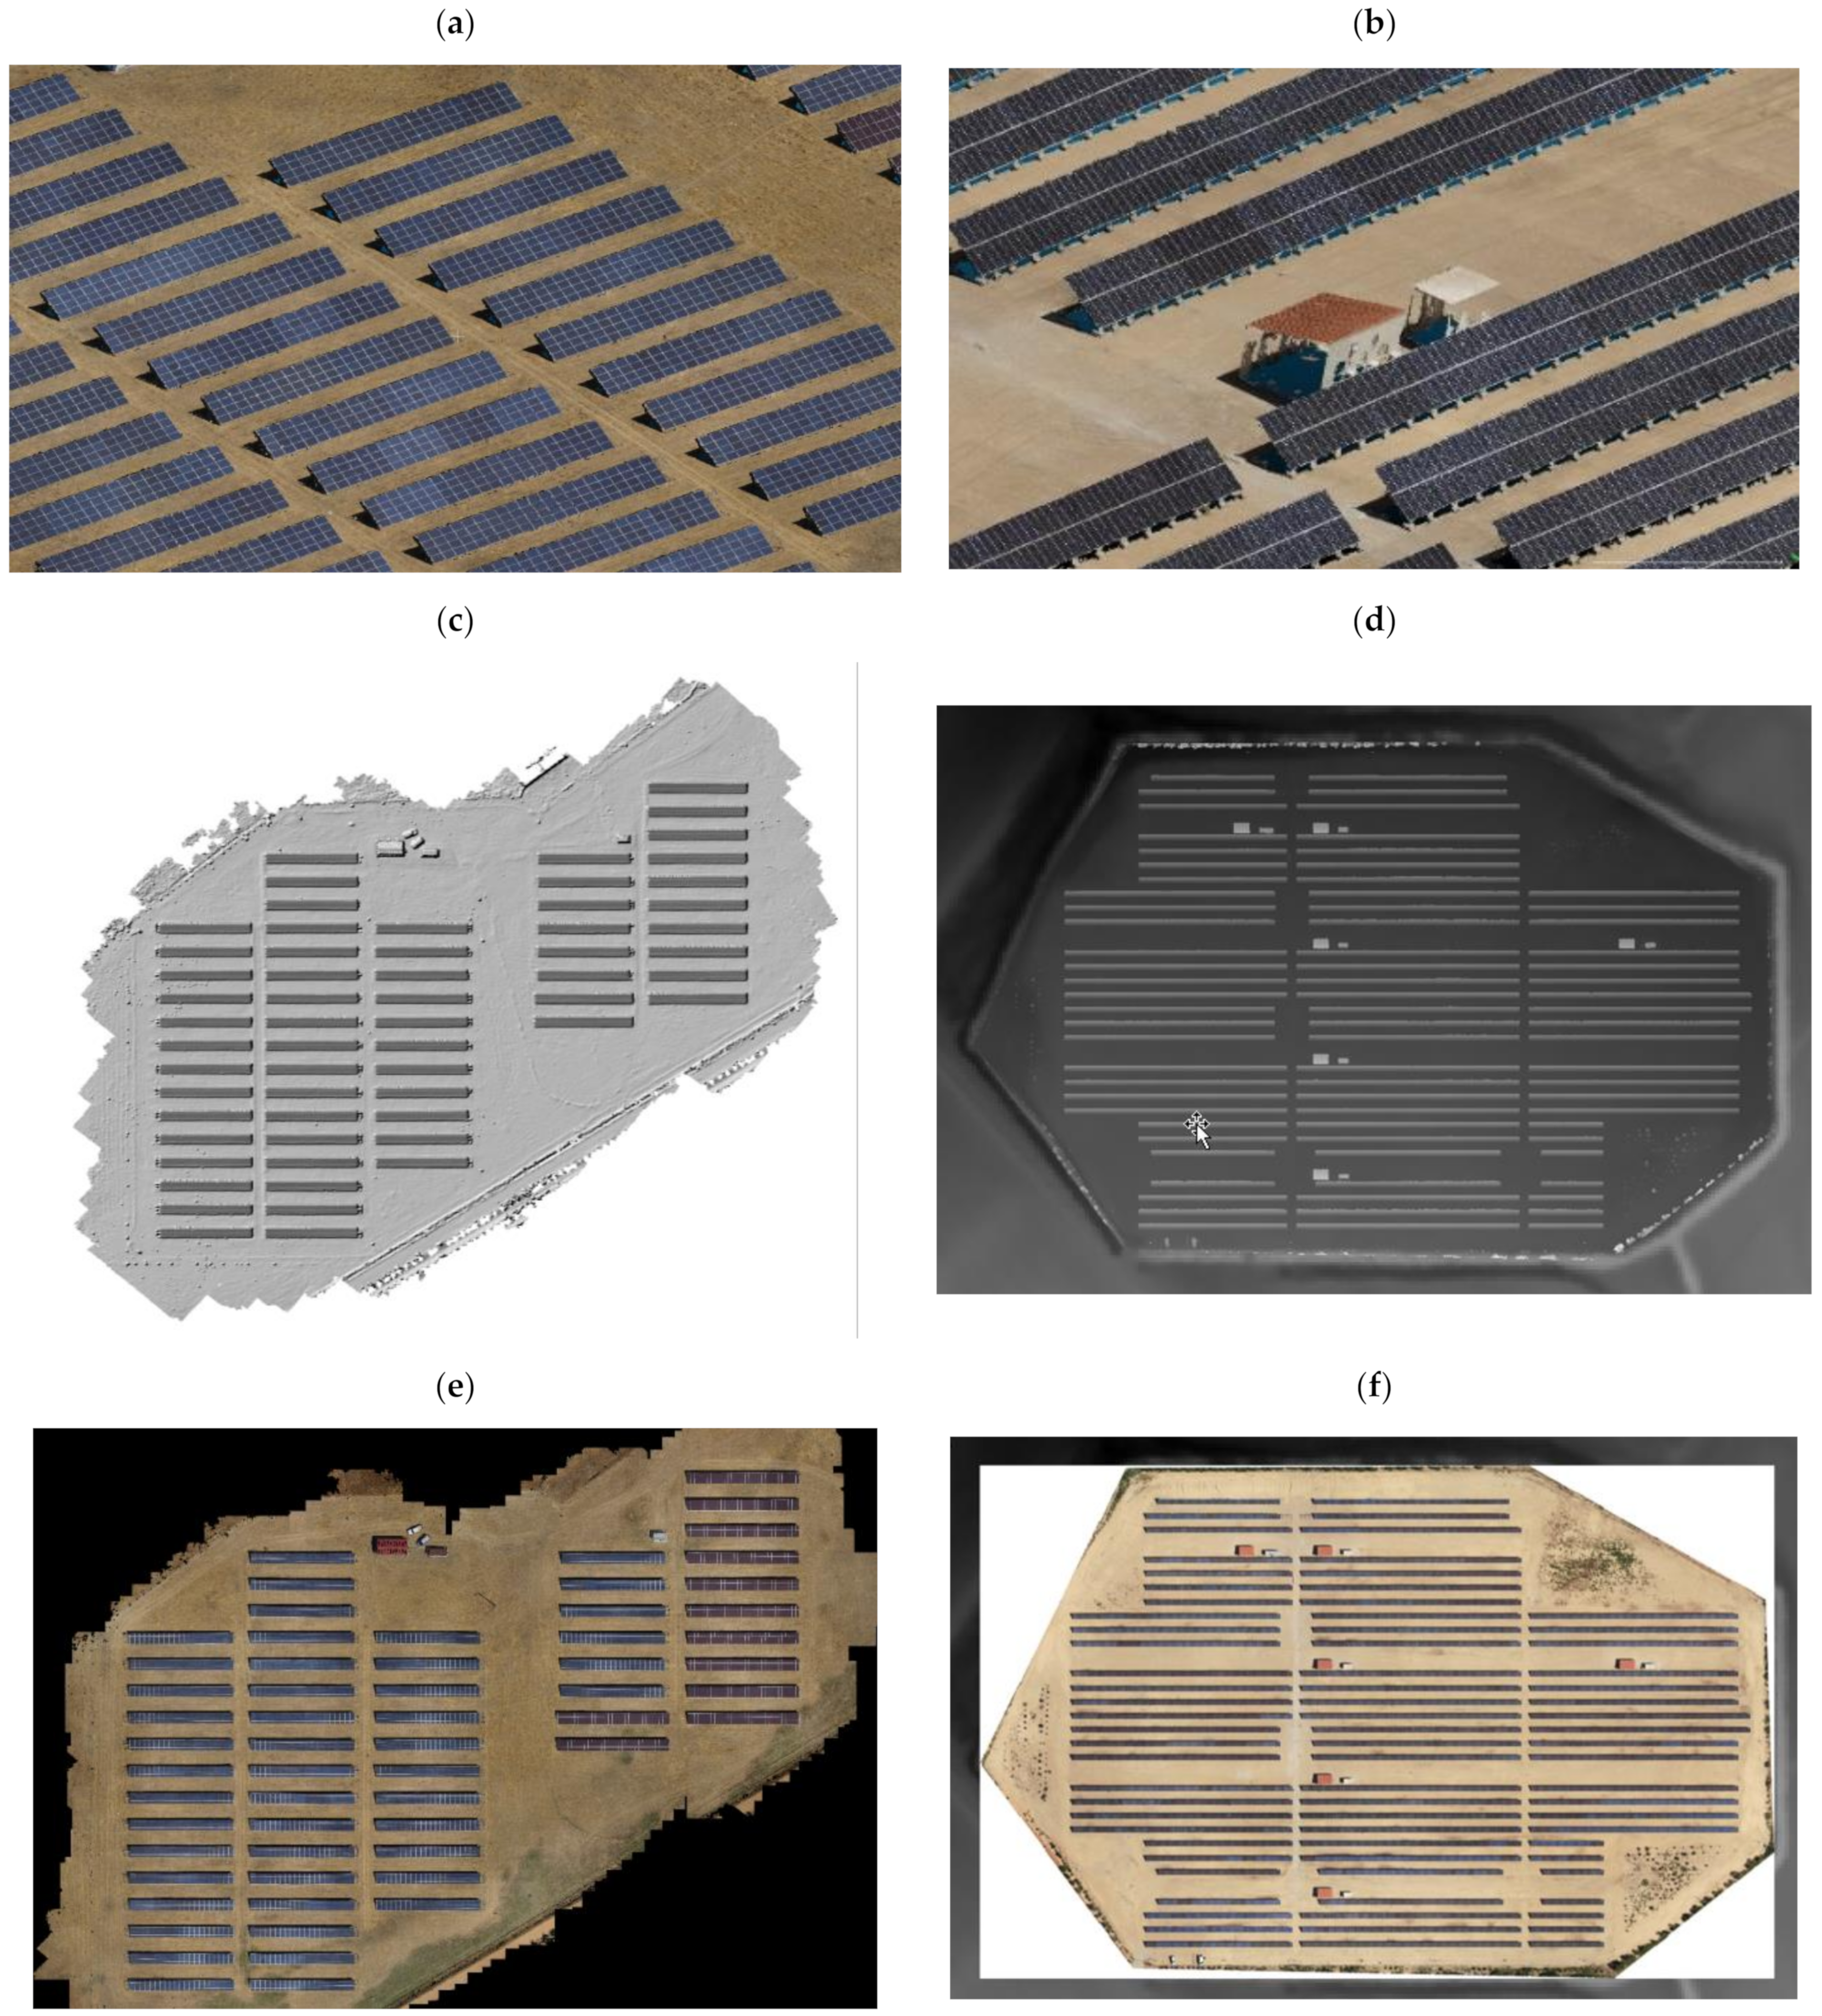
2.1. Photogrammetric Processing of Visible and Thermographic Images

An automatic photogrammetric pipeline was implemented considering the following input data: (i) images acquired from an aerial drone with an optical Red, Green and Blue (RGB) camera and an infrared thermographic (IRT) camera, capable of acquiring RGB and IRT images simultaneously or acquiring RGB and IRT images in separate flights; and (ii) the positions and orientations of images coming from the global navigation satellite system (GNSS) and the inertial navigation unit (IMU), in a CVS or TXT file. Note that GNSS positions should be provided with real-time kinematic (RTK) or Post Processed Kinematics (PPK) methods [26] so that direct orientation of the RGB and IRT images can be obtained. In this case, the fieldwork of measuring ground control points with GNSS or other topographic methods is not needed, greatly reducing data acquisition and processing costs.
The photogrammetric pipeline is integrated with a routine developed by the authors [4] based on the Structure from Motion (SfM) technique, providing a means of determining the orientation and relative positions of the cameras, and in turn performing self-calibration of the cameras (RGB and IRT). The photogrammetric approach allows for the generation of a dense point cloud using the multiview stereo (MVS) technique [27].
The first photogrammetric step comprises extraction and matching of points of interest. For the extraction, the SIFT (Scale-Invariant Feature Transform) [28] detector/descriptor algorithm is used, more specifically the SiftGPU library, which is an implementation of the SIFT algorithm for CUDA-compatible systems [29]. For matching, the FLANN technique (Fast Library for Approximate Nearest Neighbors) is used with a robust matching strategy [30]. This robust correspondence strategy consists of performing a series of tests to filter out erroneous correspondences. Specifically, the ratio test, the crossed matching, and the geometric tests are used together with determination of the fundamental, homography, and essential matrices by means of an adjustment with a Random Sample Consensus (RANSAC) algorithm [31].
Image-based 3D reconstruction is then performed incrementally through an iterative process consisting of relative image orientation, triangulation, and bundle adjustment [32].
Finally, the relative photogrammetric exterior orientations are transformed into an official coordinate reference system (CRS). In this study we use the official CRS in Spain, integrating the following CRSs: EPSG: 25830, datum ETRS89 and coordinate system UTM zone 30; and EPSG:5782, datum Alicante and orthometric heights.

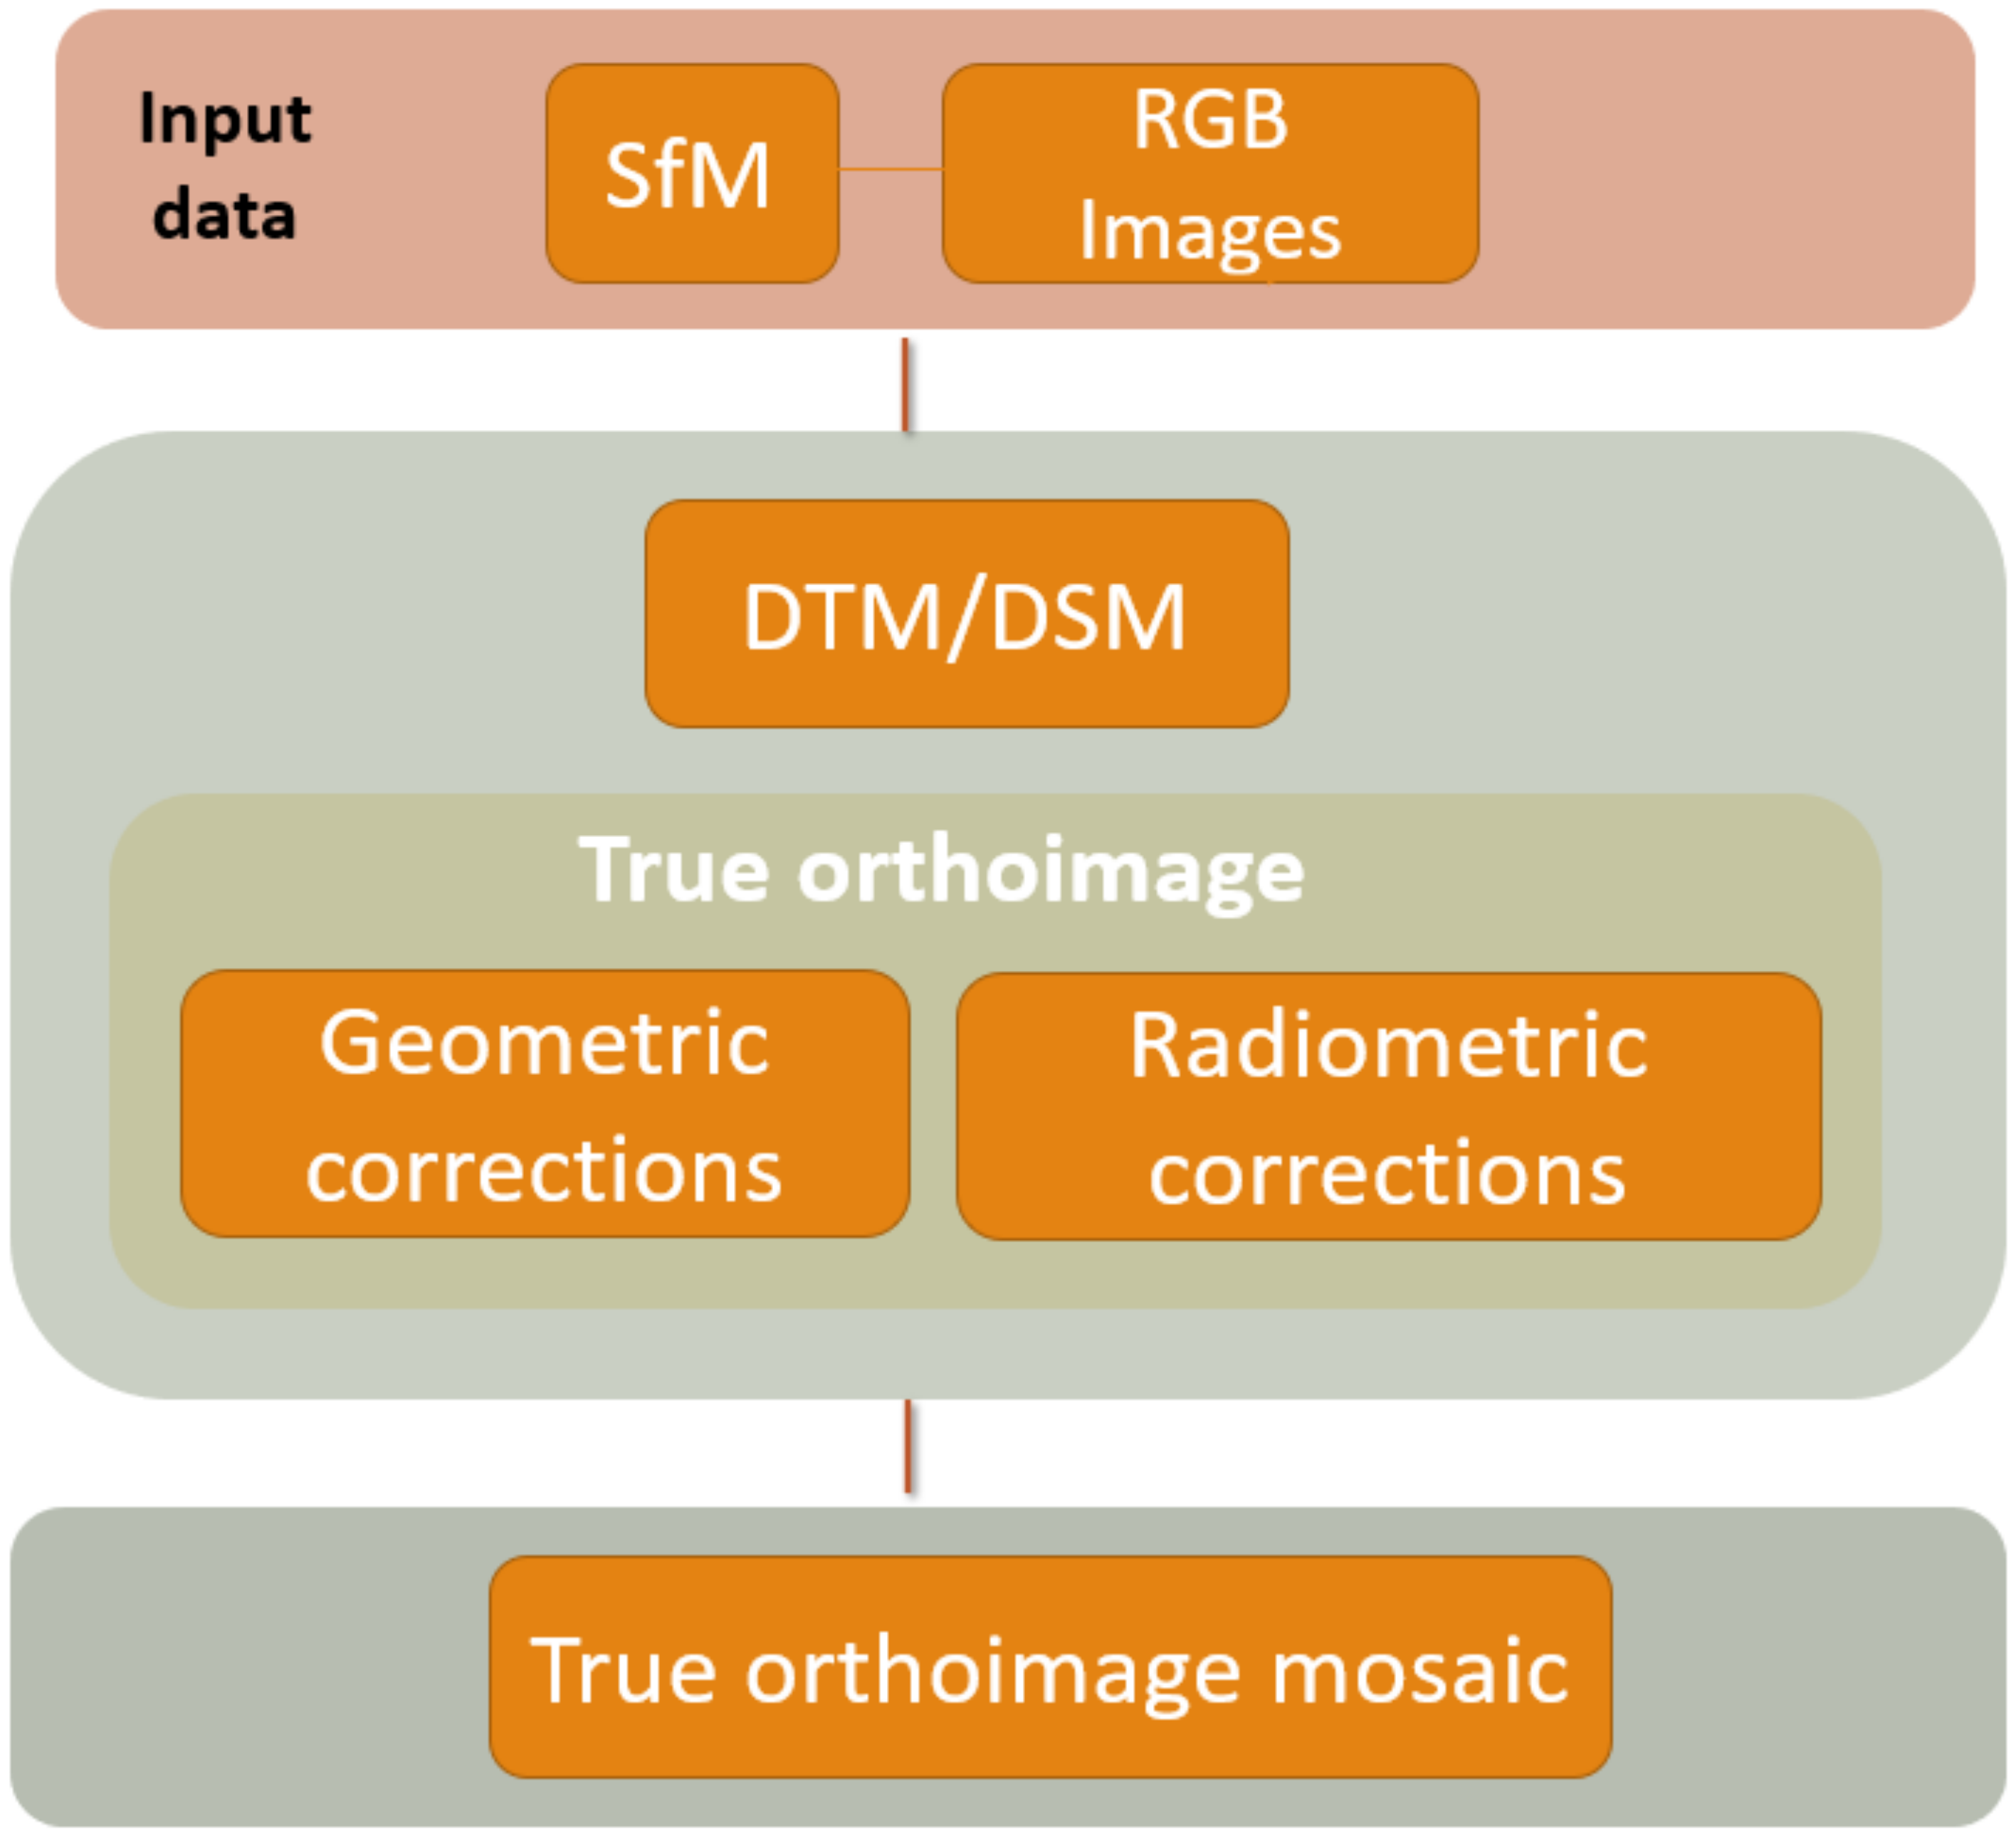
2.2. Cartographic Products Generation

Once the photogrammetry corresponding to the two cameras (RGB and IRT) is solved, the generation of cartographic products is performed in the form of digital terrain models (DTM), digital surface models (DSM), and true orthoimages, which are processed using a DSM instead of a DTM, which yields a vertical view of the PV plant, eliminating panel tilting and allowing a view of nearly any point on the ground. The DSM is used to remove relief displacement of the PV panels from the acquired images. These true orthoimages are used as input for assessing the presence of possible faults (i.e., hot spots) in the PV panels.
The first step is to separate the terrain from the panels to ensure better quality in DSM generation. For this, a terrain-extraction algorithm based on the Cloud Simulation Filter (CSF) is applied [33]. By applying this algorithm, a point cloud with the terrain and another point cloud with the panels are obtained. Using the inverse distance interpolation method based on nearest-neighbour search [34], DTMs are generated for both the terrain and the panels and later merged to generate the DSM. The reason for separating the DTMs and then merging in a DSM is that the different classes corresponding with PV panels and terrain can have different Z coordinates for the same X,Y coordinates, allowing orthorectification of the terrain and the PV panels and generation of the true orthoimage.
The second step is the generation of the true orthoimage (Figure 2) based on the previous DSM, which contains the height of the PV panels and thus allows precise geolocation of the hot spots. More specifically, the process of generating true orthoimages consists of the following steps: (i) definition of the flight path; (ii) determination of hidden areas in the images through the Z-buffer algorithm using the DSM [35]; (iii) correction of image distortion using the inner camera parameters from the self-calibration; (iv) orthoimage generation; and (v) completion of the hidden areas.
The final step is to generate a final true orthoimage mosaic corresponding to the whole PV plant. The photogrammetric process of ortho-projection basically consists of generating an orthogonal projection, thus representing three-dimensional objects (terrain and PV panels) in two dimensions without the perspective of the original image, which is a central projection. This process is achieved by a two-dimensional transformation between the original image and the corrected image (orthoimage), which is already georeferenced in the projection plane. To carry out the processing of the orthoimage, the inverse method [36] is used. In this case, an image with known internal and external orientation is needed, as well as the DSM of the PV plant. Subsequently, the size of the orthoimage (resolution) is defined according to the size of the pixel in ground units.

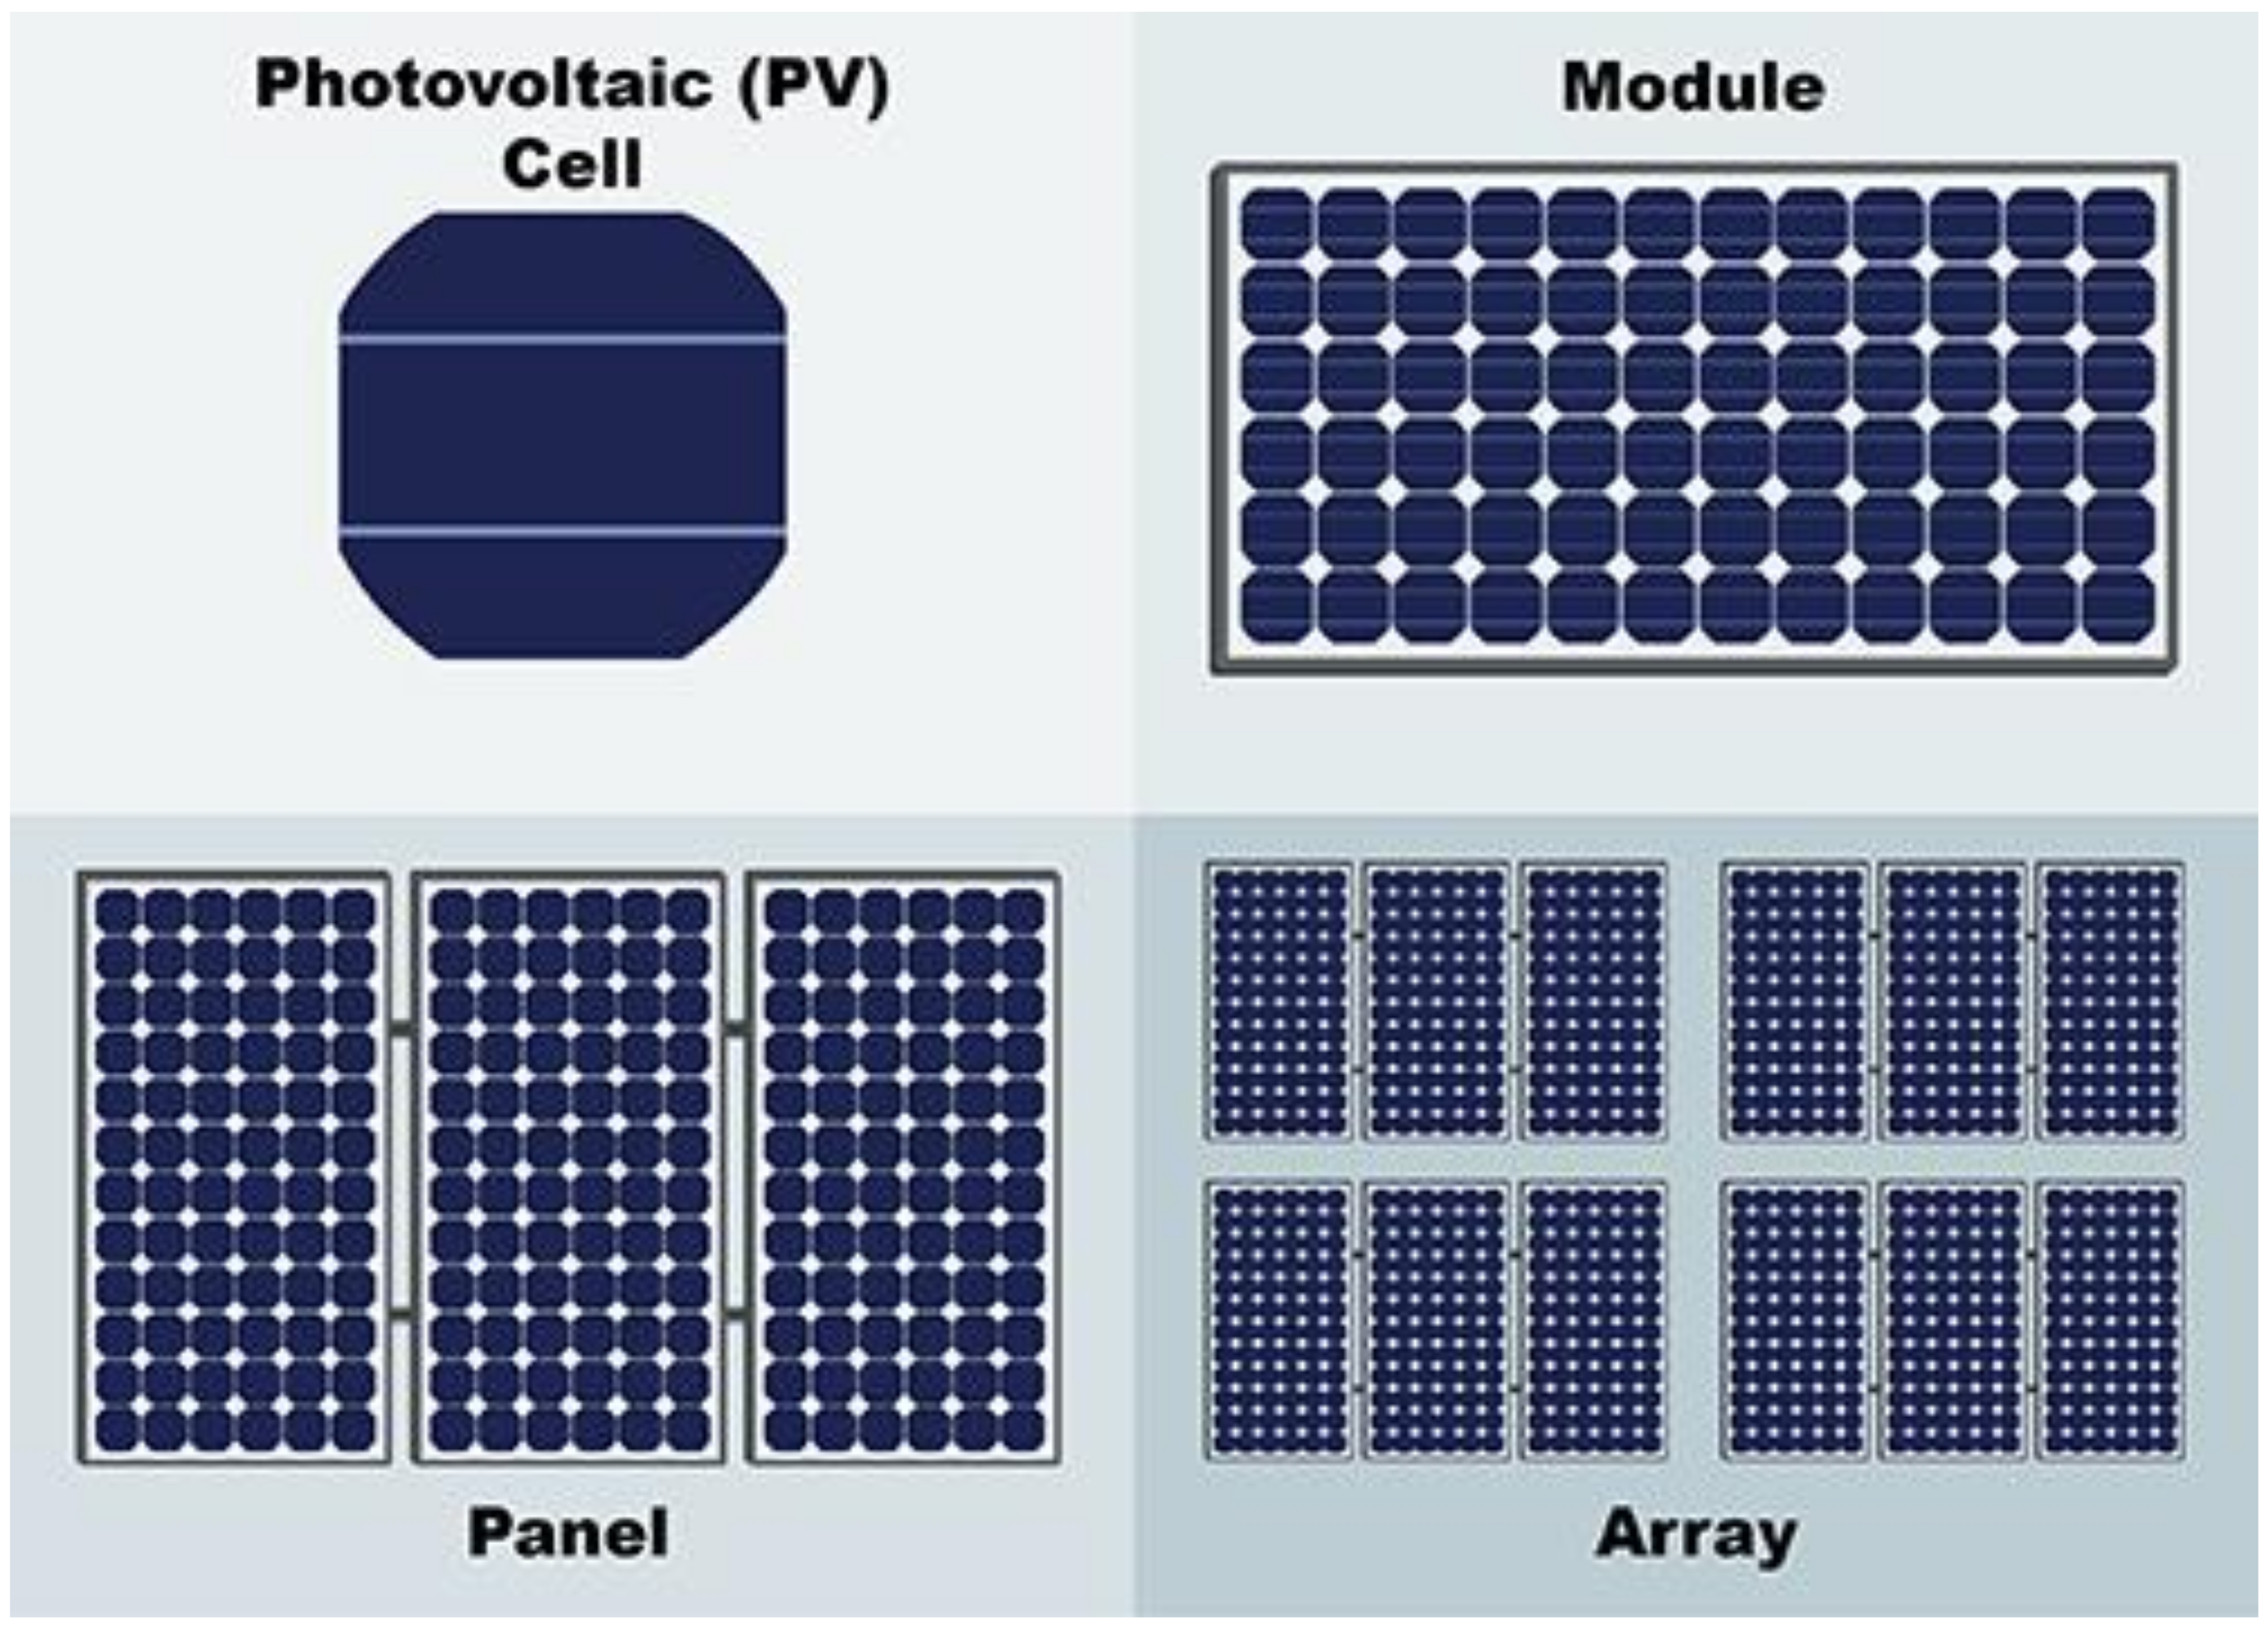
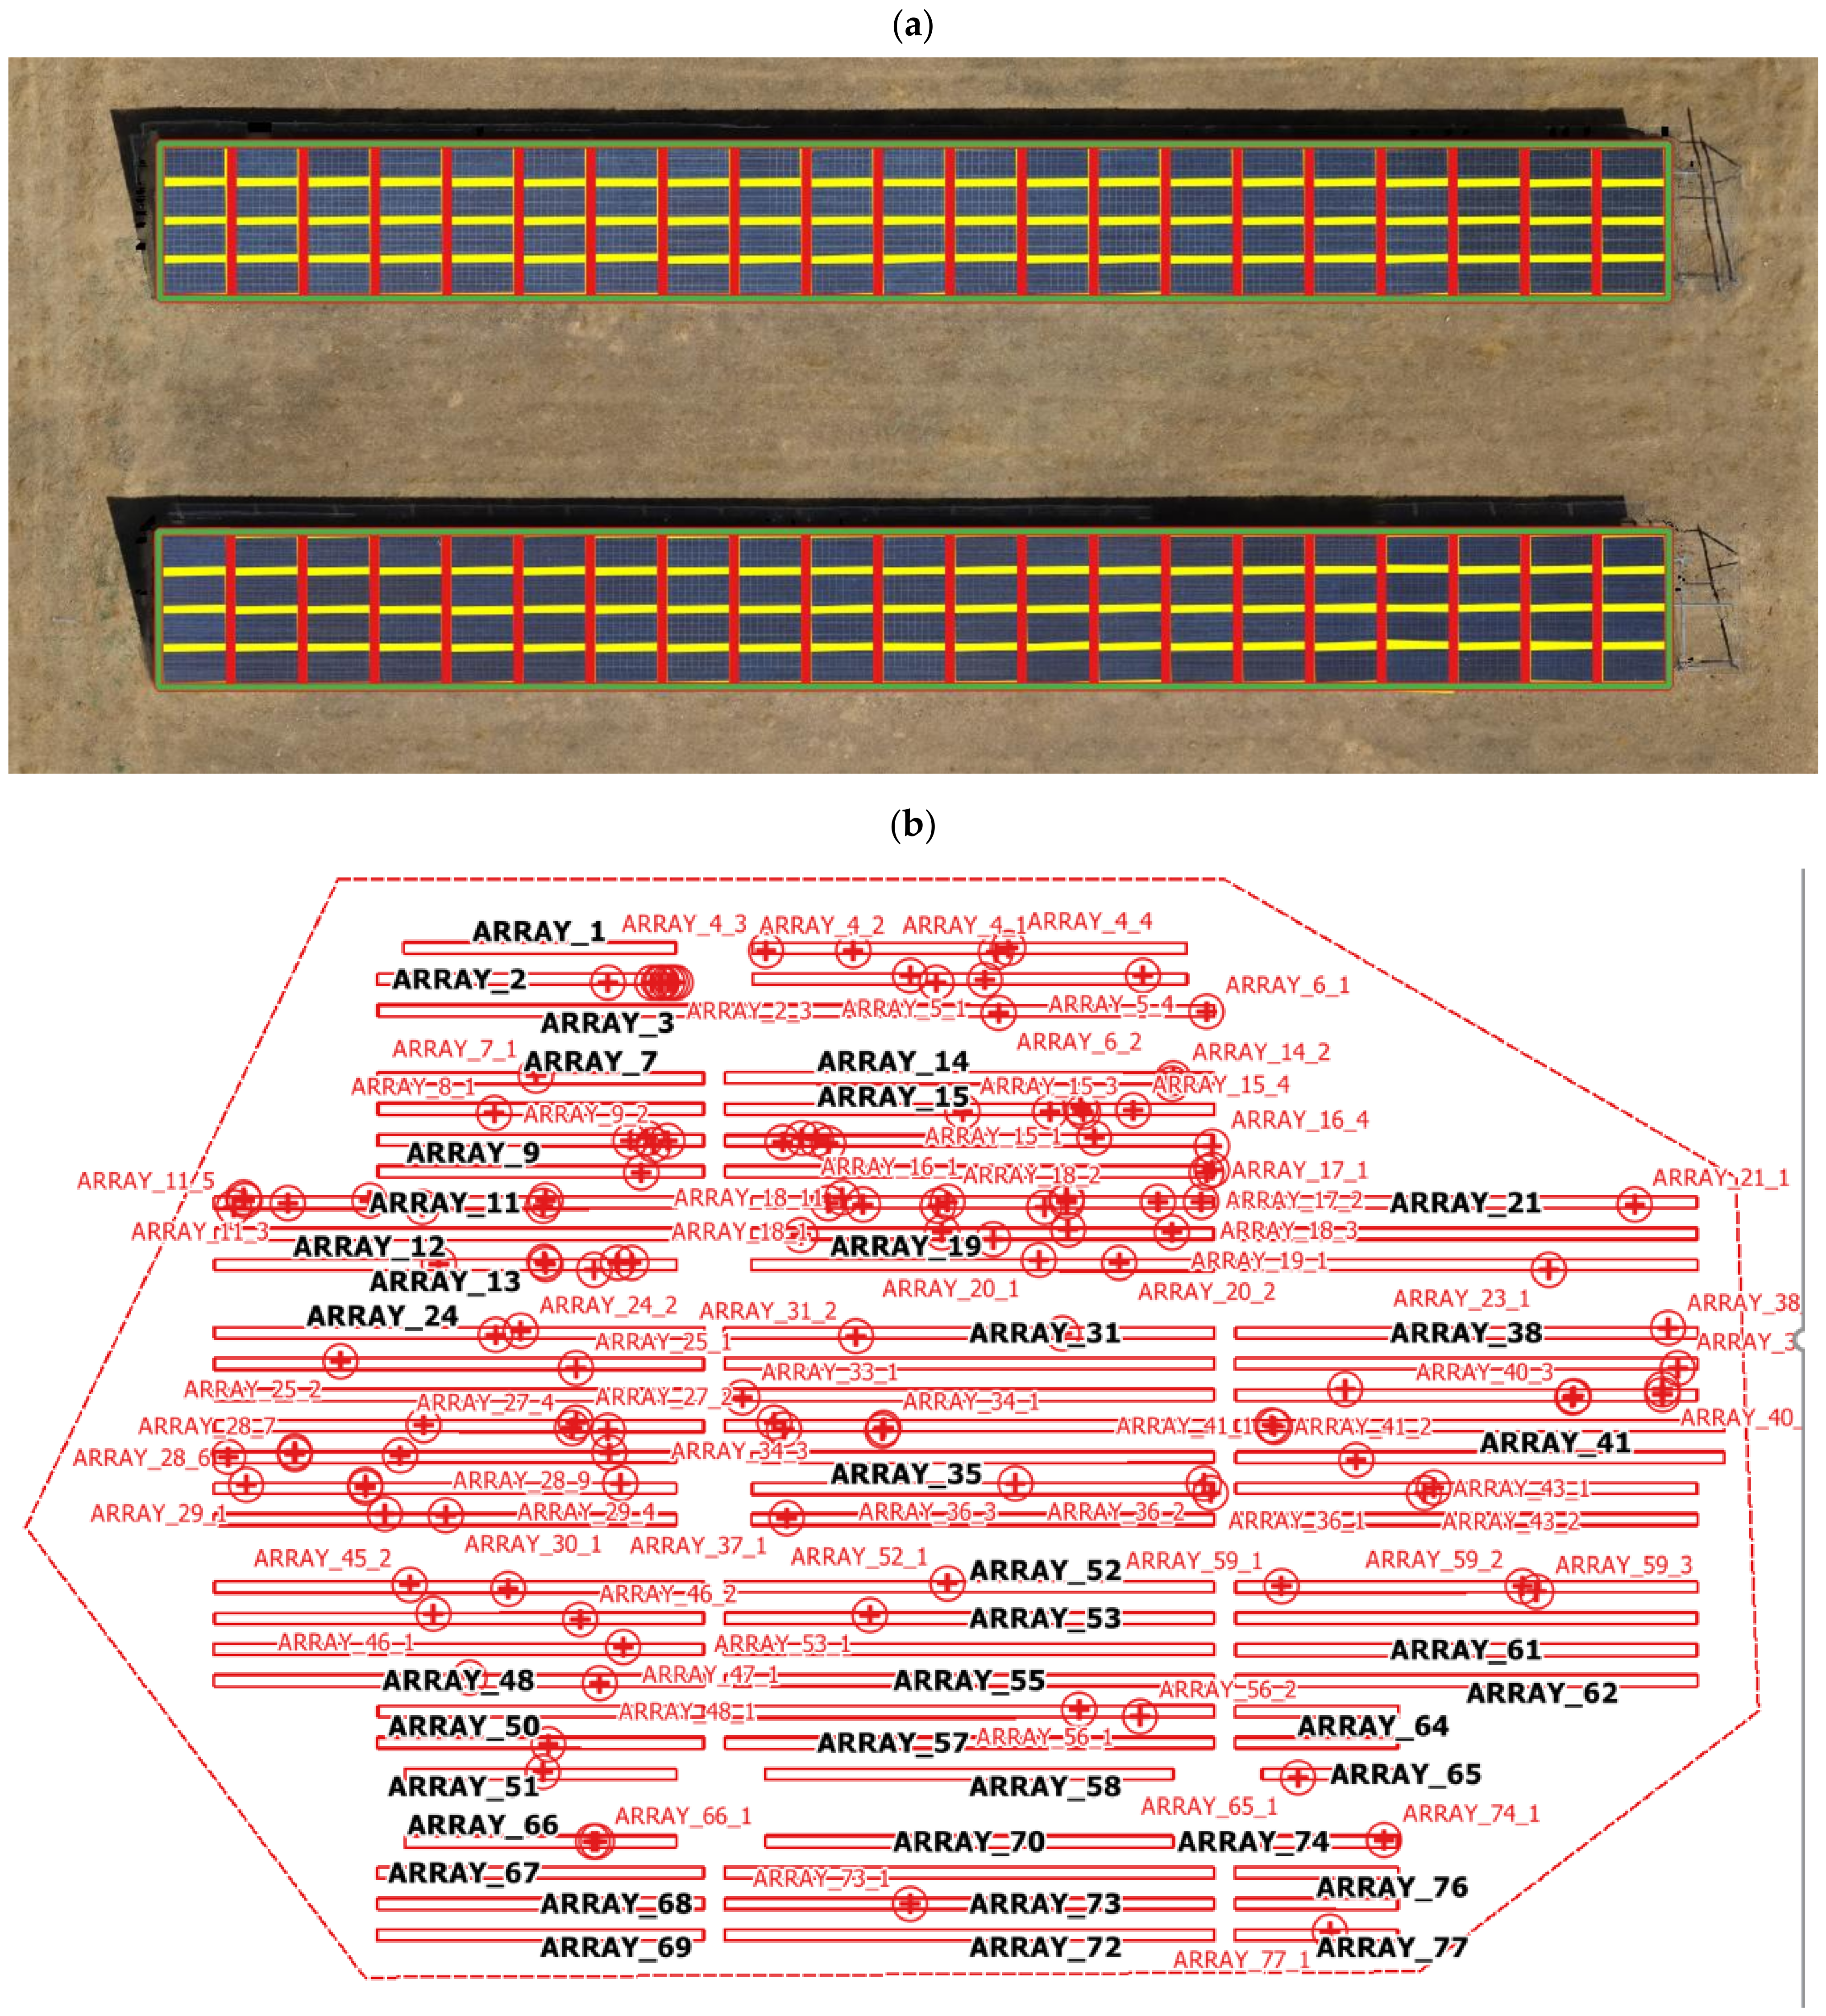
2.3. Extraction and Detection of the 3D Geometry of PV Panels

It should be noted that the inputs of this image analysis approach are the DSM and the true orthoimage generated from the photogrammetric process, since they enclose the metric properties and the adequate geometric resolution to apply the process with quality, and thus provide a better geolocation of the hot spots.
Prior to extraction and detection of the 3D geometry of the PV panels, a conceptual model based on the geometry and semantics of the PV plant needs to be defined (Figure 3). To this end, a coarse-to-fine approach is used for the extraction and detection of the 3D geometry of PV panels, so that starting from the extraction of PV arrays, the detection of PV panels, PV modules, and even PV cells can be obtained. The term “array” is used to refer to a set of PV panels arranged in rows and columns. In turn, each of these PV panels is made up of modules, which are each made up of an array of PV cells, also distributed in rows and columns.
The definition of the geometry and semantics of the PV plant, as well as the area of interest, is specified in a set of files in shapefile format that are created automatically through the development of algorithms supported by image analysis techniques (i.e., filtering) and feature extraction (i.e., contours and lines). This procedure is performed as follows: (i) first, filtering of the orthoimage is performed to remove noise, followed by a search for contours applying different thresholding of the images [37]; (ii) second, the contours obtained are simplified using the Douglas–Peucker line simplification algorithm [38]; and (iii) very small contours are eliminated, and contours with four vertices and whose angles are close to 90° are retained. For all contours, the median of their area is calculated and the panels that are not within the tolerance sought are eliminated. Finally, to determine the contours of the rows of panels, (iv) the modules are clustered using a density-based spatial clustering algorithm (DBSCAN) [39].

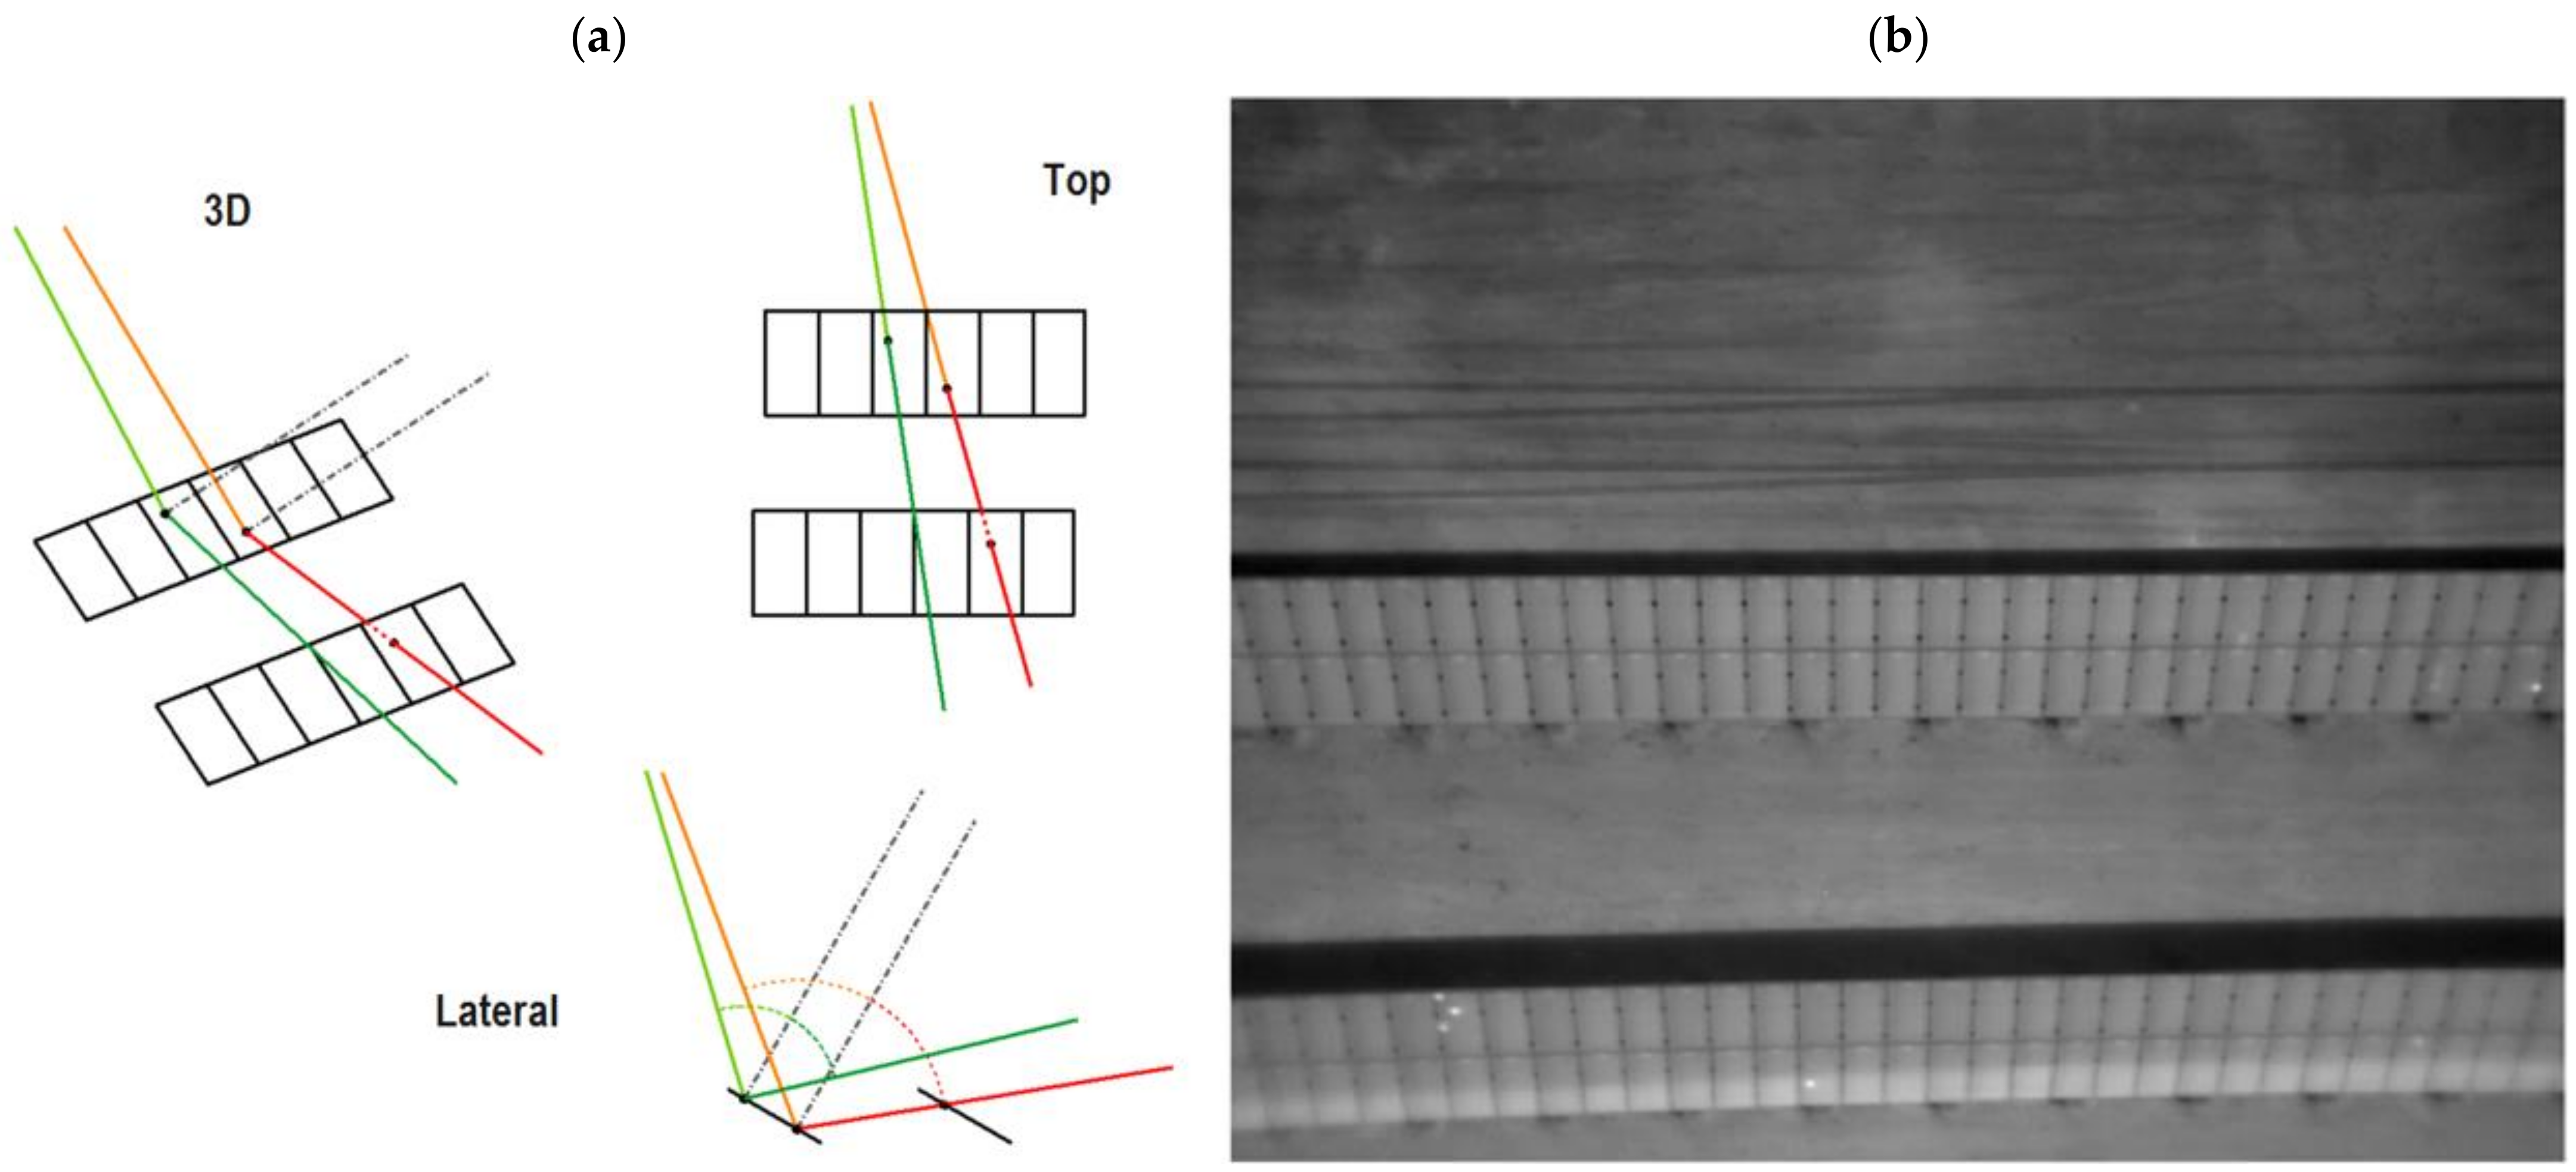
2.4. Correction of Thermographic Images

Good analysis of IRT images entails understanding the physics behind the IRT images and correcting the IRT images obtained. Information about the weather, the atmosphere, the object analysed (i.e., PV panels) and its environment is essential.
Before proceeding to calculate temperature statistics and to detect hot spots, it is necessary to apply a series of corrections to the thermographic images. This process is fully automatic and is based on the application of the following corrections: (i) distance correction, which contains the distance for each visible pixel from the center of projection of the camera to the point over the panel; (ii) incidence angle correction for obtaining emissivity, computed using the angle formed by the line of observation with the normal to the 3D surface of the PV panel for each visible pixel; (iii) reflection correction, which is based on isolating the areas of the PV arrays that may have problems caused by reflections from other panel arrays (Figure 4); and (iv) atmospheric correction, which includes correction for temperature and relative humidity of the study area.
A reflected 3D ray without intersection with a PV panel is shown in green. A reflected 3D ray with intersection with a PV panel is shown in red.
To carry out the atmospheric correction, it is necessary to know the values of temperature (°C) and relative humidity (%) at the time of acquisition [40]. Two options are contemplated in SunMap: (i) only an estimation of an average value is available for the entire drone flight, or (ii) these values can be provided from a meteorological station close to the facilities of the PV plant.
The final atmospheric correction of the thermographic images is synthesized using the following equation (Equation (1)) [6]:
T o b j = W t o t 1 ε · τ · σ · T r e f l 4 1 τ · σ · T a t m 4 ε · τ · σ 4
where the total radiation (Wtot) received by the IRT camera comprises the emission of the object, ε·τ·Wobj, the emission of the surroundings reflected by the object, (1 − ε)·τ·Wrefl, and the emission of the atmosphere, (1 − τ)·Watm.
Although there are accurate methodologies for calculating the operating temperature of photovoltaic modules [41], the proper expression depends on the specific mounting geometry. Equation (2) allows for the estimation of the temperature of the PV module from basic data such as ambient temperature, irradiance, and specific parameters of the module such as the Nominal Operating Cell Temperature (NOCT) [6]:
T c = T a + G T G N O C T T N O C T T a N O C T
where Tc is the operating temperature of PV module, GT is the irradiance, GNOCT is the irradiance at NOCT conditions (800 W/m2), TNOCT is the operating temperature of the PV module at NOCT conditions (45 °C for the analysed module), and Ta−NOCT is the ambient temperature at NOCT conditions (20 °C).

2.5. Statistical Analysis of Temperatures

Reliable hot spot detection requires an exhaustive statistical analysis. Therefore, despite applying calibrations to the acquired images and taking into account the corresponding corrections in the previous section, the detection of hot spots is applied based on the estimation of temperature gradients, not their absolute values. To do this, robust statistics (i.e., median and biweight midvariance (BWMV)) [42] are applied (Equations (3)–(5)), supported by statistical samples at two different levels: (i) the array level, assessing all the thermographic images that correspond to the PV array; and (ii) the panel level, analysing all the thermographic images that correspond to a given PV panel. Note that the photogrammetric process has been fully solved with both visible and thermographic images, making it possible to unambiguously identify the PV panels and PV arrays in the thermographic images. Again, this process is completely automatic, and the results are outlined in the expert report.
B W M V = n i = 1 n a i x i m 2 1 U i 2 4 i = 1 n a i 1 U i 2 1 5 U i 2 2
U i = μ i m 9 M A D
where m is the median, n is the number of points, U is a parameter from Equation (4), µ is the mean and MAD is the median absolute deviation, being
M A D = m e d i a n D i f i m D i f
where Dif denotes the temperature gradients and mDif is the median of the gradients in temperatures. Finally, the value of the parameter a (Equation (3)) can be 0 or 1 depending on the U value. If −1 ≤ U ≤ 1, a = 1, otherwise a = 0.

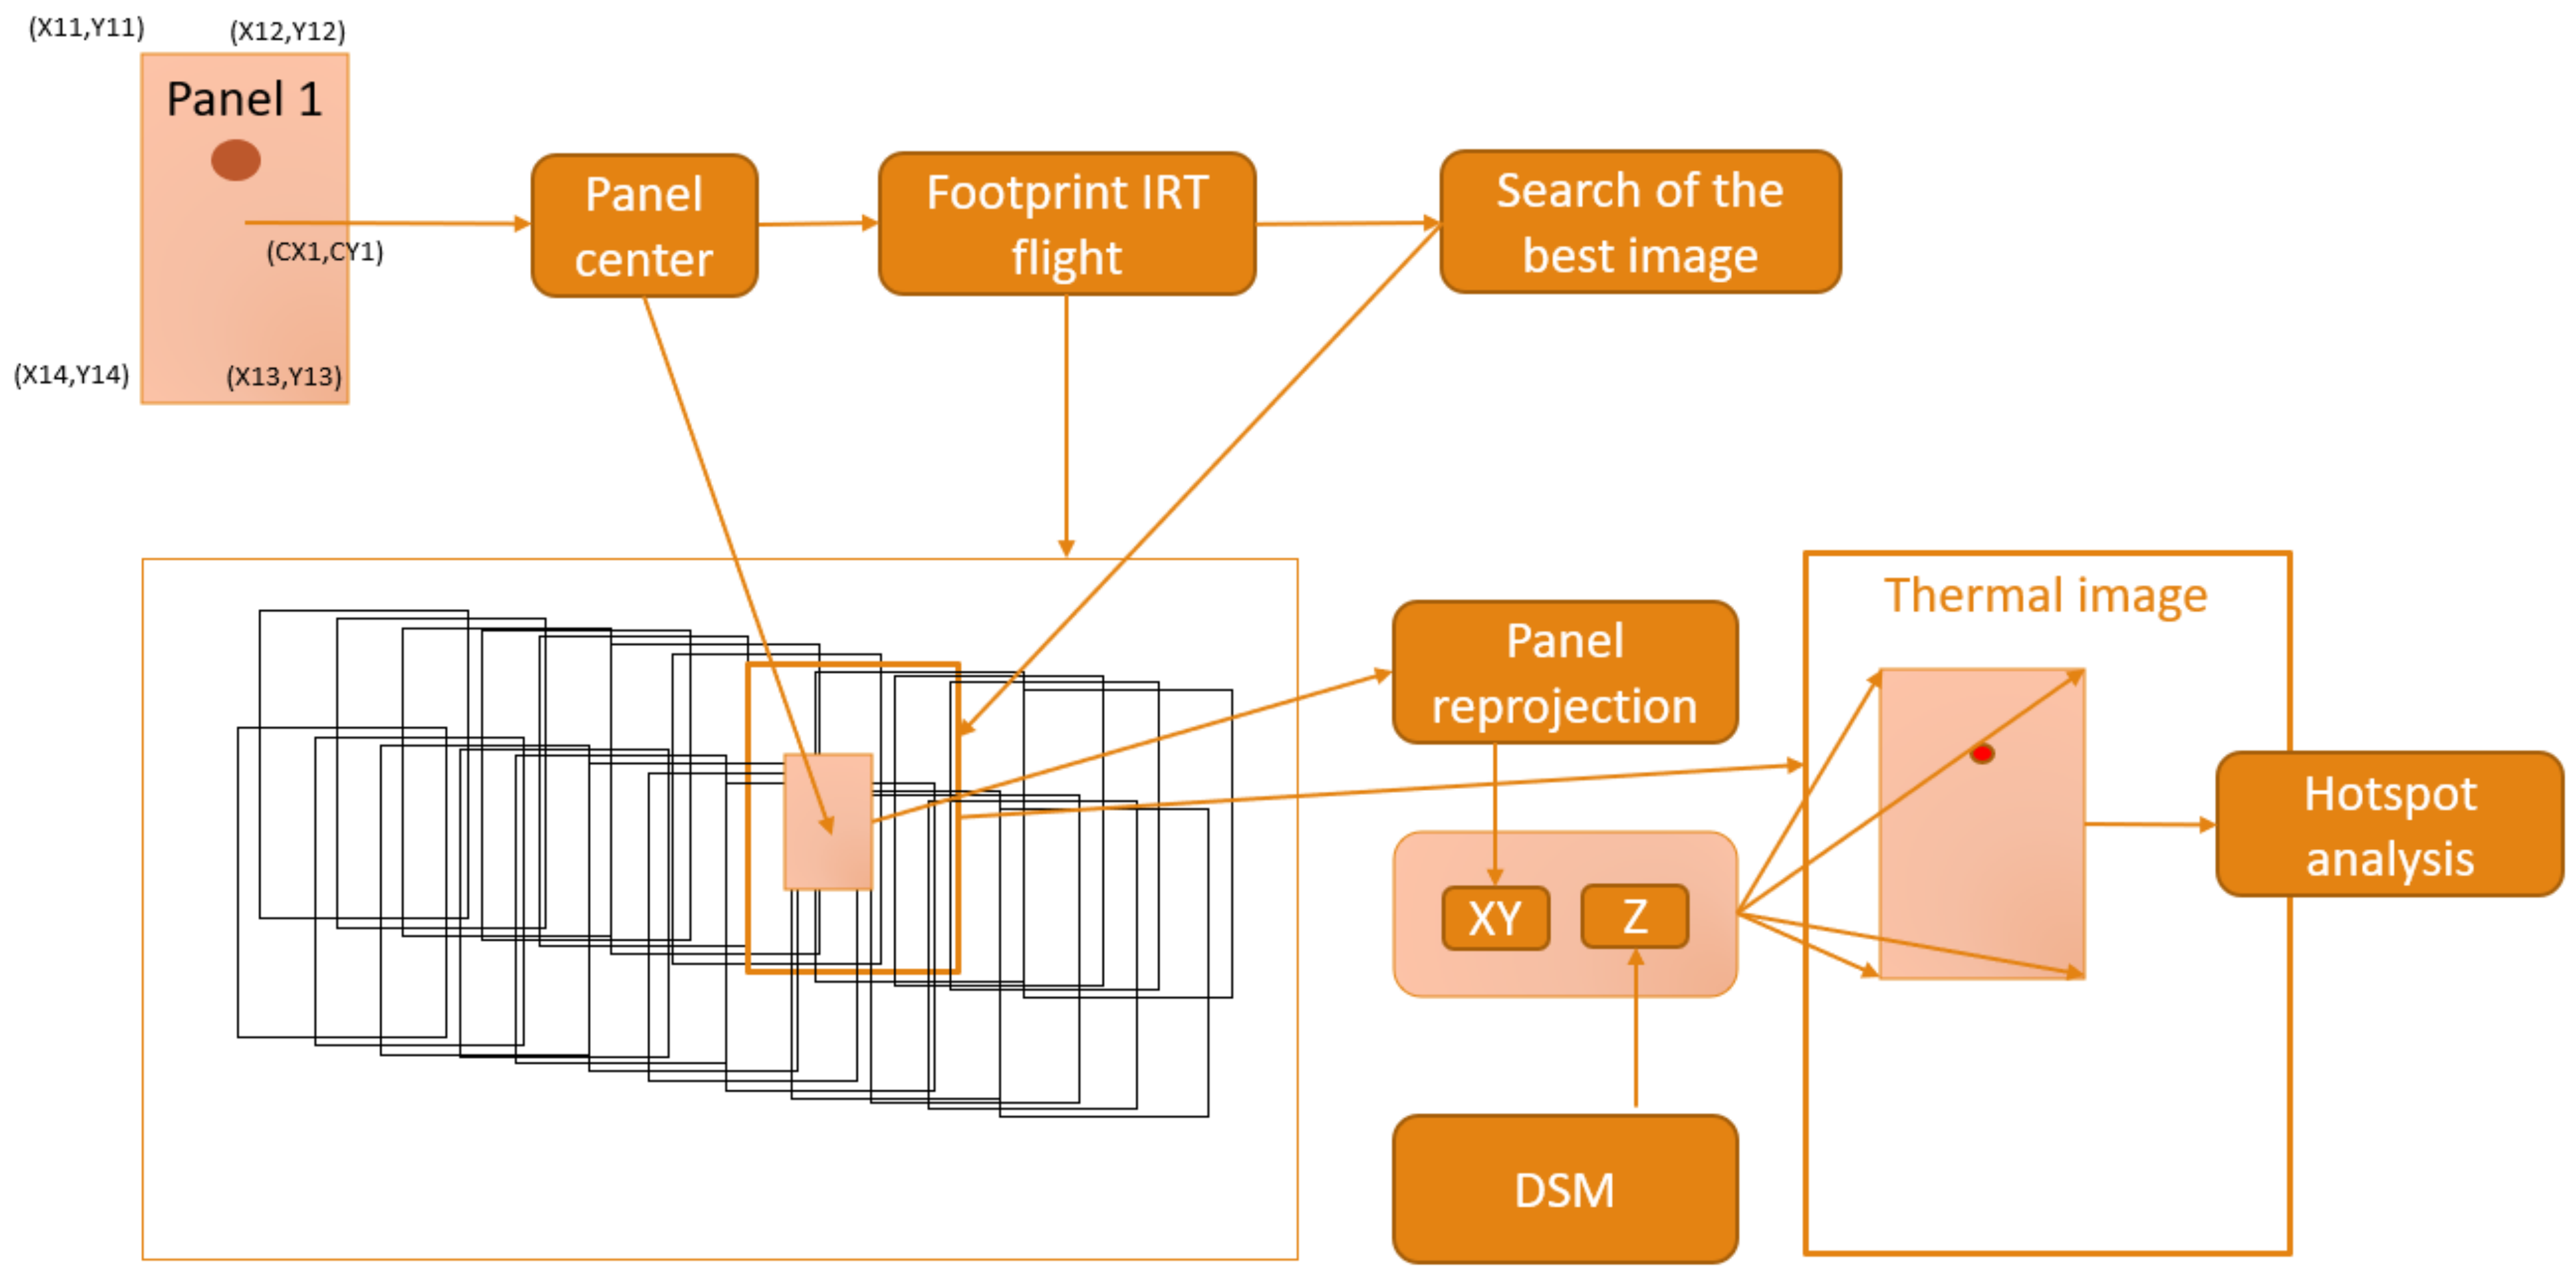
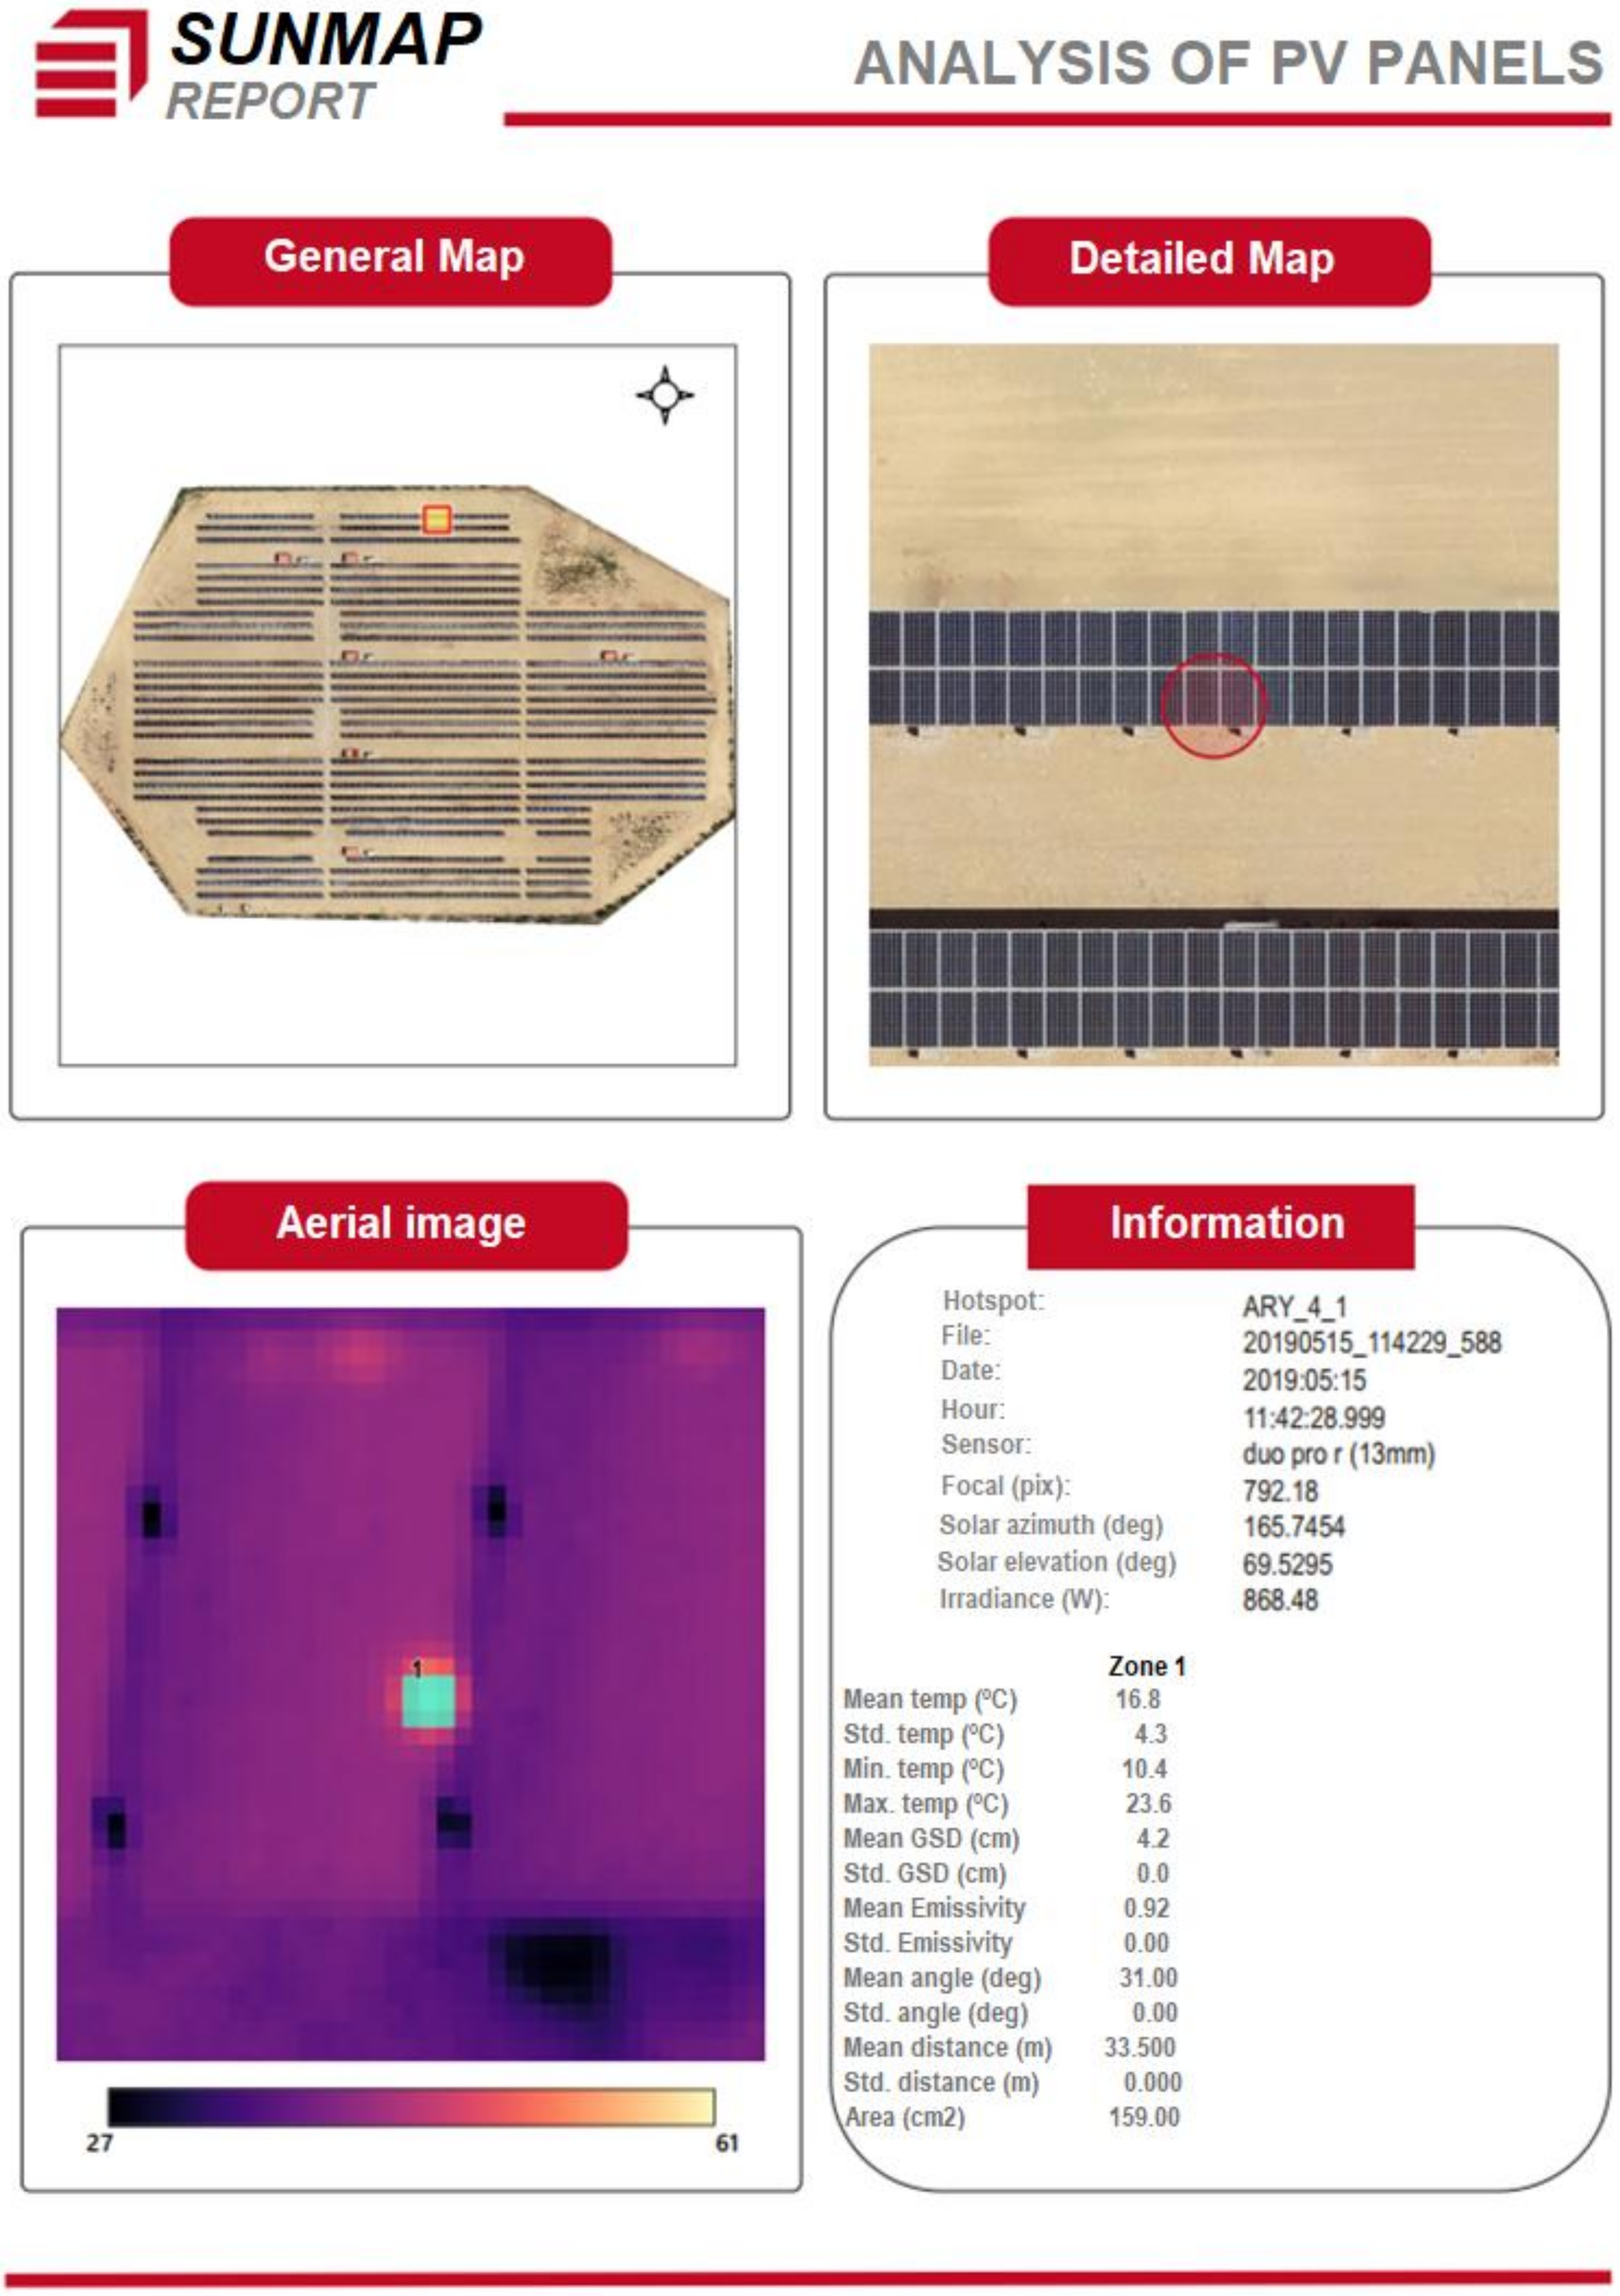
2.6. Hot Spot Detection and Expert Report Generation
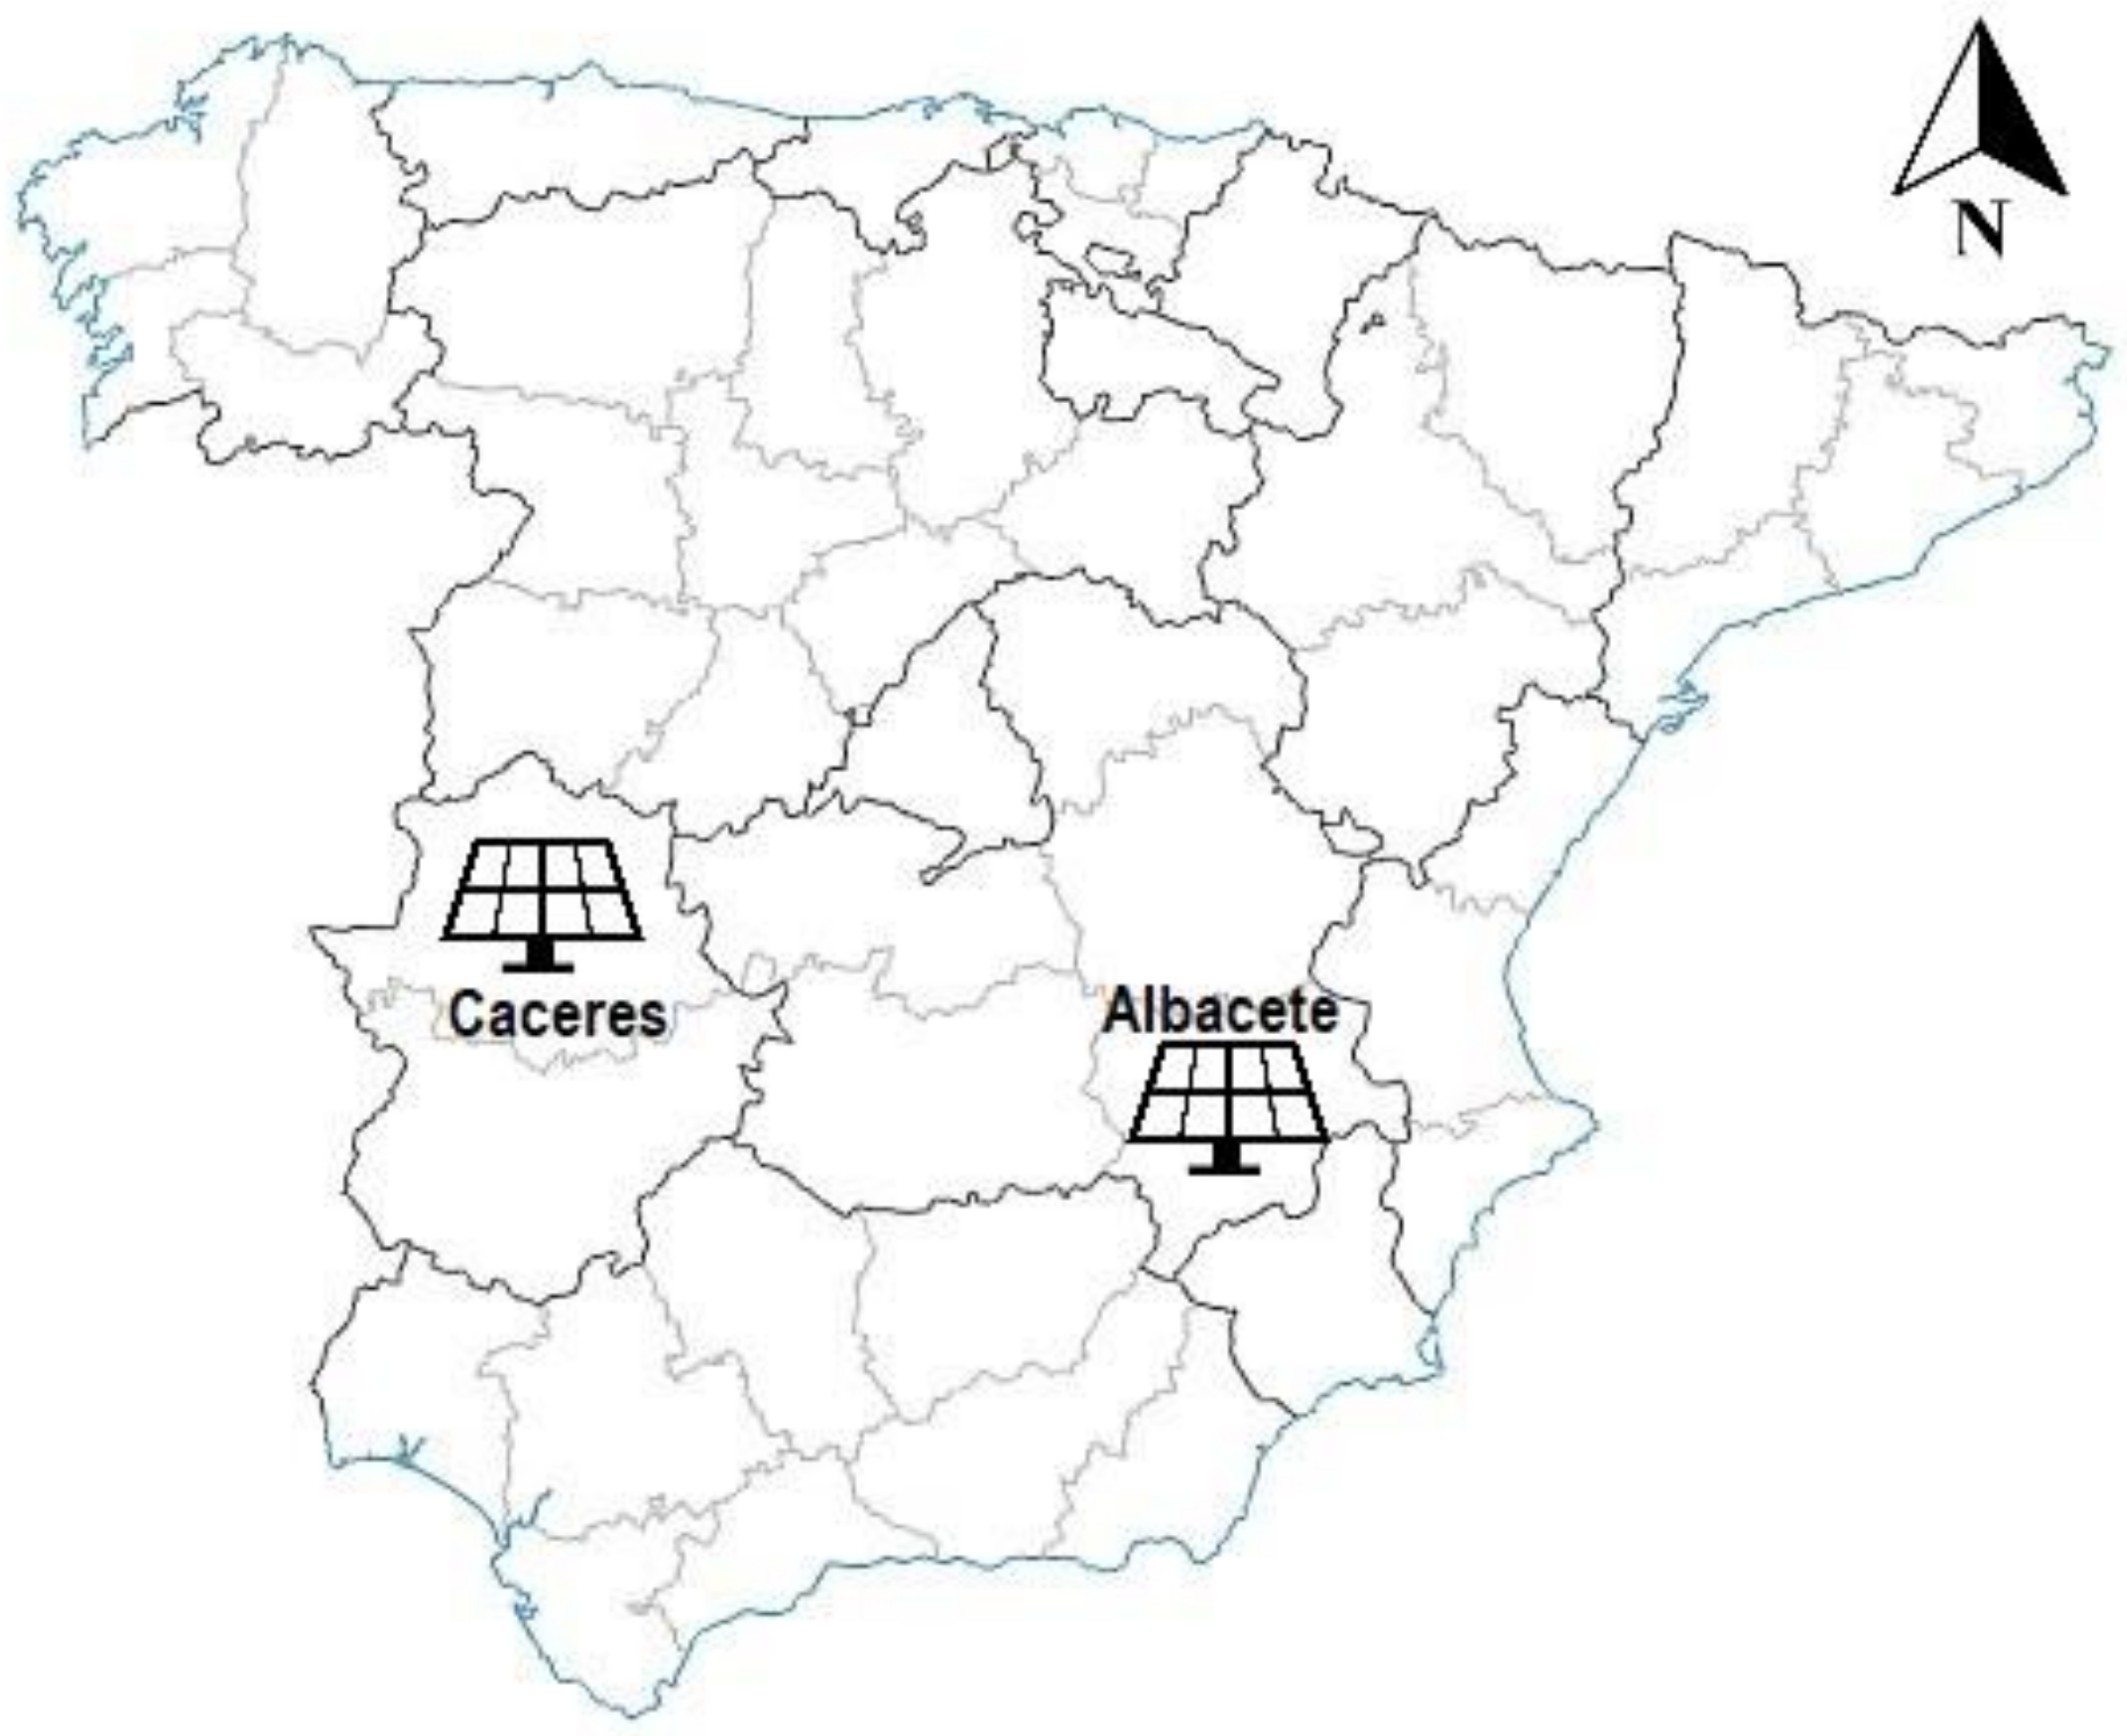
Finally, hot spot detection requires an automatic iterative process based on the analysis of panels extracted as described in Section 2.3 and the footprint of the IRT flight (Figure 5). Starting with the PV panel contour coordinates, a search is performed for those thermographic images with less perspective or that are more vertical in relation to the PV panel. As a result, more than one thermographic image can be used for hot spot detection, and thus robust detection can be provided through the calculation of the different temperature gradients (Section 2.5). A hot spot is considered valid if it fulfils at least two conditions: (i) it appears in three thermographic images; and (ii) it exists at a gradient with respect to its neighbours above a threshold, for example, 10 °C [43].
The geolocation of the hot spot in an official CRS is obtained through the photogrammetric resolution of the process detailed in Section 2.1, together with the generation of the expert report.

3. Case Studies

Validation of the SunMap tool was carried out in two PV plants located in the west and east of Spain, in Caceres and Albacete, respectively (Figure 6). Both locations have many hours of sunshine per year (>3000 h), making them ideal locations for this type of renewable energy infrastructure. The PV plant in Caceres (Figure 7a) has a surface of 12.5 ha and contains 156 PV arrays, with power generation of 2.9 MW. The PV plant located in Albacete (Figure 7c) has a surface of 9 ha and contains 77 PV arrays, with power generation of 3 MW. These two cases were selected based on the interest of two different companies in checking and validating the possibilities of the tool for the automatic inspection of PV plants.
Another important aspect for the validation of the SunMap tool is the use of different types of drones and sensors in each case study (Figure 7b,d). The following table (Table 1) outlines the technical details of the different drone platforms and sensors used.
For the imagery acquisition, different photogrammetric flights were planned and executed using a tool, Mflip, developed by the authors [44]. Special attention was focused on the different characteristics of the RGB and IRT cameras (i.e., resolution, field of view, etc.) so that the PV plants could be recorded with a single flight using both sensors simultaneously.
Regarding navigation, both flights were executed using GNSS/INS hardware and integrated navigation technology, so that the exterior orientation parameters of aerial imagery could be used as initial approximations in the photogrammetric process. This georeferencing method, which is called direct georeferencing, has gained increasing attention in the photogrammetry community because it does not require measuring ground control points, allowing unattended maintenance of PV plants.

4. Results

In this section, the different results obtained at two different PV plants are described and analysed in order to validate the in-house software.

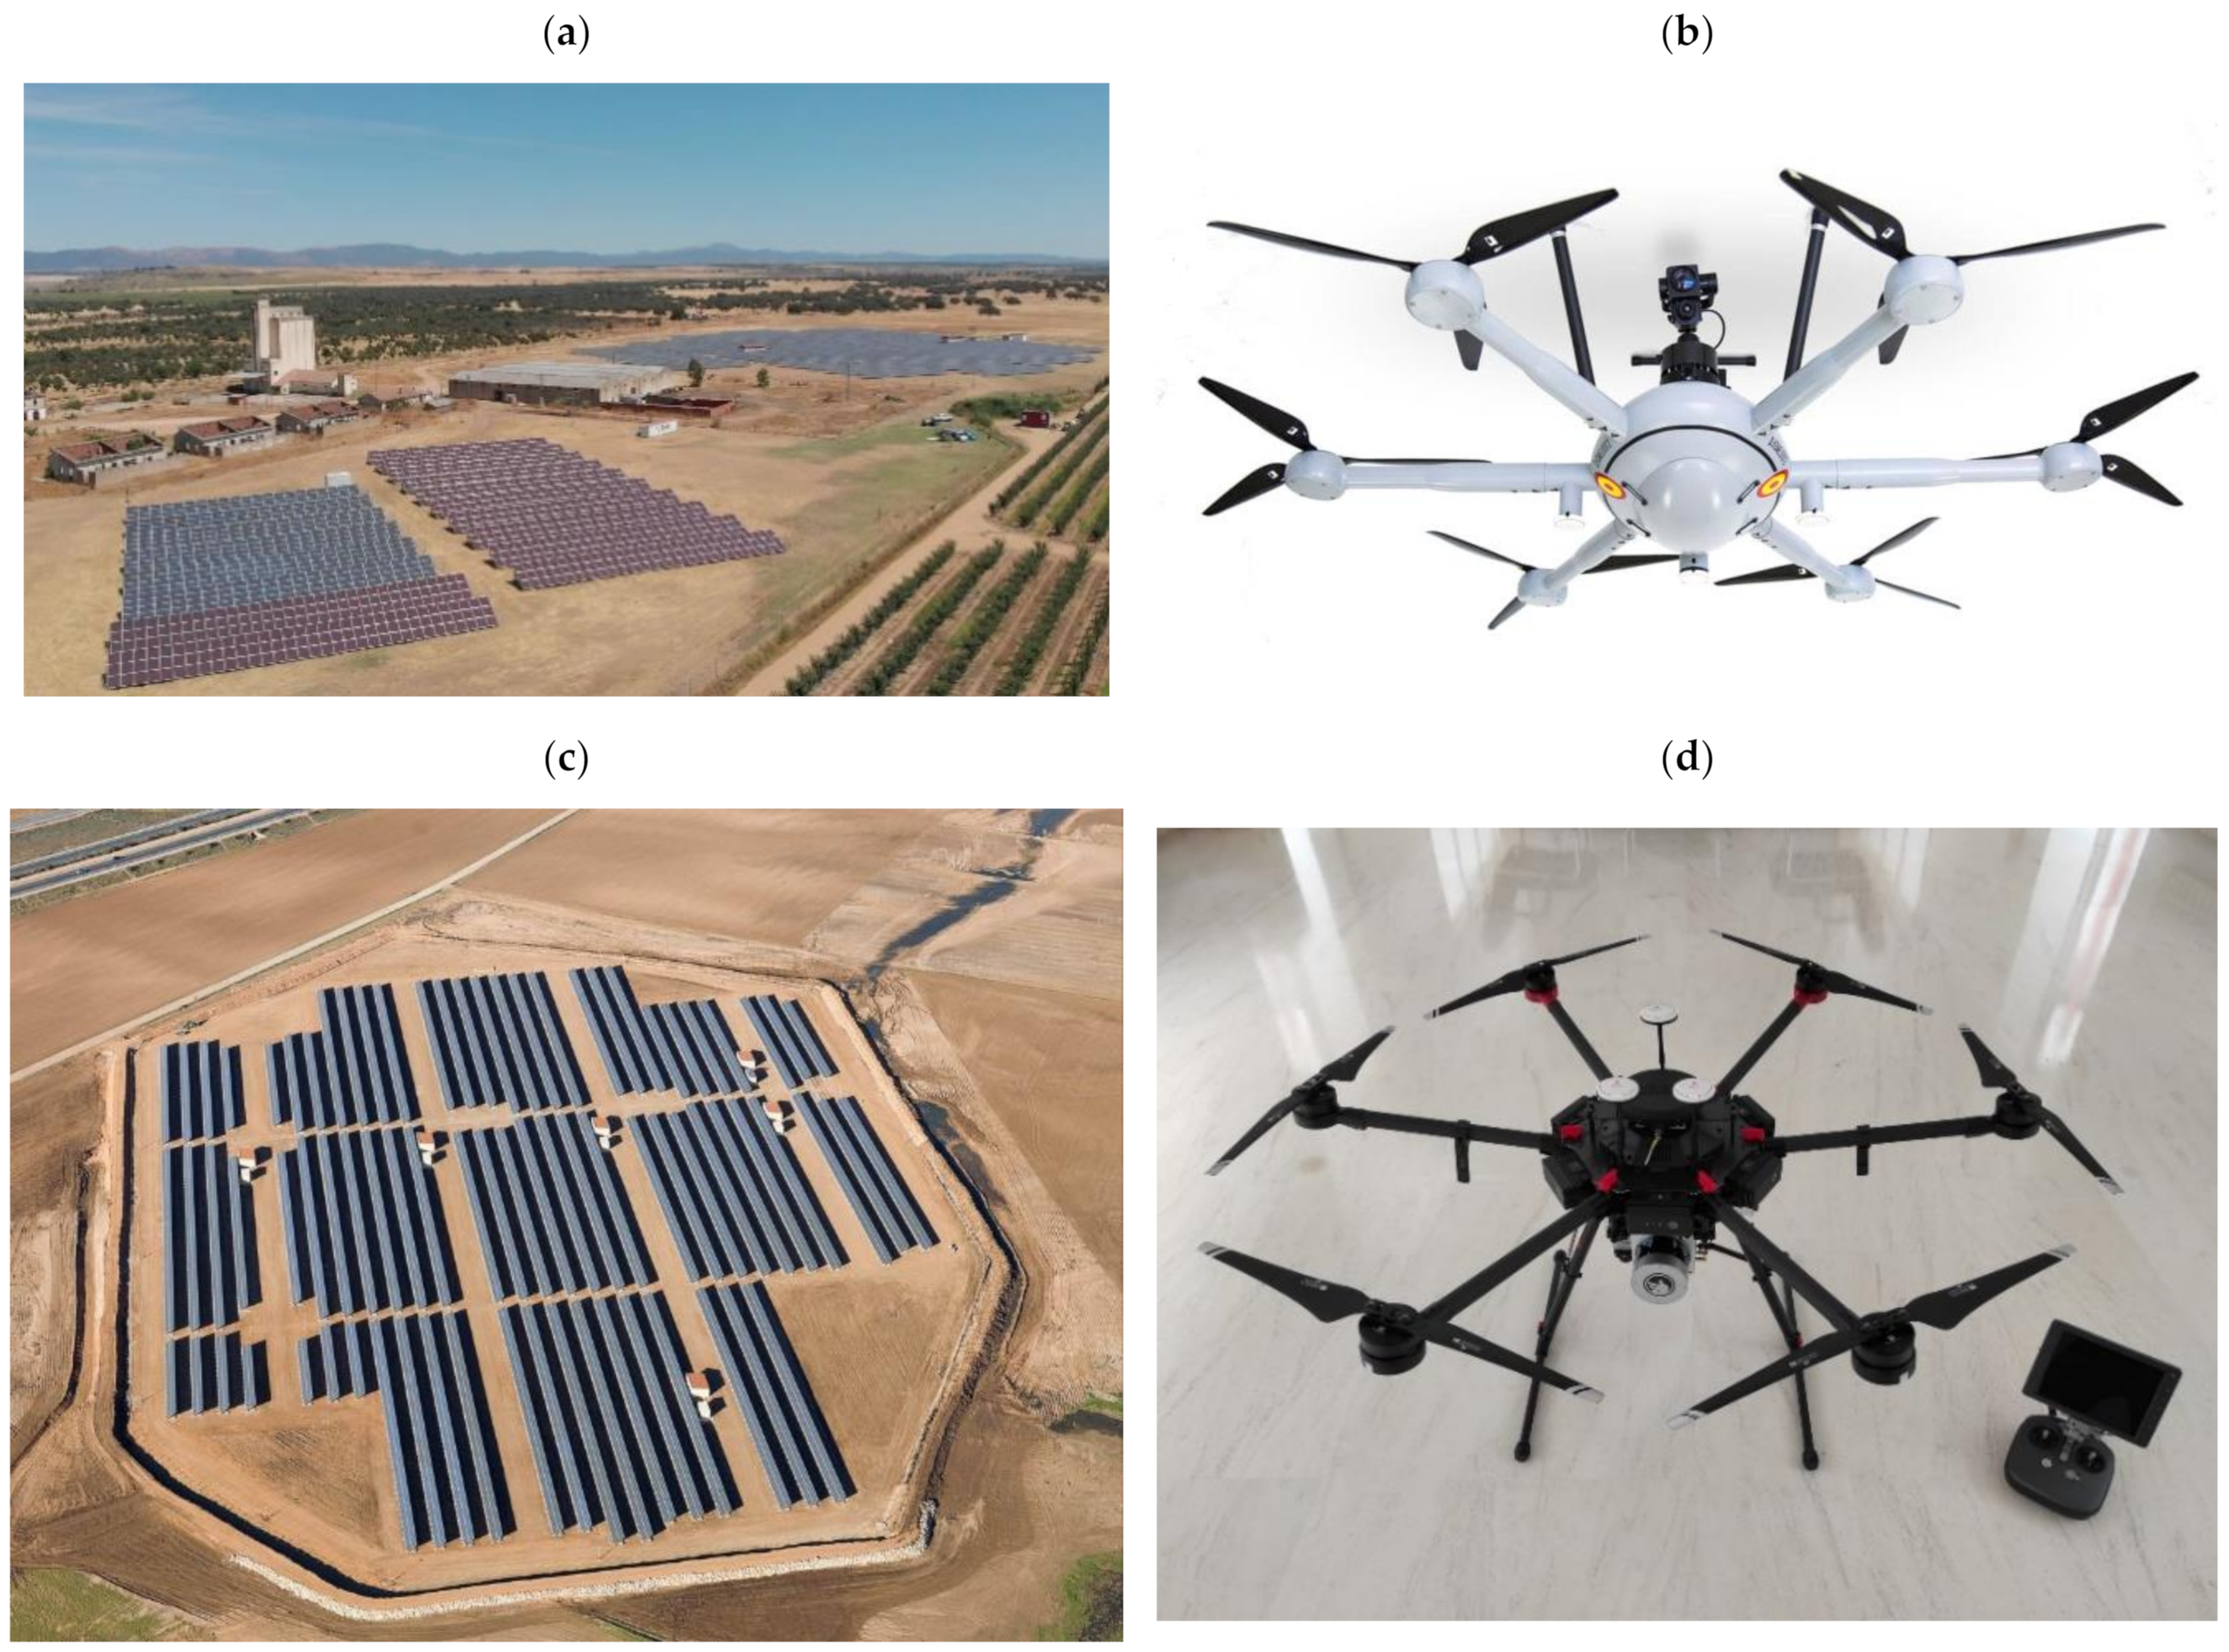
4.1. Photogrammetric Processing of Visible and Thermographic Images

At the PV plant at Caceres, a single flight was executed with a flight height of 30 m. A total of 25 strips were made in the W-E direction and a total of 1524 visible images and 1149 thermographic images were acquired. The ground sample distance (GSD) was 1 cm for the visible images and 5.7 cm for the thermographic images.
At the PV plant at Albacete, two separate flights were executed with a flight height of 70 m and 25 m for RGB and IRT, respectively. As a result, a total of 236 visible images and 5313 thermographic images were acquired. The GSD was 2 cm for the visible images and 3 cm for the thermographic images. These GSDs were considered valid for the detection of hot spots according to the specifications provided by the manufacturer and the size of the PV cells.
All the images, together with the navigation data, constituted the input data for the photogrammetric process in SunMap following the pipeline outlined in Figure 1. As a result, the extraction and matching of features (Figure 8a) was applied successfully in both visible and thermographic images using SIFTGPU [29], and image-based 3D reconstruction was performed incrementally through an iterative process consisting of relative image orientation, triangulation, and bundle adjustment [32] (Figure 8b).
Regarding the self-calibration of cameras, the Fraser model [45] was applied to estimate two-radial-lens distortion (k1, k2) and two-decentering-lens distortion (p1, p2) parameters together with the focal length (f) and the principal point displacement (cx, cy). The following table (Table 2) outlines the inner calibration parameters for the different cameras used.

4.2. Generation of Cartographic Products

The generation of cartographic products was focused on the generation of three-dimensional dense point clouds using the multiple view stereo strategy, followed by the generation of digital terrain and surface models (DTM/DSM) in raster format. Finally, the true orthoimages were generated with an average GSD of 1 cm as a final cartographic product for the geolocation of the hot spots.
For the Albacete PV plant, the dense point cloud obtained contained a total of 410 million points, which were later optimized to a point cloud of 5.2 million points in order to generate both the DTM and the DSM with a GSD of 3.5 cm.
For the Caceres PV plant, the dense point cloud obtained yielded a total of 45 million points, which were later optimized in a point cloud of 18.8 million in order to generate the DTM and the DSM with a GSD of 10 cm. Figure 9 outlines the different cartographic products obtained. These GSDs for the DSMs can be considered valid considering the size of a PV cell.

4.3. Extraction and Detection of PV Panels

The extraction and detection of PV panels was performed following a coarse-to-fine approach applying different advanced linear feature extraction operators and using the true orthoimages as input data, since they have good resolution and are georeferenced in metric coordinates. The results of the discretization process for the PV panels were carried out at three levels (Figure 10): (i) array level (in green), including the entire linear structure composed of a series of rows and columns of panels; (ii) panel level (in red), where the different panels were grouped by rows or columns; and (iii) module level (in yellow), where the different modules that compose the PV panels were discretized.
As a result of this process, a geospatial database was generated in shapefile format that contains the hierarchical structure of the arrays, panels, and modules extracted and which is also used to precisely geolocate the hot spots in the expert report.

4.4. Hot Spot Detection and Report Generation

Finally, the hot spot detection was computed for both PV plants in UTM coordinates, including semantic information regarding array-panel identification and robust statistical information related to the temperature increment (10 °C) and affected area (m2). One of the main advantages of the SunMap tool is the capability to apply different corrections to the thermographic images (i.e., distance, angle, reflection and atmospheric), together with providing a robust statistical analysis of hot spots. As a result, a new table (Table 3) has been created including statistical information alongside the geometry of the set of pixels corresponding to a hot spot. All this information is included in the final expert report following the structure outlined in Figure 11.

5. Discussion

In this section, we discuss the core aspects of this article: (1) drone acquisition; (2) photogrammetric processing; and (3) hot spot detection.
Regarding drone acquisition, multirotor and multimodal imagery (i.e., RGB and IRT) are key starting points to which particular attention should be paid. In particular, a flight planning mission is essential for guaranteeing automation of inspection, especially considering the different technical features of RGB and IRT cameras in terms of resolution, field of view, etc. In those cases where a simultaneous acquisition flight is not possible, two different flights will be required. Our flight-planning software [44] allows dealing with all these specifications, providing successful integration of RGB and IRT cameras.
Drone photogrammetry has successfully proven its efficiency and reliability in PV plant inspection. Drone photogrammetry supported by SfM and MVS is autonomous and saves time and cost; however, real-time processing is not possible, requiring postprocessing of the multimodal dataset acquired. Although different projects have implemented aerial drones for image acquisition, the majority did not take advantage of the full benefits of modern photogrammetry and computer vision workflow. In particular, the images acquired in other approaches were not orthorectified based on true orthoprojection. This prevents making accurate measurements, which simplify quantitative assessment of defective regions. These true orthoimages can be also integrated into a GIS, enabling spatial analysis operations and establishing a regular database for the inspected PV plant.
Regarding hot spot detection, although different works have tested artificial intelligence approaches, they require creating a complete benchmark, which is always a significant drawback. To this end, a hybrid and a coarse-to-fine method seems to be an efficient method for accurately and reliably detecting hot spot faults. RGB and IRT images complement each other, so a robust analysis can be performed to extract the different elements and detect false hot spots. Different projects have addressed the automatic extraction of modules, cells and defects through image processing pipelines, but noise reduction in IRT images is often a problem for applying further processing operations such as segmentation, edge extraction, and hot spot detection. In this regard, we considered a rigorous correction of IRT images based on distance, reflection, atmosphere and incident angle. Last but not least, a robust statistical analysis was used for the detection of hot spots in IRT images. Thresholds were selected based on statistical assumptions regarding the temperature distribution, as well as additional assumptions related to the correction of reflection from other PV modules.

6. Conclusions

This study presents a rigorous method for detecting hot spots in PV plants using an in-house software application, SunMap, which been proposed and validated. SunMap is a novel tool based on drone photogrammetry that is able to automatically detect and geolocate hot spot faults in PV plants. Moreover, the tool enables the generation of high-detailed cartographic products by means of 3D models and true orthoimages, which complement the maintenance and inspection operations required for this type of critical infrastructure. The tool was successfully validated in two different PV plants to provide accurate and reliable checking of hot spot faults.
In summary, the principal conclusions based on the results obtained with the SunMap tool are:
  • A rigorous photogrammetric approach able to deal with RGB and IRT images is provided.
  • 3D dense models and true orthoimages are generated automatically with high quality and metric properties.
  • Automatic extraction and database coding of the structural information regarding the PV panels is integrated into the software, guaranteeing subpixel precision.
  • Important thermographic corrections and robust statistical analysis are encoded within the software, providing rigorous thermographic treatment of images.
  • The hot spot detection is reliable and accurate, and is reinforced with an expert report which integrates all the information required for maintenance operations.
In terms of future perspectives, the classification of pathologies according to IEC TS 62446-3, including Deep Learning techniques using geometric and radiometric information as input data, will be considered as next steps.

Author Contributions

Conceptualization, D.H.-L. and D.G.-A.; methodology, D.H.-L., E.R.d.O., M.A.M. and D.G.-A.; software, D.H.-L. and E.R.d.O.; validation, D.H.-L., M.A.M. and D.G.-A.; investigation, D.H.-L., E.R.d.O., M.A.M. and D.G.-A.; resources, D.H.-L. and D.G.-A.; writing—original draft preparation, D.G.-A.; writing—review and editing, D.H.-L., E.R.d.O. and D.G.-A.; supervision, D.H.-L. and D.G.-A. All authors have read and agreed to the published version of the manuscript.

Funding

This research received no external funding.

Data Availability Statement

Data sharing not applicable.

Conflicts of Interest

The authors declare no conflict of interest.

References

  1. Oskouei, M.Z.; Seker, A.A.; Tunçel, S.; Demirba¸s, E.; Gözel, T.; Hocaoğlu, M.H.; Abapour, M.; Mohammadi-Ivatloo, B. A Critical Review on the Impacts of Energy Storage Systems and Demand-Side Management Strategies in the Economic Operation of Renewable-Based Distribution Network. Sustainability 2022, 14, 2110. [Google Scholar] [CrossRef]
  2. Gonzalez-Aguilera, D.; Rodriguez-Gonzalvez, P. Drones—An Open Access Journal. Drones 2017, 1, 1. [Google Scholar] [CrossRef]
  3. Montes, G.A.; Goertzel, B. Distributed, decentralized, and democratized artificial intelligence. Technol. Forecast. Soc. Chang. 2019, 141, 354–358. [Google Scholar] [CrossRef]
  4. González-Aguilera, D.; López-Fernández, L.; Rodríguez-Gonzálvez, P.; Hernández-López, D.; Guerrero, D.; Remondino, F.; Menna, F.; Nocerino, E.; Toschi, I.; Ballabeni, A.; et al. GRAPHOS—Open-Source Software for Photogrammetric Applications. Photogramm. Rec. 2018, 33, 11–29. [Google Scholar] [CrossRef]
  5. Fernández-Hernandez, J.; González-Aguilera, D.; Rodríguez-Gonzálvez, P.; Mancera-Taboada, J. Image-based modelling from unmanned aerial vehicle (UAV) photogrammetry: An effective, low-cost tool for archaeological applications. Archaeometry 2015, 57, 128–145. [Google Scholar] [CrossRef]
  6. IEC TS 62446-3, Thecnical Specification: Photovoltaic (PV) Systems—Requirements for Testing, Documentation and Maintenance—Part 3: Photovoltaic Modules and Plants—Outdoor Infrared Thermography, Según la Edition 1.0 2017-06. Available online: https://webstore.iec.ch/publication/28628 (accessed on 30 December 2022).
  7. Grimaccia, F.; Leva, S.; Dolara, A.; Achaea, M. Survey on PV Modules’ Common Faults after an O&M Flight Extensive Campaign over Different Plants in Italy. IEEE J. Photovolt. 2017, 7, 810–816. [Google Scholar]
  8. Salient, S.; Chouder, A.; Guerriero, P.; Pavan, A.M.; Mellit, A.; Moeini, R.; Tricoli, P. Monitoring, diagnosis, and power forecasting for photovoltaic fields: A review. Int. J. Photoenergy 2017, 2017, 1356851. [Google Scholar]
  9. Tsanakas, J.A.; Ha, L.; Buerhop, C. Faults and infrared thermographic diagnosis in operating c-Si photovoltaic modules: A review of research and future challenges. Renew. Sustain. Energy Rev. 2016, 62, 695–709. [Google Scholar] [CrossRef]
  10. Høiaas, I.; Grujic, K.; Imenes, A.G.; Burud, I.; Olsen, E.; Belbachir, N. Inspection and Condition Monitoring of Large-Scale Photovoltaic Power Plants: A Review of Imaging Technologies. Renew. Sustain. Energy Rev. 2022, 161, 112353. [Google Scholar] [CrossRef]
  11. Meribout, M.; Kumar Tiwari, V.; Pablo Peña Herrera, J.; Baobaid, A.N.M.A. Solar Panel Inspection Techniques and Prospects. Measurement 2023, 209, 112466. [Google Scholar] [CrossRef]
  12. Bellezza Quarter, P.; Grimaccia, F.; Leva, S.; Mussetta, M.; Aghaei, M. Light Unmanned Aerial Vehicles (UAVs) for cooperative inspection of PV plants. IEEE J. Photovolt. 2014, 4, 1107–1113. [Google Scholar]
  13. Hu, Y.; Cao, W.; Ma, H.; Finney, S.J.; Li, D. Identifying PV Module Mismatch Faults by a Thermography-Based Temperature Distribution Analysis. IEEE Trans. Device Mater. Reliab. 2014, 14, 951–960. [Google Scholar] [CrossRef]
  14. López-Fernández, L.; Lagüela, S.; Fernández, J.; González-Aguilera, D. Automatic Evaluation of Photovoltaic Power Stations from High-Density RGB-T 3D Point Clouds. Remote Sens. 2017, 9, 631. [Google Scholar] [CrossRef] [Green Version]
  15. Tsanakas, J.A.; Chrysostomou, D.; Botsaris, P.N.; Gasteratos, A. Fault diagnosis of photovoltaic modules through image processing and Canny edge detection on field thermographic measurements. Int. J. Sustain. Energy 2015, 34, 351–372. [Google Scholar] [CrossRef]
  16. Afifah, A.N.N.; Indrabayu; Suyuti, A.; Syafaruddin. Hotspot detection in photovoltaic module using Otsu thresholding method. In Proceedings of the IEEE International Conference on Communication, Networks and Satellite (Comnetsat), Batam, Indonesia, 17–18 December 2020; pp. 408–412. [Google Scholar]
  17. Aghaei, M.; Grimaccia, F.; Gonano, C.A.; Leva, S. Innovative automated control system for PV fields inspection and remote control. IEEE Trans. Ind. Electron. 2015, 62, 7287–7296. [Google Scholar] [CrossRef]
  18. Henry, C.; Poudel, S.; Lee, S.-W.; Jeong, H. Automatic Detection System of Deteriorated PV Modules Using Drone with Thermal Camera. Appl. Sci. 2020, 10, 3802. [Google Scholar] [CrossRef]
  19. Piccinini, F.; Pierdicca, R.; Malinverni, E.S. A Relational Conceptual Model in GIS for the Management of Photovoltaic Systems. Energies 2020, 13, 2860. [Google Scholar] [CrossRef]
  20. Sánchez-Aparicio, M.; Martín-Jiménez, J.; Del Pozo, S.; González-González, E.; Lagüela, S. Ener3DMap-SolarWeb roofs: A geospatial web-based platform to compute photovoltaic potential. Renew. Sustain. Energy Rev. 2021, 135, 110203. [Google Scholar] [CrossRef]
  21. Yahya, Z.; Imane, S.; Hicham, H.; Ghassane, A.; Safia, E.B.I. Applied imagery pattern recognition for photovoltaic modules’ inspection: A review on methods, challenges and future development. Sustain. Energy Technol. Assess. 2022, 52, 102071. [Google Scholar] [CrossRef]
  22. Wang, X.; Yang, W.; Qin, B.; Wei, K.; Ma, Y.; Zhang, D. Intelligent monitoring of photovoltaic panels based on infrared detection. Energy Rep. 2022, 8, 5005–5015. [Google Scholar] [CrossRef]
  23. Oña, E.R.D.; Rodríguez-Martin, M.; Rodríguez-Gonzálvez, P.; Mora, R.; González-Aguilera, D. WELDMAP: A Photogrammetric Suite Applied to the Inspection of Welds. Appl. Sci. 2022, 12, 2553. [Google Scholar] [CrossRef]
  24. Oña, E.R.D.; Sánchez-Aparicio, M.; Del Pozo, S.; González-Aguilera, D. INSPECTORMAP: A Spatial Data Infrastructure Applied to the Maintenance of Solar Plants Using Free Satellite Imagery. Appl. Sci. 2022, 12, 70. [Google Scholar]
  25. Moser, D.; Del Buono, M.; Bresciani, W.; Veronese, E.; Jahn, U.; Herz, M.; Janknecht, E.; Ndrio, E.; De Brabandere, K.; Richter, M. Technical risks in PV projects development and PV plant operation D1.1. D2.1. Solar Bankability Project 2016, 1, 1–139. [Google Scholar]
  26. Cledat, E.; Jospin, L.V.; Cucci, D.A.; Skaloud, J. Mapping quality prediction for RTK/PPK-equipped micro-drones operating in complex natural environment. ISPRS J. Photogramm. Remote Sens. 2020, 167, 24–38. [Google Scholar] [CrossRef]
  27. Furukawa, Y.; Hernández, C. Multi-View Stereo: A Tutorial, Foundations and Trends® in Computer Graphics and Vision; Now Publishers Inc.: Hanover, MA, USA, 2015; Volume 9, pp. 1–148. [Google Scholar]
  28. Lowe, D.G. Distinctive image features from scale-invariant keypoints. Int. J. Comput. Vis. 2004, 60, 91–110. [Google Scholar] [CrossRef]
  29. Wu, C. A GPU Implementation of Scale Invariant Feature Transform (SIFT). Available online: https://github.com/pitzer/SiftGPU (accessed on 12 April 2022).
  30. Muja, M.; Lowe, D.G. Fast approximate nearest neighbors with automatic algorithm configuration. VISAPP 2009, 2, 2. [Google Scholar]
  31. Fischler, M.A.; Bolles, R.C. Random sample consensus: A paradigm for model fitting with applications to image analysis and automated cartography. Commun. ACM 1981, 24, 381–395. [Google Scholar] [CrossRef]
  32. Schönberger, J.L.; Frahm, J. Structure-from-Motion Revisited. In Proceedings of the IEEE Conference on Computer Vision and Pattern Recognition, Las Vegas, NV, USA, 27–30 June 2016; pp. 4104–4113. [Google Scholar]
  33. Zhang, W.; Qi, J.; Wan, P.; Wang, H.; Xie, D.; Wang, X.; Yan, G. An Easy-to-Use Airborne LiDAR Data Filtering Method Based on Cloth Simulation. Remote Sens. 2016, 8, 501. [Google Scholar] [CrossRef]
  34. Łukaszyk, S. A new concept of probability metric and its applications in approximation of scattered data sets. Comput. Mech. 2004, 33, 299–304. [Google Scholar] [CrossRef]
  35. Gharibi, H.; Habib, A. True Orthophoto Generation from Aerial Frame Images and LiDAR Data: An Update. Remote Sens. 2018, 10, 581. [Google Scholar] [CrossRef]
  36. Kraus, K. Photogrammetry; Ferd. Dummler’s Verlag: Bonn, Germany, 1993; Volume 1, Fundamentals and standard processes; Volume 2, Advanced methods and applications. [Google Scholar]
  37. Kudelka, M.; Horak, Z.; Voženílek, V.; Snasel, V. Orthophoto feature extraction and clustering. Neural Netw. World 2012, 22, 103–121. [Google Scholar] [CrossRef]
  38. Visvalingam, M.; Whyatt, J.D. The Douglas-Peucker Algorithm for Line Simplification: Re-evaluation through Visualization. Comput. Graph. Forum. 2007, 9, 213–225. [Google Scholar] [CrossRef]
  39. Martin, E.; Kriegel, H.-P.; Sander, J.; Xu, X. A density-based algorithm for discovering clusters in large spatial databases with noise. In Proceedings of the Second International Conference on Knowledge Discovery and Data Mining, Portland, OR, USA, 2–4 August 1996; pp. 226–231. [Google Scholar]
  40. Tran, Q.H.; Han, D.; Kang, C.; Haldar, A.; Huh, J. Effects of Ambient Temperature and Relative Humidity on Subsurface Defect Detection in Concrete Structures by Active Thermal Imaging. Sensors 2017, 17, 1718. [Google Scholar] [CrossRef]
  41. Ferreira, R.A.; Pottie, D.L.; Dias, L.H.; Cardoso Filho, B.J.; Porto, M.P. A Directional-Spectral Approach to Estimate Temperature of Outdoor PV Panels. Sol. Energy 2019, 183, 782–790. Available online: https://www.sciencedirect.com/science/article/pii/S0038092X19302786 (accessed on 7 February 2023). [CrossRef]
  42. Rodríguez-Gonzálvez, P.; Garcia-Gago, J.; Gomez-Lahoz, J.; González-Aguilera, D. Confronting Passive and Active Sensors with Non-Gaussian Statistics. Sensors 2014, 14, 13759–13777. [Google Scholar] [CrossRef]
  43. Kamran, A.; Khan, N.; Wajahat, A.; Hassan, A.; Khan, Y.; Yang, Y.; Shahrukh, A. Hotspot diagnosis for solar photovoltaic modules using a Naive Bayes classifier. Sol. Energy 2019, 190, 34–43. [Google Scholar]
  44. Hernandez-Lopez, D.; Felipe-Garcia, B.; Gonzalez-Aguilera, D.; Arias-Perez, B. An automatic approach to UAV flight planning and control for photogrammetric applications. Photogramm. Eng. Remote Sens. 2013, 79, 87–98. [Google Scholar] [CrossRef]
  45. Fraser, C.S. Digital camera self-calibration. ISPRS J. Photogramm. Remote Sens. 1997, 52, 149–159. [Google Scholar] [CrossRef]
Figure 1. Workflow scheme of the method developed and encoded in SunMap. SfM refers to Structure from Motion for providing self-calibration and orientation of images. MVS refers to the multiview stereo technique for generating dense point clouds. DTM and DSM refer to digital terrain and surface models, respectively.
Drones 07 00129 g001
Figure 2. True orthoimage scheme developed and encoded in SunMap.
Drones 07 00129 g002
Figure 3. Schema of the different levels of discretization of the PV panels under study.
Drones 07 00129 g003
Figure 4. Reflection correction in thermal imagery: (a) 3D ray reflection computation and its possible intersection with other PV panels; (b) detected and isolated areas affected by reflections in IRT images. In green colour a reflected 3D ray without intersection with a PV panel. In red colour a reflected 3D ray with intersection with a PV panel.
Drones 07 00129 g004
Figure 5. Automatic and iterative hot spot detection process developed in SunMap.
Drones 07 00129 g005
Figure 6. Location of the PV plants included in the present research.
Drones 07 00129 g006
Figure 7. Aerial images acquired from drones of the PV plants used as pilot cases for the validation of the SunMap tool. (a) PV plant in Caceres, with an extension of 12.5 ha, 156 PV arrays and power generation of 2.9 MW. (b) Aerial drone platform and sensors used in the PV plant at Caceres. (c) PV plant located in Albacete with a surface of 9 ha, 77 PV arrays and power generation of 3 MW. (d) Aerial drone platform and sensors used in the PV plant at Albacete.
Drones 07 00129 g007
Figure 8. Photogrammetric processing in SunMap: (a) extraction of features based on SIFTGPU. The green circles represent the extracted points in the different images. The red circle represents the selected and matched point; (b) bundle adjustment imagery orientation based on collinearity condition and including camera self-calibration.
Drones 07 00129 g008
Figure 9. Cartographic products resulting from SunMap: 3D point clouds obtained in the PV plants of Caceres (a) and Albacete (b). DSM in vector format obtained at the Caceres PV plant (c). DSM in raster format obtained at the Albacete PV plant (d). True orthoimages from visible images generated at the PV plants at Caceres (e) and Albacete (f).
Drones 07 00129 g009
Figure 10. (a) Extraction and detection of PV panels using SunMap and following hierarchical discretization: detection of PV arrays in green, detection of PV panels in red, and detection of PV modules in yellow; (b) Structured information of the PV panels in vector format corresponding to PV arrays resulting from the automatic extraction and detection process.
Drones 07 00129 g010
Figure 11. Example of an expert report produced by the SunMap tool to support maintenance operations in PV plants.
Drones 07 00129 g011
Table 1. Technical features of the drones and sensors used in the pilot cases.
Drone PlatformCamera SensorsGNSS/INS Sensors
RGBIRTGNSS/RTKINS
RGB–Phantom 4
Thermal–DJI Matrice 600
FC6310R,

Resolution: 5472 × 3648 pixels

Focal length:
8.8 mm
Flir Duo Pro R

Resolution:
640 × 512 pixels

Focal length:
13 mm
GPS: L1/L2;
GLONASS: L1/L2;

Vertical 2.5 cm
Horizontal 2 cm
APX-15
RMS ERROR INS:
Roll: 0.02 Deg
Pitch: 0.02 Deg
Heading: 0.15 Deg
CondorSony ILCE-6000
Resolution: 6000 × 4000 pixels
Focal length:
16 mm
Workswell Wiris

Resolution:
640 × 512 pixels

Focal length:
13 mm
GPS: L1/L2;
GLONASS: L1/L2;
BeiDou: B1/B2;
Galileo E1/E5a

Vertical 1.5 cm
Horizontal 1 cm
RMS ERROR INS:
Roll: 0.02 Deg
Pitch: 0.02 Deg
Heading: 0.15 Deg
Table 2. Self-calibration of RGB and IRT cameras in the different case studies.
Location of PV PlantsRGBIRT
PV plant, Albacetef: 3549.6891f: 792.1776
cx: −13.4458cx: 10.1731
cy: 12.6957cy: 4.4445
k1: −0.25872317k1: 0.31691682
k2: 0.11303087k2: −0.03630885
p1: −0.00101272p1: −0.00292202
p2: −0.00031058p2: −0.00170231
PV plant, Caceresf: 3952.0199f: 496.8117
cx: 2944.9719cx: 326.6674
cy: 1915.3403cy: 261.1664
k1: 0.05358915k1: −0.30101814
k2: 0.03855508k2: 0.137739510
p1: 0.00617445p1: −0.00177455
p2: 0.00389557p2: −0.00001426
Table 3. Geolocation of hot spots in UTM coordinates and identification of the array and panel affected.
Location of PV PlantsHot Spot CoordinatesSemantic InformationΔΤμεδιανΔΤΒΩΜςΔΤμινΔΤμαξArea
(X, Y, UTM)(Array/Panel)(°C)(°C)(°C)(°C)(m2)
PV plant, AlbaceteH1: (608693.292, 4298641.314)Array_2_Panel_614.80.214.615.20.0006
H2: (608686.307, 4298603.146)Array_9_ Panel_115.72.410.130.30.1514
H3: (608593.379, 4298588.754)Array_11_ Panel_412.11.51016.30.0343
H4: (608722.99, 4298602.731)Array_16_ Panel_612.921015.40.0184
H5: (608816.908, 4298616.944)Array_14_ Panel_1142.610.120.70.0963
H6: (608804.4, 4298573.71)Array_20_ Panel_215.20.614.215.90.0099
H7: (608762.854, 4298588.594)Array_18_ Panel_514.73.310.423.20.0596
H8: (608684.113, 4298520.685)Array_29_ Panel_414.12.210.120.90.0426
H9: (608636.663, 4298534.604)Array_27_ Panel_113210.117.50.02
H10: (608681.254, 4298528.101)Array_28_ Panel_912.52.110.515.40.0092
H11: (608913.738, 4298541.88)Array_42_ Panel_113.42.610.120.90.0879
H12: (608665.377, 4298451.152)Array_51_ Panel_112.50.211.813.50.0022
H13: (608677.44, 4298434.384)Array_66_ Panel_211.60.910140.0343
PV plant, CaceresH1: (271960.445, 4338451.632)Array_2_ Panel_214.60.114.4150.0986
H2: (271961.776, 4338450.219)Array_2_ Panel_614.83.310.818.30.011
H3: (271987.440, 4338413.552)Array_11_ Panel_314.12.710220.8326
H4: (271967.000, 4338424.524)Array_11_ Panel_5142.210.323.10.0983
H5: (271965.387, 4338422.592)Array_12_ Panel_614.52.510.420.30.0381
H6: (271919.947, 4338350.703)Array_16_ Panel_312.70.212.113.90.0185
H7: (271923.550, 4338333.465)Array_18_ Panel_313.31.61019.40.1876
H8: (272004.211, 4338386.299)Array_26_ Panel_513.92.21022.30.0946
H9: (271956.918, 4338359.317)Array_28_ Panel_914.32.410.321.70.0116
H10: (271988.745, 4338342.373)Array_30_ Panel_614.2310.1210.1218
H11: (271941.599, 4338307.870)Array_31_ Panel_510.60.110.410.70.0016
H12: (271933.203, 4338305.567)Array_31_ Panel_613.92.21020.90.0518
H13: (271922.018, 4338306.404)Array_31_ Panel_711.81.91015.80.0216
H14: (271975.008 4338333.946)Array_34_ Panel_714.53.610.620.80.048
H15: (272079.122, 4338433.789)Array_38_ Panel_712.70.312.4130.2917
H16: (271961.229, 4338315.750)Array_51_ Panel_1012.9012.812.90.002
Disclaimer/Publisher’s Note: The statements, opinions and data contained in all publications are solely those of the individual author(s) and contributor(s) and not of MDPI and/or the editor(s). MDPI and/or the editor(s) disclaim responsibility for any injury to people or property resulting from any ideas, methods, instructions or products referred to in the content.

