
Using Particle Swarm Optimization and Artificial Intelligence to Select the Appropriate Characteristics to Determine Volume Fraction in Two-Phase Flows
 , and
, and
Abstract
:1. Introduction
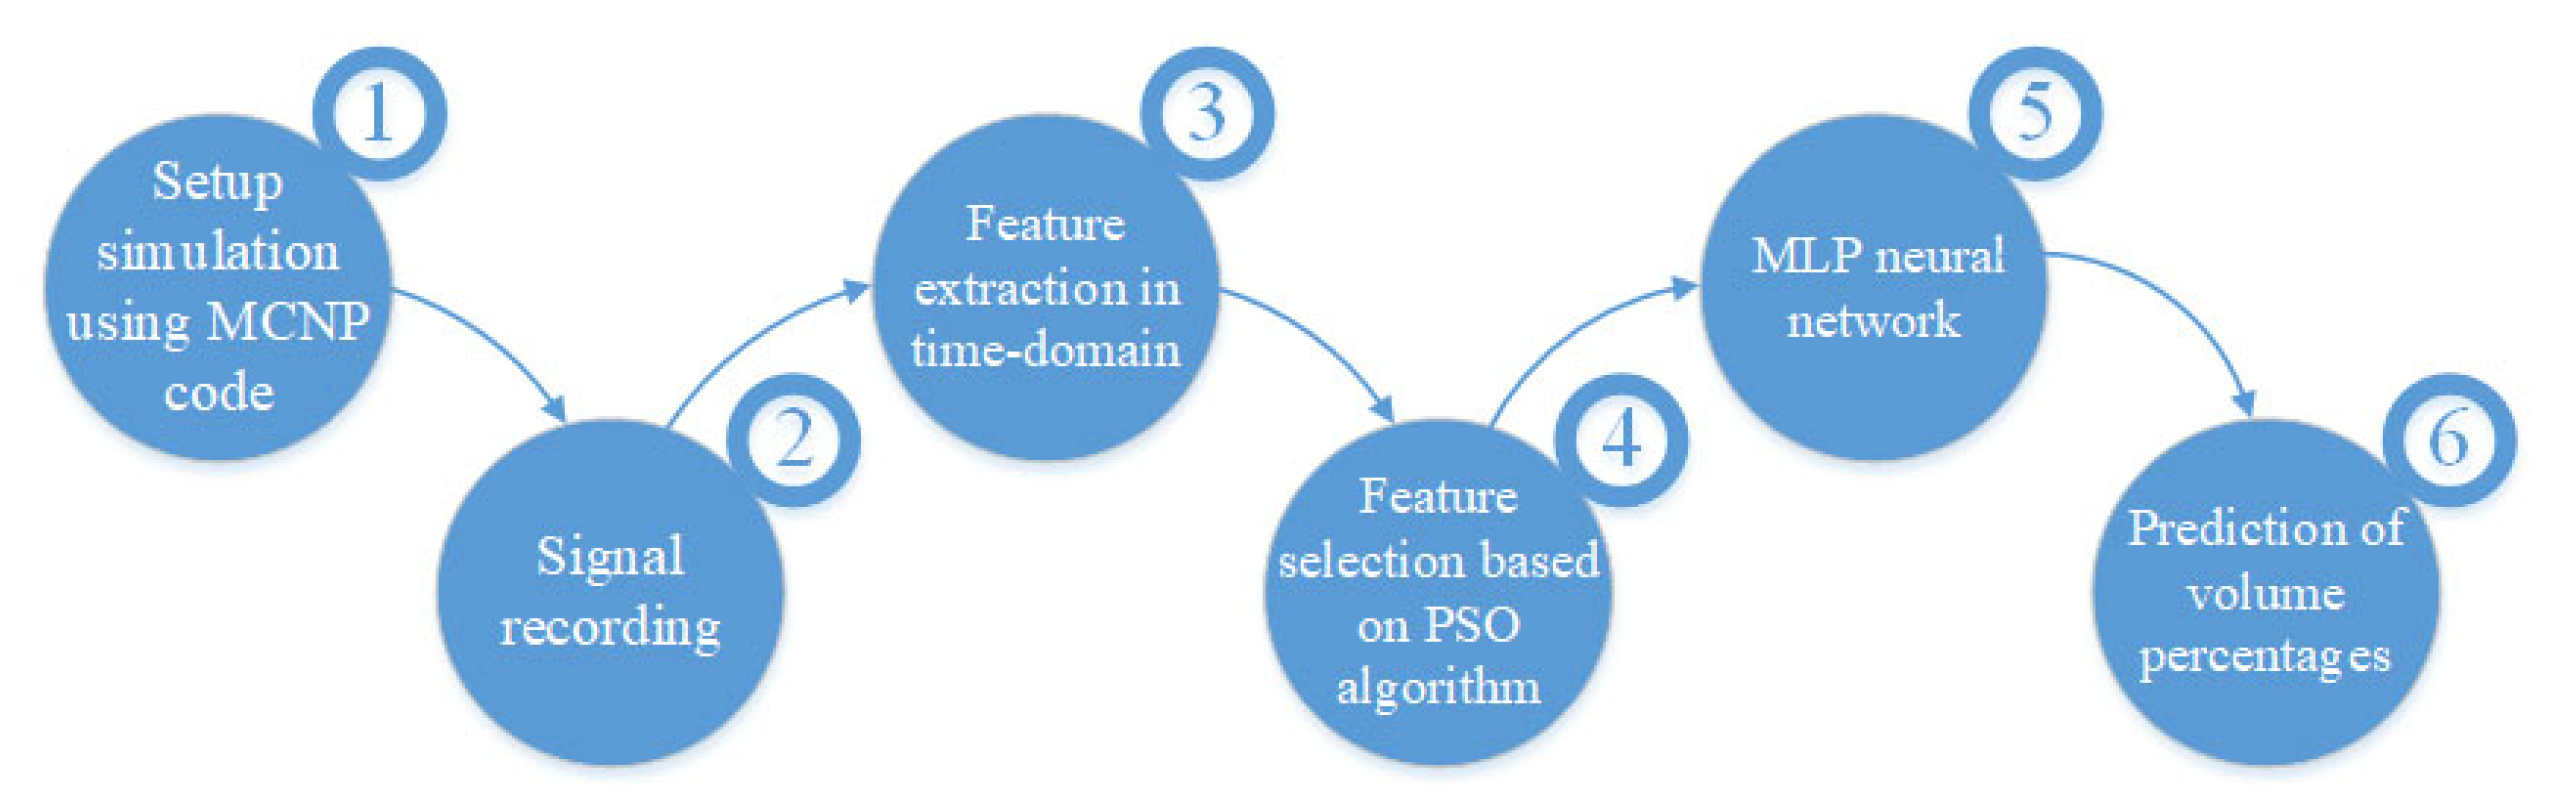
- Extraction of time characteristics to determine volume percentages in two-phase fluids;
- Including effective features employing an algorithm based on PSO algorithm for selecting features;
- Significant increase in accuracy in determining volume percentages;
- Selecting the most useful features as the neural network’s input helps the system do fewer computations.
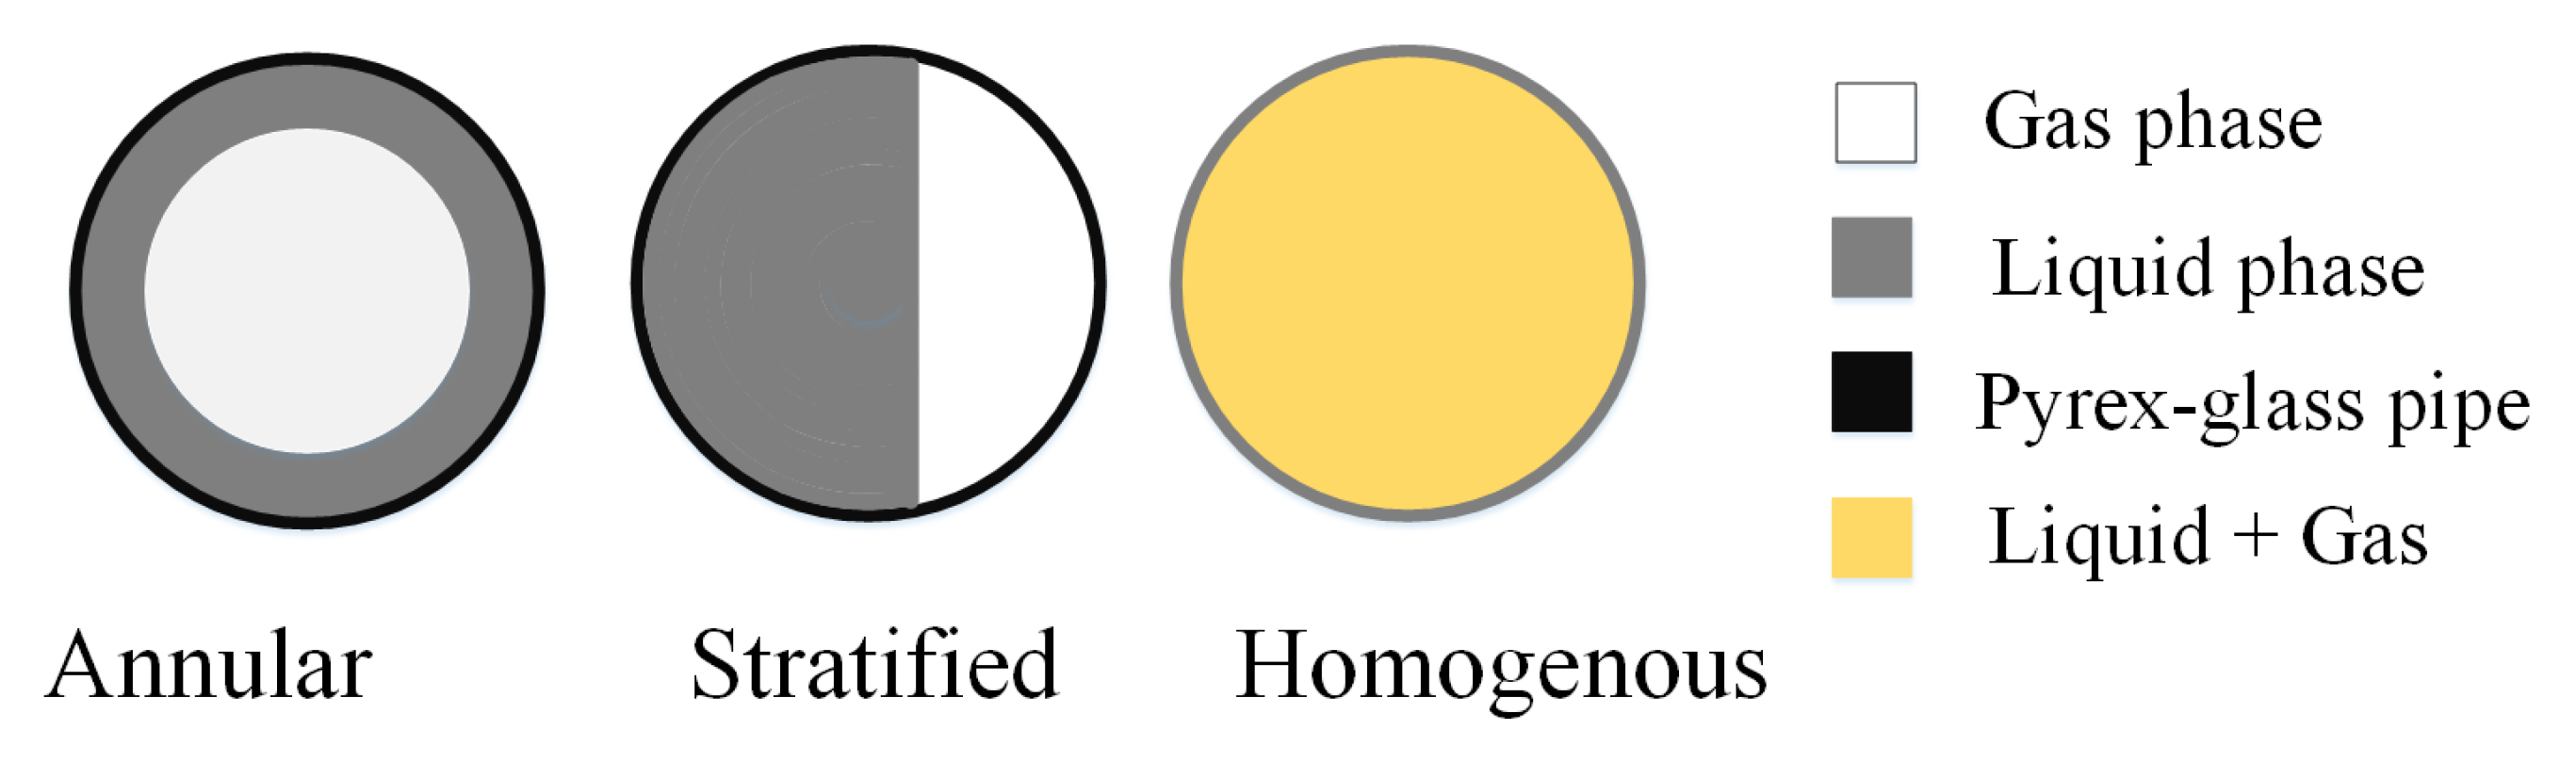
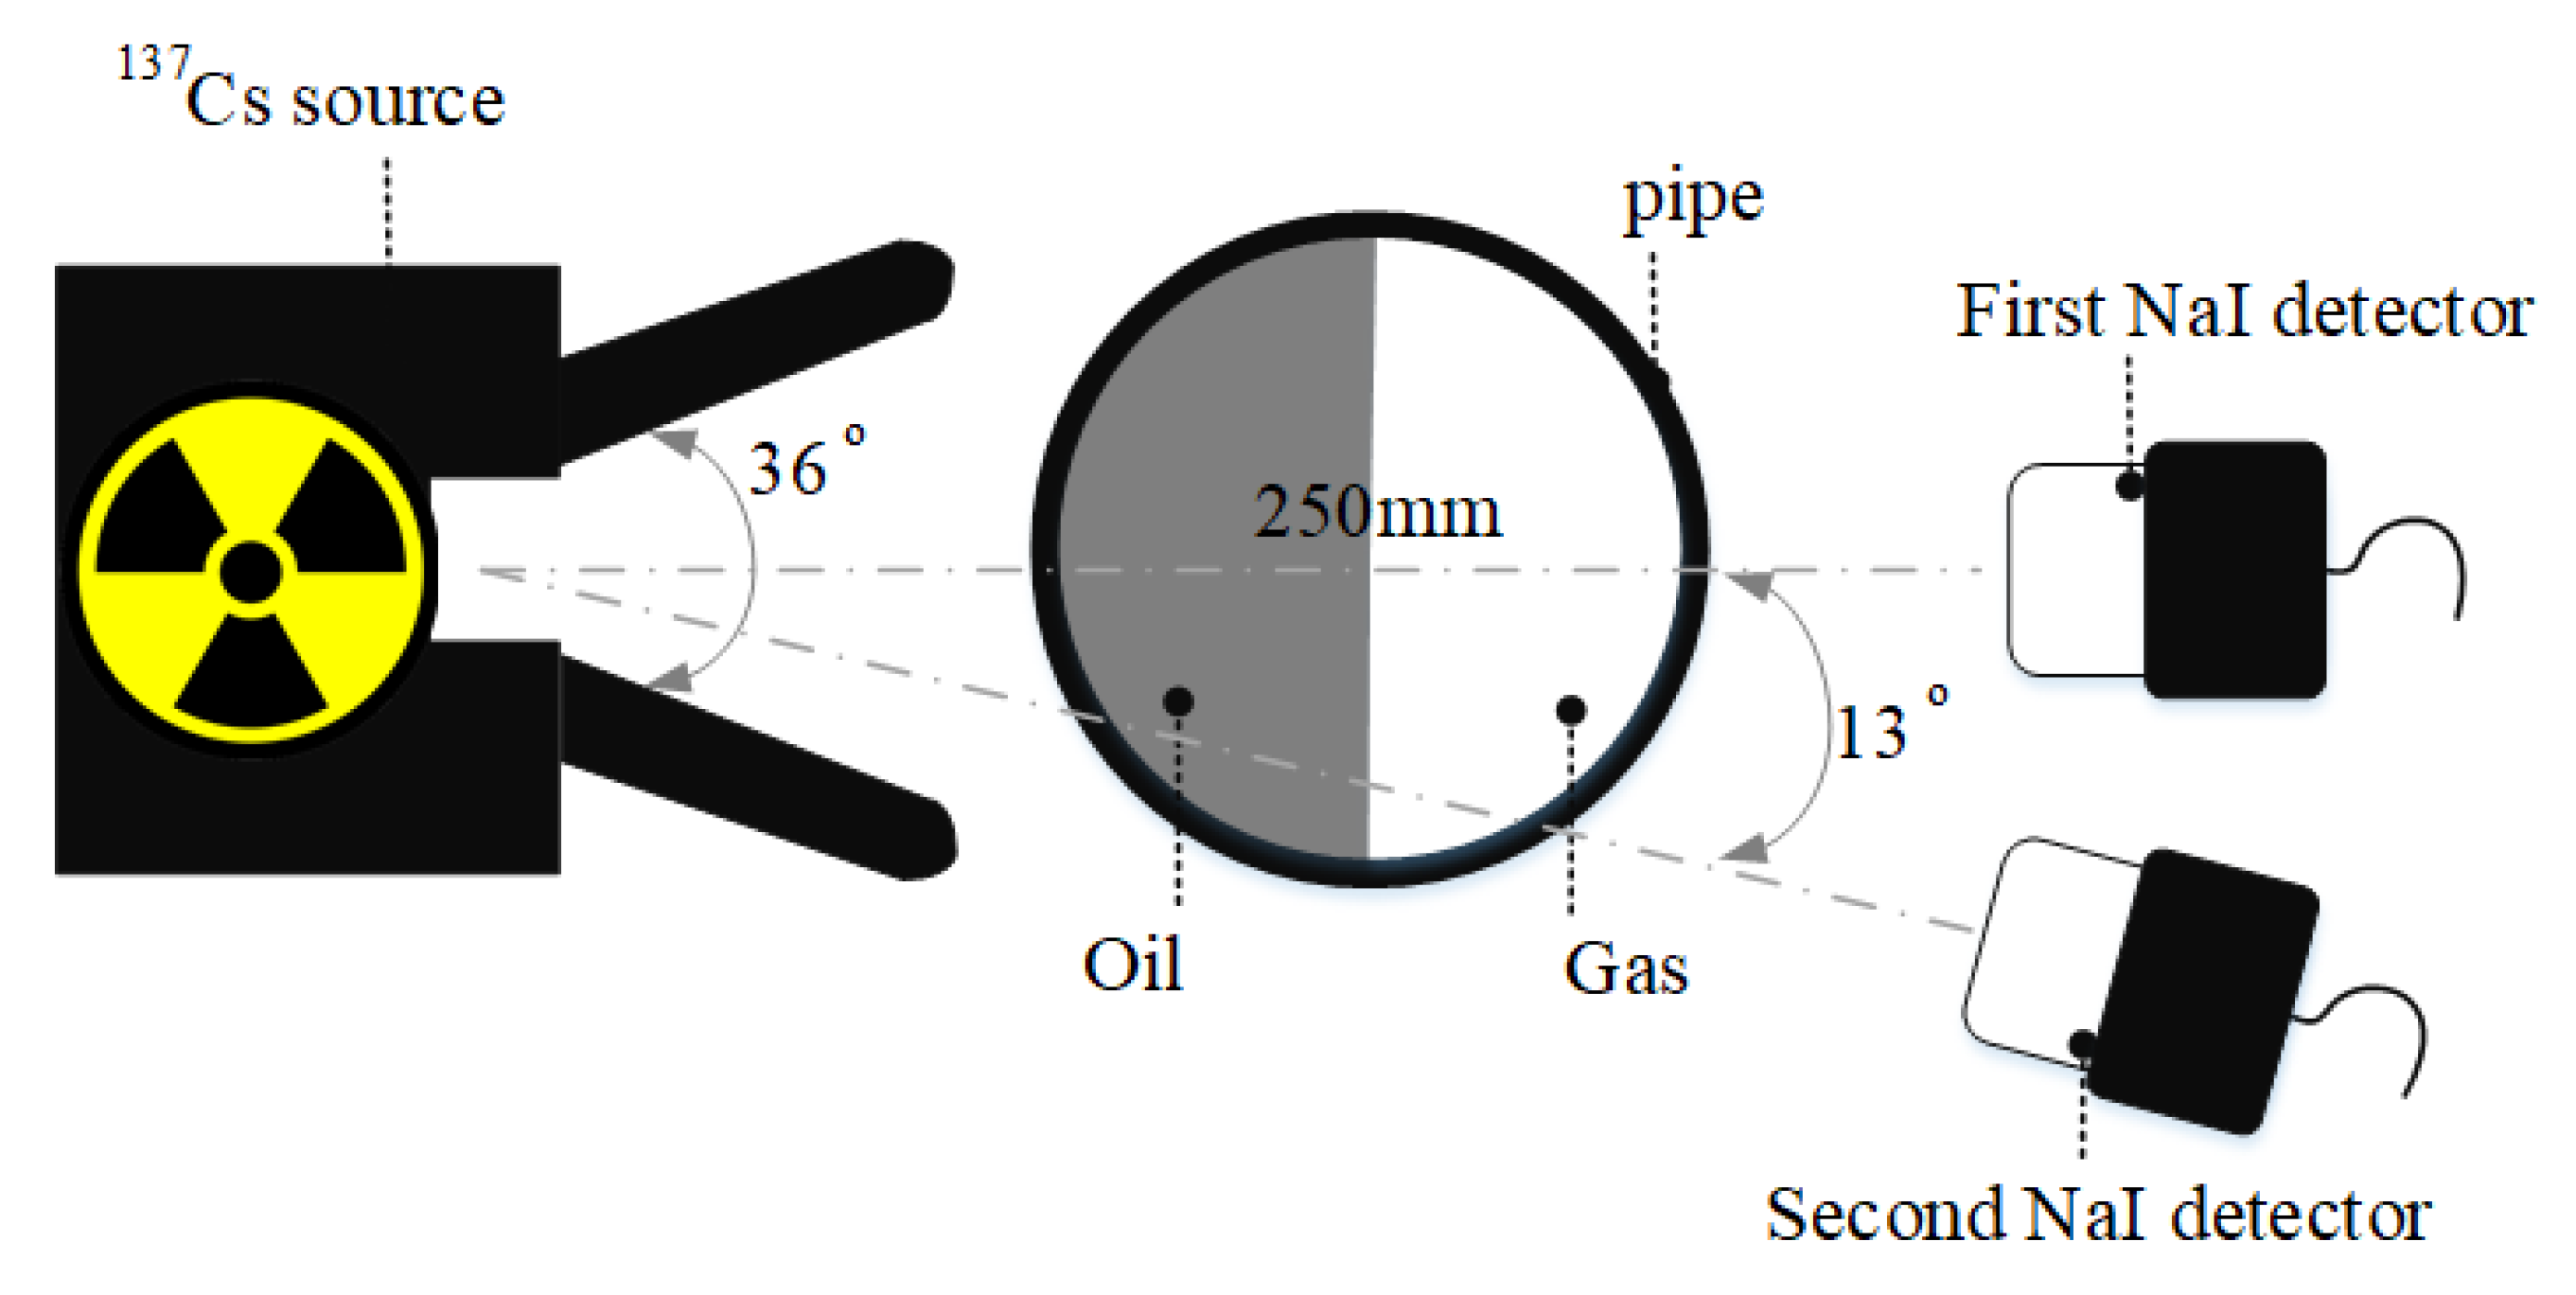
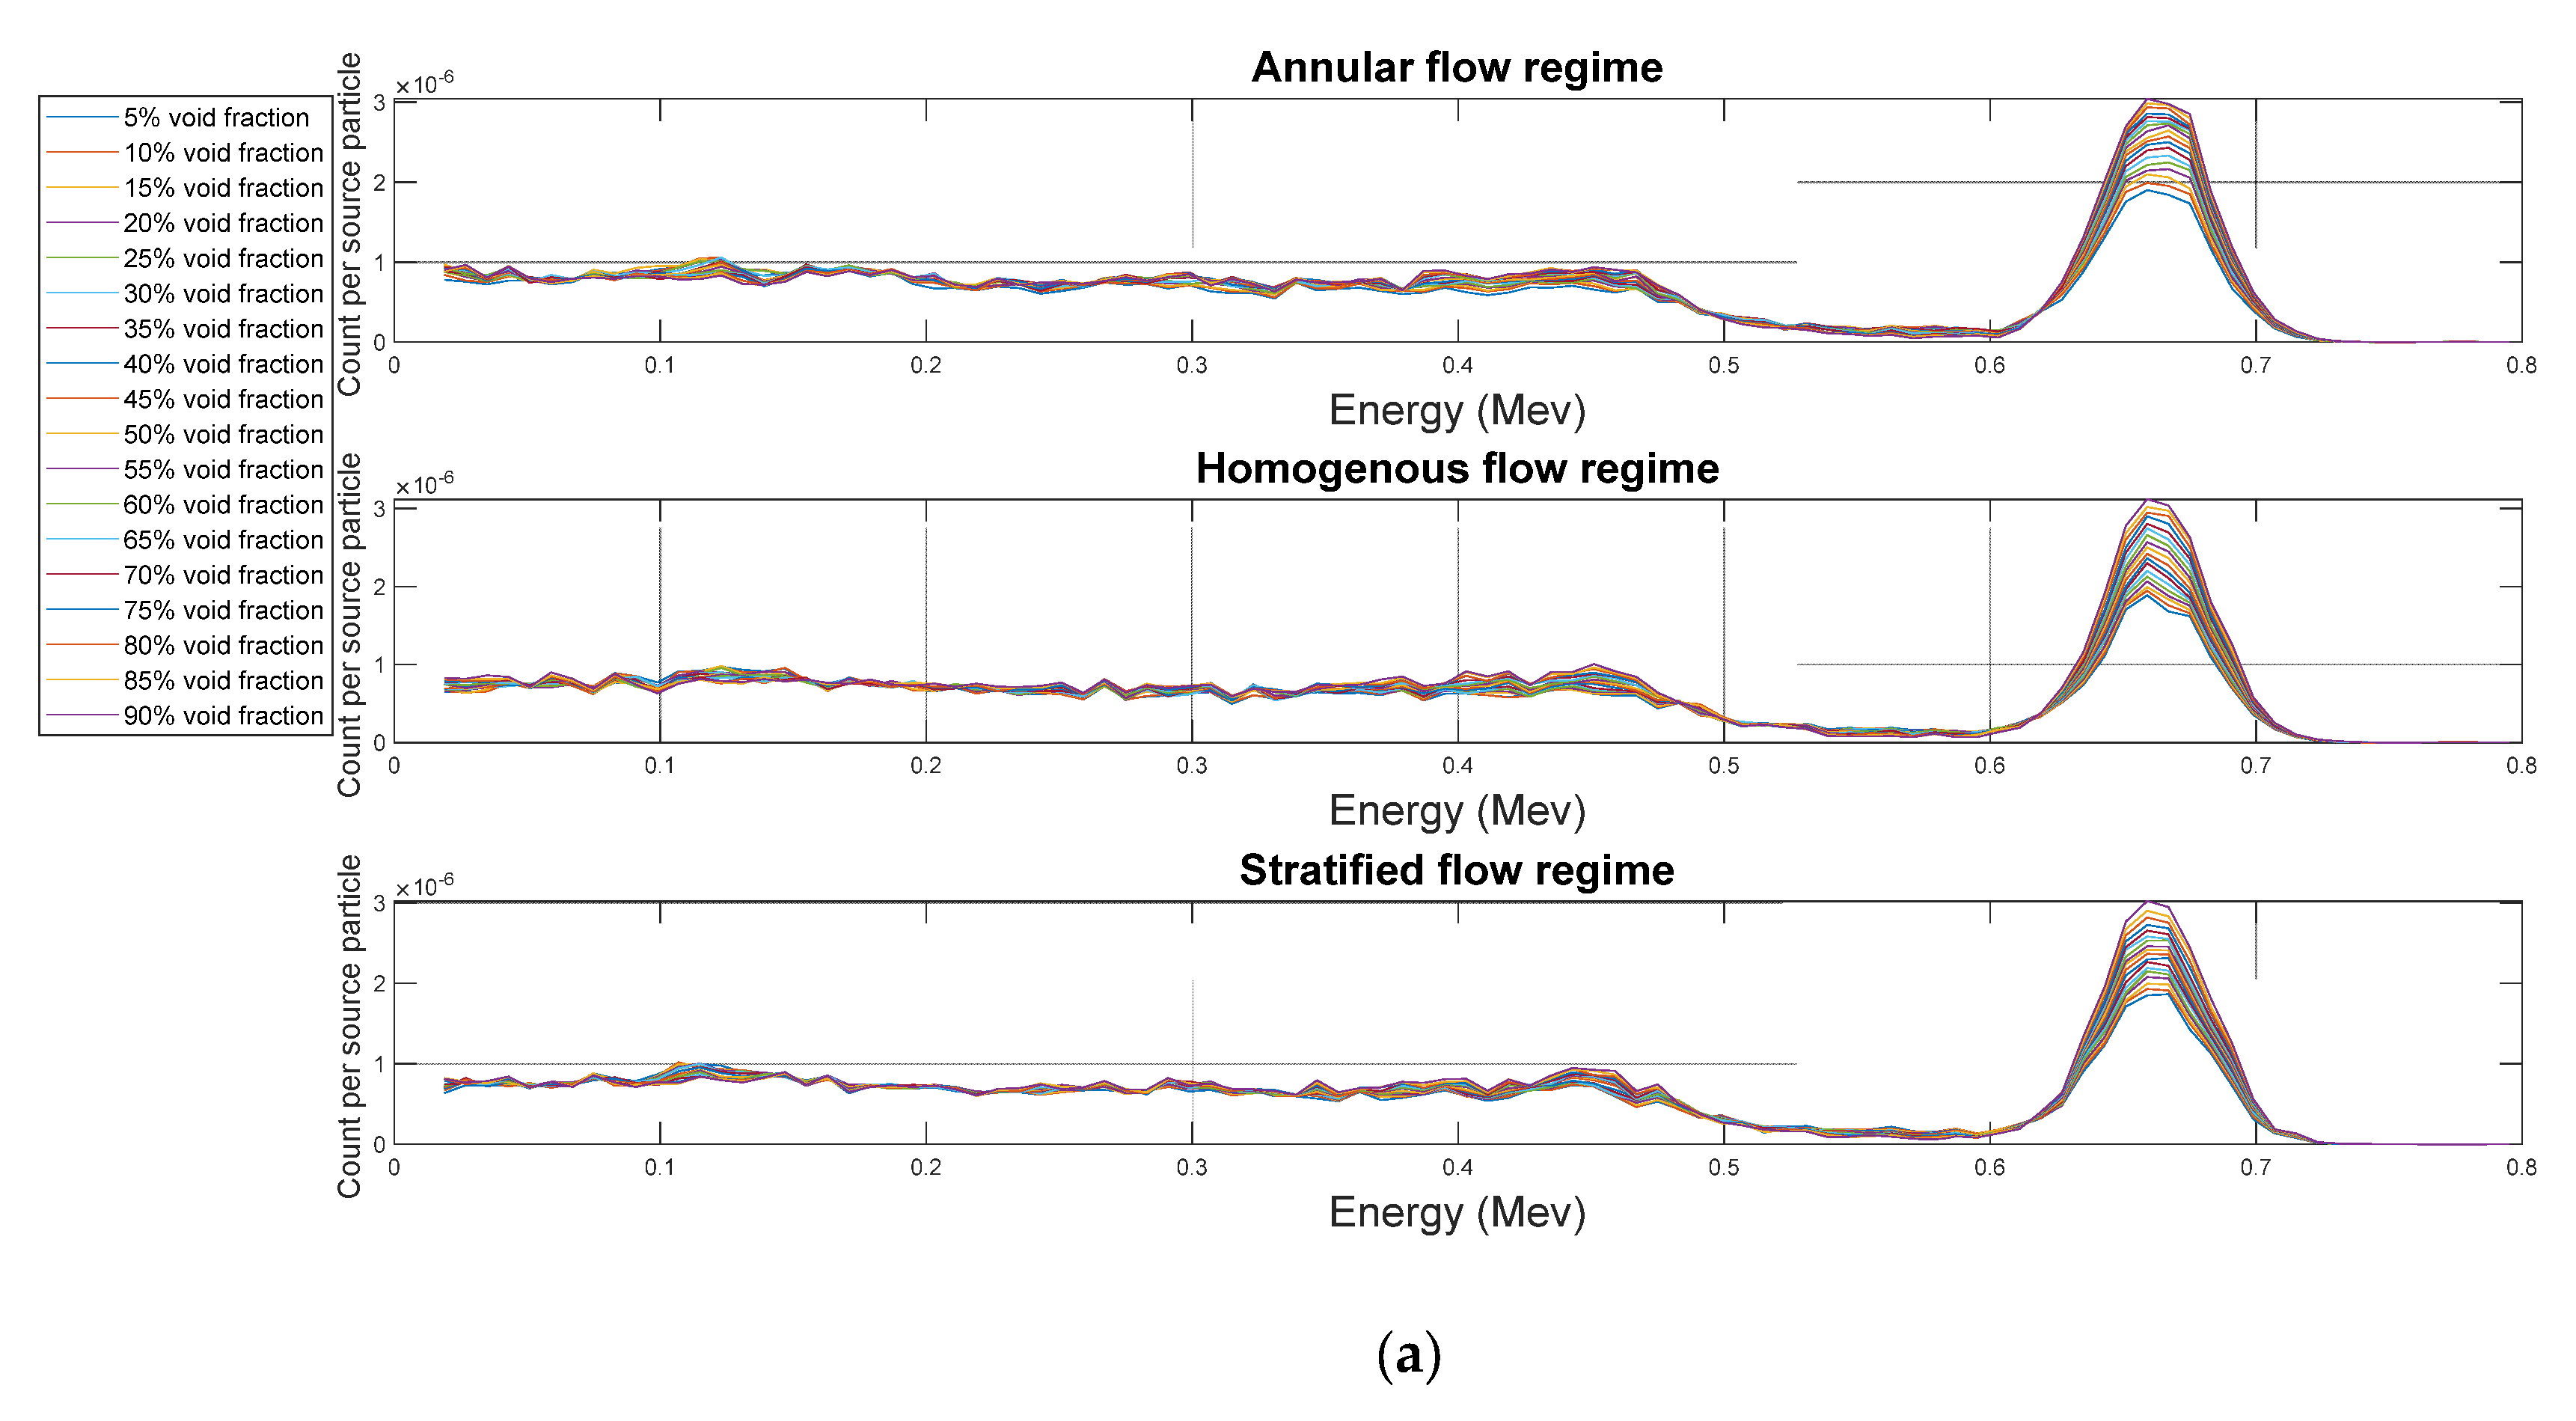
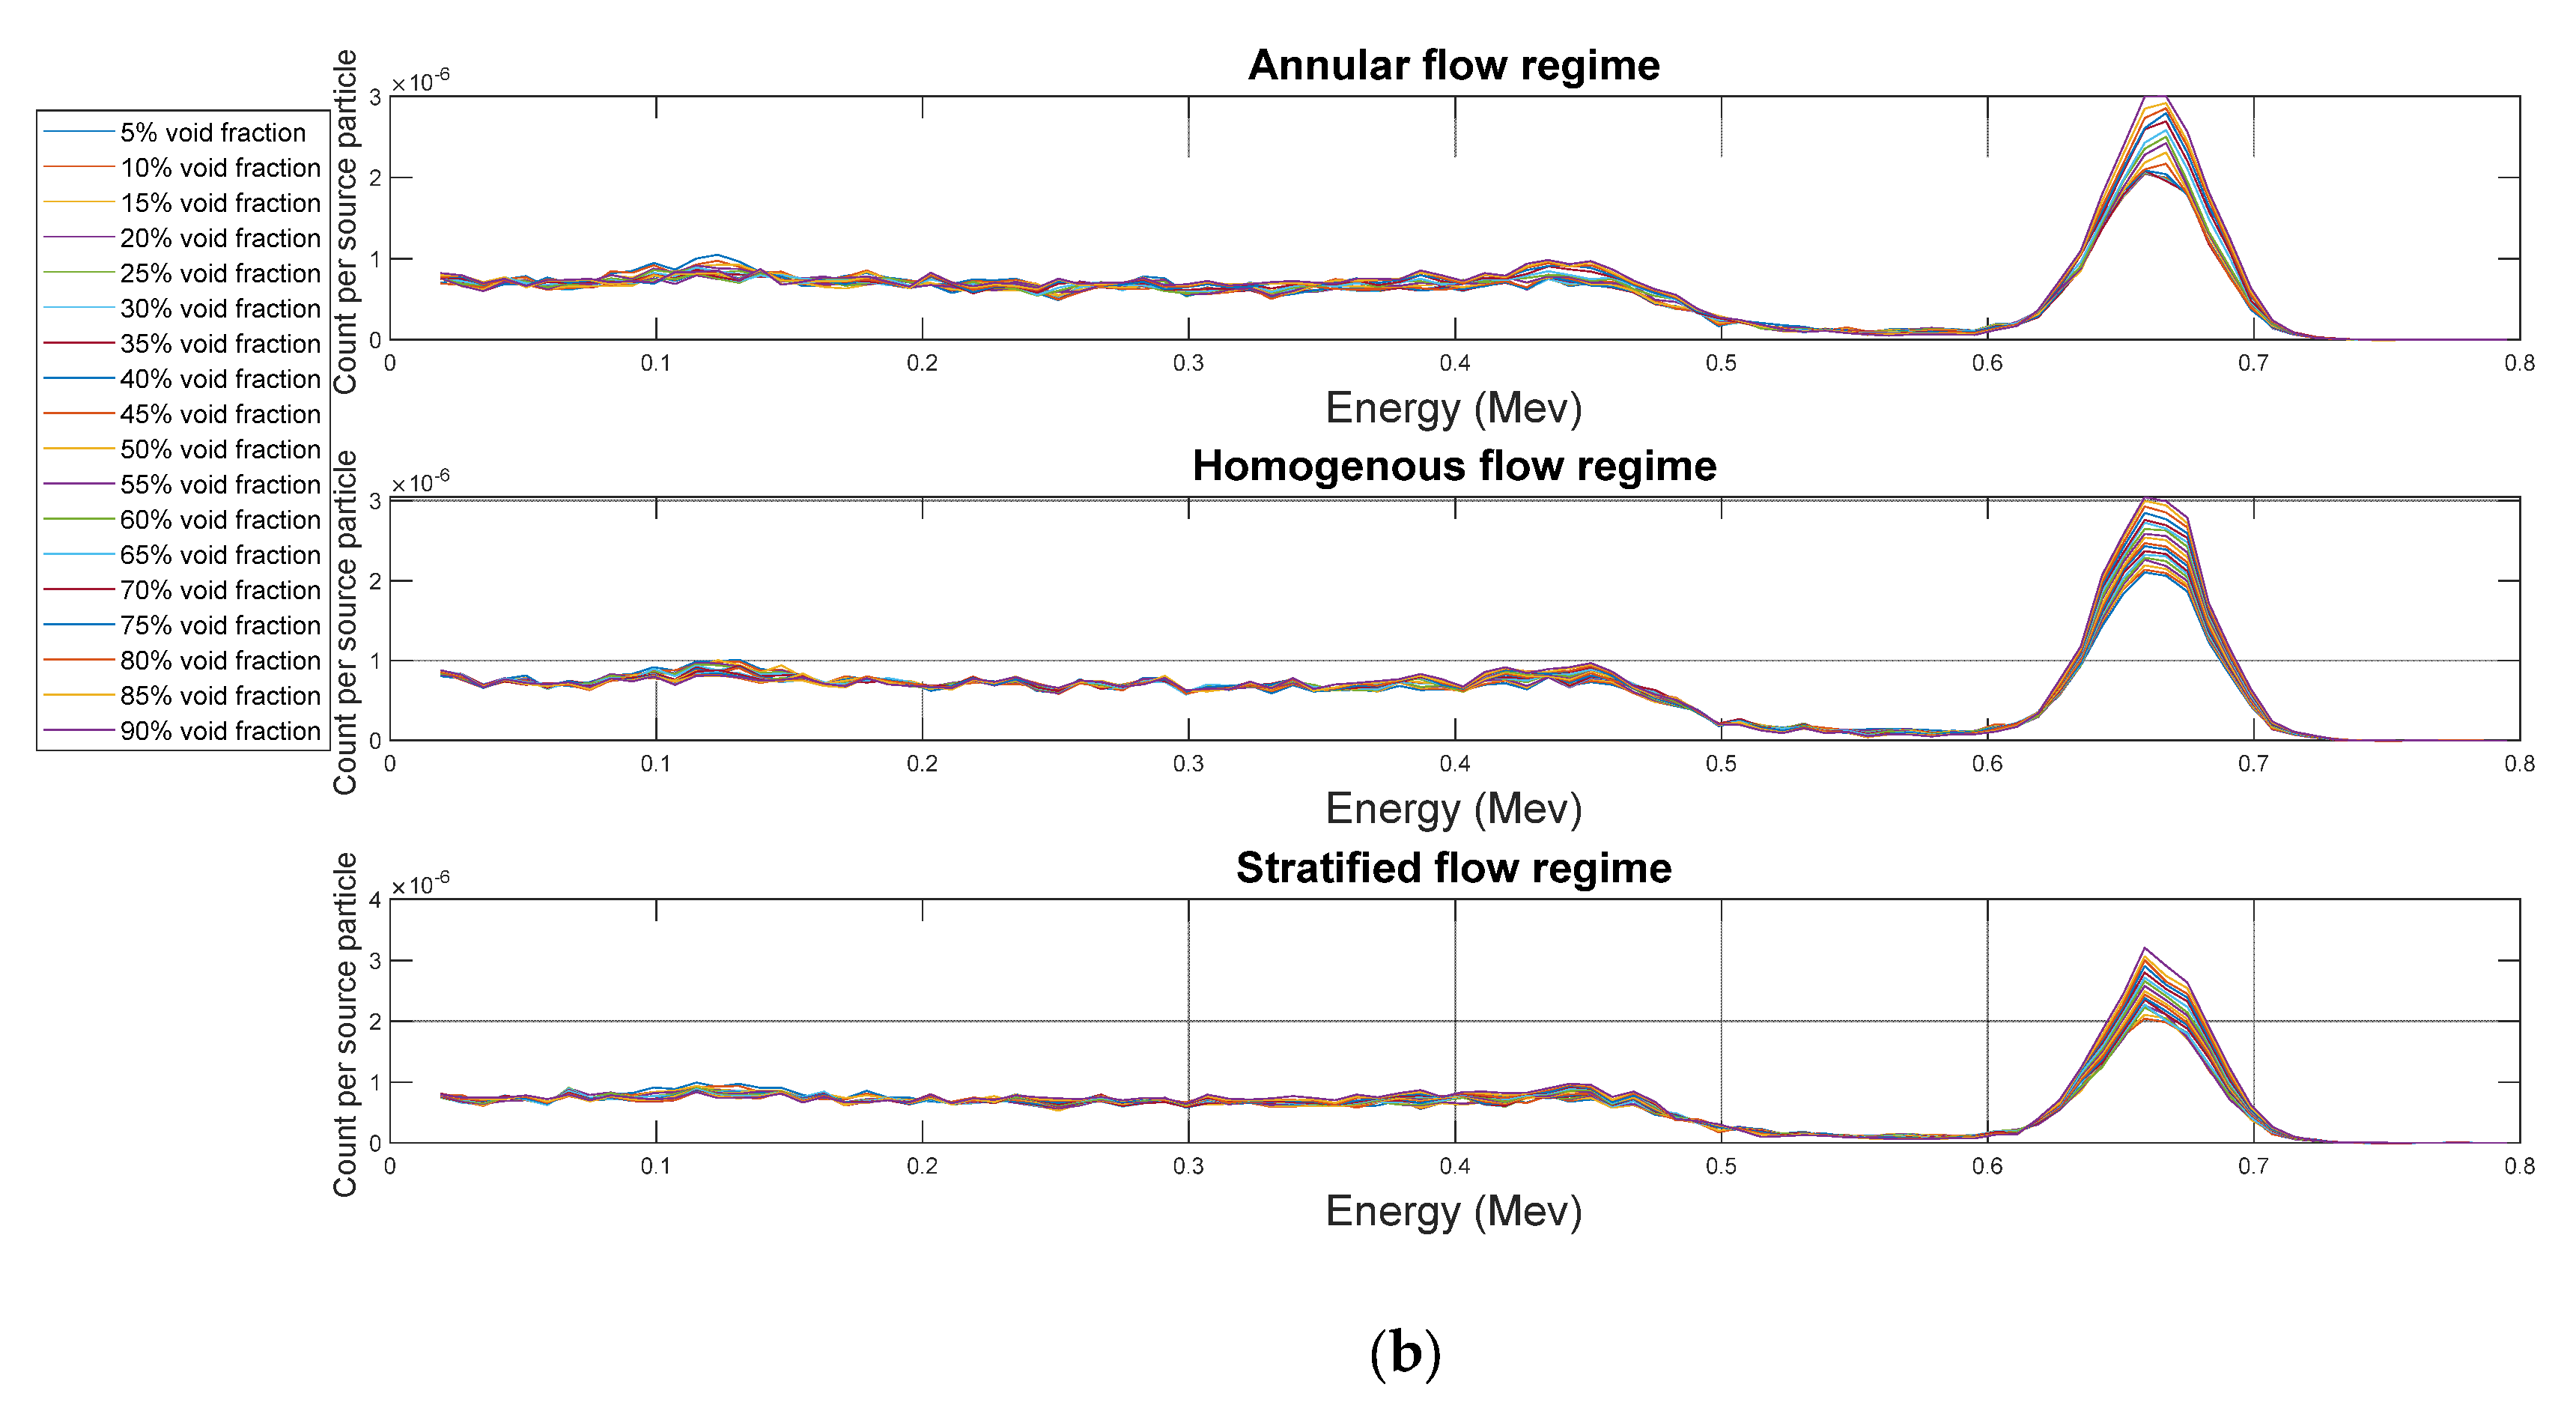
2. The Method of Simulation
3. Signals Features Extraction
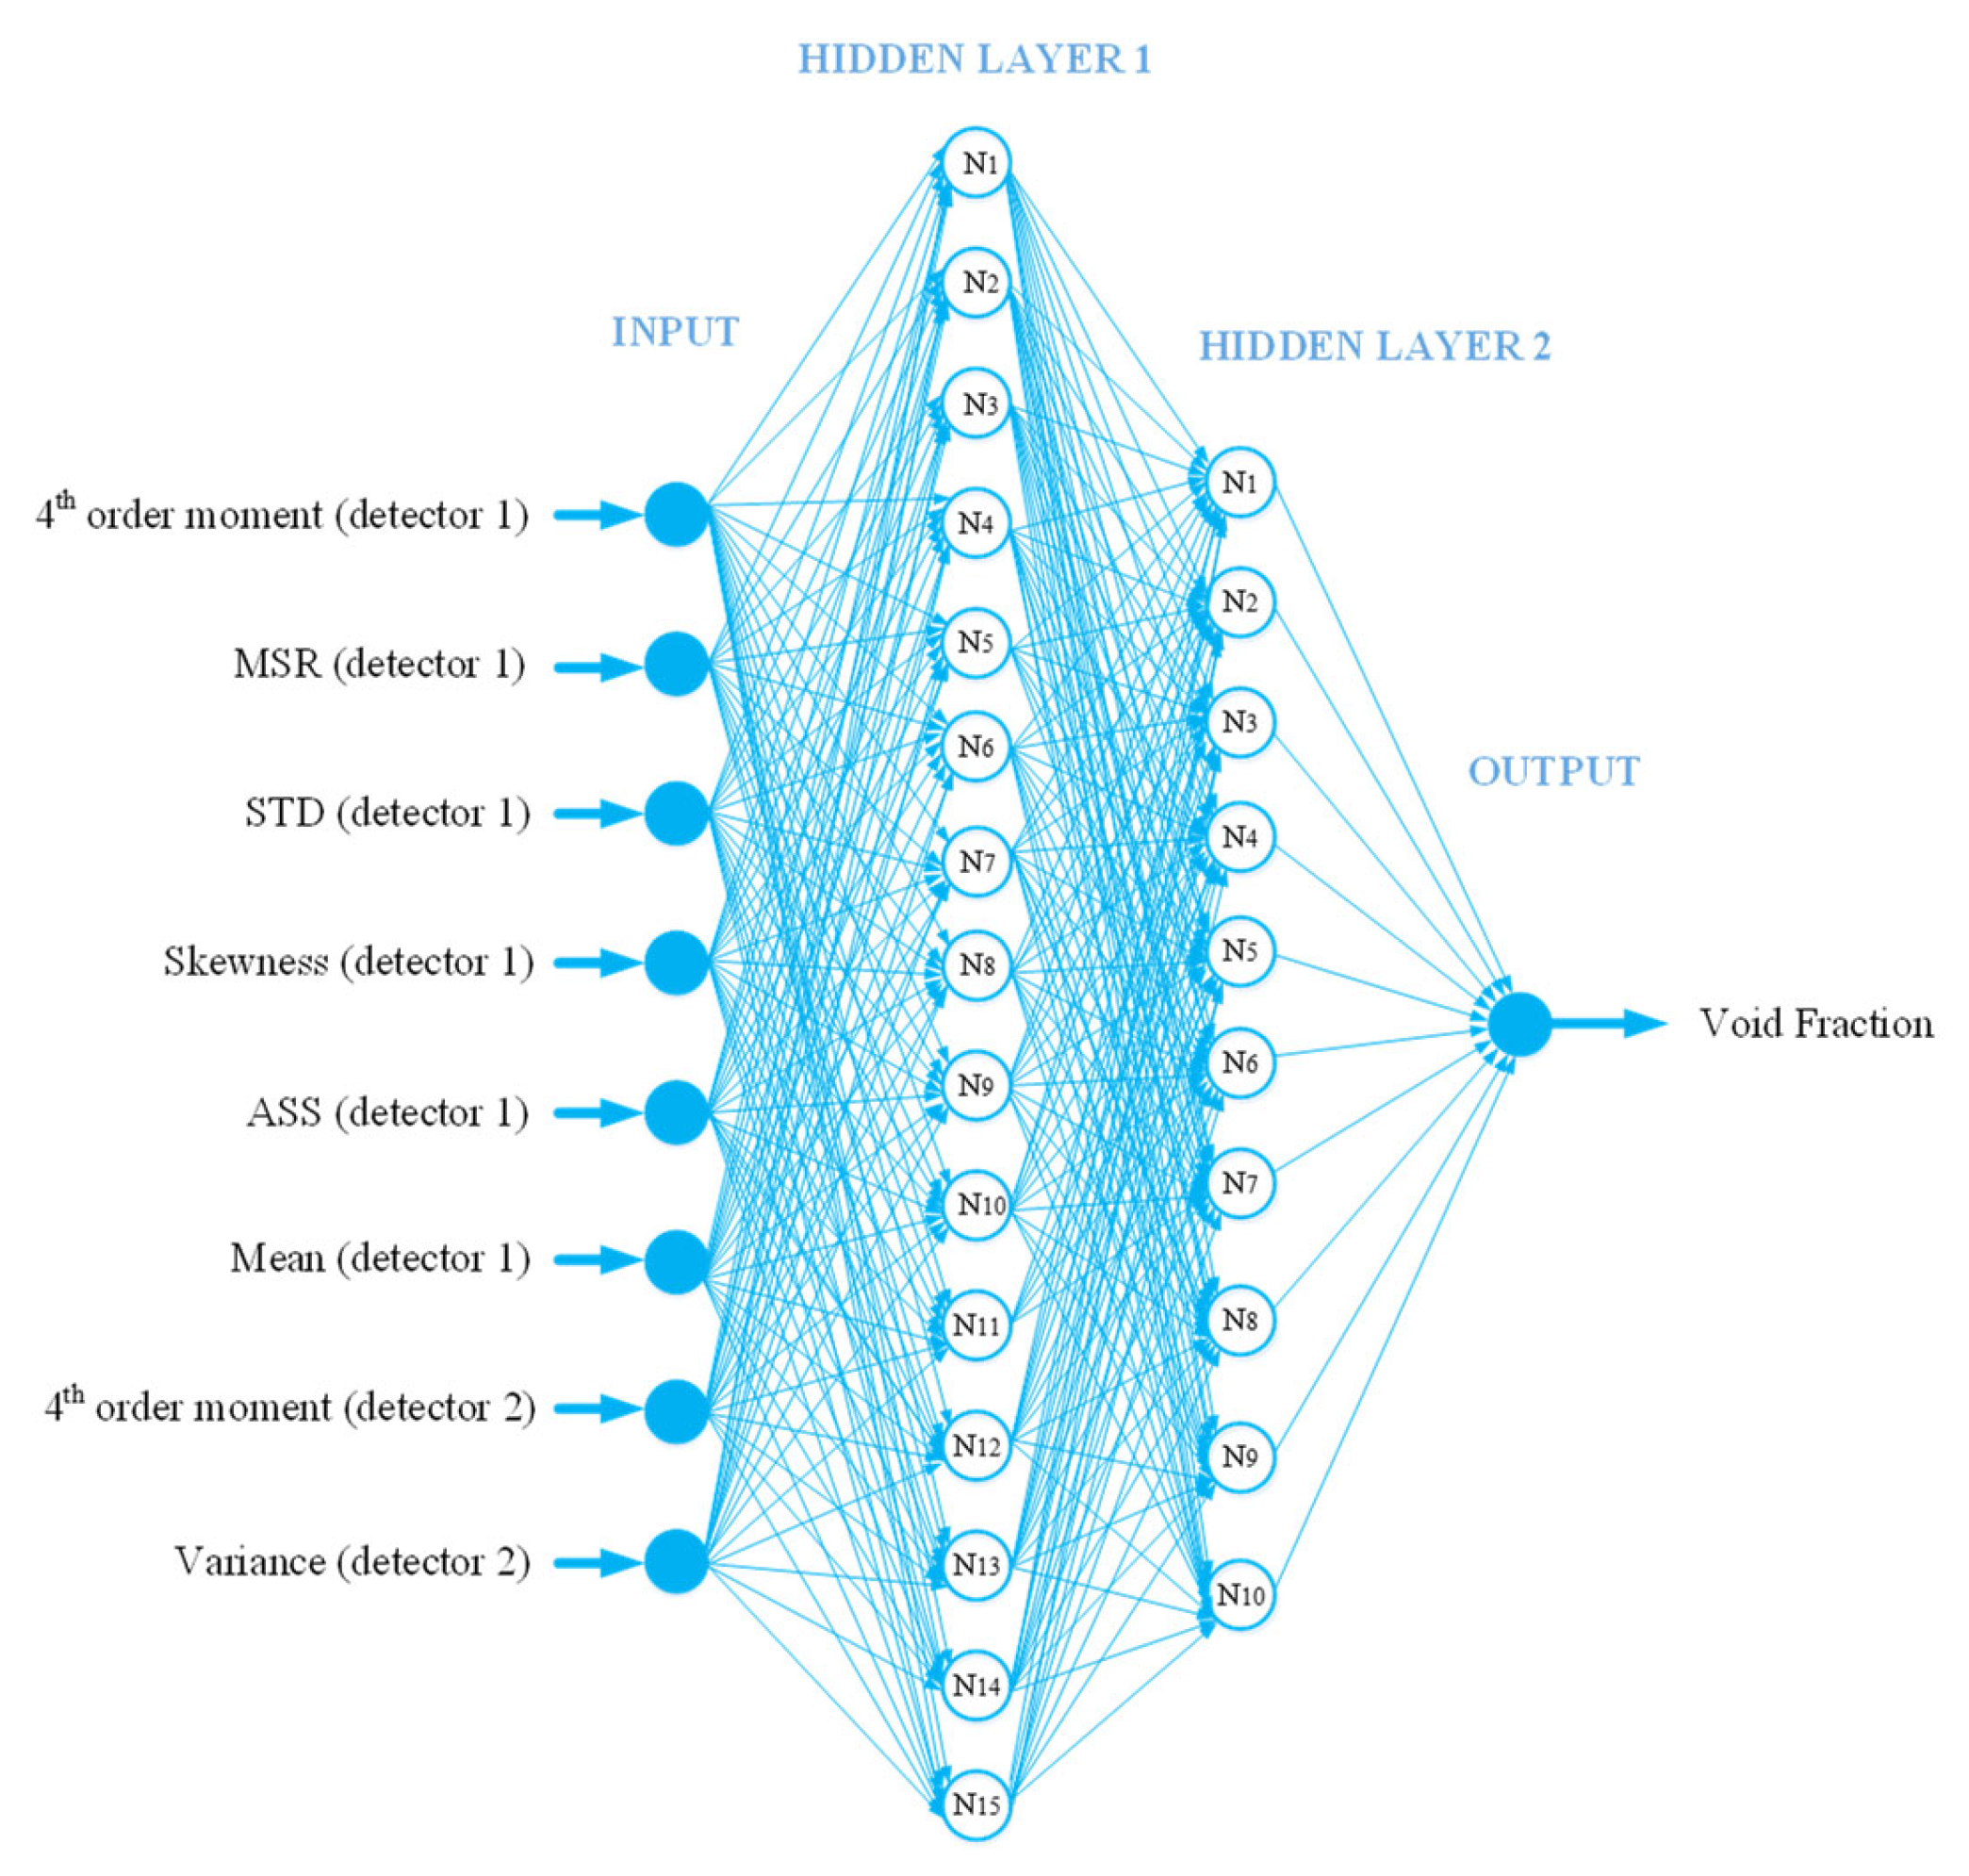
- From the registered data of both detectors, thirteen time-domain characteristics were derived: (1) average value; (2) variance; (3) 4th order moment; (4) root mean square; (5) skewness; (6) kurtosis; (7) median; (8) waveform length (WL); (9) absolute value of the summation of square root (ASS); (10) mean value of the square root (MSR); (11) absolute value of the summation of the exp th root (ASM); (12) maximum value; and (13) standard deviation (STD) [30].
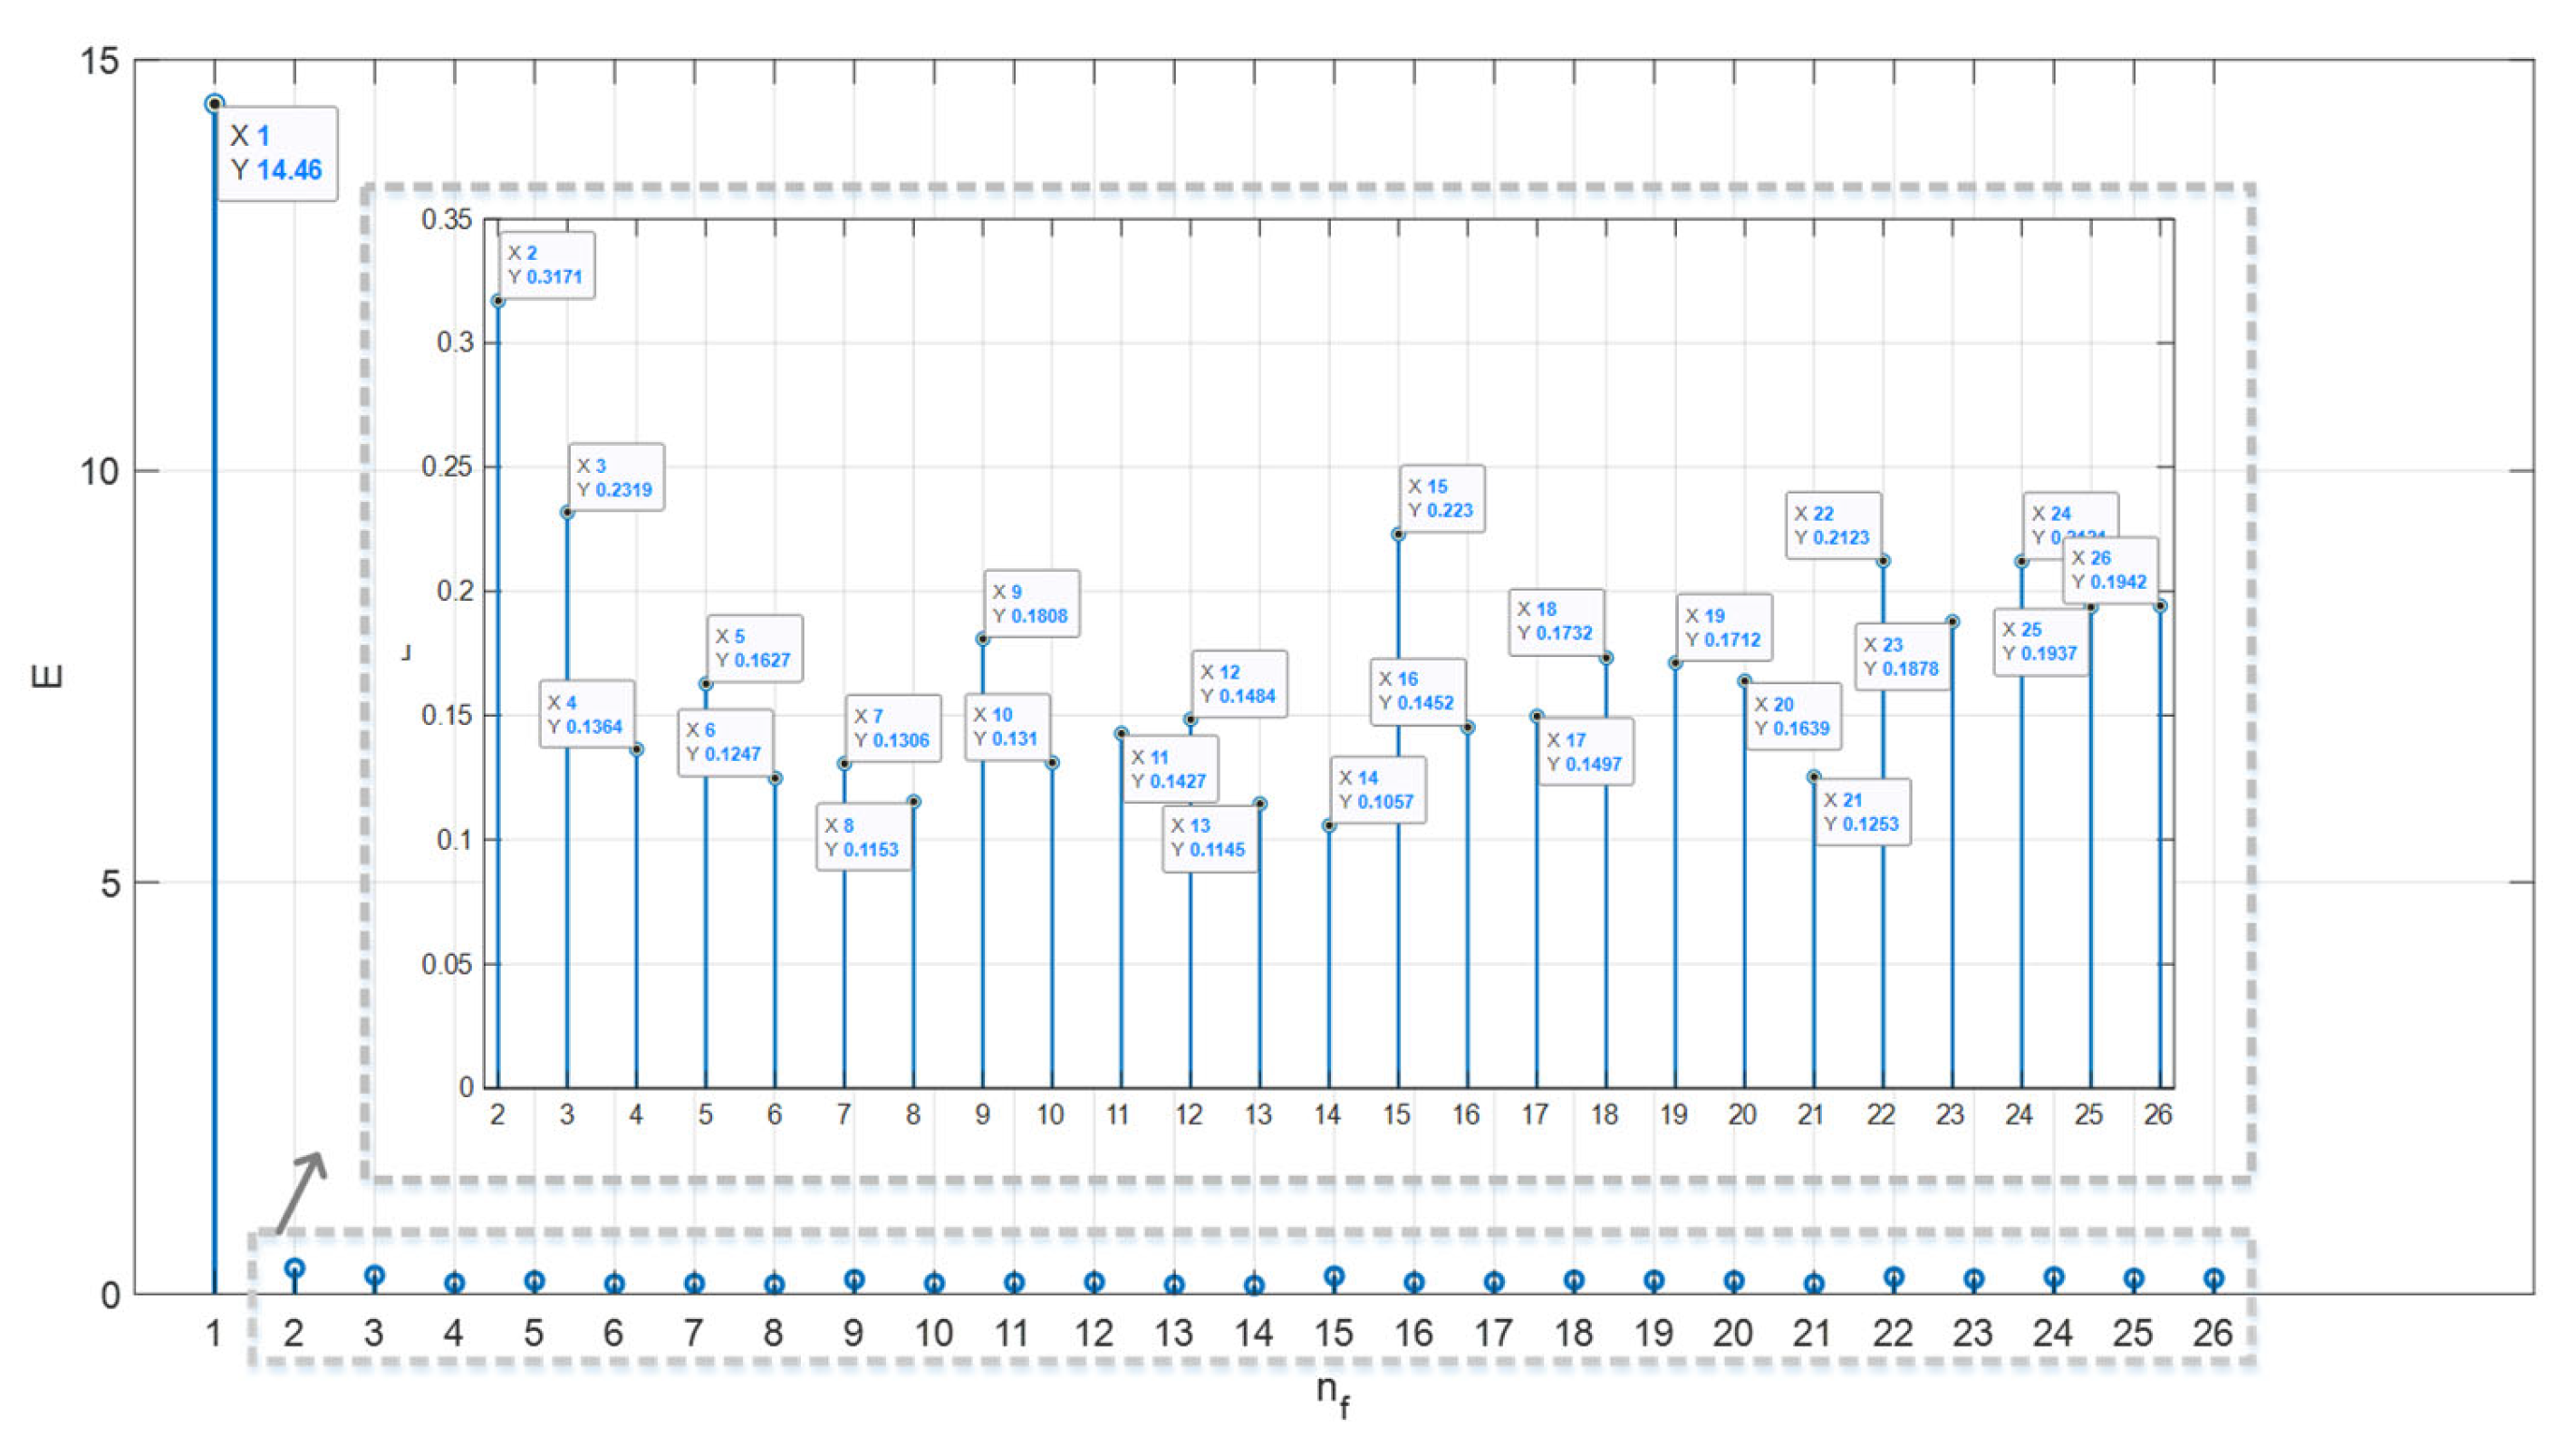
4. Feature Selection
xm ∈ {0, 1} ∀m ∈ {1, 2,…, M}
s.t. X = (x1, x2,…, xM)
xm ∈ {0, 1} ∀m ∈ {1, 2,…, M}
Particle Swarm Optimization
5. MLP Neural Network
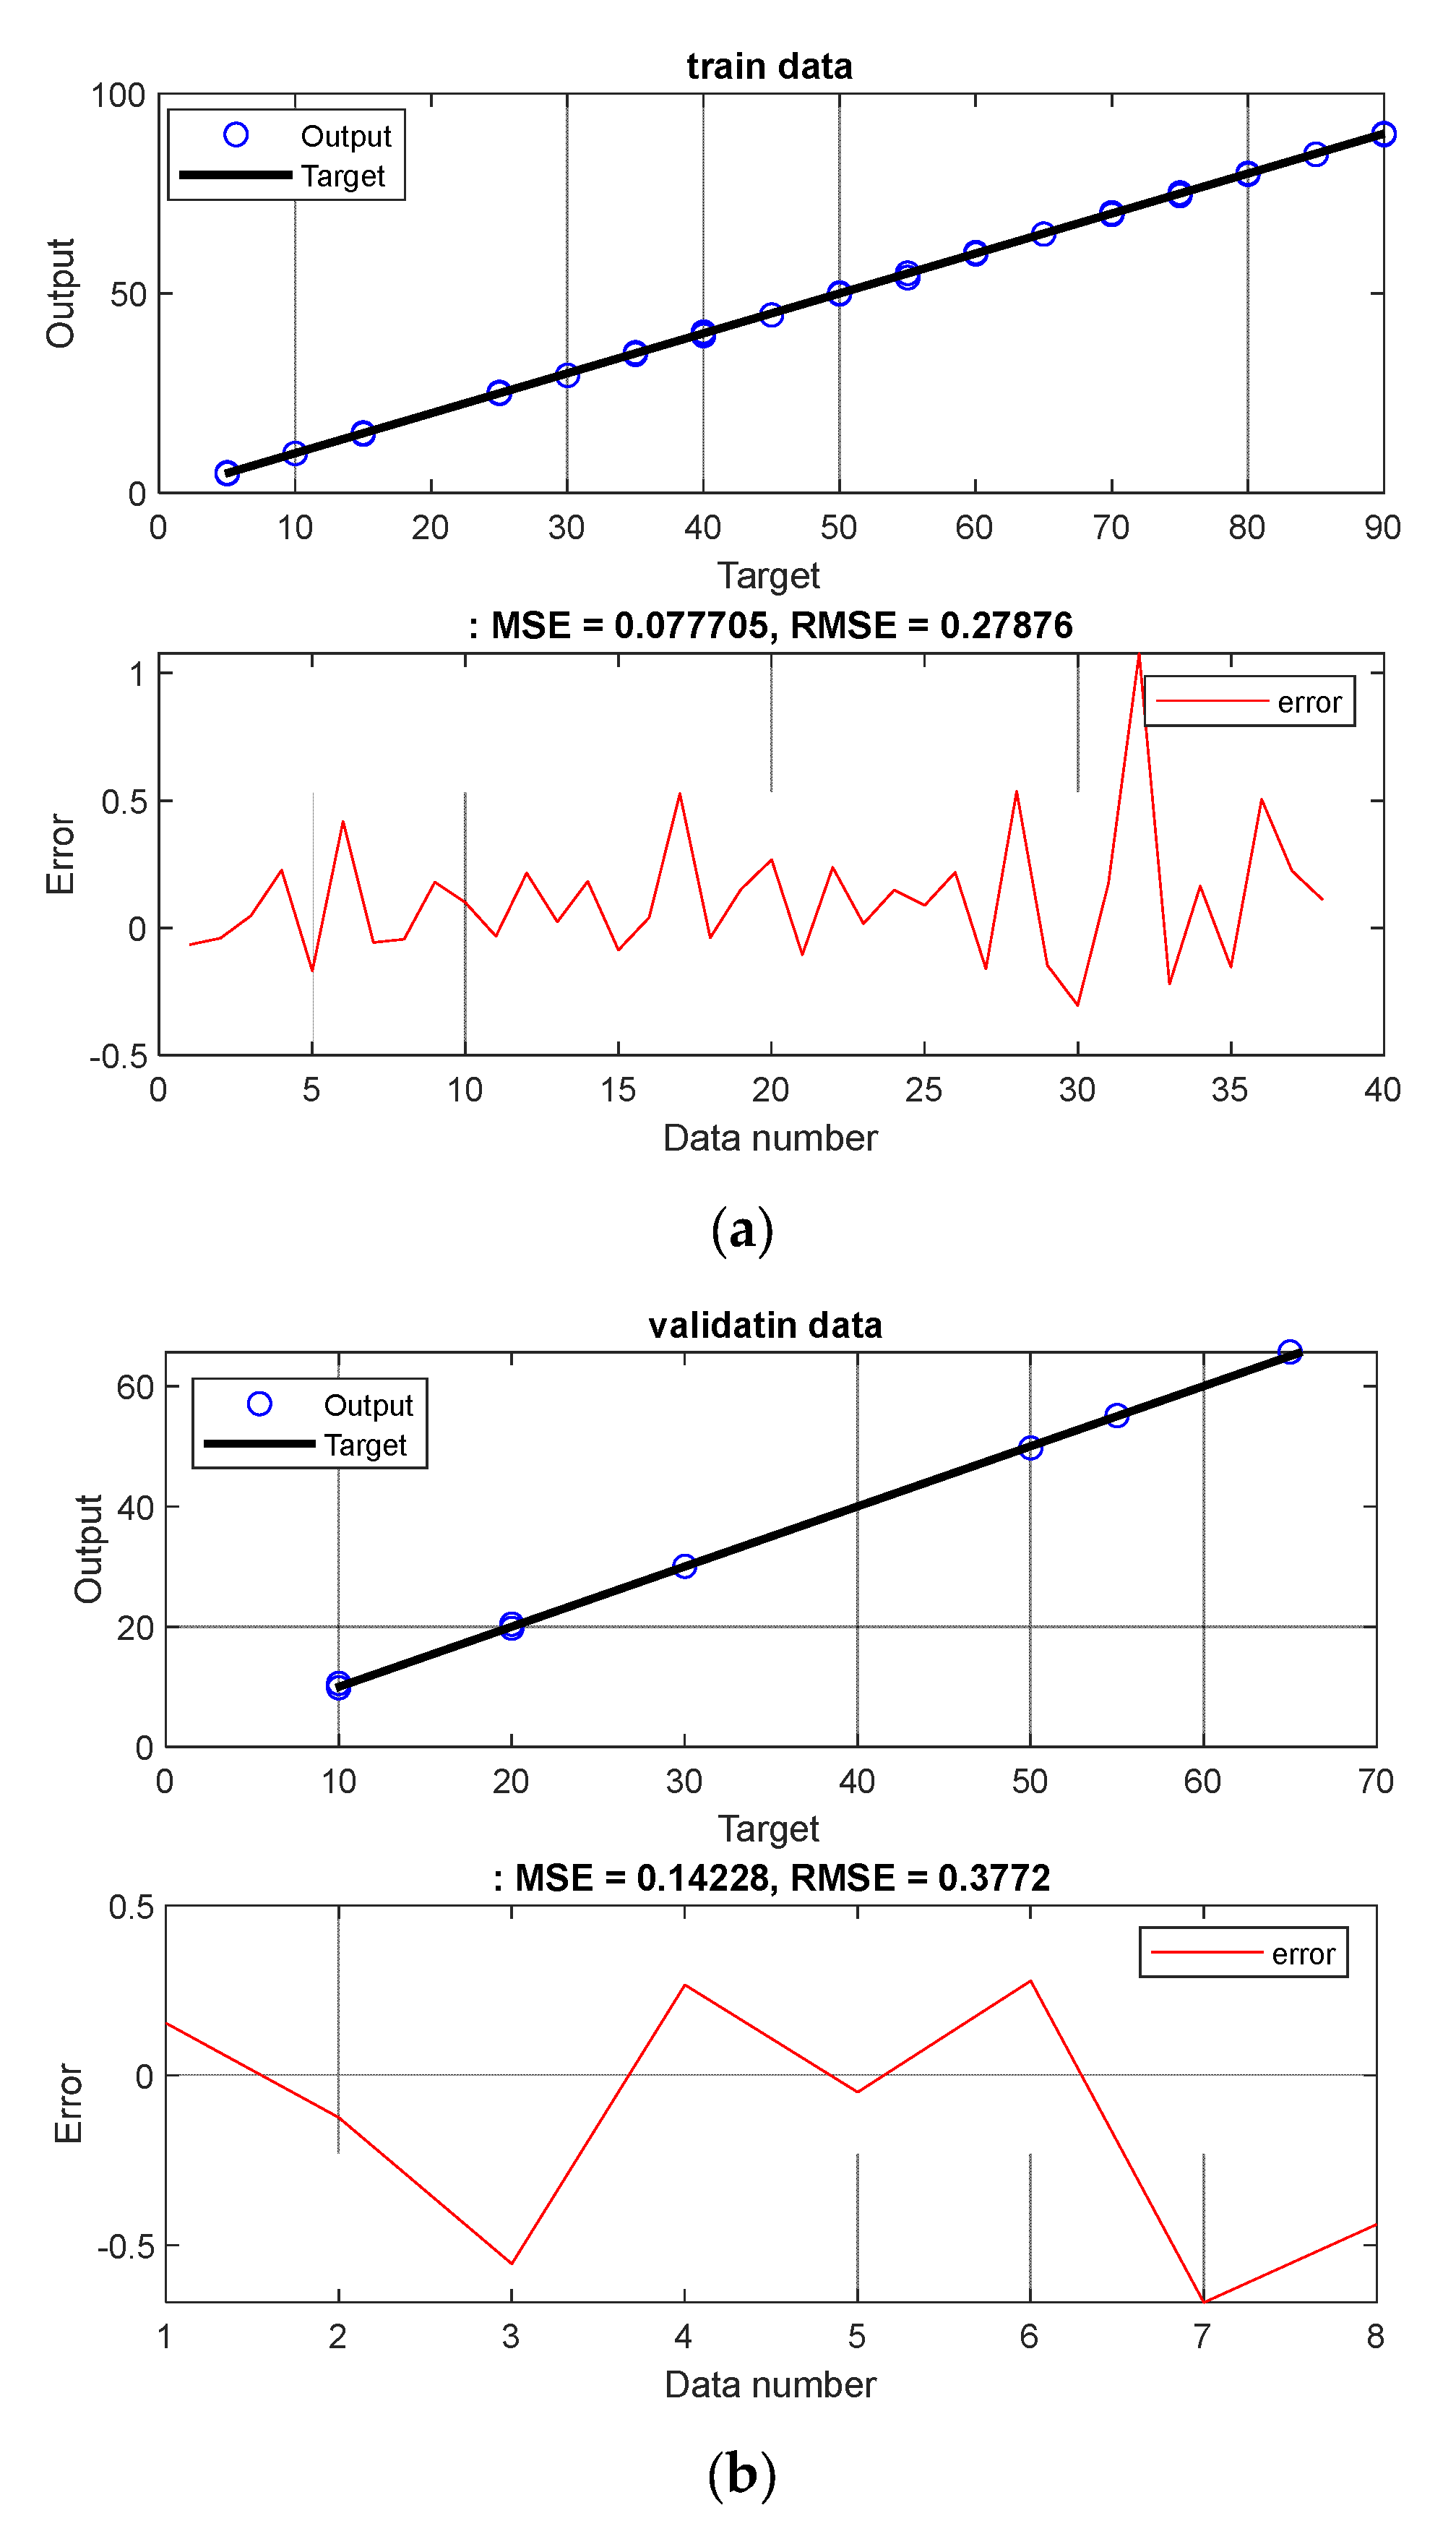
6. Results
7. Conclusions
Author Contributions
Funding
Data Availability Statement
Conflicts of Interest
References
- Pusppanathan, J.; Rahim, R.A.; Phang, F.A.; Mohamad, E.J.; Ayob, N.M.N.; Rahiman, M.H.F.; Seong, C.K. Single-plane dual-modality tomography for multiphase flow imaging by integrating electrical capacitance and ultrasonic sensors. IEEE Sens. J. 2017, 17, 6368–6377. [Google Scholar] [CrossRef]
- Mohamad, E.; Rahim, R.; Rahiman, M.; Ameran, H.; Muji, S.; Marwah, O. Measurement and analysis of water/oil multiphase flow using electrical capacitance tomography sensor. Flow Meas. Instrum. 2016, 47, 62–70. [Google Scholar] [CrossRef]
- Rahim, R.A.; Yunos, Y.M.; Rahiman, M.H.F.; Muji, S.Z.M.; Thiam, C.K.; Rahim, H.A. Optical tomography: Velocity profile measurement using orthogonal and rectilinear arrangements. Flow Meas. Instrum. 2012, 23, 49–55. [Google Scholar] [CrossRef]
- Abouelwafa, M.S.A.; Kendall, E.J.M. The measurement of component ratios in multiphase systems using alpha-ray attenuation. J. Phys. E Sci. Instrum. 1980, 13, 341. [Google Scholar] [CrossRef]
- Chen, T.-C.; Iliyasu, A.M.; Alizadeh, S.M.; Salama, A.S.; Eftekhari-Zadeh, E.; Hirota, K. The use of artificial intelligence and time characteristics in the optimization of the structure of the volumetric percentage detection system independent of the scale value inside the pipe. Appl. Artif. Intell. 2023, 37, 2166225. [Google Scholar]
- Mayet, A.M.; Alizadeh, S.M.; Kakarash, Z.A.; Al-Qahtani, A.A.; Alanazi, A.K.; Grimaldo Guerrero, J.W.; Alhashimi, H.H.; Eftekhari-Zadeh, E. Increasing the Efficiency of a Control System for Detecting the Type and Amount of Oil Product Passing through Pipelines Based on Gamma-Ray Attenuation, Time Domain Feature Extraction, and Artificial Neural Networks. Polymers 2022, 14, 2852. [Google Scholar]
- Peyvandi, R.G.; Rad, S.Z.I. Application of artificial neural networks for the prediction of volume fraction using spectra of gamma rays backscattered by three-phase flows. Eur. Phys. J. Plus 2017, 132, 511. [Google Scholar] [CrossRef]
- Mayet, A.M.; Alizadeh, S.M.; Kakarash, Z.A.; Al-Qahtani, A.A.; Alanazi, A.K.; Alhashimi, H.H.; Eftekhari-Zadeh, E.; Nazemi, E. Introducing a Precise System for Determining Volume Percentages Independent of Scale Thickness and Type of Flow Regime. Mathematics 2022, 10, 1770. [Google Scholar]
- Hanus, R.; Zych, M.; Petryka, L.; Jaszczur, M.; Hanus, P. Signals features extraction in liquid-gas flow measurements using gamma densitometry. Part 1: Time domain. EPJ Web Conf. 2016, 114, 02035. [Google Scholar] [CrossRef] [Green Version]
- Hanus, R.; Zych, M.; Petryka, L.; Jaszczur, M.; Hanus, P. Signals features extraction in liquid-gas flow measurements using gamma densitometry. Part 2: Frequency domain. EPJ Web Conf. 2016, 114, 02036. [Google Scholar] [CrossRef] [Green Version]
- Hanus, R.; Zych, M.; Kusy, M.; Jaszczur, M.; Petryka, L. Identification of liquid-gas flow regime in a pipeline using gamma-ray absorption technique and computational intelligence methods. Flow Meas. Instrum. 2018, 60, 17–23. [Google Scholar] [CrossRef]
- Hanus, R.; Zych, M.; Petryka, L.; Świsulski, D.; Strzępowicz, A. Application of ANN and PCA to two-phase flow evaluation using radioisotopes. EPJ Web Conf. 2017, 143, 02033. [Google Scholar] [CrossRef] [Green Version]
- Salgado, C.M.; Brandão, L.E.; Conti, C.C.; Salgado, W.L. Density prediction forpetroleum and derivatives by gamma-ray attenuation and artificial neural networks. Appl. Radiat. Isot. 2016, 116, 143–149. [Google Scholar] [CrossRef]
- Salgado, W.L.; Dam, R.S.; Teixeira, T.P.; Conti, C.C.; Salgado, C.M. Application of artificial intelligence in scale thickness prediction on offshore petroleum using a gamma-ray densitometer. Radiat. Phys. Chem. 2020, 168, 108549. [Google Scholar] [CrossRef]
- Salgado, C.M.; Brandão, L.E.; Schirru, R.; Pereira, C.M.; da Silva, A.X.; Ramos, R. Prediction of volume fractions in three-phase flows using nuclear technique and artificial neural network. Appl. Radiat. Isot. 2009, 67, 1812–1818. [Google Scholar] [CrossRef]
- Salgado, C.M.; Pereira, C.M.; Schirru, R.; Brandão, L.E. Flow regime identification and volume fraction prediction in multiphase flows by means of gamma-ray attenuation and artificial neural networks. Prog. Nucl. Energy 2010, 52, 555–562. [Google Scholar] [CrossRef]
- Khayat, O.; Afarideh, H. Design and simulation of a multienergy gamma ray absorptiometry system for multiphase flow metering with accurate void fraction and water-liquid ratio approximation. Nukleonika 2019, 64, 19–29. [Google Scholar] [CrossRef] [Green Version]
- Affonso, R.R.W.; Dam, R.S.F.; Salgado, W.L.; da Silva, A.X.; Salgado, C.M. Flow regime and volume fraction identification using nuclear techniques, artificial neural networks and computational fluid dynamics. Appl. Radiat. Isot. 2020, 159, 109103. [Google Scholar] [CrossRef] [PubMed]
- Shao, D.; Yan, Y.; Zhang, W.; Sun, S.; Sun, C.; Xu, L. Dynamic measurement of gas volume fraction in a CO2 pipeline through capacitive sensing and data driven modelling. Int. J. Greenh. Gas Control 2020, 94, 102950. [Google Scholar] [CrossRef]
- Basahel, A.; Sattari, M.A.; Taylan, O.; Nazemi, E. Application of Feature Extraction and Artificial Intelligence Techniques for Increasing the Accuracy of X-ray Radiation Based Two Phase Flow Meter. Mathematics 2021, 9, 1227. [Google Scholar] [CrossRef]
- Taylan, O.; Sattari, M.A.; Essoussi, I.E.; Nazemi, E. Frequency Domain Feature Extraction Investigation to Increase the Accuracy of an Intelligent Nondestructive System for Volume Fraction and Regime Determination of Gas-Water-Oil Three-Phase Flows. Mathematics 2021, 9, 2091. [Google Scholar]
- Mayet, A.M.; Nurgalieva, K.S.; Al-Qahtani, A.A.; Narozhnyy, I.M.; Alhashim, H.H.; Nazemi, E.; Indrupskiy, I.M. Proposing a high-precision petroleum pipeline monitoring system for identifying the type and amount of oil products using extraction of frequency characteristics and a MLP neural network. Mathematics 2022, 10, 2916. [Google Scholar] [CrossRef]
- Balubaid, M.; Sattari, M.A.; Taylan, O.; Bakhsh, A.A.; Nazemi, E. Applications of discrete wavelet transform for feature extraction to increase the accuracy of monitoring systems of liquid petroleum products. Mathematics 2021, 9, 3215. [Google Scholar] [CrossRef]
- Sattari, M.A.; Korani, N.; Hanus, R.; Roshani, G.H.; Nazemi, E. Improving the performance of gamma radiation based two phase flow meters using optimal time characteristics of the detector output signal extraction. J. Nucl. Sci. Technol. 2020, 41, 42–54. [Google Scholar]
- Alanazi, A.K.; Alizadeh, S.M.; Nurgalieva, K.S.; Nesic, S.; Guerrero, J.W.G.; Abo-Dief, H.M.; Eftekhari-Zadeh, E.; Nazemi, E.; Narozhnyy, I.M. Application of neural network and time-domain feature extraction techniques for determining volumetric percentages and the type of two phase flow regimes independent of scale layer thickness. Appl. Sci. 2022, 12, 1336. [Google Scholar] [CrossRef]
- Mayet, A.M.; Alizadeh, S.M.; Hamakarim, K.M.; Al-Qahtani, A.A.; Alanazi, A.K.; Grimaldo Guerrero, J.W.; Alhashim, H.H.; Eftekhari-Zadeh, E. Application of Wavelet Characteristics and GMDH Neural Networks for Precise Estimation of Oil Product Types and Volume Fractions. Symmetry 2022, 14, 1797. [Google Scholar] [CrossRef]
- Mayet, A.M.; Chen, T.-C.; Alizadeh, S.M.; Al-Qahtani, A.A.; Qaisi, R.M.A.; Alhashim, H.H.; Eftekhari-Zadeh, E. Application of Artificial Intelligence for Determining the Volume Percentages of a Stratified Regime’s Three-Phase Flow, Independent of the Oil Pipeline’s Scale Thickness. Processes 2022, 10, 1996. [Google Scholar] [CrossRef]
- Mayet, A.M.; Chen, T.-C.; Alizadeh, S.M.; Al-Qahtani, A.A.; Alanazi, A.K.; Ghamry, N.A.; Alhashim, H.H.; Eftekhari-Zadeh, E. Optimizing the Gamma Ray-Based Detection System to Measure the Scale Thickness in Three-Phase Flow through Oil and Petrochemical Pipelines in View of Stratified Regime. Processes 2022, 10, 1866. [Google Scholar] [CrossRef]
- Mayet, A.M.; Chen, T.-C.; Ahmad, I.; Tag Eldin, E.; Al-Qahtani, A.A.; Narozhnyy, I.M.; Guerrero, J.W.G.; Alhashim, H.H. Application of Neural Network and Dual-Energy Radiation-Based Detection Techniques to Measure Scale Layer Thickness in Oil Pipelines Containing a Stratified Regime of Three-Phase Flow. Mathematics 2022, 10, 3544. [Google Scholar] [CrossRef]
- Sattari, M.A.; Roshani, G.H.; Hanus, R.; Nazemi, E. Applicability of time-domain feature extraction methods and artificial intelligence in two-phase flow meters based on gamma-ray absorption technique. Measurement 2021, 168, 108474. [Google Scholar]
- Sattari, M.A.; Roshani, G.H.; Hanus, R. Improving the structure of two-phase flow meter using feature extraction and GMDH neural network. Radiat. Phys. Chem. 2020, 171, 108725. [Google Scholar] [CrossRef]
- Roshani, M.; Sattari, M.A.; Ali PJ, M.; Roshani, G.H.; Nazemi, B.; Corniani, E.; Nazemi, E. Application of GMDH neural network technique to improve measuring precision of a simplified photon attenuation based two-phase flowmeter. Flow Meas. Instrum. 2020, 75, 101804. [Google Scholar] [CrossRef]
- Alamoudi, M.; Sattari, M.A.; Balubaid, M.; Eftekhari-Zadeh, E.; Nazemi, E.; Taylan, O.; Kalmoun, E.M. Application of Gamma Attenuation Technique and Artificial Intelligence to Detect Scale Thickness in Pipelines in Which Two-Phase Flows with Different Flow Regimes and Void Fractions Exist. Symmetry 2021, 13, 1198. [Google Scholar] [CrossRef]
- Amoozegar, M.; Minaei-Bidgoli, B. Optimizing multi-objective PSO based feature selection method using a feature elitism mechanism. Expert Syst. Appl. 2018, 113, 499–514. [Google Scholar] [CrossRef]
- Chen, T.-C.; Alizadeh, S.M.; Albahar, M.A.; Thanoon, M.; Alammari, A.; Guerrero, J.W.G.; Nazemi, E.; Eftekhari-Zadeh, E. Introducing the Effective Features Using the Particle Swarm Optimization Algorithm to Increase Accuracy in Determining the Volume Percentages of Three-Phase Flows. Processes 2023, 11, 236. [Google Scholar] [CrossRef]
- Ullah, H.; Haq, Z.U.; Naqvi, S.R.; Khan MN, A.; Ahsan, M.; Wang, J. Optimization based comparative study of machine learning methods for the prediction of bio-oil produced from microalgae via pyrolysis. J. Anal. Appl. Pyrolysis 2023, 170, 105879. [Google Scholar] [CrossRef]
- Kennedy, J.; Eberhart, R. Particle swarm optimization. In Proceedings of the ICNN’95-International Conference on Neural Networks, IEEE, Perth, Australia, 27 November–1 December 1995; Volume 4, pp. 1942–1948. [Google Scholar] [CrossRef]
- Shi, Y.; Eberhart, R. A modified particle swarm optimizer. In Proceedings of the 1998 IEEE International Conference on Evolutionary Computation, IEEE, IEEE World Congress on Computational Intelligence (Cat. No. 98TH8360). Anchorage, AK, USA, 4–9 May 1998; pp. 69–73. [Google Scholar] [CrossRef]
- Dabiri, H.; Farhangi, V.; Moradi, M.J.; Zadehmohamad, M.; Karakouzian, M. Applications of Decision Tree and Random Forest as Tree-Based Machine Learning Techniques for Analyzing the Ultimate Strain of Spliced and Non-Spliced Reinforcement Bars. Appl. Sci. 2022, 12, 4851. [Google Scholar] [CrossRef]
- Zych, M.; Petryka, L.; Kępński, J.; Hanus, R.; Bujak, T.; Puskarczyk, E. Radioisotope investigations of compound two-phase flows in an open channel. Flow Meas. Instrum. 2014, 35, 11–15. [Google Scholar] [CrossRef]
- Zych, M.; Hanus, R.; Wilk, B.; Petryka, L.; Świsulski, D. Comparison of noise reduction methods in radiometric correlation measurements of two-phase liquid-gas flows. Measurement 2018, 129, 288–295. [Google Scholar] [CrossRef]
- Golijanek-Jędrzejczyk, A.; Mrowiec, A.; Hanus, R.; Zych, M.; Heronimczak, M.; Świsulski, D. Uncertainty of mass flow measurement using centric and eccentric orifice for Reynolds number in the range 10,000 ≤ Re ≤ 20,000. Measurement 2020, 160, 107851. [Google Scholar] [CrossRef]
- Mayet, A.; Hussain, M. Amorphous WNx Metal for Accelerometers and Gyroscope. In Proceedings of the MRS Fall Meeting, Boston, MA, USA, 30 November–5 December 2014. [Google Scholar]
- Mayet, A.; Hussain, A.; Hussain, M. Three-terminal nanoelectromechanical switch based on tungsten nitride—An amorphous metallic material. Nanotechnology 2016, 27, 035202. [Google Scholar] [CrossRef]
- Shukla, N.K.; Mayet, A.M.; Vats, A.; Aggarwal, M.; Raja, R.K.; Verma, R.; Muqeet, M.A. High speed integrated RF–VLC data communication system: Performance constraints and capacity considerations. Phys. Commun. 2022, 50, 101492. [Google Scholar] [CrossRef]
- Mayet, A.; Smith, C.E.; Hussain, M.M. Energy reversible switching from amorphous metal based nanoelectromechanical switch. In Proceedings of the 13th IEEE International Conference on Nanotechnology (IEEE-NANO 2013), Beijing, China, 5–8 August 2013; pp. 366–369. [Google Scholar]
- Jedkare, E.; Shama, F.; Sattari, M.A. Compact Wilkinson power divider with multi-harmonics suppression. AEU-Int. J. Electron. Commun. 2020, 127, 153436. [Google Scholar] [CrossRef]
- Artyukhov, A.V.; Isaev, A.A.; Drozdov, A.N.; Gorbyleva, Y.A.; Nurgalieva, K.S. The rod string loads variation during short-term annular gas extraction. Energies 2022, 15, 5045. [Google Scholar] [CrossRef]
- Isaev, A.A.; Aliev, M.M.O.; Drozdov, A.N.; Gorbyleva, Y.A.; Nurgalieva, K.S. Improving the efficiency of curved wells’ operation by means of progressive cavity pumps. Energies 2022, 15, 4259. [Google Scholar] [CrossRef]
- Zhang, G.; Liu, R.; Ge, Y.; Mayet, A.M.; Chan, S.; Li, G.; Nazemi, E. Investigation on the Wilson Neuronal Model: Optimized Approximation and Digital Multiplierless Implementation. IEEE Trans. Biomed. Circuits Syst. 2022, 16, 1181–1190. [Google Scholar] [CrossRef] [PubMed]
- Alanazi, A.K.; Alizadeh, S.M.; Nurgalieva, K.S.; Guerrero, J.W.G.; Abo-Dief, H.M.; Eftekhari-Zadeh, E.; Nazemi, E.; Narozhnyy, I.M. Optimization of X-ray tube voltage to improve the precision of two phase flow meters used in petroleum industry. Sustainability 2021, 13, 13622. [Google Scholar] [CrossRef]
- Hosseini Tabatabaee, A.; Shama, F.; Sattari, M.A.; Veysifard, S. A miniaturized Wilkinson power divider with 12th harmonics suppression. J. Electromagn. Waves Appl. 2021, 35, 371–388. [Google Scholar] [CrossRef]
- Mayet, A.M.; Alizadeh, S.M.; Nurgalieva, K.S.; Hanus, R.; Nazemi, E.; Narozhnyy, I.M. Extraction of Time-Domain Characteristics and Selection of Effective Features Using Correlation Analysis to Increase the Accuracy of Petroleum Fluid Monitoring Systems. Energies 2022, 15, 1986. [Google Scholar] [CrossRef]
- Lalbakhsh, A.; Mohamadpour, G.; Roshani, S.; Ami, M.; Roshani, S.; Sayem, A.S.; Alibakhshikenari, M.; Koziel, S. Design of a compact planar transmission line for miniaturized rat-race coupler with harmonics suppression. IEEE Access 2021, 9, 129207–129217. [Google Scholar] [CrossRef]
- Hookari, M.; Roshani, S.; Roshani, S. High-efficiency balanced power amplifier using miniaturized harmonics suppressed coupler. Int. J. RF Microw. Comput. Aided Eng. 2020, 30, e22252. [Google Scholar] [CrossRef]
- Lotfi, S.; Roshani, S.; Roshani, S.; Gilan, M.S. Wilkinson power divider with band-pass filtering response and harmonics suppression using open and short stubs. Frequenz 2020, 74, 169–176. [Google Scholar] [CrossRef]
- Jamshidi, M.; Siahkamari, H.; Roshani, S.; Roshani, S. A compact Gysel power divider design using U-shaped and T-shaped resonators with harmonics suppression. Electromagnetics 2019, 39, 491–504. [Google Scholar] [CrossRef]
- Roshani, S.; Jamshidi, M.B.; Mohebi, F.; Roshani, S. Design and modeling of a compact power divider with squared resonators using artificial intelligence. Wirel. Pers. Commun. 2021, 117, 2085–2096. [Google Scholar] [CrossRef]
- Roshani, S.; Azizian, J.; Roshani, S.; Jamshidi, M.B.; Parandin, F. Design of a miniaturized branch line microstrip coupler with a simple structure using artificial neural network. Frequenz 2022, 76, 255–263. [Google Scholar] [CrossRef]
- Khaleghi, M.; Salimi, J.; Farhangi, V.; Moradi, M.J.; Karakouzian, M. Application of Artificial Neural Network to Predict Load Bearing Capacity and Stiffness of Perforated Masonry Walls. CivilEng 2021, 2, 48–67. [Google Scholar] [CrossRef]
- Taylor, J.G. Neural Networks and Their Applications; John Wiley Sons Ltd.: Brighton, UK, 1996. [Google Scholar]
- Gallant, A.R.; White, H. On learning the derivatives of an unknown mapping with multilayer feedforward networks. Neural Netw. 1992, 5, e129–e138. [Google Scholar] [CrossRef] [Green Version]
- Song, X.; Zhang, Y.; Guo, Y.-N.; Sun, X.-Y.; Wang, Y.-L. Variablesize cooperative coevolutionary particle swarm optimization for feature selection on high-dimensional data. IEEE Trans. Evol. Comput. 2020, 24, 882–895. [Google Scholar] [CrossRef]
- Tran, B.; Xue, B.; Zhang, M. Variable-length particle swarm optimization for feature selection on high-dimensional classification. IEEE Trans. Evol. Comput. 2019, 23, 473–487. [Google Scholar] [CrossRef]
- Jain, I.; Jain, V.K.; Jain, R. Correlation feature selection based improved-Binary Particle Swarm Optimization for gene selection and cancer classification. Appl. Soft Comput. 2018, 62, 203–215. [Google Scholar] [CrossRef]


| No. of Iterations | 30 |
|---|---|
| Size of the Population | 20 |
| Inertia Weight | 0.72 |
| Inertia Weight Damping Ratio | 1 |
| Type of Applied ANN | MLP |
|---|---|
| Nodes of input layer | 8 |
| Nodes of 1st hidden layer | 15 |
| Nodes of 2nd hidden layer | 10 |
| Nodes of output layer | 1 |
| Epochs | 500 |
| Activation function applied for any neuron | Tansig |
| Ref. | Method of Feature Extracted | Method of Feature Selection | Neural Network’s Type | MSE | RMSE |
|---|---|---|---|---|---|
| [4] | Without feature extraction | Without feature selection | MLP | 1.08 | 1.04 |
| [6] | Without feature extraction | Without feature selection | RBF | 37.45 | 6.12 |
| [7] | Without feature extraction | Without feature selection | MLP | 2.56 | 1.6 |
| [26] | Frequency features | Without feature selection | MLP | 0.67 | 0.82 |
| [30] | Time features | Without feature selection | GMDH | 1.24 | 1.11 |
| [31] | Time features | Without feature selection | MLP | 0.21 | 0.46 |
| [32] | Without feature extraction | Without feature selection | GMDH | 7.34 | 2.71 |
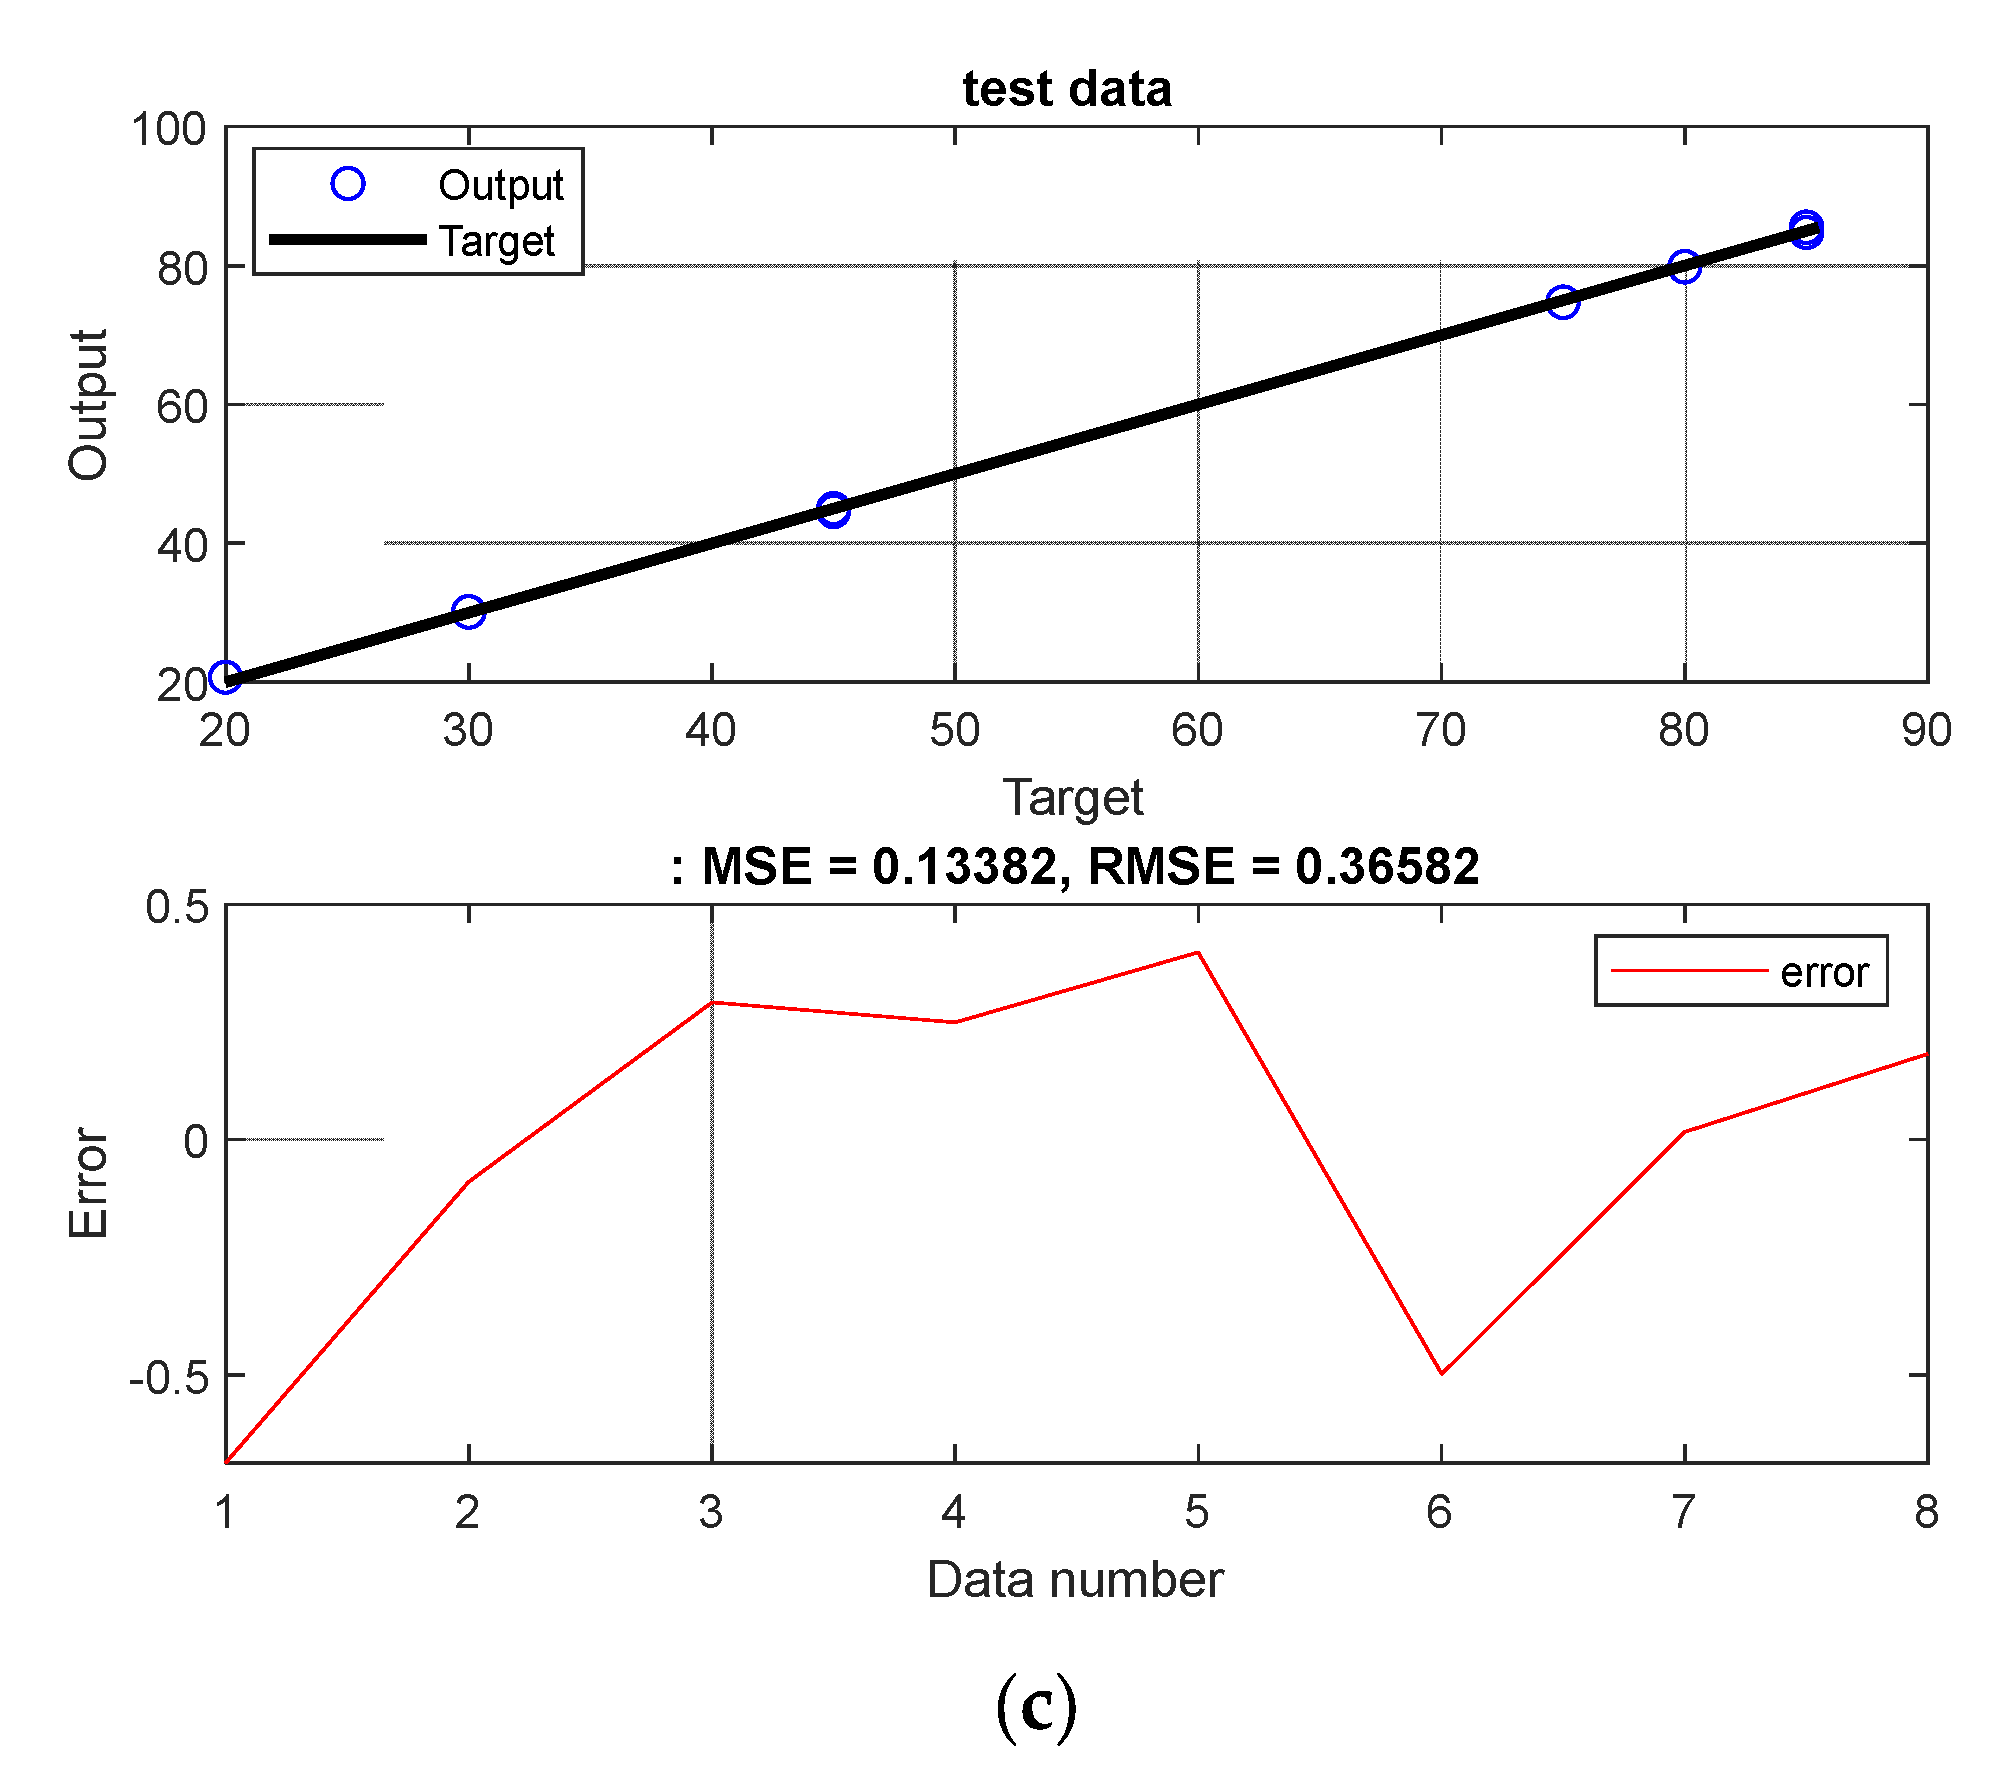
| [current study] | Time features | PSO-based feature selection | MLP | 0.14 | 0.37 |
Disclaimer/Publisher’s Note: The statements, opinions and data contained in all publications are solely those of the individual author(s) and contributor(s) and not of MDPI and/or the editor(s). MDPI and/or the editor(s) disclaim responsibility for any injury to people or property resulting from any ideas, methods, instructions or products referred to in the content. |
© 2023 by the authors. Licensee MDPI, Basel, Switzerland. This article is an open access article distributed under the terms and conditions of the Creative Commons Attribution (CC BY) license (https://creativecommons.org/licenses/by/4.0/).
Share and Cite
Iliyasu, A.M.; Benselama, A.S.; Bagaudinovna, D.K.; Roshani, G.H.; S. Salama, A. Using Particle Swarm Optimization and Artificial Intelligence to Select the Appropriate Characteristics to Determine Volume Fraction in Two-Phase Flows. Fractal Fract. 2023, 7, 283. https://doi.org/10.3390/fractalfract7040283
Iliyasu AM, Benselama AS, Bagaudinovna DK, Roshani GH, S. Salama A. Using Particle Swarm Optimization and Artificial Intelligence to Select the Appropriate Characteristics to Determine Volume Fraction in Two-Phase Flows. Fractal and Fractional. 2023; 7(4):283. https://doi.org/10.3390/fractalfract7040283
Chicago/Turabian StyleIliyasu, Abdullah M., Abdallah S. Benselama, Dakhkilgova Kamila Bagaudinovna, Gholam Hossein Roshani, and Ahmed S. Salama. 2023. "Using Particle Swarm Optimization and Artificial Intelligence to Select the Appropriate Characteristics to Determine Volume Fraction in Two-Phase Flows" Fractal and Fractional 7, no. 4: 283. https://doi.org/10.3390/fractalfract7040283