
Multi-Point, Multi-Objective Optimisation of Centrifugal Fans by 3D Inverse Design Method
Abstract
:1. Introduction
2. Blade Design
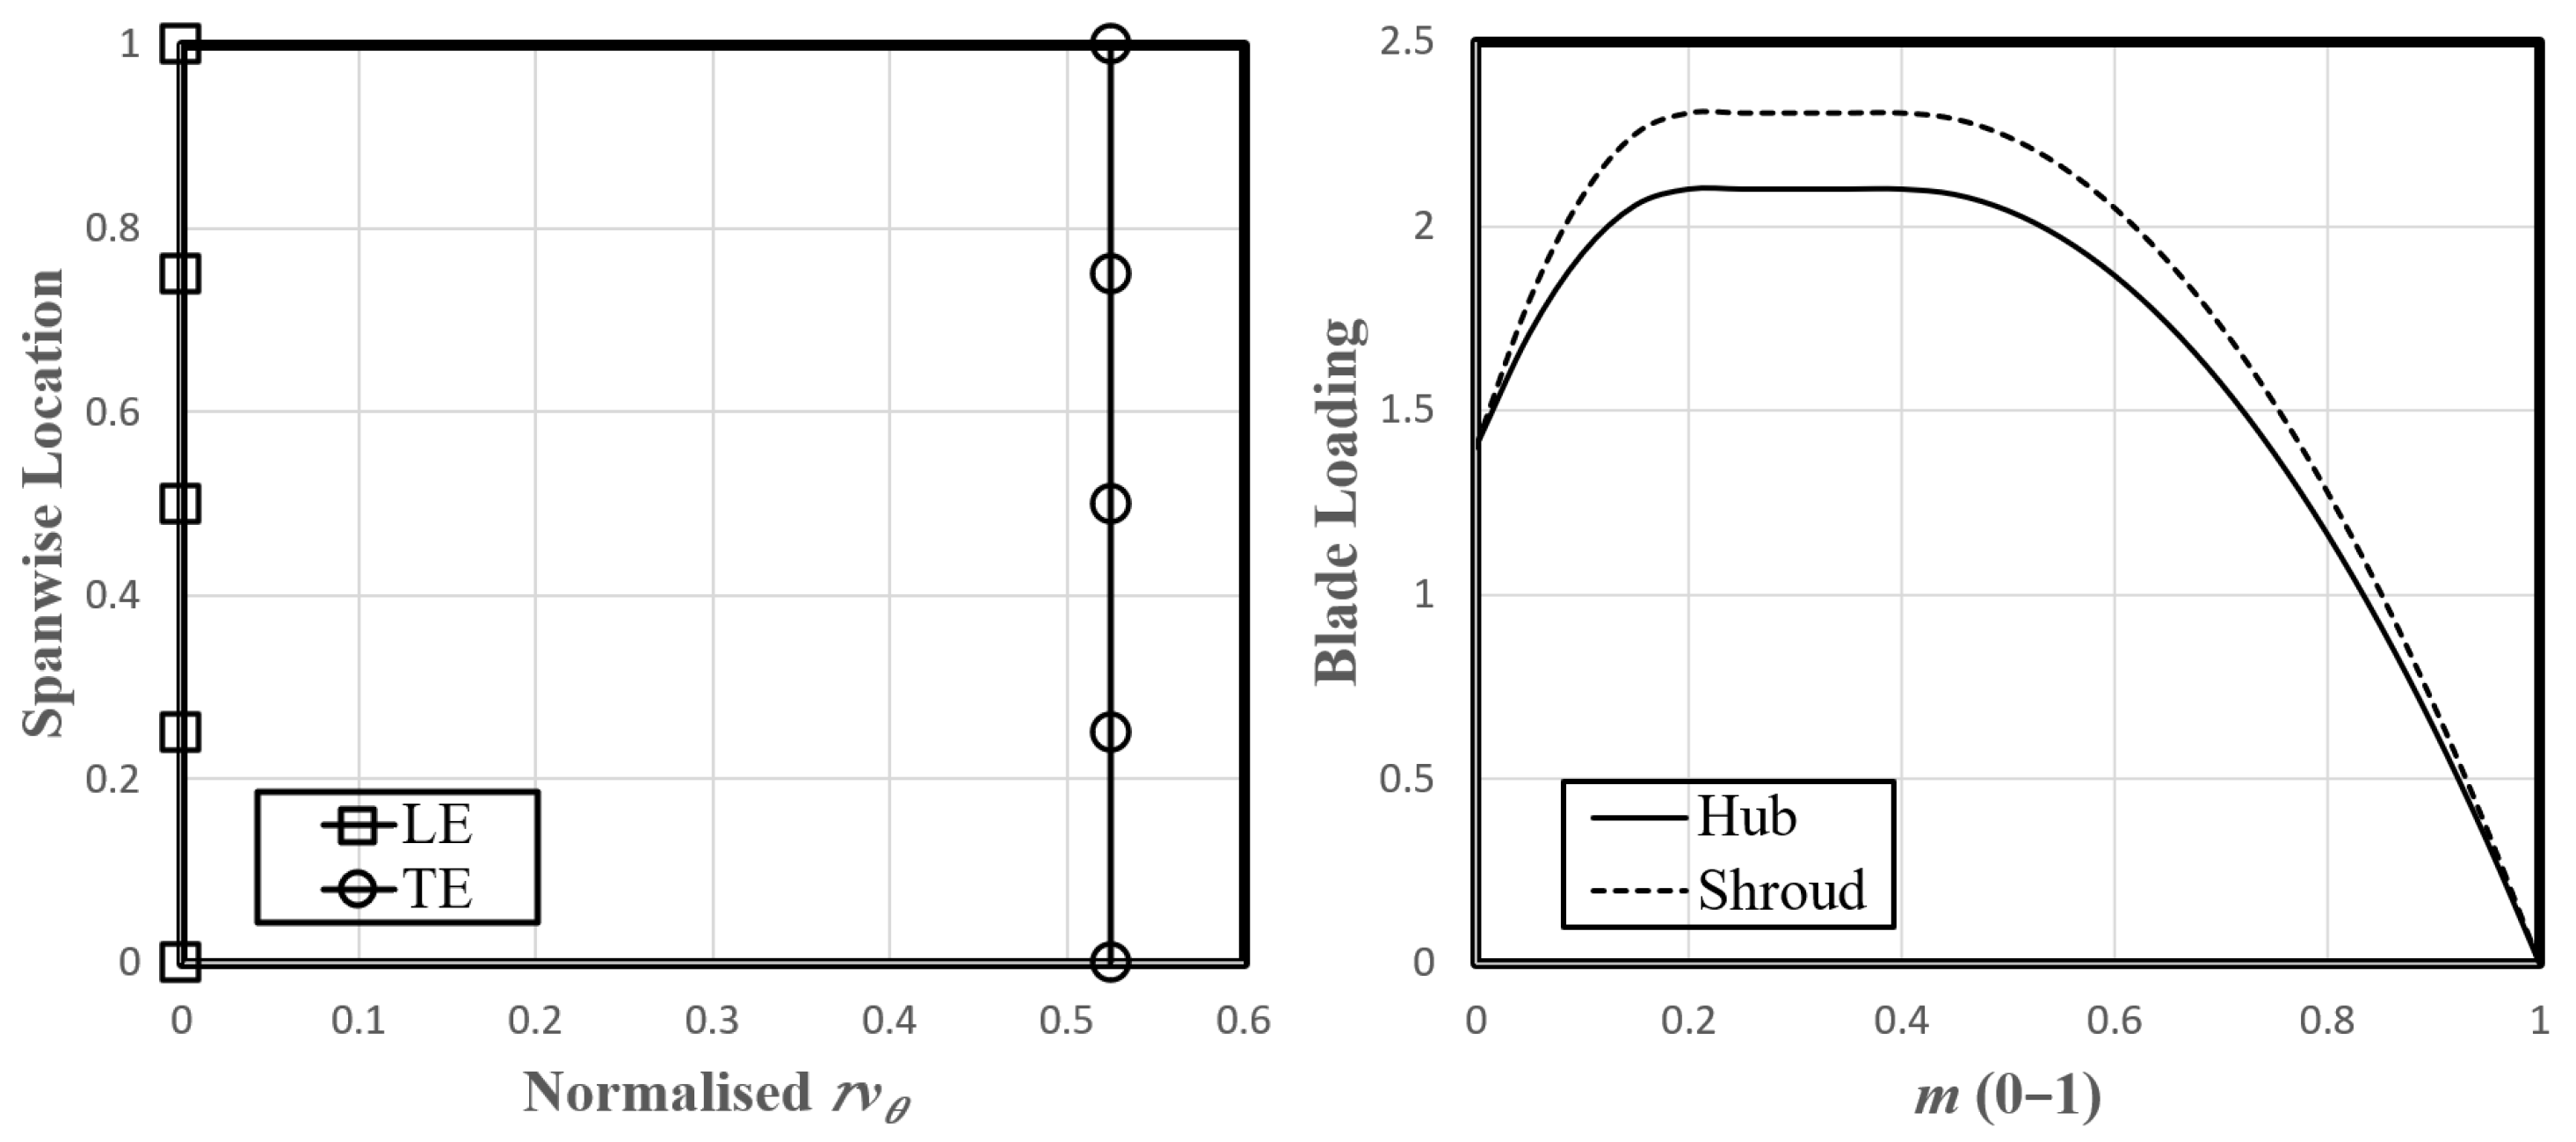
2.1. The 3D Inverse Design Method
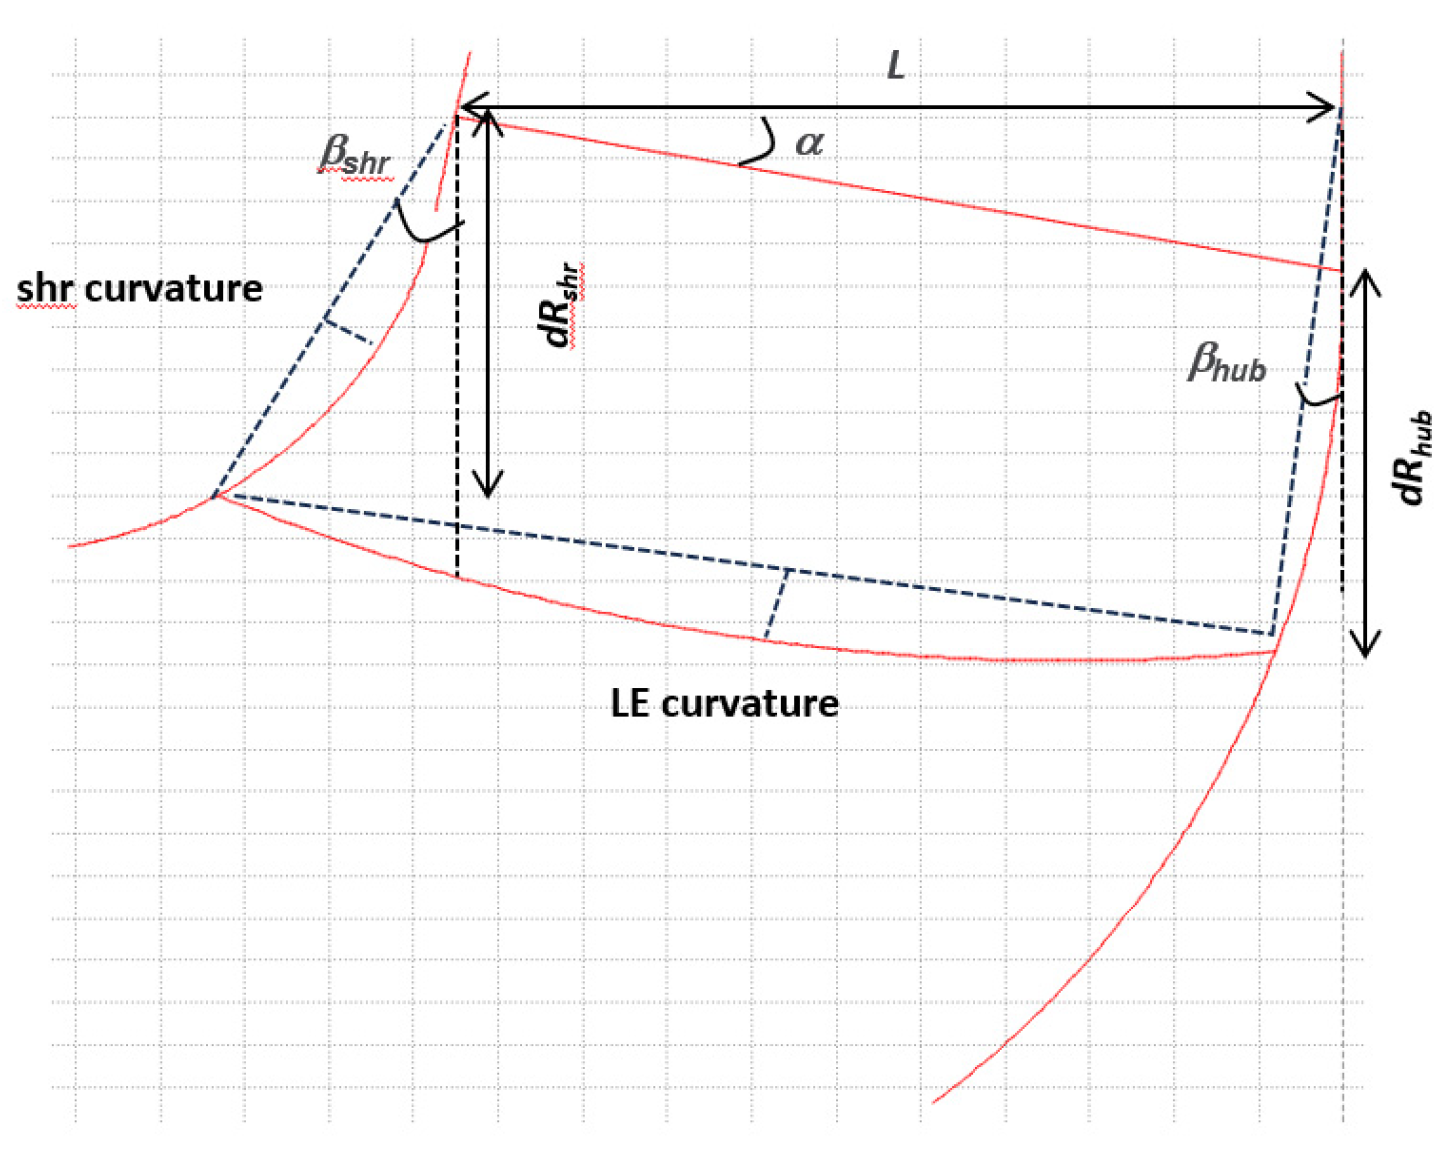
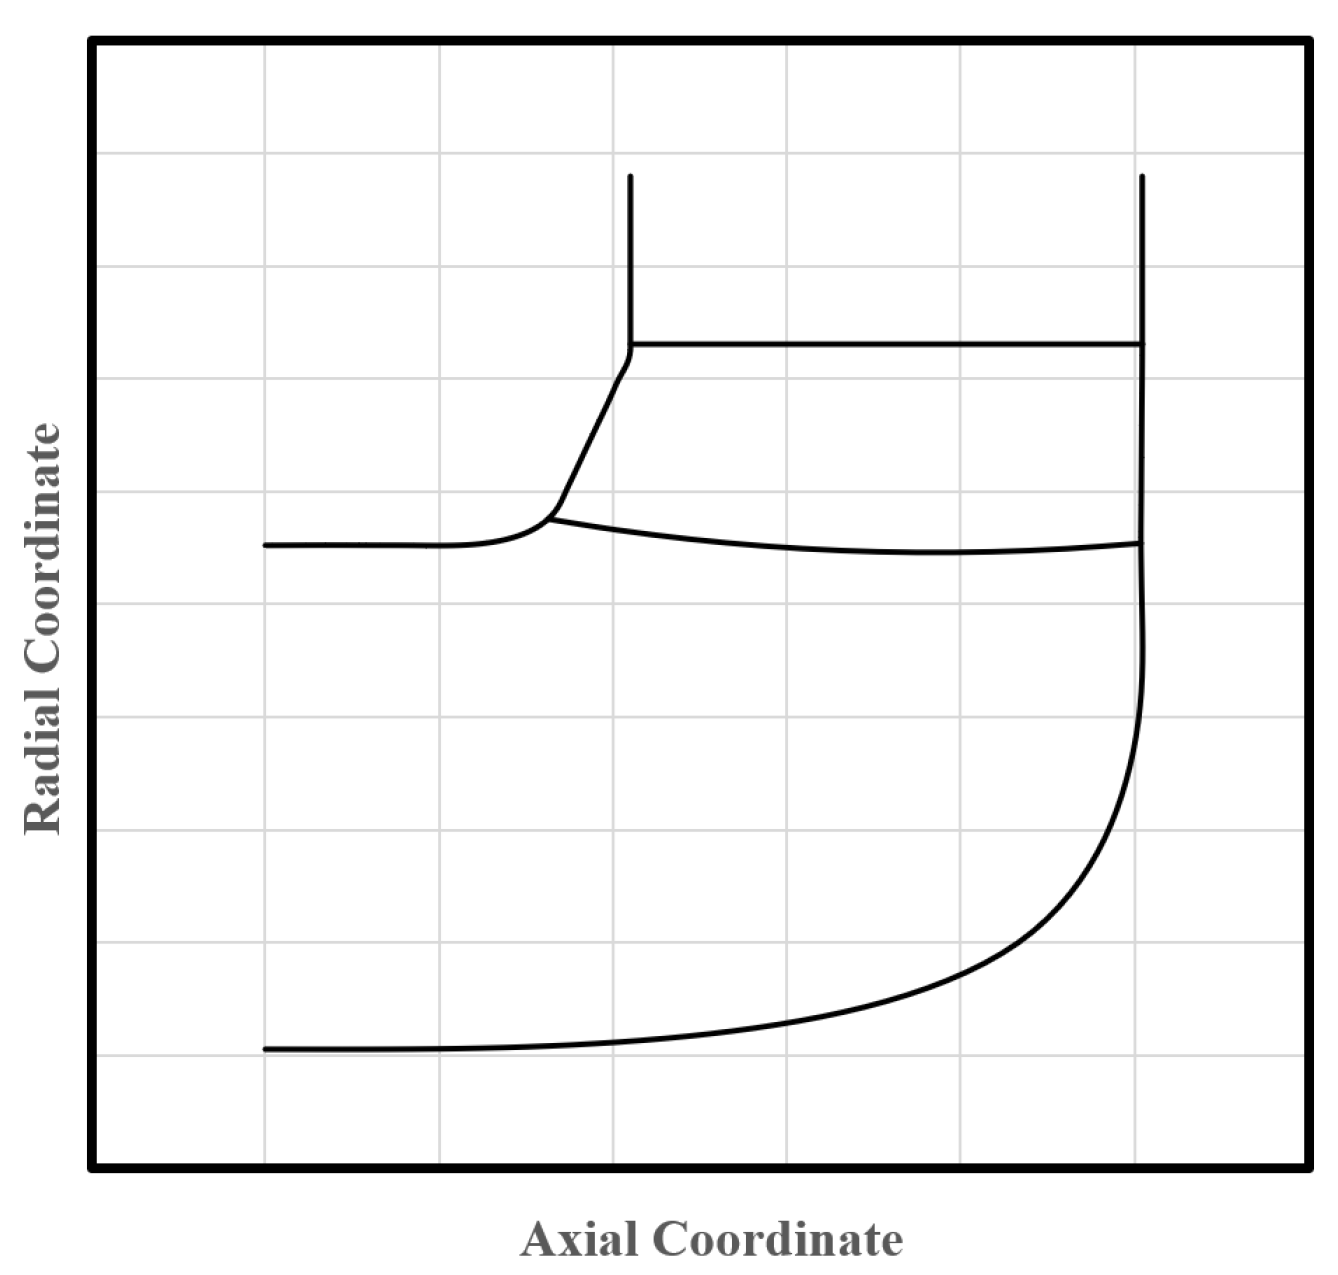
2.2. Blade Parametrization
2.3. Design Specifications and Baseline Blade Generation
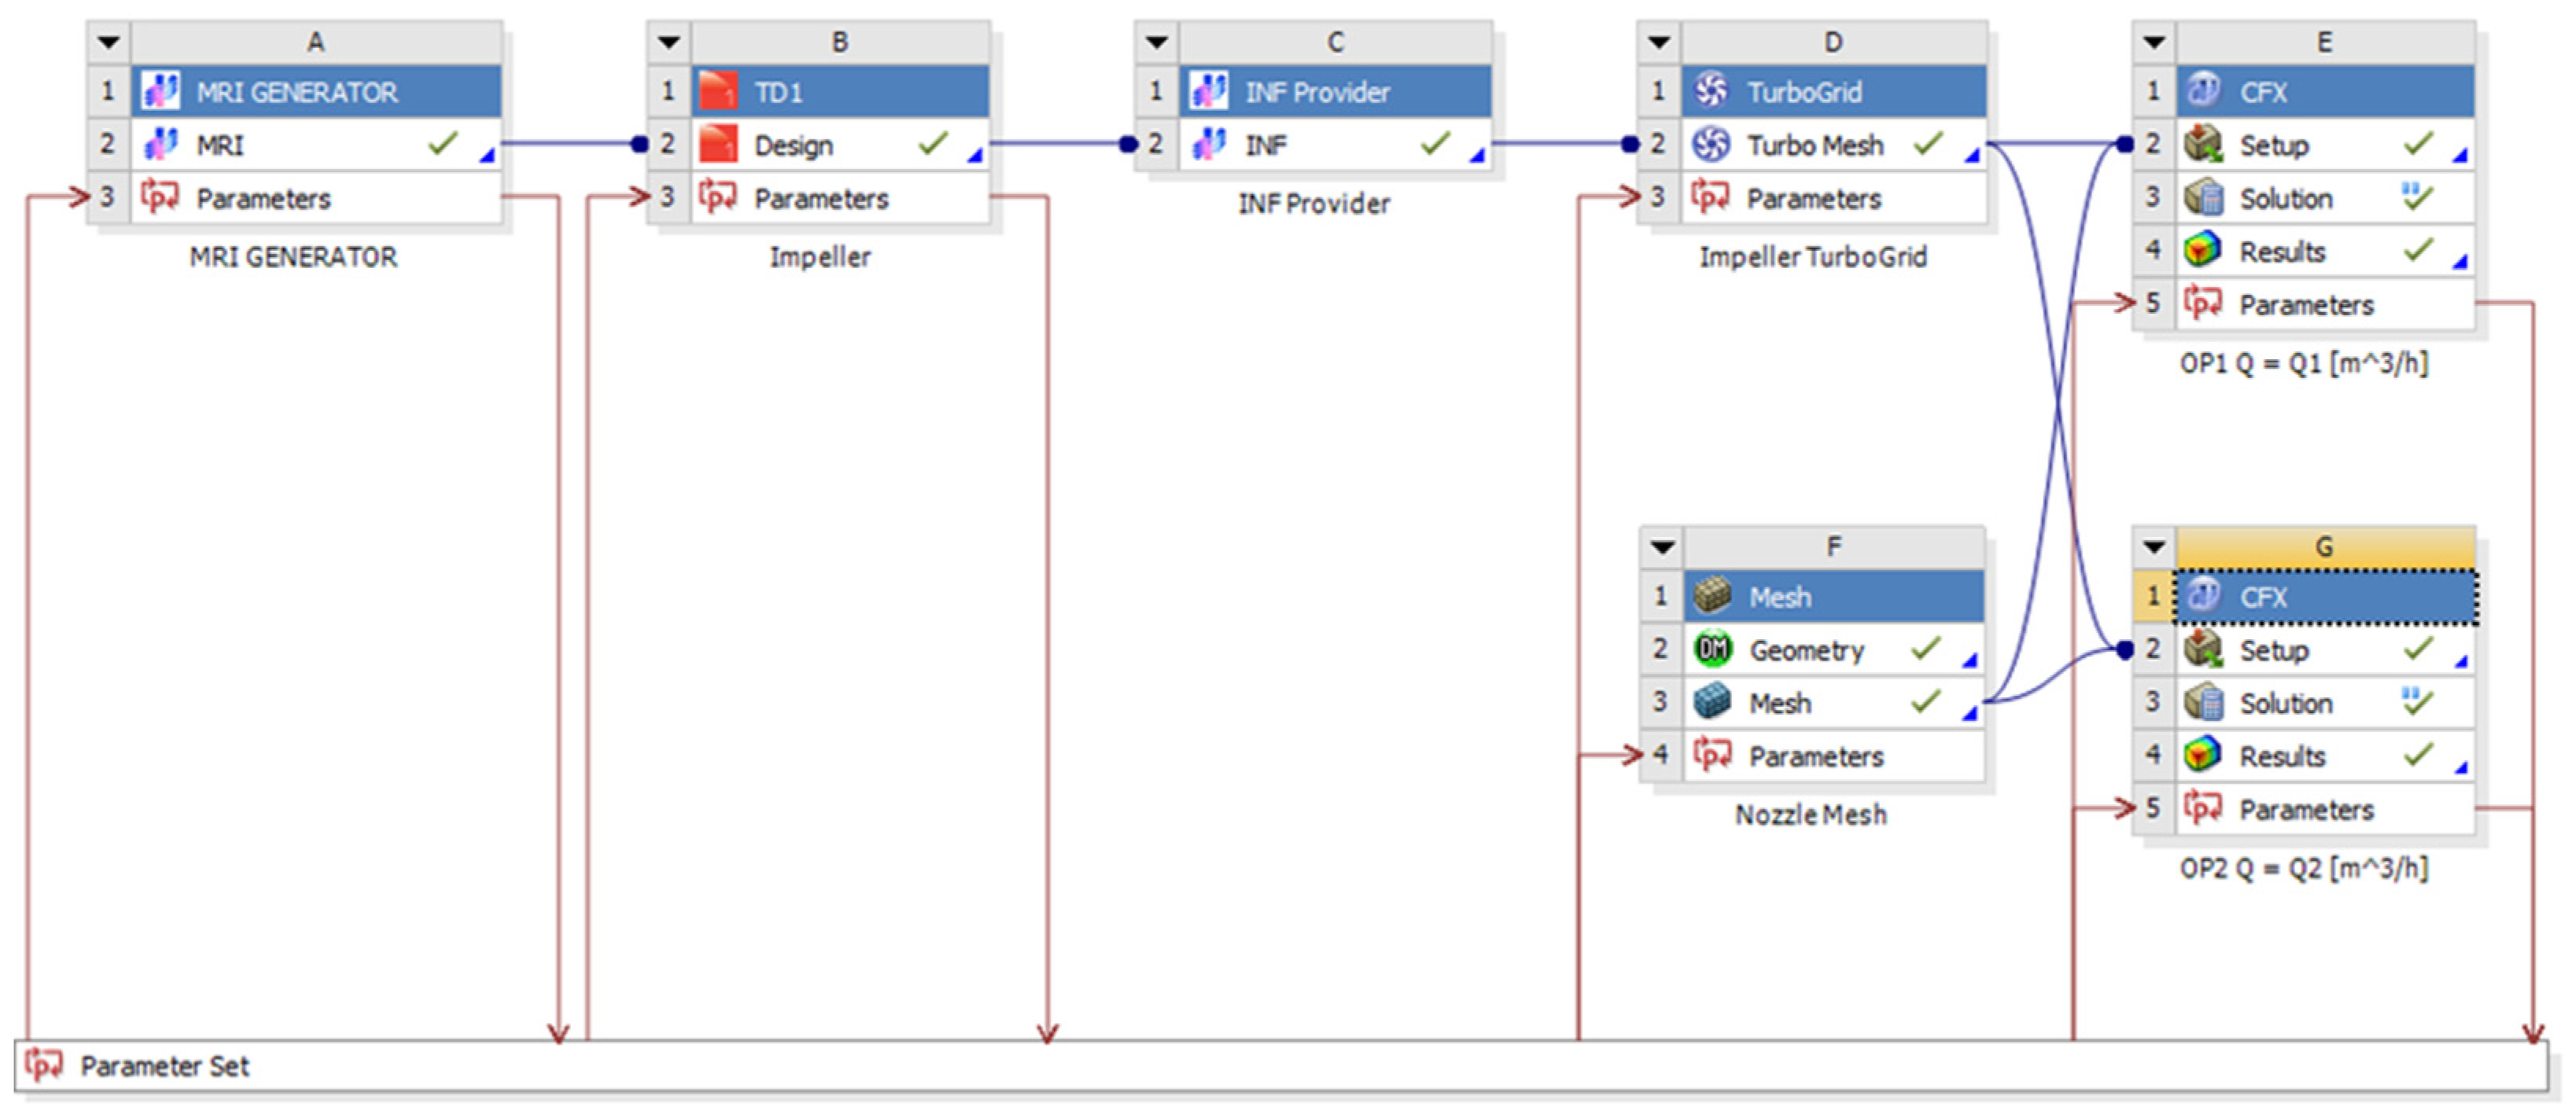
3. CFD Simulation
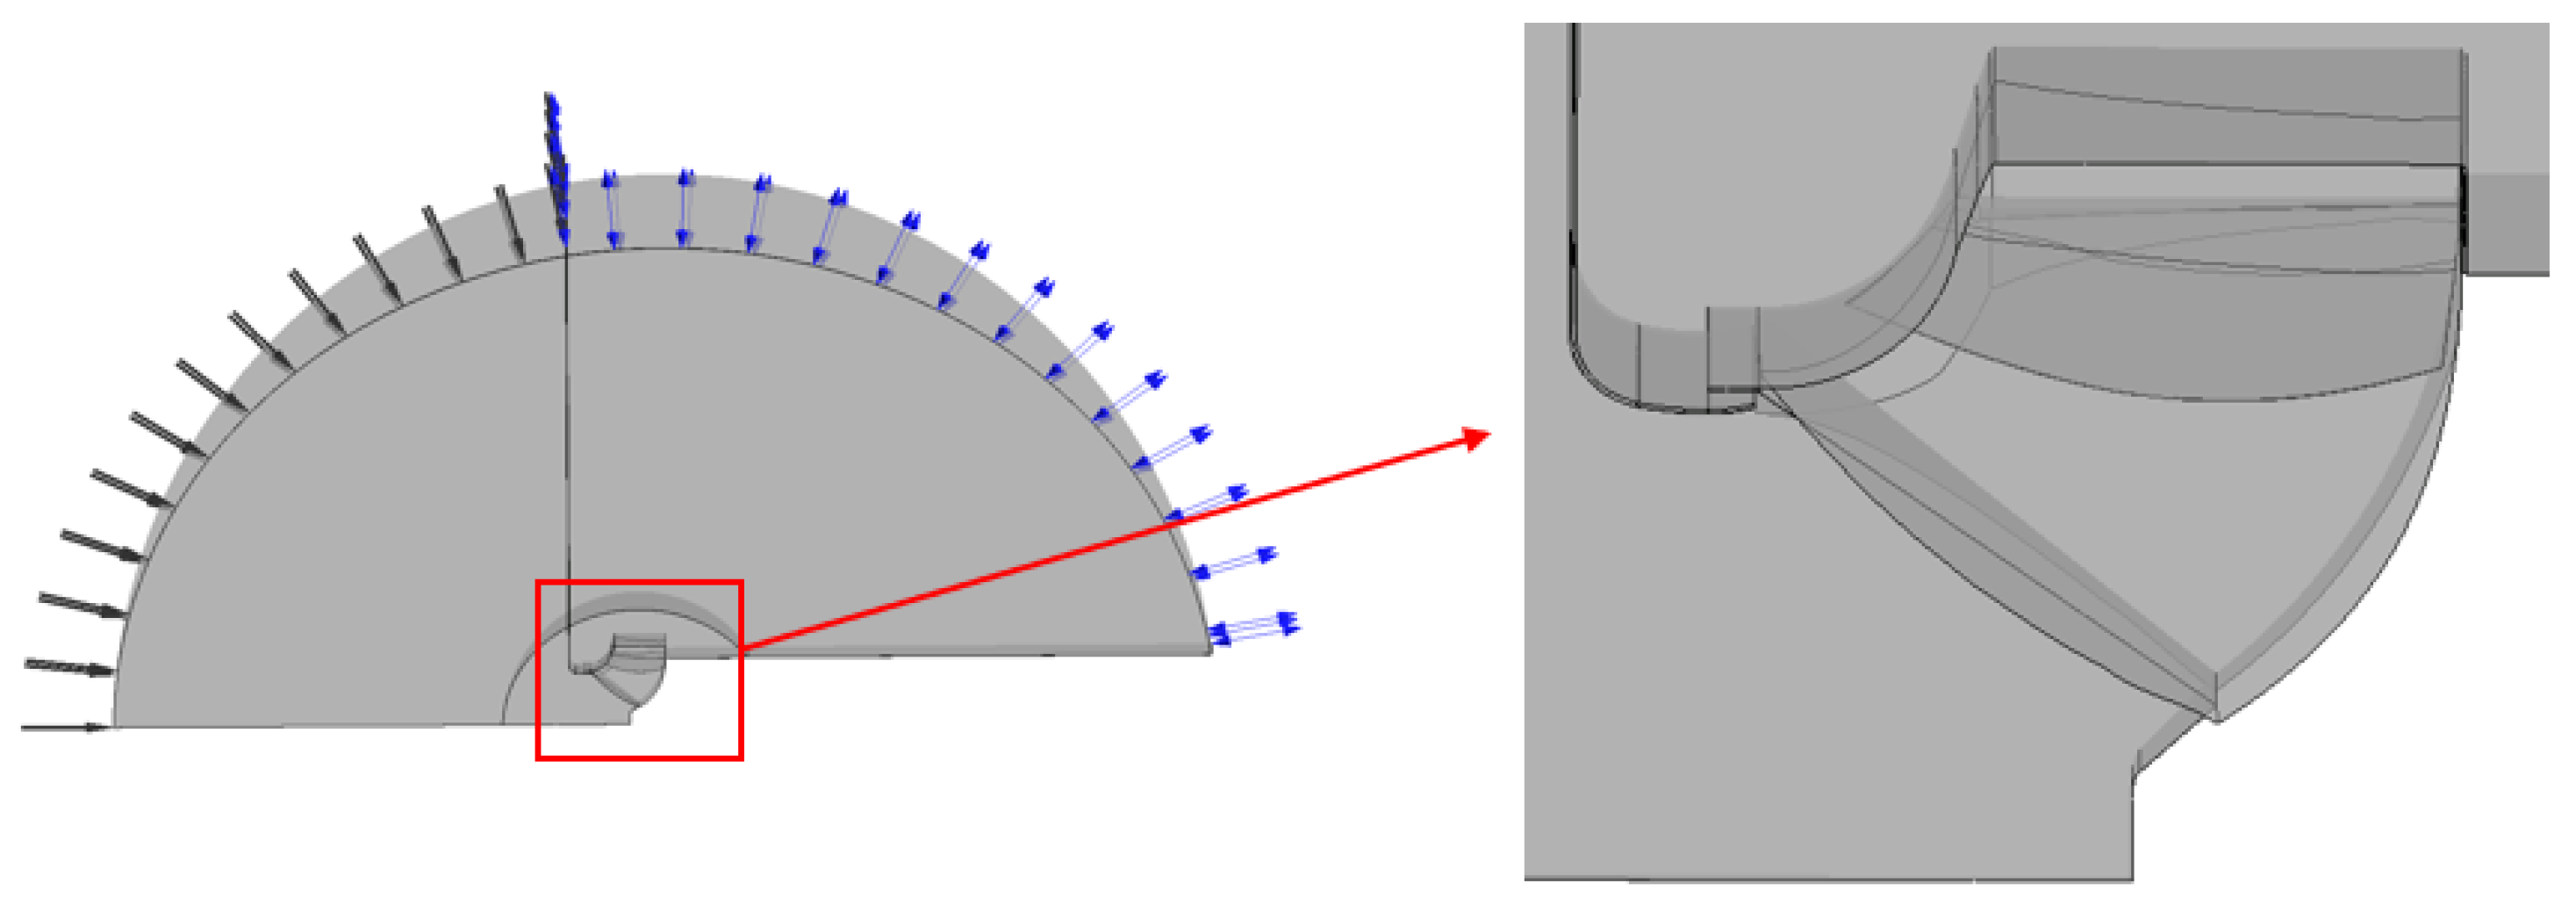
3.1. Mesh Generation
3.2. CFD Setup
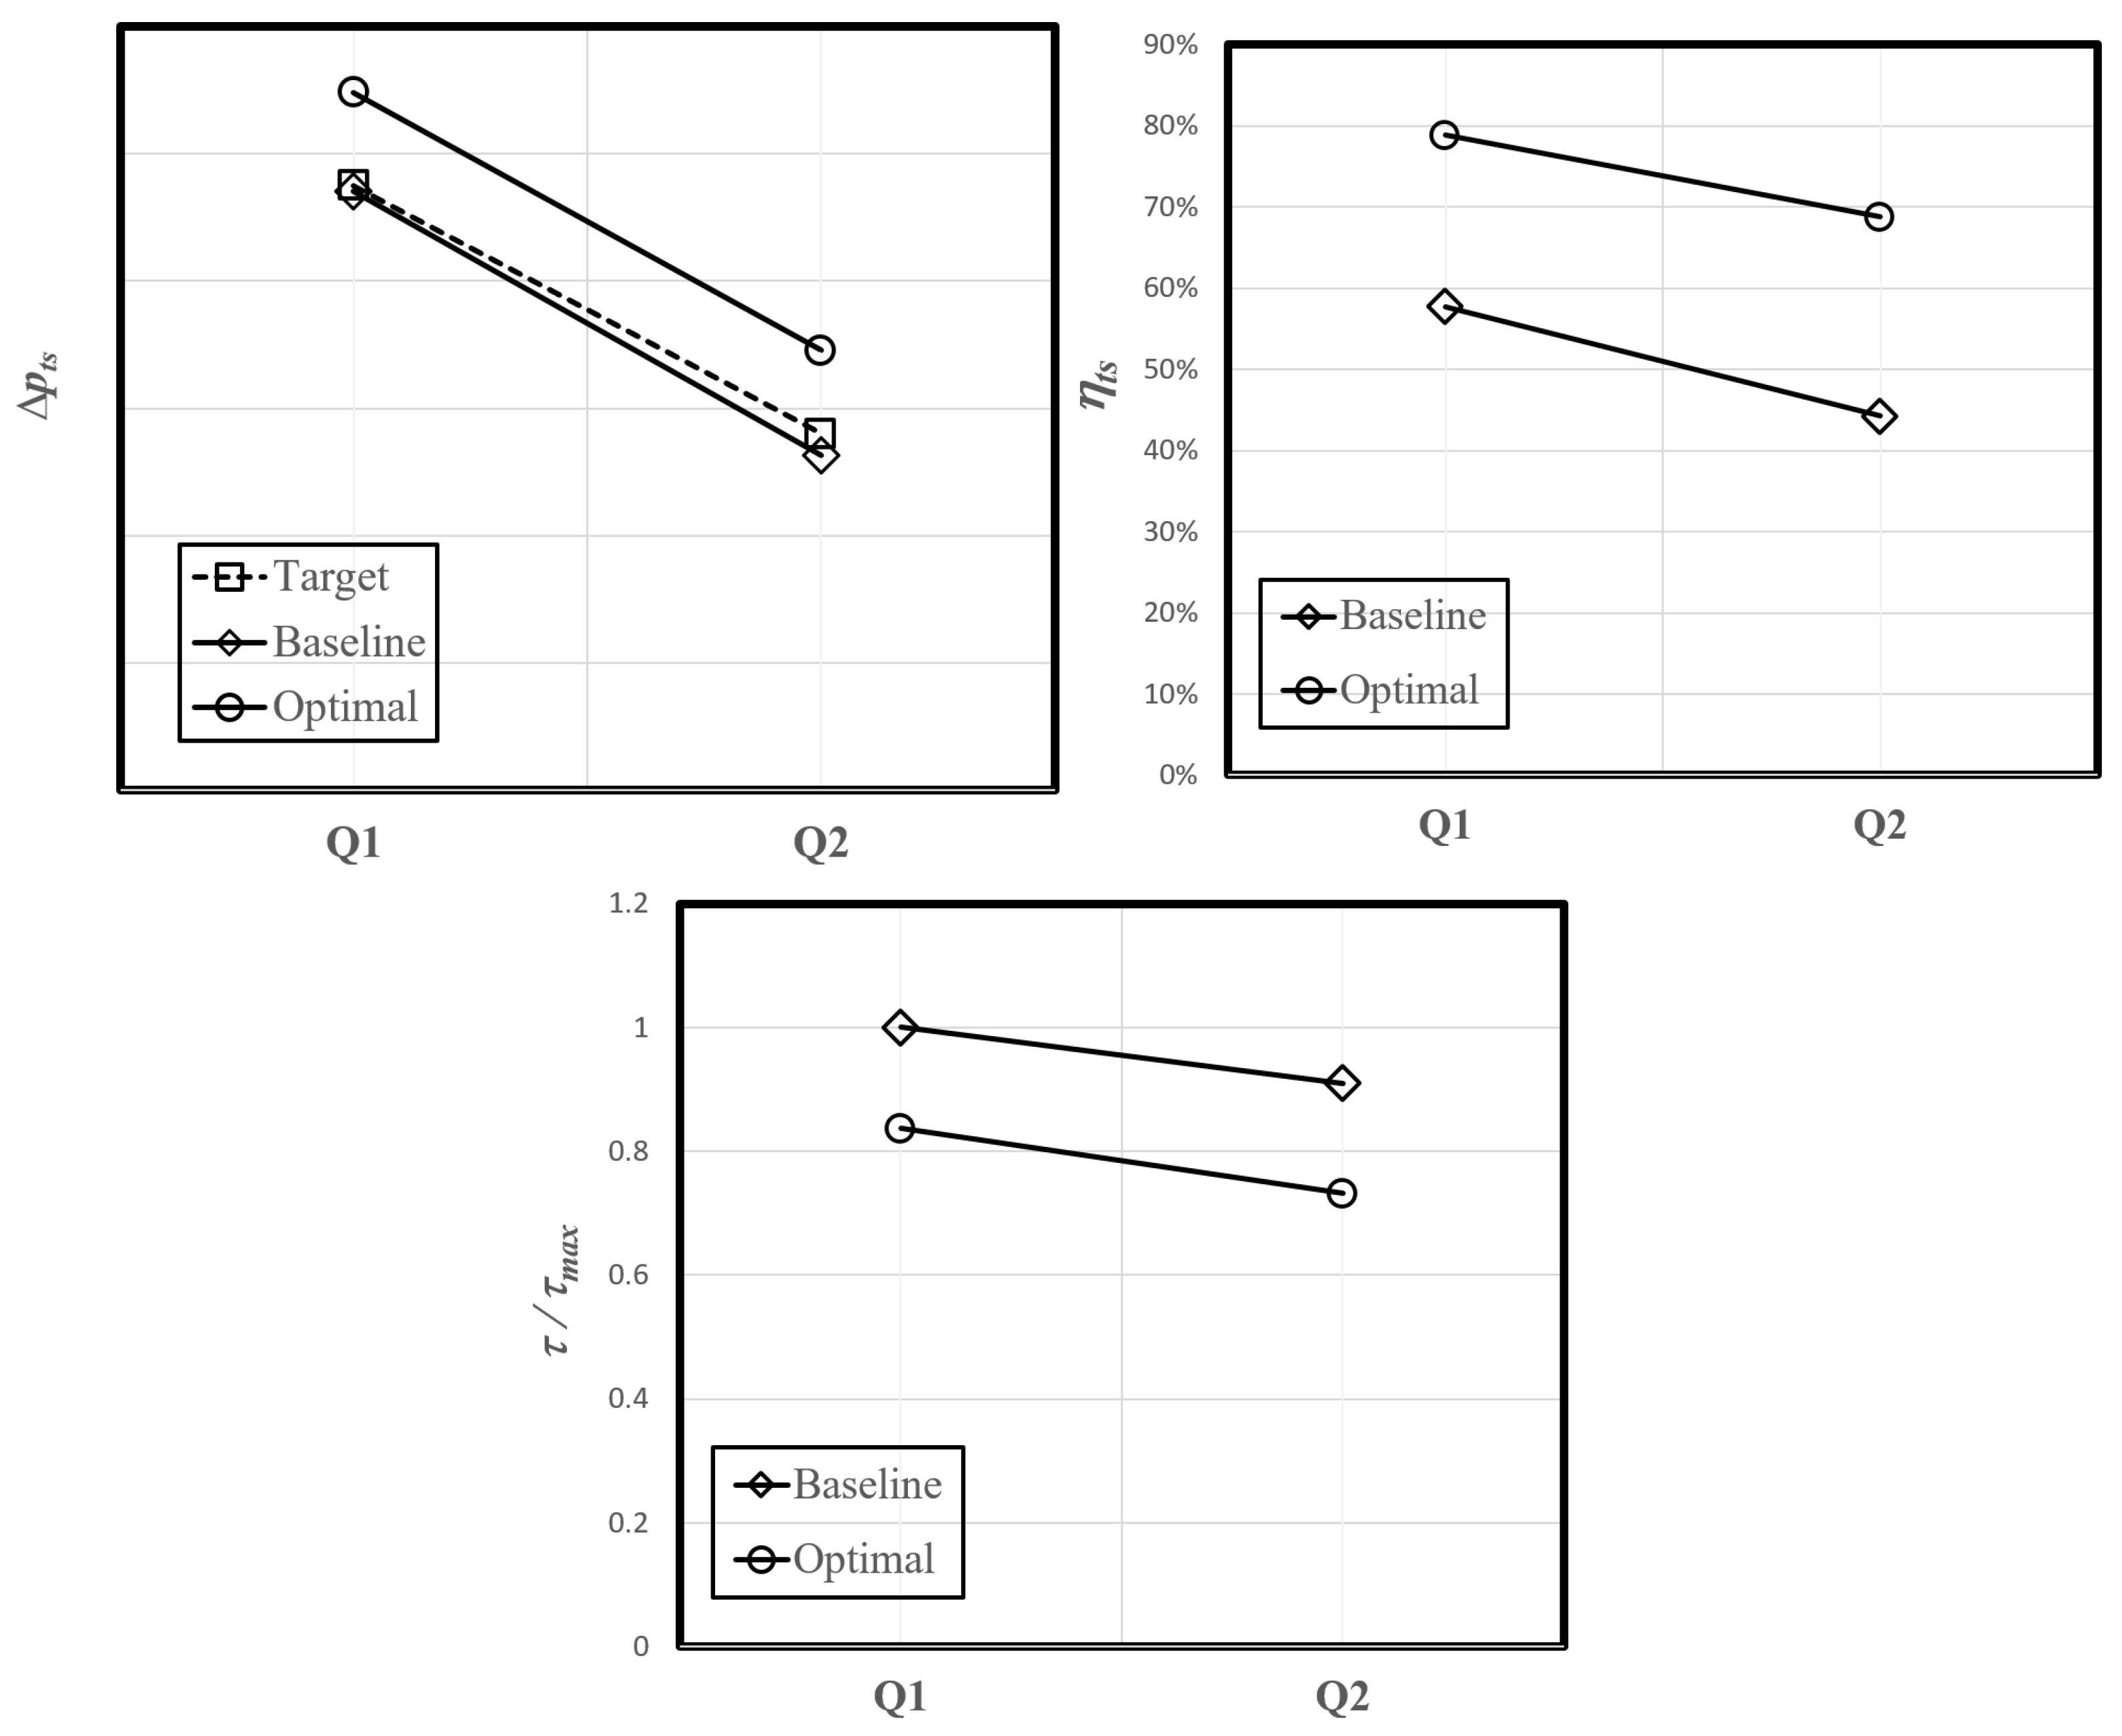
3.3. CFD Results
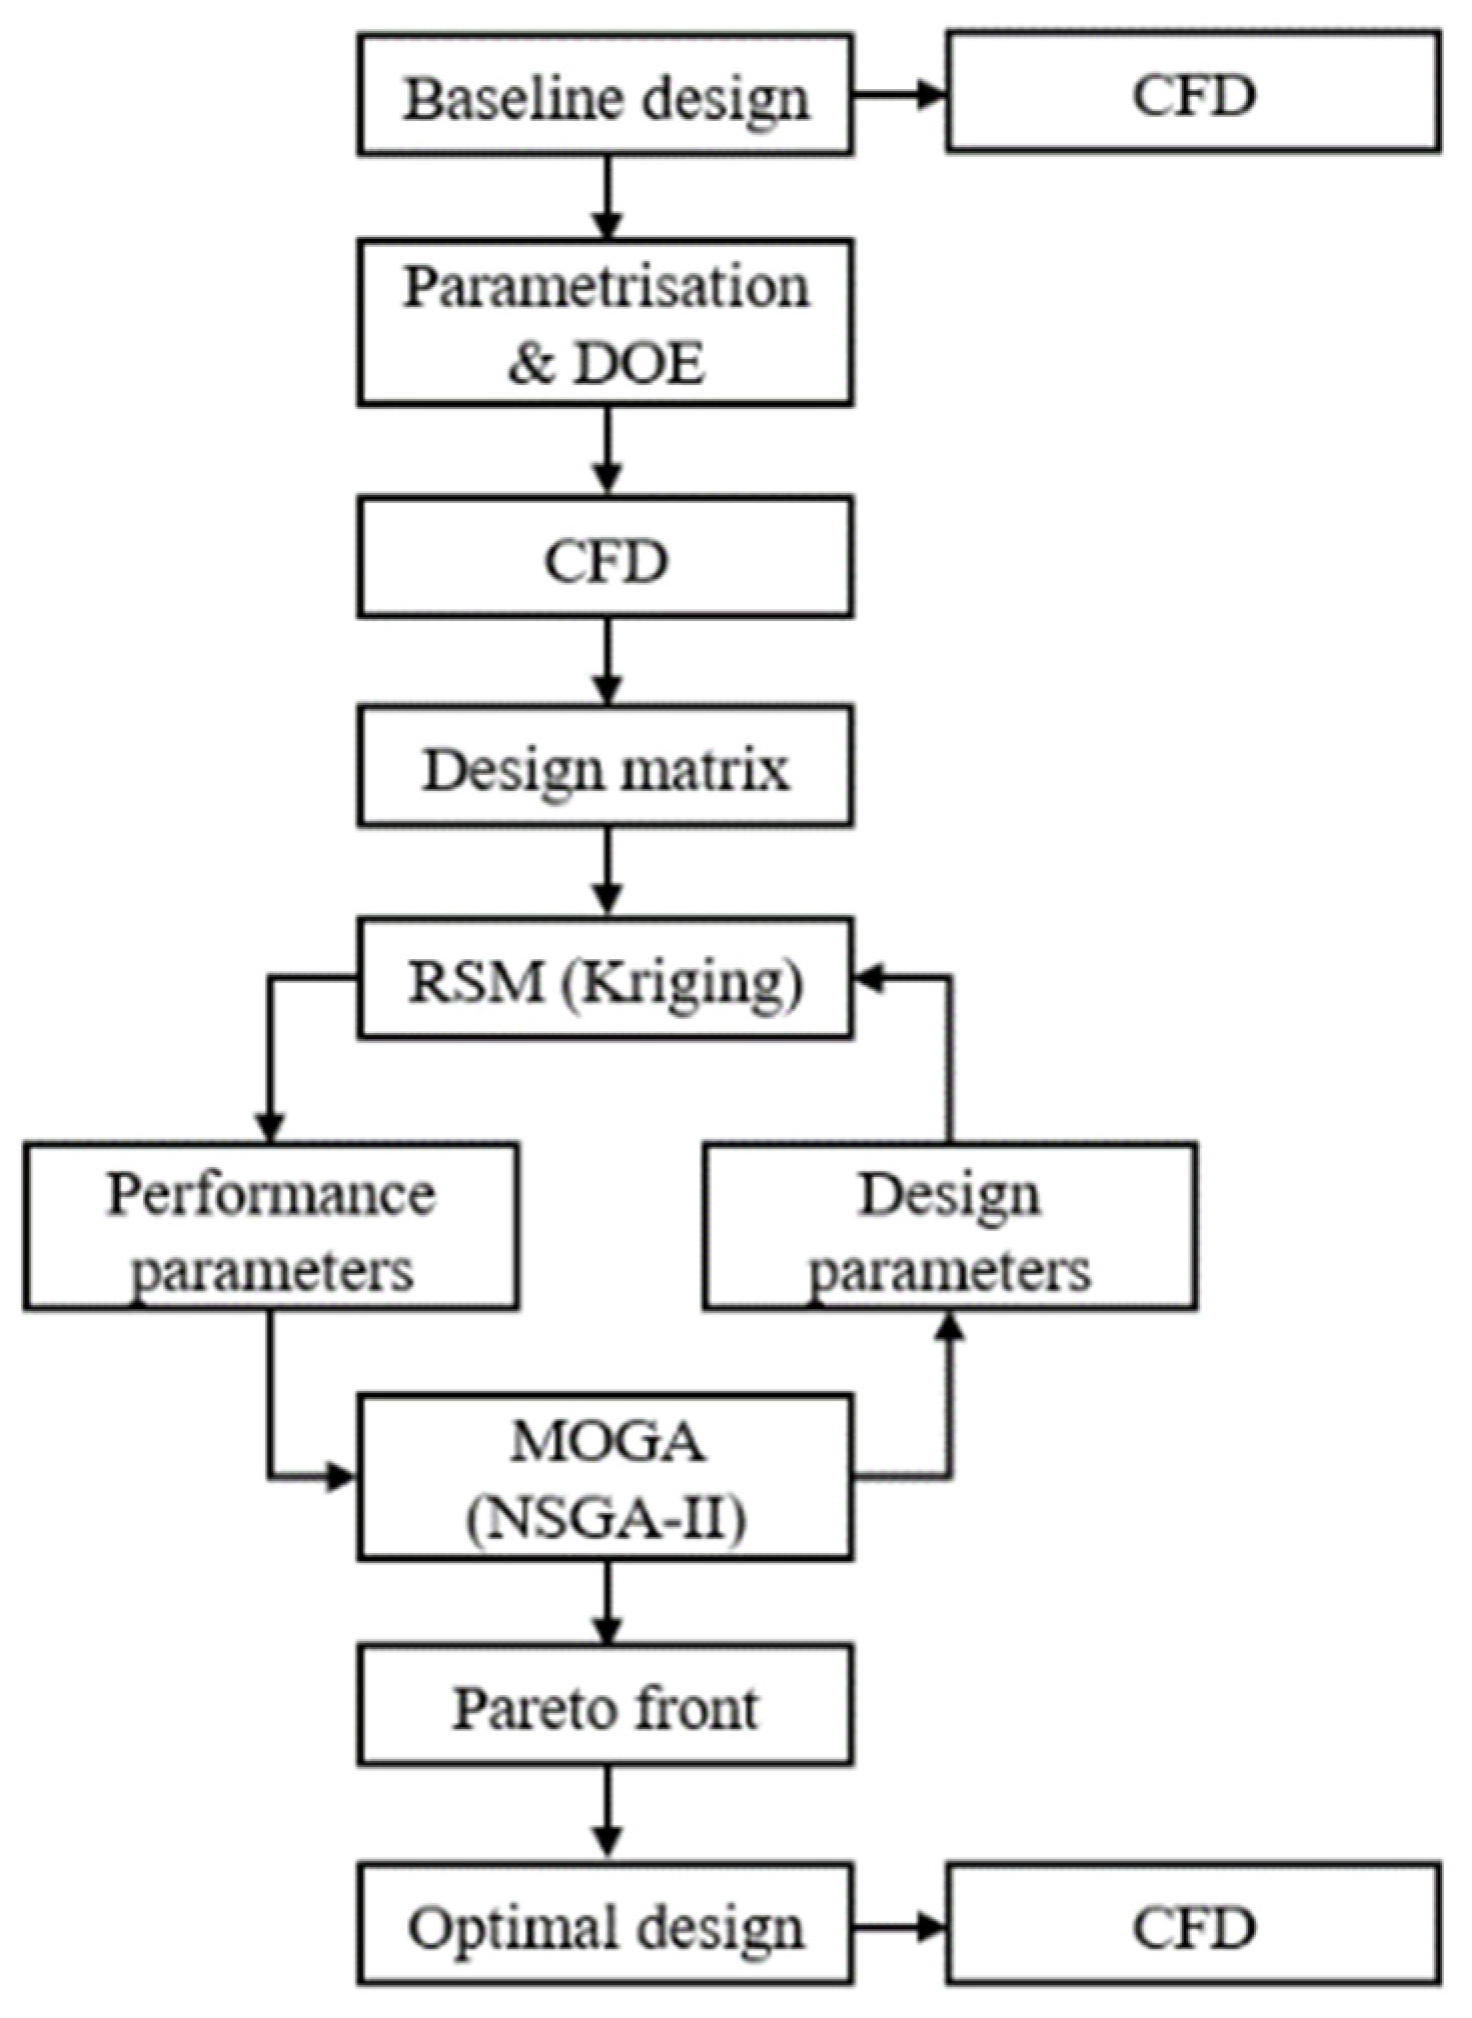
4. DOE and Optimization
4.1. DOE
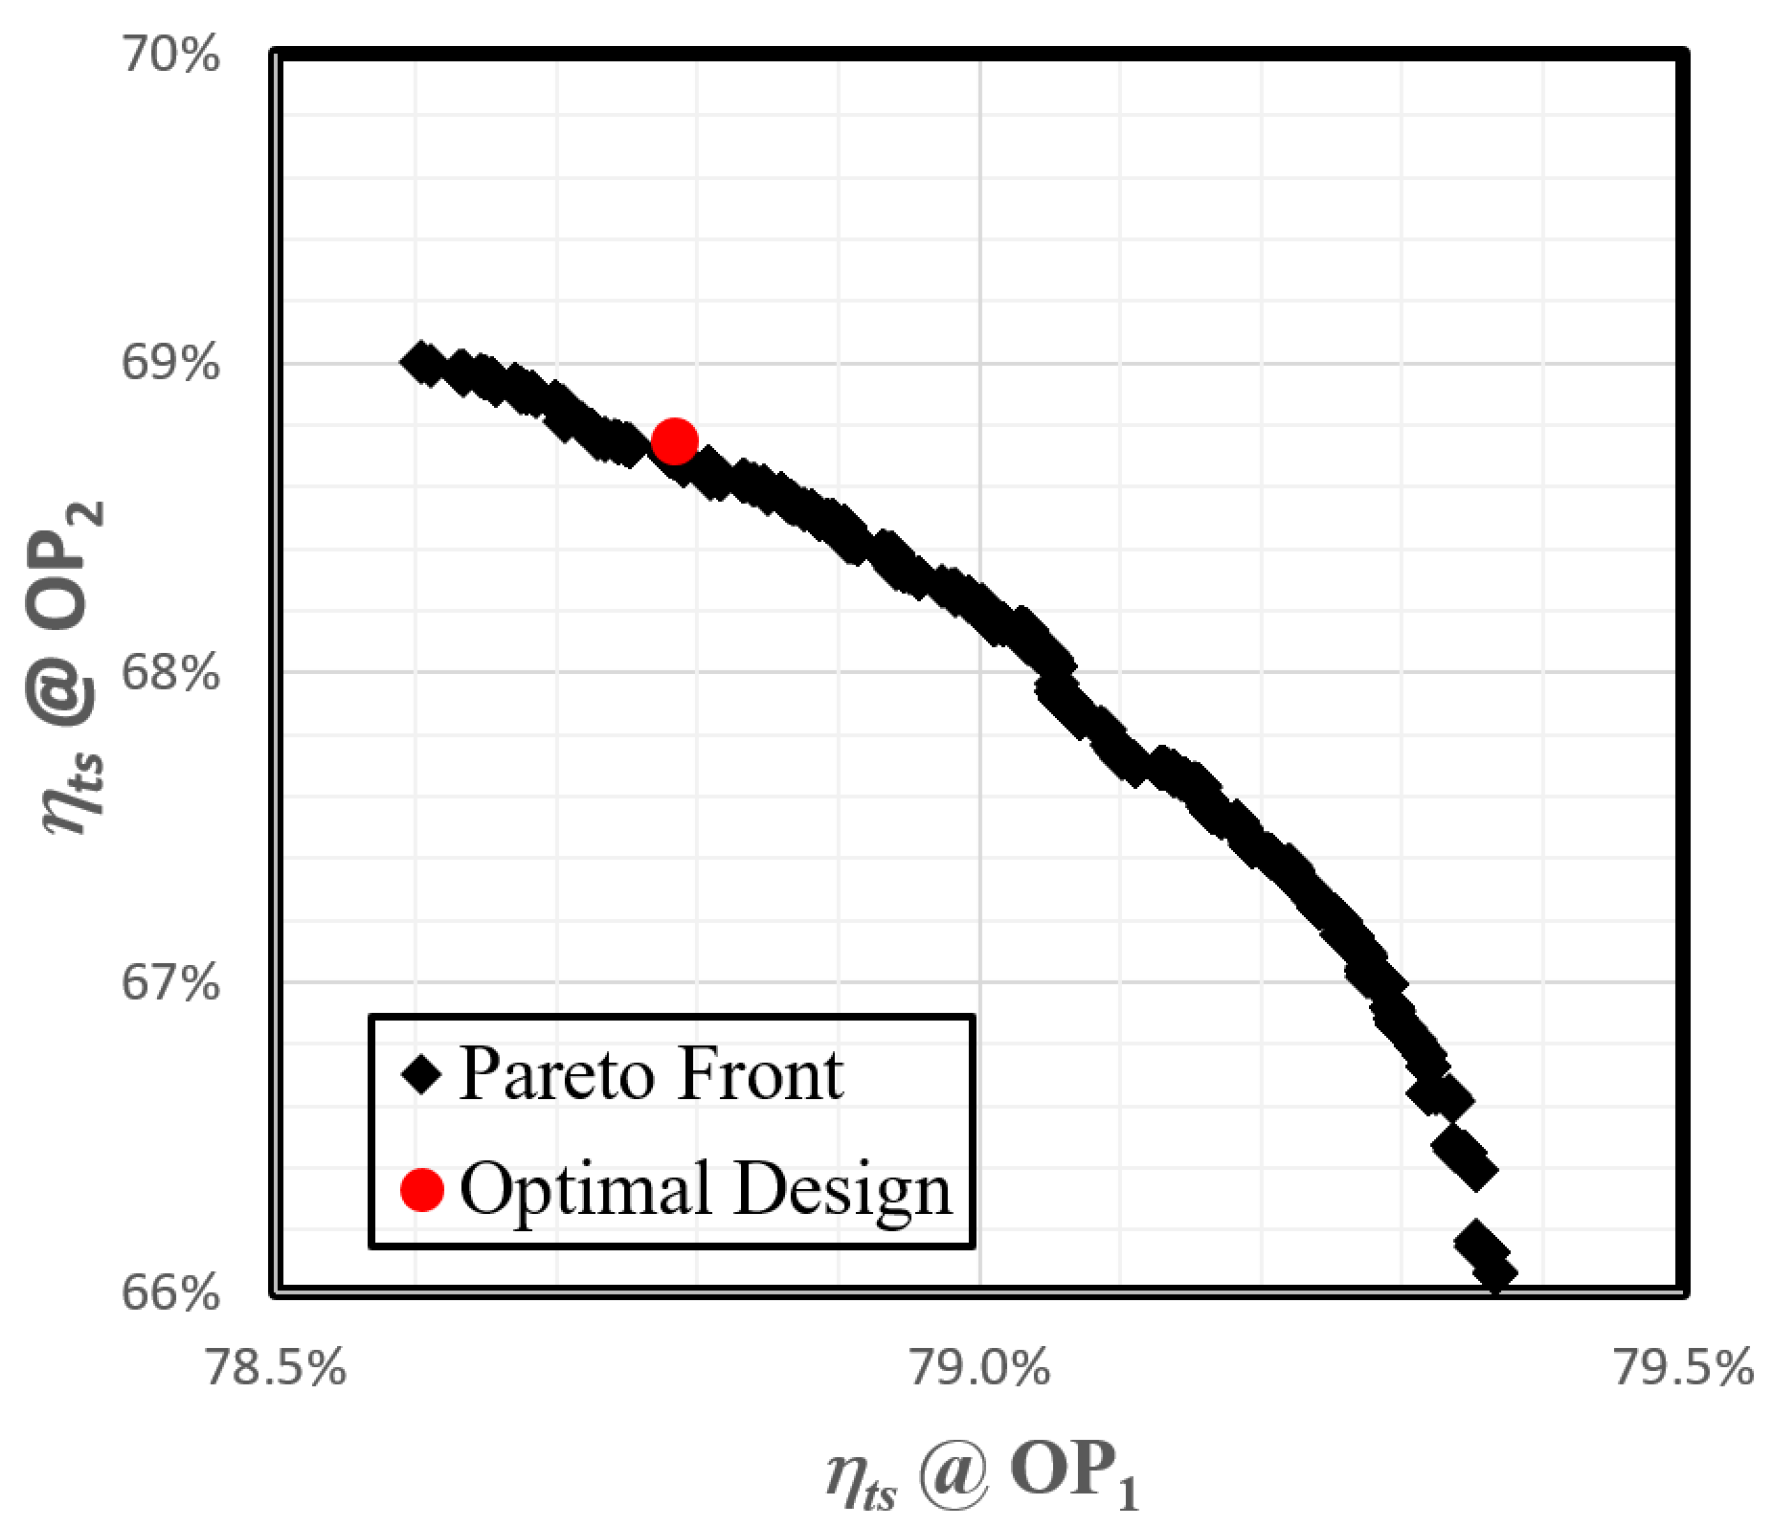
4.2. Optimization
5. Conclusions
Author Contributions
Funding
Institutional Review Board Statement
Informed Consent Statement
Data Availability Statement
Conflicts of Interest
References
- Jeon, W.-H.; Baek, S.-J.; Kim, C.-J. Analysis of the aeroacoustic characteristics of the centrifugal fan in a vacuum cleaner. J. Sound Vib. 2003, 268, 1025–1035. [Google Scholar] [CrossRef]
- Woodard, J.K., Jr.; Johnson, G.E. Optimal design of cooling fan for industrial electric motors. J. Mech. Transm. Autom. Des. 1986, 108, 224–266. [Google Scholar] [CrossRef]
- Rugang, C. Experimental study on erosion characteristic for different blade contours in the centrifugal fan exposed to solid particulate environment. Fluid Mach. 2000, 1, 5–8. [Google Scholar]
- Tan, J.; Tang, W.; Yuan, W. Optimizing technique of air-cooled engine centrifugal cooking fan test. Chin. Intern. Combust. Engine Eng. 2002, 1002–6819. [Google Scholar]
- Li, H. Flow driven by a stamped metal cooling fan—Numerical model and validation. Exp. Therm. Fluid Sci. 2009, 33, 683–694. [Google Scholar] [CrossRef]
- Chang, C.-C.; Cheng, C.-C.; Ke, M.-T.; Chen, S.-L. Experimental and numerical investigations of air cooling for a large-scale motor. Int. J. Rotating Mach. 2009, 2009, 34–40. [Google Scholar] [CrossRef] [Green Version]
- Hariharan, C.; Govardhan, M. Effect of inlet clearance on the aerodynamic performance of a centrifugal blower. Int. J. Turbo Jet Engines 2016, 33, 215–228. [Google Scholar] [CrossRef]
- Singh, O.P.; Khilwani, R.; Sreenivasulu, T.; Kannan, M. Parametric Study of Centrifugal Fan Performance: Experiments and Numerical Simulation. Int. J. Adv. Eng. Technol. 2011, 1, 33–50. [Google Scholar]
- Jeon, W.-H. A numerical study on the effects of design parameters on the performance and noise of a centrifugal fan. J. Sound Vib. 2003, 265, 221–230. [Google Scholar] [CrossRef]
- Pei, J.; Wang, W.; Yuan, S.; Zhang, J. Optimization on the Impeller of a Low-specific-speed centrifugal Pump for hydraulic Performance Improvement. Chin. J. Mech. Eng. 2016, 29, 992–1002. [Google Scholar] [CrossRef]
- Zhang, J.; Zangeneh, M. Multidisciplinary and multi-point optimisation of radial and mixed-inflow turbines for turbochargers using 3D inverse design method. In The 14th International Conference on Turbochargers and Turbocharging; CRC Press: London, UK, 2020. [Google Scholar]
- Tuchler, S.; Chen, Z.; Copeland, C.D. Multipoint shape optimisation of an automotive radial compressor using a coupled computational fluid dynamics and genetic algorithm approach. Energy 2018, 165, 543–561. [Google Scholar] [CrossRef]
- Behzadmehr, A.; Piaud, J.B. Aero-Acoustical Effects of Some Parameters of a Backward-Curved Centrifugal Fan Using DOE. HVAC&R Res. 2006, 12, 353–365. [Google Scholar]
- Qiu, S.; Deng, X. Multi-point design Optimization of a High Bypass Ratio Fan Blade. In Proceedings of the 30th Congress of the International Council of the Aeronautical Sciences, Daejeon, Republic of Korea, 25–30 September 2016. [Google Scholar]
- Zangeneh, M. A compressible three-dimensional design method for radial and mixed flow turbomachinery blades. Int. J. Numer. Methods Fluids 1991, 13, 599–624. [Google Scholar] [CrossRef]
- Okamoto, H.; Zangeneh, M.; Watanabe, H.; Goto, A. Design of a box fan rotor using 3-D inverse design method. In Proceedings of the IMechE International Conference on Fans, London, UK, 9–10 November 2004. [Google Scholar]
- Henner, M.; Neddadi, Y.; Demory, B.; Zangeneh, M.; Pemgie, F. Automotive blower design with inverse method applied on wheel and volute. In Proceedings of the Fan 2015, International Conference on Fan Noise, Technology and Numerical Methods, Lyon, France, 15–17 April 2015. [Google Scholar]
- Eisenmenger, C.; Frank, S.; Dogan, H.; Ochmann, M. Aerodynamic and aeroacoustic optimization of a small centrifugal fan with backward-curved blades by means of inverse design. In Proceedings of the 23rd International Congress on Acoustics, Aachen, Germany, 9–13 September 2019. [Google Scholar]
- Park, J.-S. Optimal Latin-hypercube designs for computer experiments. J. Stat. Plan. Inference 1994, 39, 95–111. [Google Scholar] [CrossRef]
- Chung, H.-S.; Alonso, J.J. Multiobjective Optimization using Approximation Model-based Genetic Algorithm. In Proceedings of the 10th AIAA/ISSMO Symposium on Multidisciplinary Analysis and Optimization, Albany, NY, USA, 30 August–1 September 2004. [Google Scholar]
- Siller, K.; Vob, S.; Nicke, E. Automated Multidisciplinary Optimization of A Transonic Axial Compressor. In Proceedings of the 47th AIAA Aerospace Science Meeting including the New Horizons Forum and Aerospace Exposition, Orlando, FL, USA, 5–8 January 2009. [Google Scholar]
- Deb, K.; Agrawal, S.; Pratap, A.; Meyarivan, T. A Fast Elitist Non-dominated Sorting Genetic Algorithm for Multi-objective Optimization: NSGA-II. In Proceedings of the Parallel Problem Solving from Nature VI Conference, Paris, France, 18–20 September 2000; pp. 849–858. [Google Scholar]


| Flow Coefficient Loading Coefficient RPM | 0.22 0.39 ≤RPMmax |
|---|---|
| Volume flow rate @ OP1 | Q1 |
| Pressure rise @ OP1 | ≥Δp1 |
| Volume flow rate @ OP2 | Q2 = 117%Q1 |
| Pressure rise @ OP2 | ≥Δp2 |
| Torque | ≤τmax |
| Efficiency @ OP1 | Maximize |
| Efficiency @ OP2 | Maximize |
| Impeller diameter | ≥Dmax |
| Blade | 2D and axial filament |
| Variable Name | OP1 | OP2 |
|---|---|---|
| RPM | RPMmax | RPMmax |
| Q | Q1 | Q2 |
| Δpts | 0.99 Δp1 | 0.94 Δp2 |
| τ | τmax | 0.91τmax |
| ηts | 57.7% | 44.2% |
| Δp @ OP1 | ≥Δp1 |
| Δp @ OP2 | ≥Δp2 |
| τ @ OP1 | ≥τmax |
| τ @ OP2 | ≥τmax |
| Angle | ≥−5.5° & ≤−4.9° |
| ηts @ OP1 | Maximize |
| ηts @ OP2 | Maximize |
Disclaimer/Publisher’s Note: The statements, opinions and data contained in all publications are solely those of the individual author(s) and contributor(s) and not of MDPI and/or the editor(s). MDPI and/or the editor(s) disclaim responsibility for any injury to people or property resulting from any ideas, methods, instructions or products referred to in the content. |
© 2023 by the authors. Licensee MDPI, Basel, Switzerland. This article is an open access article distributed under the terms and conditions of the Creative Commons Attribution (CC BY-NC-ND) license (https://creativecommons.org/licenses/by-nc-nd/4.0/).
Share and Cite
Zhang, J.; Zangeneh, M. Multi-Point, Multi-Objective Optimisation of Centrifugal Fans by 3D Inverse Design Method. Int. J. Turbomach. Propuls. Power 2023, 8, 8. https://doi.org/10.3390/ijtpp8010008
Zhang J, Zangeneh M. Multi-Point, Multi-Objective Optimisation of Centrifugal Fans by 3D Inverse Design Method. International Journal of Turbomachinery, Propulsion and Power. 2023; 8(1):8. https://doi.org/10.3390/ijtpp8010008
Chicago/Turabian StyleZhang, Jiangnan, and Mehrdad Zangeneh. 2023. "Multi-Point, Multi-Objective Optimisation of Centrifugal Fans by 3D Inverse Design Method" International Journal of Turbomachinery, Propulsion and Power 8, no. 1: 8. https://doi.org/10.3390/ijtpp8010008