

Enhancing Calculus Learning through Interactive VR and AR Technologies: A Study on Immersive Educational Tools

Abstract
:1. Introduction
- Improved Information Retention: While a study of high school Philosophy students using a VR environment showed significant improvements in information retention, studies have shown a far more impressive, far-reaching field in which such environments have improved memory: Treating dementia and traumatic brain injuries [5]. Such retention improvements appear more prevalent in VR environments [6], yet, due to the clear difficulties of using VR in a standard classroom environment, AR may be used in less individualized cases. Additional studies have found similar benefits, particularly in the field of learning languages [7].
- Enhanced Visualization Abilities: As previously mentioned, AR/VR significantly improves students’ ability to visualize complex concepts. Beyond the aforementioned retention advantages, one study found that strictly spatial and temporal relationships are remembered 40% more effectively in AR/VR environments [5]. These benefits are likely due to the feeling of physically being in the environment, also known as spatial presence [6]. However, in some cases, these advantages are granted by allowing users to see what they simply cannot; AR’s many applications in surgery, particularly overlaying intraoperative imaging techniques over the patient, have given surgeons the ability to see into the patient without having to constantly reference a separate monitor. These techniques have been suggested for training surgeons, so patients may be put at lower risk of complications [8,9]. While that is, of course, a radically different field, the notion of simply allowing students to see what they otherwise can’t applies. Other studies have found similar results [2].
- Increased Student Attention and Motivation: One study reported an average score of 4/5 regarding student attention within engineering courses, which is exceptionally high given the common pedagogical struggles within said field [1]. Due to their often-game-like nature, AR/VR environments seem to universally improve student motivation, likely due to simply being more enjoyable [6,7]. In other examples, significant improvements were found among students on the autism spectrum [5]. Additional studies have found similar results for various populations [6,9,10,11].
- Improved Student Outcomes and Success Rates: Direct and notable improvements in student performance and success rates across various fields have been observed as a result of implementing these technologies [2,7,10,12]. In some cases, this is tied directly to the self-driven learning valued by constructivist pedagogy [5].
- Facilitated Access to Psychological ‘Flow’ State: Easier access to the psychological “flow” state, a mental state of deep immersion and focused concentration, paired with reduced cognitive load, despite the improvements as mentioned above [11].
Related Works
- Construct3D [17] and a related project, Physics Playground [18]. Both projects were developed circa 2008. While Construct3D was an extremely interactive AR tool aimed at teaching students geometry and included a tool to create simple solids of revolution, Physics Playground was effectively an AR interface for running simple physics simulations. While extremely impressive for the time, it is unlikely the project would be reasonably ported to modern hardware [17].
- An unnamed, recently developed project [19], which cites Construct3D as an inspiration, enabled the creation of arbitrary cross-sections of solids of revolution. However, its functionality had some ambiguities and offered limited student interactivity.
- AVRAM and ARC [20]. Somewhat combining the approaches of Construct3D and the previously mentioned unnamed project, these two projects provide, respectively, a synchronized 3D graphing software in which students can work together to manipulate and understand a particular 3D solid, and an AR implementation of several classes of problems, including polar coordinates and quadric surfaces. However, these two functionalities are split, and, while this study’s tool is in early development and requires far more features to match ARC’s, ARC seems to take a less procedural approach, making modules for each functionality separately. In the future, the current tool seeks to avoid this by generalizing each functionality as much as possible.
- Manim, an exceptionally powerful mathematics animation engine created by Grant Sanderson [21]. The visualizations produced by the engine have proven extremely useful, not only for Sanderson’s YouTube channel, 3Blue1Brown [22,23,24], but multiple academic circumstances, including the visualization of error theory [25], general mathematics [26], and machine learning courses at the authors’ host university. Although not an AR tool, the clarity and effectiveness of Manim’s visualizations set a high standard for AR projects in educational contexts.
2. Materials and Methods
2.1. Implementation
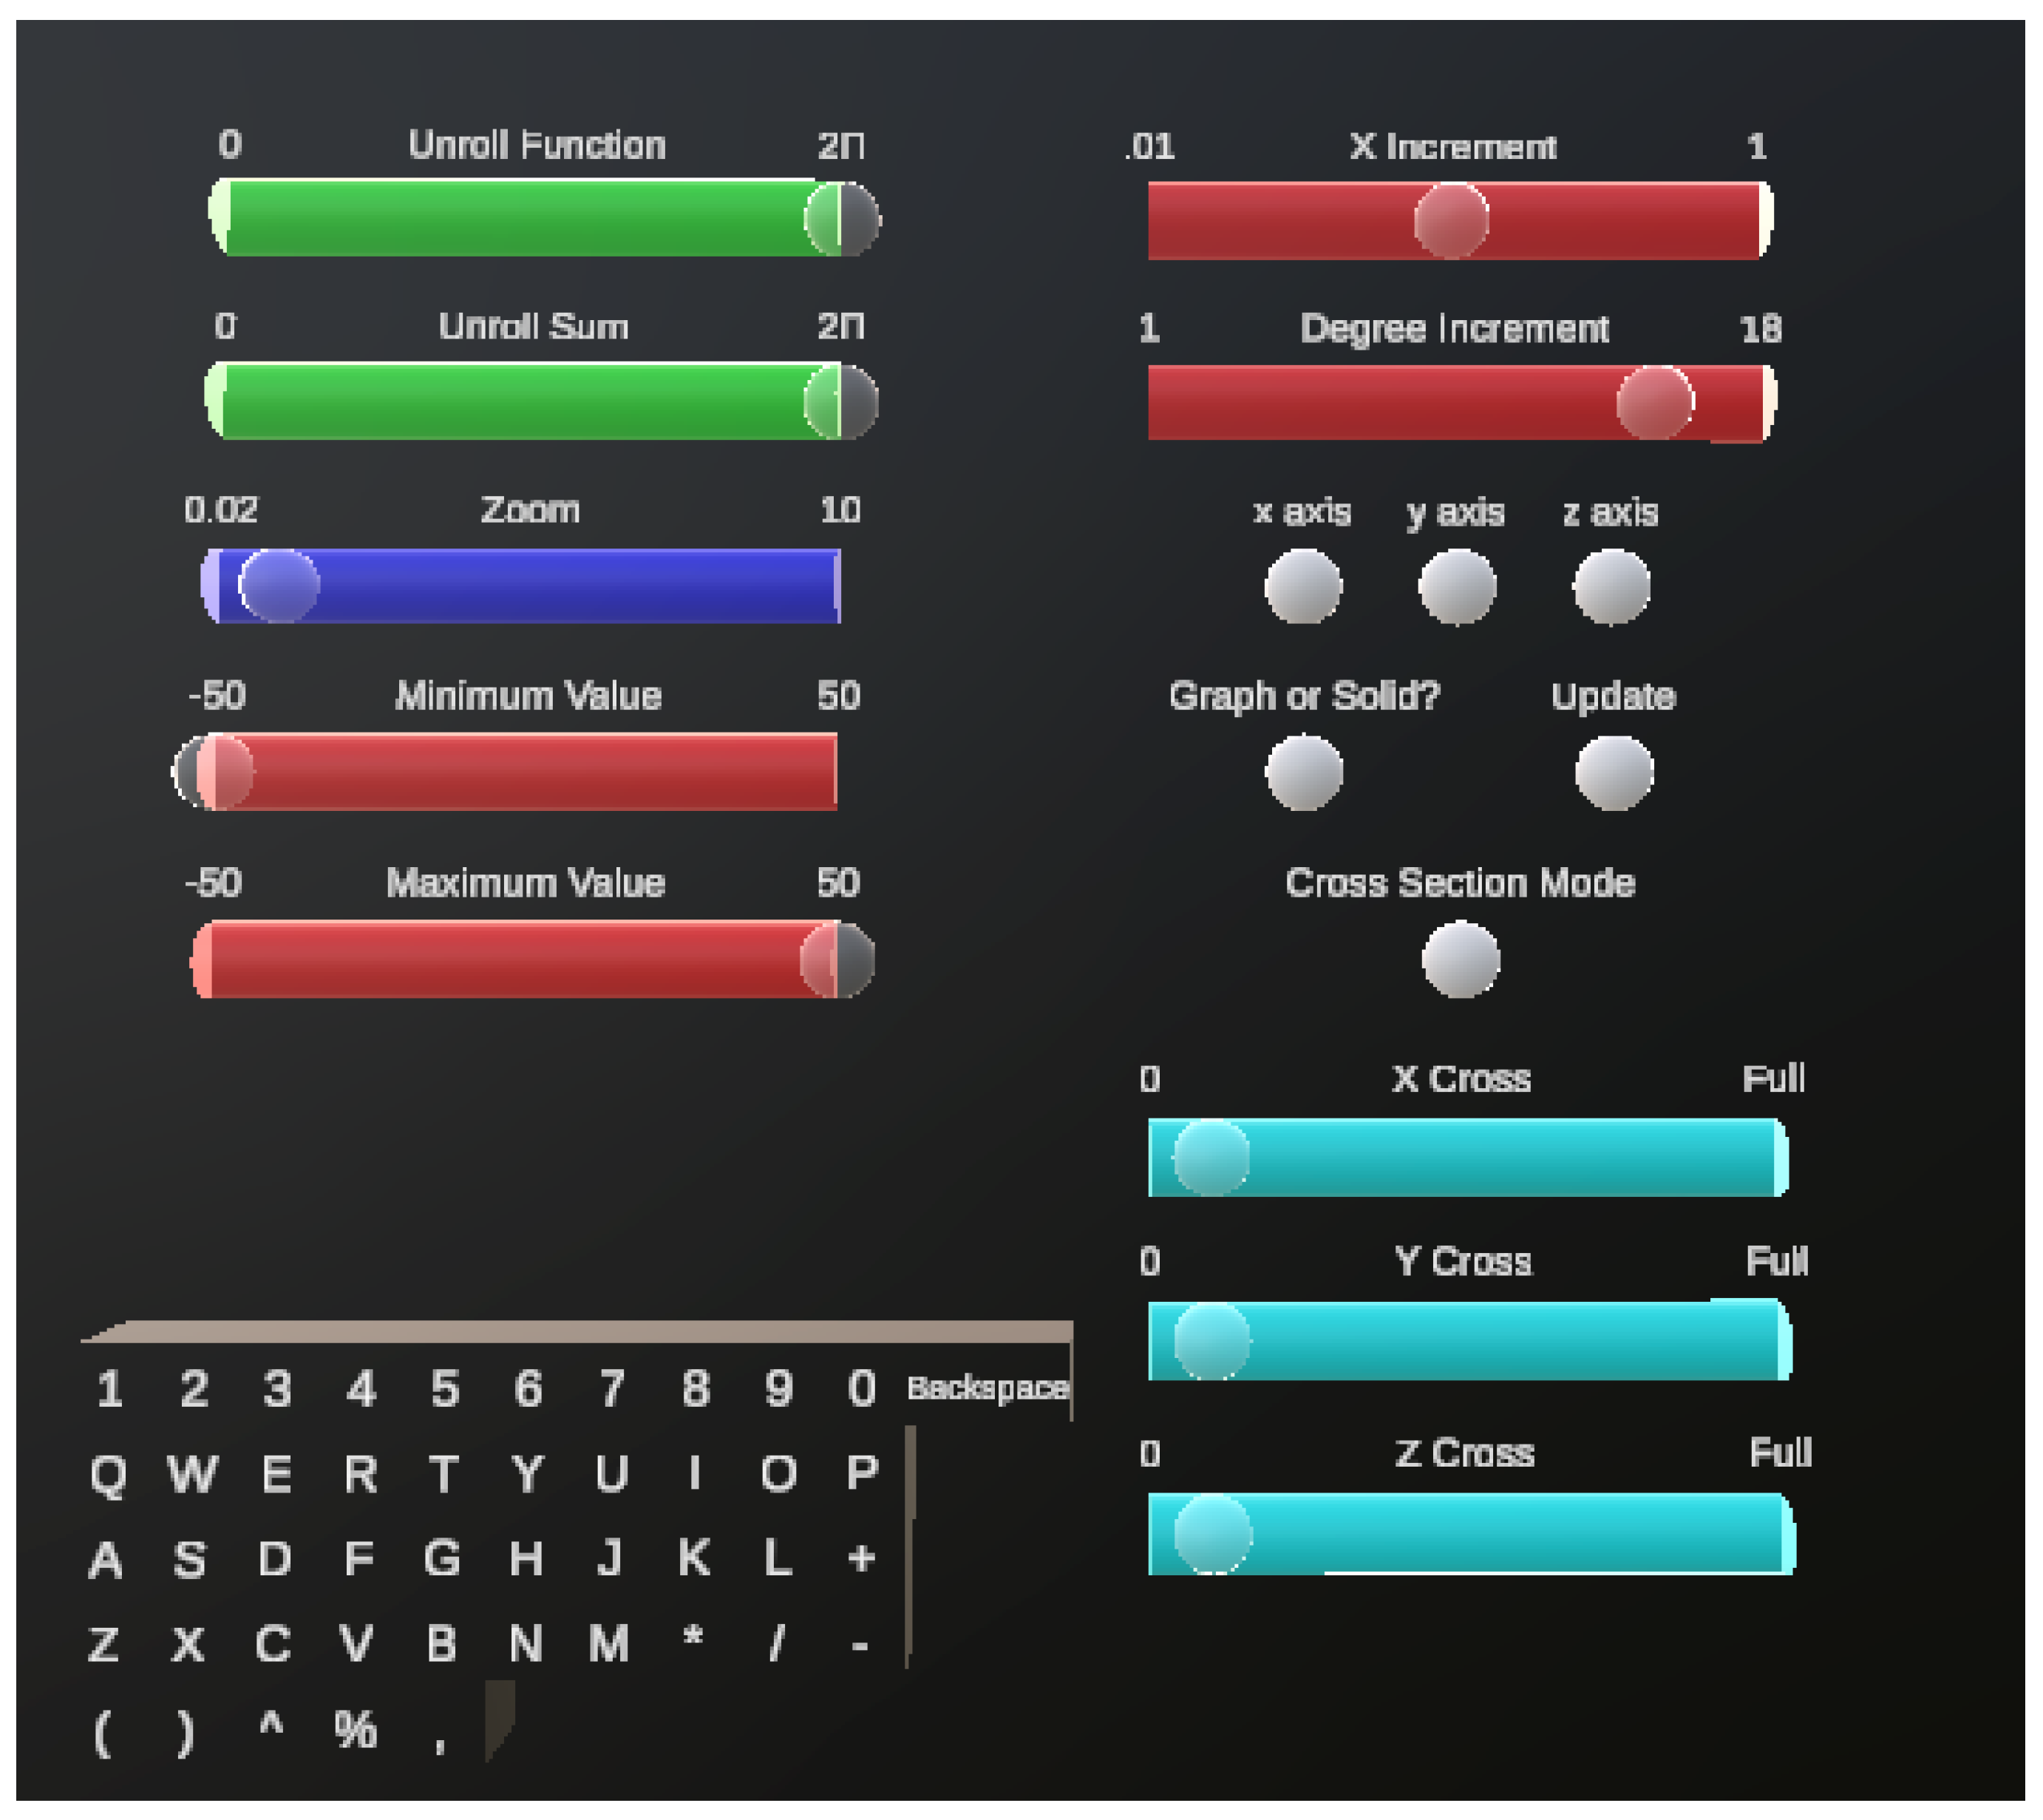
2.1.1. Extended UI Implementation
- Unroll Function—This slider causes the solid of revolution displayed to “unroll”, displaying a subsection of the solid from 0 to the selected value in radians
- Unroll Sum—This slider is similar to Unroll Function, but “unrolls” the Riemann sum underlying the solid of revolution
- Zoom—This slider allows you to zoom in and out of the function at the origin
- Minimum Value—This slider determines the minimum value of X at which the function will be evaluated (Must be less than Maximum Value)
- Maximum Value—This slider determines the maximum value of X at which the function will be evaluated (Must be greater than Minimum Value)
- Keyboard—No tooltip provided: Used to input function desired
- X Increment—This slider controls the “steps” along the X axis at which the function will be evaluated. For example, a function with a minimum of 0, maximum of 1, and increment of 0.5, will be evaluated at 0, 0.5, and 1
- Degree Increment—This slider controls the “steps” used to rotate around the given axis when generating a solid of revolution, in degrees. For example, a function with a degree increment of 18 will evaluate the solid at 0°, 18°, 36°, etc.
- Axis Buttons—These buttons will set the solid of rotation to be around the given axis
- Graph or Solid?—If this button is grey, a solid of revolution will be generated. If not, a standard 2D graph will be generated
- Update—When activated, this button generates the function you have input
- Cross Section Mode—This button determines whether the entire graph will be visualized, or only a cross section around the teal ball located near this panel
- Cross Sliders—These sliders control the size of the cross section (when enabled) in the given axis
2.1.2. Procedural Mesh Generation
- Minimum and Maximum value, Alongside X Increment: Determine the fidelity of the graph along the X axis. These values may be mapped to the following code snippet, used to generate the X values at which the function is sampled:for(float x = Minimum Value;x <= Maximum Value;x += X increment)
- Degree Increment: Determines the fidelity of the solid of revolution by controlling the angles around a circle at which the solid is sampled, in degrees. This may be mapped to the following code snippet:for(float angle = 0;angle <= 360;angle += Degree Increment)
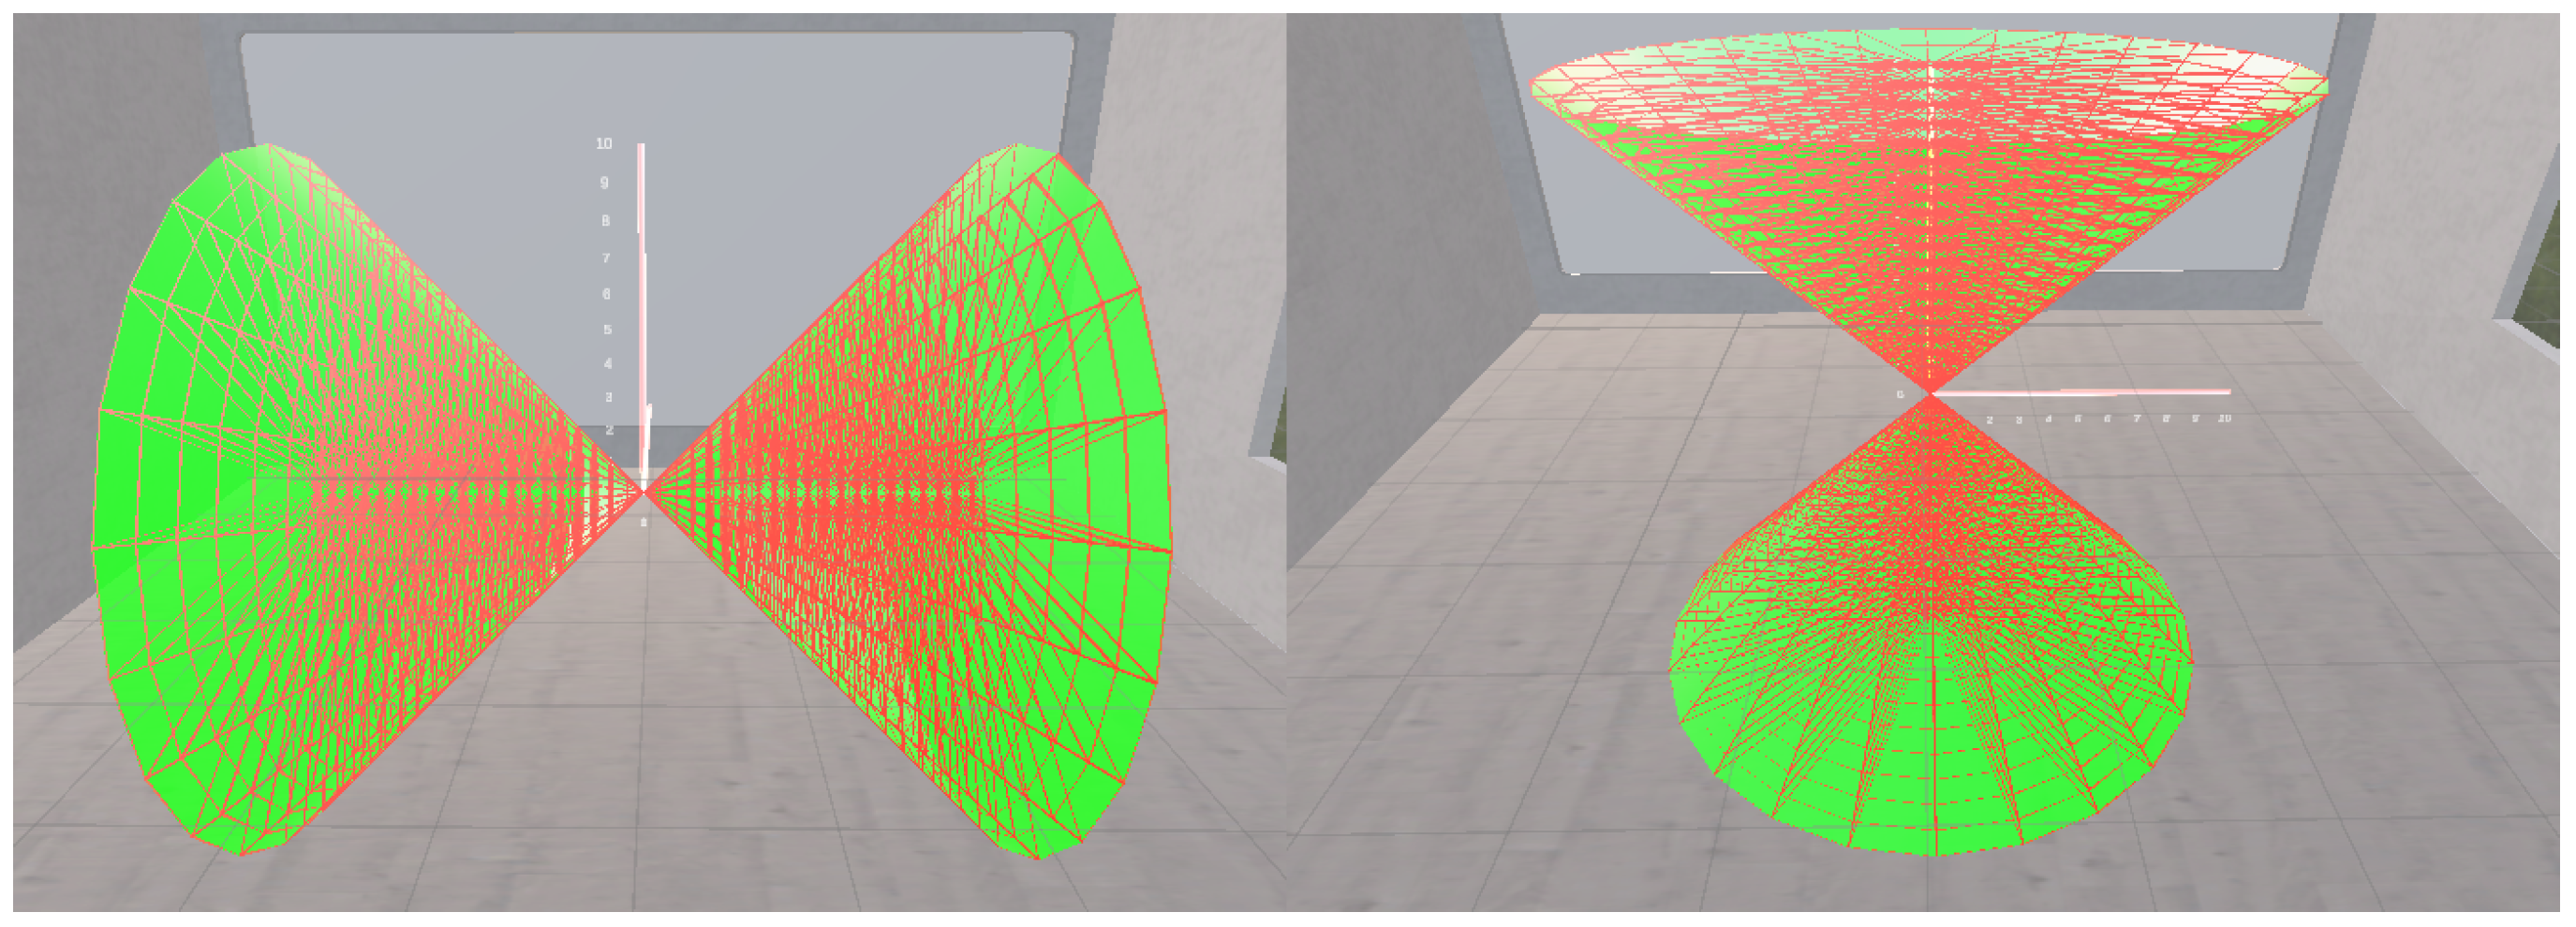
- X, Y, and Z Axis Buttons: Determines the axis along which the solid of revolution is generated, as seen in Figure 3. The inclusion of the Z-axis in the tool is mainly for demonstration purposes.
2.1.3. Underlying Riemann Sum Visualization
- The corresponding vertex on the previous ring of the solid of revolution
- The vertex itself
- The vertex’s component along the axis chosen for the solid of revolution
- The vertex itself, once more
- The next vertex along the ring in which the vertex is placed, rotating clockwise
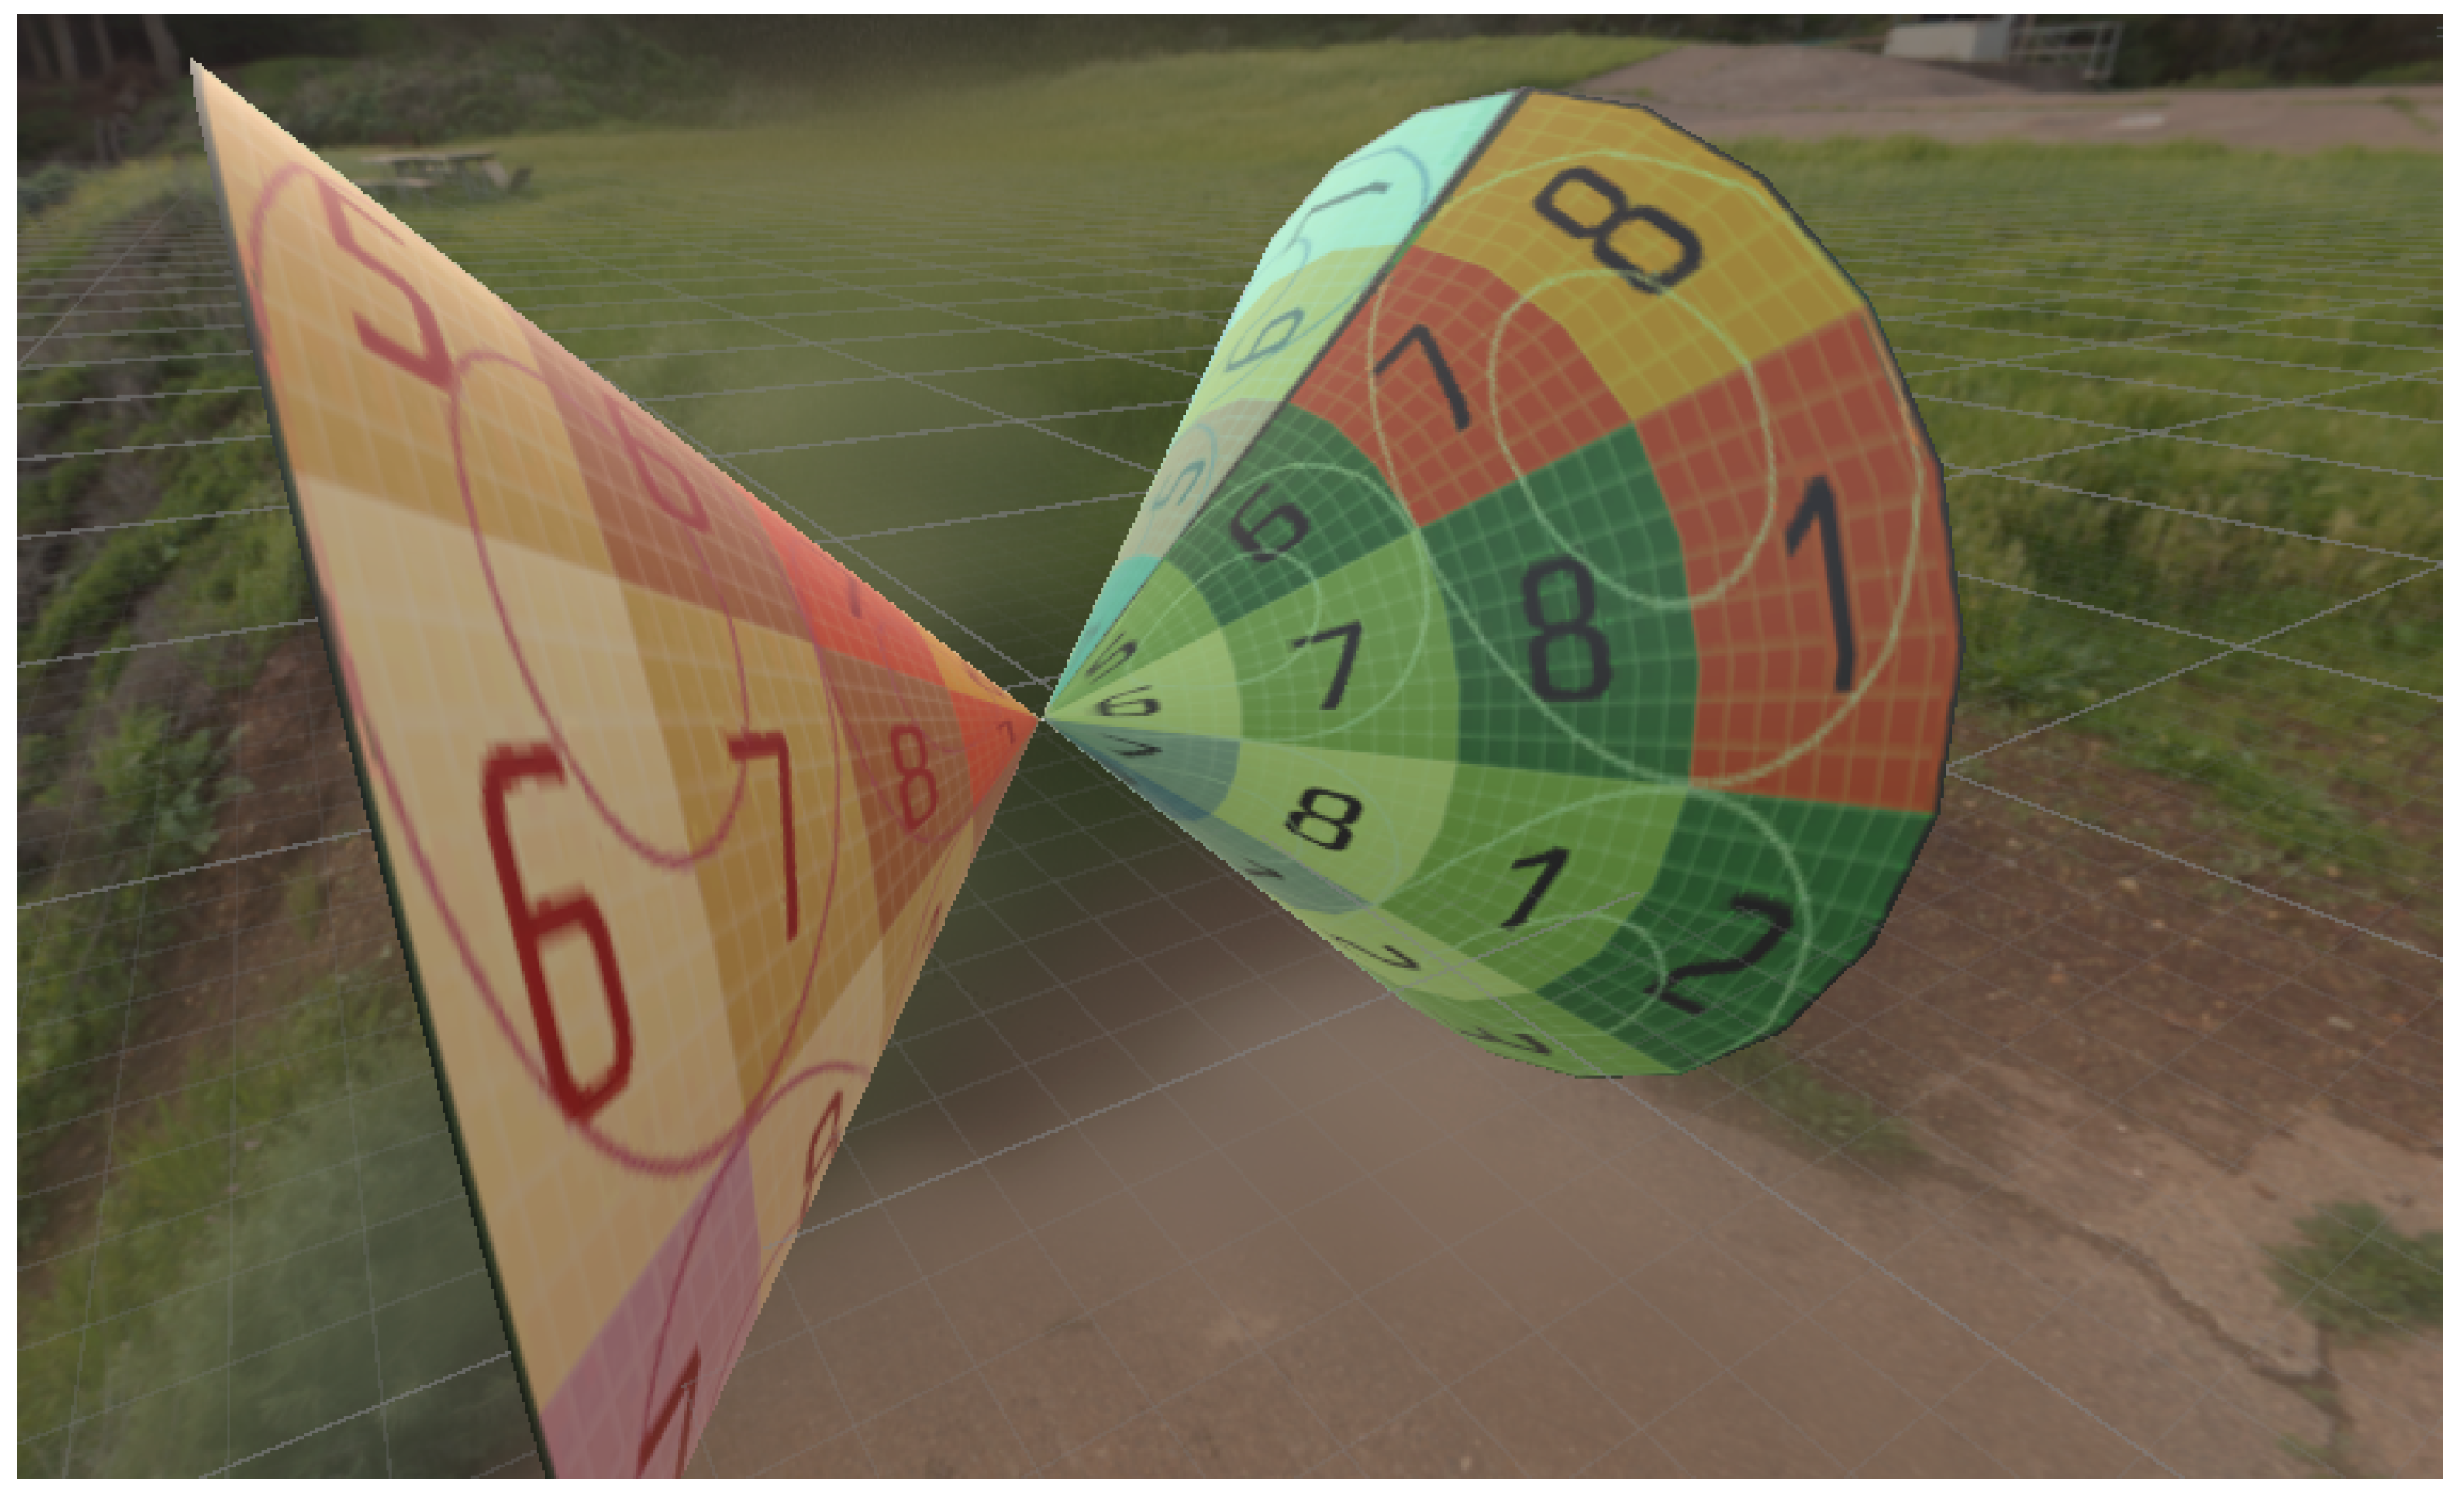
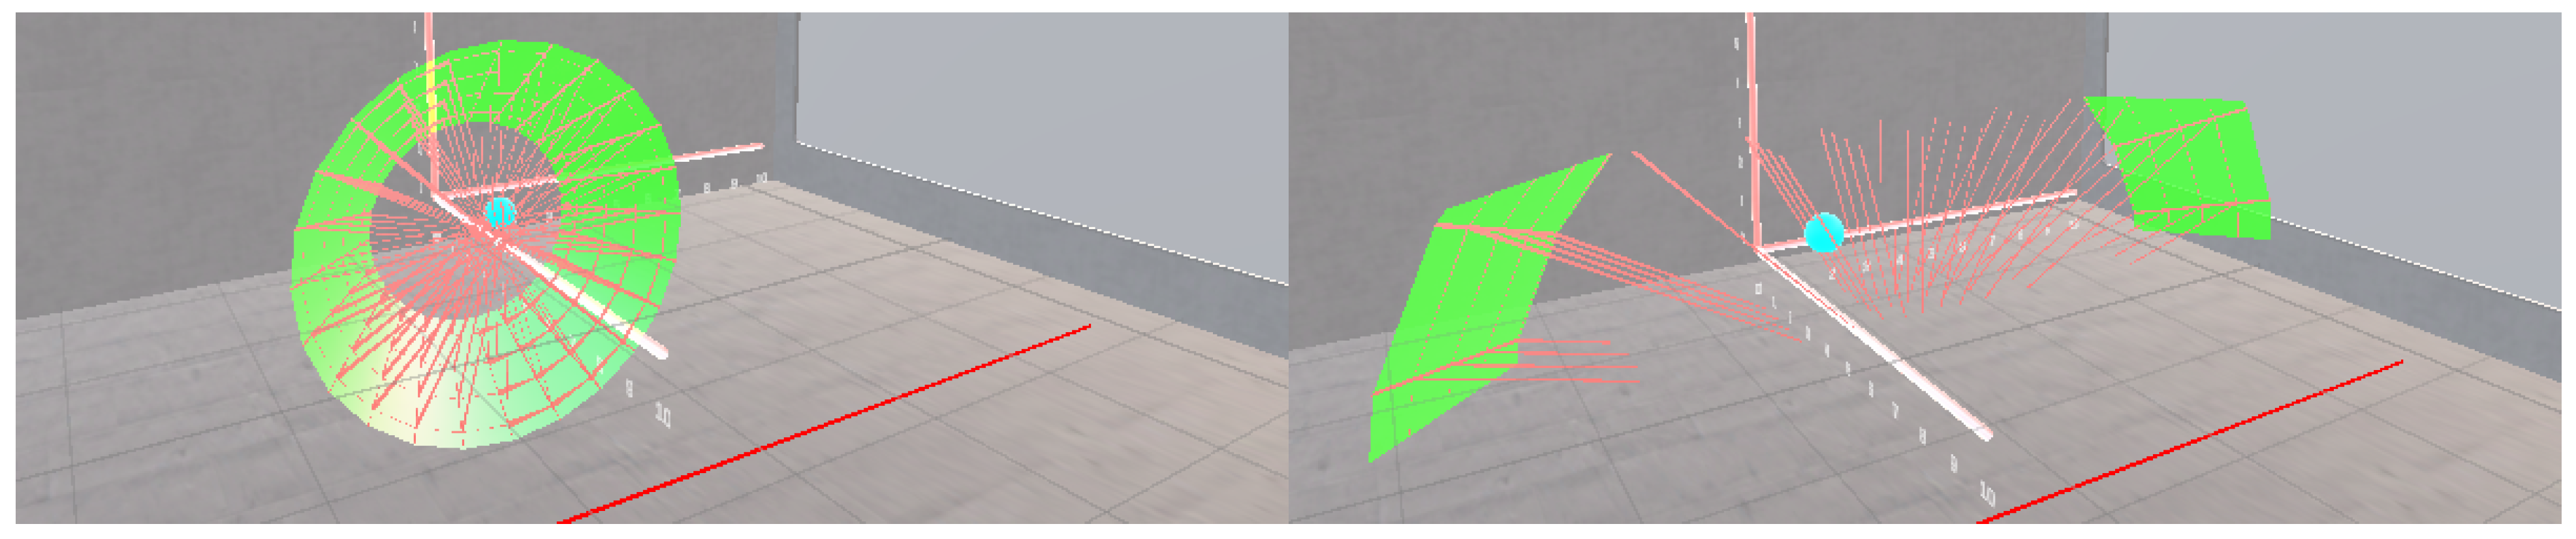
2.1.4. “Unrolling” Visualization
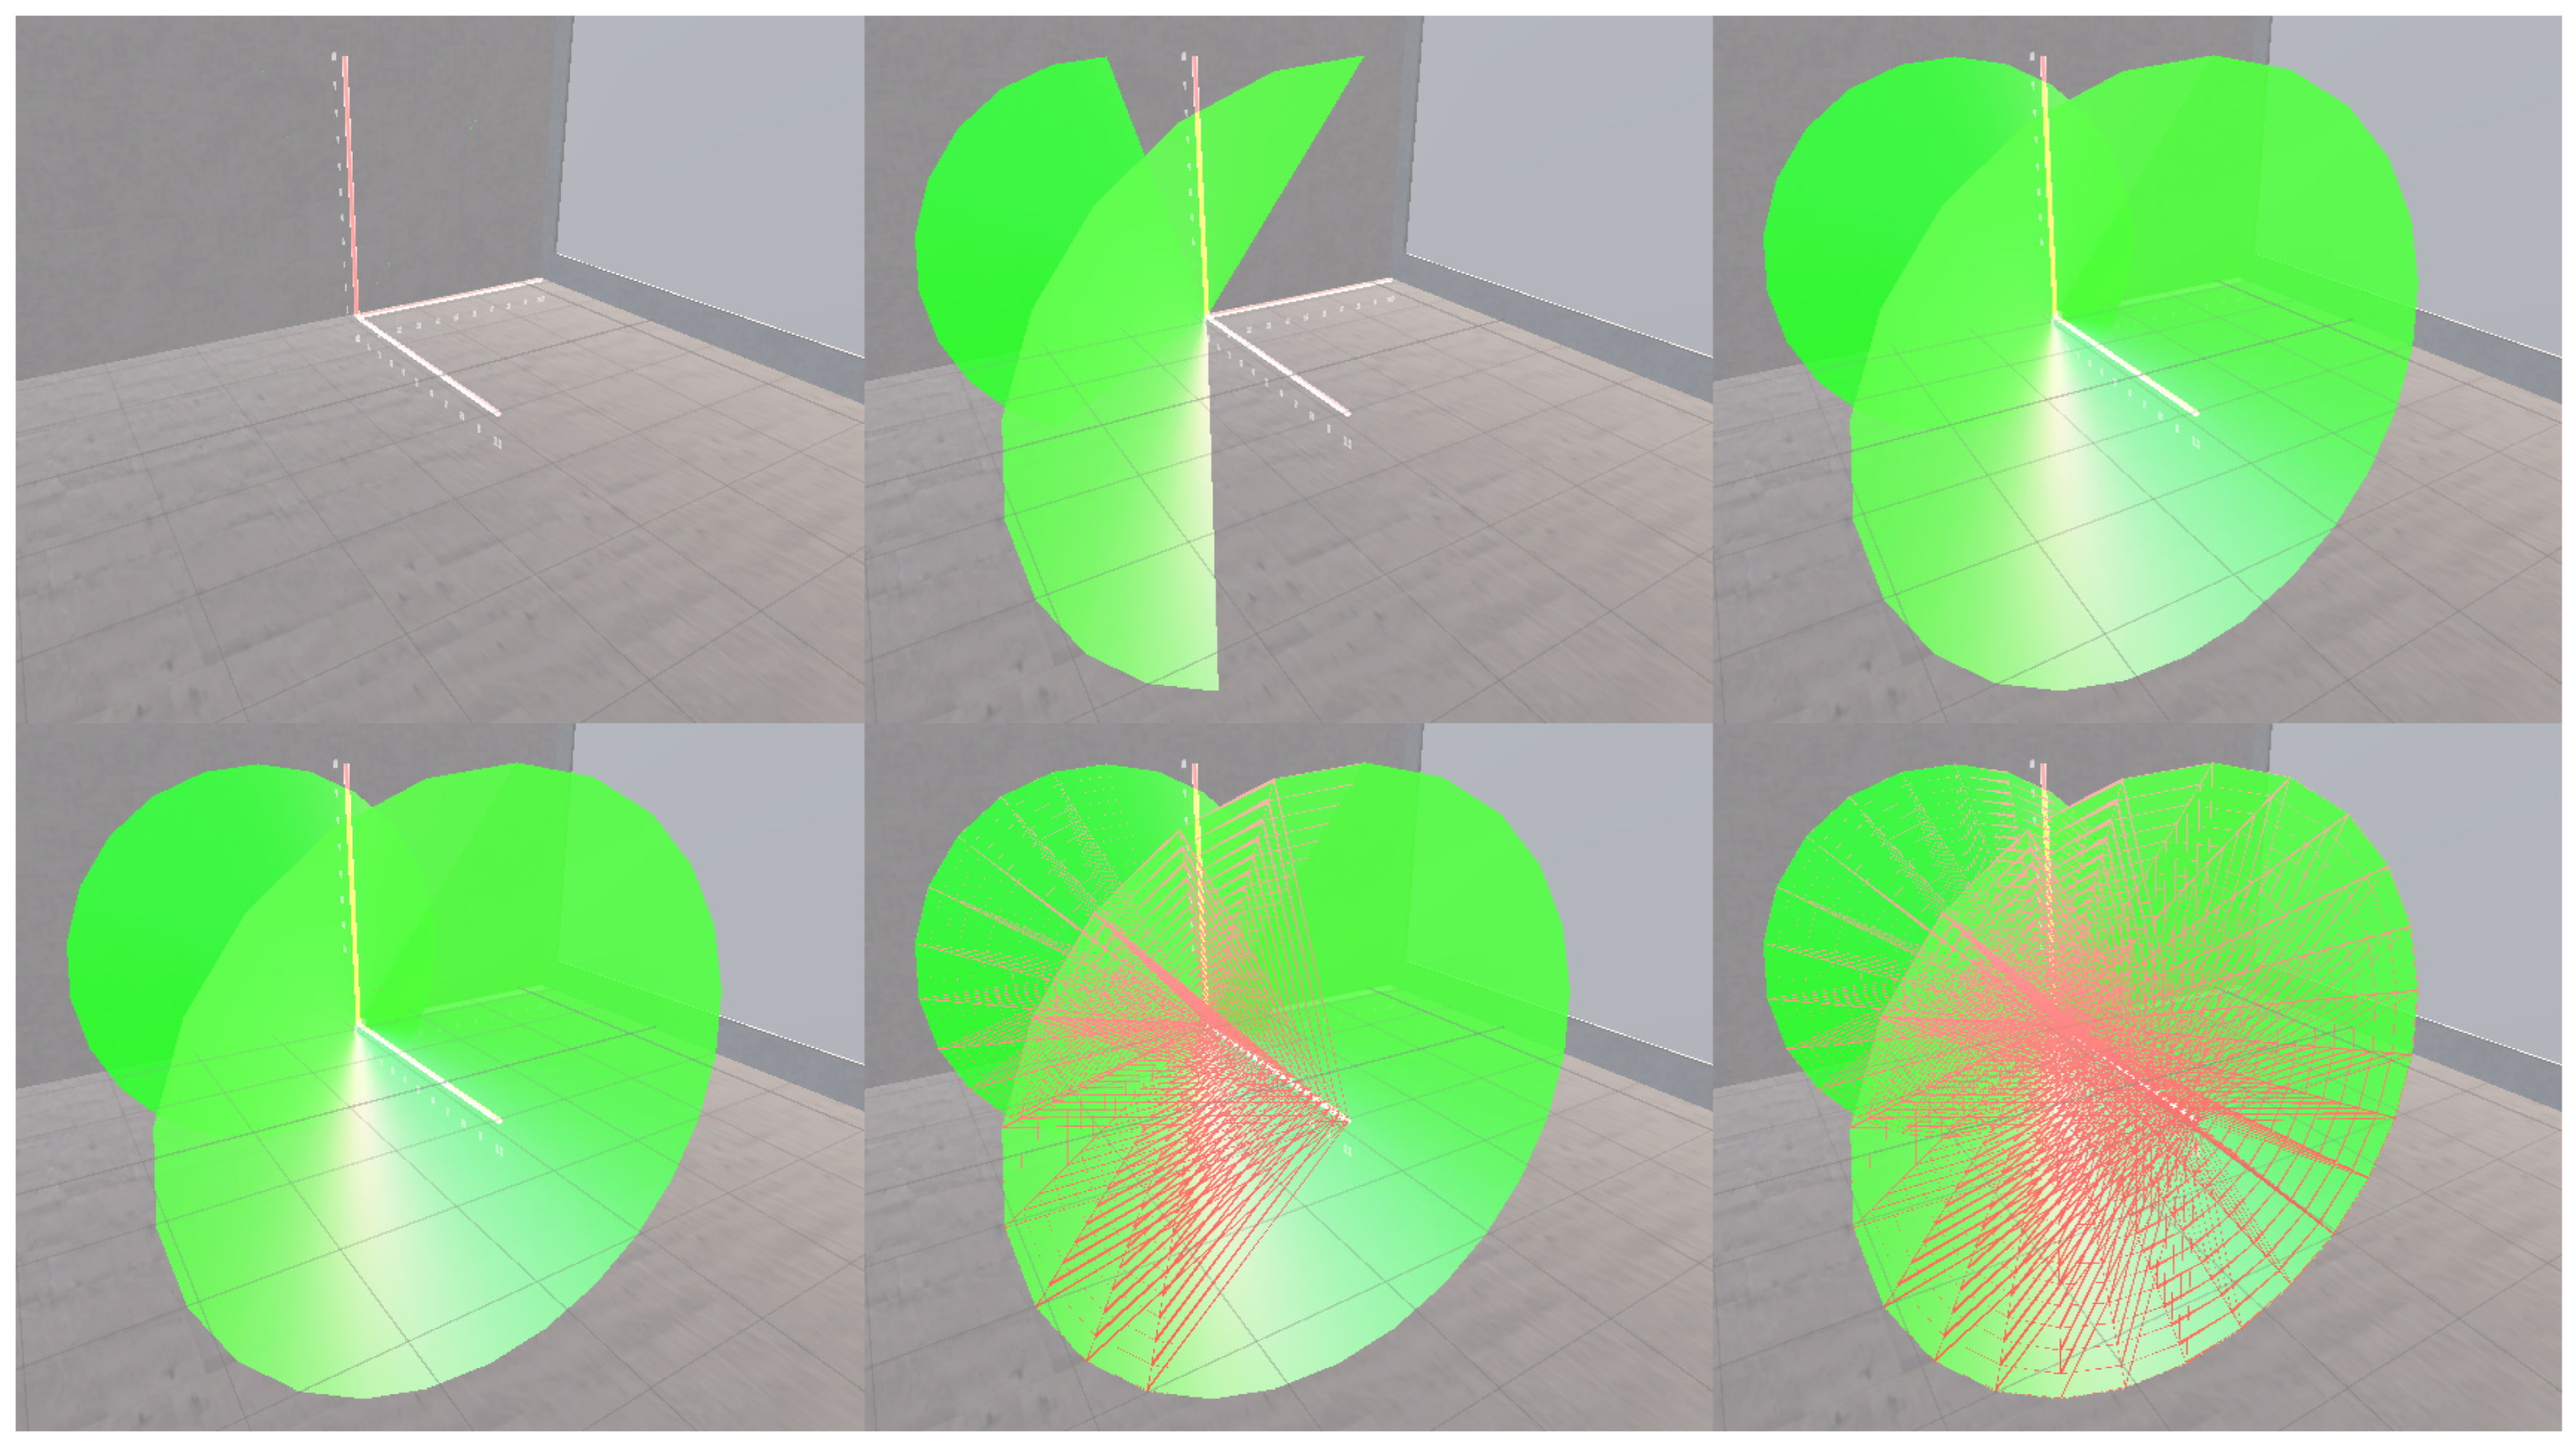
2.1.5. Cross Section Visualization
2.1.6. Additional Features
- Notebook Feature: A simple “Notebook” object is provided within the tool, providing users with essential information such as basic controls and function syntax.
- VR Classroom Environment: The tool features a virtual reality classroom setting, which is somewhat oversized for easy navigation. The authors created the models within the scene, and the textures were taken from freely available online repositories.
- Cross-Platform Functionality: Basic cross-platform functionality is provided within the project, including the ability to deploy directly to the Oculus Quest using an Android build target. Compatibility with additional XR head-mounted displays (HMDs) can be achieved using standard methods within the Unity XR Interaction Toolkit library.
- AR Scene for HoloLens: Alongside the primary VR implementation, a basic AR scene designed for the Microsoft HoloLens is included. However, due to consistent hardware delivery delays, this scene remains incomplete. Given the decreased likelihood of motion sickness due to movement in the real world and the relative ease of use in a classroom environment, the future versions of the tool are expected to shift towards an AR environment.
2.2. Subject Engagement
2.2.1. Preliminary Survey
- 1 (a).
- Do you find it challenging to imagine a solid in 3D space by revolving a region around an axis?
2.2.2. VR Application
- Participate fully in the study using the tool, which operates on the Meta Quest 2 platform. This option involves standard participation, engaging directly with the VR tool.
- Opt out of the standard participation but share reasons, such as medical or health concerns. This choice was included to assess if a significant portion of the target group had reservations about using the technology, which could impact the project’s overall feasibility.
- Choose not to participate in the study without providing feedback or data to the research team.
3. Results
3.1. Preliminary Survey
- Difficulty in 3D Visualization:
- A notable portion of students (average rating: 2.39 ranging from 1, Not at all challenging, to 5, Extremely challenging) acknowledged challenges in imagining solids in 3D space, a fundamental aspect of Calculus III, It is worth noting that any score above 1 indicated some level of difficulty, and Calculus II/III students experiencing any difficulty is indicative of an overall lack of confidence in traditional teaching methods
- Common difficulties highlighted include the inability to visualize unique shapes in 3D and the struggle to interpret these shapes from 2D diagrams.
- Interest in AR Applications:
- Most students expressed high interest (average rating: 3.39 ranging from 1, Not interested at all, to 5, Extremely interested) in using AR applications to enhance their understanding of calculus concepts. Given the term “interest” can only refer to students’ subjective outlook of simply enjoying the process, this portrays a degree of satisfaction with even hypothetical VR/AR tools.
- Students believe that AR could particularly aid in manipulating functions in 3D space, offering a more tangible and interactive learning experience.
- Impact of AR on Calculus Learning:
- The respondents showed a strong belief (average rating: 3.89 ranging from 1, Strongly disagree, to 5, Strongly agree) in the potential of AR to improve their understanding of calculus concepts. Students described finding VR more enjoyable while providing a more direct visualization, allowing for greater intuition. These, respectively, represent a degree of satisfaction and confidence in even hypothetical VR/AR tools.
- Several students noted that AR would offer a more in-depth and engaging way to explore complex calculus topics.
3.2. VR Application Survey
3.2.1. ARCS Criteria
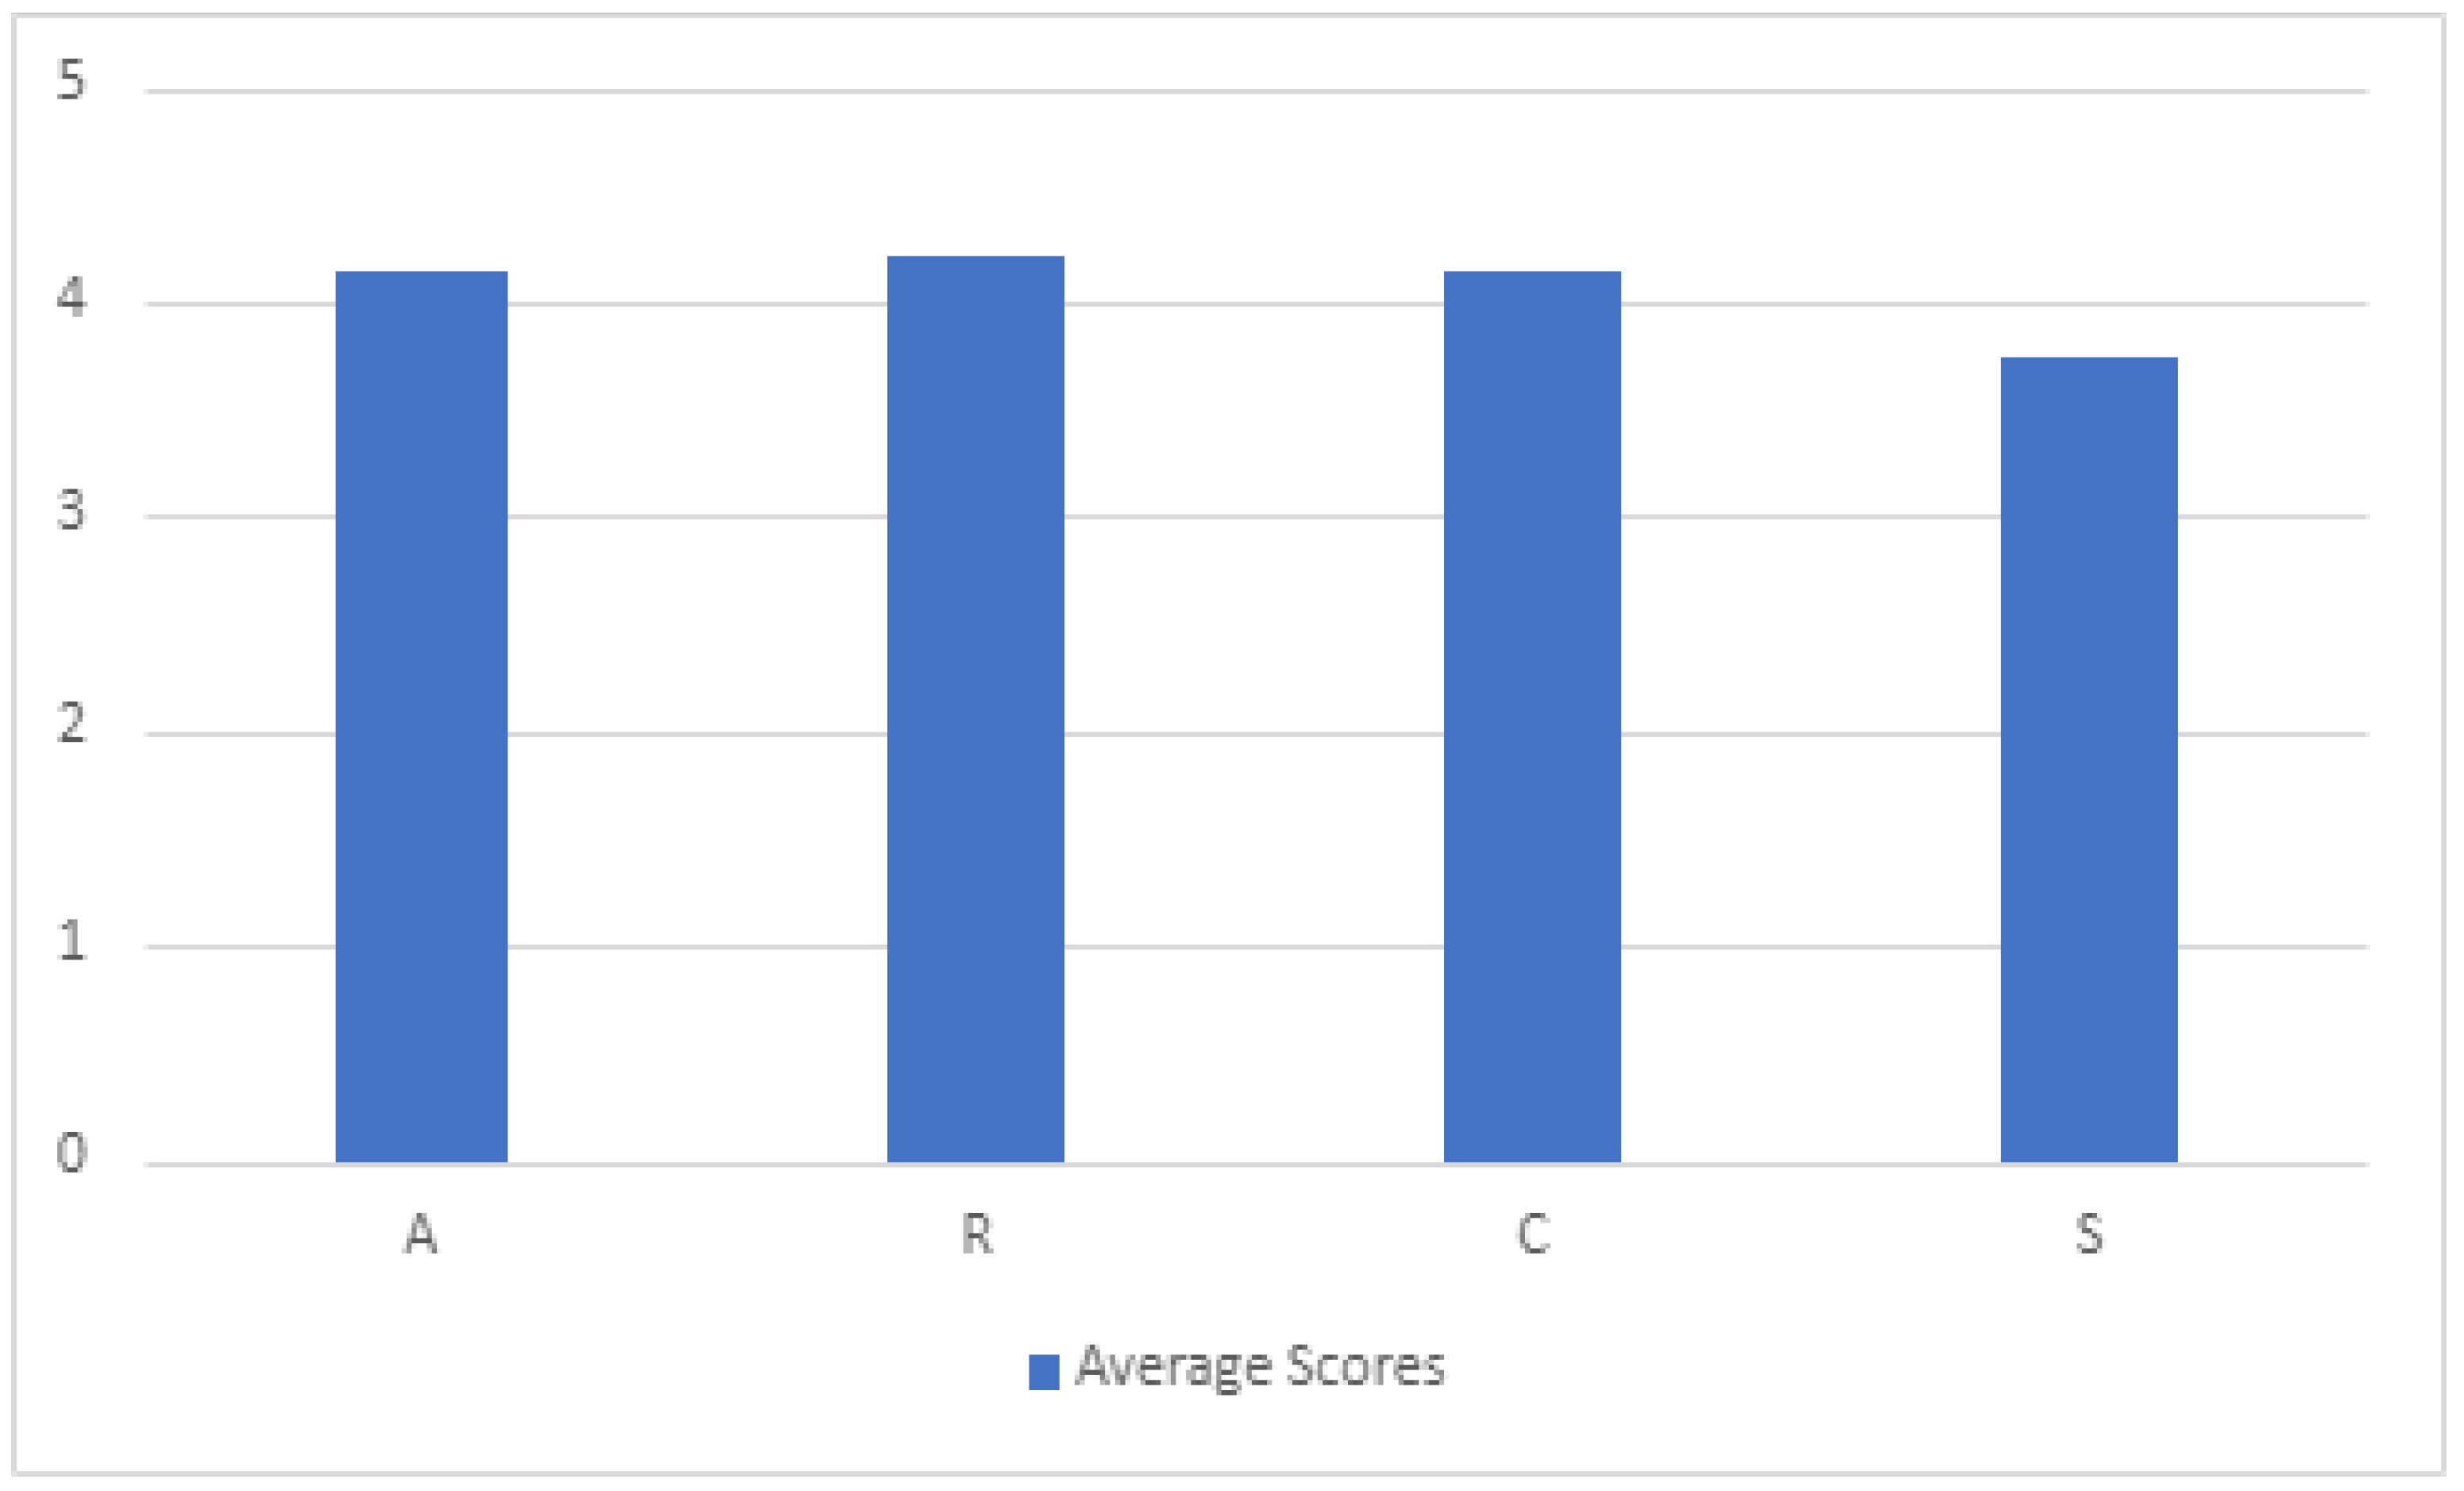
- Attention (2 Questions): 4.14
- Relevance (3 Questions): 4.21
- Confidence (2 Questions): 4.14
- Satisfaction (2 Questions): 3.73
3.2.2. Data Elucidation
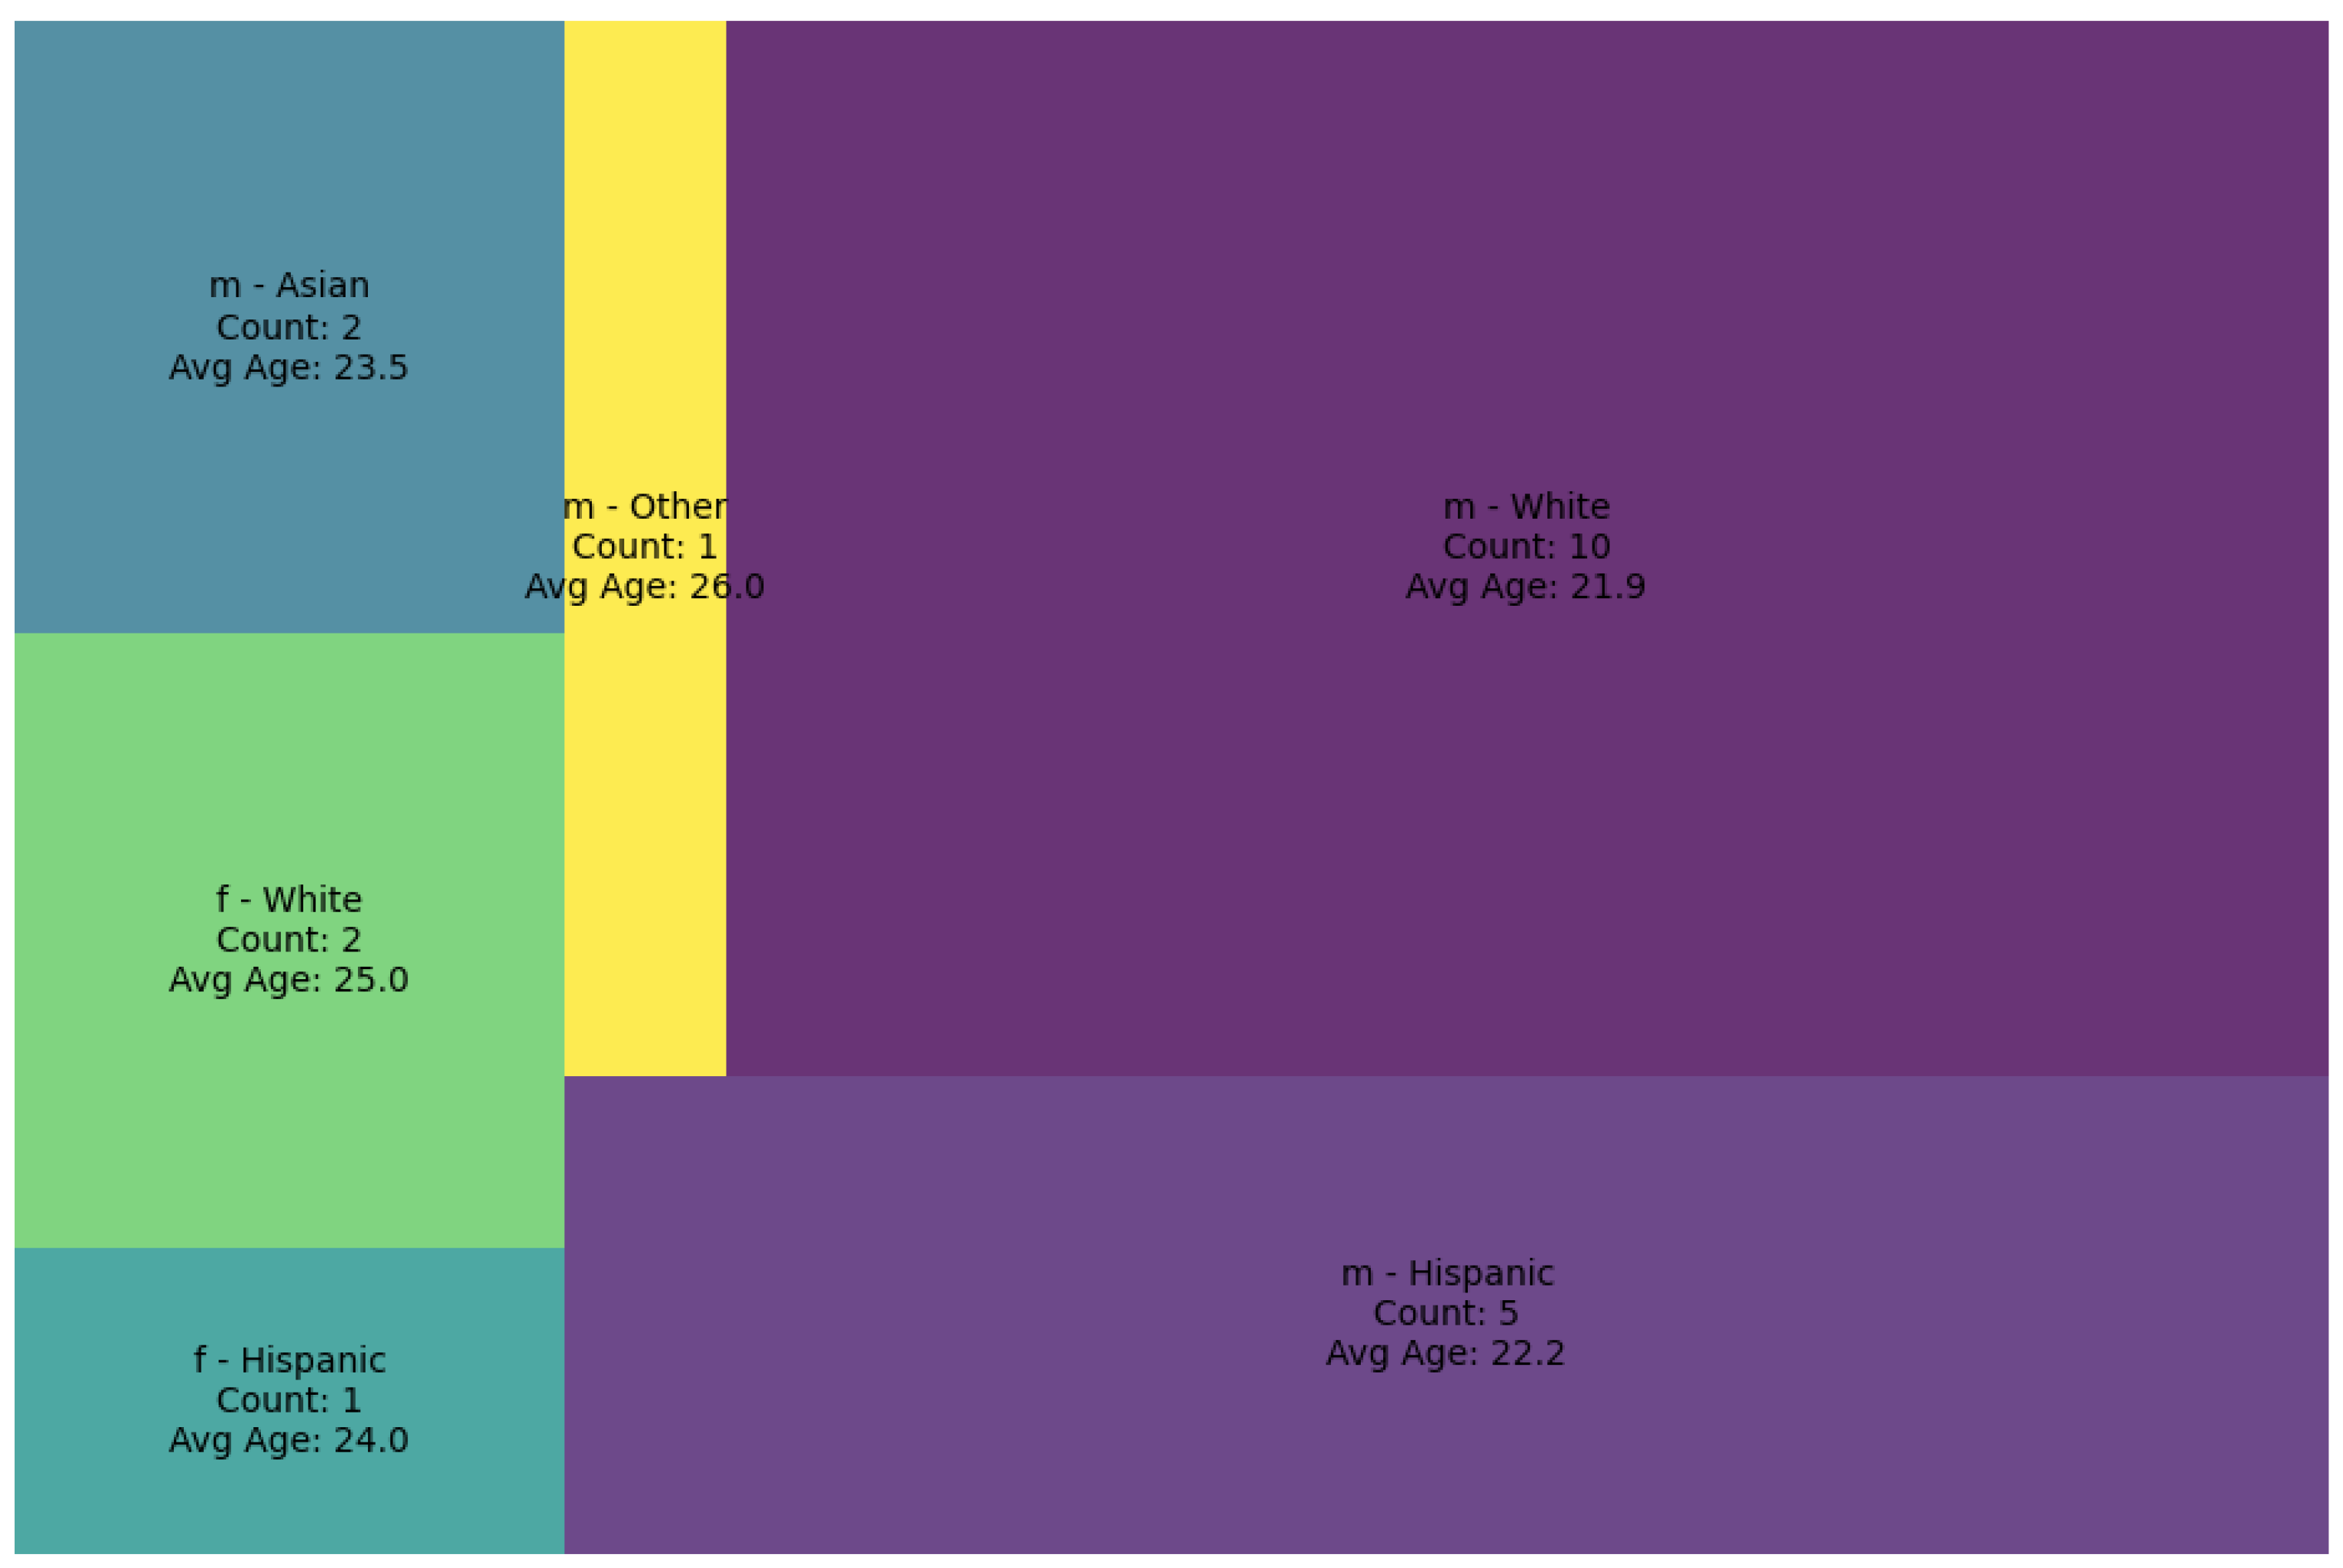
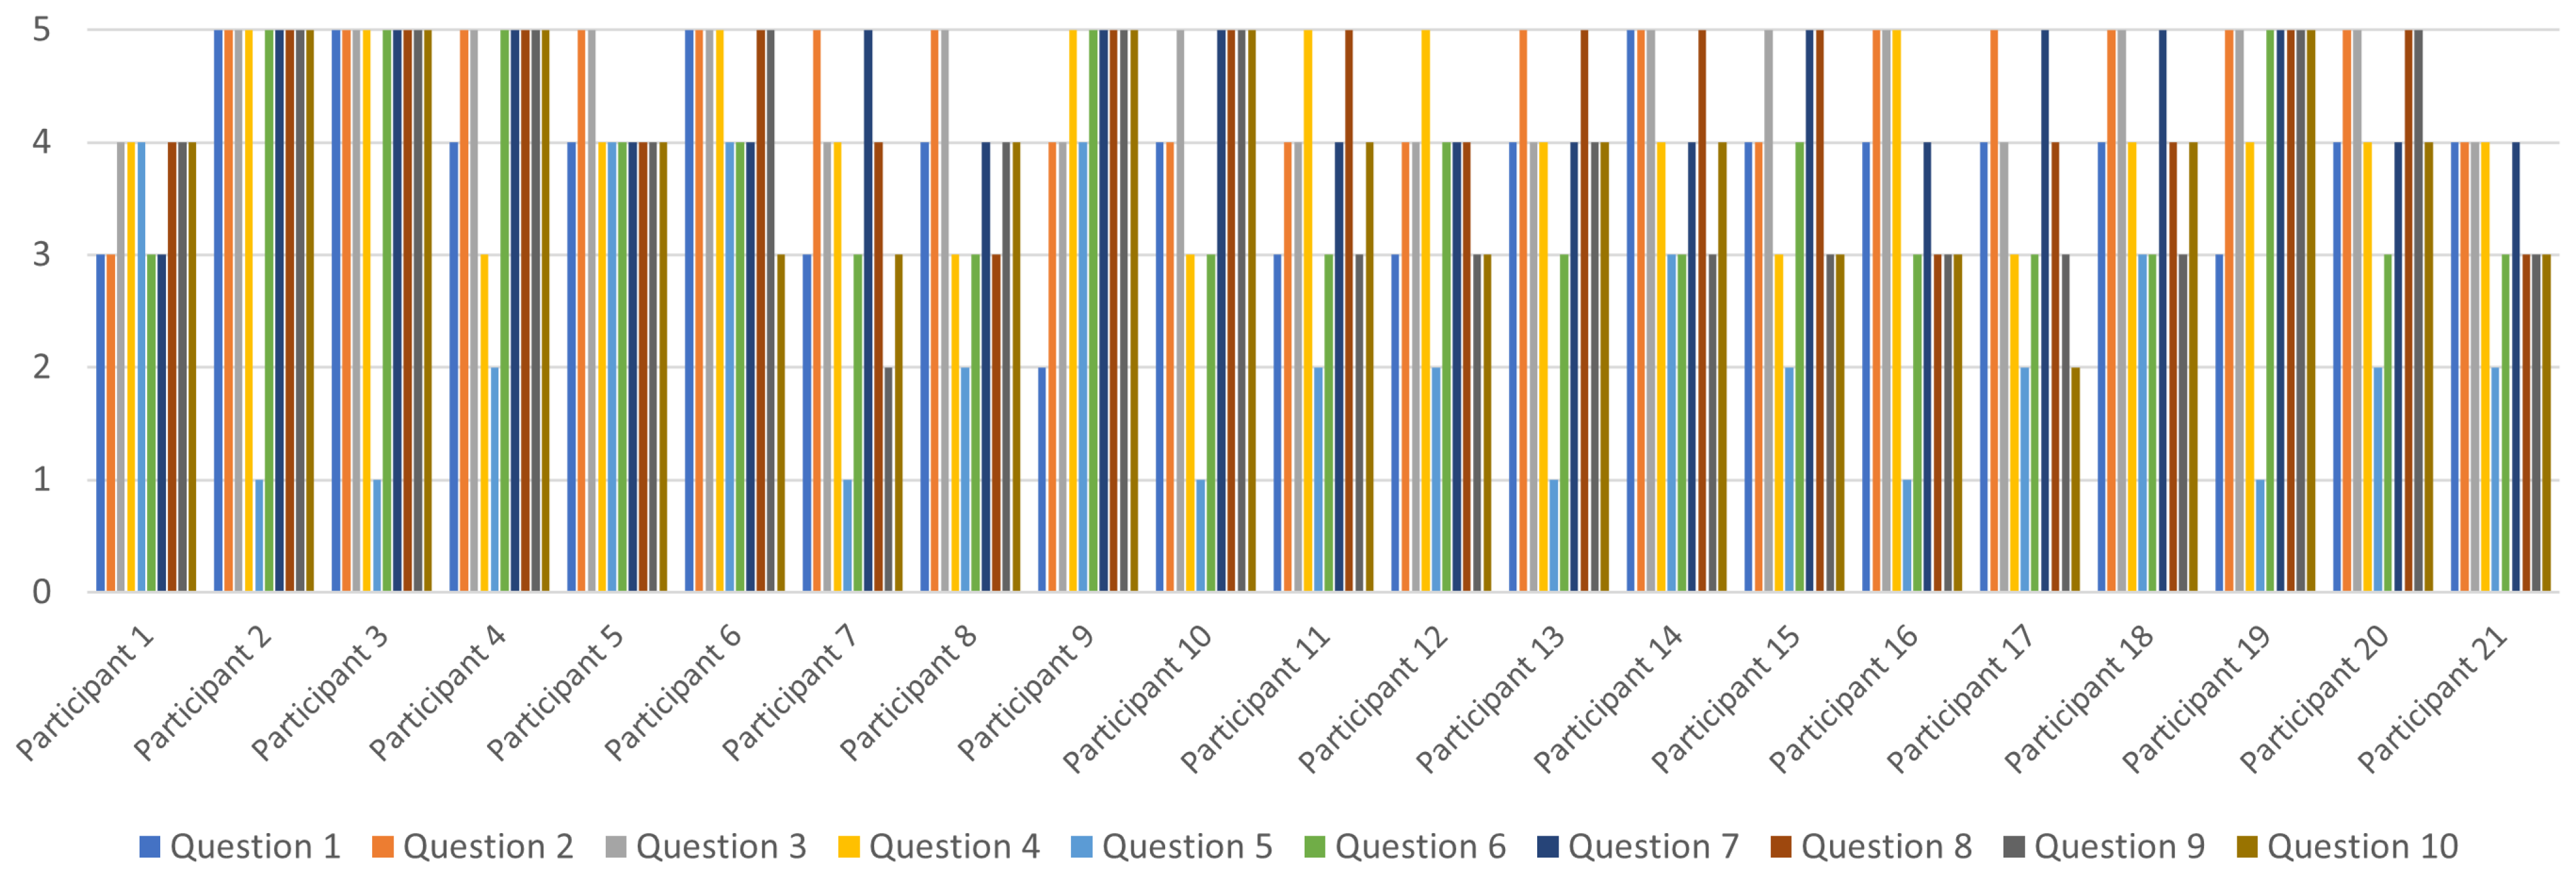
- Demographic Overview and Conceptual StrugglesOur survey engaged 21 students with diverse backgrounds. The age range was 19 to 29 years, with a gender distribution of 18 males and 3 females. The racial diversity included 2 Asian, 12 White, 6 Hispanic, and 1 other, providing a broad spectrum of perspectives. Figure 7 illustrates this demographic diversity, which is crucial for understanding the varied impact of the VR Studio. The survey revealed that while Calculus II students often struggle with solids of revolution, Calculus III students face difficulties with more generalized concepts. This includes challenges with the bounds of triple integrals and visualizing spherical coordinates—areas where VR can offer visual aids. Students’ feedback underscores the necessity for tools to aid these complex topics. The accompanying bar graph Figure 8 illustrates the survey results, clearly representing the students’ responses and preferences. In our survey, a response score of 1 or 2 indicates low agreement or satisfaction, while a score of 4 or 5 indicates high agreement or satisfaction with the evaluated aspects.
- General Feedback and Experience
- Understanding of Solids of Revolution (Q1): 15 of 21 students agreed (score of 4 or 5) that the VR studio helped them understand the solids of revolution. In comparison, only 1 disagreed (score of 1 or 2), indicating a high level of effectiveness in this area.
- Usefulness as an Augmented Reality Application (Q4): 16 of 21 of students saw the VR studio as beneficial when considering an Augmented Reality application, suggesting an interest in AR technologies for educational purposes.
- Educational Impact
- Classroom Utility of VR Studio (Q2): A significant 20 of 21 of students found the VR studio useful in the classroom setting, demonstrating its strong educational value.
- Value as a Study Tool (Q3): The VR studio was unanimously valued as a study tool, all students agreeing on its usefulness, highlighting its potential as a learning aid.
- Comparison with Traditional Methods
- Intuitive Grasp Compared to Conventional Methods (Q7): The VR studio was seen as more intuitive than conventional methods by 20 of 21 students, emphasizing its effectiveness in facilitating understanding.
- Feedback on Specific Methods, Concepts, and Suggestions
- Calculus II students highlighted difficulties with the washer method, suggesting a need for visualization tools for plotting multiple graphs. Calculus III students expressed the need for visual aids for triple integrals and spherical coordinates, with suggestions for using distinct colors to differentiate integral bounds.
- In the survey, students strongly preferred specific features in the VR studio: the ability to manipulate graphs freely, visual enhancements for clearer axis visibility and graph focus, and the functionality to overlay multiple graphs, likely due to usefulness for methods like the washer method in a VR setting. These features align well with planned updates, indicating their relevance and potential impact on learning.
- Suggestions for Improvement and Reported Issues
- Potential Enhancements to the VR Studio (Q6): 9 of 21 students suggested potential enhancements to the VR studio, providing valuable feedback for further development.
- Bugs or Issues Encountered (Q11): Responses to this question were primarily open-ended, providing specific feedback on technical aspects and user experience. As stated in the methods section, any minor issues encountered with the Quest hardware were addressed immediately. This proactive approach ensured that hardware limitations did not significantly hinder the study’s results.
- Enthusiasm for AR/VR Tools
- Despite varying levels of struggle with visualization, there was strong interest in engaging with AR tools (scoring 3+ on multiple questions)., indicating excitement about the potential of AR in education.
- Additional Applications and Interactivity Preferences
- Applicability of VR to Other Subjects (Q8): The survey results revealed a notable interest in extending VR applications beyond mathematics, with 18 of 21 of students recognizing its potential across various subjects. Physics, particularly the 3D visualization of electric and magnetic fields, emerged as a frequent area of interest. Computer Science topics, including neural networks and trees, were also highlighted as areas ripe for VR integration. Furthermore, students’ comments underscored the benefits of visualizing spherical coordinates within the VR environment, illustrating its versatility and applicability as a multifaceted educational tool.
- Desire for More Direct Interactivity (Q9): 12 of 21 students expressed a desire for more direct interactivity in the VR studio, suggesting areas for improvement in user engagement.
- Preference for Intricate Visualizations (Q10): 14 of 21 students preferred intricate visualizations, highlighting a demand for more complex and detailed graphical representations in educational tools.
- Health Concerns and Opt-out Reasons
- Discomfort or Negative Effects Experienced (Q5): Only 4 of 21 students reported experiencing discomfort or negative effects, while a significant 15 of 21 did not face any such issues, indicating good user comfort overall.
- Revisiting Concepts with VR
- Students clearly preferred VR tools that allow revisiting mathematical concepts, indicating their potential for reinforcing learning and appealing across different learning styles.
- General Interest and the Quest for More
- The feedback reflects a general interest in more complex concepts over basic interactivity, with students eager for tools to help them grasp more challenging subjects.
4. Discussion
- Promising Outcomes and Ethical Considerations: Despite a few bugs and potential flaws, the preliminary feedback from students who interacted with the VR tool has been overwhelmingly positive. This positivity encourages further exploration and development of the project, ultimately moving it into a meaningful, course-based environment. Importantly, ethical considerations were diligently addressed, and the study received approval from the University’s Institutional Review Board (IRB), ensuring adherence to the highest research ethics standards.
- Addressing Study Limitations: It is essential to acknowledge certain limitations within the current study:
- The source of the subjects may have introduced a potential conflict of interest, as some participants may have had pre-existing associations with the authors. This influence could have impacted the subjects’ responses.
- Some participants may have been primarily intrigued by the concept of XR graphing tools rather than critically evaluating their suitability for the classroom environment. The study’s small sample size, consisting mainly of students from STEM disciplines, particularly Computer Science, necessitates further investigation to generalize the results to a broader population.
- Due to the informal nature of the questionnaire, the study should be regarded as an indicator of student engagement and motivation rather than a quantitative analysis of student outcomes.
- Given the limited number of respondents, this study serves as a strictly exploratory measure, and a much larger study of similar tools must be performed before one may be implemented in a classroom environment.
- Due to the extremely early status of the visualization tool, these results are more indicative of general excitement and enhanced intuition, rather than a direct measurement of student outcomes. A far more extensive array of features is required for gathering such data.
- The open-ended nature of some questions makes a systemic approach difficult, and may hinder reproducibility; exact feature requests, attitudes on interactivity and complexity, etc. may vary from student to student and organization to organization.
- Given the strictly VR-based implementation, this study cannot provide any information on an AR implementation. This is despite the relative practicality of such a paradigm in a classroom environment.
- Incorporation of Student-Suggested Features as Future Directions: The feedback and suggestions from students who interacted with the VR graphing tool are invaluable. Prioritized enhancements focus on expanding the tool’s capabilities with advanced graphical features, interactive simulations, and comprehensive scientific visualizations. This feedback guides immediate improvements and informs the long-term vision of creating a comprehensive AR platform for advanced calculus education. The positive response from students underscores the tool’s potential to revolutionize traditional learning methods, aligning closely with student needs and preferences.
- Contributions to Educational Practice:As presented in our study, the innovative application of AR and VR technologies showcases a transformative approach to calculus education, emphasizing the importance of immersive learning experiences. The utilization of these technologies has demonstrated a marked improvement in students’ comprehension of complex calculus concepts, particularly through enhanced 3D visualization and interactive learning environments [2,7,10]. This study reveals the immediate benefits, such as increased student engagement and understanding, and lays the groundwork for future educational practices. It underscores the potential for AR and VR technologies to revolutionize traditional teaching methodologies by offering more personalized and engaging learning experiences. Furthermore, students’ positive feedback and suggestions highlight the demand for technology-enhanced educational tools, suggesting a shift towards more interactive and visually enriched learning landscapes. Our research contributes to educational practice by providing evidence of the effectiveness of immersive technologies in improving educational outcomes and suggesting pathways for integrating these innovations into mainstream educational settings.
5. Conclusions
Author Contributions
Funding
Institutional Review Board Statement
Informed Consent Statement
Data Availability Statement
Acknowledgments
Conflicts of Interest
Abbreviations
| VR | Virtual Reality |
| AR | Augmented Reality |
| ARCS | Attention, Relevance, Confidence, Satisfaction |
| STEM | Science, Technology, Engineering, and Mathematics |
| IRB | Institutional Review Board |
| XR | Extended Reality |
| UI | User Interface |
| HMD | Head Mounted Displays |
| WTAMU | West Texas A&M University |
References
- Kaur, D.P.; Mantri, A.; Horan, B. Enhancing student motivation with use of augmented reality for interactive learning in engineering education. Procedia Comput. Sci. 2020, 172, 881–885. [Google Scholar] [CrossRef]
- Wang, M.; Callaghan, V.; Bernhardt, J.; White, K.; Peña-Rios, A. Augmented reality in education and training: Pedagogical approaches and illustrative case studies. J. Ambient. Intell. Humaniz. Comput. 2018, 9, 1391–1402. [Google Scholar] [CrossRef]
- Garzón, J. An Overview of Twenty-Five Years of Augmented Reality in Education. Multimodal Technol. Interact. 2021, 5, 37. [Google Scholar] [CrossRef]
- Altinpulluk, H. Determining the trends of using augmented reality in education between 2006–2016. Educ. Inf. Technol. 2019, 24, 1089–1114. [Google Scholar] [CrossRef]
- Papanastasiou, G.; Drigas, A.; Skianis, C.; Lytras, M.; Papanastasiou, E. Virtual and augmented reality effects on K-12, higher and tertiary education students’ twenty-first century skills. Virtual Real. 2019, 23, 425–436. [Google Scholar] [CrossRef]
- Huang, K.T.; Ball, C.; Francis, J.; Ratan, R.; Boumis, J.; Fordham, J. Augmented Versus Virtual Reality in Education: An Exploratory Study Examining Science Knowledge Retention When Using Augmented Reality/Virtual Reality Mobile Applications. CYberpsychology, Behav. Soc. Netw. 2019, 22, 105–110. [Google Scholar] [CrossRef] [PubMed]
- Huang, X.; Zou, D.; Cheng, G.; Xie, H. A Systematic Review of AR and VR Enhanced Language Learning. Sustainability 2021, 13, 4639. [Google Scholar] [CrossRef]
- McKnight, R.R.; Pean, C.A.; Buck, J.S.; Hwang, J.S.; Hsu, J.R.; Pierrie, S.N. Virtual Reality and Augmented Reality—Translating Surgical Training into Surgical Technique. Curr. Rev. Musculoskelet. Med. 2020, 13, 663–674. [Google Scholar] [CrossRef] [PubMed]
- Hsu, Y.S.; Lin, Y.H.; Yang, B. Impact of augmented reality lessons on students’ STEM interest. Res. Pract. Technol. Enhanc. Learn. 2017, 12, 1–14. [Google Scholar] [CrossRef]
- Mat-jizat, J.E.; Jaafar, H.; Yahaya, R. Measuring the Effectiveness of Augmented Reality as a Pedagogical Strategy in Enhancing Student Learning and Motivation. Int. J. Acad. Res. Bus. Soc. Sci. 2017, 7, 219–234. [Google Scholar] [CrossRef]
- Wang, X.M.; Hu, Q.N.; Hwang, G.J.; Yu, X.H. Learning with digital technology-facilitated empathy: An augmented reality approach to enhancing students’ flow experience, motivation, and achievement in a biology program. Interact. Learn. Environ. 2023, 31, 6988–7004. [Google Scholar] [CrossRef]
- Petrov, P.D.; Atanasova, T.V. The Effect of Augmented Reality on Students’ Learning Performance in Stem Education. Information 2020, 11, 209. [Google Scholar] [CrossRef]
- Phon, D.N.E.; Ali, M.B.; Halim, N.D.A. Collaborative Augmented Reality in Education: A Review. In Proceedings of the 2014 International Conference on Teaching and Learning in Computing and Engineering, Kuching, Malaysia, 11–13 April 2014; pp. 78–83. [Google Scholar] [CrossRef]
- Keller, J. Development and use of the ARCS model of instructional design. J. Instr. Dev. 1987, 10, 2–10. [Google Scholar] [CrossRef]
- Li, K.; Keller, J.M. Use of the ARCS model in education: A literature review. Comput. Educ. 2018, 122, 54–62. [Google Scholar] [CrossRef]
- Pinter, L.; Izquierdo, M.; Siddiqui, M.F.H. Revolutionizing Learning: An Interactive VR Application for Solids of Revolution. In Proceedings of the Proceedings of the 7th International Conference on Education and Multimedia Technology, Tokyo, Japan, 29–31 August 2023; pp. 35–40. [Google Scholar] [CrossRef]
- Kaufmann, H.; Schmalstieg, D. Construct3D—An Augmented Reality System for Mathematics and Geometry Education. 2008. Available online: https://www.ims.tuwien.ac.at/projects/construct3d (accessed on 29 December 2023).
- Kaufmann, H.; Meyer, B. Simulating Educational Physical Experiments in Augmented Reality. 2008. Available online: https://publik.tuwien.ac.at/files/PubDat_170658.pdf (accessed on 29 December 2023).
- Quintero, E.; Salinas, P.; González-Mendívil, E.; Ramírez, H. Augmented reality app for calculus: A proposal for the development of spatial visualization. Procedia Comput. Sci. 2015, 75, 301–305. [Google Scholar] [CrossRef]
- Medina Herrera, L.; Pérez, J.; Juárez Ordóñez, S. Developing spatial mathematical skills through 3D tools: Augmented reality, virtual environments and 3D printing. Int. J. Interact. Des. Manuf. (IJIDeM) 2019, 13, 1385–1399. [Google Scholar] [CrossRef]
- Sanderson, G. Manim. 2022. Available online: https://github.com/3b1b/manim (accessed on 29 December 2023).
- Sanderson, G. The Essence of Calculus. 2017. Available online: https://www.youtube.com/watch?v=WUvTyaaNkzM (accessed on 29 December 2023).
- Sanderson, G. But What Is a Convolution? 2022. Available online: https://www.youtube.com/watch?v=KuXjwB4LzSA (accessed on 29 December 2023).
- Sanderson, G. Who Cares about Topology? (Inscribed Rectangle Problem). 2016. Available online: https://www.youtube.com/watch?v=AmgkSdhK4K8 (accessed on 29 December 2023).
- Coluci, V.R. Animações de conceitos da teoria de erros usando Manim/Python. Rev. Bras. Ensino FíSica 2022, 44, e20210239. [Google Scholar] [CrossRef]
- Aragón, X.; Serrano, Z.; José, F. Manim Com a Eina de Visualització Matemàtica; RecerCAT: Barcelona, Spain, 2022. [Google Scholar]
- GeoGebra—The World’s Favorite, Free Math Tools Used by over 100 Million Students and Teachers. 2023. Available online: https://www.geogebra.org/ (accessed on 29 December 2023).
- About the Oculus XR Plugin. 2023. Available online: https://docs.unity3d.com/Packages/com.unity.xr.oculus@1.0.0/manual/index.html (accessed on 29 December 2023).
- Unity XR Interaction Toolkit Documentation. 2023. Available online: https://docs.unity3d.com/Packages/com.unity.xr.interaction.toolkit@2.3/manual/index.html (accessed on 29 December 2023).
- Using Shader Graph. 2023. Available online: https://docs.unity3d.com/Manual/shader-graph.html (accessed on 29 December 2023).
- Vanifato, V. Expression Parser. 2022. Available online: https://github.com/codewriter-packages/Expression-Parser (accessed on 29 December 2023).
- Blumhardt, N. Sprache. 2021. Available online: https://github.com/sprache/sprache (accessed on 29 December 2023).


| No. | Question | Type/Scale | ARCS Factor | |
|---|---|---|---|---|
| 1 | a | Do you find it challenging to imagine a surface in 3D space? | Not At All Challenging—Extremely Challenging | C |
| b | If you find it challenging, what specific aspects do you struggle with? | Short Answer | C | |
| 2 | a | Are you interested in the use of augmented reality applications to enhance your understanding of 3D visualization in calculus? | Not Interested At All—Extremely Interested | S |
| b | What aspects of augmented reality applications do you think would be most beneficial to learning calculus concepts? | Short Answer | C/S 1 | |
| 3 | a | In your opinion, do you believe that augmented reality techniques could improve your understanding of calculus concepts? | Disagree—Agree | C/S 1 |
| b | Please provide any additional comments or suggestions regarding the potential use of augmented reality in your calculus studies. | Short Answer | C/S 1 |
| No. | Question | Type | ARCS Factor |
|---|---|---|---|
| 1 | After using the visualization, my understanding of the solids of revolution improved. | Disagree—Agree | C |
| 2 | The visualization would be beneficial in a classroom setting. | Disagree—Agree | A/S |
| 3 | The visualization would serve as a valuable study tool. | Disagree—Agree | R |
| 4 | The visualization would be more useful as an Augmented Reality application—super-imposed, for instance, on a classroom table. | Disagree—Agree | A/R † |
| 5 | I experienced discomfort or other negative effects while using the visualization. | Disagree—Agree | S |
| 6 | The visualization could be enhanced with specific features. | Disagree—Agree | A/R |
| If you agree, please provide some recommendations: | Short Answer | ||
| 7 | Compared to textbooks or other conventional teaching methods, this visualization offers a more intuitive grasp of the solids of revolution. | Disagree—Agree | C |
| Do you believe this applies more to new students, current students, or both? | Short Answer | ||
| 8 | Similar Visualizations would benefit other mathematics, engineering, or computer science subjects. | Disagree—Agree | R |
| If you agree, please provide some recommendations: | Short Answer | ||
| 9 | I would appreciate more direct interactivity in the visualization, with controls similar to the cross-section visualization. | Disagree—Agree | A/S † |
| 10 | I would prefer a more intricate visualization capable of representing a broader array of concepts. | Disagree—Agree | R † |
| 11 | Did you find any bug that you want to let us know? Please provide the details briefly. | Short Answer | N/A 1 |
| No. | Question | Type |
|---|---|---|
| 1 | I chose not to participate in the VR visualization due to health concerns. | Yes/No |
| 2 | Please specify you reasons for opting out of the VR experience: | Short Answer |
| 3 | Would you consider using VR visualization if your concerns were addressed or if additional safety features were implemented | Yes/No |
| If yes, please specify what changes or features would make you comfortable: | Short Answer |
Disclaimer/Publisher’s Note: The statements, opinions and data contained in all publications are solely those of the individual author(s) and contributor(s) and not of MDPI and/or the editor(s). MDPI and/or the editor(s) disclaim responsibility for any injury to people or property resulting from any ideas, methods, instructions or products referred to in the content. |
© 2024 by the authors. Licensee MDPI, Basel, Switzerland. This article is an open access article distributed under the terms and conditions of the Creative Commons Attribution (CC BY) license (https://creativecommons.org/licenses/by/4.0/).
Share and Cite
Pinter, L.; Siddiqui, M.F.H. Enhancing Calculus Learning through Interactive VR and AR Technologies: A Study on Immersive Educational Tools. Multimodal Technol. Interact. 2024, 8, 19. https://doi.org/10.3390/mti8030019
Pinter L, Siddiqui MFH. Enhancing Calculus Learning through Interactive VR and AR Technologies: A Study on Immersive Educational Tools. Multimodal Technologies and Interaction. 2024; 8(3):19. https://doi.org/10.3390/mti8030019
Chicago/Turabian StylePinter, Logan, and Mohammad Faridul Haque Siddiqui. 2024. "Enhancing Calculus Learning through Interactive VR and AR Technologies: A Study on Immersive Educational Tools" Multimodal Technologies and Interaction 8, no. 3: 19. https://doi.org/10.3390/mti8030019