Article

Trust Development and Explainability: A Longitudinal Study with a Personalized Assistive System

by
Setareh Zafari
1,†,
Jesse de Pagter
2,†,
Guglielmo Papagni
1,*,†,
Alischa Rosenstein
3,
Michael Filzmoser
4 and
Sabine T. Koeszegi
4
1
Austrian Institute of Technology GmbH, Giefinggasse 2, 1210 Vienna, Austria
2
Centre for Social Innovation (ZSI), Linke Wienzeile 246, 1150 Vienna, Austria
3
Mercedes-Benz AG, Benz-Str., 71063 Sindelfingen, Germany
4
TU Wien, Institute of Management Science Theresianumgasse 27, 1040 Vienna, Austria
*
Author to whom correspondence should be addressed.
These authors contributed equally to this work.
Multimodal Technol. Interact. 2024, 8(3), 20; https://doi.org/10.3390/mti8030020
Submission received: 16 January 2024 / Revised: 20 February 2024 / Accepted: 28 February 2024 / Published: 1 March 2024
(This article belongs to the Special Issue Cooperative Intelligence in Automated Driving- 2nd Edition)

Abstract

:
This article reports on a longitudinal experiment in which the influence of an assistive system’s malfunctioning and transparency on trust was examined over a period of seven days. To this end, we simulated the system’s personalized recommendation features to support participants with the task of learning new texts and taking quizzes. Using a 2 × 2 mixed design, the system’s malfunctioning (correct vs. faulty) and transparency (with vs. without explanation) were manipulated as between-subjects variables, whereas exposure time was used as a repeated-measure variable. A combined qualitative and quantitative methodological approach was used to analyze the data from 171 participants. Our results show that participants perceived the system making a faulty recommendation as a trust violation. Additionally, a trend emerged from both the quantitative and qualitative analyses regarding how the availability of explanations (even when not accessed) increased the perception of a trustworthy system.

1. Introduction

Trust is a fundamental concept in human relationships, as people’s behavior depends, among other things, on whether they trust each other. Hence, trust has been investigated from a wide range of perspectives. Important examples include antecedents of trust [1], cognitive and emotional components of trust [2], trust in organizations [3,4], trust development [5], and trust in interpersonal relationships [6,7].
In recent decades, artificial intelligence (AI) has been increasingly used in a growing number of applications, many of which range from automated transportation to email services, online banking, and social media, thereby affecting people’s everyday lives. For this reason, the concept of trust has come to occupy a central position in academic and institutional discussions related to AI-based automated systems, and researchers aim to understand the dynamics of trust formation and development in relation to such technologies [8,9,10,11], as well as whether and how these processes relate to trust in human–human interaction.
Explainability, or the lack thereof, is considered to be one of the idiosyncratic yet most relevant features of AI that may influence how much trust people place in it [12,13,14]. This is relevant with regard to the increasing popularity of models such as neural networks (black box models) and is in light of their intrinsic opaqueness and inscrutability [13,15]. It is all the more relevant in interaction contexts that entail potential risks for the users, such as with automated vehicles [16,17]. In this regard, researchers argue that making the causal chains behind models’ decisions interpretable is likely to help people understand the rationales behind those decisions and, importantly, calibrate their expectations and trust [18,19,20]. This, in turn, increases the chances that users decide to interact further with a system [21,22]. Given that trust is dynamic and changes throughout different phases of interactions, still-open questions concern how exactly trust forms and evolves in the context of repeated interactions with AI-based systems, as well as the conditions under which transparency affects trust in these systems.
As a gap exists in the literature concerning the explanations’ influence on trust development in longitudinal interaction settings [23], the experimental work presented here contributes to the literature by investigating trust dynamics in relation to transparency in the context of repeated interaction with an assistive system. To this end, we simulated via a ‘Wizard of Oz Methodology’ the system’s personalized recommendations in order to assist users preparing for quizzes by providing them with recommendations on which portions of text to focus on. Specifically, this study focuses on comparing participants’ trust ratings at the beginning, over the course of the study, and after a system malfunction. Furthermore, the system provided explanations of how it functions to one group of participants, while another group was not provided with this explanation. The trust ratings between these conditions are also compared. Finally, trust in the system at the very end of the study is also measured and compared. Our study shows that, even after the system had proven its reliability, a faulty recommendation was perceived as a trust violation. Accordingly, participants who experienced the system’s malfunction attributed significantly lower trust to it than those who interacted with an always accurate system. Furthermore, a trend emerged concerning the explanations’ effect as a trust restoration strategy. Although our study did not yield significant results on this matter, both the quantitative and qualitative analyses suggest that providing explanations after a system malfunction may indeed accelerate the trust restoration process.
The remainder of this paper is divided into five parts. Section 2 discusses previous work related to the notion of trust as a dynamic process, thereby connecting it to the concept of explainability while identifying open challenges and experimental propositions. Then, Section 3 describes the methodology and design of the 2 × 2 study in which the system’s accuracy and explainability were manipulated to investigate how trust in the system is affected. Section 4 presents the results from the quantitative and qualitative analysis. The study’s contributions to the literature on trust and explainability are then discussed in Section 5, with considerations regarding automated vehicles, together with final considerations and limitations in Section 6.

2. Related Work and Experimental Hypotheses

Definitions of trust have repeatedly emphasized certain elements. Namely, trust implies a trustor who is willing to be vulnerable and face risks and uncertainties in expectation that the trustee will provide support in achieving specific goals [7,24]. As such, trust is a fundamental phenomenon that characterizes human relationships on multiple levels. Trust in technology represents just one of these levels (albeit a multifaceted one), and researchers emphasize how trust plays a role in determining technology acceptance [22,25]. In this respect, trust towards assistive systems, such as those employed by automated vehicles, can be operationalized as the probability of an individual following the system’s recommendations, predictions, and decision making [12]. Furthermore, recent long term studies [26,27] have found time to be an important factor influencing trust in repeated interactions with such systems. Hence, the dynamic nature of trust necessitates studying its relationship with (and effects of) performance/accuracy and explainability at different moments of an interaction [28,29,30,31].

2.1. Initial Trust

Certain factors influence people’s initial trust in new technologies before any interaction takes place. As antecedents of trust, individuals’ characteristics, environmental factors, and features of the technology in question play a role in determining people’s initial trust towards new technologies [25]. Taken together, these factors contribute to determining people’s initial attitude and expectations so that the process of trust formation is not a complete ‘blind leap of faith’ [32], a concept which comprises a high risk potential in applications like automated driving.
Environmental factors include social and cultural background, as well as institutional cues. The latter is particularly relevant for AI-based technologies, as it refers to entities that are involved in the introduction of new technologies, such as developers and expert opinion leaders, companies that market the technology, and national and international organizations that contribute to shaping the narratives around new technologies [28,33,34,35]. Before any interaction is established, institutional cues can determine whether people perceive new technologies as benevolent or malicious [36,37].
Human factors refer to the disposition to trust, propensity to take risks, individual abilities, and personality traits [9,25,38]. Ref. [16] reports on a study conducted to evaluate the effects of risk perception on trust in automated vehicles. They found that not only did interacting with an automated vehicle in a risky scenario significantly reduce participants’ trust and delegation of control to the vehicle, but they also found that initial trust was significantly higher than trust levels after interacting with the vehicle in high-risk conditions.
Concerning technological features, ref. [8] identifies three factors that can influence people’s trust in automation. These are performance, process, and purpose. Researchers argue that an AI-based system may be considered trustworthy if it acts within the ‘contractual preconditions’ of its use [14], that is, if an AI-based system successfully performs in accordance with its purposes, which are contextually recognized by users.
However, before or at the beginning of an interaction, it is difficult for people to judge whether an AI-based system will perform in accordance with its purposes. This means that initial trust is likely not based on the AI-based system’s actual capabilities. Rather, it is mostly influenced by individuals’ background and disposition and how the technology is presented by external entities. The former in particular may lead to unreasonably high or low levels of initial trust, given that the explicit third party in this case are the researchers conducting the study [39,40]. In this regard, several researchers note that, particularly during the first phases of the adoption of and interaction with new AI-based technologies, providing initial explanations may improve trust formation processes. For instance, studies suggest that automated vehicles’ explanations provided before the vehicle acted may positively influence the willingness to trust the vehicle [41,42]. Specifically, by compensating for the lack of previous experience (and proven reliability), initial explanations that clarify the functions and purposes of a specific technology may reduce users’ perception of risk, increase perceived trustworthiness, enable accountability, and mitigate individual disposition [25,34,43]. In turn, the initial attribution of trust and low perception of risks may be fundamental in determining users’ acceptance of potentially hazardous systems such as automated vehicles [44].
On top of these considerations, we propose the following:
Hypothesis 1 (H1). 
Transparency by means of explanations about the system’s inner workings leads to higher initial trust levels.

2.2. Trust Development over Time

Once initial trust is established and the interaction with an AI-based system proceeds, people are unlikely to completely lose trust without a specific reason. In this regard, researchers suggest that trust dynamics evolve gradually [25] and that initial trust levels usually adjust after an interaction begins as the result of a calibration of individuals’ attitudes and other factors involved in determining initial trust, which are intertwined with an AI-based system’s behavior [10,29,45,46]. Recalling Lee and See’s model, as an interaction unfolds, an AI-based system will likely be considered trustworthy and reliable if it performs in accordance with its purpose or, to put it in other terms, with the ‘contracts’ established with users [8,14]. For an AI-based system to be considered reliable, behavioral consistency over time is required, as reliability is a property that can be attributed to a system only in relation to its past performance [47,48,49]. In turn, when an AI-based system proves reliable, people grow confident in its capacity; trust and familiarity stabilize, and performance improves [17,50,51,52].
In this regard, studies have suggested that, as long as an AI system performs accurately, people will perceive it as reliable, and explanations may be unnecessary [53,54] or even detrimental to trust development; for instance, they might reveal the system’s limited capabilities, thereby breaking the illusion of intelligence [12,55].
For instance, empirical results from a series of studies on explanations by automated vehicles show how the explanations’ timing plays a central role in determining users’ trust. The researchers found that explanations provided before the vehicle acted had a positive influence on participants’ attribution of trust, while explanations that were given after a specific action did not affect trust ratings [41,42]. In line with H1, these findings suggest that explanations may be more beneficial before, rather than during, an interaction.
However, other studies point out that explanations provided during an interaction may help people make sense of specific decisions or predictions generated by AI-based systems [56] and are therefore fundamental to continuous trust calibration [25].Taken all together, these results suggest that, once a system proves itself reliable through repeated accurate performance, people’s attribution of trust will, for the most part, depend on this accuracy. In turn, this means that providing explanations in this phase is neither likely to have negative effects, nor to significantly increase the perception of the system as trustworthy.
Accordingly, we propose the following:
Hypothesis 2 (H2). 
As long as the system proves reliable, transparency by means of explanations does not affect trust development as compared to a lack of transparency.

2.3. Trust Violation and Restoration

Due to the dynamic nature of trust, it may be that, after an AI-based system proves reliable throughout an interaction, something happens that compromises people’s trust in it, their acceptance of the system, and future interactions with it [57]. This notion is particularly important for new technologies such as automated vehicles, as early significant trust breaches among the public may compromise their long-term adoption. In the taxonomy of events that can cause such trust breaches, ref. [58] identify four types of failures related to poor design choices, system failure, behavior that goes against users’ expectations, and users’ misbehavior.
Several studies support the idea that the types, timing, and recurrence of failure may affect trust in different ways. For instance, Desai et al. found that early mistakes have more negative effects on trust than mistakes that occur later [59], while other experiments show that humans tend to take over control from robots with low levels of competence [60], or that even as little as two trust violations are sufficient for trust to be significantly eroded [61]. Further results indicate how faulty robots are considered to be significantly less trustworthy and reliable than the those which performed successfully, but also that mistakes do not necessarily affect participants’ willingness to follow the robot’s instructions [62]. Finally, individuals’ characteristics, such as perception of and disposition towards risk [63,64], as well as willingness to forgive, age, and experience, also emerge as factors that may play a role in determining the degree of trust erosion after a violation [61].
Alsom in [58], trust restoration strategies are introduced. Important examples are apologies, promises, remedial trustworthy behavior, and explanations. Importantly, compared to the other trust restoration strategies, explainability comes with one major advantage. In this regard, studies suggest that perceiving an anomaly in a system’s behavior represents the main trigger for an explanation request [65,66] and that providing explanations for such anomalies (and mistakes), may result in increased trust and reliance by shedding light on the causes of the anomalous behavior rather than just offering a restructuring of the relationship [31,39,67]. At the same time, high levels of trust in a faulty system may still be dangerous, even if the system can explain its mistakes. In this regard, studies suggest that explanations may not only restore trust after a violation, but also dampen it in case people overtrust a nontrustworthy system [14,30]. Ref. [39] suggests that providing more informative explanations and instructions about how the system operates may mitigate unwanted effects. Accordingly, studies on automated vehicles indicate that the negative effects on the trust of vehicles’ mistakes that lead to, for instance, near crash events need to be mitigated and that transparency may play a key role in that [68,69,70].
Taking into account the aforementioned considerations on trust violation, as well as the role of explanations as a trust restoration strategy as it emerges from the literature, we propose the following:
Hypothesis 3 (H3). 
After a faulty recommendation, the groups that experience such a malfunction will report lower trust ratings than groups without malfunction.
Hypothesis 4 (H4). 
The group with explanations after the malfunction will experience a greater increase in trust than the group without explanation.

3. Method

3.1. Experimental Design

To test our hypotheses, a 2 × 2 mixed design with the following independent variables was implemented: system malfunctioning (correct/faulty), transparency (with/without explanation), and exposure time (measured over seven days). The system’s malfunction and transparency were manipulated as between-subjects variables and exposure time was a within-subjects variable. For this purpose, we mimicked, through the Wizard of Oz methodology, an abstract-generating assistive system named PLANT. The Wizard of Oz methodology entails that the system’s autonomy and agency were simulated in order to conduct research on the way that humans react to its appearances and actions. As such, it allows for the study of user interactions and to gather feedback on the system’s design without actually implementing full autonomy [71].

3.1.1. Use Case: PLANT as a Personalized Assistive System

In the context of our study, the assistive component was developed by making the system support participants with the task of learning new technology-related texts. Regarding the content of each text, they had to take a quiz with five questions. To meet its goal, the system provided personalized recommendations on the most relevant parts of text (i.e., abstracting support) in order to prepare participants for upcoming quizzes about the content of this text. While participants always had the option to access the full texts, accepting PLANT’s recommendations resulted in time savings in preparation for the quizzes. Conducting the study with an assistive system providing recommendations allowed for a certain degree of generalization of the results, as platforms of this kind are very common across different types of AI-based technologies.
When participants were introduced to the system, they were explained that the recommendations were generated through the system’s Natural Language Processing (NLP) algorithms, while in reality the researchers behind the project produced and controlled them via the Wizard of Oz methodology. Thus, NLP algorithms were meant to represent the core of the automated features of the system by demonstrating the ability to interpret and comprehend human language. Even though these kinds of algorithms (and their mistakes) were simulated in order to conduct the research in a controlled manner with a focus on human reactions and experiences to automated systems, the goal was to produce a simulation that was very close to reality. In terms of the NLP systems that we were simulating, we focused on deep learning models that are trained for automatic summarization in a specific domain. Participants were told that the goal of the experiment was to test the beta testing version of the system’s functionalities in order to provide feedback to the developers. Crucial to note here is that the experiment took place before the breakthrough of ChatGPT, which meant that NLP algorithms and deep learning models in text analysis were still a rather abstract theme for most participants. Furthermore, the general focus of our study was mostly to understand trust dynamics with regard to AI-based systems in general; NLP systems simply functioned as a specific instance of such systems. In this context, the mimicked nature of PLANT ensured the controllability and reproducibility of the study, as no actual malfunctions could occur.
Given that PLANT was presented as a personalized assistive system with a focus on summarization, one of its key features was the range of customization options. These included alerts and notifications, via either email or (optionally) SMS, with reminders of upcoming quizzes and suggestions to change the scheduling and timing of one’s preparation. Additionally, participants could receive performance-based insights into their use of the recommendations, switch between ‘light’ and ‘dark’ themes for the interface, and personalize the text font. Perhaps more importantly, participants could personalize their learning style by choosing among four different options (see Figure 1, Figure 2, Figure 3 and Figure 4). Specifically, these were the following:
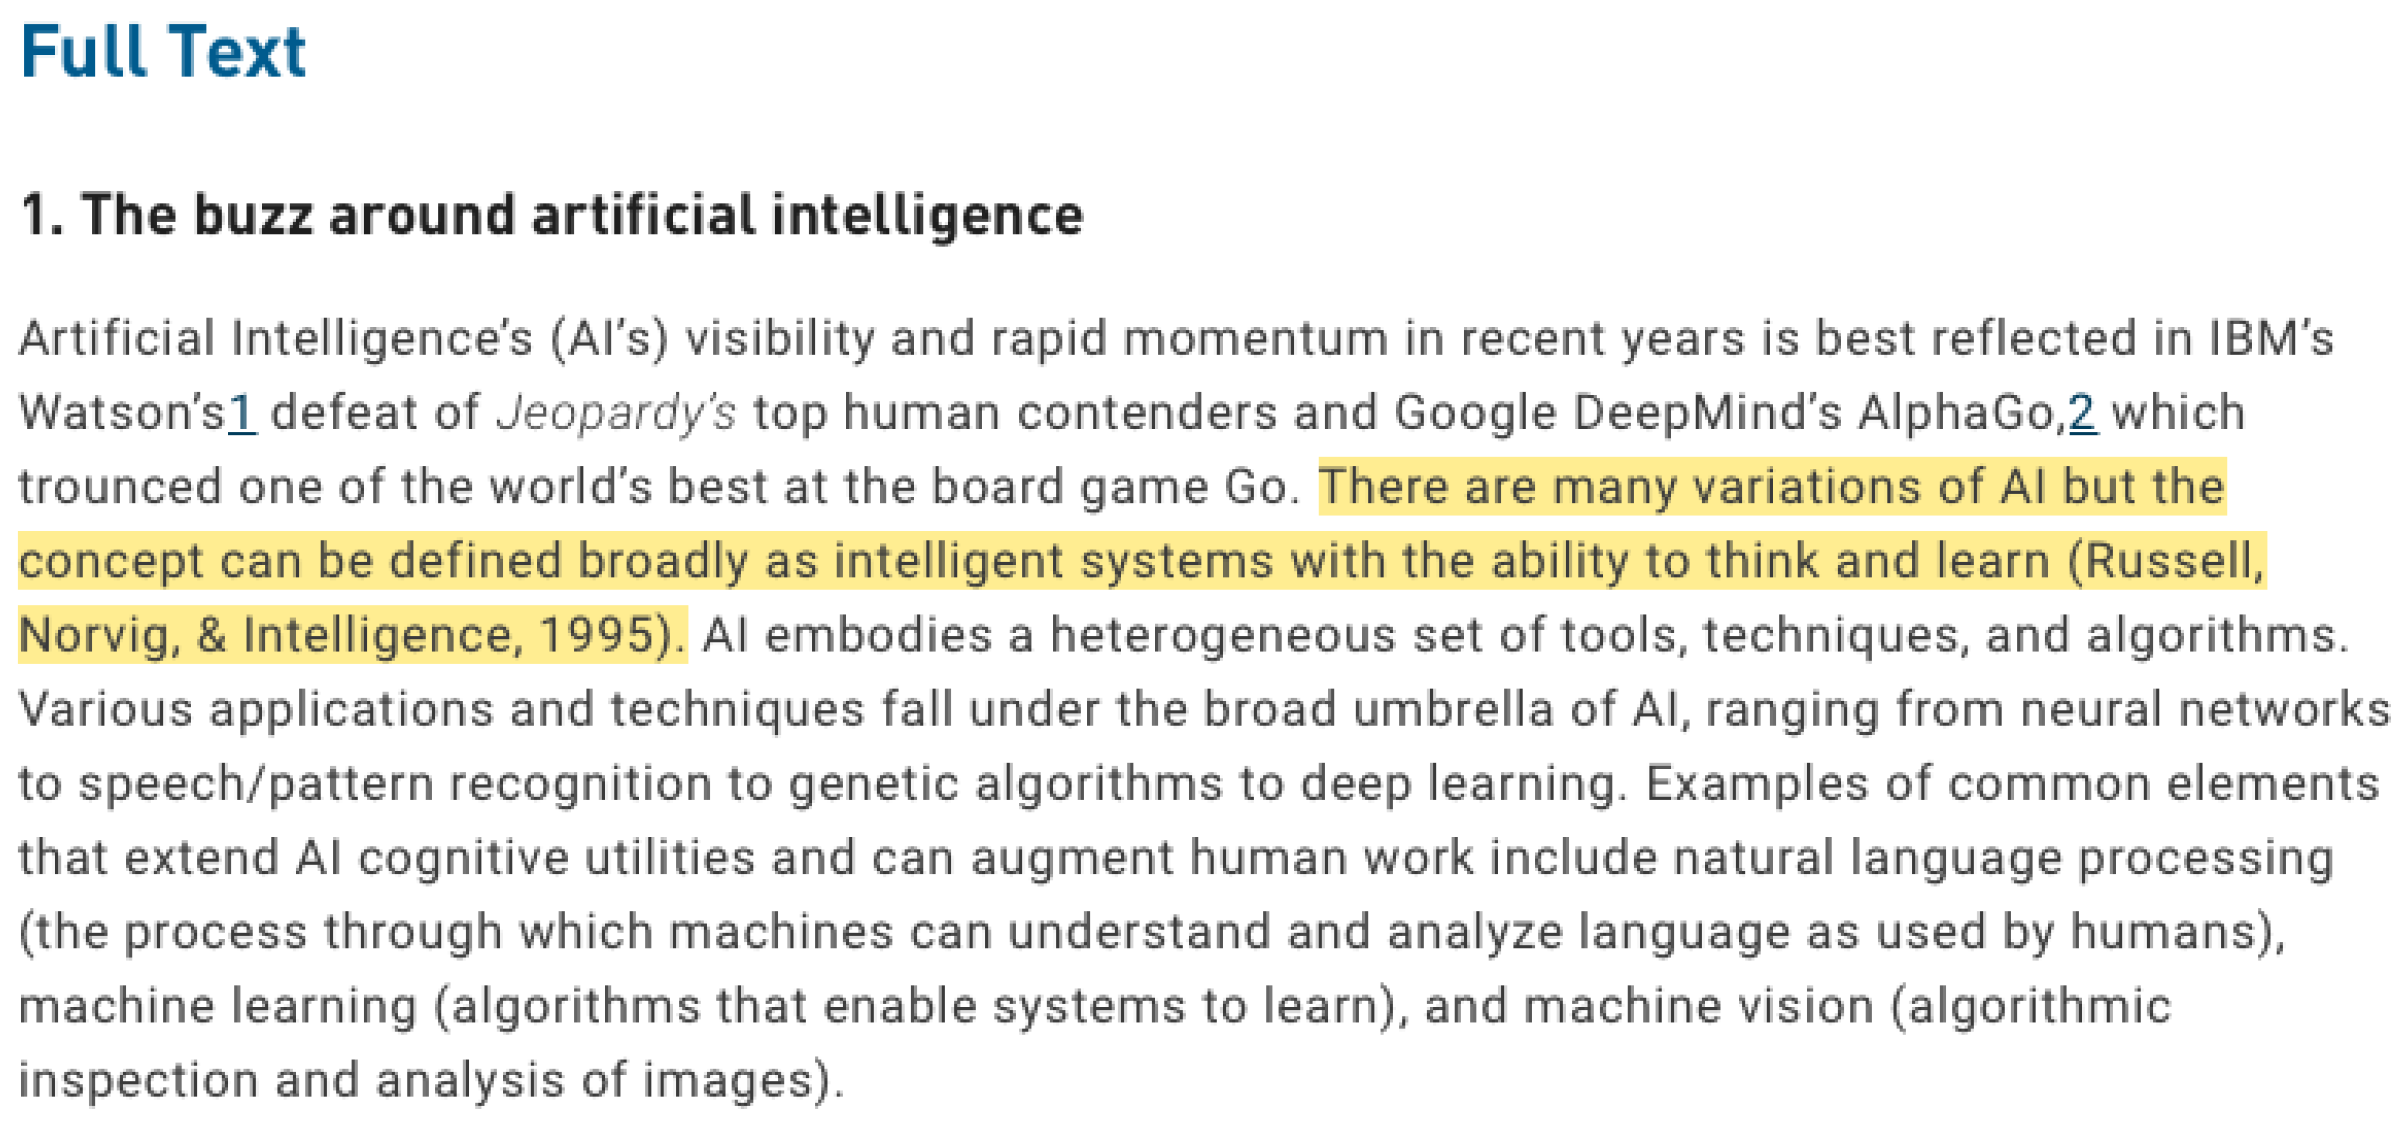
  • Kinesthetic: Full text with highlights.
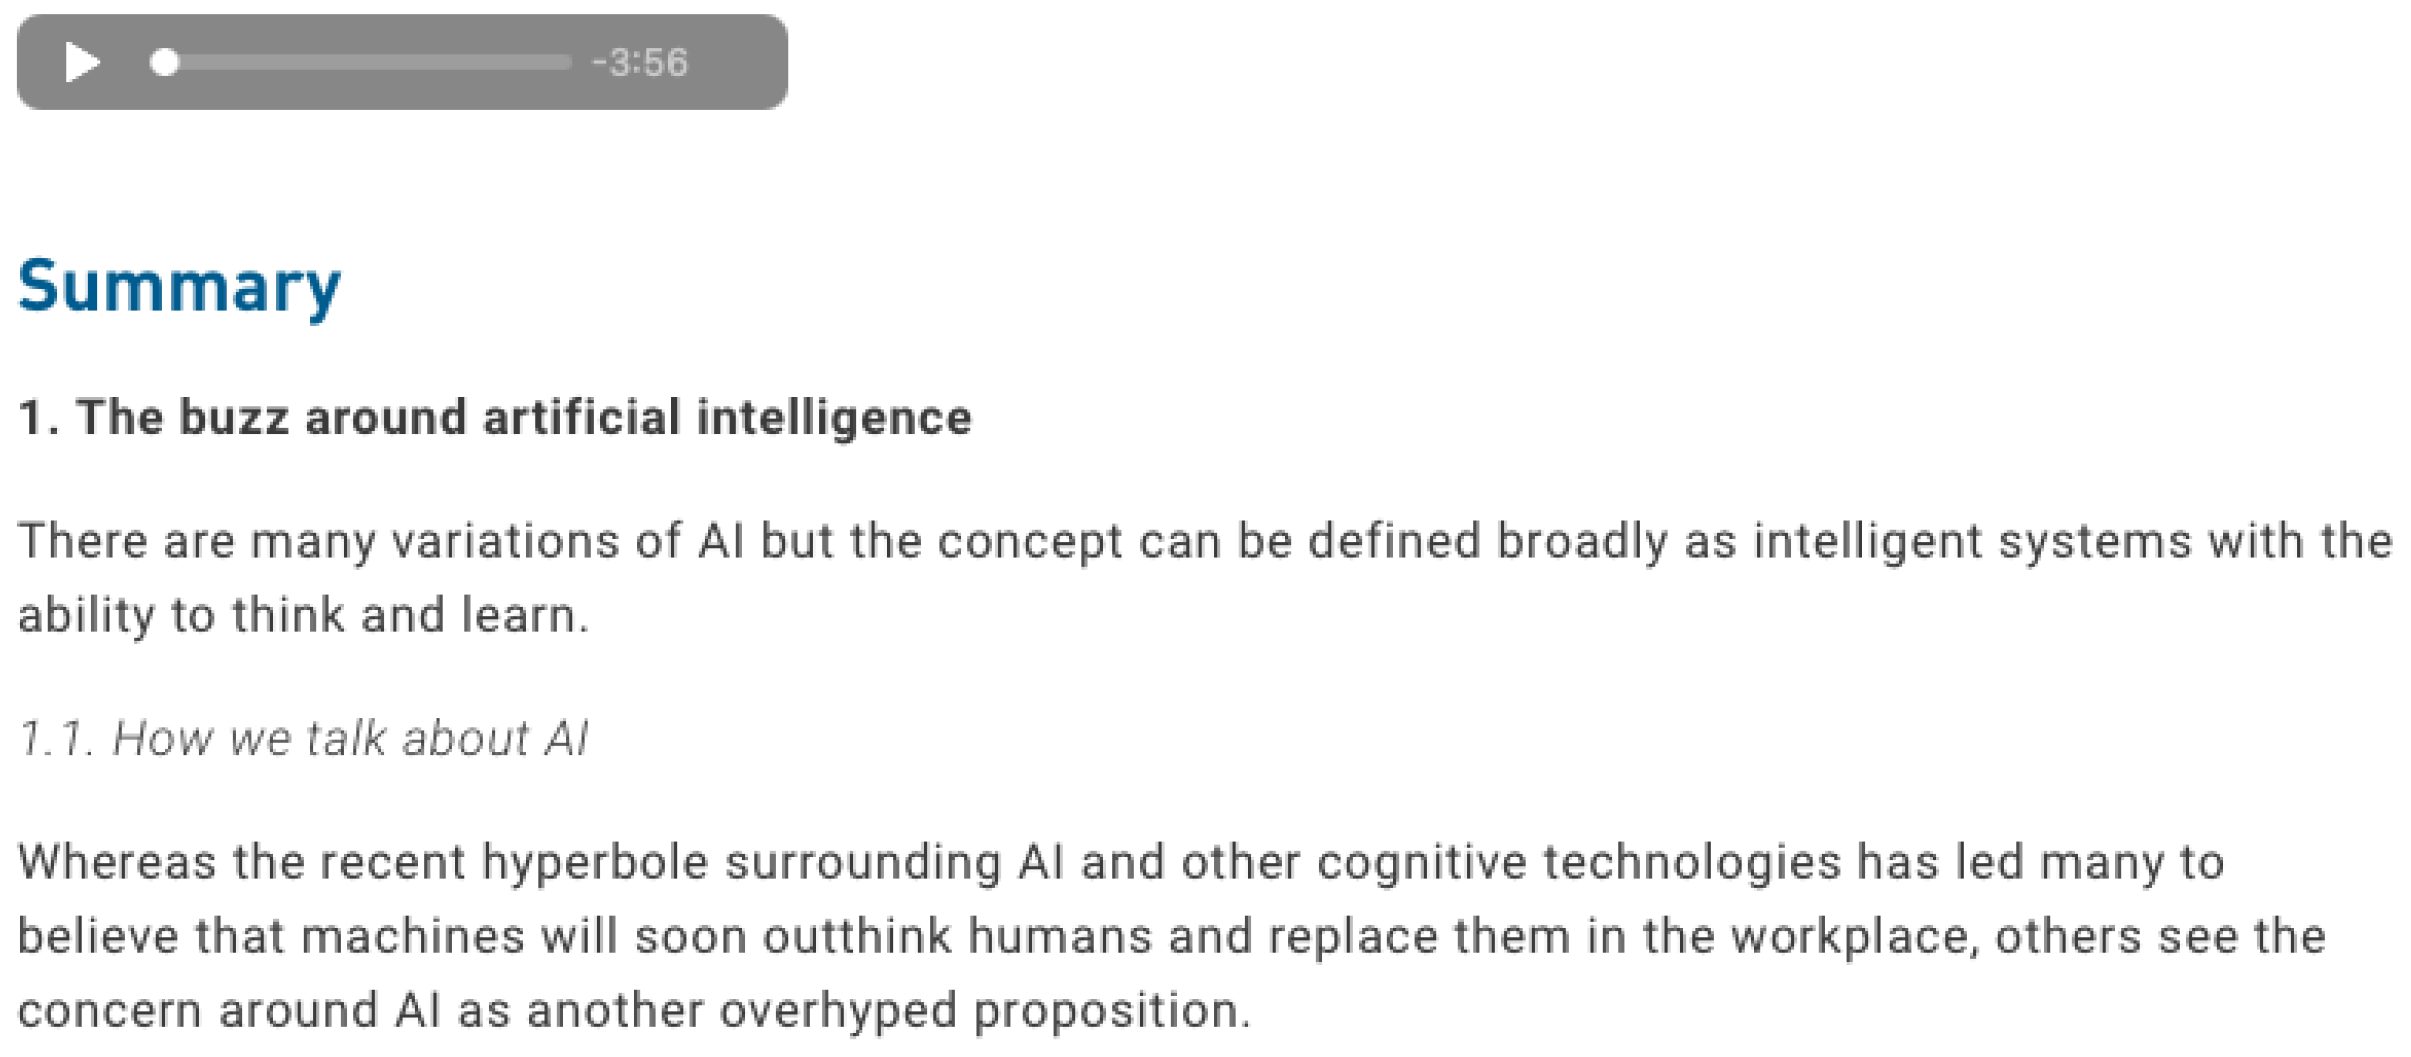
  • Auditory: Reading and listening to the summary.
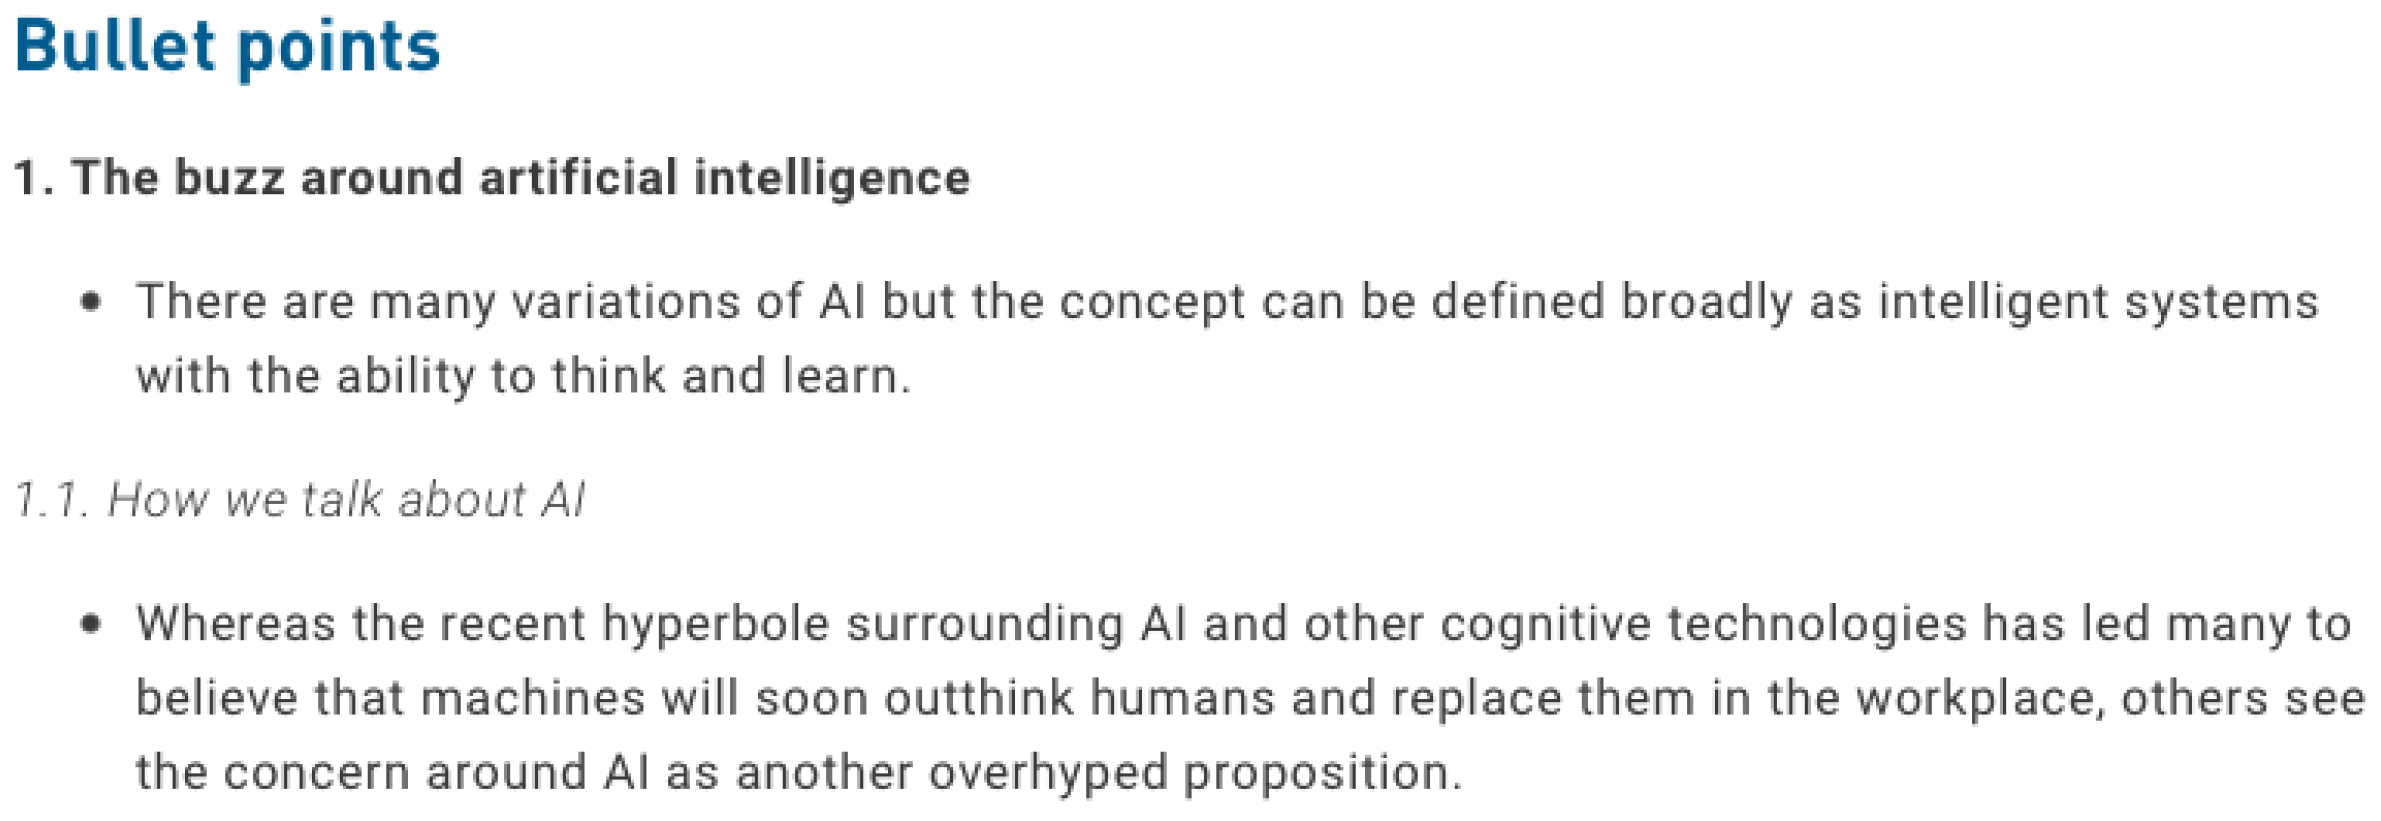
  • Reading/Writing: Bullet points.
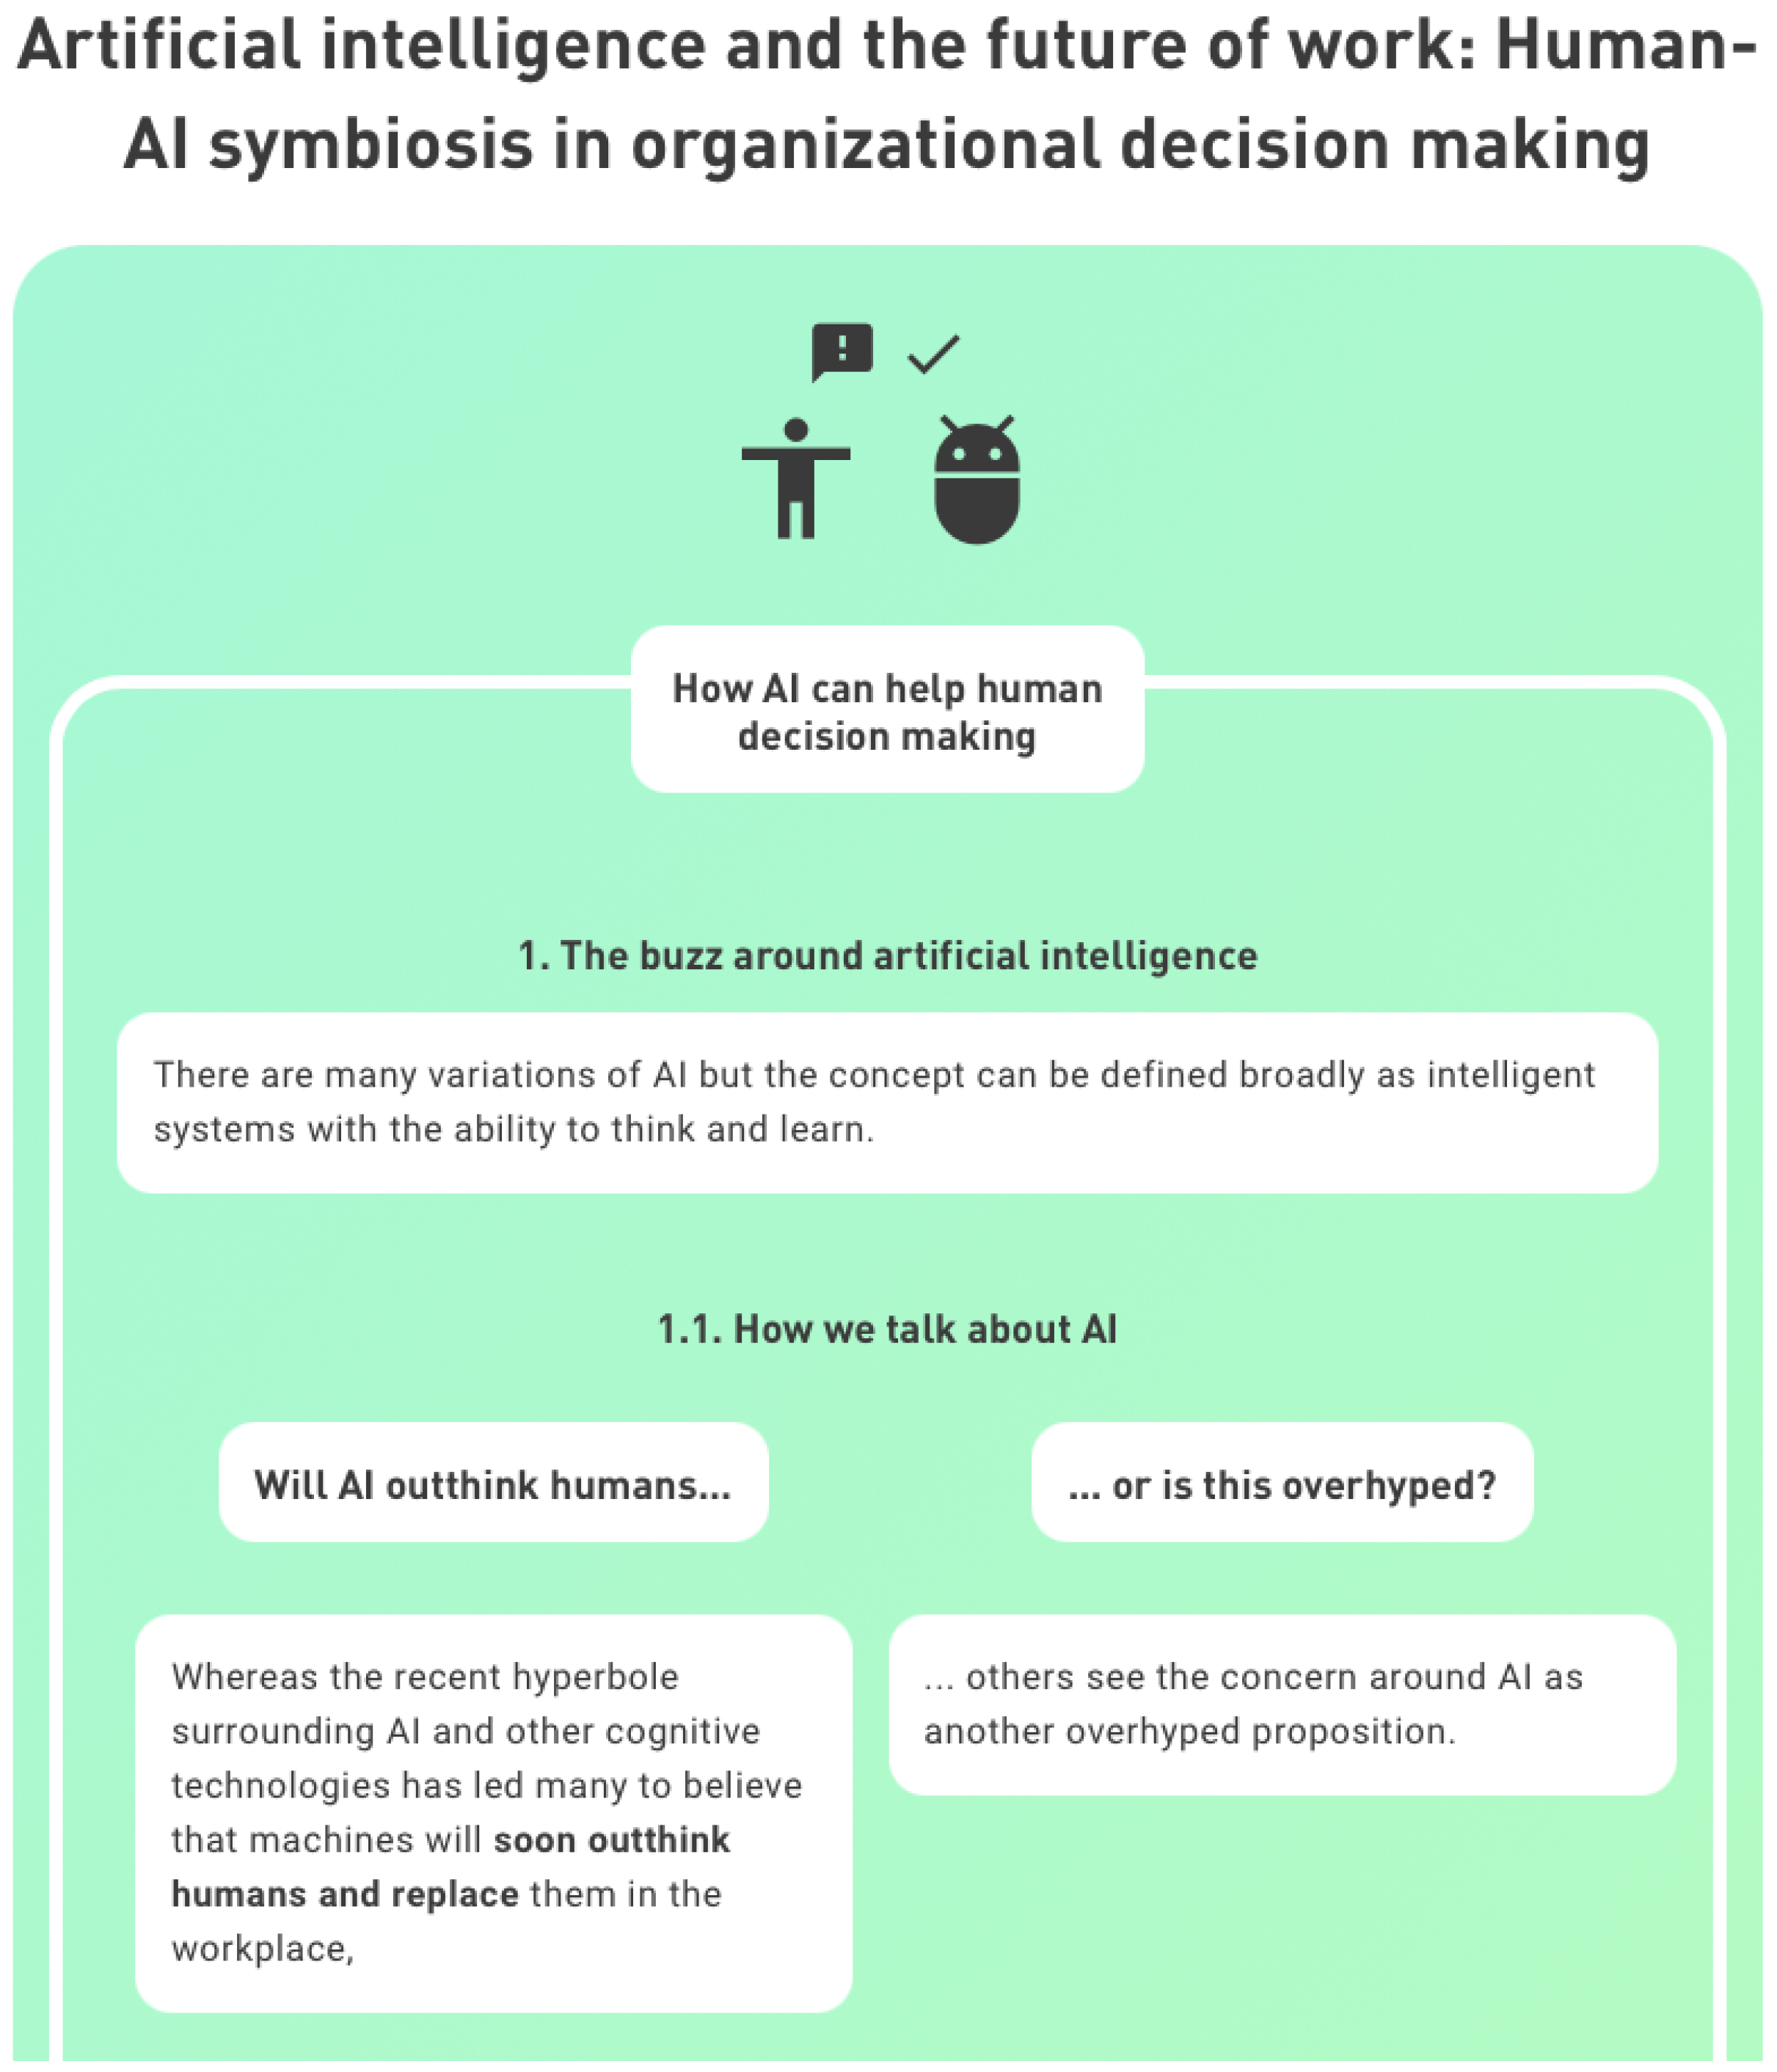
  • Visual: Graphical representation.
Figure 1. Kinesthetic learning style. The kynesthetic learning style consists of highlighted portions of the original full text.
Mti 08 00020 g001
Figure 2. Auditory learning style. The auditory learning style consists of a textual summary of the original content and an additional auditory reading of the summary.
Mti 08 00020 g002
Figure 3. Reading/writing learning style. The visual learning style consists of a graphic rendering of the key points of the original full text.
Mti 08 00020 g003
Figure 4. Visual learning style. The reading/writing learning style consists of a series of bullet points containing key chunks of the original full text, adapted from the summary.
Mti 08 00020 g004
What each of the four learning styles respectively entails will now be briefly described. The ‘kinesthetic’ learning style presented the full text with essential sentences highlighted in yellow in text. The ‘auditory’ style was a shortened version of the full text consisting of the highlighted text passages only, to which participants could listen to. Additionally, the summary featured headings and subheadings corresponding to the sections of the full text. The ‘reading/writing’ style was adapted from the summary, with the essential passages slightly changed or shortened to create a list of appropriate bullet points. The headings and subheadings of the summary were also shown in the list of bullet points. The contents of the ‘visual’ were derived from the bullet points by shortening and modifying the essential passages. In order to distinguish between different parts of the text, the sections were colored differently, and icons were used to support the text. The infographic would automatically switch to a different set of colors if the user turned on the dark theme. The highlights, summary, and bullet points were designed by the researchers responsible for the study using the edit tab in the backend of the web application. The visualization was created with CSS classes based on the Flexbox Grid (http://flexboxgrid.com, last accessed 19 February 2024) system.
Based on how participants answered an initial questionnaire, the VARK Questionnaire Version 8.01 (https://vark-learn.com/the-vark-questionnaire/, last accessed 19 February 2024), PLANT suggested one of these learning styles to each user. However, participants did not have to follow the system’s recommendation, and it was ultimately up to them to decide which learning style they felt most comfortable proceeding with. Furthermore, the full text was always available to all users, regardless of which learning style they selected. To keep experimental conditions controlled, the initial learning style choice could not be changed during the course of the study, and participants using different learning styles were evenly distributed across all experimental conditions.

3.1.2. Participants

The pilot study was conducted between April and July 2021. Over a period of seven weeks, each participant had a total of seven interaction sessions with PLANT, with one text and quiz per week. Participants were recruited from the Technical University of Vienna. A total of 75 participants took part in the pilot study, but only 13 participants completed it (2 female and 11 male). Their ages ranged between 22 and 54 years old (M = 26, SD = 8.51). The highest educational degree completed by the participants was a general qualification for university entrance (46%), bachelor’s degree (46%) and master’s degree (1%). The majority of participants were of Austrian nationality (85%).
After conducting the pilot study, we reduced the duration of study (from seven weeks to seven days, i.e., one text and quiz per day) and changed our incentive system (from random lottery to performance-based) to reduce the number of dropouts. The main study was conducted between June and August of 2021. Participants for the main study were recruited through the online platform Probando (https://www.probando.io, last accessed 19 February 2024) and were redirected to the PLANT website. Of the 205 participants who took part in the study, 171 completed it. Thus, the sample used for quantitative analysis consisted of 171 participants.
The majority of participants had Austrian nationality (72.5%). Participants’ age ranged between 19 and 69 years old, with an average age of 29.3 years (M = 29, SD = 9.11). The majority of participants (71%) identified as female. Furthermore, the majority of participants had a general qualification for university entrance as their highest educational degree (51%).
Before taking part in the study, participants were provided with information about the study and a consent form, which was approved by the Research Ethics Coordinator of the Technical University of Vienna. After creating an account and logging in, participants were directed to the homepage of PLANT, where introductory information about PLANT, a timeline, and assignments (quiz and questionnaire) were listed. Upon registration, they were asked to fill out a demographics questionnaire and the VARK Questionnaire. After submitting these questionnaires, PLANT suggested a learning style to each participant based on their answers to the VARK Questionnaire.

3.1.3. Experimental Conditions

Participants were then randomly assigned to one of the four experimental conditions. Hereby, we briefly describe each of them.
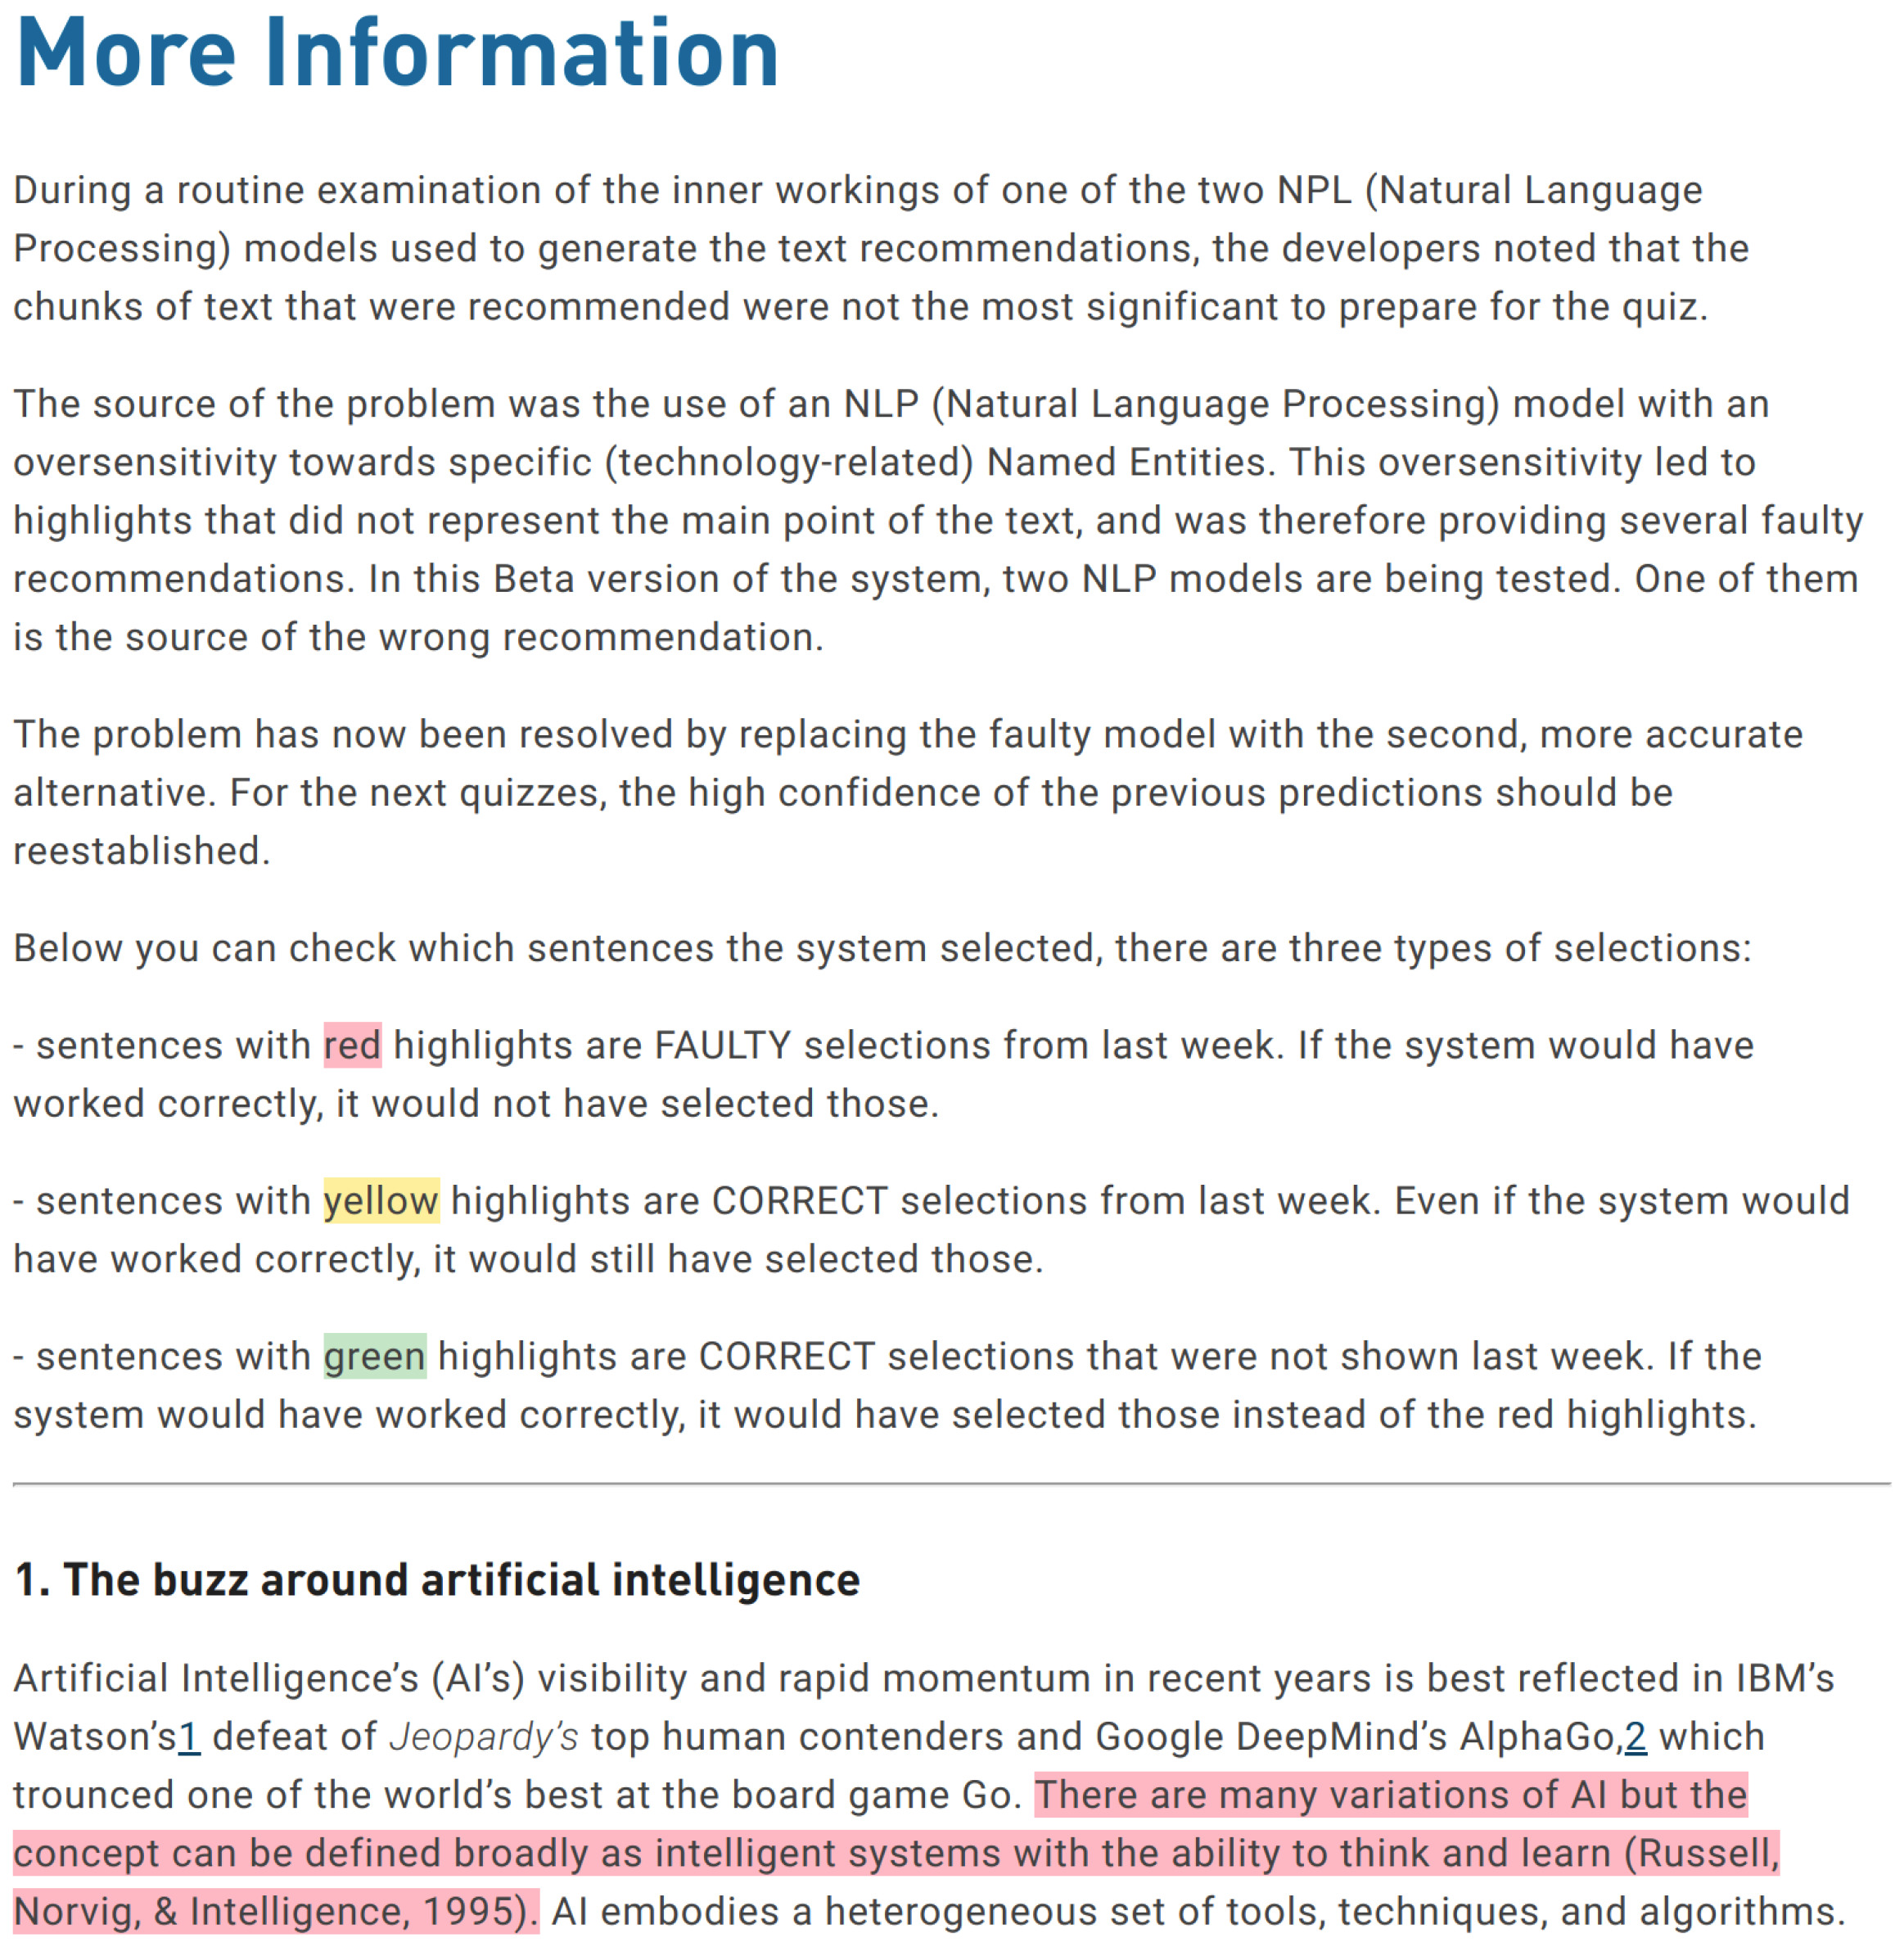
  • Correct with explanation (CwE): PLANT provides correct recommendations throughout the entire study. From the beginning and throughout the study, the system allows participants to access a short explanatory description of how recommendations are generated by means of NLP algorithms (i.e., a ‘global explanation’).
  • hlCorrect without explanation (CwoE): PLANT provides correct recommendations throughout the entire study but does not offer any explanation concerning its inner workings.
  • Faulty with explanation (FwE): From the beginning and throughout the study, PLANT allows participants to access a short explanatory description of how recommendations are generated. The system initially provides three correct recommendations to let participants familiarize themselves with the system and to support trust formation. At the fourth interaction, the system provides a faulty recommendation (i.e., trust violation) and offers an explanation focused on the inaccuracy of one of the algorithms used by the system. The final three recommendations are again correct.
  • Faulty without explanation (FwoE): PLANT initially provides three correct recommendations to let participants familiarize themselves with the system and to support trust formation. At the fourth interaction, the system provides a faulty recommendation (i.e., trust violation) and offers no explanation for the malfunction. The final three recommendations are again correct.

Malfunction Explanation

After the faulty recommendation, participants in the FwE group received a notification that a malfunction occurred in one of the NLP models used to generate the recommendations and that the issue had been solved for the upcoming quizzes. Furthermore, participants in this group had the chance to access a more detailed ‘local explanation’ (i.e., only concerning the reasons for the malfunction [56]) by clicking a ‘More Information’ button. As the Figure 5 shows, a plausible explanation for the faulty recommendation, and the confirmation that the issue had been resolved were provided. Additional graphic information showing which chunks of text were wrongly recommended and which ones should have been recommended instead was also displayed.

3.1.4. Procedure

Each participant was required to prepare for seven quizzes over the next seven working days. The texts that participants had to study were all related to emerging technologies and carefully selected by the team of researchers running the study. The order of the texts presented to participants across the four experimental treatments was fixed to mitigate the possibility of cheating (i.e., participants talking to each other about the previous quizzes). The order of the texts, respectively labeled from ‘A’ to ‘G’, plus ‘X’ and ‘Y’ (same text, but ‘X’ faulty, ‘Y’ correct) is reported in Table 1 below.
Each day over the following seven days, according to the provided timeline, a new text to study was made available on the homepage under the ‘assignment’ section. After studying the text, participants were asked to take a short quiz that consisted of five multiple choice questions about the text. Participants could take the quiz whenever they wanted during that day. After clicking on the quiz, they only had five minutes to complete it. After each quiz, participants were asked to fill out a post-test questionnaire that contained questions about trust and satisfaction levels.
Upon completion of the seventh quiz, the study concluded with a final questionnaire that contained questions about participants’ perceived trust in the system and perception of the system’s usefulness. After finishing the study, they received an email informing them of the review and payment process and inviting them to participate in an online interview and focus group about their perception of the whole experience (participation in the interview and focus group were optional and unpaid).
As a token of gratitude for participants’ time and support, all those who completed all the questionnaires (demographic and learning style, post-test, final questionnaire) received a fix payment of 35 EUR. Additionally, for each correct response to a quiz question, they received a bonus payment of 0.5 EUR (i.e., if a participant answered all five questions correctly in all seven quizzes, they received a bonus of 17.5 EUR, thus yielding a total compensation of 52.5 EUR). Participants in the pilot study received a participation certificate signed by the head of the research group. In addition, everyone who completed all questionnaires was entitled to participate in a lottery with ten prizes worth 200 EUR each. The lottery drawing was a live online event conducted in July under the supervision of a member of the research ethics coordination team at the Technical University of Vienna.
Eventually, participants were debriefed via email about the actual purpose of the study and the fact that the system was not actually automated and was operated by humans.

3.2. Measurements

3.2.1. Questionnaires

After each interaction throughout the seven days, trust perception was measured by means of an adapted version of the short, validated ‘Trust Perception Scale-HRI’, consisting of twelve items [72]. We used the short version as it is suitable for“trust measurement specific to measuring changes in trust over time, or during assessment with multiple trials” ([72], p. 214) and because it is specific to systems’ functional capabilities. A sample item was “What % of the time did PLANT perform exactly as instructed”. Three negatively worded items (Items 1.8, 1.10, 1.11) were reverse coded. Two items that directly and specifically referred to physically embodied robots were excluded from our questionnaire.
At the end of the seven-day study, participants were asked to rate the trustworthiness of PLANT. Trustworthiness was measured by means of an adapted version of the ‘Multi-Dimensional Measure of Trust’ [73], which consists of 16 items divided into four groups (namely capable, reliable, ethical, and sincere). Only the scale’s wording was adapted to fit our specific use case. Participants were asked to report how closely they associated PLANT with each item on a five-point scale ranging from “strongly disagree” to “strongly agree”. A sample item was “Predictable”. Cronbach’s alpha values for the four subscales were the followinf: capable = 0.86, reliable = 0.78, ethical = 0.89, and sincere = 0.88.
Finally, demographic information such as age, gender, highest educational degree, and country of residence was acquired.

3.2.2. Interviews and Focus Groups

After finishing the study, participants received an email and were asked whether they wanted to provide us with further feedback and insights by participating in optional interviews and focus groups. We conducted 18 semistructured interviews and a focus group discussion. The interviews focused on the following topics: the functionality and purpose of PLANT, the personalized learning styles, experiences concerning reliability, and explanations and interpretability of PLANT. As such, were meant to provide additional insights into the main themes of the study. The focus group concerned the same topic; however, there was a stronger emphasis on the explanations and malfunctions of PLANT, since the focus group allowed for fruitful discussions on these topics. We conducted the interviews and focus groups online with the help of video conference software (https://zoom.us, last accessed 19 February 2024). The data were collected in the form of audio recordings, which were subsequently transcribed using transcription software (https://www.otter.ai, last accessed 19 February 2024). Both the audio recordings and transcripts were stored in a protected database at the Technical University of Vienna. Only PLANT team members had access to this database. After the transcription of the interviews and focus group, we analyzed the textual data with the help of the Atlas.ti (https://atlas.de, last accessed 19 February 2024) qualitative data analysis software. The analysis was conducted using a qualitative coding methodology, thus assigning descriptive labels to the transcripts of the interviews and focus group discussion. The qualitative coding analysis was conducted by two different people. Several meetings were organized in order to discuss the direction of the coding process. Furthermore, the functionalities of the qualitative data analysis software provided a good overview of the major topics that emerged in the qualitative research.

4. Results

4.1. Quantitative Analysis

As mentioned in procedure, participants were randomly assigned to one of the four groups. Table 2 shows the frequency distribution of the groups. As each group was nearly equal in size (52/36 = 1.44 < 1.5), the multivariate test results are fairly robust.

4.1.1. Initial Trust Perception

An independent sample t test was conducted to compare the initial trust level (day 1) in groups with and without the explanation. There was no significant effect of the explanation on the initial trust level, t(169) = −0.59, p = 0.56, even though both groups with the explanation (namely, CwE and FwE) (M = 86.15, SD = 10.99) exhibited higher trust scores than the groups without the explanation (CwoE and FwoE) (M = 84.99, SD = 14.32). Thus, H1 is not supported.

4.1.2. Trust Development over Time in Groups without Malfunction

To assess the effect of the explanations on trust development over time, we looked at trust level in both groups with no system malfunction (i.e., CwE and CwoE). A repeated-measures ANOVA was performed to evaluate the effect of explainability and time on trust. Mauchly’s test indicated that the assumption of sphericity had been violated, χ 2 (20) = 88.31, p < 0.001, and therefore degrees of freedom were corrected using Greenhouse–Geisser estimates of sphericity ( ε = 0.73). The analysis revealed a main effect of time (F(4.36, 379.57) = 2.86, p < 0.05) in trust development, but the main effect of explanation (F(1, 87) = 1.64, p = 0.2) and the interaction between time and explanation (F(4.36, 379.57) = 0.34, p = 0.86) were not significant. As posited in H2, explanation did not affect the trust level in groups without malfunction.

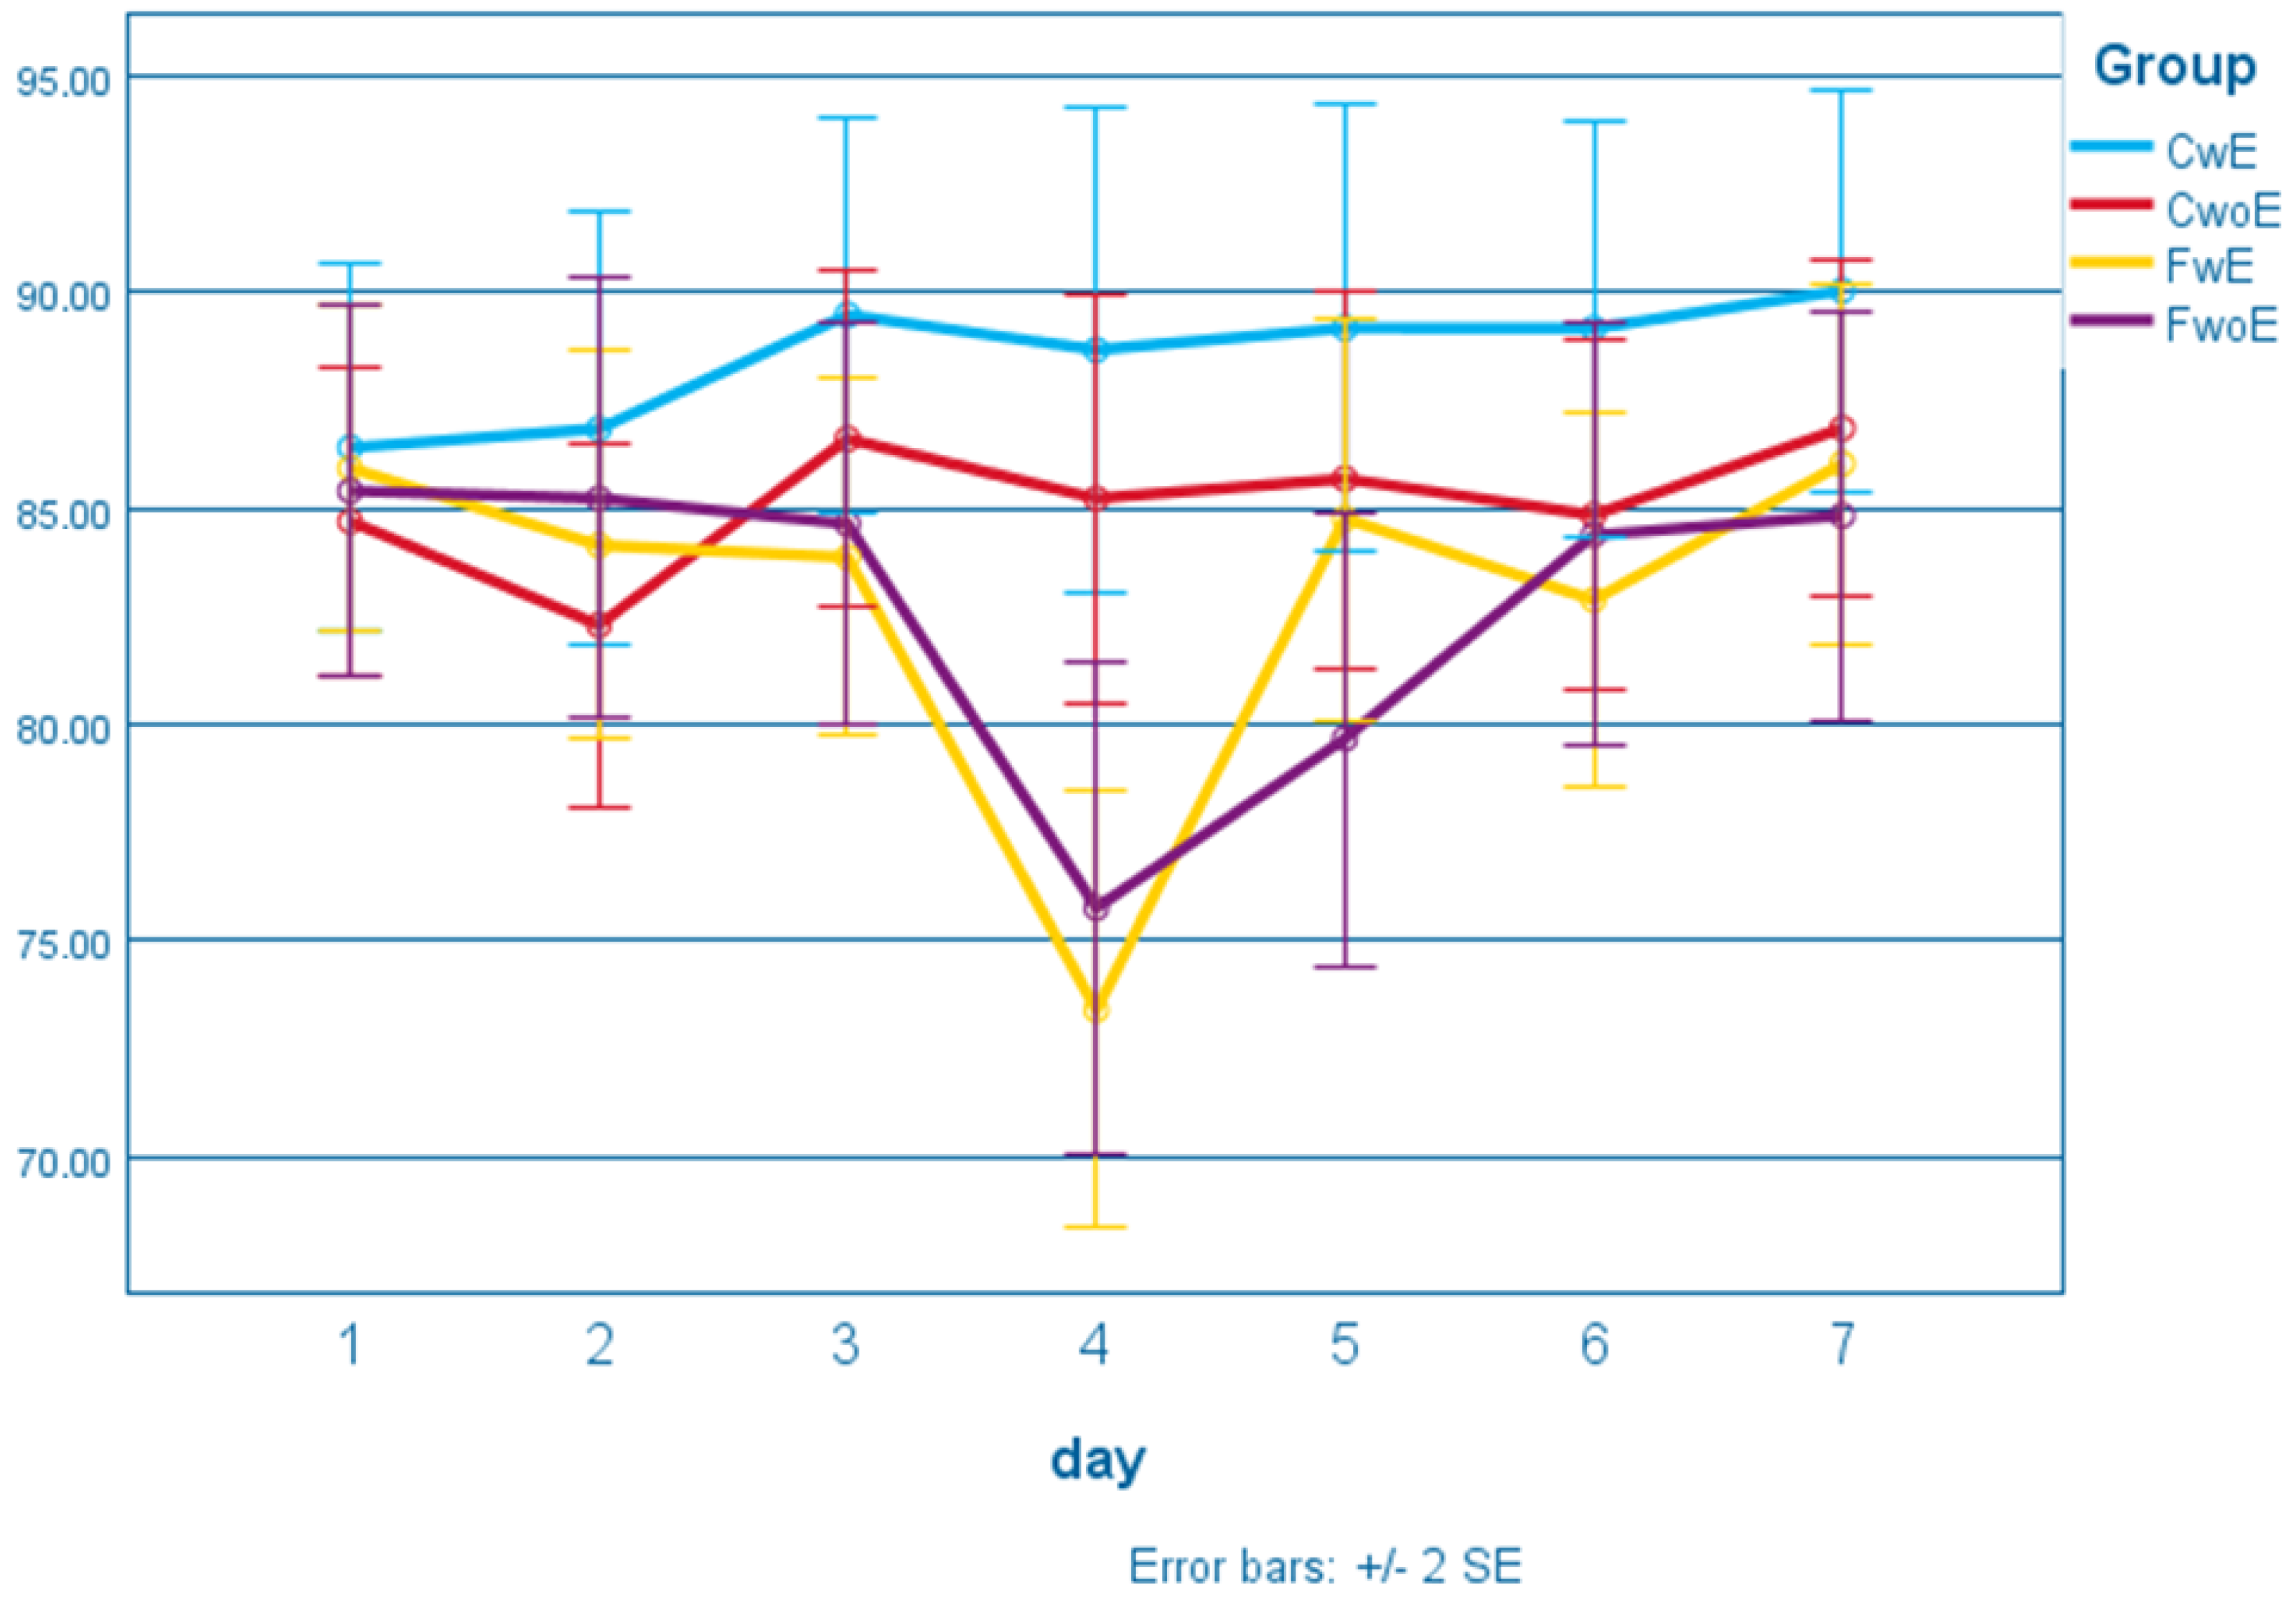
4.1.3. Trust Violation and Restoration

As shown on Figure 6, the trust level was lower on day 4 in groups with the malfunction, i.e., FWO and FWOE (Mean = 74.44), compared to groups without the malfunction, i.e., CWE and CWOE (Mean = 86.66). An independent t test revealed that this difference among groups with and without the malfunction was significant (t(169) = 4.68, p < 0.01). Thus, H3 is supported in this work. If the malfunction has a trust violation effect, we expect trust level to decrease from day 3 to day 4 for groups with malfunctions. A 2 × 2 ANOVA with malfunction as a between factor and time as a within-subjects factor was run. The analysis revealed a main effect of time (F(1, 169) = 30.74, p < 0.001), the main effect of explanation (F(1, 169) = 13.27, p < 0.001) and an interaction between time and explanation on trust (F(1, 169) = 19.22, p < 0.001) in the predicted direction. Thus, H3 is supported.
To assess the impact of explanation on trust restoration, we looked at the trust level in two groups with a malfunction when the system made a mistake (day 4) and functioned correctly again (day 5). On day 5, while descriptive statistics revealed that participants’ trust was higher in the faulty with explanation group (FwE: Mean = 84.77) compared to the faulty without explanation group (FwoE: Mean = 79.68) (see Table 3), an independent t test showed that this difference was not significant (t(80) = 1.31, p = 0.19). If providing an explanation has a trust restoration effect, we expect the trust level to improve from day 4 to day 5, especially for FwE group. A 2 × 2 ANOVA with explanation as a between factor and time as a within-subjects factor was run. The analysis revealed a main effect of time (F(1, 80) = 21.91, p < 0.001) in the predicted direction, and an interaction between time and explanation (F(1, 80) = 5.21, p < 0.05), but the main effect of explanation was not significant on trust (F(1, 80) = 0.13, p = 0.71). Thus, H4 is not supported.

4.2. Qualitative Analysis

The qualitative research provided useful outcomes to supplement the quantitative results. In what follows, we focus on three different major complementary insights of the qualitative research, namely the perceived accuracy and reliability of PLANT, perceptions of the malfunctions of PLANT, and how participants experienced system transparency in terms of explanations.

4.2.1. PLANT’s Accuracy and Reliability

Since trust development over time was a central component of our study, we wanted to gain more insights regarding the perceived accuracy and reliability of the system. Participants generally provided constructive and positive feedback about their experiences with the assistance offered by PLANT. Crucially, several participants explained that after reading the original text, they gained an increased understanding of PLANT’s accuracy in relation to its assistance for the quizzes and thus argued that it strengthened their appreciation of PLANT being a reliable assistant. However, in some cases, it was also argued that curiosity about the way the system functioned, in turn, could translate to suspicions about how this was done in an automated manner. In this regard, an important insight was that several participants expressed a desire to gain more insight into how PLANT could achieve this kind of accuracy, regardless of whether the system malfunctioned or not.
This provides an important lesson about the experience of trustworthiness in the sense that trust in the system is not just an outcome of the experience of accuracy itself, but is likely influenced by the larger context within which people interpret the accuracy of automated systems. This could be particularly interesting in terms of achieving better explanations to improve the interpretability of assistive systems, since curious users can be provided with more detailed insights into how such systems function. To provide just a few examples, this can include background information about the systems’ developers or insights into the choices made during the development phase, and so on.
Furthermore, participants’ experience of accuracy and reliability was described as something relative to specific users’ needs. In our case, participants who were focused on receiving assistance for the test were mostly happy with the system’s accuracy, even if they had read the full text beforehand. Other participants were instead focused on getting a better understanding of the text content in general (and less focused on getting a good score in the test). Since texts can often be interpreted in different ways, they would occasionally complain about the accuracy of the assistance.

4.2.2. Perception of Malfunctions

PLANT’s malfunctions were a central element of the experiment and the subsequent quantitative analysis. Interestingly however, malfunctions were not always explicitly experienced as a prominent issue by the participants, who reported to not be always bothered by the malfunction. Some participants were, in fact, rather forgiving, due to the very notion that the system was fully automated. In other terms, the automated system did something that could be experienced as a malfunction by participants, but at the same time, some participants expressed this as a way of humans and automated systems to adjust to each other. This emphasis on two different types of intelligence, human versus artificial, can therefore be considered important for the way people interpret and judge such malfunctions.

4.2.3. Transparency through Explanations

Finally, with regard to PLANT’s explanations, several interesting insights emerged. The focus group provided particularly interesting results concerning the general role of explanations in automated systems. First of all, the word “black box” played an important role in this context, as it was used to emphasize how it was still not clear to participants how exactly the mechanisms behind PLANT’s assistance worked. Even though this was obviously related to the fact that this was a Wizard of Oz study, in hindsight, a possible solution would have been to provide optional insights that provide clear, additional explanations about the way NLP systems develop text summaries.
It was interesting to see that several participants exhibited strong curiosity regarding the provided explanations. When asking for more clarification about this curiosity in the focus group, a consensus emerged that different types of users should be provided with different kinds of explanations. That is, participants agreed that users with different backgrounds are likely to be looking for a divergent range of insights. For instance, the technical details behind the system might be interesting for a specific group of users, whereas others are likely to focus more strongly on the application’s user-friendliness. It is therefore recommended that different explanations be able to be accessed through different channels. An example would be to not only implement explanations in the system itself but also provide further explanations on the website about how such automated systems work through social media channels or as part of personalized insights. Explainability in this sense can be seen as a term denoting a general tendency to provide explanations in many different ways.
In relation to this general tendency, several participants argued that even if they would not access such explanations or insights into the data, they would prefer such explanations and insights to be available nevertheless. This is an important insight from the qualitative research, since it shows that even though explanations are not always accessed immediately (since people lack the time or the motivation to go through them), their very availability could help to create the impression of a system that gains a positive reputation and authority based on features like transparency and explanatory behavior.
Finally, in relation to such a larger framework, a topic that came up concerned the authority embedded in the explanation. Crucial here is to understand the way in which explanations are embedded in a larger array of expectations about a system’s quality. Explanations can help to build and restore trust when they are seen as dependent on the perceived authority of the entity that provides the explanation. In other words, if the explanations are provided by people, institutions, or companies that are already seen as reliable and transparent, participants reported that they would be much more likely to take the explanations for malfunctions or irregularities seriously.

5. Discussion

This paper addresses the gap in the literature concerning longitudinal studies on trust development [23,25,30,74], and, as such, it contributes to the understanding of trust dynamics in repeated interaction with AI-based systems. Specifically, our investigation sheds light on the combined effects of an assistive system’s level of performance and explainability (or lack thereof) on people’s attribution of trust over the course of repeated interactions. Furthermore, thanks to the combination of quantitative and qualitative methodologies, other insights emerged in this study that deserve to be discussed and further investigated.
Concerning initial trust formation, the literature suggests that that initial explanations may mitigate the effect of personal dispositions and external influences in determining trust formation in new technologies [25,32,34,42]. As our results do not show any significant difference in terms of trust formation across the different groups, H1 is not supported.
There are some possible interpretations of our findings. In the first place, the literature indicates that explanations of specific predictions (i.e., local explanations), rather than general ones that clarify how a system works (i.e., global explanations) are the most likely to improve trust [56,75]. The fact that, in this study, the initial explanation provided by the system fell into the second category might clarify our results. However, another possible explanation lies in the role played by ‘institutional cues’, that is, the authority and reputation of third parties in determining how likely people are to trust new technologies with which no interaction has taken place [28,34]. Such third parties may be a reputable vehicle manufacturer, governmental institutions, or other such entities. In our study, participants were aware of the fact that the study was conducted by university researchers. In turn, this may have been perceived as an ‘institutional cue’ and primed participants’ initial perception of the system in terms of benevolence.
Results from the qualitative analysis back up this interpretation, as in the interviews and the focus group, the role of ‘institutional cues’ in the form of a ‘concealed authority’ behind the system’s explanations emerged. While it was not possible to determine with certainty how the researchers’ authority influenced participants’ perceptions of the system, particularly in terms of initial trust (e.g., whether they perceived the system as benevolent), the fact that participants brought up the topic, specifically in relation to the reliability and transparency of such a ‘concealed authority’, corroborates the idea of ‘institutional cues’ as a determining factor for trust formation. This consideration has some important implications, particularly for those applications such as automated vehicles, in which the authority of the well-reputed companies marketing automated vehicles and other technologies heavily relying on AI might influence or even distort the narrative around (and consequently people’s perception of) the technology’s reliability and safety, with possible repercussions in terms of liability, responsibility distribution, and lawfulness [76,77,78].
Regarding continuous trust development, studies provide contrasting evidence concerning explanations’ impact on trust development throughout an interaction, thereby suggesting alternatively that they are useful if not fundamental for continuous trust building [25,56], superfluous [53,54], or even detrimental [12,55]. In line with H2, our study did not find any significant differences in terms of trust among the groups with and without explanations, as long as the system performed accurately.
This corroborates the idea that, after initial trust is established, it will adjust primarily according to a system’s accuracy and reliability [41,42,47,48]. In such cases, explanations may become superfluous and do not necessarily increase people’s trust in an artificial agent. Supporting this position, the qualitative analysis showed that some participants read the original text alongside PLANT’s recommendations to check the system’s accuracy. In other words, participants’ perception of PLANT as a reliable assistant strengthened as they checked for themselves and after accuracy was confirmed by the initial quizzes. However, at the same time, the qualitative analysis also indicated that even when participants did not access the explanations, their very presence added to the positive perception of the system. A possible interpretation for this is that explanations should not be forced upon users, particularly during the initial phases of an interaction and as long as a system performs accurately. Rather, to support trust development, it may be good design practice to implement informative explanations (particularly local ones) and let the users decide whether they need them or not [20,79].
With regard to trust violation and restoration, this study found that system malfunctions negatively influence trust ratings, as they are perceived as trust violations. This finding supports H3, is consistent with that of a driving simulation experiment that found that unexpected malfunctions lead to trust decrease [68], and generally corroborates the results from the literature about the negative effects of errors and malfunctions on trust [58,62,70]. Interestingly, however, during the interviews and focus groups, some participants reported that they were not too negatively surprised by the system’s faulty recommendation. Because they were aware of its nonhuman nature, they expressed forgiveness. The results from [59] suggest that mistakes and malfunctions that occur early on during an interaction affect trust more negatively than later ones, while [61] notes how trust erodes much faster after multiple errors. In our case, the system only made one mistake while being accurate before (first three interactions) and afterwards (last three). This relatively high accuracy may clarify why several participants were so tolerant toward the system’s faulty recommendation, even though it still yielded significantly lower trust ratings. Furthermore, the fact that the interaction posed no risk for the participants may further clarify why some of them were so tolerant, as the literature indicates that trust ratings are the lowest in high-risk situations [16,44,57].
Finally, our results did not show any significant difference in terms of trust restoration with and without explanations. Hence, H4 was not supported. However, as Figure 6 shows, a clear trend emerged concerning the explanations effectiveness as a trust restoration strategy. The qualitative results corroborate this trend, as several participants argued that even if they would not access the explanations, they would prefer such explanations and insights to be available nevertheless. Recalling what was mentioned above in relation to trust restoration strategies [58], the fact that, after the malfunction, the system provided accurate recommendations offers a possible interpretation of our results. In other words, participants who did not receive an explanation could still benefit from the system’s ‘remedial trustworthy behavior’ [58]. Additionally, the qualitative analysis shows that some participants did not understand how the system worked, even after explanations were provided. Additionally, comments from participants with different levels of familiarity and expertise with the technology suggest the need for different explanations that provide insights at different levels of complexity. This relates to user experience concepts concerning systems’ usability and the effects this has on trust development [79]. Furthermore, our finding is in line with studies that suggest personalizing explanations as a means to support users’ confidence, familiarity, and acceptance [39,67,80,81], and it reinforces the idea that an explanation which is not understood serves little to no purpose in terms of supporting trust calibration [20].

6. Conclusions and Future Work

This paper investigated, from both a quantitative as well as qualitative perspective, the dynamics of trust development in the context of repeated interactions with an assistive system. As this kind of technology is being integrated in a wide range of applications, such as automated vehicles, personalized recommender systems, social media, and so forth. Our results further the understanding of how different system’s features contribute to people’s perception, attribution of trust, and acceptance of such systems.
While our results did not show significant differences in terms of initial trust ratings across the groups, the role of ‘institutional cues’ emerged as a potential key determining factor for trust formation. In this regard, as initial trust may determine how new technologies are accepted into society and used, a limitation of this study is that it did not fully consider the consequences of this phenomenon. Future work could control for the impact of different external parties’ reputation and investigate, perhaps on a more explicit level, their priming effects of on trust formation. Furthermore, our results show that once a system’s reliability is established through repeated accurate performances, explanations may be superfluous. However, our qualitative analysis showed that their availability may add to people’s positive experience of a system in terms of transparency and reliability. Future work shall focus more in detail on how the presence of different types of explanations (e.g., local and global) influence continuous trust development.
Moreover, our results corroborate existing evidence on how a system’s malfunction compromise trust. While our study shows a significant trust decline after a wrong recommendation, participants also expressed tolerance towards the error, which might highlight the timing and single occurrence of the malfunction as a limitation of this study. At the same time, a larger and more gender-balanced sample might show significant correlations between personal factors such as general risk attitude and affinity for technology and tolerance towards mistakes and malfunctions. Building upon these insights, future work shall focus on comparing how different types of malfunctions, number, and timing of their occurrences affect trust in a longitudinal context.
Finally, despite showing a trend suggesting that explanations led to faster trust restoration, our study did not yield significant results in this regard. As some participants noted that it was not clear how the system worked, even after the explanation, a possible limitation concerns participants’ understanding of the causes of the faulty recommendation in relation to the quality of the explanations provided by the system. Furthermore, the system’s ‘remedial trustworthy behavior’ in the group without explanations may also provide an interpretation of our results. Future work should investigate more rigorously the effect of different kinds (i.e., personalized and at varied levels of detail) of explanations and other trust restoration strategies, such as apologies and remedial behavior, on users’ experience of a system in terms of reliability, transparency, and trustworthiness. Likewise, a study designed to explicitly assess how people understand different types of explanations would help to shed light on the dynamics of understanding explanations and their effect on trust development.

Author Contributions

Conceptualization, G.P., S.Z., J.d.P., S.T.K., A.R. and M.F.; Methodology, G.P., S.Z., J.d.P., S.T.K. and M.F.; Validation, S.Z., J.d.P. and G.P.; Formal Analysis, S.Z. and J.d.P.; Investigation, S.Z., J.d.P. and G.P.; Data Curation, S.Z. and J.d.P.; Writing—Original Draft Preparation, G.P., S.Z. and J.d.P.; Visualization, S.Z., J.d.P. and G.P.; Supervision, S.T.K., M.F. and A.R.; Project Administration, S.T.K. and A.R.; Funding Acquisition, S.T.K. All authors have read and agreed to the published version of the manuscript.

Funding

Funding for this study was contributed by Mercedes-Benz AG.

Institutional Review Board Statement

The study was approved by the Research Ethics Coordinator of the Technical University of Vienna.

Informed Consent Statement

Informed consent was obtained from all subjects involved in the study.

Data Availability Statement

The data presented in this study are available upon request.

Acknowledgments

The authors would like to thank Georg Bixa and Reinhard Grabler for their support in developing PLANT.

Conflicts of Interest

The authors declare no conflicts of interest.

References

  1. Gill, H.; Boies, K.; Finegan, J.E.; McNally, J. Antecedents of trust: Establishing a boundary condition for the relation between propensity to trust and intention to trust. J. Bus. Psychol. 2005, 19, 287–302. [Google Scholar] [CrossRef]
  2. McAllister, D.J. Affect-and cognition-based trust as foundations for interpersonal cooperation in organizations. Acad. Manag. J. 1995, 38, 24–59. [Google Scholar] [CrossRef]
  3. Zucker, L.G. Institutional theories of organization. Annu. Rev. Sociol. 1987, 13, 443–464. [Google Scholar] [CrossRef]
  4. Schoorman, F.D.; Mayer, R.C.; Davis, J.H. An integrative model of organizational trust: Past, present, and future. Acad. Manag. Rev. 2007, 32, 344–354. [Google Scholar] [CrossRef]
  5. Lewicki, R.J.; Wiethoff, C. Trust, trust development, and trust repair. In The Handbook of Conflict Resolution: Theory and Practice; John Wiley & Sons, Inc.: New York, NY, USA, 2006; Volume 2, pp. 92–119. [Google Scholar]
  6. Rotter, J.B. Generalized expectancies for interpersonal trust. Am. Psychol. 1971, 26, 443. [Google Scholar] [CrossRef]
  7. Simpson, J.A. Foundations of interpersonal trust. Soc. Psychol. Handb. Basic Princ. 2007, 2, 587–607. [Google Scholar]
  8. Lee, J.D.; See, K.A. Trust in automation: Designing for appropriate reliance. Hum. Factors 2004, 46, 50–80. [Google Scholar] [CrossRef]
  9. Schaefer, K.E.; Chen, J.Y.; Szalma, J.L.; Hancock, P.A. A meta-analysis of factors influencing the development of trust in automation: Implications for understanding autonomy in future systems. Hum. Factors 2016, 58, 377–400. [Google Scholar] [CrossRef] [PubMed]
  10. Holliday, D.; Wilson, S.; Stumpf, S. User trust in intelligent systems: A journey over time. In Proceedings of the 21st International Conference on Intelligent User Interfaces (IUI), Sonoma, Ca, USA, 7–10 March 2016; ACM: New York, NY, USA, 2016; pp. 164–168. [Google Scholar]
  11. Basu, C.; Singhal, M. Trust dynamics in human autonomous vehicle interaction: A review of trust models. In Proceedings of the 2016 AAAI Spring Symposium Series, Palo Alto, CA, USA, 21–23 March 2016. [Google Scholar]
  12. Schmidt, P.; Biessmann, F.; Teubner, T. Transparency and trust in artificial intelligence systems. J. Decis. Syst. 2020, 29, 260–278. [Google Scholar] [CrossRef]
  13. Kim, J.; Rohrbach, A.; Darrell, T.; Canny, J.; Akata, Z. Textual explanations for self-driving vehicles. In Proceedings of the European Conference on Computer Vision (ECCV), Munich, Germany, 8–14 September 2018; pp. 563–578. [Google Scholar]
  14. Jacovi, A.; Marasović, A.; Miller, T.; Goldberg, Y. Formalizing trust in artificial intelligence: Prerequisites, causes and goals of human trust in AI. In Proceedings of the 2021 ACM Conference on Fairness, Accountability, and Transparency (FAccT), Virtual Event, Canada, 3–10 March 2021; pp. 624–635. [Google Scholar]
  15. Adadi, A.; Berrada, M. Peeking Inside the Black-Box: A Survey on Explainable Artificial Intelligence (XAI). IEEE Access 2018, 6, 52138–52160. [Google Scholar] [CrossRef]
  16. Ajenaghughrure, I.B.; da Costa Sousa, S.C.; Lamas, D. Risk and Trust in artificial intelligence technologies: A case study of Autonomous Vehicles. In Proceedings of the 13th International Conference on Human System Interaction (HSI), Tokyo, Japan, 6–8 June 2020; IEEE: Piscataway, NJ, USA, 2020; pp. 118–123. [Google Scholar]
  17. Zang, J.; Jeon, M. The effects of transparency and reliability of in-vehicle intelligent agents on driver perception, takeover performance, workload and situation awareness in conditionally automated vehicles. Multimodal Technol. Interact. 2022, 6, 82. [Google Scholar] [CrossRef]
  18. De Graaf, M.M.; Malle, B.F. How people explain action (and autonomous intelligent systems should too). In Proceedings of the 2017 AAAI Fall Symposium Series, Arlington, VA, USA, 9–11 November 2017. [Google Scholar]
  19. Hagras, H. Toward human-understandable, explainable AI. Computer 2018, 51, 28–36. [Google Scholar] [CrossRef]
  20. Papagni, G.; Koeszegi, S. Understandable and trustworthy explainable robots: A sensemaking perspective. Paladyn J. Behav. Robot. 2020, 12, 13–30. [Google Scholar] [CrossRef]
  21. Pu, P.; Chen, L. Trust-inspiring explanation interfaces for recommender systems. Knowl.-Based Syst. 2007, 20, 542–556. [Google Scholar] [CrossRef]
  22. Lomas, M.; Chevalier, R.; Cross, E.V.; Garrett, R.C.; Hoare, J.; Kopack, M. Explaining robot actions. In Proceedings of the 7th ACM/IEEE International Conference on Human-Robot Interaction (HRI), Boston, MA, USA, 5–8 March 2012; pp. 187–188. [Google Scholar]
  23. Glikson, E.; Woolley, A.W. Human trust in artificial intelligence: Review of empirical research. Acad. Manag. Ann. 2020, 14, 627–660. [Google Scholar] [CrossRef]
  24. Gambetta, D. Can we trust trust? In Trust: Making and Breaking Cooperative Relations; Department of Sociology, University of Oxford: Oxford, UK, 2000; Chapter 13; pp. 213–237. [Google Scholar]
  25. Siau, K.; Wang, W. Building trust in artificial intelligence, machine learning, and robotics. Cut. Bus. Technol. J. 2018, 31, 47–53. [Google Scholar]
  26. van Maris, A.; Lehmann, H.; Natale, L.; Grzyb, B. The influence of a robot’s embodiment on trust: A longitudinal study. In Proceedings of the Companion of the 2017 ACM/IEEE International Conference on Human-Robot Interaction, Vienna, Austria, 6–9 March 2017; pp. 313–314. [Google Scholar]
  27. Rossi, A.; Dautenhahn, K.; Koay, K.L.; Walters, M.L.; Holthaus, P. Evaluating People’s Perceptions of Trust in a Robot in a Repeated Interactions Study. In Proceedings of the International Conference on Social Robotics, Golden, CO, USA, 14–18 November 2020; Springer: Cham, Switzerland, 2020; pp. 453–465. [Google Scholar]
  28. McKnight, D.H.; Cummings, L.L.; Chervany, N.L. Initial trust formation in new organizational relationships. Acad. Manag. Rev. 1998, 23, 473–490. [Google Scholar] [CrossRef]
  29. Lyon, F.; Möllering, G.; Saunders, M.N. Introduction. Researching trust: The ongoing challenge of matching objectives and methods. In Handbook of Research Methods on Trust: Second Edition; Edward Elgar Publishing Ltd.: Cheltenham, Gloucestershire, UK, 2015; pp. 1–22. [Google Scholar]
  30. De Visser, E.J.; Peeters, M.M.; Jung, M.F.; Kohn, S.; Shaw, T.H.; Pak, R.; Neerincx, M.A. Towards a theory of longitudinal trust calibration in human–robot teams. Int. J. Soc. Robot. 2020, 12, 459–478. [Google Scholar] [CrossRef]
  31. Papagni, G.; de Pagter, J.; Zafari, S.; Filzmoser, M.; Koeszegi, S.T. Artificial agents’ explainability to support trust: Considerations on timing and context. AI Soc. 2022, 38, 947–960. [Google Scholar] [CrossRef]
  32. Lockey, S.; Gillespie, N.; Holm, D.; Someh, I.A. A Review of Trust in Artificial Intelligence: Challenges, Vulnerabilities and Future Directions. In Proceedings of the 54th Hawaii International Conference on System Sciences (HICSS), Kauai, HI, USA, 5–8 January 2021; Hawaii International Conference on System Sciences. pp. 5463–5472. [Google Scholar]
  33. Li, X.; Hess, T.J.; Valacich, J.S. Why do we trust new technology? A study of initial trust formation with organizational information systems. J. Strateg. Inf. Syst. 2008, 17, 39–71. [Google Scholar] [CrossRef]
  34. Andras, P.; Esterle, L.; Guckert, M.; Han, T.A.; Lewis, P.R.; Milanovic, K.; Payne, T.; Perret, C.; Pitt, J.; Powers, S.T.; et al. Trusting intelligent machines: Deepening trust within socio-technical systems. IEEE Technol. Soc. Mag. 2018, 37, 76–83. [Google Scholar] [CrossRef]
  35. Neri, H.; Cozman, F. The role of experts in the public perception of risk of artificial intelligence. AI Soc. 2020, 35, 663–673. [Google Scholar] [CrossRef]
  36. Lankton, N.K.; McKnight, D.H.; Tripp, J. Technology, humanness, and trust: Rethinking trust in technology. J. Assoc. Inf. Syst. 2015, 16, 880–918. [Google Scholar] [CrossRef]
  37. Sood, K. The ultimate black box: The thorny issue of programming moral standards in machines [Industry View]. IEEE Technol. Soc. Mag. 2018, 37, 27–29. [Google Scholar] [CrossRef]
  38. Kaplan, A.D.; Kessler, T.T.; Brill, J.C.; Hancock, P. Trust in artificial intelligence: Meta-analytic findings. Hum. Factors 2021. [Google Scholar] [CrossRef] [PubMed]
  39. Dzindolet, M.T.; Peterson, S.A.; Pomranky, R.A.; Pierce, L.G.; Beck, H.P. The role of trust in automation reliance. Int. J. Hum.-Comput. Stud. 2003, 58, 697–718. [Google Scholar] [CrossRef]
  40. Kerschner, C.; Ehlers, M.H. A framework of attitudes towards technology in theory and practice. Ecol. Econ. 2016, 126, 139–151. [Google Scholar] [CrossRef]
  41. Haspiel, J.; Du, N.; Meyerson, J.; Robert, L.P., Jr.; Tilbury, D.; Yang, X.J.; Pradhan, A.K. Explanations and expectations: Trust building in automated vehicles. In Proceedings of the Companion of the 2018 ACM/IEEE International Conference on Human-Robot Interaction, Chicago, IL, USA, 5–8 March 2018; pp. 119–120. [Google Scholar]
  42. Du, N.; Haspiel, J.; Zhang, Q.; Tilbury, D.; Pradhan, A.K.; Yang, X.J.; Robert Jr, L.P. Look who’s talking now: Implications of AV’s explanations on driver’s trust, AV preference, anxiety and mental workload. Transp. Res. Part Emerg. Technol. 2019, 104, 428–442. [Google Scholar] [CrossRef]
  43. Haresamudram, K.; Larsson, S.; Heintz, F. Three levels of AI transparency. Computer 2023, 56, 93–100. [Google Scholar] [CrossRef]
  44. Zhang, T.; Tao, D.; Qu, X.; Zhang, X.; Lin, R.; Zhang, W. The roles of initial trust and perceived risk in public’s acceptance of automated vehicles. Transp. Res. Part C Emerg. Technol. 2019, 98, 207–220. [Google Scholar] [CrossRef]
  45. Hancock, P.A.; Billings, D.R.; Schaefer, K.E.; Chen, J.Y.; De Visser, E.J.; Parasuraman, R. A meta-analysis of factors affecting trust in human-robot interaction. Hum. Factors 2011, 53, 517–527. [Google Scholar] [CrossRef] [PubMed]
  46. Hoff, K.A.; Bashir, M. Trust in automation: Integrating empirical evidence on factors that influence trust. Hum. Factors 2015, 57, 407–434. [Google Scholar] [CrossRef] [PubMed]
  47. O’neill, O. Autonomy and Trust in Bioethics; Cambridge University Press: Cambridge, UK, 2002. [Google Scholar]
  48. Fossa, F. “I don’t trust you, you faker!” On Trust, Reliance, and Artificial Agency. Teoria 2019, 39, 63–80. [Google Scholar]
  49. Schwarz, C.; Gaspar, J.; Brown, T. The effect of reliability on drivers’ trust and behavior in conditional automation. Cogn. Technol. Work 2019, 21, 41–54. [Google Scholar] [CrossRef]
  50. Luhmann, N. Familiarity, confidence, trust: Problems and alternatives. Trust. Mak. Break. Coop. Relat. 2000, 6, 94–107. [Google Scholar]
  51. Komiak, S.Y.; Benbasat, I. The effects of personalizaion and familiarity on trust and adoption of recommendation agents. MIS Q. 2006, 30, 941–960. [Google Scholar] [CrossRef]
  52. Yang, J.X.; Unhelkar, V.V.; Li, K.; Shah, J.A. Evaluating effects of user experience and system transparency on trust in automation. In Proceedings of the 12th ACM/IEEE International Conference on Human-Robot Interaction (HRI), Vienna, Austria, 6–9 March 2017; Association for Computing Machinery: New York, NY, USA, 2017; pp. 408–416. [Google Scholar]
  53. Cramer, H.; Evers, V.; Ramlal, S.; Van Someren, M.; Rutledge, L.; Stash, N.; Aroyo, L.; Wielinga, B. The effects of transparency on trust in and acceptance of a content-based art recommender. User Model. User-Adapt. Interact. 2008, 18, 455–496. [Google Scholar] [CrossRef]
  54. Doshi-Velez, F.; Kim, B. Towards a rigorous science of interpretable machine learning. arXiv 2017, arXiv:1702.08608. [Google Scholar]
  55. Baker, A.L.; Phillips, E.K.; Ullman, D.; Keebler, J.R. Toward an understanding of trust repair in human-robot interaction: Current research and future directions. ACM Trans. Interact. Intell. Syst. (TiiS) 2018, 8, 1–30. [Google Scholar] [CrossRef]
  56. Ribeiro, M.T.; Singh, S.; Guestrin, C. “Why should i trust you?” Explaining the predictions of any classifier. In Proceedings of the 22nd ACM International Conference on Knowledge Discovery and Data Mining (SIGKDD), San Francisco, CA, USA, 13–17 August 2016; pp. 1135–1144. [Google Scholar]
  57. Robinette, P.; Howard, A.M.; Wagner, A.R. Effect of robot performance on human–robot trust in time-critical situations. IEEE Trans. Hum.-Mach. Syst. 2017, 47, 425–436. [Google Scholar] [CrossRef]
  58. Tolmeijer, S.; Weiss, A.; Hanheide, M.; Lindner, F.; Powers, T.M.; Dixon, C.; Tielman, M.L. Taxonomy of trust-relevant failures and mitigation strategies. In Proceedings of the 15th ACM/IEEE International Conference on Human-Robot Interaction (HRI), Cambridge, UK, 23–26 March 2020; IEEE: Piscataway, NJ, USA, 2020; pp. 3–12. [Google Scholar]
  59. Desai, M.; Kaniarasu, P.; Medvedev, M.; Steinfeld, A.; Yanco, H. Impact of robot failures and feedback on real-time trust. In Proceedings of the 8th ACM/IEEE International Conference on Human-Robot Interaction (HRI), Tokyo, Japan, 3–6 March 2013; Association for Computing Machinery: New York, NY, USA, 2013; pp. 251–258. [Google Scholar]
  60. Freedy, A.; DeVisser, E.; Weltman, G.; Coeyman, N. Measurement of trust in human-robot collaboration. In Proceedings of the 2007 International Symposium on Collaborative Technologies and Systems, Orlando, FL, USA, 25 May 2007; IEEE: Piscataway, NJ, USA, 2007; pp. 106–114. [Google Scholar]
  61. Elangovan, A.; Auer-Rizzi, W.; Szabo, E. Why don’t I trust you now? An attributional approach to erosion of trust. J. Manag. Psychol. 2007, 22, 4–24. [Google Scholar] [CrossRef]
  62. Salem, M.; Lakatos, G.; Amirabdollahian, F.; Dautenhahn, K. Would you trust a (faulty) robot? Effects of error, task type and personality on human-robot cooperation and trust. In Proceedings of the 10th ACM/IEEE International Conference on Human-Robot Interaction (HRI), Portland, OR, USA, 2–5 March 2015; Association for Computing Machinery: New York, NY, USA, 2015; pp. 1–8. [Google Scholar]
  63. Perkins, L.; Miller, J.E.; Hashemi, A.; Burns, G. Designing for human-centered systems: Situational risk as a factor of trust in automation. In Proceedings of the Human Factors and Ergonomics Society Annual Meeting (HFES Annual), San Francisco, CA, USA, 27 September–1 October 2010; SAGE Publications Sage CA: Los Angeles, CA, USA, 2010; Volume 54, pp. 2130–2134. [Google Scholar]
  64. Furner, C.P.; Drake, J.R.; Zinko, R.; Kisling, E. Online review antecedents of trust, purchase, and recommendation intention: A simulation-based experiment for hotels and AirBnBs. J. Internet Commer. 2022, 21, 79–103. [Google Scholar] [CrossRef]
  65. Walton, D. Dialogical Models of Explanation. ExaCt 2007, 2007, 1–9. [Google Scholar]
  66. Madumal, P.; Miller, T.; Vetere, F.; Sonenberg, L. Towards a grounded dialog model for explainable artificial intelligence. arXiv 2018, arXiv:1806.08055. [Google Scholar]
  67. Wang, N.; Pynadath, D.V.; Hill, S.G. Trust calibration within a human-robot team: Comparing automatically generated explanations. In Proceedings of the 11th ACM/IEEE International Conference on Human-Robot Interaction (HRI), Christchurch, New Zealand, 7–10 March 2016; IEEE: Piscataway, NJ, USA, 2016; pp. 109–116. [Google Scholar]
  68. Kraus, J.; Scholz, D.; Stiegemeier, D.; Baumann, M. The more you know: Trust dynamics and calibration in highly automated driving and the effects of take-overs, system malfunction, and system transparency. Hum. Factors 2020, 62, 718–736. [Google Scholar] [CrossRef] [PubMed]
  69. Shen, Y.; Jiang, S.; Chen, Y.; Campbell, K.D. To explain or not to explain: A study on the necessity of explanations for autonomous vehicles. arXiv 2020, arXiv:2006.11684. [Google Scholar]
  70. Xu, Z.; Jiang, Z.; Wang, G.; Wang, R.; Li, T.; Liu, J.; Zhang, Y.; Liu, P. When the automated driving system fails: Dynamics of public responses to automated vehicles. Transp. Res. Part C Emerg. Technol. 2021, 129, 103271. [Google Scholar] [CrossRef]
  71. Riek, L.D. Wizard of oz studies in hri: A systematic review and new reporting guidelines. J. Hum.-Robot. Interact. 2012, 1, 119–136. [Google Scholar] [CrossRef]
  72. Schaefer, K.E. Measuring trust in human robot interactions: Development of the “trust perception scale-HRI”. In Robust Intelligence and Trust in Autonomous Systems; Springer: Berlin/Heidelberg, Germany, 2016; pp. 191–218. [Google Scholar]
  73. Malle, B.F.; Ullman, D. A multidimensional conception and measure of human-robot trust. In Trust in Human-Robot Interaction; Elsevier: Amsterdam, The Netherlands, 2021; pp. 3–25. [Google Scholar]
  74. Ekman, F.; Johansson, M.; Sochor, J. Creating appropriate trust in automated vehicle systems: A framework for HMI design. IEEE Trans. Hum.-Mach. Syst. 2017, 48, 95–101. [Google Scholar] [CrossRef]
  75. Leichtmann, B.; Humer, C.; Hinterreiter, A.; Streit, M.; Mara, M. Effects of Explainable Artificial Intelligence on trust and human behavior in a high-risk decision task. Comput. Hum. Behav. 2022, 139, 107539. [Google Scholar] [CrossRef]
  76. Gurney, J.K. Sue my car not me: Products liability and accidents involving autonomous vehicles. Univ. Ill. J. Law Technol. Policy 2013, 247–277. [Google Scholar]
  77. O’Leary, D.E. GOOGLE’S Duplex: Pretending to be human. Intell. Syst. Accounting, Financ. Manag. 2019, 26, 46–53. [Google Scholar] [CrossRef]
  78. Soh, J. The executive’s guide to getting AI wrong. Asian Manag. Insights (Singap. Manag. Univ.) 2022, 9, 74–80. [Google Scholar]
  79. Frison, A.K.; Wintersberger, P.; Riener, A.; Schartmüller, C.; Boyle, L.N.; Miller, E.; Weigl, K. In UX we trust: Investigation of aesthetics and usability of driver-vehicle interfaces and their impact on the perception of automated driving. In Proceedings of the 2019 CHI Conference on Human Factors in Computing Systems, Glasgow, UK, 4–9 May 2019; pp. 1–13. [Google Scholar]
  80. Schraagen, J.M.; Elsasser, P.; Fricke, H.; Hof, M.; Ragalmuto, F. Trusting the X in XAI: Effects of different types of explanations by a self-driving car on trust, explanation satisfaction and mental models. In Proceedings of the Human Factors and Ergonomics Society Annual Meeting, Virtual, 5–9 October 2020; SAGE Publications Sage CA: Los Angeles, CA, USA, 2020; Volume 64, pp. 339–343. [Google Scholar]
  81. Kim, G.; Yeo, D.; Jo, T.; Rus, D.; Kim, S. What and When to Explain? On-road Evaluation of Explanations in Highly Automated Vehicles. Proc. ACM Interact. Mob. Wearable Ubiquitous Technol. 2023, 7, 1–26. [Google Scholar]
Figure 5. Malfunction explanation.
Mti 08 00020 g005
Figure 6. Trust development in each group.
Mti 08 00020 g006
Table 1. Order of the texts in the different experimental treatments.
OrderParticipants
‘A’,‘B’,‘C’,‘X’,‘D’,‘E’,‘F’,‘G’even user ID
‘A’,‘D’,‘E’,‘X’,‘F’,‘B’,‘C’,‘G’odd user ID
‘A’,‘D’,‘F’,‘B’,‘C’,‘Y’,‘E’,‘G’even user ID
‘A’,‘B’,‘D’,‘F’,‘E’,‘Y’,‘C’,‘G’odd user ID
Table 2. Frequency distribution of treatment groups.
GroupFrequencyGenderLearning Style
MaleFemaleOtherKVAR
CwE37 (22%)1423018883
CwoE52 (30%)143802112514
FwE46 (27%)8371218512
FwoE36 (21%)12240181062
Total171 (100%)48122178382431
K = kinesthetic, V = visual, A = auditory, R = reading/writing.
Table 3. Mean scores for trust perception by groups (day 3–5).
DayGroupMeanSELBUB
3CwE89.482.2984.9594.01
CWoE86.611.9482.7990.43
FWE83.872.0679.8187.93
FWoE84.652.3380.0589.24
4CwE88.672.8183.1294.22
CwoE85.232.3780.5589.92
FwE73.402.5268.4278.38
FwoE75.762.8570.1381.39
5CwE89.182.5984.0694.30
CwoE85.692.1881.3790.01
FwE84.772.3380.1889.36
FwoE79.682.6374.4984.87
Disclaimer/Publisher’s Note: The statements, opinions and data contained in all publications are solely those of the individual author(s) and contributor(s) and not of MDPI and/or the editor(s). MDPI and/or the editor(s) disclaim responsibility for any injury to people or property resulting from any ideas, methods, instructions or products referred to in the content.

