
Contact Resistance Sensing for Touch and Squeeze Interactions


Abstract
:1. Introduction
- Pilot experiment: to examine the contribution of contact resistance on the total resistance change during compression.
- Experiment 1: to investigate the static resistance properties of samples using six electrode solutions based on three accessible materials—copper tape, conductive fabric tape, and conductive threads.
- Experiment 2: to investigate the dynamic resistance behavior of foam sensors based on two electrode solutions utilizing conductive threads.
2. Related Work
2.1. Sensing for Squeezable Interfaces
2.2. Electrodes for Foam Sensors
3. Test Setup
3.1. Data Acquisition Setup
3.2. Compression Setup
- The primary function of the first component is to provide compression and load control during the deformation process (Figure 1c, 1). Weights are put in a box to exert compression in most experiments. To facilitate vertical descent, the wooden box is accompanied by two elongated bars on each side, designed to align with the tracks of the big wooden box. A box made of paper is used to apply small loads in Experiment 1 (i.e., 0.06 N and 1.04 N) to minimize the weight of the container itself and provide an even contact surface.
- The second component is a larger wooden box (Figure 1c, 2) which is strategically designed to facilitate the controlled vertical descent of the first component (the box). This larger wooden apparatus is equipped with two parallel tracks, situated on both the left and right sides.
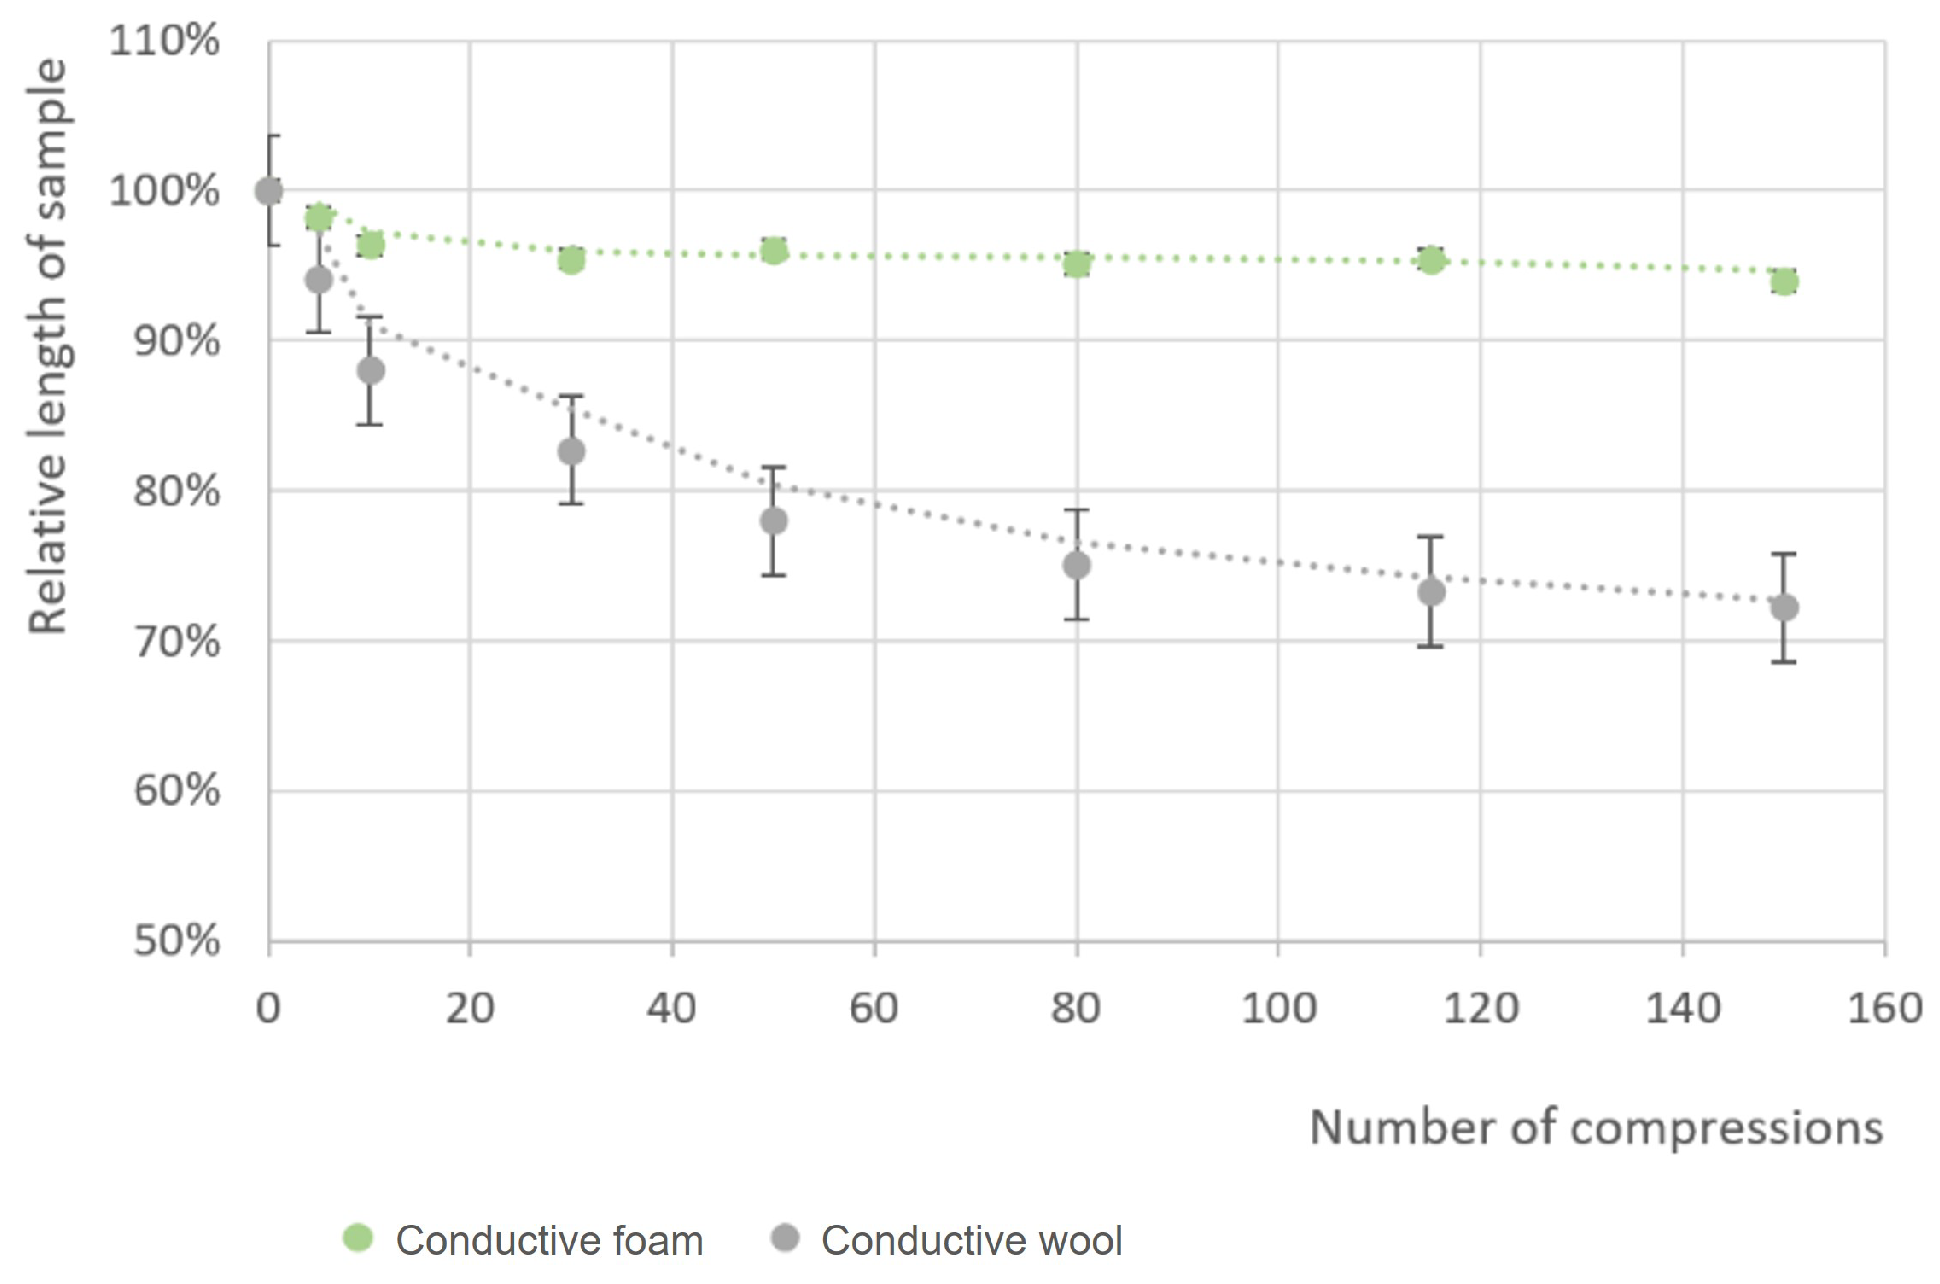
4. Pilot Experiment: Conductive Wool vs. Conductive PU Foam
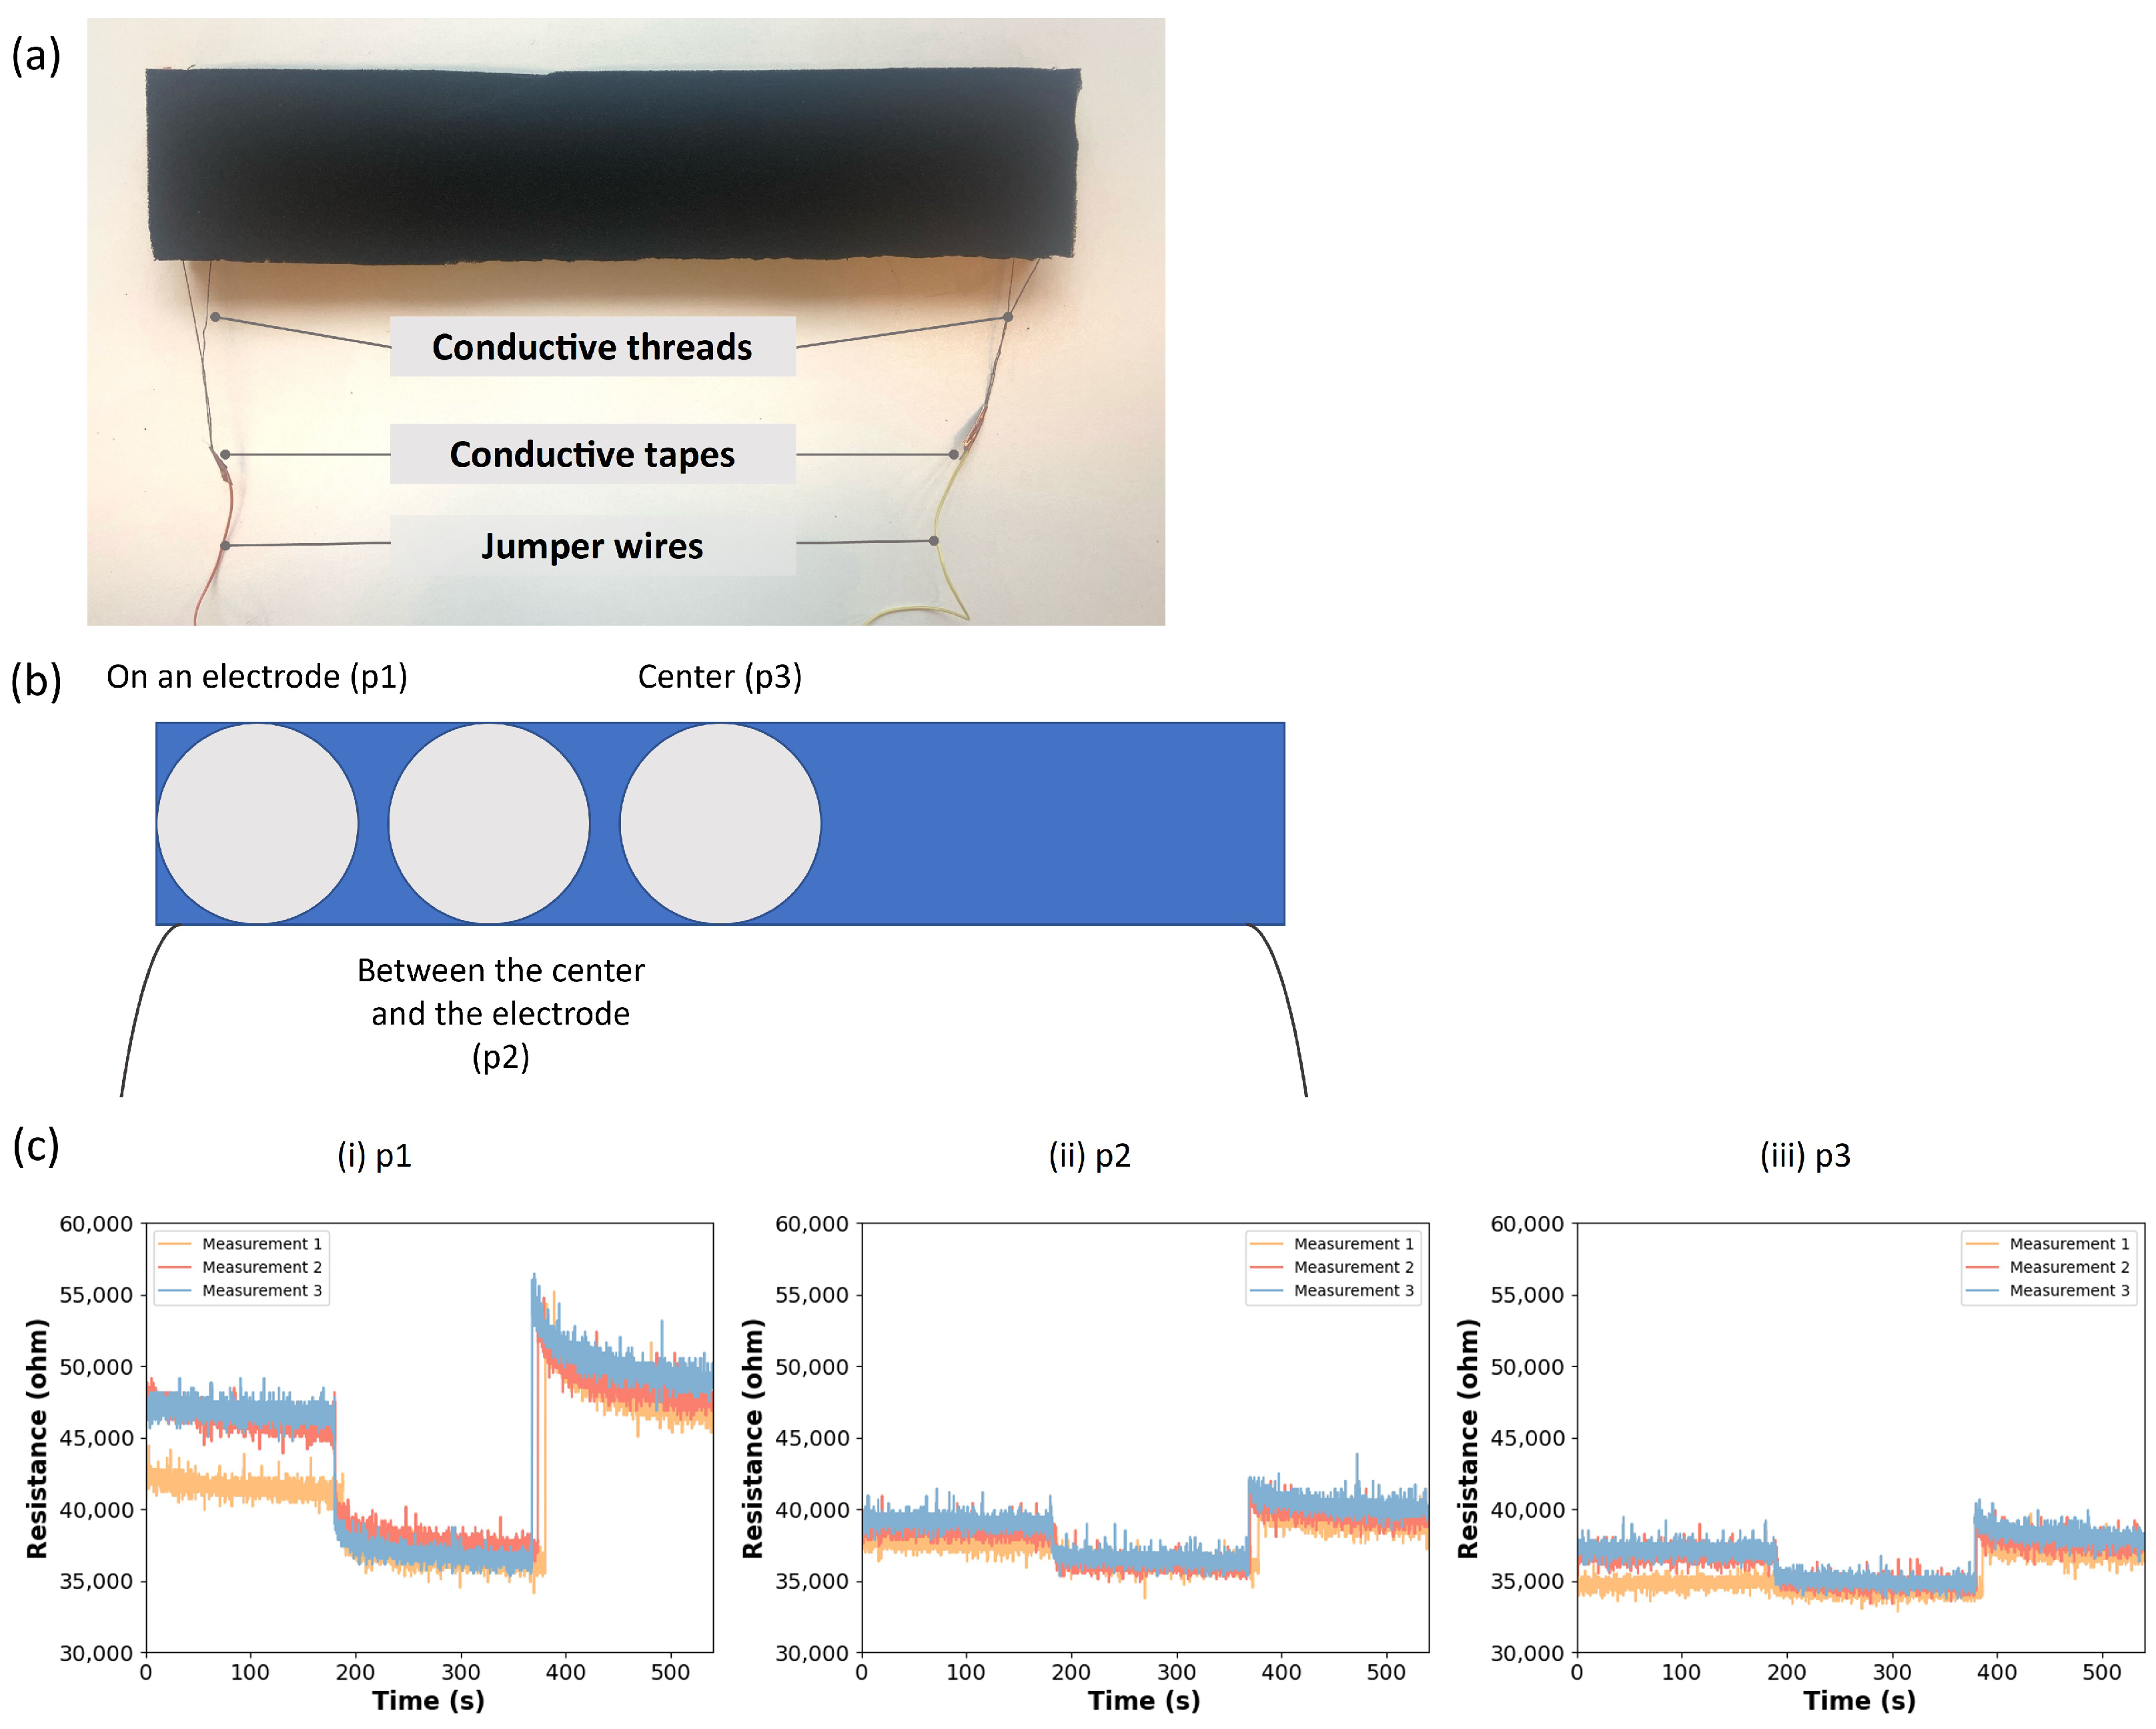
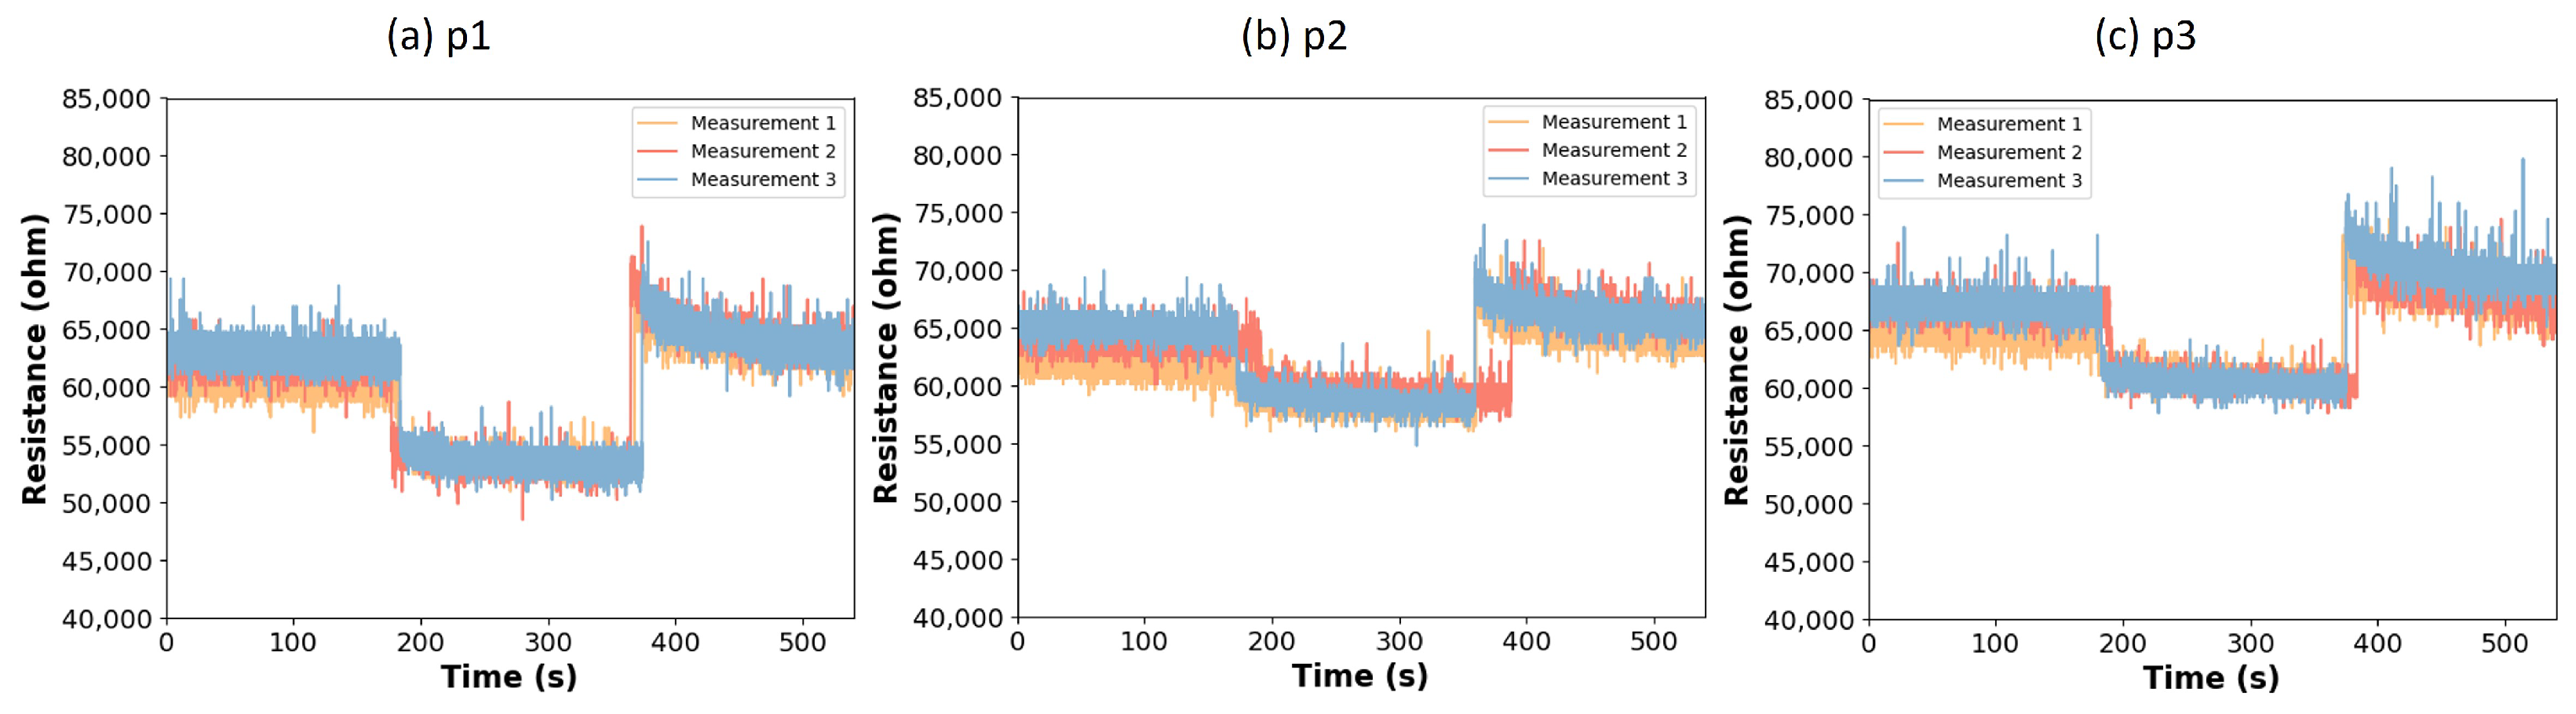
5. Pilot Experiment: Contact Resistance
- Hypothesis 1: The major cause of resistance change is the change in the volume of the foam.
- Hypothesis 2: The major cause of resistance change is the contact between the electrodes and the foam.
- If the changes in resistance were similar in all three circumstances, then the change in volume of the foam would be the major factor causing the change in resistance, therefore suggesting H1;
- If the change in resistance was more significant as the weight was placed on the electrode, then the main factor influencing the resistance would be the contact resistance, therefore suggesting H2.

5.1. Procedure
5.2. Results
5.3. Discussion
6. Experiment 1: Electrode Solutions
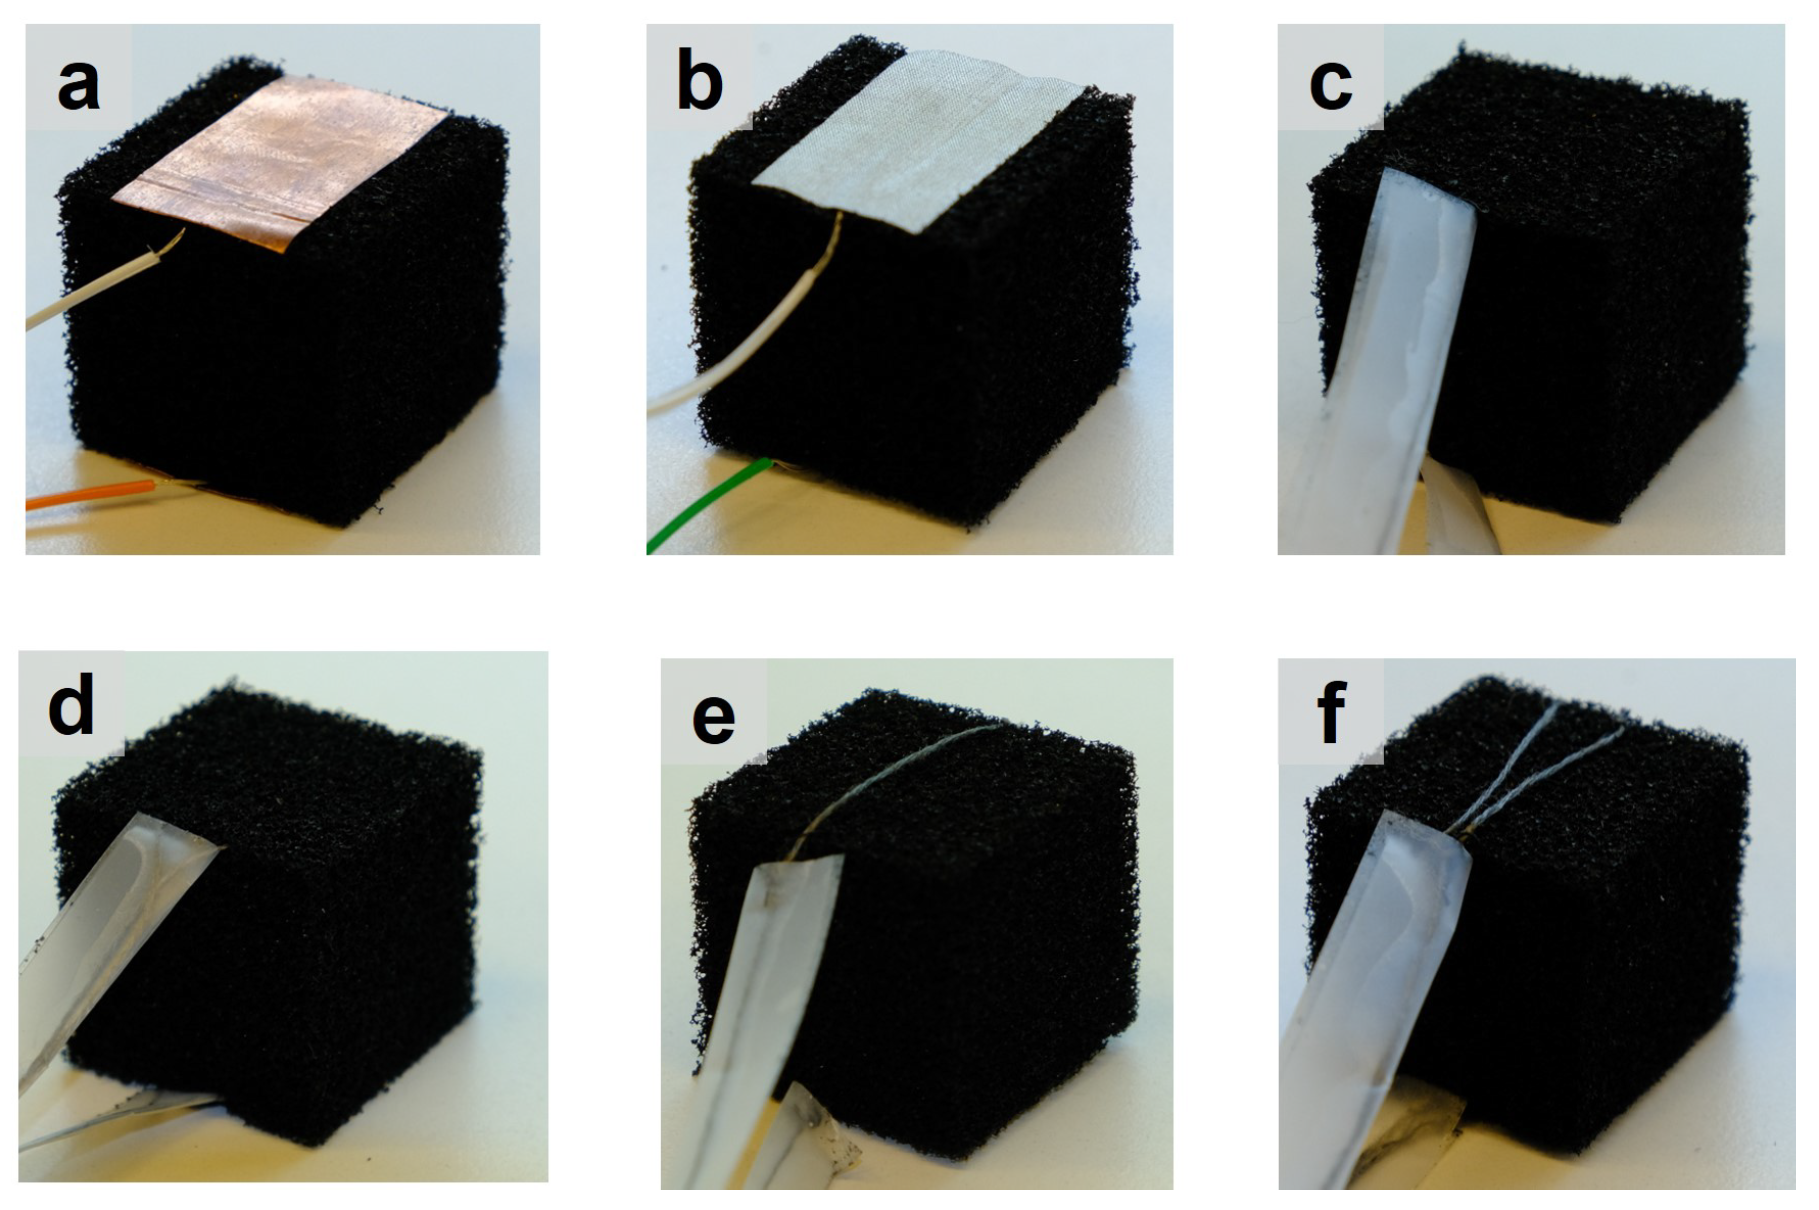
6.1. Sample Preparation
- (a)
- Conductive copper tape (AT528, Advance Tapes, Leicester, UK): 19 mm × 30 mm;
- (b)
- Conductive fabric tape (MDFT-10F-1I, MOS Equipment, Santa Barbara, CA, USA): 19 mm × 30 mm;
- (c)
- One piece of conductive thread inserted into the surface of foam (641, Adafruit Inc., New York, NY, USA): 160 mm;
- (d)
- Two pieces of conductive threads inserted into the surfaces of the foam (641, Adafruit Inc., New York, NY, USA): 160 mm × 2 pieces. The distance between two conductive threads that constitute the same electrode is 10 mm;
- (e)
- One piece of conductive thread loosely put on the surface of the foam (641, Adafruit Inc., New York, NY, USA): 160 mm;
- (f)
- Two pieces of conductive thread loosely put on the surface of the foam (641, Adafruit Inc., New York, NY, USA): 160 mm. The distance between two conductive threads that constitute the same electrode is 10 mm.

6.2. Procedure
6.3. Methods of Analysis
- The coefficient of variation (CV) of the first 1500 data points before deformation, defined by the ratio of standard deviation (SD) to the mean value, denoted as .
- The CV of the last 1500 data points during compression, denoted as .
- The SD of the /R0 values for each sample under the same strain in Test 1, denoted as ).
- The SD of the /R values for each sample under the same load in Test 2, denoted as ).
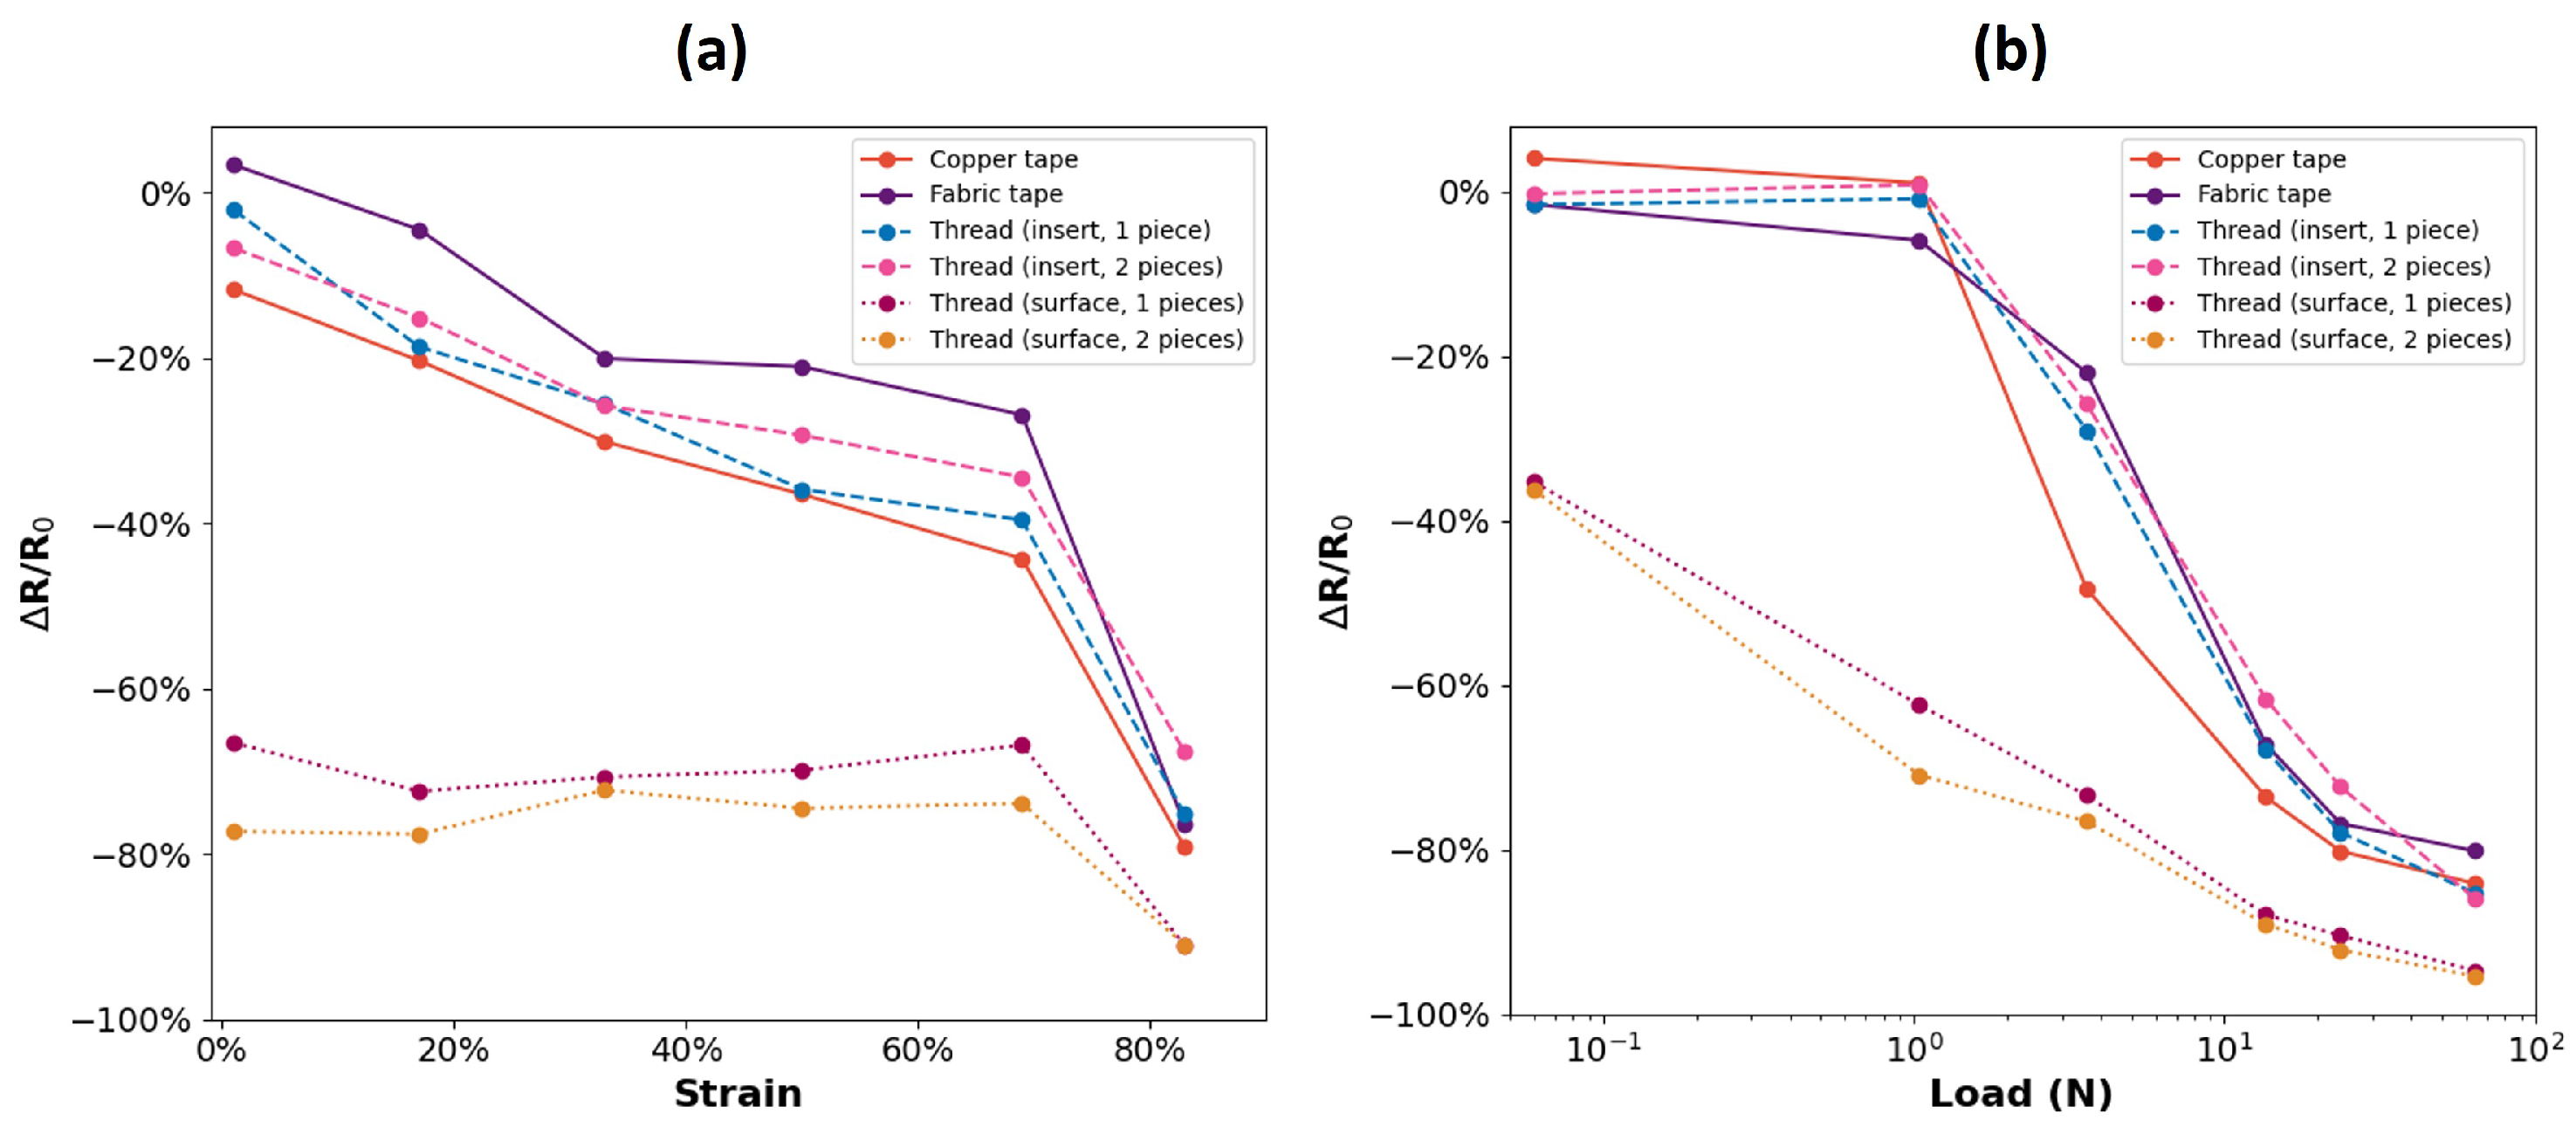
6.4. Results
6.5. Discussion
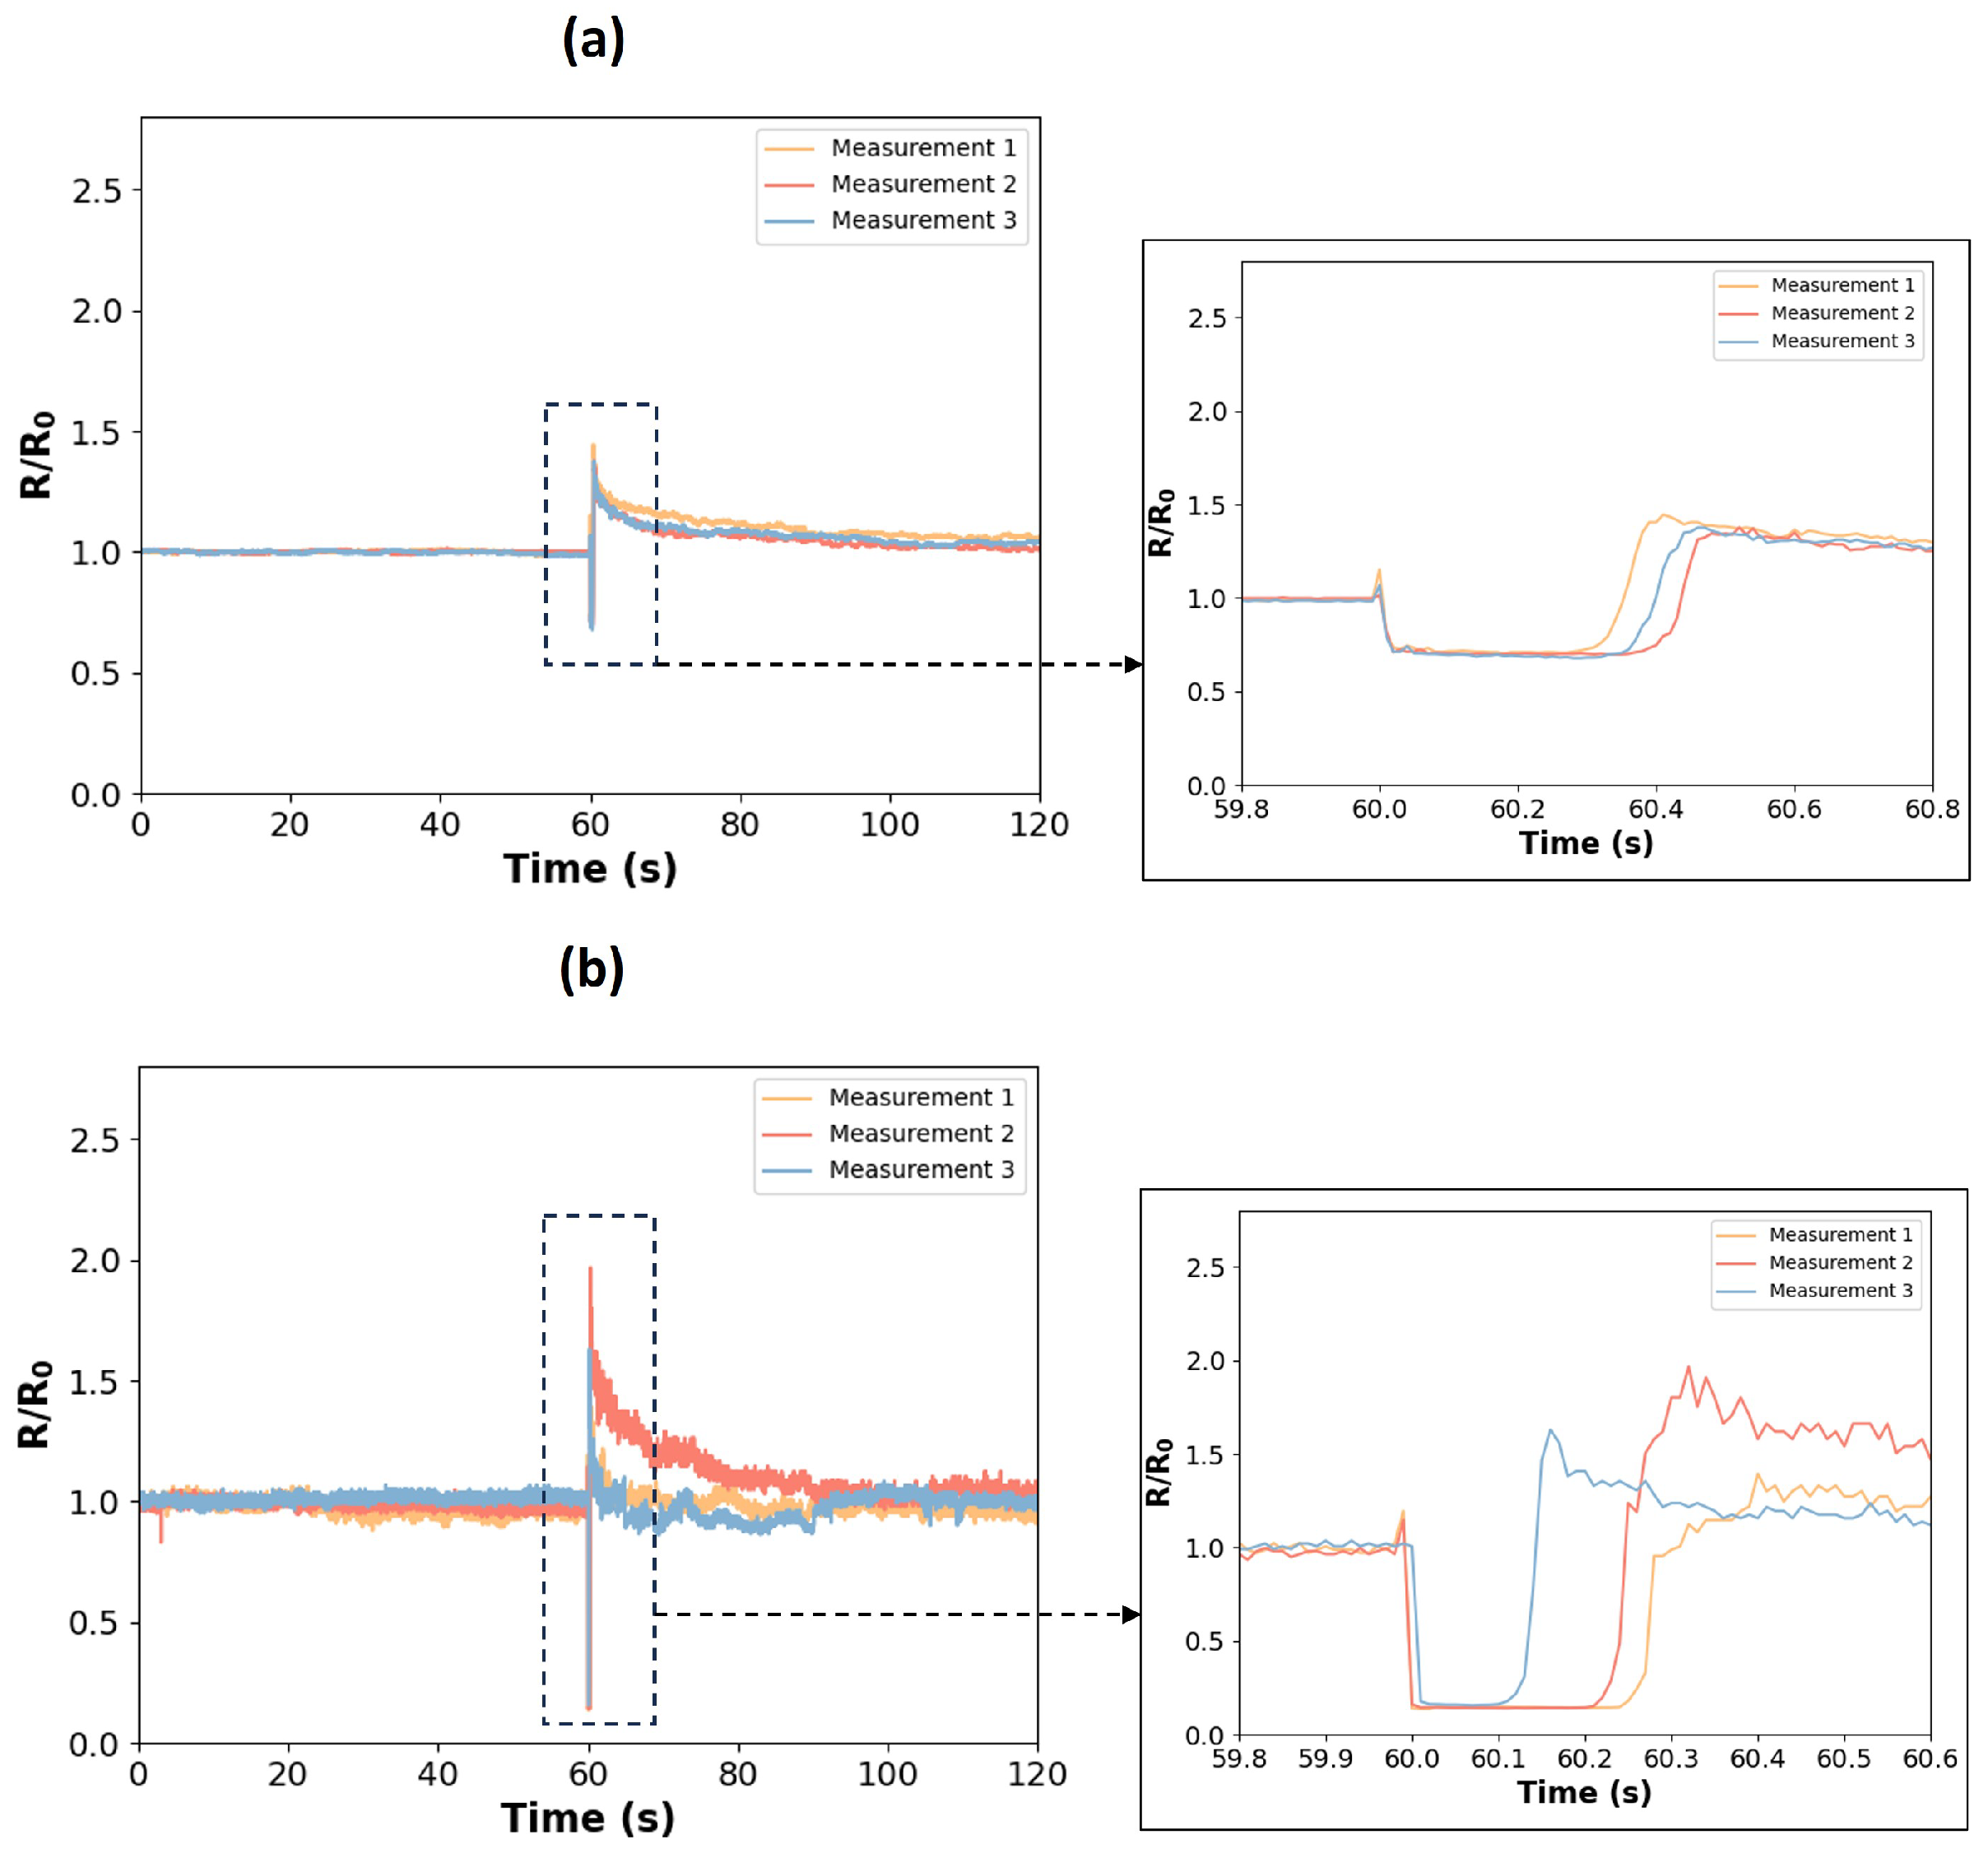
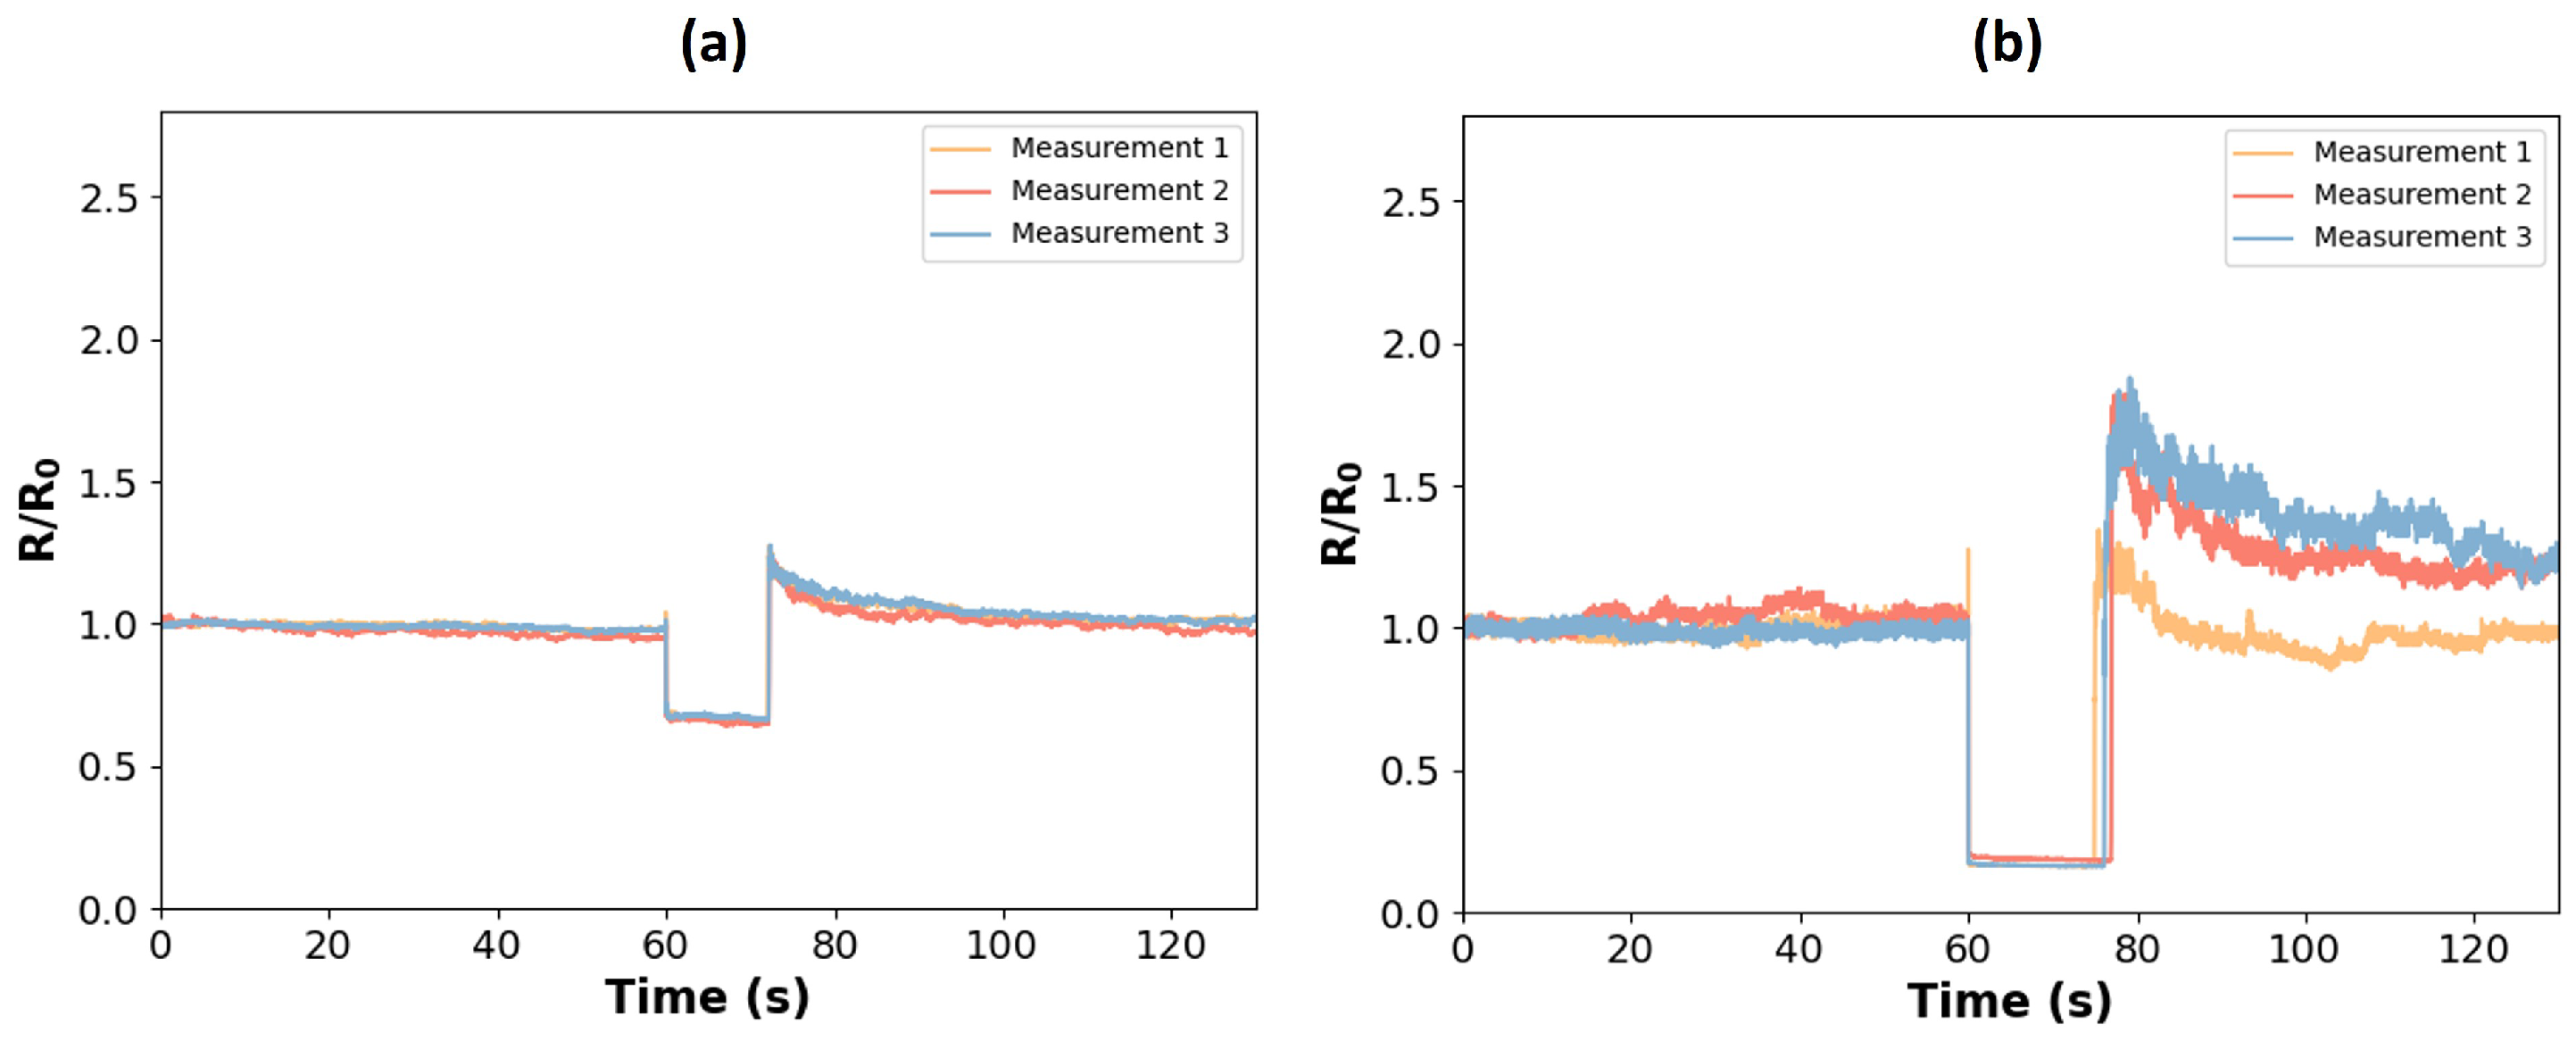
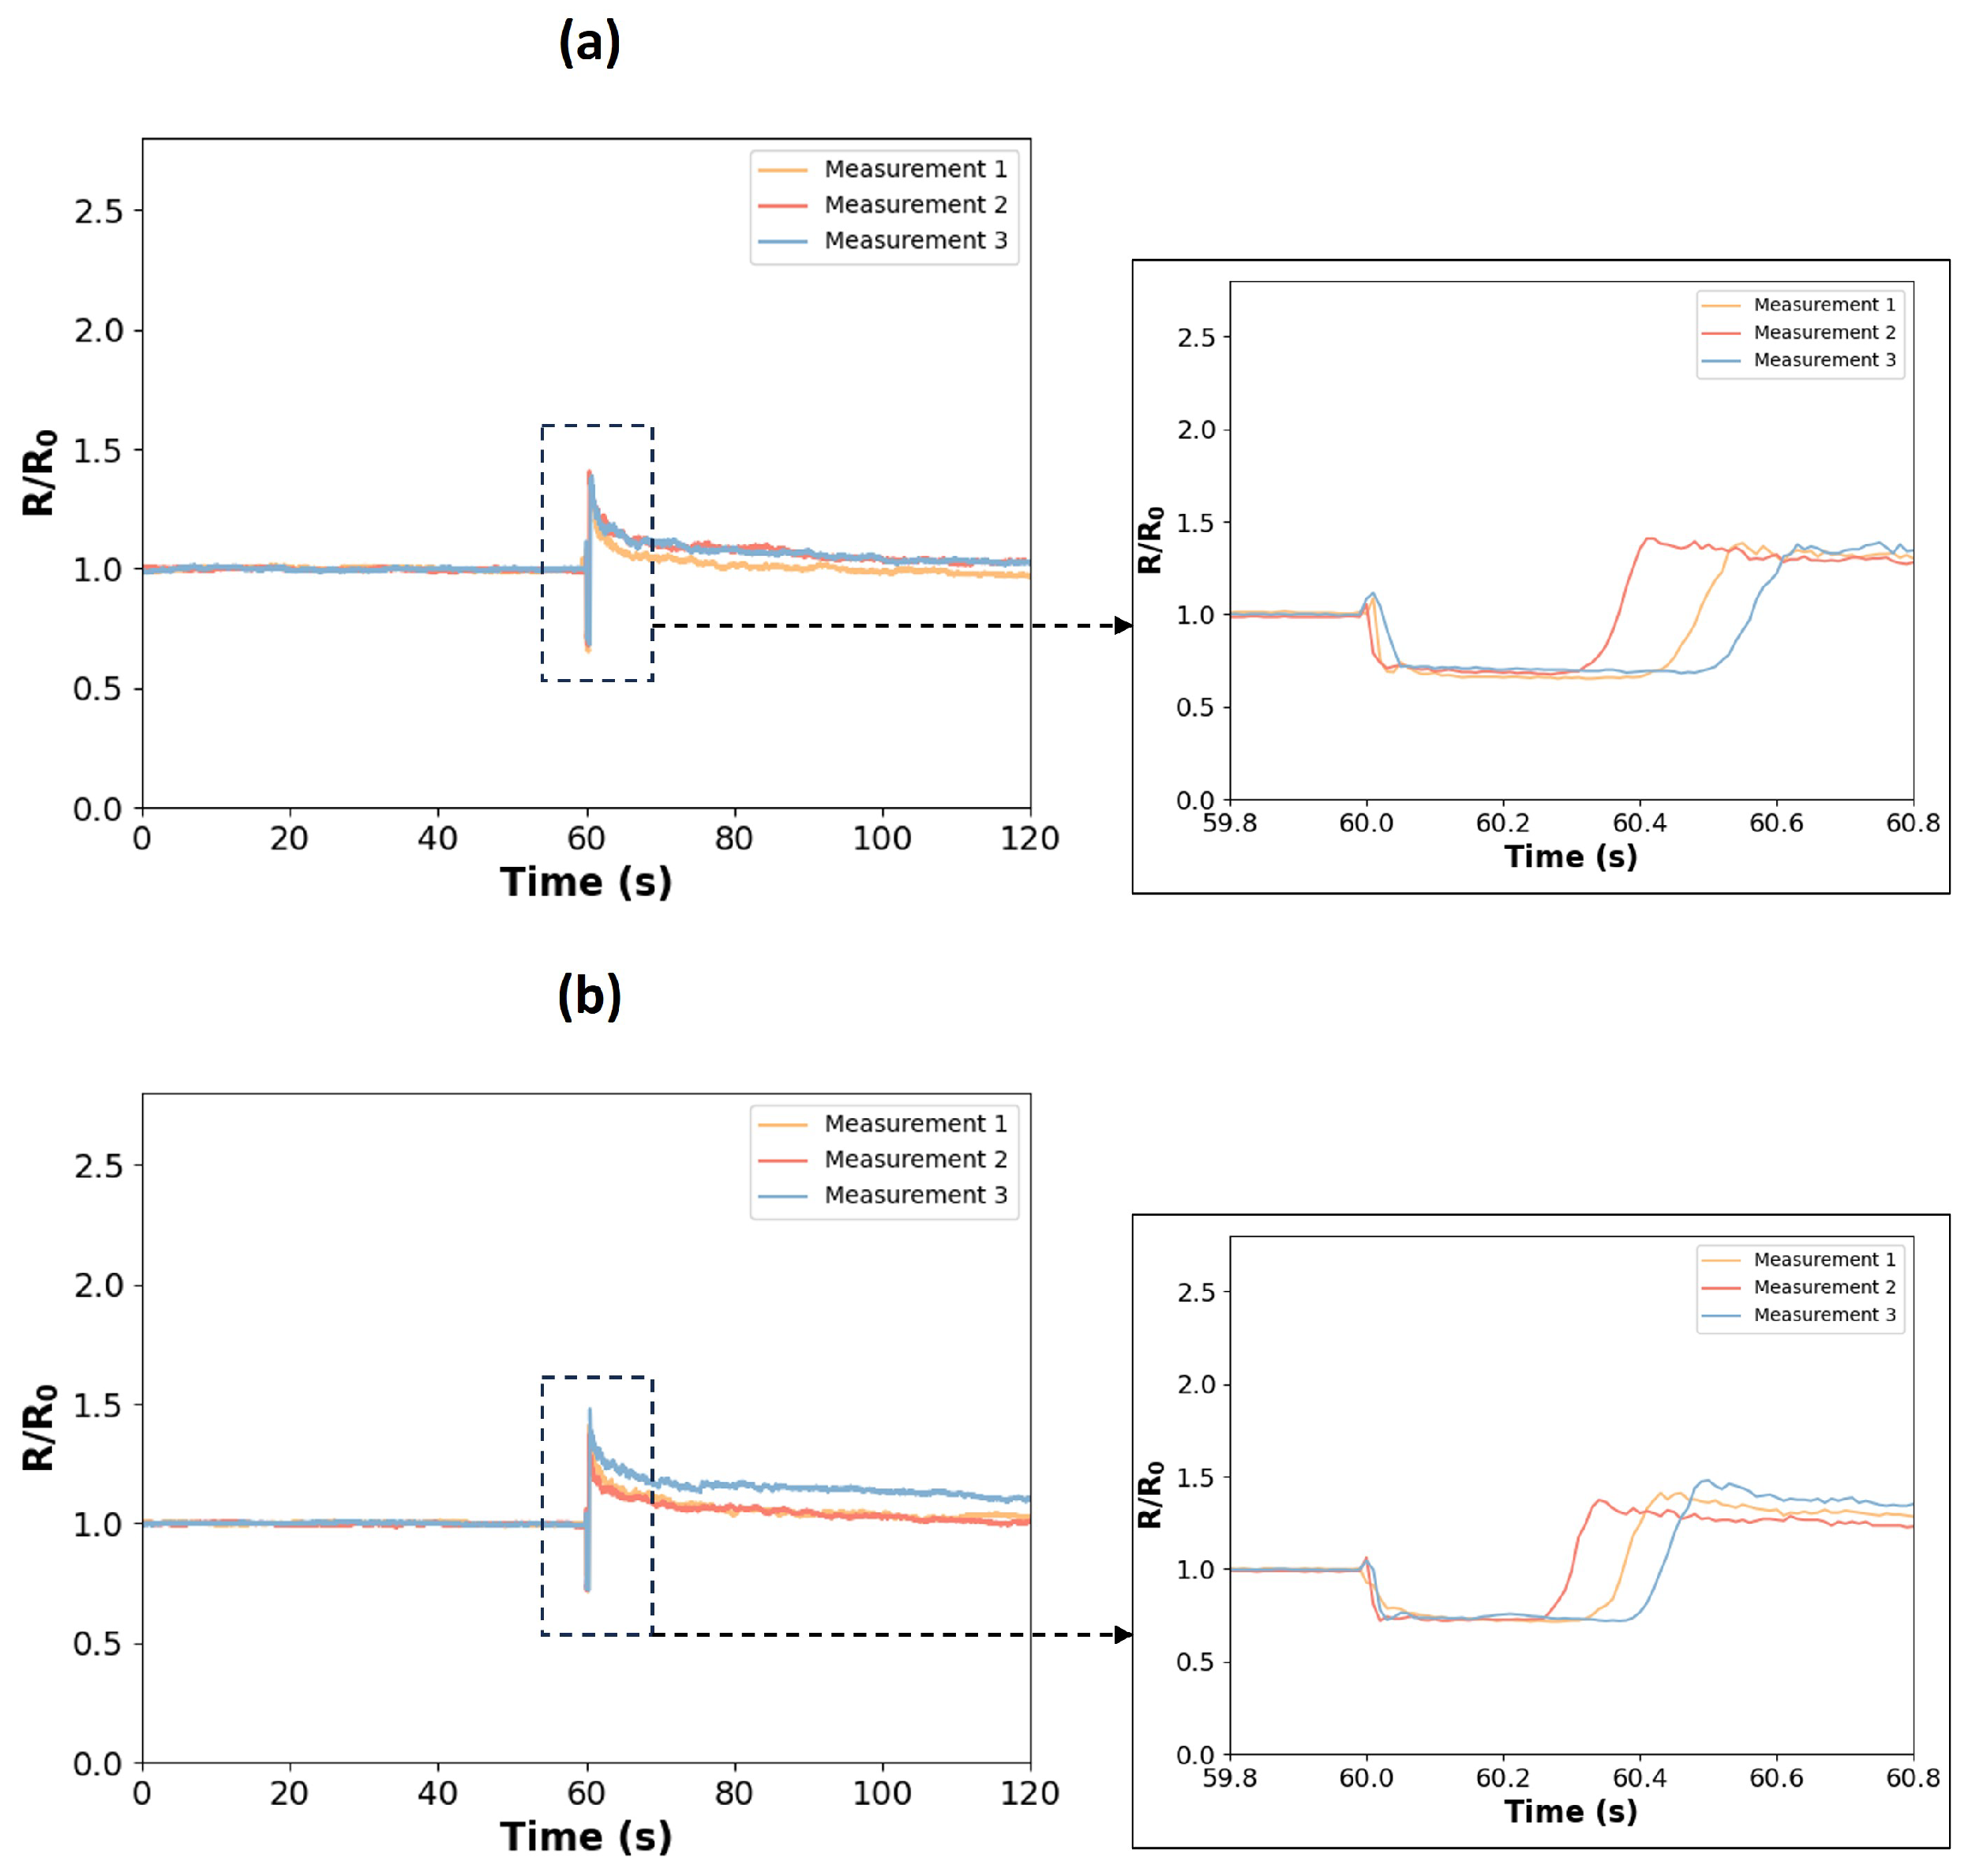
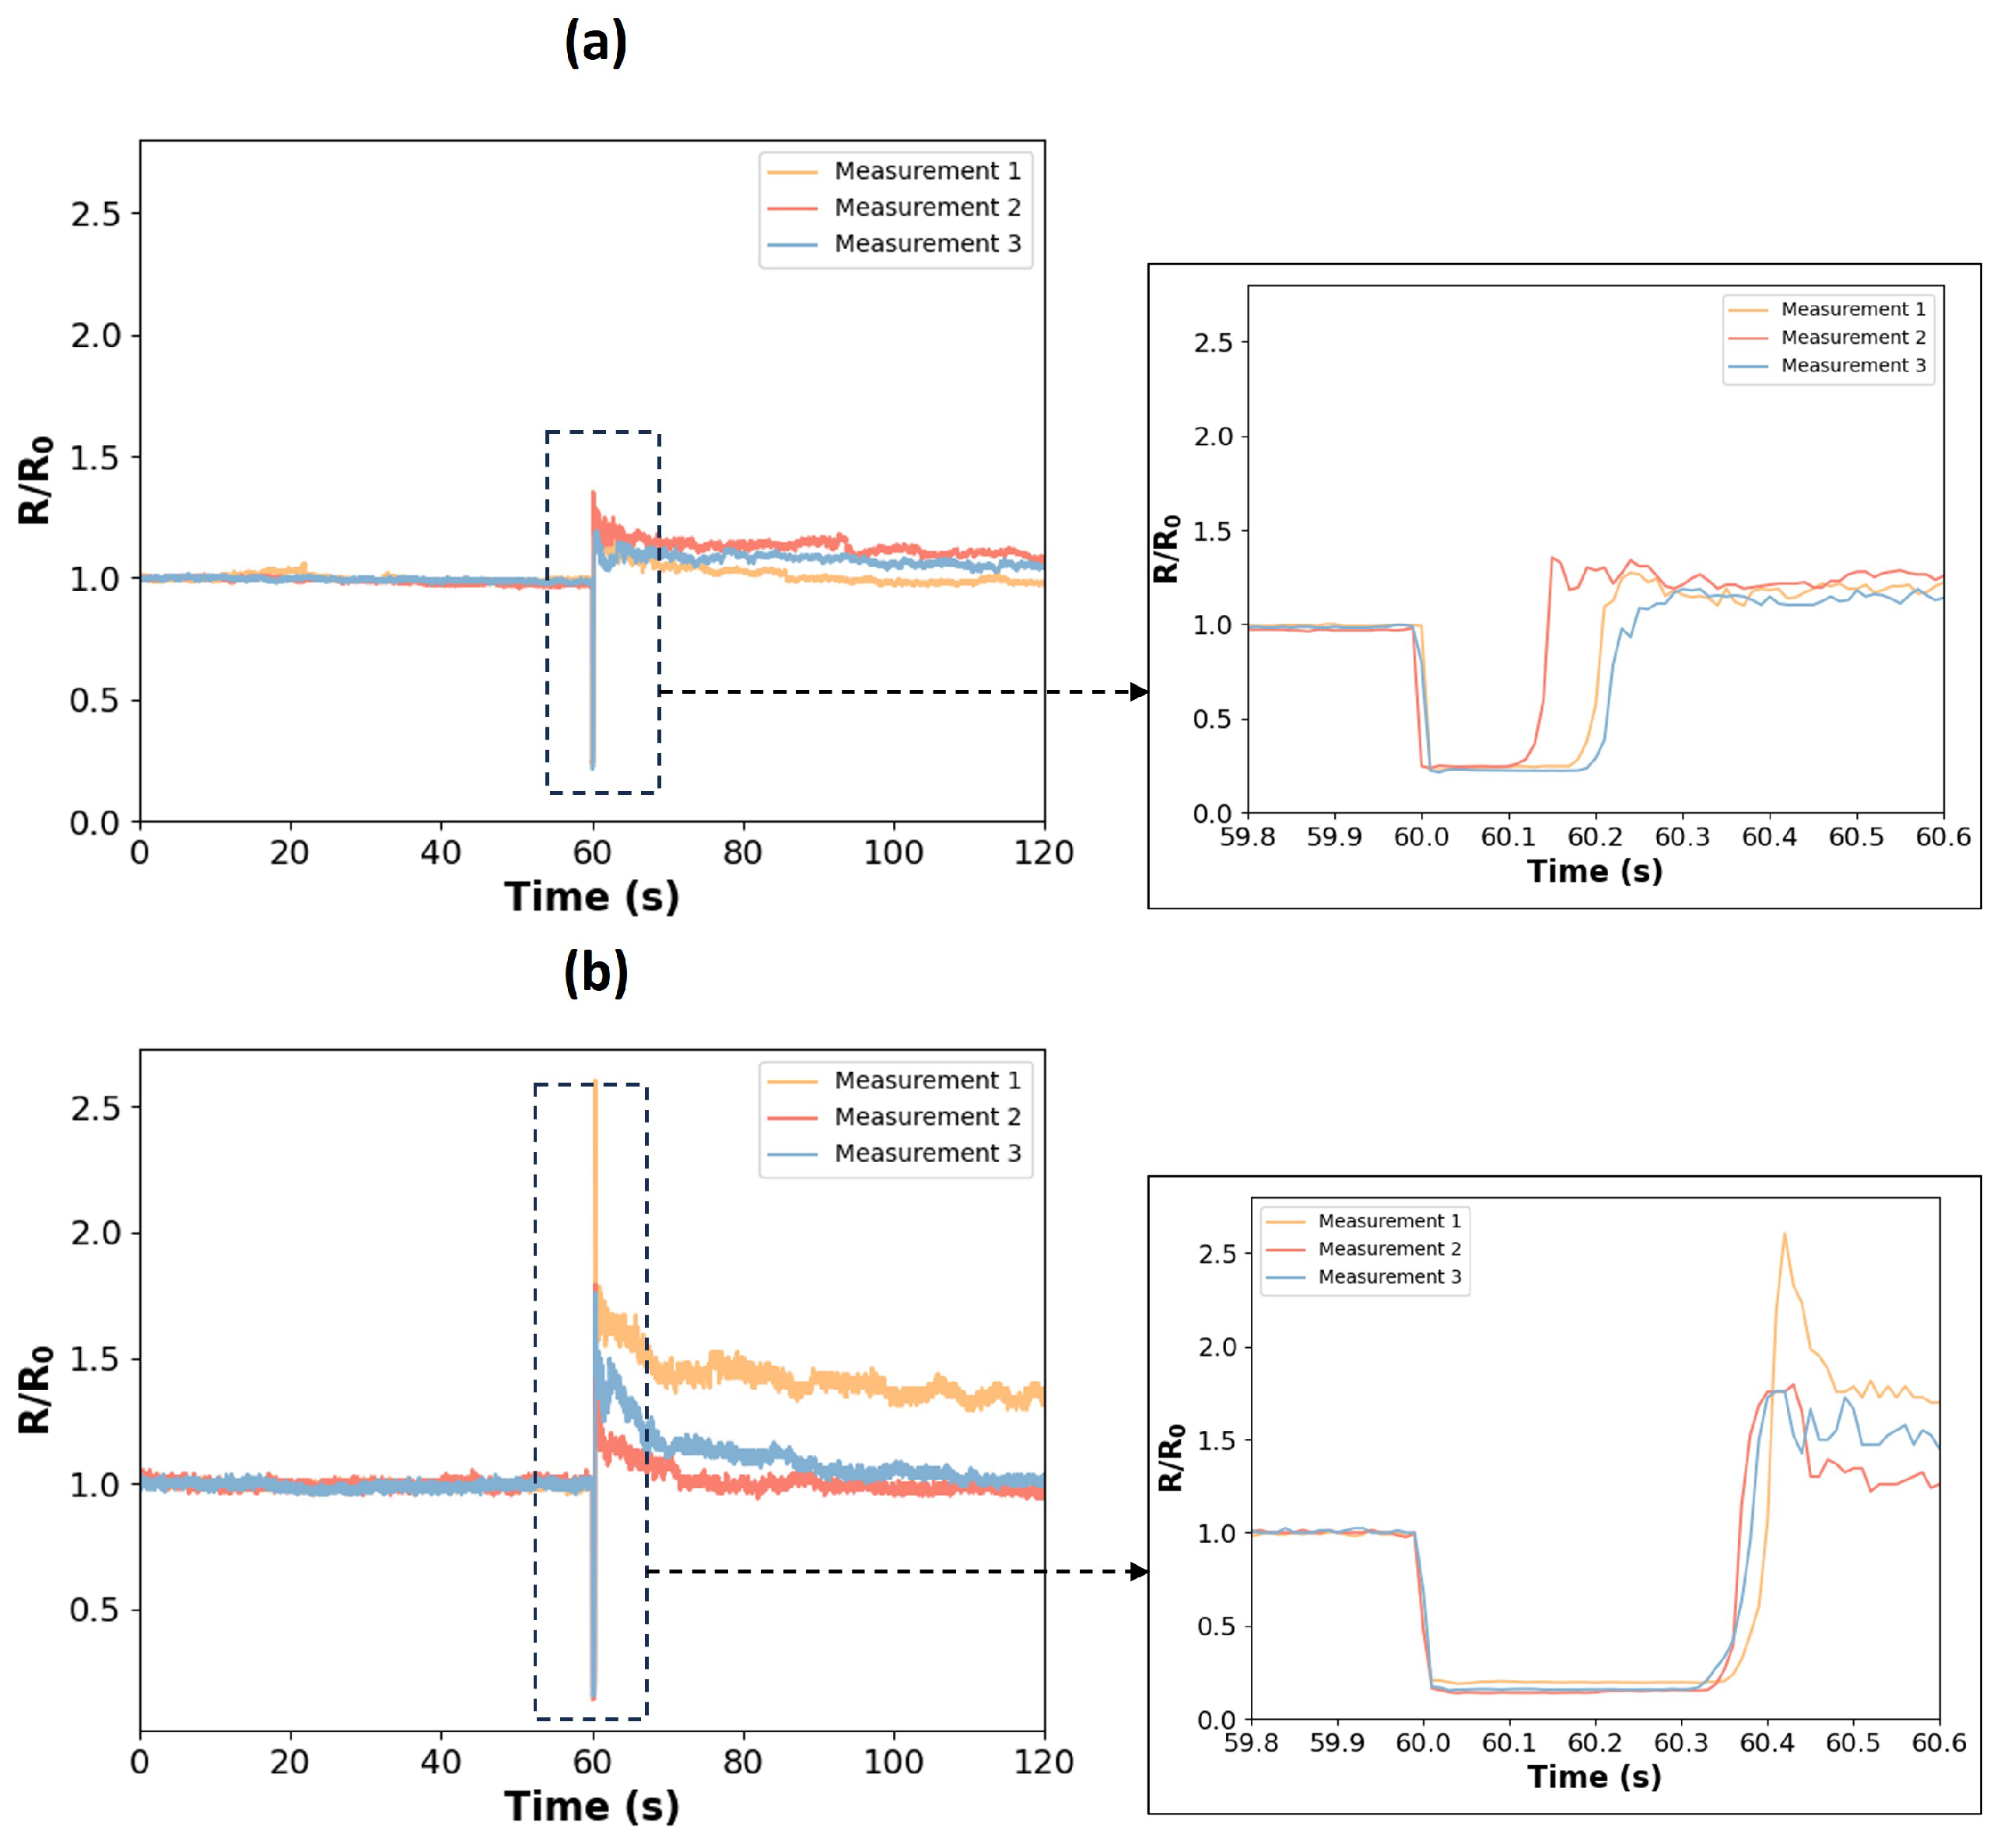
7. Experiment 2: Dynamic Resistance Behaviors under Manual Compression
7.1. Test 1: Single Impulse and Constant Compression
7.1.1. Procedure
7.1.2. Methods of Analysis
7.1.3. Results and Discussion
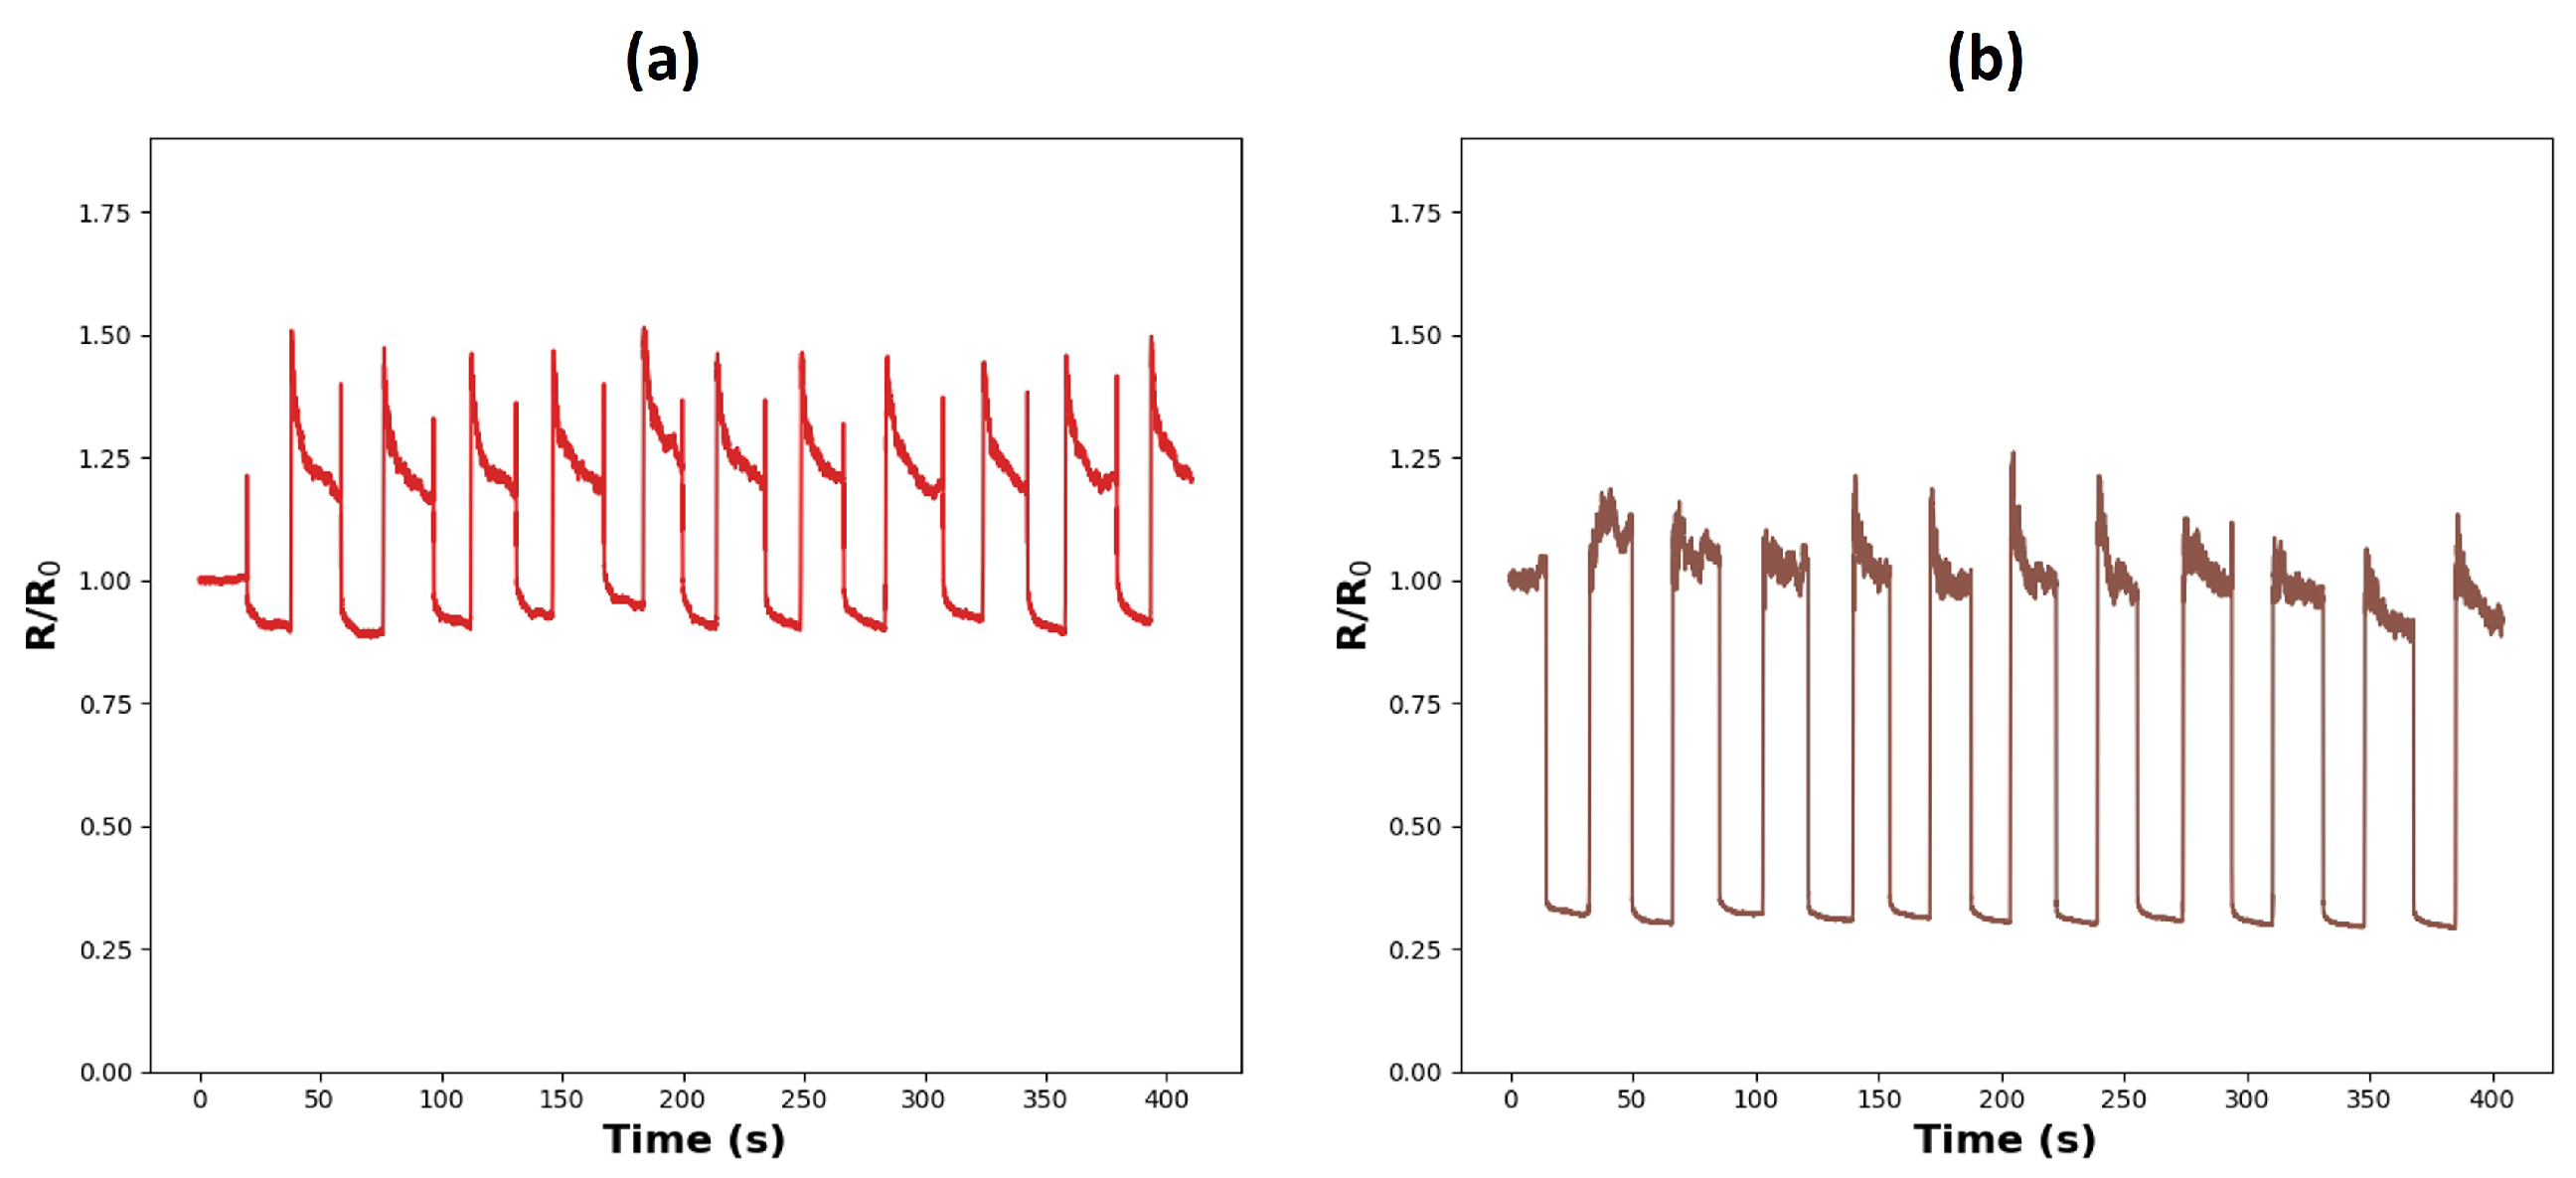
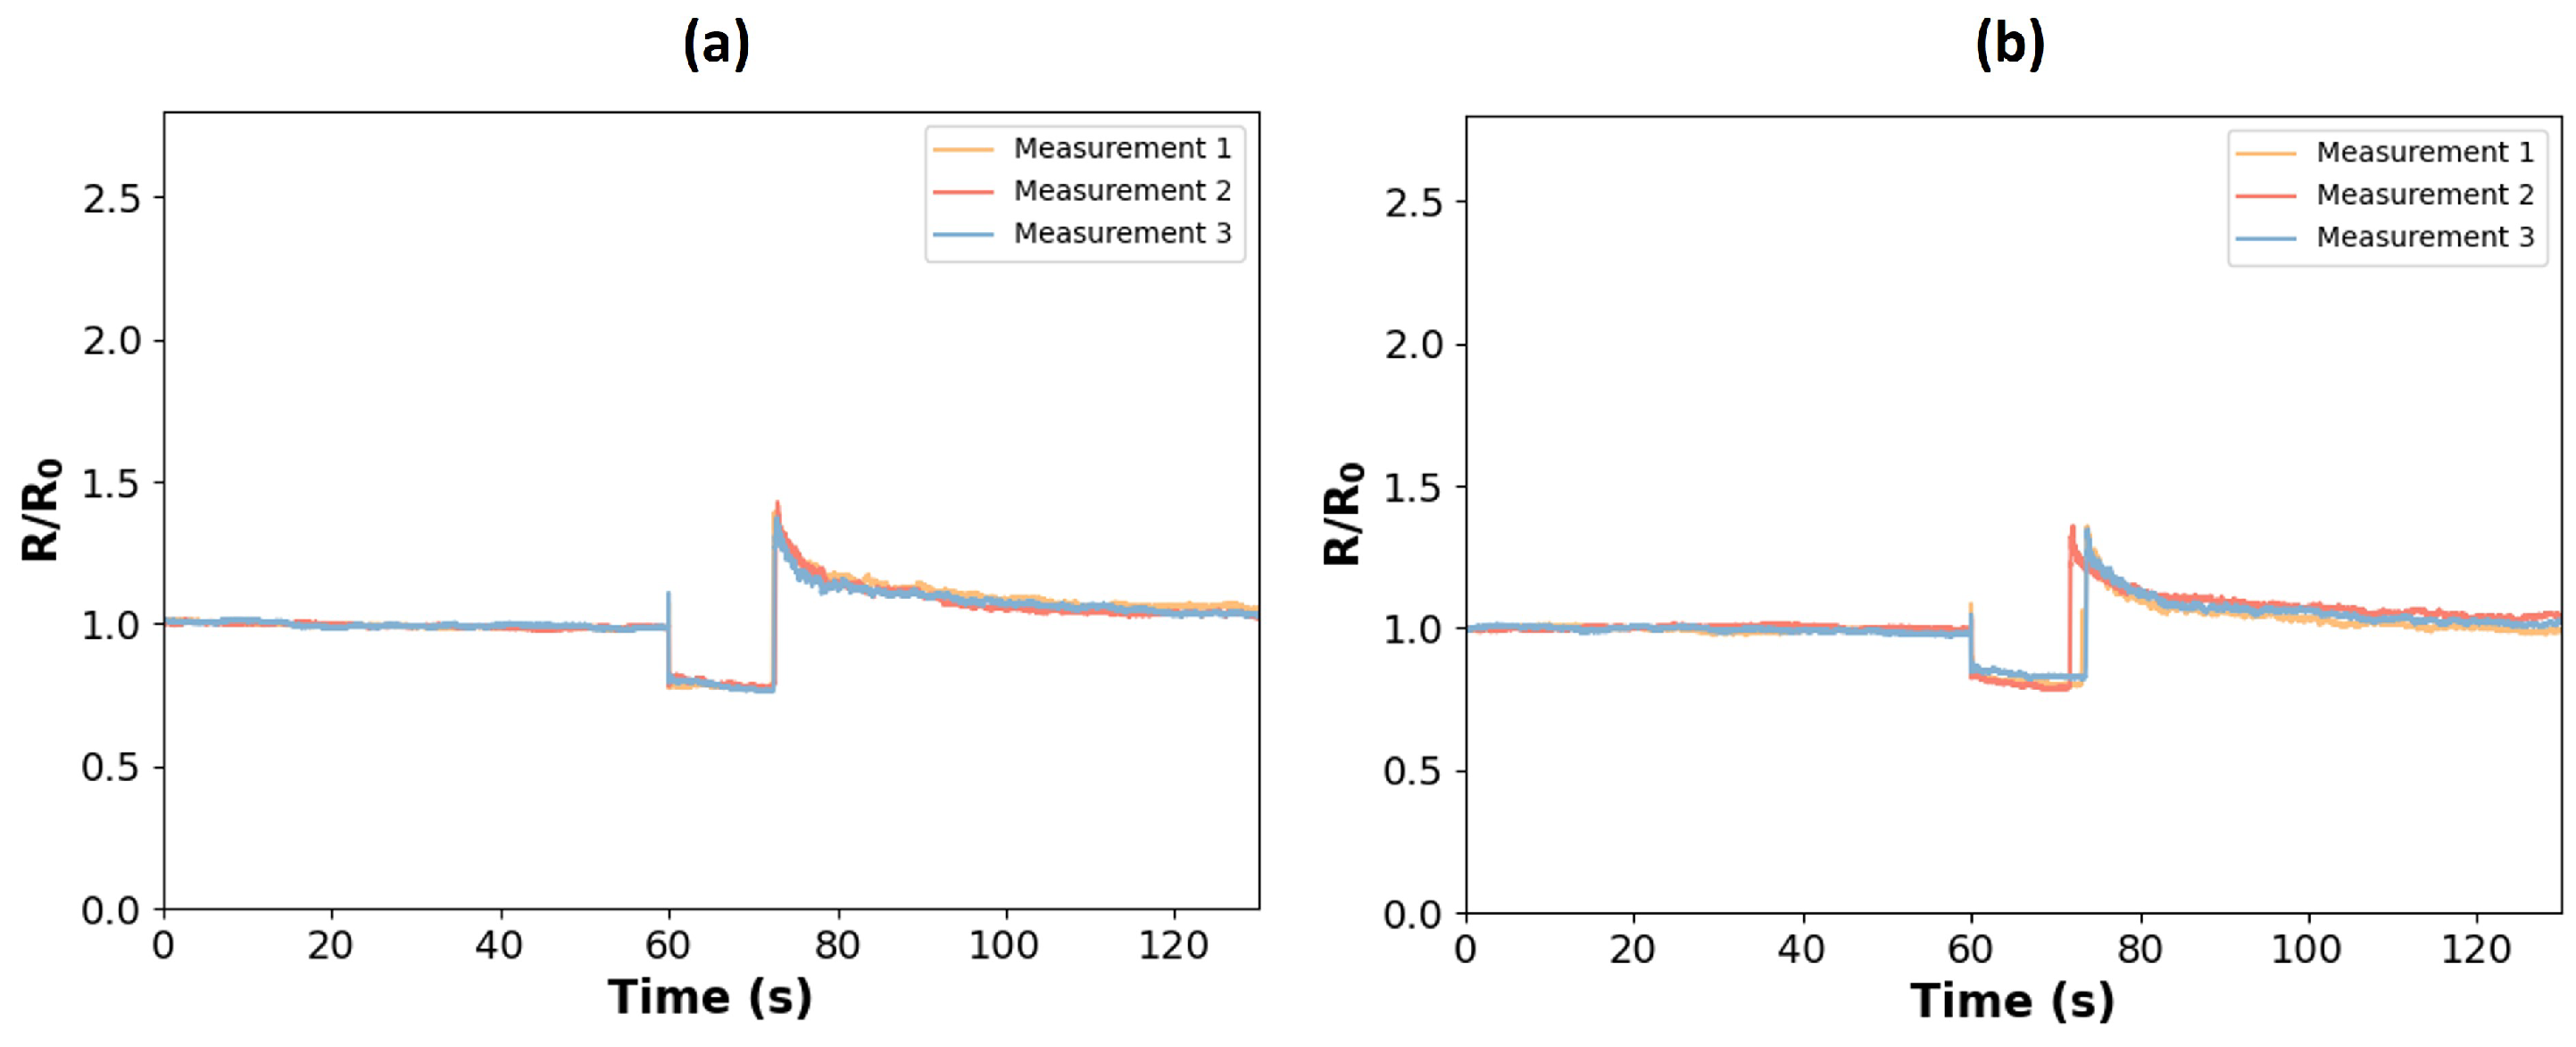
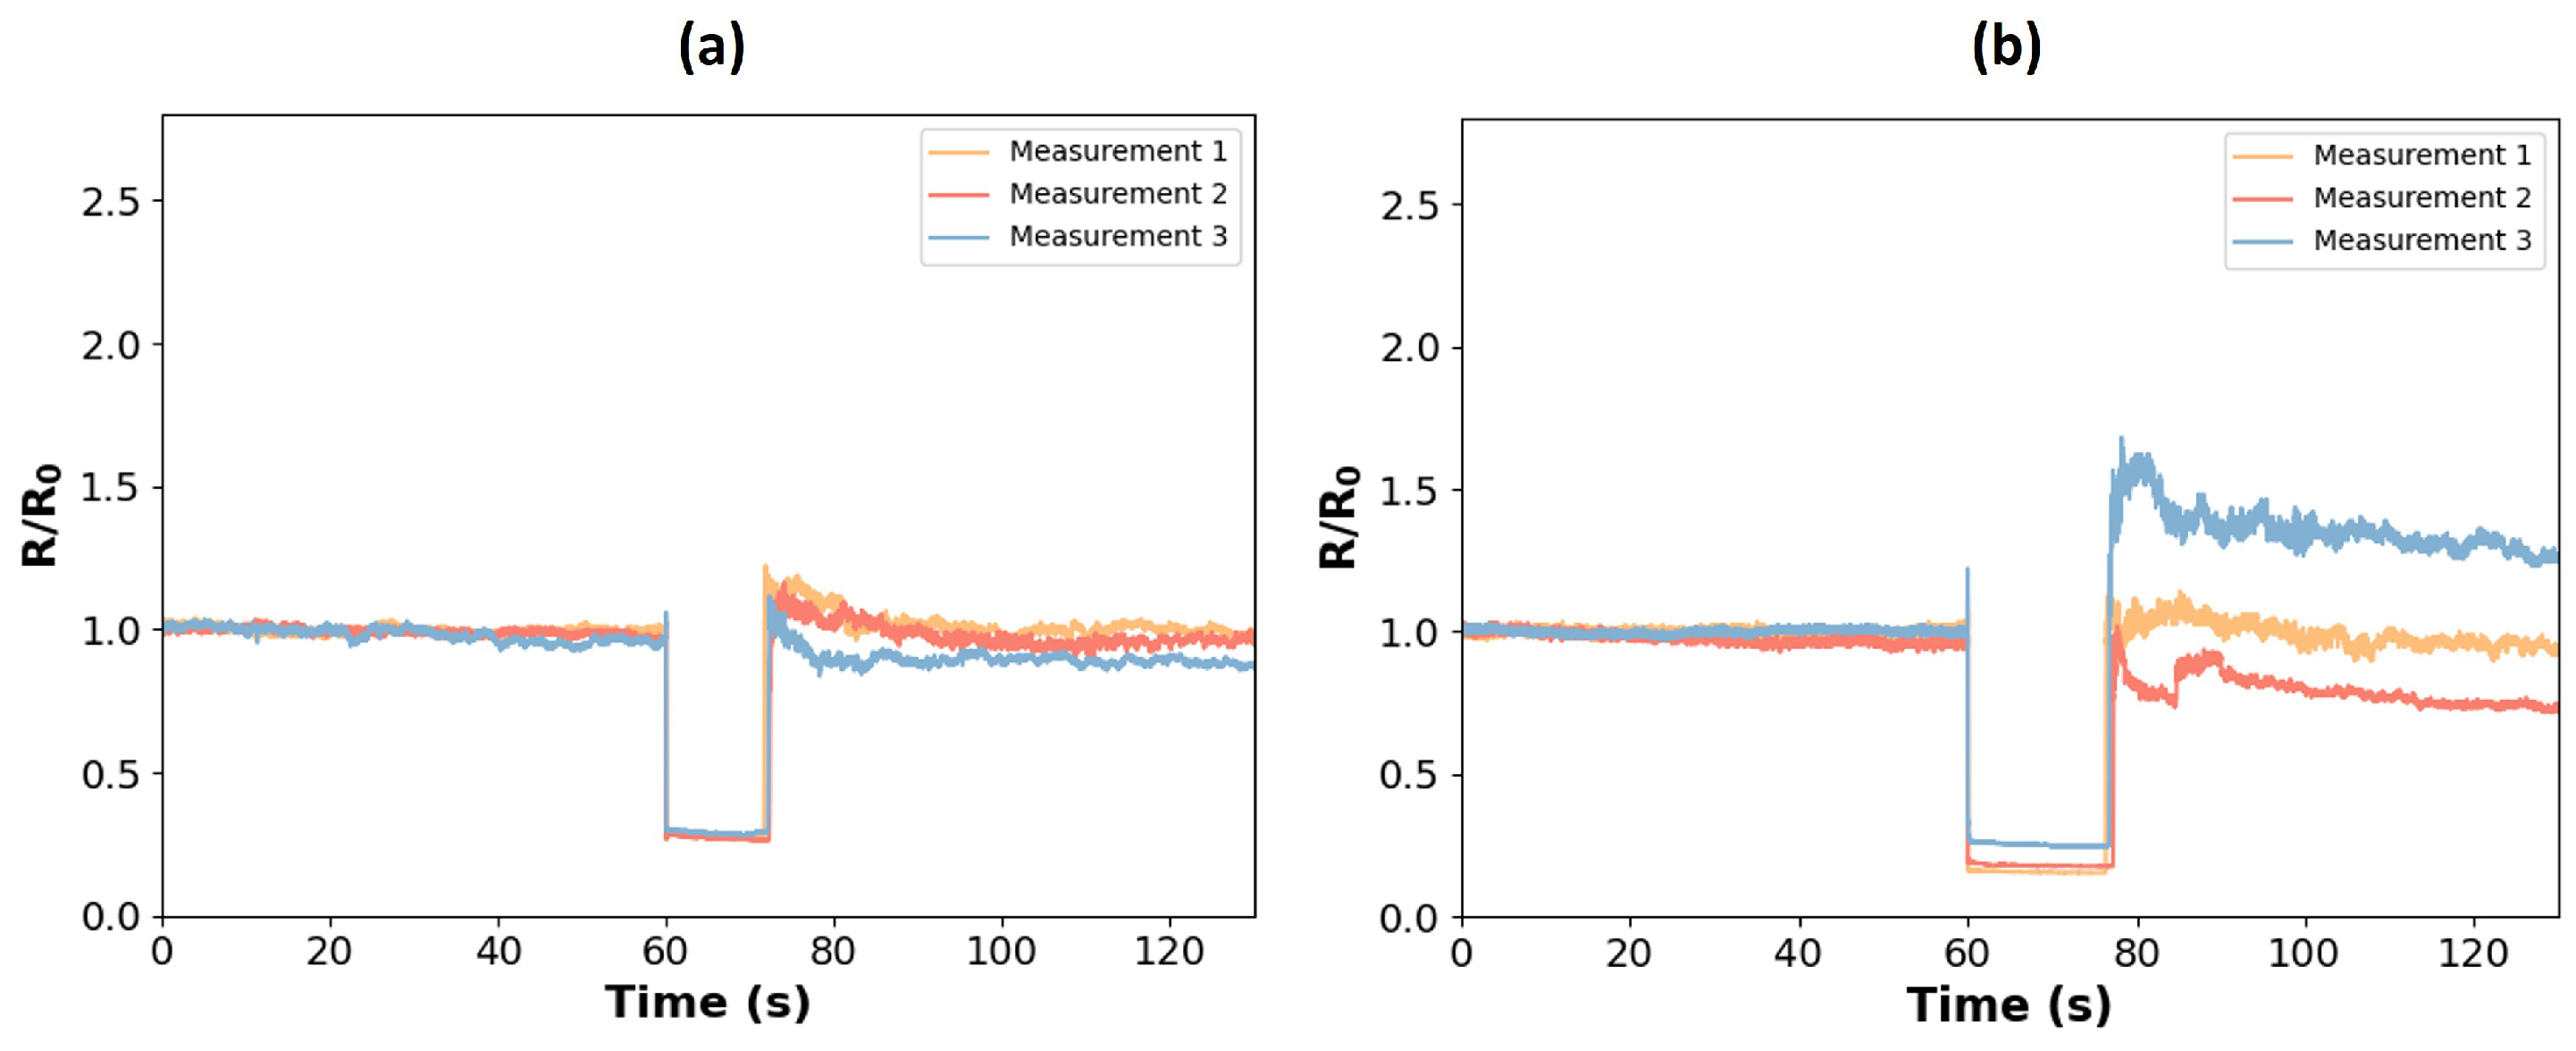
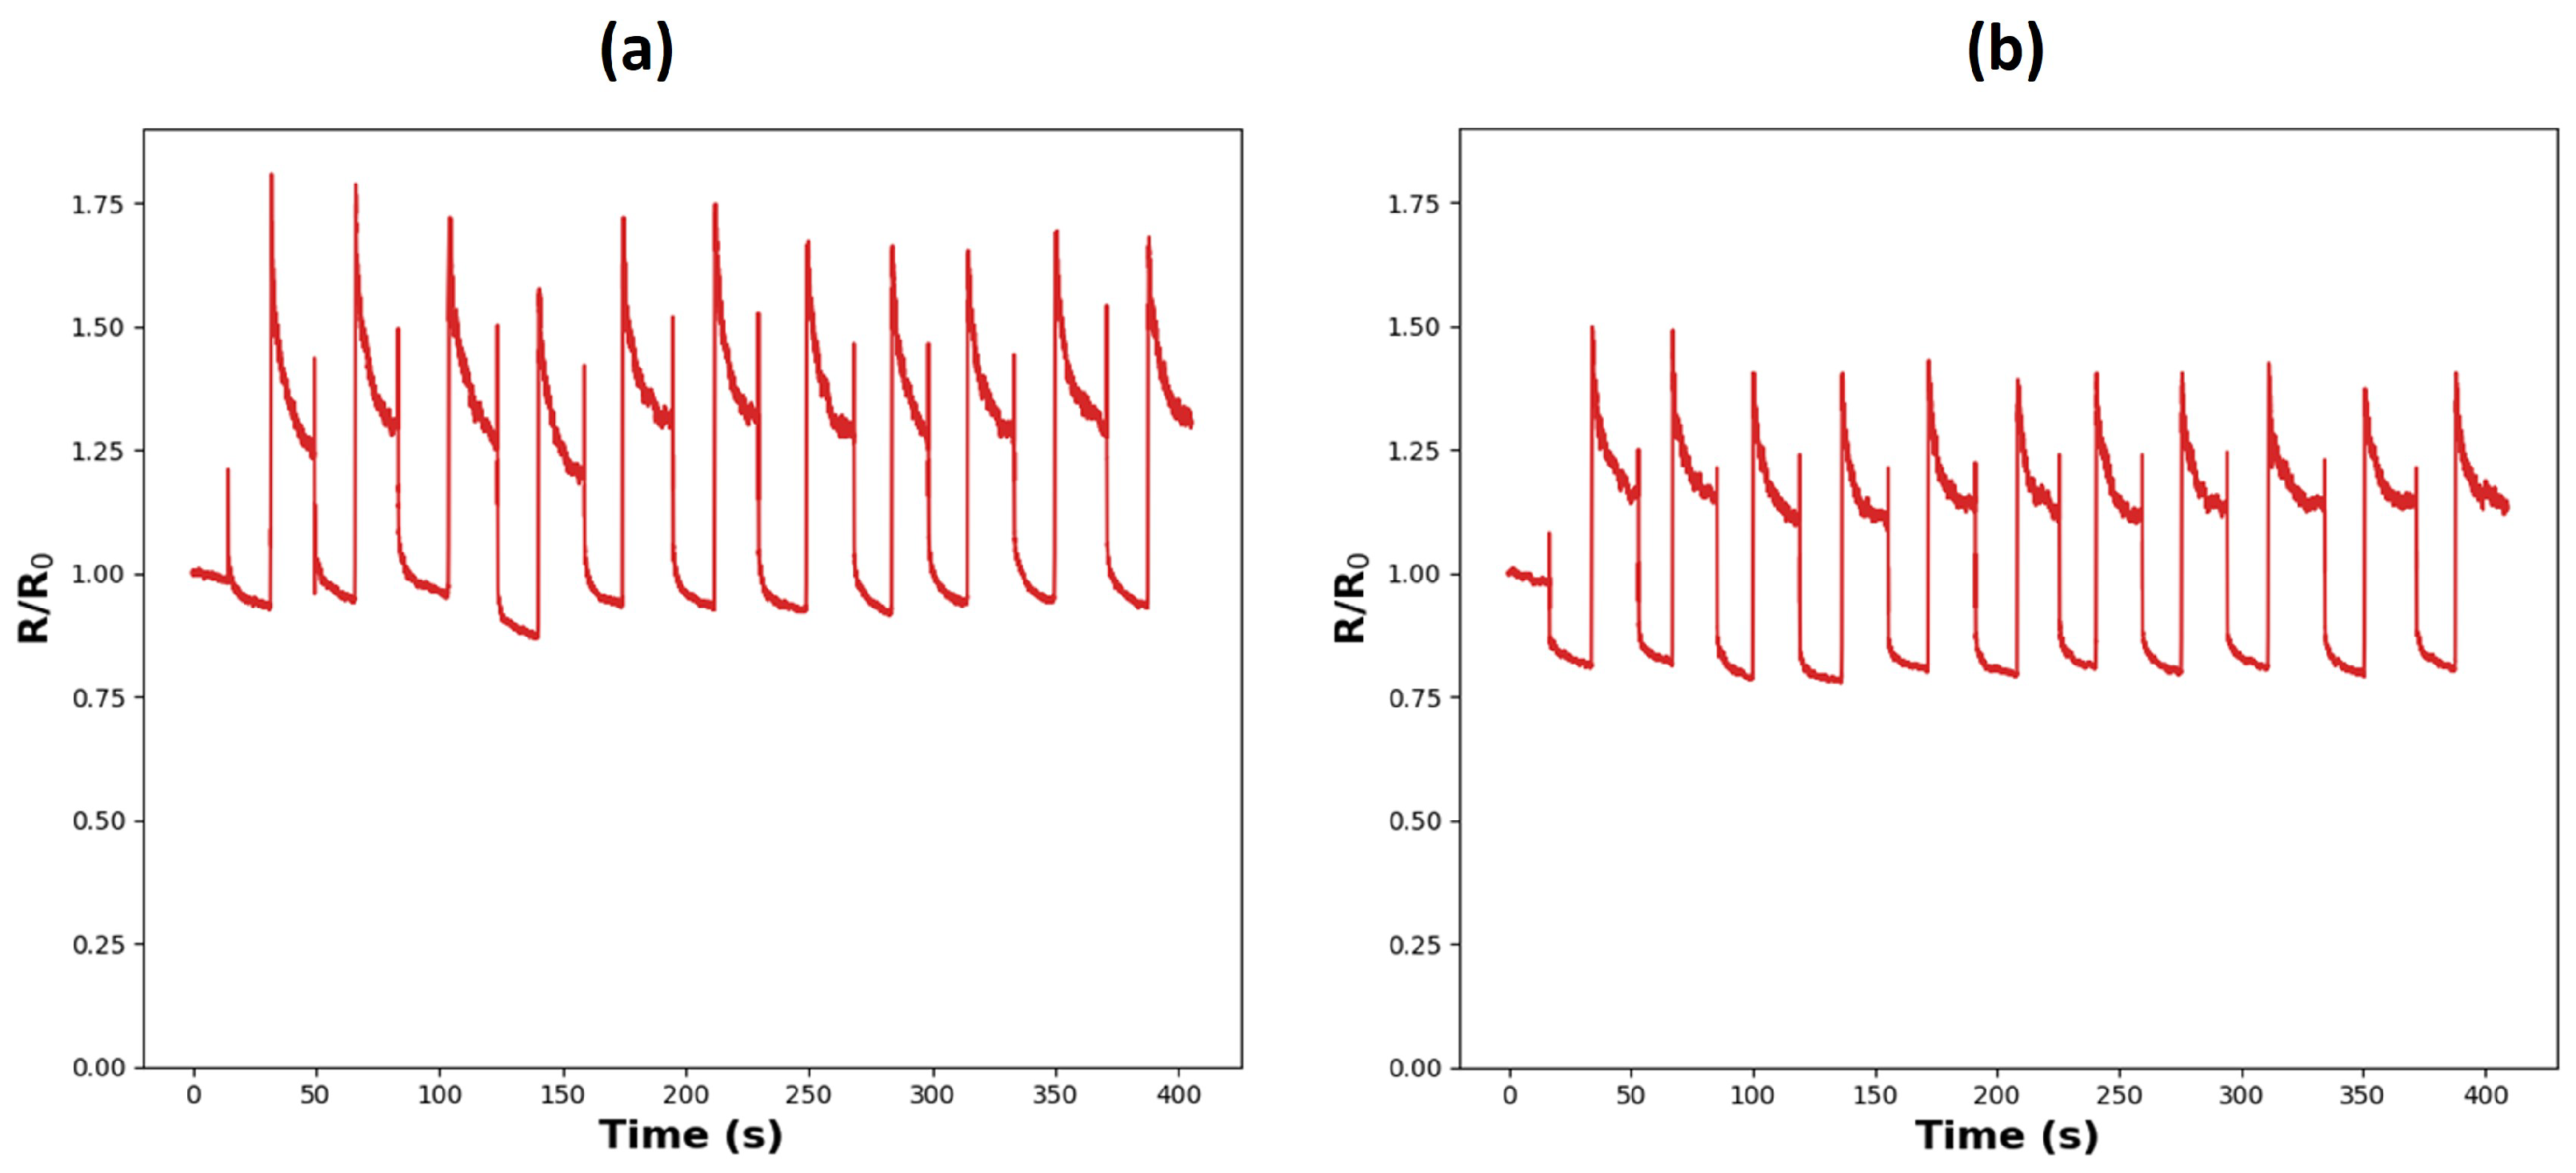
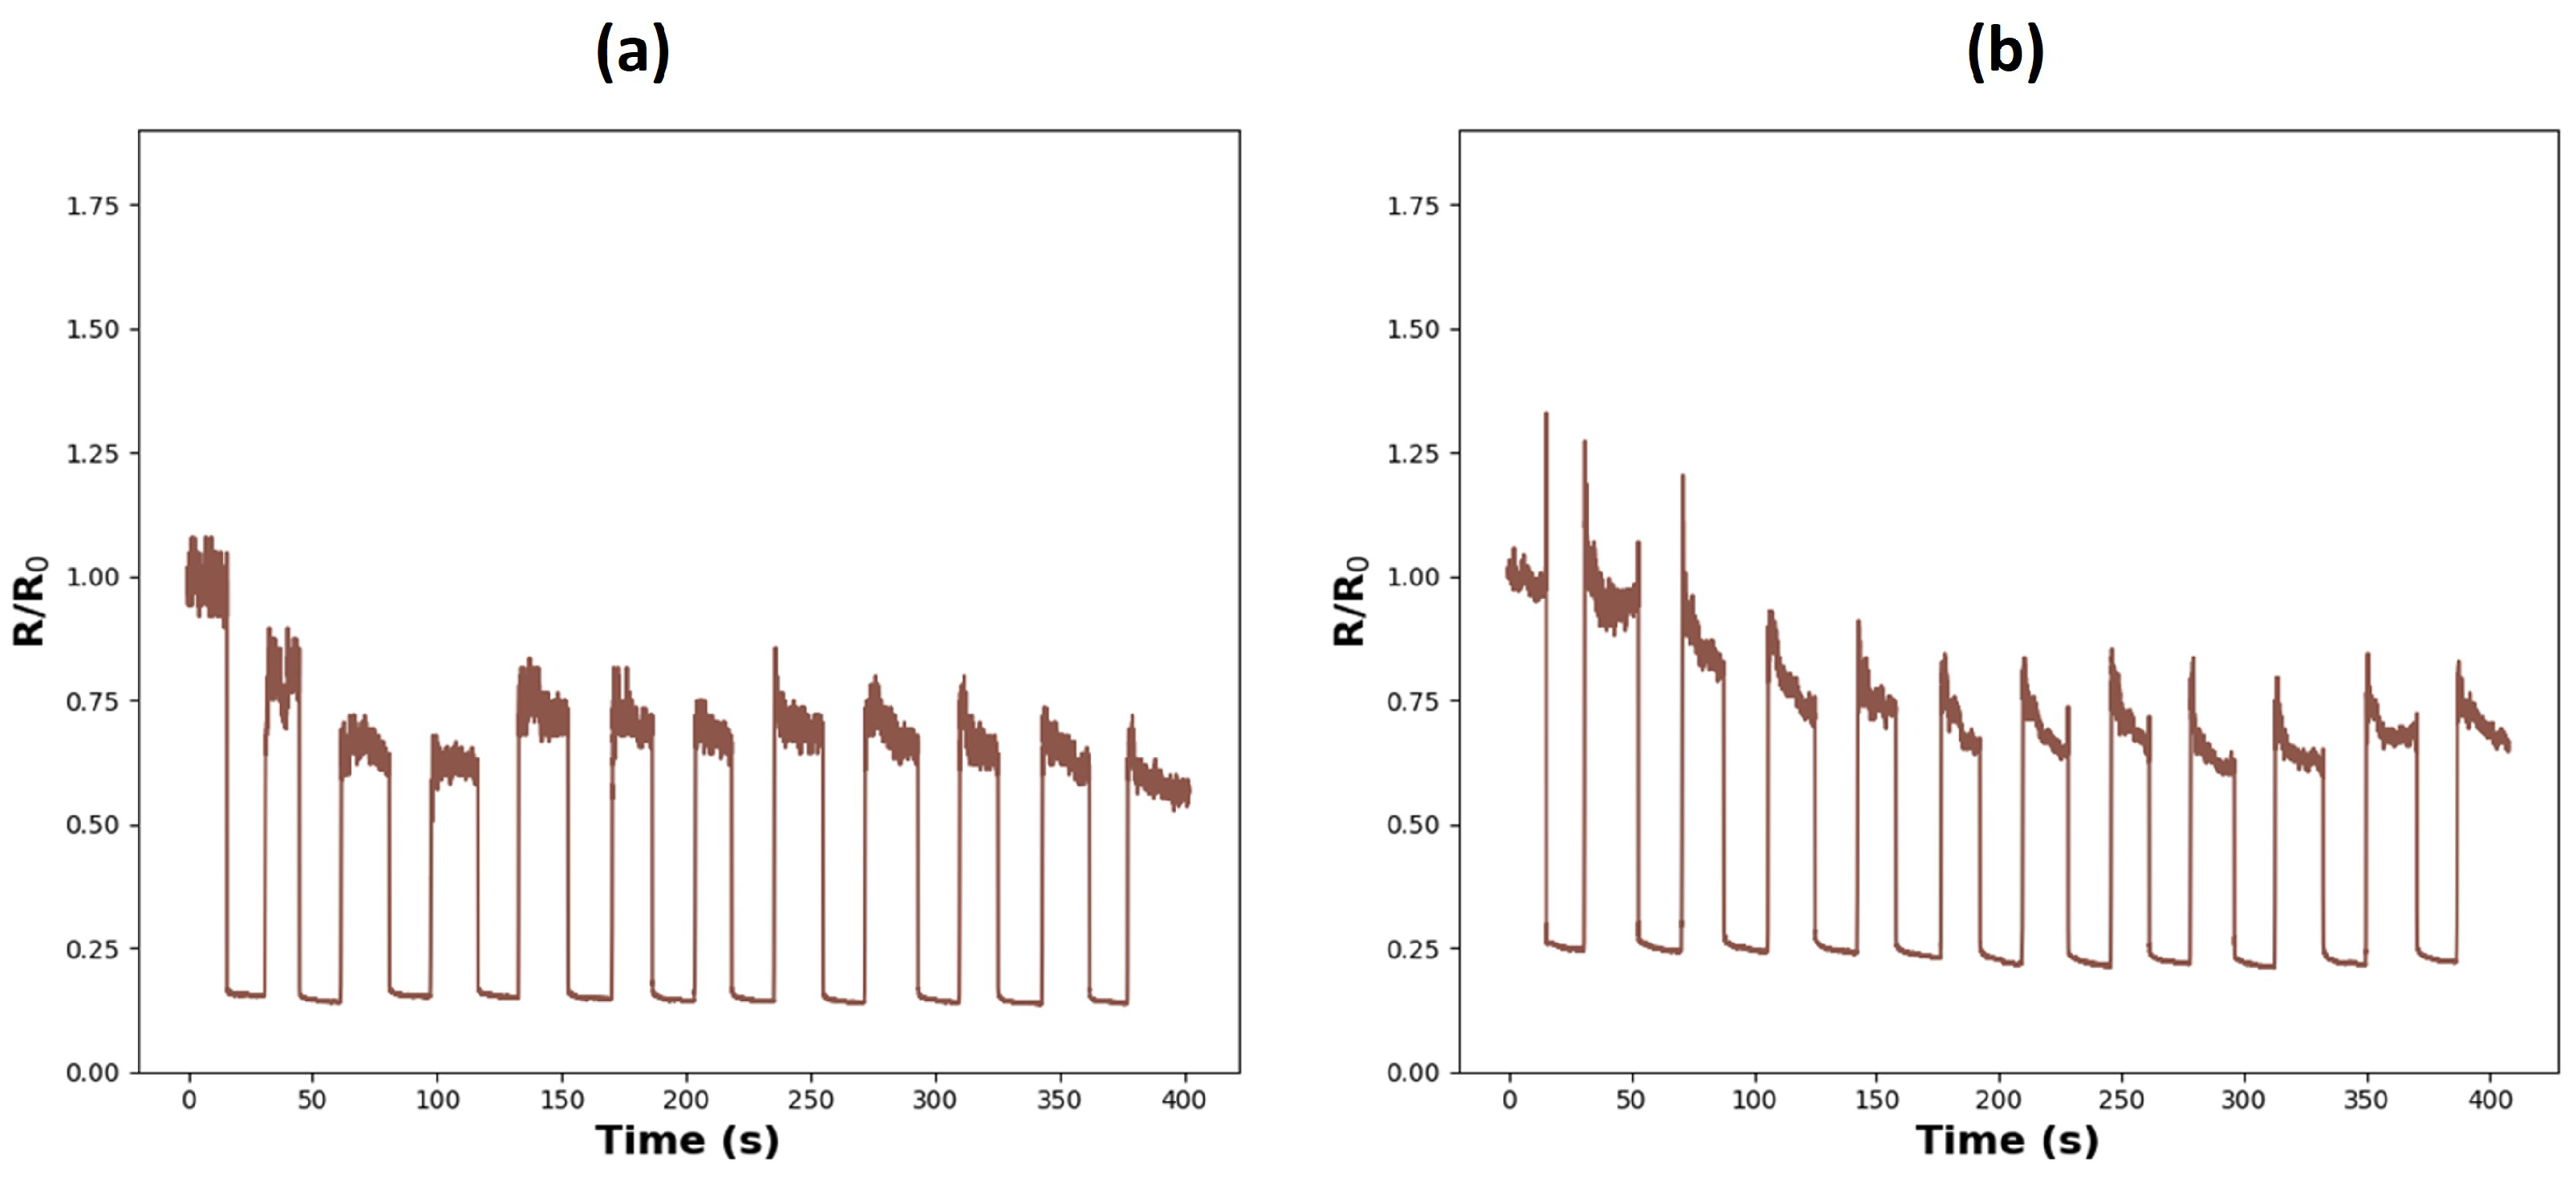
7.2. Test 2: Cyclic Compression
7.2.1. Procedure
7.2.2. Results and Discussion
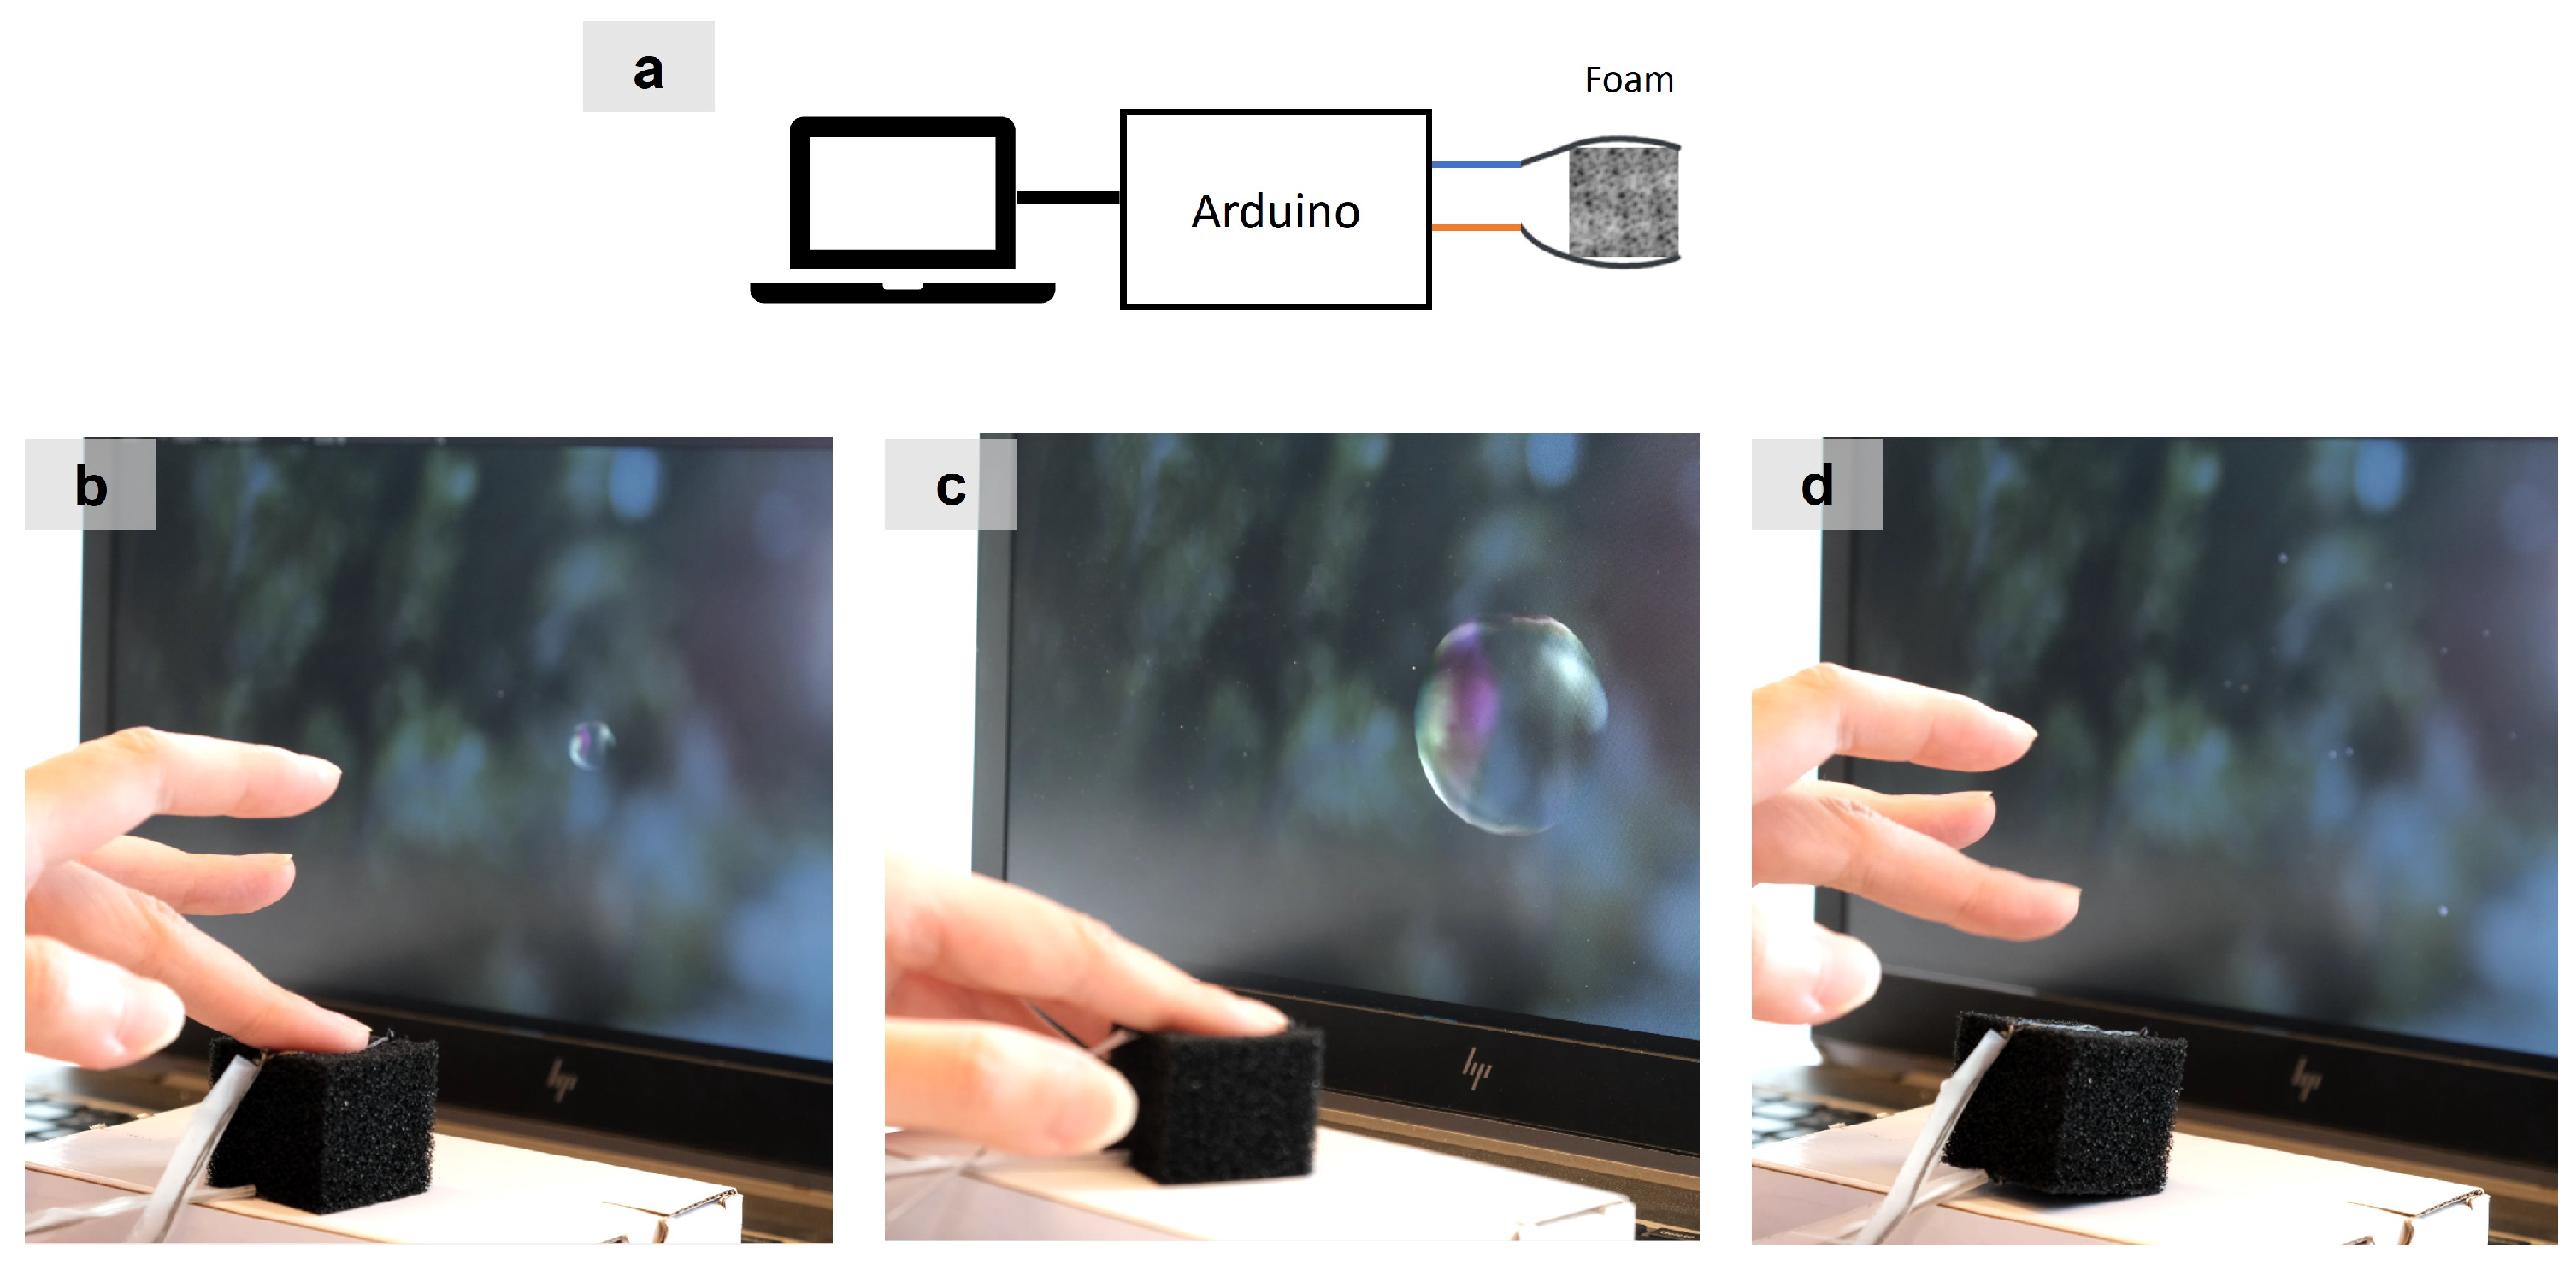
8. Applications
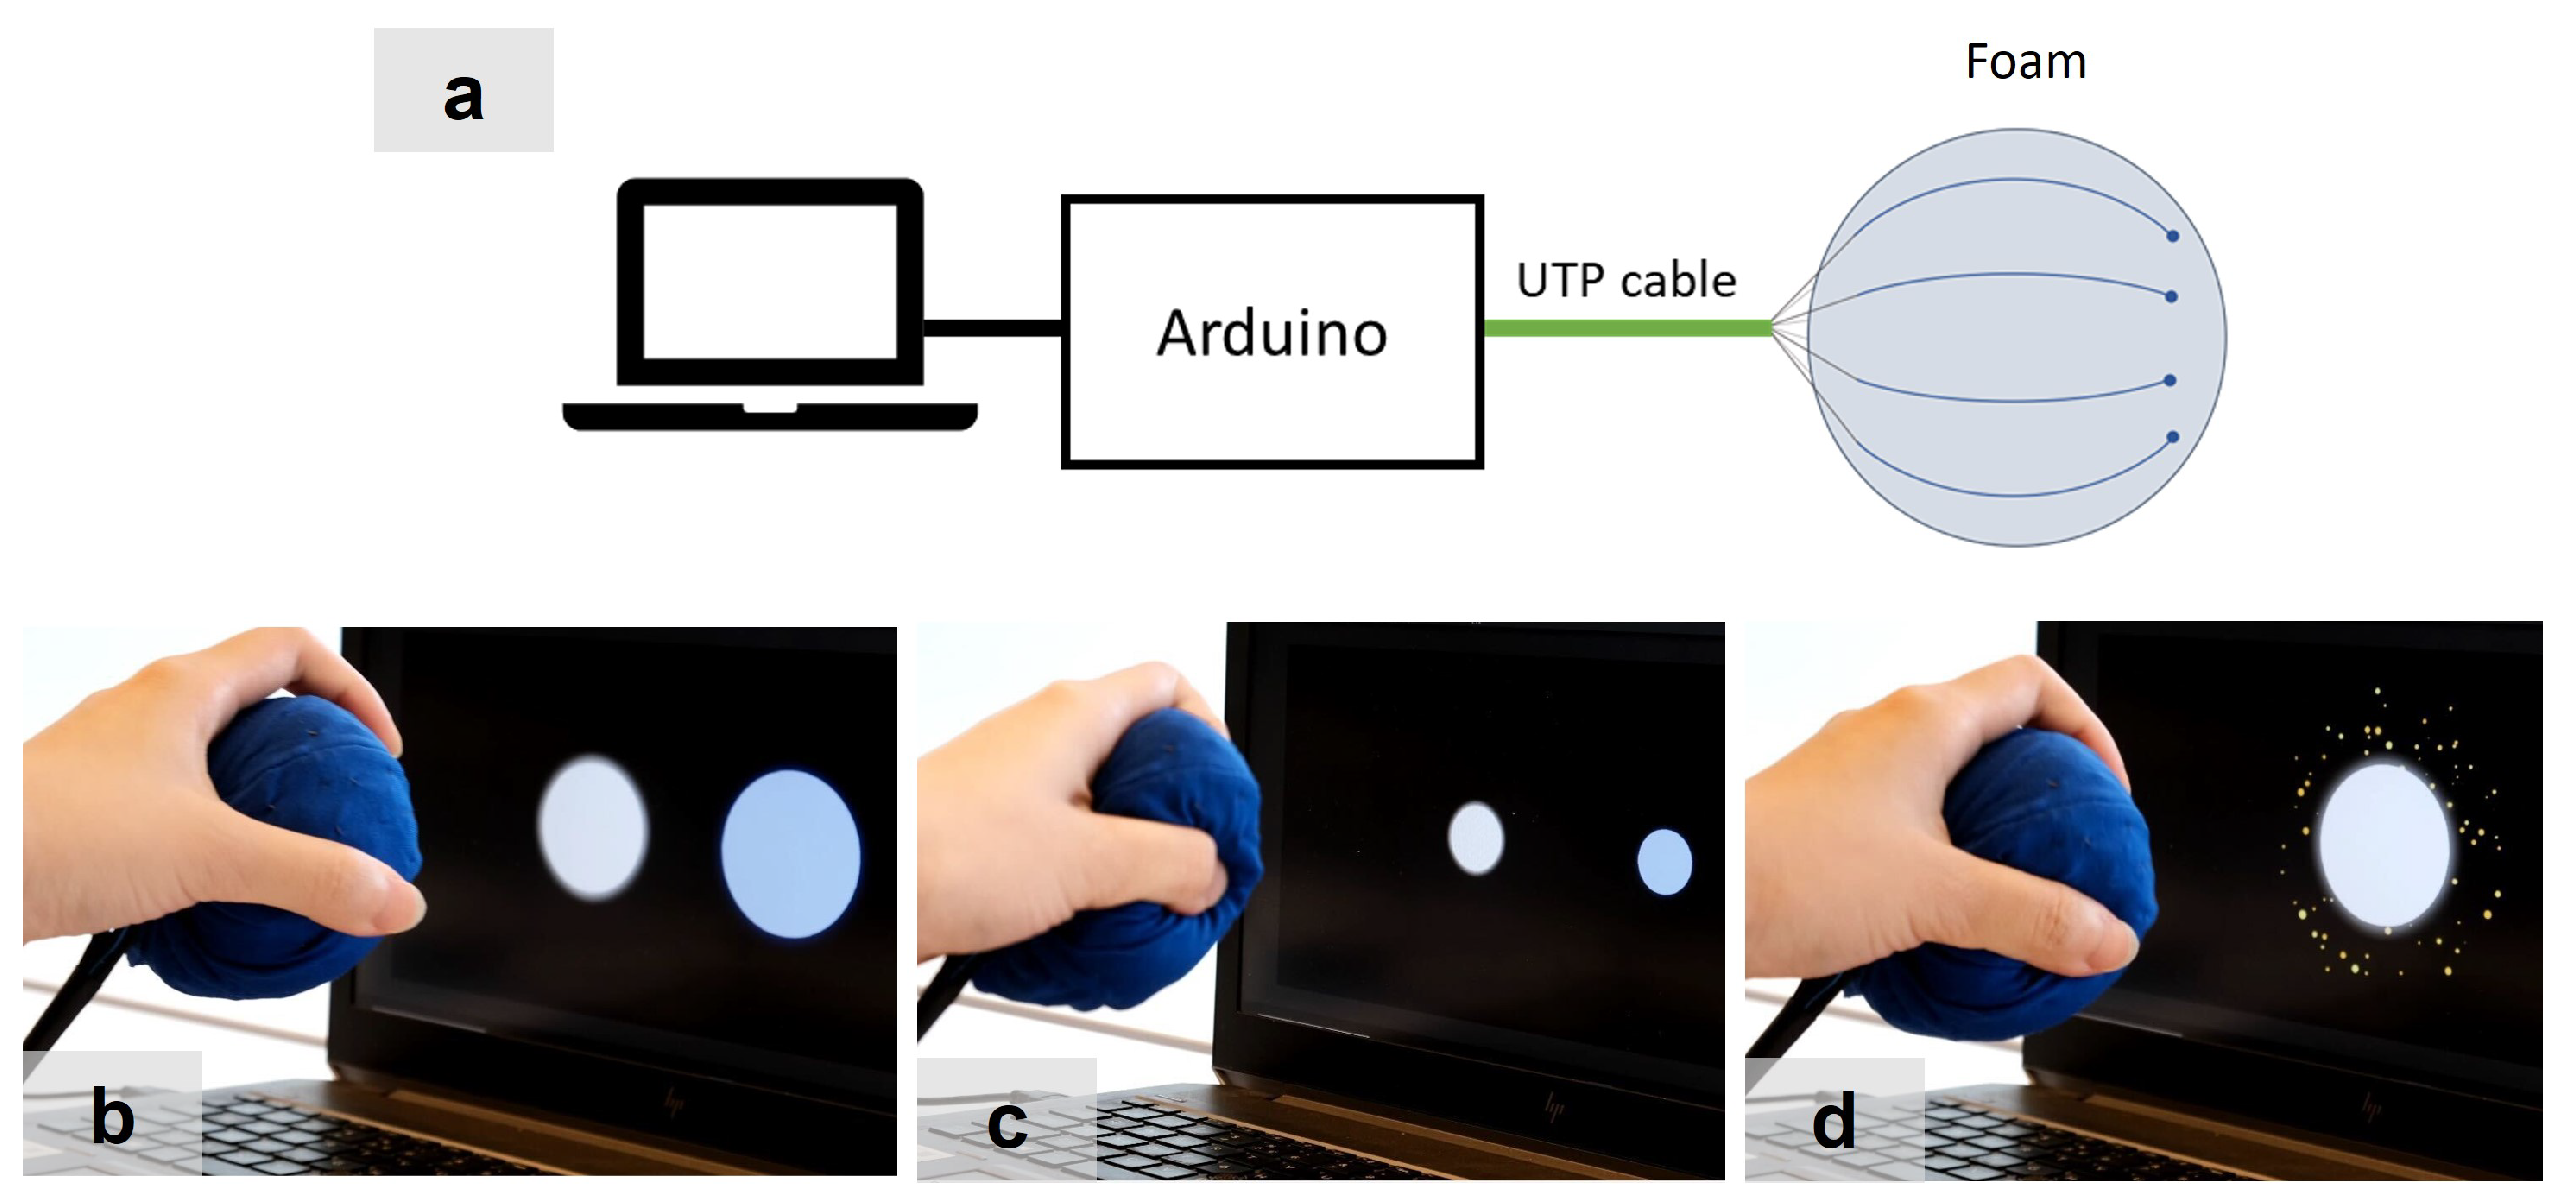
8.1. Finger Interaction: Bubble Popping
8.2. Hand Interaction: Interactive Stress Ball
9. Discussion: Design Guidelines for Foam-Based Squeezable Interfaces
9.1. Leveraging Contact Resistance Instead of Minimizing It
9.2. Choosing Electrode Solution Based on System Requirements
9.3. Calibrating Data Based on Electrical Properties
10. Conclusions
Author Contributions
Funding
Institutional Review Board Statement
Informed Consent Statement
Data Availability Statement
Acknowledgments
Conflicts of Interest
Abbreviations
| PU | Polyurethane |
| HCI | Human–Computer Interaction |
| DIY | Do-It-Yourself |
| CV | Coefficient of Variation |
| UTP | Unshielded Twisted Pair |
| FSR | Force-Sensitive Resistor |
Appendix A. Contact Resistance—Sample 2

Appendix B. Table—Variance of Resistance Change Across Samples

| Electrode | ) (%) | ) (%) |
|---|---|---|
| a. Copper tape | 10.91 | 4.76 |
| b. Fabric tape | 6.21 | 4.61 |
| c. Thread (insert, 1 piece) | 5.34 | 3.79 |
| d. Thread (insert, 2 pieces) | 8.00 | 4.22 |
| e. Thread (surface, 1 piece) | 7.78 | 8.90 |
| f. Thread (surface, 2 pieces) | 6.64 | 6.60 |
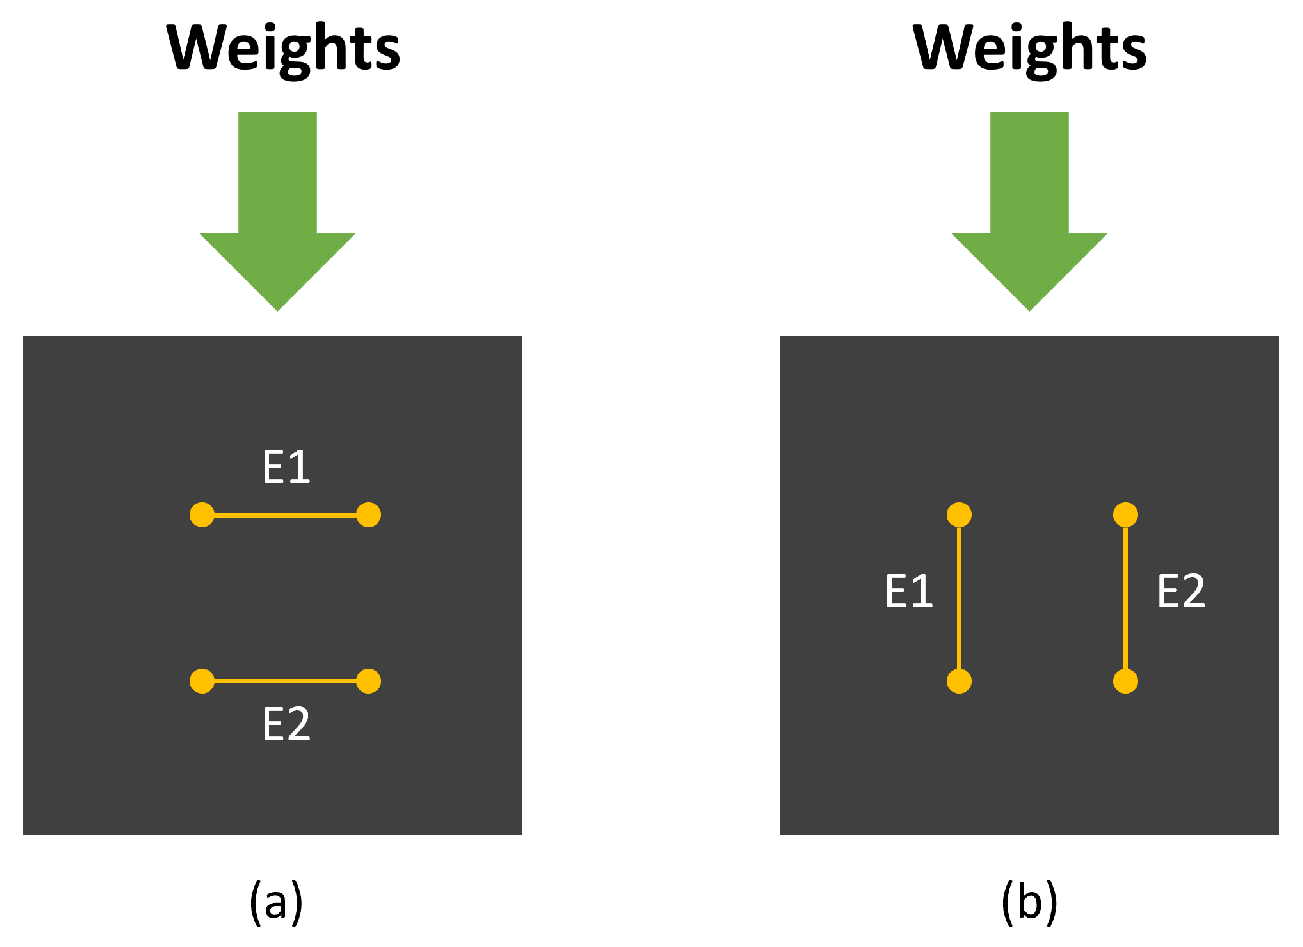
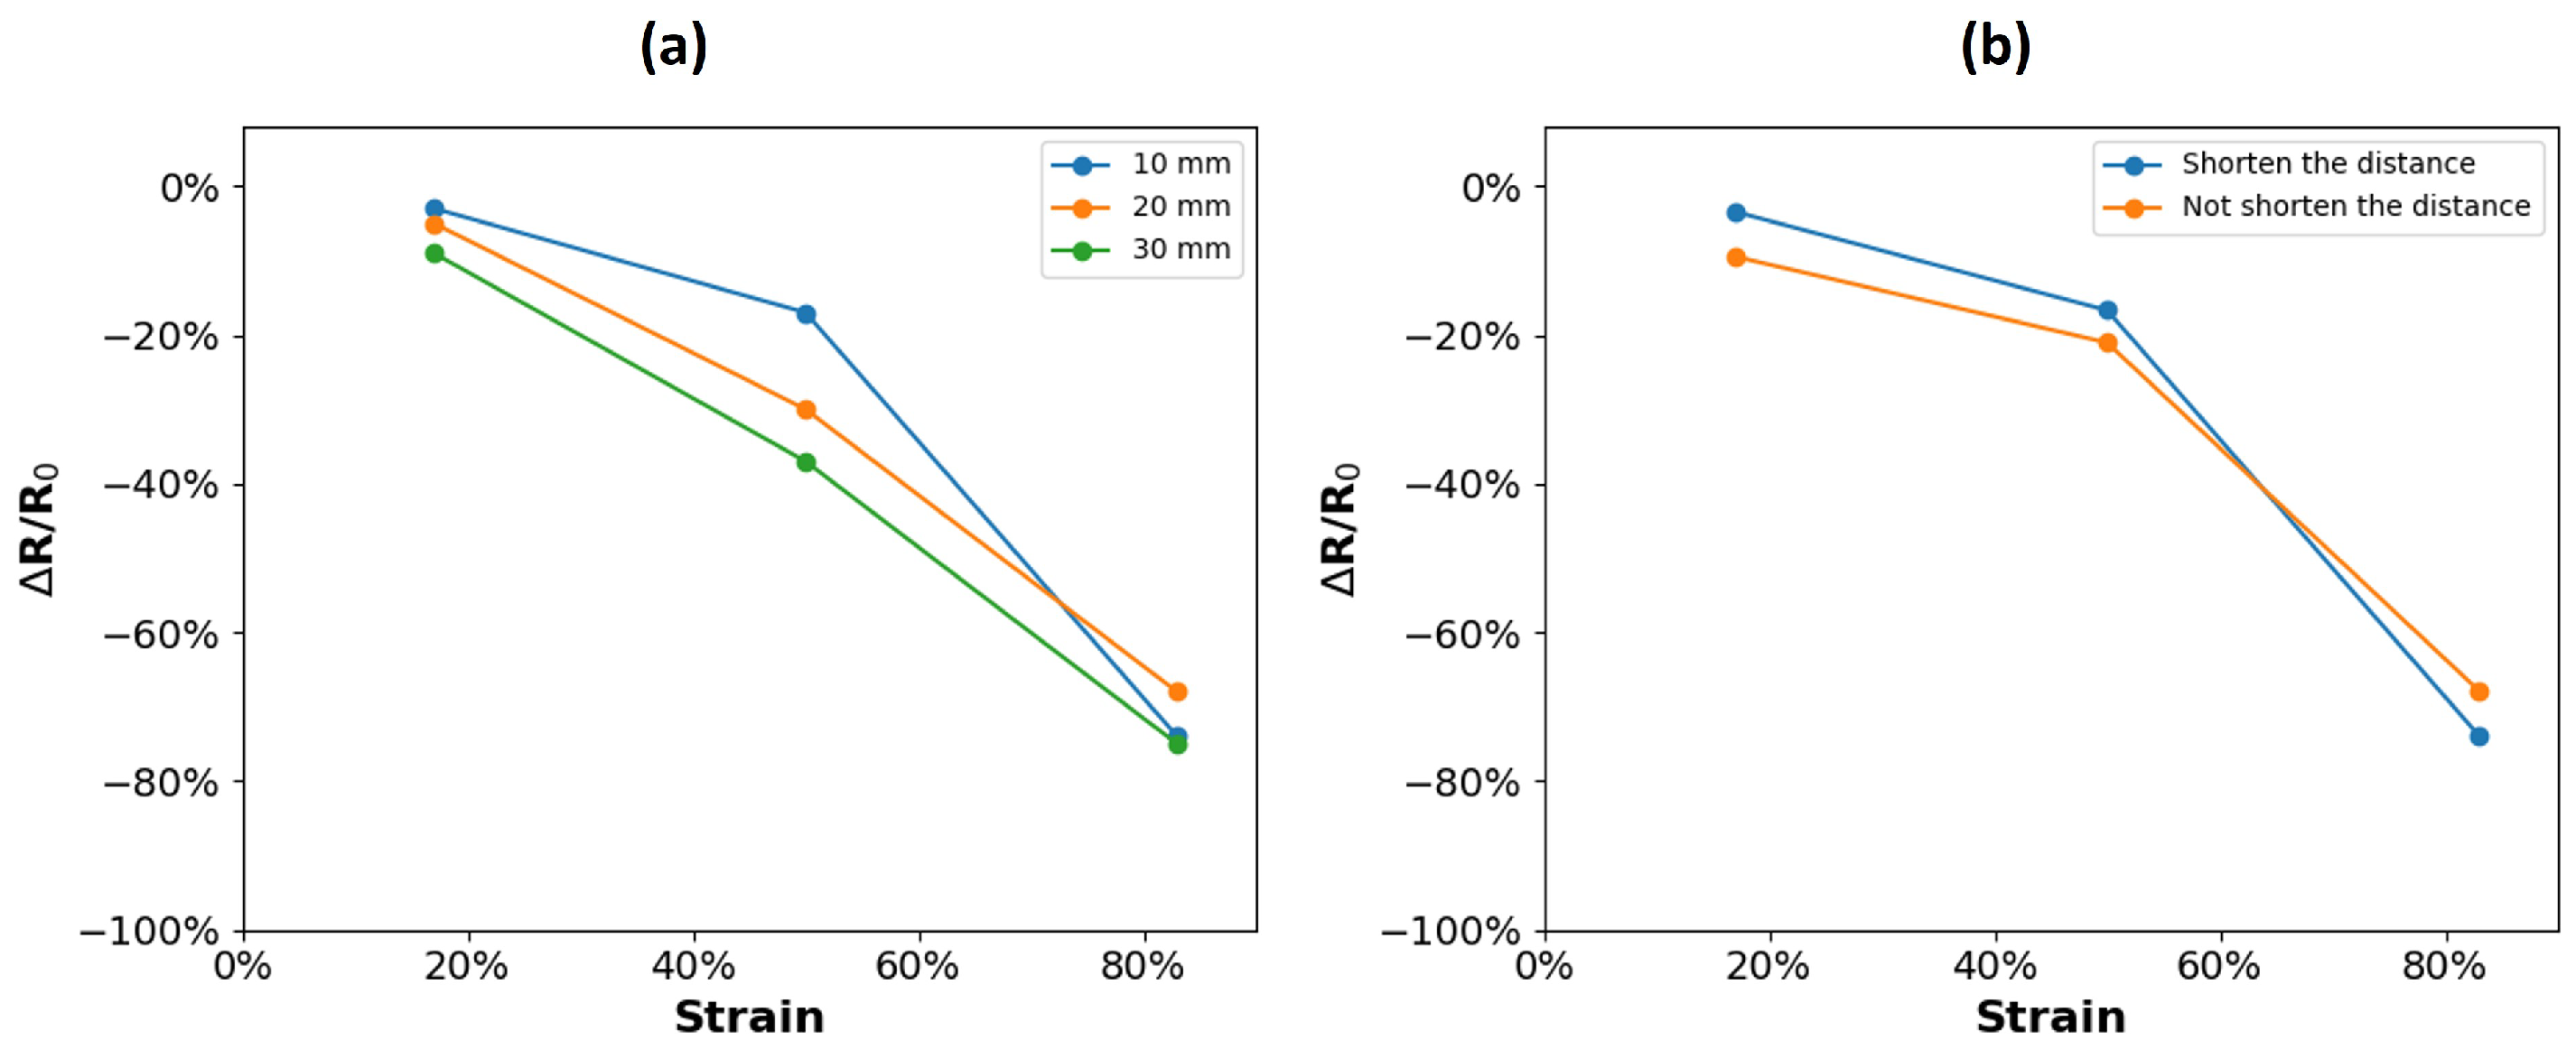
Appendix C. Experiments of Electrode Distance and Compression Direction
- Test 1 (T1): electrode distance
- Test 2 (T2): compression direction
Appendix C.1. Procedure

Appendix C.2. Methods of Analysis
Appendix C.3. Results

Appendix D. Supplementary Plots for Dynamic Resistance Behavior


References
- Boem, A.; Troiano, G.M. Non-Rigid HCI: A Review of Deformable Interfaces and Input. In Proceedings of the 2019 Designing Interactive Systems Conference, San Diego, CA, USA, 23–28 June 2019; pp. 885–906. [Google Scholar] [CrossRef]
- Weinberg, G. Playpens, Fireflies and Squeezables: New Musical Instruments for Bridging the Thoughtful and the Joyful. Leonardo Music J. 2002, 12, 43–51. [Google Scholar] [CrossRef]
- Boem, A. A Malleable Tangible Interface for Sound Sculpting. In Proceedings of the ICMC, Athens, Greece, 14–20 September 2014; pp. 737–743. [Google Scholar]
- Kiefer, C. A Malleable Interface for Sonic Exploration. In Proceedings of the International Conference on New Interfaces for Musical Expression, Sydney, Australia, 15–18 June 2010; pp. 291–296. [Google Scholar] [CrossRef]
- Hashimoto, S.; Sawada, H. A Grasping Device to Sense Hand Gestures for Expressive Sound Generation. J. New Music. Res. 2005, 34, 115–123. [Google Scholar] [CrossRef]
- Grierson, M.; Kiefer, C. NoiseBear: A Wireless Malleable Instrument Designed in Participation with Disabled Children. In Proceedings of the International Conference on New Interfaces for Musical Expression (NIME), Daejeon, Republic of Korea, 27–30 May 2013; pp. 413–416. [Google Scholar] [CrossRef]
- Brzozowski, I.; Bratek, P.; Dziurdzia, P.; Gelmuda, W.; Kos, A.; Ostrowski, J.; Rzepka, D. Breath Sensor Based on Conductive Foam: Idea, Construction, and Characterization. In Proceedings of the 2016 International Conference on Signals and Electronic Systems (ICSES), Krakow, Poland, 5–7 September 2016; pp. 219–224. [Google Scholar] [CrossRef]
- Smith, R.T.; Thomas, B.H.; Piekarski, W. Digital Foam Interaction Techniques for 3D Modeling. In Proceedings of the 2008 ACM Symposium on Virtual Reality Software and Technology, Bordeaux, France, 27–29 October 2008; pp. 61–68. [Google Scholar] [CrossRef]
- Tech Note: Digital Foam. In Proceedings of the 2008 IEEE Symposium on 3D User Interfaces, Reno, NV, USA, 8–9 March 2008; pp. 35–38. [CrossRef]
- Hoang, T.N.; Smith, R.T.; Thomas, B.H. Passive Deformable Haptic Glove to Support 3D Interactions in Mobile Augmented Reality Environments. In Proceedings of the 2013 IEEE International Symposium on Mixed and Augmented Reality (ISMAR), Adelaide, Australia, 1–4 October 2013; pp. 257–258. [Google Scholar] [CrossRef]
- Nguyen, V.; Kumar, P.; Yoon, S.H.; Verma, A.; Ramani, K. SOFTii: Soft Tangible Interface for Continuous Control of Virtual Objects with Pressure-Based Input. In Proceedings of the Ninth International Conference on Tangible, Embedded, and Embodied Interaction, Stanford, CA, USA, 16–19 January 2015; pp. 539–544. [Google Scholar] [CrossRef]
- Nakamaru, S.; Nakayama, R.; Niiyama, R.; Kakehi, Y. FoamSense: Design of Three Dimensional Soft Sensors with Porous Materials. In Proceedings of the 30th Annual ACM Symposium on User Interface Software and Technology, Quebec City, QC, Canada, 22–25 October 2017; pp. 437–447. [Google Scholar] [CrossRef]
- Sugiura, Y.; Kakehi, G.; Withana, A.; Lee, C.; Sakamoto, D.; Sugimoto, M.; Inami, M.; Igarashi, T. Detecting Shape Deformation of Soft Objects Using Directional Photoreflectivity Measurement. In Proceedings of the 24th Annual ACM Symposium on User Interface Software and Technology, Santa Barbara, CA, USA, 16–19 October 2011; pp. 509–516. [Google Scholar] [CrossRef]
- Weigel, M.; Steimle, J. DeformWear: Deformation Input on Tiny Wearable Devices. Proc. ACM Interact. Mob. Wearable Ubiquitous Technol. 2017, 1, 1–23. [Google Scholar] [CrossRef]
- Beven, T.; Hoang, T.; Carter, M.; Ploderer, B. HandLog: A Deformable Tangible Device for Continuous Input through Finger Flexion. In Proceedings of the 28th Australian Conference on Computer-Human Interaction, Launceston, Australia, 29 November–2 December 2016; pp. 595–604. [Google Scholar] [CrossRef]
- Vandenberghe, B.; Meijvis, J.; Sodermans, T.; Gerling, K.; Vanden Abeele, V.; Geurts, L. Sailing Skweezee: An Exploration of Squeeze Interaction in VR. In Proceedings of the Extended Abstracts of the Annual Symposium on Computer-Human Interaction in Play Companion Extended Abstracts, Barcelona, Spain, 22–25 October 2019; pp. 131–138. [Google Scholar] [CrossRef]
- Lee, H.; Yoong, A.C.H.; Lui, S.; Vaniyar, A.; Balasubramanian, G. Design Exploration for the “Squeezable” Interaction. In Proceedings of the 28th Australian Conference on Computer-Human Interaction, Launceston, Australia, 29 November–2 December 2016; pp. 586–594. [Google Scholar] [CrossRef]
- Speer, S.; Hamner, E.; Tasota, M.; Zito, L.; Byrne-Houser, S.K. MindfulNest: Strengthening Emotion Regulation with Tangible User Interfaces. In Proceedings of the 2021 International Conference on Multimodal Interaction, Montreal, QC, Canada, 18–22 October 2021; pp. 103–111. [Google Scholar] [CrossRef]
- Isbister, K.; Cottrell, P.; Cecchet, A.; Dagan, E.; Theofanopoulou, N.; Bertran, F.A.; Horowitz, A.J.; Mead, N.; Schwartz, J.B.; Slovak, P. Design (Not) Lost in Translation: A Case Study of an Intimate-Space Socially Assistive “Robot” for Emotion Regulation. ACM Trans. Comput. Hum. Interact. 2022, 29, 32. [Google Scholar] [CrossRef]
- Henkel, K.; Henkel, Z.; Aldridge, A.; Bethel, C.L. The Evolving Design of a Socially Therapeutic Robotic Dog. In Proceedings of the 2023 World Symposium on Digital Intelligence for Systems and Machines (DISA), Košice, Slovakia, 21–22 September 2023; pp. 90–97. [Google Scholar] [CrossRef]
- Kim, B.; Kwak, Y.; Kim, D.; Kwon, Y.; Lee, H.S. Development of a Robot-assisted Online Pain Communication System using a Squeezable Tangible User Interface. In Proceedings of the 2022 31st IEEE International Conference on Robot and Human Interactive Communication (RO-MAN), Napoli, Italy, 29 August–2 September 2022; pp. 185–191. [Google Scholar] [CrossRef]
- Cang, X.L.; Israr, A.; MacLean, K.E. When is a Haptic Message Like an Inside Joke? Digitally Mediated Emotive Communication Builds on Shared History. IEEE Trans. Affect. Comput. 2023, 14, 732–746. [Google Scholar] [CrossRef]
- Ueki, A.; Kamata, M.; Inakage, M. Tabby: Designing of Coexisting Entertainment Content in Everyday Life by Expanding the Design of Furniture. In Proceedings of the International Conference on Advances in Computer Entertainment Technology, Salzburg, Austria, 13–15 June 2007; pp. 72–78. [Google Scholar] [CrossRef]
- Kadowaki, A.; Yoshikai, T.; Hayashi, M.; Inaba, M. Development of Soft Sensor Exterior Embedded with Multi-Axis Deformable Tactile Sensor System. In Proceedings of the RO-MAN 2009-The 18th IEEE International Symposium on Robot and Human Interactive Communication, Toyama, Japan, 27 September–2 October 2009; pp. 1093–1098. [Google Scholar] [CrossRef]
- Pakanen, M.; Colley, A.; Häkkilä, J.; Kildal, J.; Lantz, V. Squeezy Bracelet: Designing a Wearable Communication Device for Tactile Interaction. In Proceedings of the 8th Nordic Conference on Human–Computer Interaction: Fun, Fast, Foundational, Helsinki, Finland, 26–30 October 2014; pp. 305–314. [Google Scholar] [CrossRef]
- He, L.; Laput, G.; Brockmeyer, E.; Froehlich, J.E. SqueezaPulse: Adding Interactive Input to Fabricated Objects Using Corrugated Tubes and Air Pulses. In Proceedings of the Eleventh International Conference on Tangible, Embedded, and Embodied Interaction, Yokohama, Japan, 20–23 March 2017; pp. 341–350. [Google Scholar] [CrossRef]
- Schiphorst, T. Soft(n): Toward a Somaesthetics of Touch. In CHI ’09 Extended Abstracts on Human Factors in Computing Systems; Association for Computing Machinery: New York, NY, USA, 2009; pp. 2427–2438. [Google Scholar] [CrossRef]
- Lazaro Vasquez, E.S.; Ofer, N.; Wu, S.; West, M.E.; Alistar, M.; Devendorf, L. Exploring Biofoam as a Material for Tangible Interaction. In Proceedings of the 2022 ACM Designing Interactive Systems Conference, Virtual Event, Australia, 13–17 June 2022; pp. 1525–1539. [Google Scholar] [CrossRef]
- Fan, Y.; Pietroni, N.; Ferguson, S. A Neural Network-Based Low-Cost Soft Sensor for Touch Recognition and Deformation Capture. In Proceedings of the 2023 ACM Designing Interactive Systems Conference, Pittsburgh, PA, USA, 13–17 June 2023; pp. 889–903. [Google Scholar] [CrossRef]
- Honnet, C.; Perner-Wilson, H.; Teyssier, M.; Fruchard, B.; Steimle, J.; Baptista, A.C.; Strohmeier, P. PolySense: Augmenting Textiles with Electrical Functionality Using In-Situ Polymerization. In Proceedings of the 2020 CHI Conference on Human Factors in Computing Systems, Honolulu, HI, USA, 25–30 April 2020; pp. 1–13. [Google Scholar] [CrossRef]
- Sakura, R.; Han, C.; Watanabe, K.; Yamamura, R.; Kakehi, Y. Design of 3D-Printed Soft Sensors for Wire Management and Customized Softness. In Proceedings of the CHI Conference on Human Factors in Computing Systems Extended Abstracts, New Orleans, LA, USA, 29 April–5 May 2022; pp. 1–5. [Google Scholar] [CrossRef]
- Troiano, G.M.; Pedersen, E.W.; Hornbæk, K. Deformable Interfaces for Performing Music. In Proceedings of the 33rd Annual ACM Conference on Human Factors in Computing Systems, Seoul, Republic of Korea, 18–23 April 2015; pp. 377–386. [Google Scholar] [CrossRef]
- Fruchard, B.; Strohmeier, P.; Bennewitz, R.; Steimle, J. Squish this: Force Input on Soft Surfaces for Visual Targeting Tasks. In Proceedings of the 2021 CHI Conference on Human Factors in Computing Systems, Yokohama, Japan, 8–13 May 2021; pp. 1–9. [Google Scholar] [CrossRef]
- Schmitz, M.; Günther, S.; Schön, D.; Müller, F. Squeezy-Feely: Investigating Lateral Thumb-Index Pinching as an Input Modality. In Proceedings of the 2022 CHI Conference on Human Factors in Computing Systems, New Orleans, LA, USA, 29 April–5 May 2022; pp. 1–15. [Google Scholar] [CrossRef]
- Yin, Z.; Liyanage, M.; Ottun, A.R.; Paul, S.; Zuniga, A.; Nurmi, P.; Flores, H. HIPPO: Pervasive Hand-Grip Estimation from Everyday Interactions. Proc. ACM Interact. Mob. Wearable Ubiquitous Technol. 2023, 6, 209. [Google Scholar] [CrossRef]
- Van Cauwenberghe, N. Research and Design of Electrically Conductive Foam for Squeezable Objects in a Therapeutic Context. Master’s Thesis, Ghent University, Ghent, Belgium, 2020. [Google Scholar]
- Vanderloock, K.; Vanden Abeele, V.; Suykens, J.A.; Geurts, L. The Skweezee System: Enabling the Design and the Programming of Squeeze Interactions. In Proceedings of the 26th Annual ACM Symposium on User Interface Software and Technology, St. Andrews Scotland, UK, 8–11 October 2013; pp. 521–530. [Google Scholar] [CrossRef]
- Moraiti, A.; Vanden Abeele, V.; Vanroye, E.; Geurts, L. Empowering Occupational Therapists with a DIY-Toolkit for Smart Soft Objects. In Proceedings of the Ninth International Conference on Tangible, Embedded, and Embodied Interaction, Stanford, CA, USA, 15–19 January 2015; pp. 387–394. [Google Scholar] [CrossRef]
- Wang, H.; Bernardeschi, I.; Beccai, L. Developing Reliable Foam Sensors with Novel Electrodes. In Proceedings of the 2019 IEEE SENSORS, Montreal, QC, Canada, 27–30 October 2019; pp. 1–4. [Google Scholar] [CrossRef]
- Choong, C.L.; Shim, M.B.; Lee, B.S.; Jeon, S.; Ko, D.S.; Kang, T.H.; Bae, J.; Lee, S.H.; Byun, K.E.; Im, J.; et al. Highly Stretchable Resistive Pressure Sensors Using a Conductive Elastomeric Composite on a Micropyramid Array. Adv. Mater. 2014, 26, 3451–3458. [Google Scholar] [CrossRef]
- Zang, Y.; Zhang, F.; Di, C.a.; Zhu, D. Advances of Flexible Pressure Sensors Toward Artificial Intelligence and Health Care Applications. Mater. Horizons 2015, 2, 140–156. [Google Scholar] [CrossRef]
- Pang, C.; Lee, G.Y.; Kim, T.i.; Kim, S.M.; Kim, H.N.; Ahn, S.H.; Suh, K.Y. A Flexible and Highly Sensitive Strain-Gauge Sensor Using Reversible Interlocking of Nanofibres. Nat. Mater. 2012, 11, 795–801. [Google Scholar] [CrossRef]
- Pan, L.; Chortos, A.; Yu, G.; Wang, Y.; Isaacson, S.; Allen, R.; Shi, Y.; Dauskardt, R.; Bao, Z. An Ultra-Sensitive Resistive Pressure Sensor Based on Hollow-Sphere Microstructure Induced Elasticity in Conducting Polymer Film. Nat. Commun. 2014, 5, 3002. [Google Scholar] [CrossRef]
- Slyper, R.; Hodgins, J. Prototyping Robot Appearance, Movement, and Interactions Using Flexible 3D Printing and Air Pressure Sensors. In Proceedings of the 2012 IEEE RO-MAN: The 21st IEEE International Symposium on Robot and Human Interactive Communication, Paris, France, 9–13 September 2012; pp. 6–11. [Google Scholar] [CrossRef]
- Vázquez, M.; Brockmeyer, E.; Desai, R.; Harrison, C.; Hudson, S.E. 3D Printing Pneumatic Device Controls with Variable Activation Force Capabilities. In Proceedings of the Proceedings of the 33rd Annual ACM Conference on Human Factors in Computing Systems, 18–23 April 2015; Seoul, Republic of Korea; pp. 1295–1304. [Google Scholar] [CrossRef]
- Watanabe, K.; Yamamura, R.; Kakehi, Y. Foamin: A Deformable Sensor for Multimodal Inputs Based on Conductive Foam with a Single Wire. In Proceedings of the Extended Abstracts of the 2021 CHI Conference on Human Factors in Computing Systems, Yokohama, Japan, 8–13 May 2021. [Google Scholar] [CrossRef]
- Albaugh, L.; McCann, J.; Hudson, S.E.; Yao, L. Engineering Multifunctional Spacer Fabrics Through Machine Knitting. In Proceedings of the the 2021 CHI Conference on Human Factors in Computing Systems, Yokohama, Japan, 8–13 May 2021; pp. 1–12. [Google Scholar] [CrossRef]
- Aigner, R.; Haberfellner, M.A.; Haller, M. spaceR: Knitting Ready-Made, Tactile, and Highly Responsive Spacer-Fabric Force Sensors for Continuous Input. In Proceedings of the 35th Annual ACM Symposium on User Interface Software and Technology, Bend, OR, USA, 29 October–2 November 2022; pp. 1–15. [Google Scholar] [CrossRef]
- Aigner, R.; Pointner, A.; Preindl, T.; Parzer, P.; Haller, M. Embroidered Resistive Pressure Sensors: A Novel Approach for Textile Interfaces. In Proceedings of the 2020 CHI Conference on Human Factors in Computing Systems, Honolulu, HI, USA, 25–30 April 2020; pp. 1–13. [Google Scholar] [CrossRef]
- Han, J.W.; Kim, B.; Li, J.; Meyyappan, M. Flexible, Compressible, Hydrophobic, Floatable, and Conductive Carbon Nanotube-Polymer Sponge. Appl. Phys. Lett. 2013, 102, 051903. [Google Scholar] [CrossRef]
- Li, J.; Fang, L.; Sun, B.; Li, X.; Kang, S.H. Recent Progress in Flexible and Stretchable Piezoresistive Sensors and Their Applications. J. Electrochem. Soc. 2020, 167, 037561. [Google Scholar] [CrossRef]
- Totaro, M.; Bernardeschi, I.; Wang, H.; Beccai, L. Analysis and Optimization of Fully Foam-Based Capacitive Sensors. In Proceedings of the 2020 3rd IEEE International Conference on Soft Robotics (RoboSoft), New Haven, CT, USA, 15 May–15 July 2020; pp. 470–475. [Google Scholar] [CrossRef]
- Timsit, S. Electrical Contact Resistance: Properties of Stationary Interfaces. IEEE Trans. Compon. Packag. Technol. 1999, 22, 85–98. [Google Scholar] [CrossRef]
- Huang, W.; Dai, K.; Zhai, Y.; Liu, H.; Zhan, P.; Gao, J.; Zheng, G.; Liu, C.; Shen, C. Flexible and Lightweight Pressure Sensor Based on Carbon Nanotube/Thermoplastic Polyurethane-Aligned Conductive Foam with Superior Compressibility and Stability. ACS Appl. Mater. Interfaces 2017, 9, 42266–42277. [Google Scholar] [CrossRef]
- Tolvanen, J.; Hannu, J.; Jantunen, H. Hybrid Foam Pressure Sensor Utilizing Piezoresistive and Capacitive Sensing Mechanisms. IEEE Sens. J. 2017, 17, 4735–4746. [Google Scholar] [CrossRef]
- Koelle, M.; Nicolae, M.; Nittala, A.S.; Teyssier, M.; Steimle, J. Prototyping Soft Devices with Interactive Bioplastics. In Proceedings of the 35th Annual ACM Symposium on User Interface Software and Technology, Bend, OR, USA, 29 October–2 November 2022; pp. 1–16. [Google Scholar] [CrossRef]
- Zhong, W.; Ding, X.; Li, W.; Shen, C.; Yadav, A.; Chen, Y.; Bao, M.; Jiang, H.; Wang, D. Facile Fabrication of Conductive Graphene/Polyurethane Foam Composite and Its Application on Flexible Piezo-Resistive Sensors. Polymers 2019, 11, 1289. [Google Scholar] [CrossRef]
- Langlois, K.; Roels, E.; Van De Velde, G.; Espadinha, C.; Van Vlerken, C.; Verstraten, T.; Vanderborght, B.; Lefeber, D. Integration of 3D Printed Flexible Pressure Sensors into Physical Interfaces for Wearable Robots. Sensors 2021, 21, 2157. [Google Scholar] [CrossRef]
- Brady, S.; Diamond, D.; Lau, K.T. Inherently Conducting Polymer Modified Polyurethane Smart Foam for Pressure Sensing. Sens. Actuators A Phys. 2005, 119, 398–404. [Google Scholar] [CrossRef]
- Ding, Y.; Xu, T.; Onyilagha, O.; Fong, H.; Zhu, Z. Recent Advances in Flexible and Wearable Pressure Sensors Based on Piezoresistive 3D Monolithic Conductive Sponges. ACS Appl. Mater. Interfaces 2019, 11, 6685–6704. [Google Scholar] [CrossRef]
- Ozen, N.; Berse, S.; Tosun, B. Effects of Using a Stress Ball on Anxiety and Depression in Patients Undergoing Hemodialysis: A Prospective, Balanced, Single-blind, Crossover study. Hemodial. Int. 2023, 27, 411–418. [Google Scholar] [CrossRef]
- Kasar, K.S.; Erzincanli, S.; Akbas, N.T. The Effect of a Stress Ball on Stress, Vital Signs and Patient Comfort in Hemodialysis Patients: A Randomized Controlled Trial. Complement. Ther. Clin. Pract. 2020, 41, 101243. [Google Scholar] [CrossRef] [PubMed]
- Cang, X.L.; Bucci, P.; Rantala, J.; Maclean, K. Discerning Affect from Touch and Gaze During Interaction with a Robot Pet. IEEE Trans. Affect. Comput. 2021, 14, 1598–1612. [Google Scholar] [CrossRef]


| Electrode | R (ohm) | CV | CV | (%) | (%) |
|---|---|---|---|---|---|
| a. Copper tape | 18,801 | 0.012 | 0.012 | 4.19 | 3.09 |
| b. Fabric tape | 12,418 | 0.011 | 0.013 | 4.26 | 2.05 |
| c. Thread (insert, 1 piece) | 11,293 | 0.005 | 0.005 | 3.09 | 2.75 |
| d. Thread (insert, 2 pieces) | 11,120 | 0.004 | 0.006 | 3.78 | 2.17 |
| e. Thread (surface, 1 piece) | 27,857 | 0.012 | 0.006 | 3.46 | 3.35 |
| f. Thread (surface, 2 pieces) | 85,735 | 0.017 | 0.007 | 2.76 | 1.82 |
| Electrode | Cost | Sensitivity | Stability | Repeatability | Tactile Sensation | Interaction Type |
|---|---|---|---|---|---|---|
| Copper tape | 0.014 euro/cm | Medium | Medium | Medium | Rigid | One dimensional |
| Fabric tape | 0.016 euro/cm | Medium | Medium | Medium | Stiff fabric | One dimensional |
| Thread—insert | 0.007 euro/cm | Medium | High | Medium-high | Soft | Multi-dimensional |
| Thread—surface | High | Medium | High | Soft | One dimensional |
Disclaimer/Publisher’s Note: The statements, opinions and data contained in all publications are solely those of the individual author(s) and contributor(s) and not of MDPI and/or the editor(s). MDPI and/or the editor(s) disclaim responsibility for any injury to people or property resulting from any ideas, methods, instructions or products referred to in the content. |
© 2024 by the authors. Licensee MDPI, Basel, Switzerland. This article is an open access article distributed under the terms and conditions of the Creative Commons Attribution (CC BY) license (https://creativecommons.org/licenses/by/4.0/).
Share and Cite
Zhou, N.; Devleminck, S.; Geurts, L. Contact Resistance Sensing for Touch and Squeeze Interactions. Multimodal Technol. Interact. 2024, 8, 14. https://doi.org/10.3390/mti8020014
Zhou N, Devleminck S, Geurts L. Contact Resistance Sensing for Touch and Squeeze Interactions. Multimodal Technologies and Interaction. 2024; 8(2):14. https://doi.org/10.3390/mti8020014
Chicago/Turabian StyleZhou, Nianmei, Steven Devleminck, and Luc Geurts. 2024. "Contact Resistance Sensing for Touch and Squeeze Interactions" Multimodal Technologies and Interaction 8, no. 2: 14. https://doi.org/10.3390/mti8020014