


Ranking Crossing Scenario Complexity for eHMIs Testing: A Virtual Reality Study


Abstract
:1. Introduction
1.1. Simulating Complex Traffic Environments
1.2. Aims and Research Contribution
2. Materials and Methods
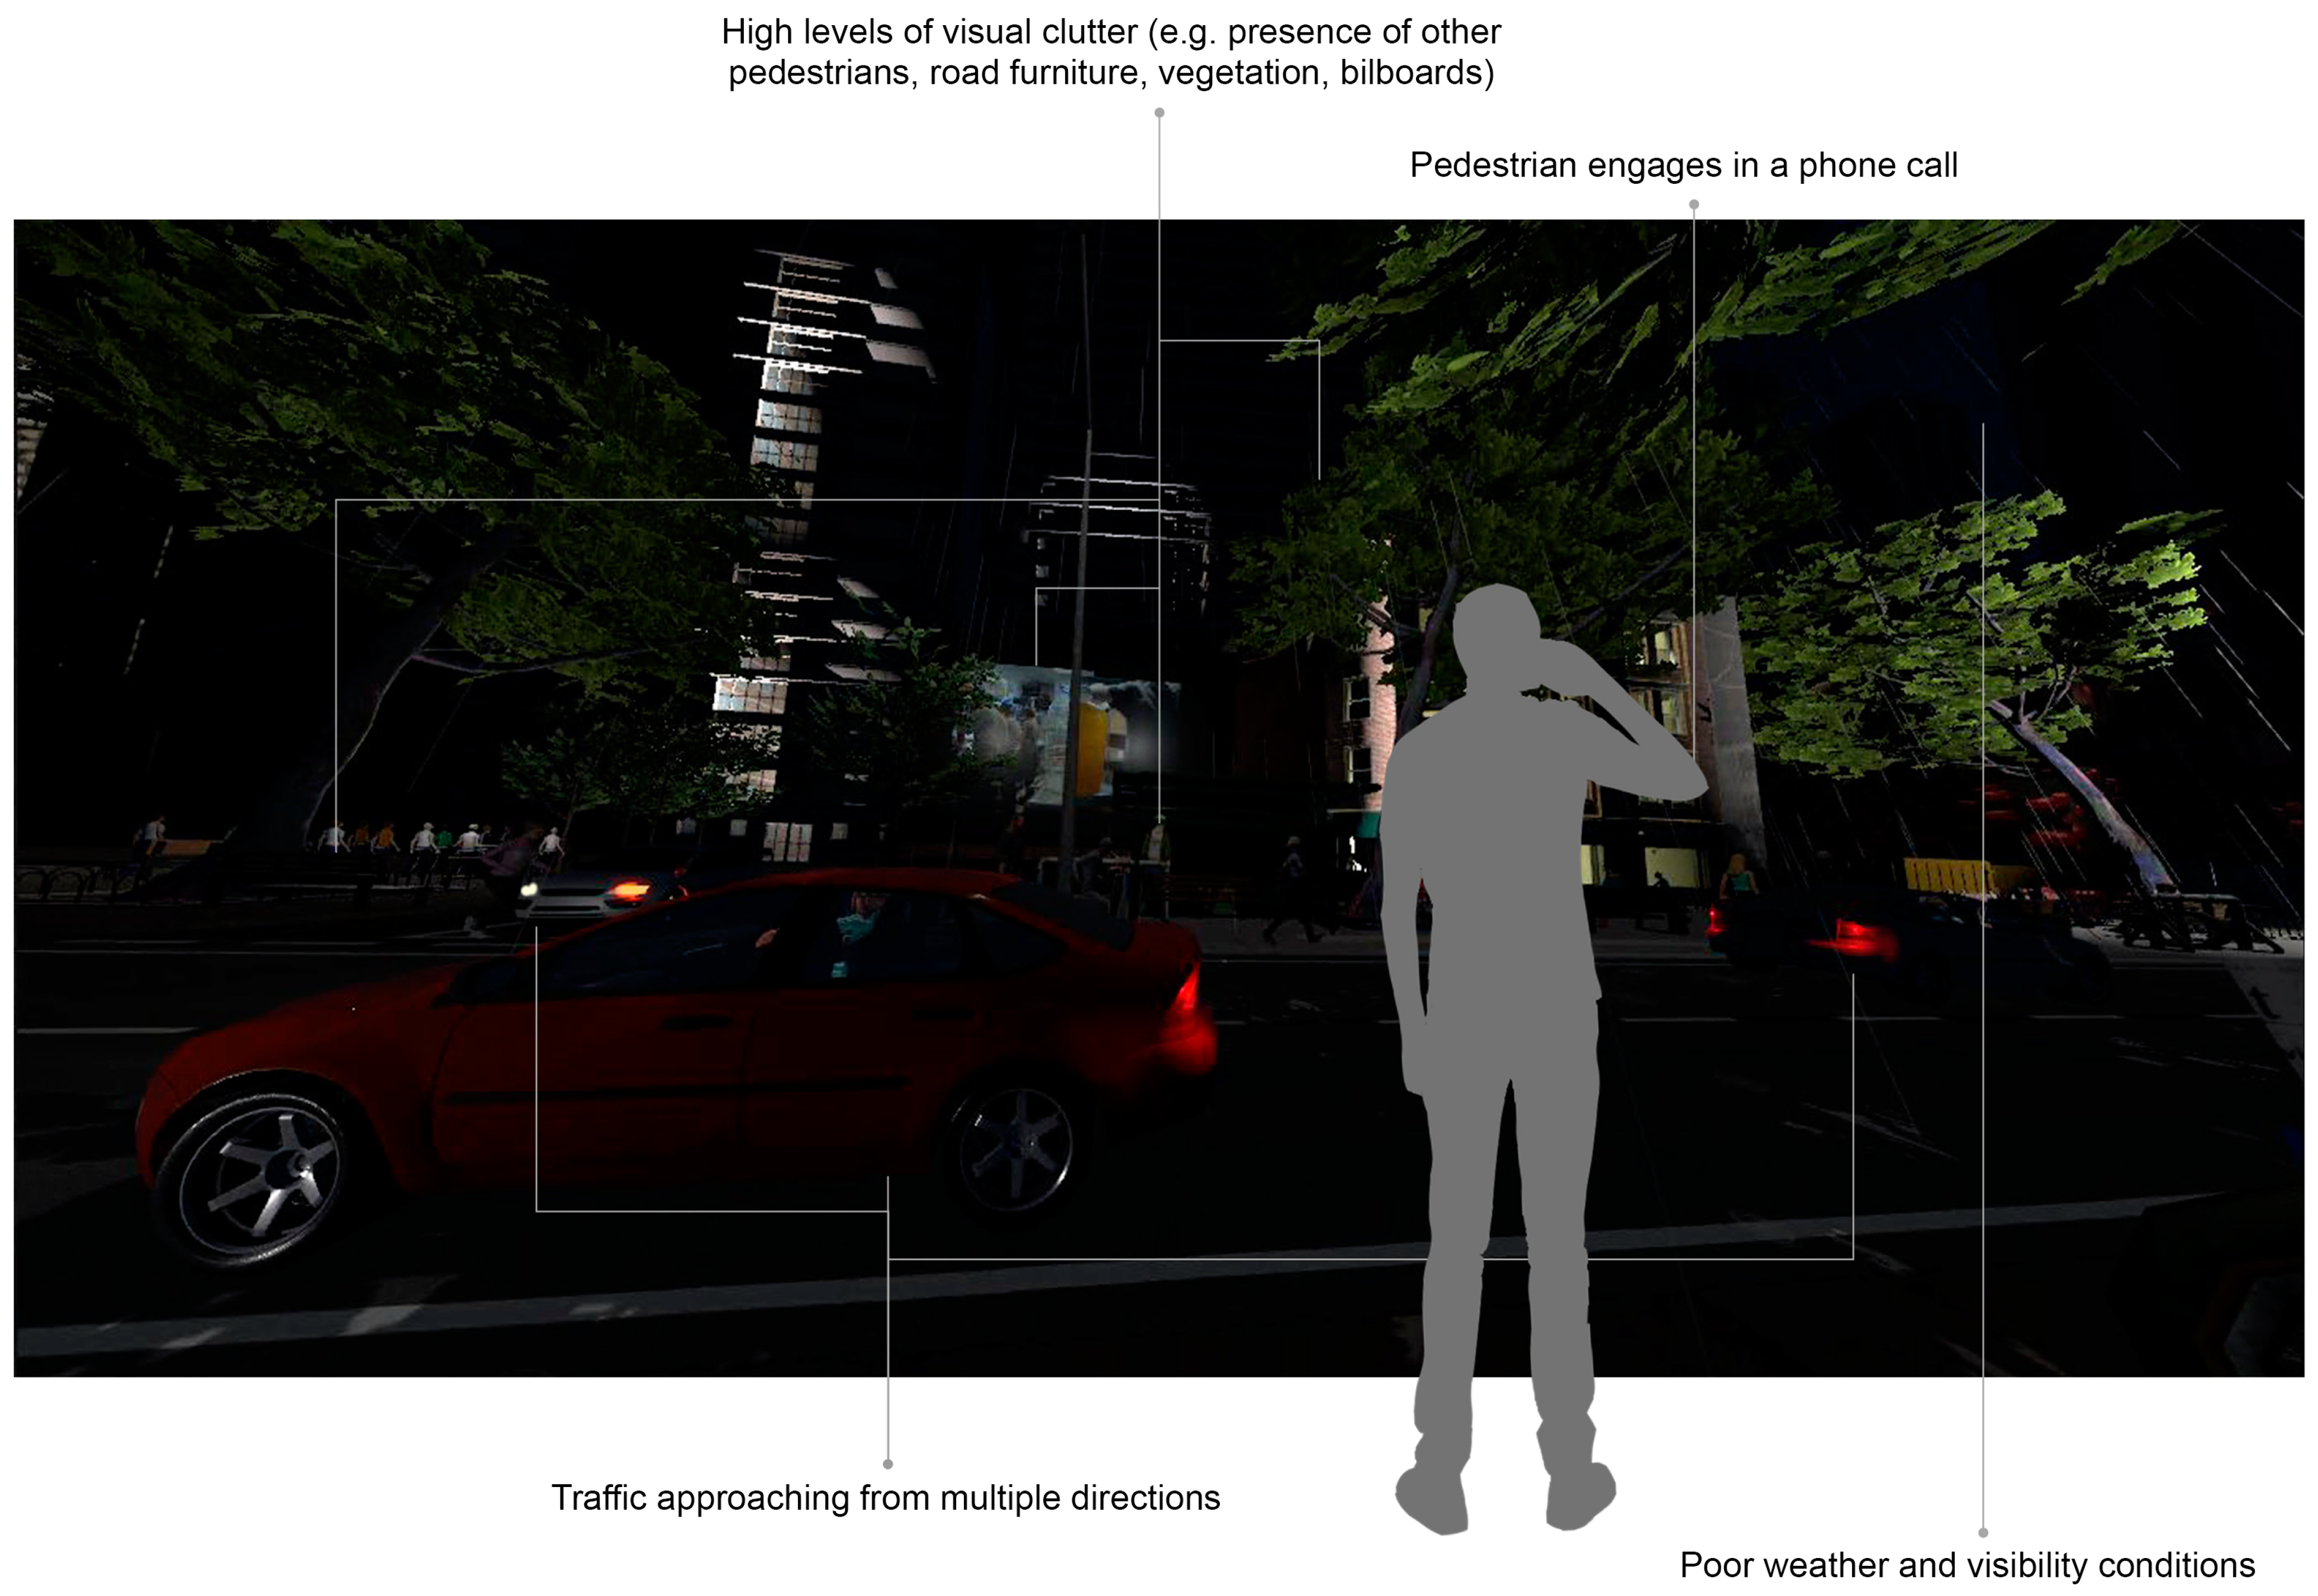
2.1. Study Scenarios Development
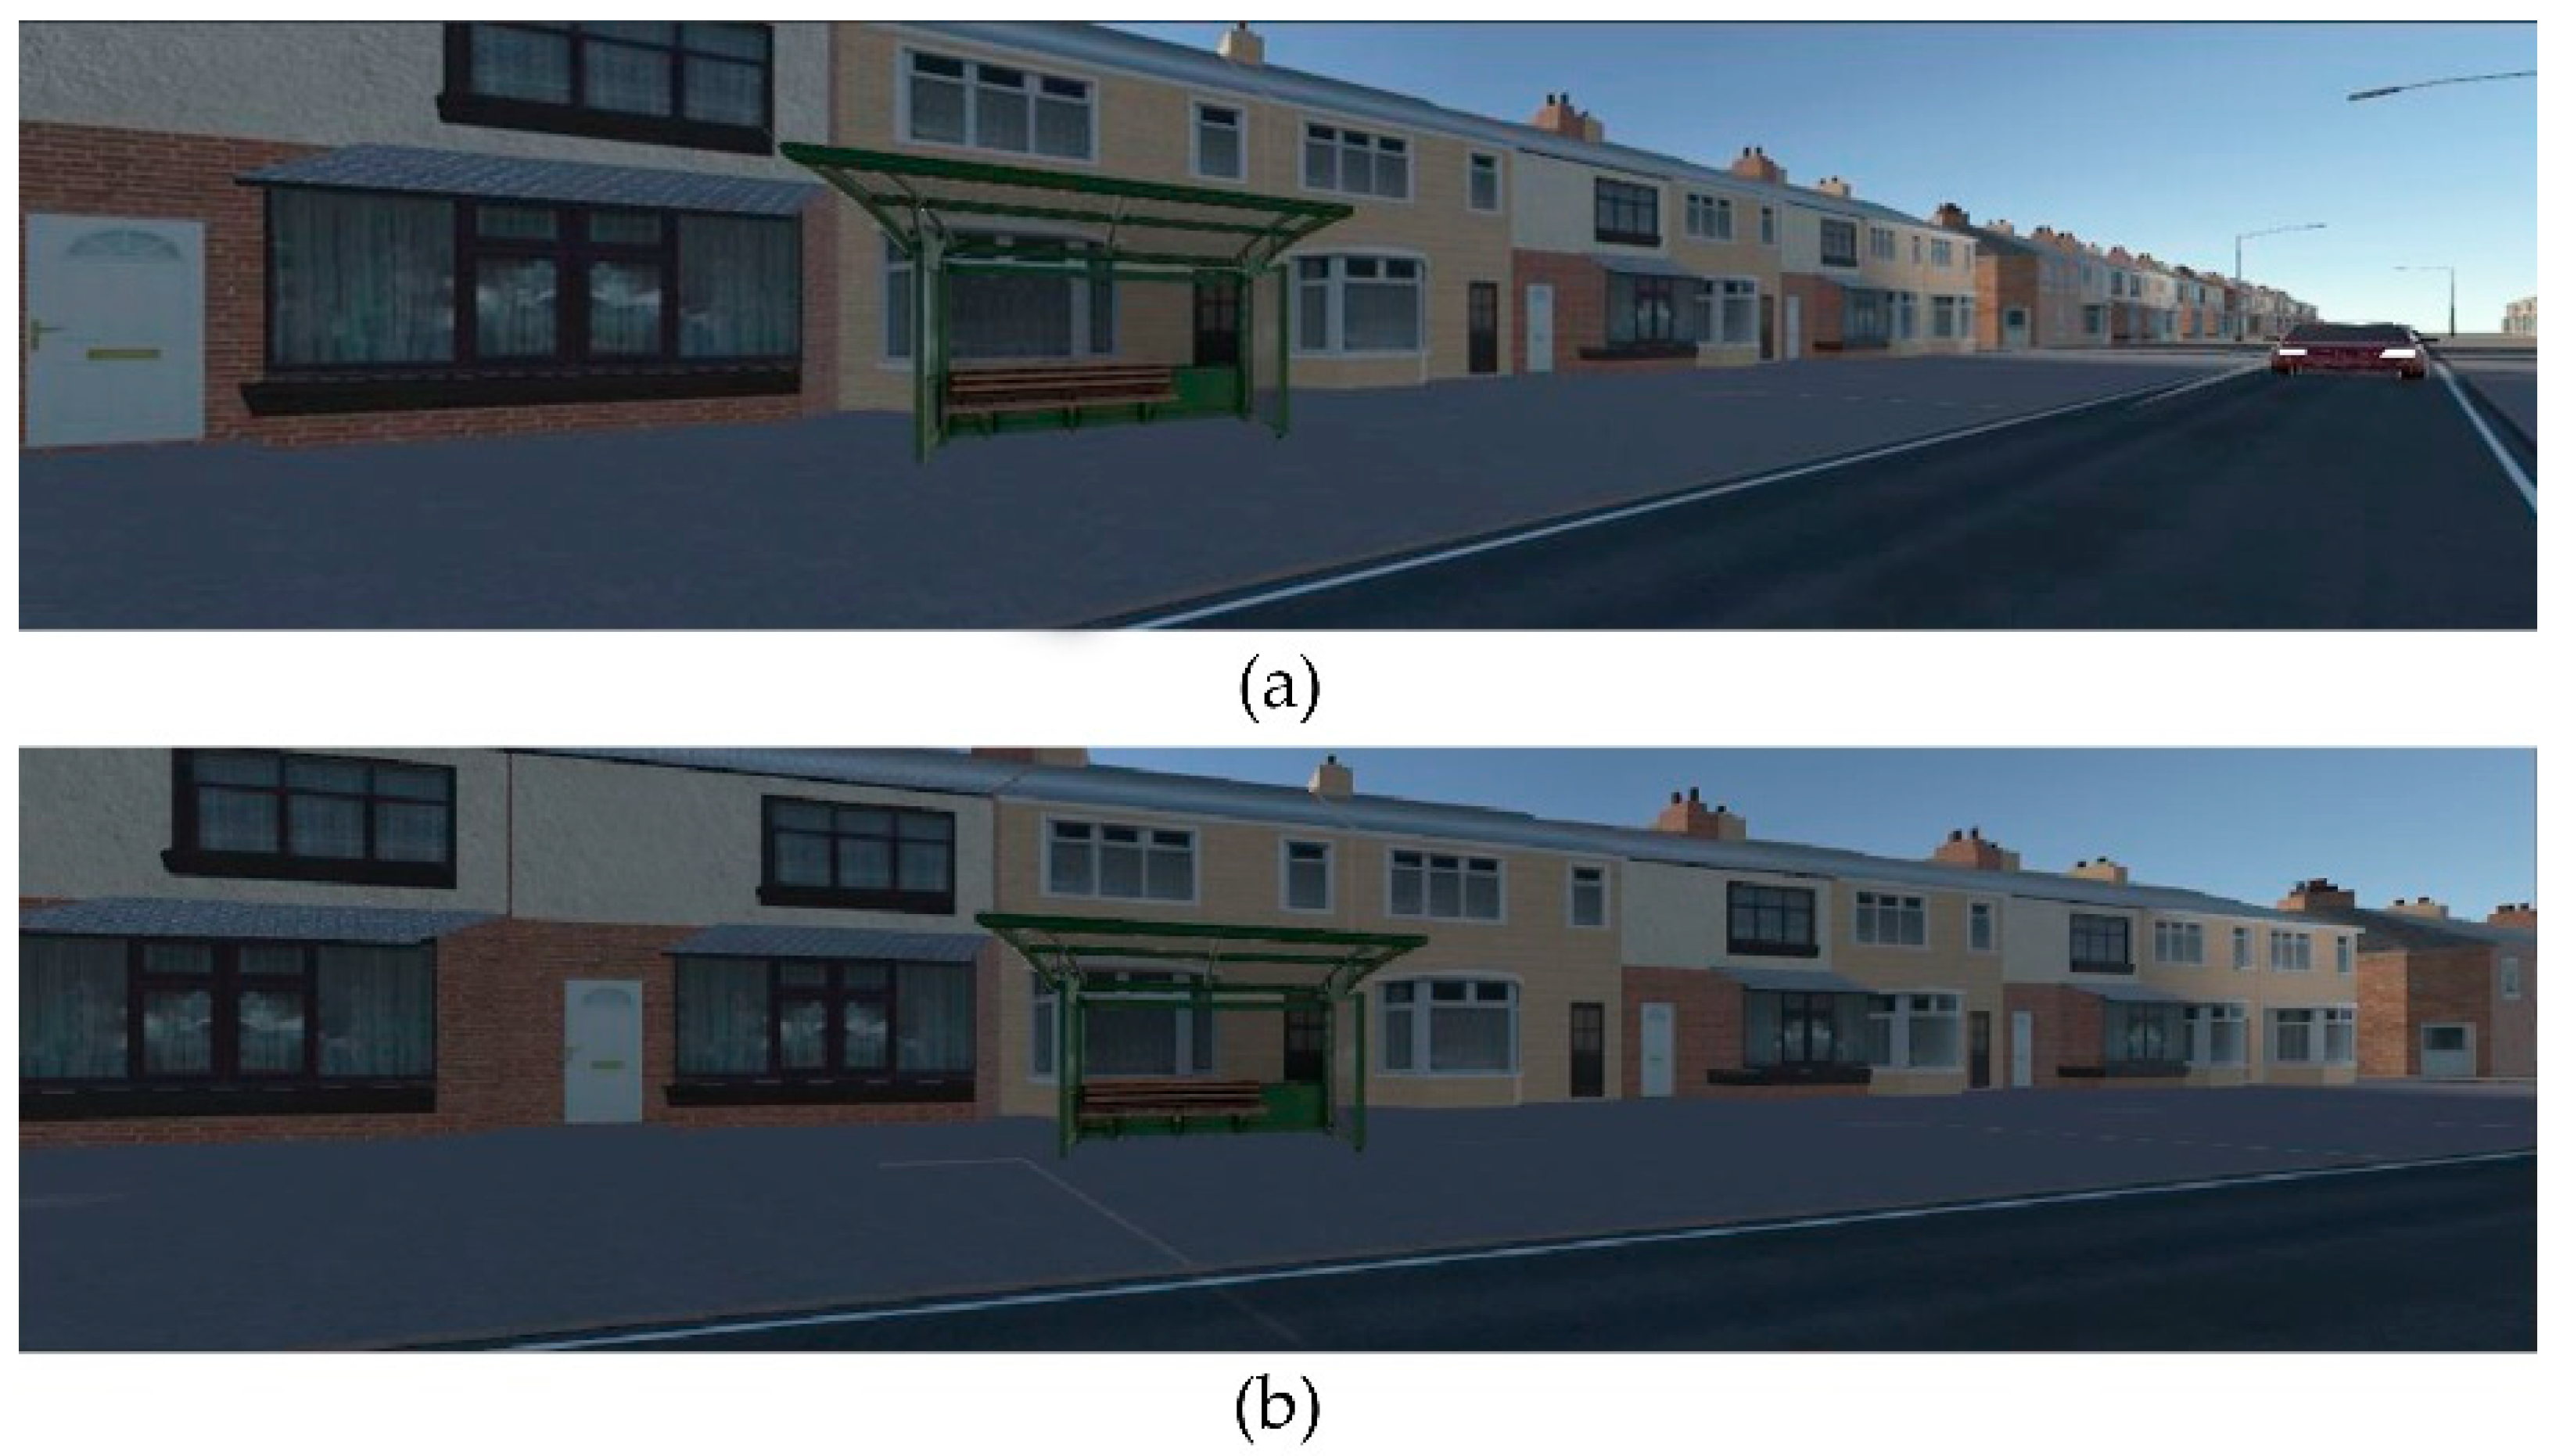
2.1.1. Baseline Conditions
2.1.2. Traffic Density
- For 2–5 s: Starting at smaller gaps increases traffic density. A 5 s gap was included in this condition to give participants an opportunity to cross when they wouldn’t cross with the smaller gap times. This level of traffic density, i.e., gaps between 2 and 5 s, was repeated across all the other conditions, with the exception of the baseline scenarios. The reason for choosing smaller gaps was that these would allow for more efficient traffic flow, which is a desired outcome of AV deployment. If smaller gaps are acceptable across different crossing scenarios, it becomes possible to design gaps which are comfortable enough for pedestrians to cross but whilst also being efficient.
- For 5.5–7 s: A lower density of traffic with more comfortable traffic gaps but which still establishes a condition of traffic conflict requiring individuals to carefully evaluate traffic in order to make safe crossing decisions.
- For 7.5–10 s: Low traffic density where most pedestrians would accept a gap.
2.1.3. Road Geometry
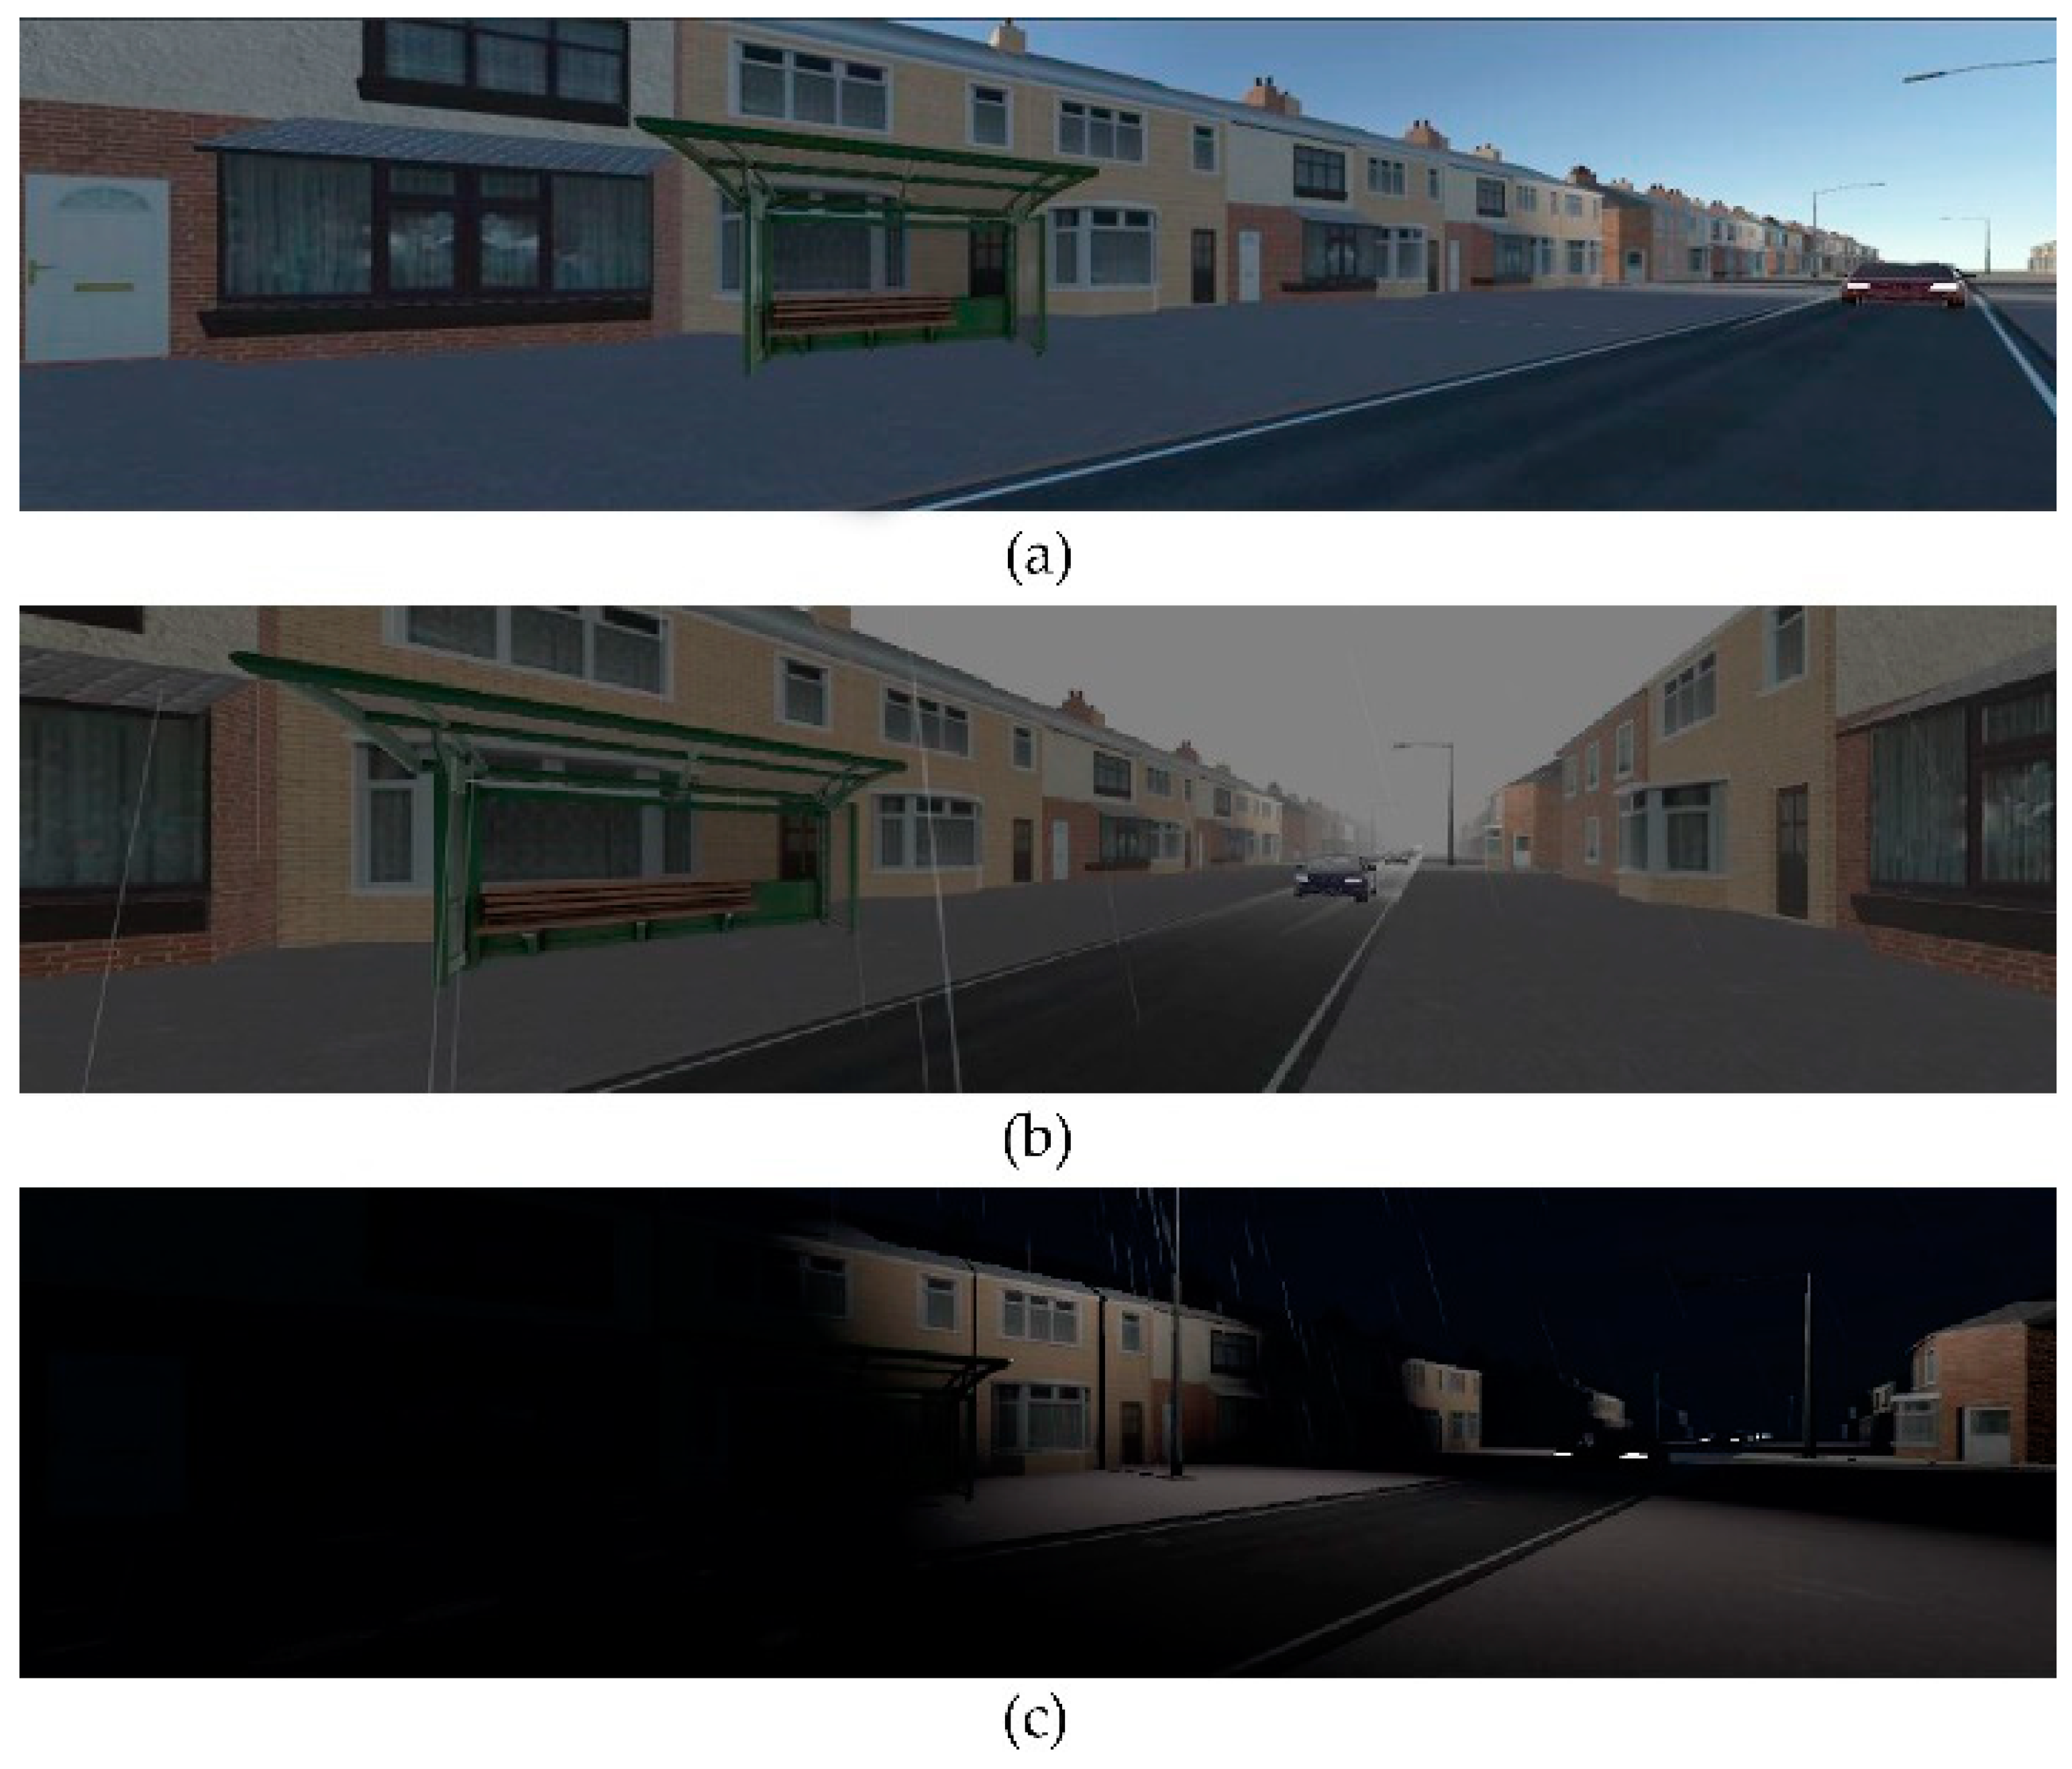
2.1.4. Weather and Visibility
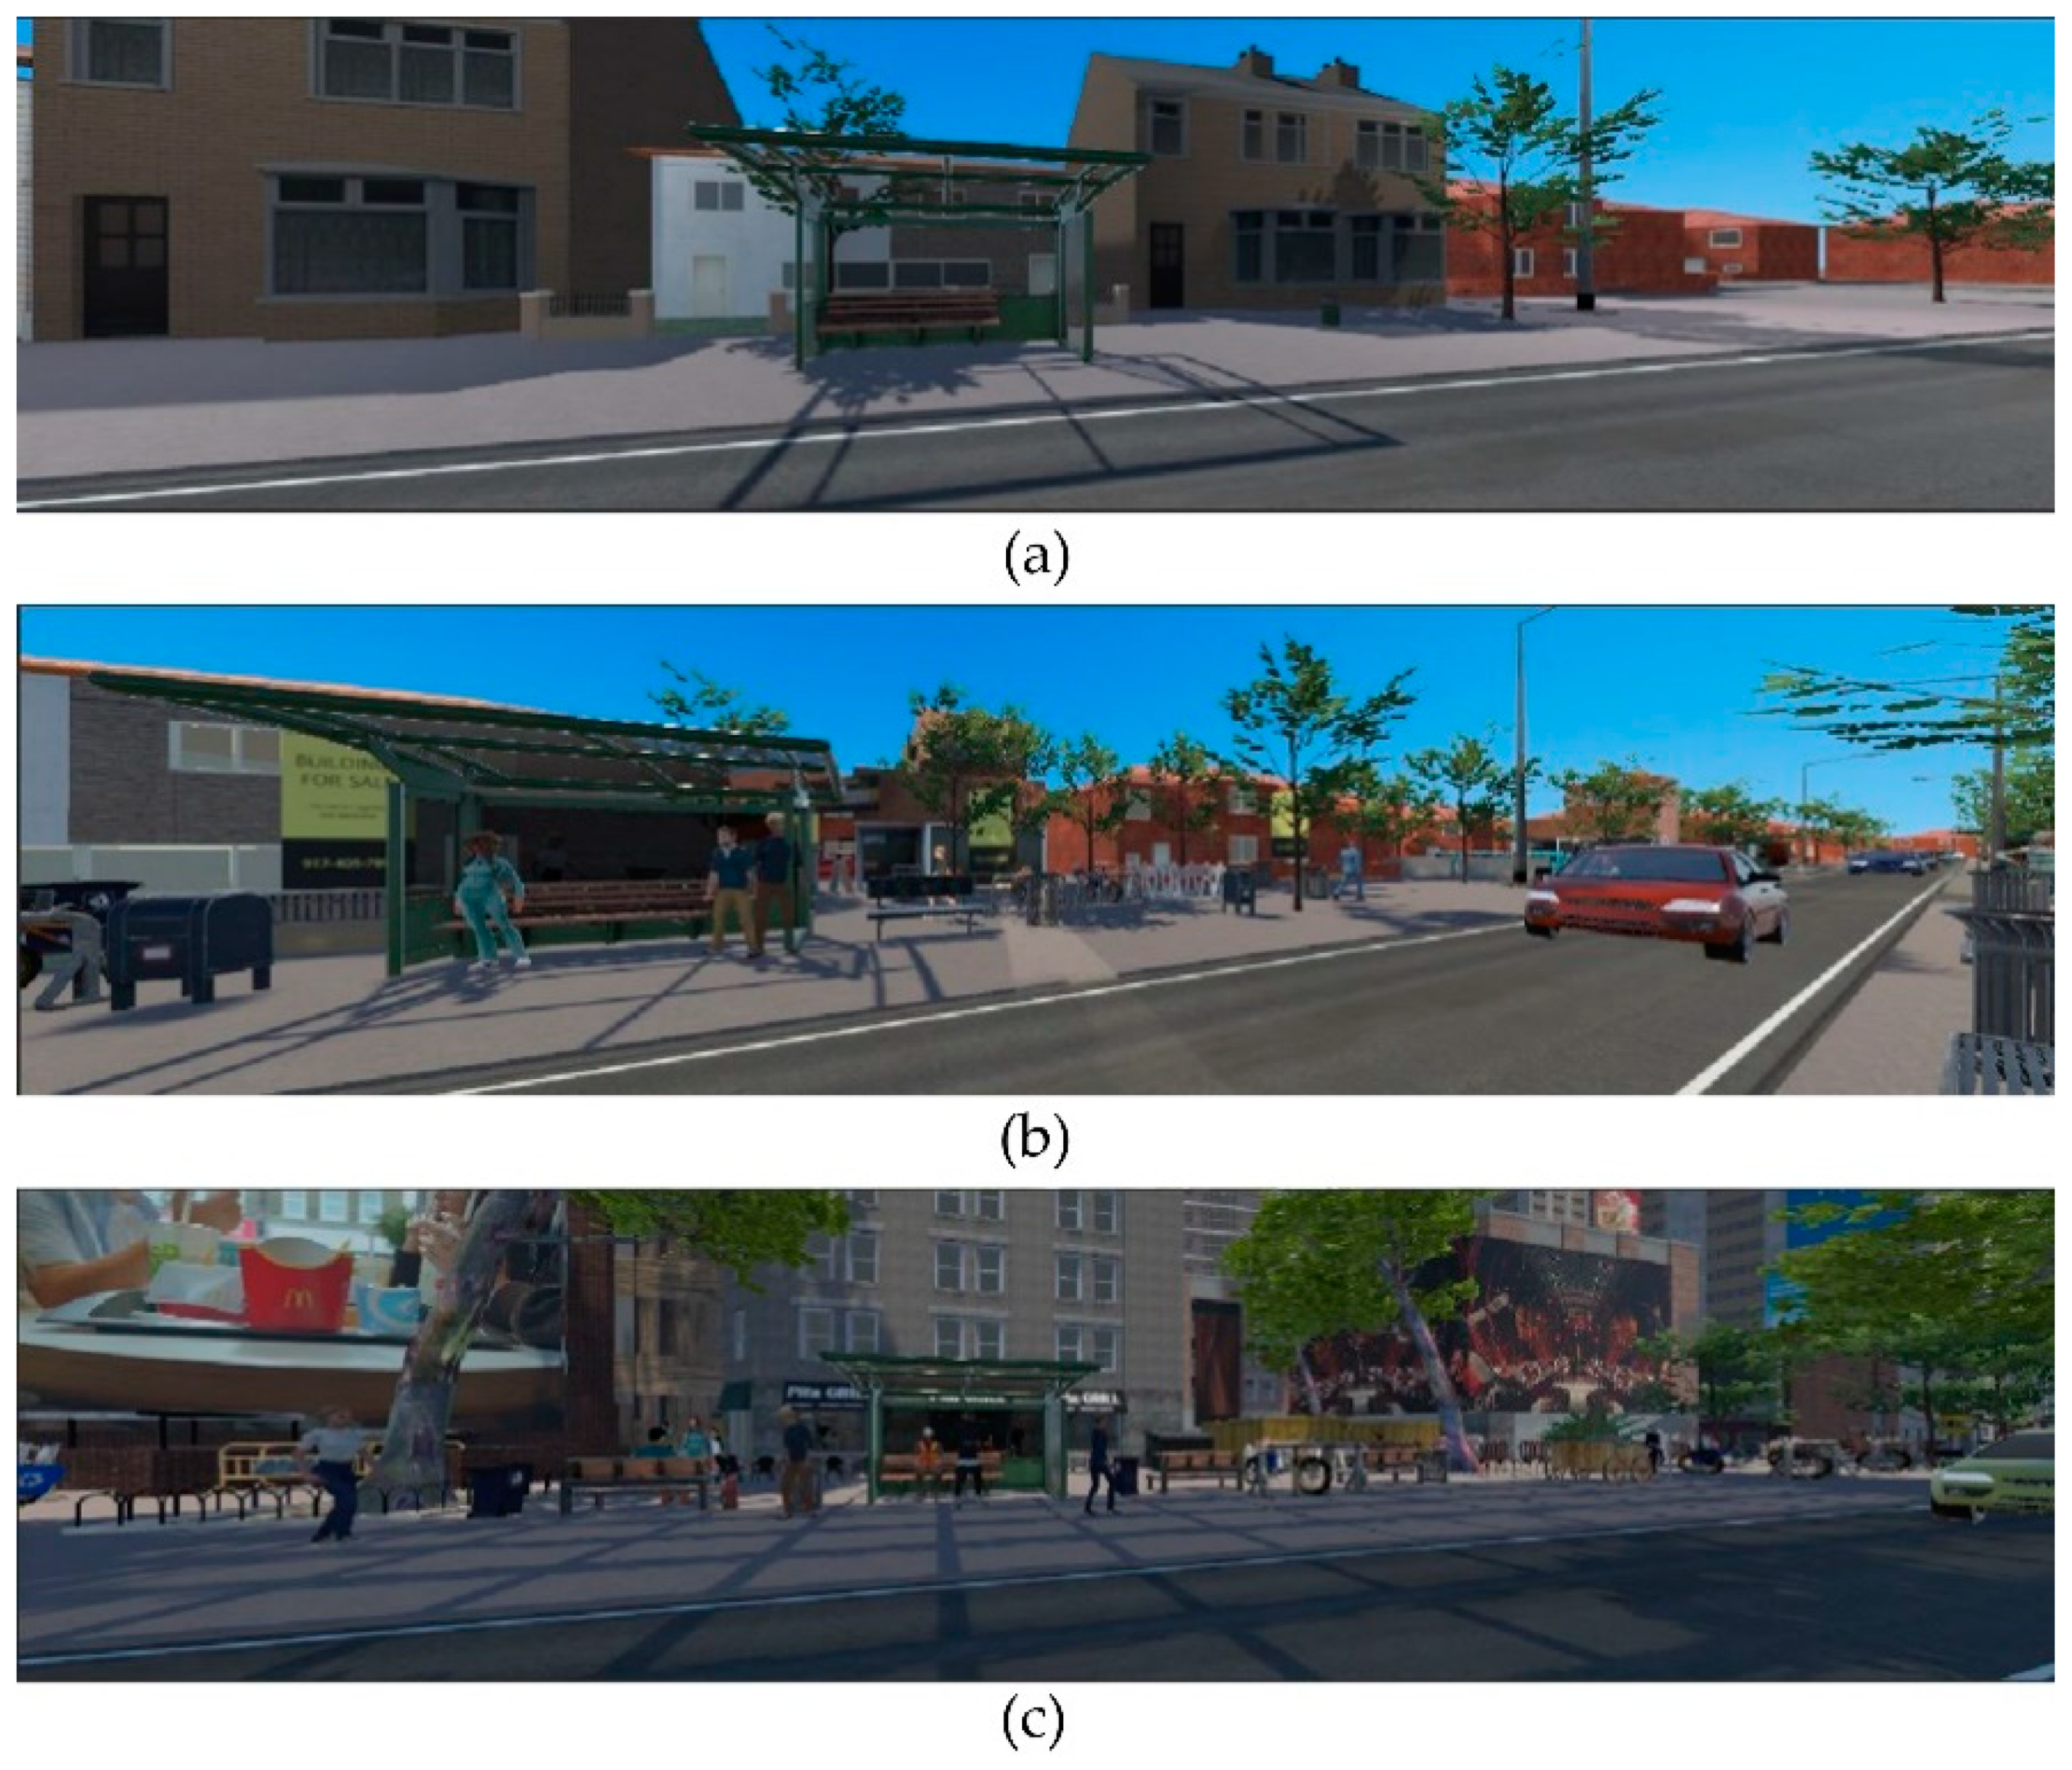
2.1.5. Distractions
2.2. Measures
2.2.1. Simulation Task Load Index
2.2.2. SUS Questionnaire
2.2.3. Crossing Behaviour Measures
2.2.4. Gaze Behaviour
2.2.5. Additional Data Collected
2.3. Participants
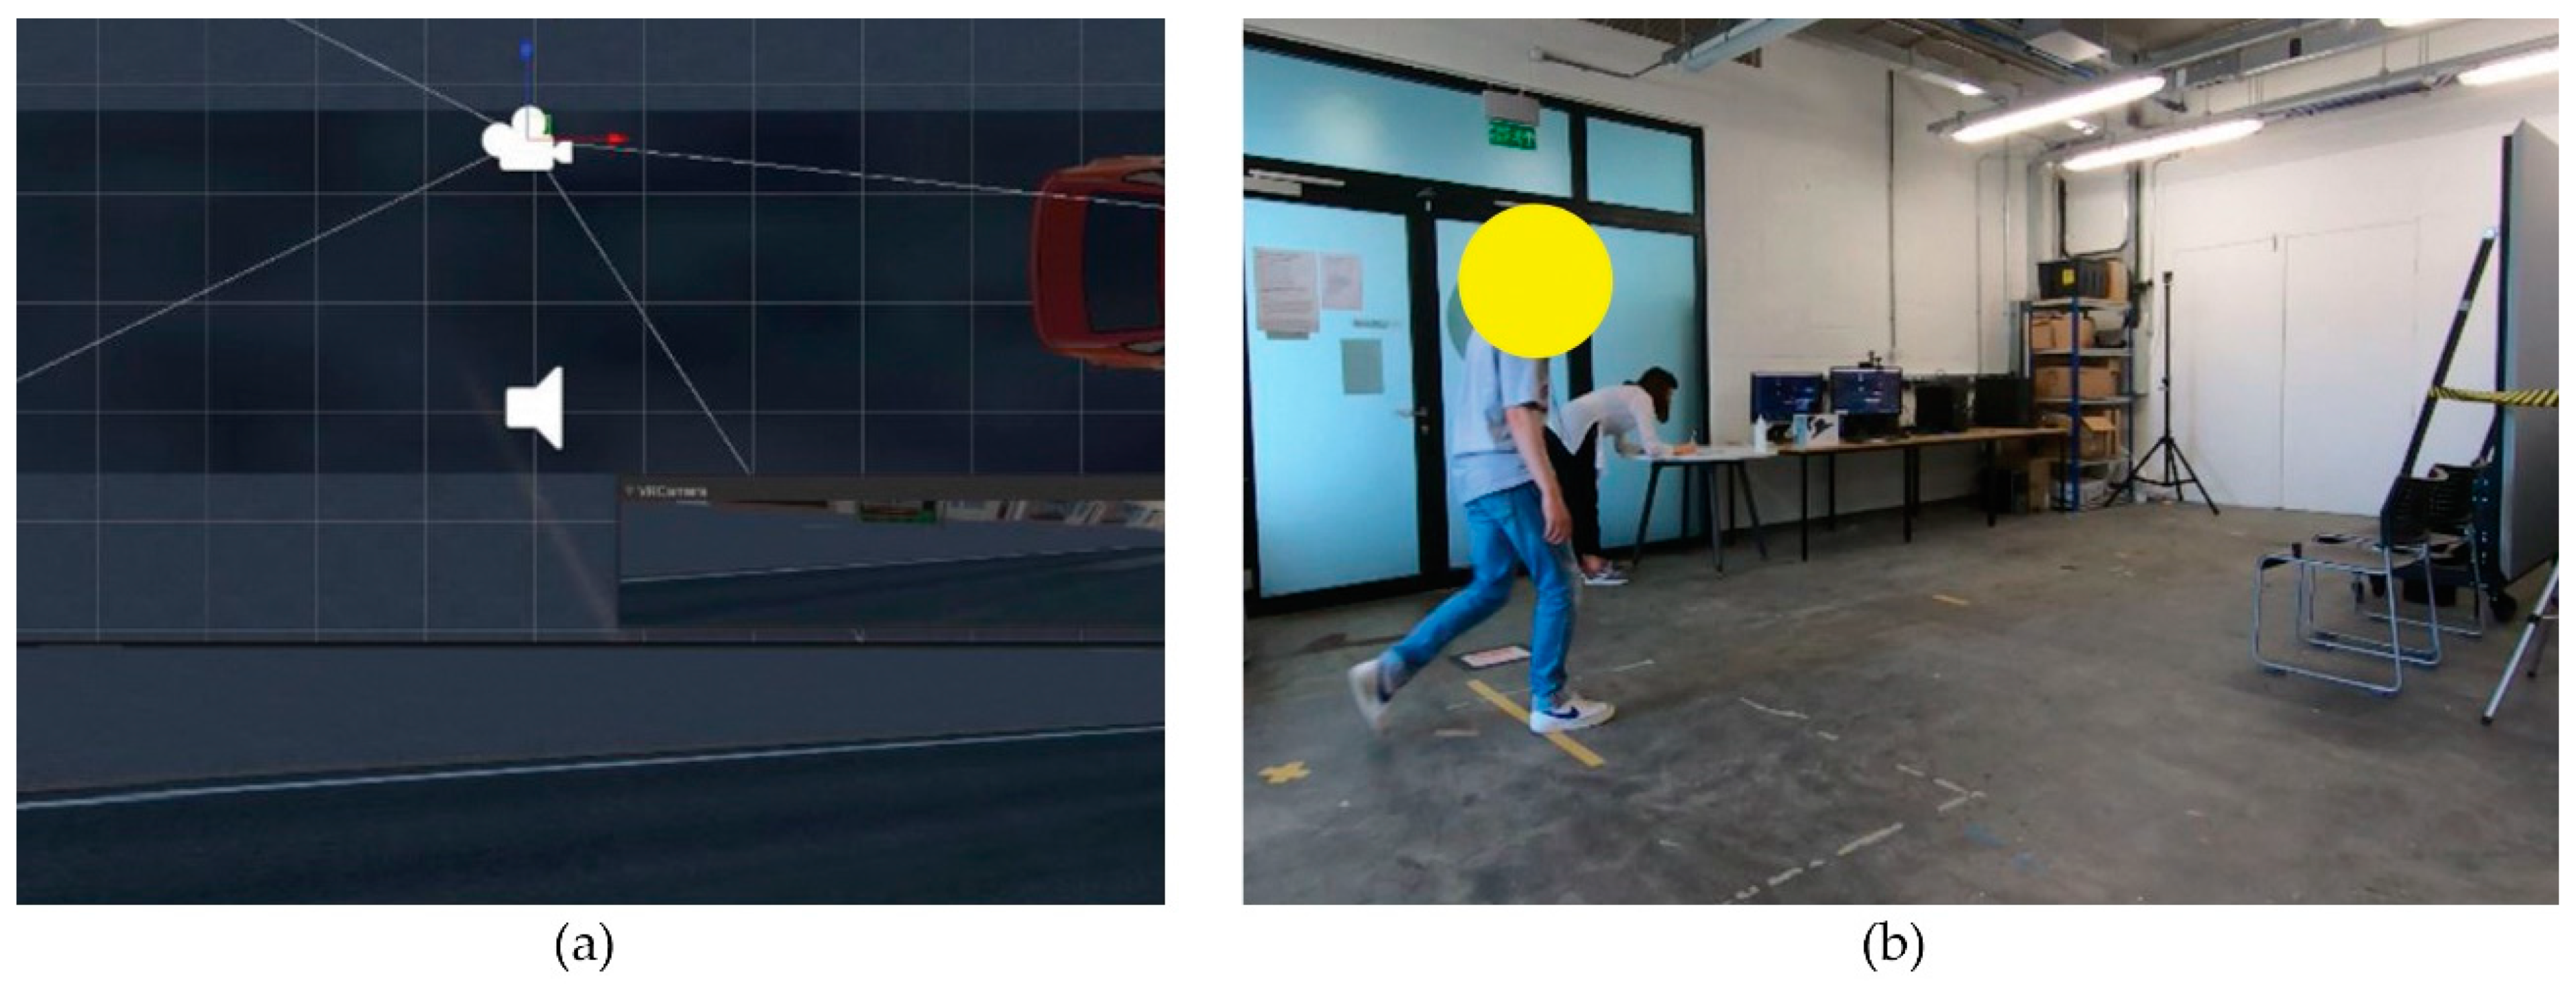
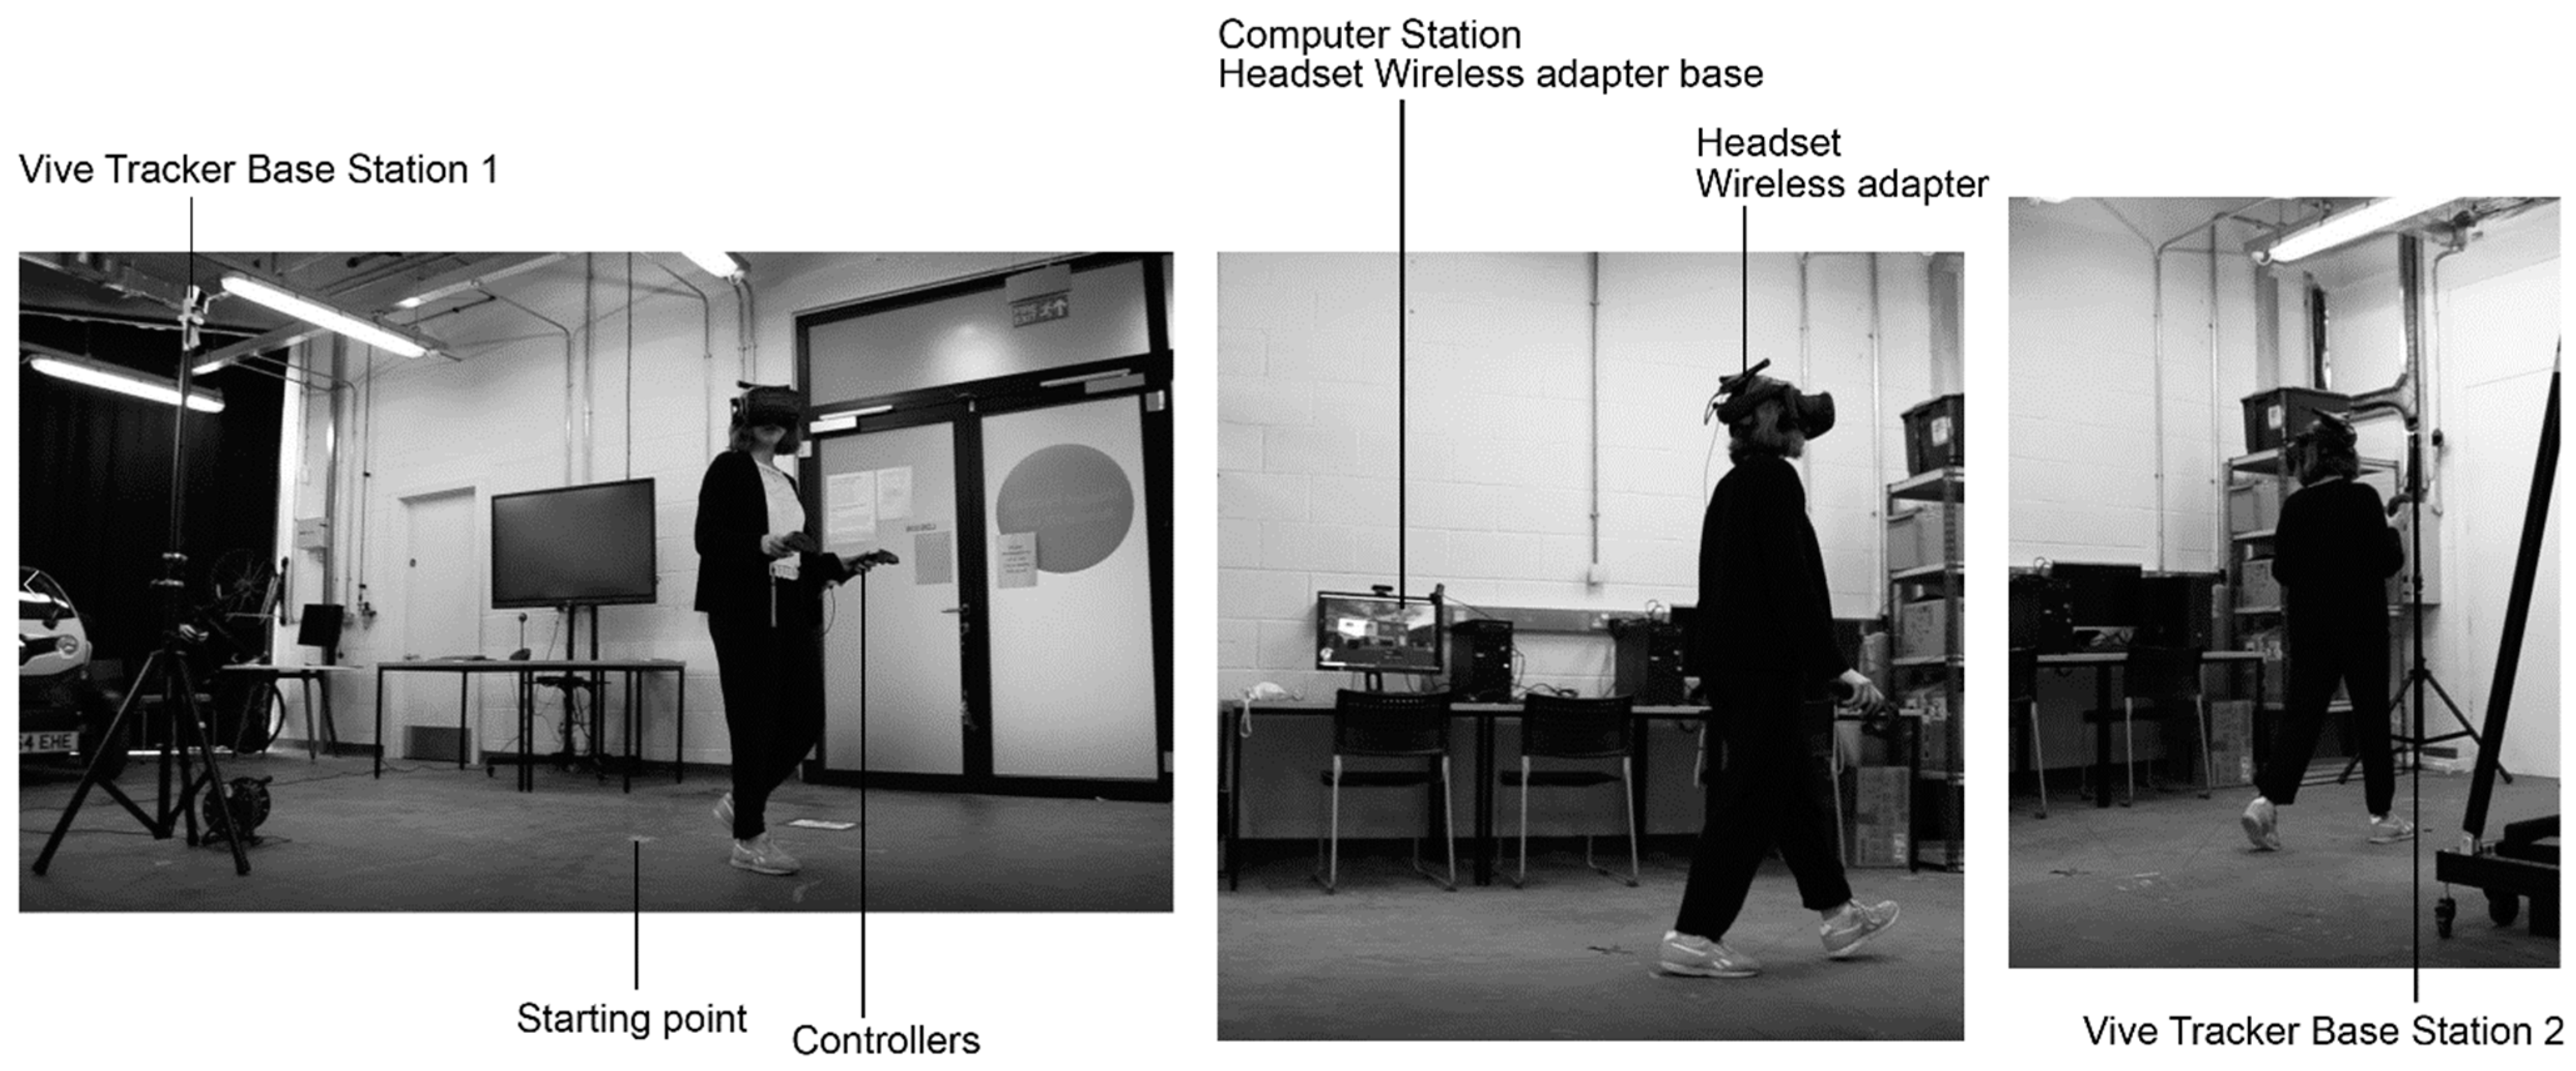
2.4. Apparatus
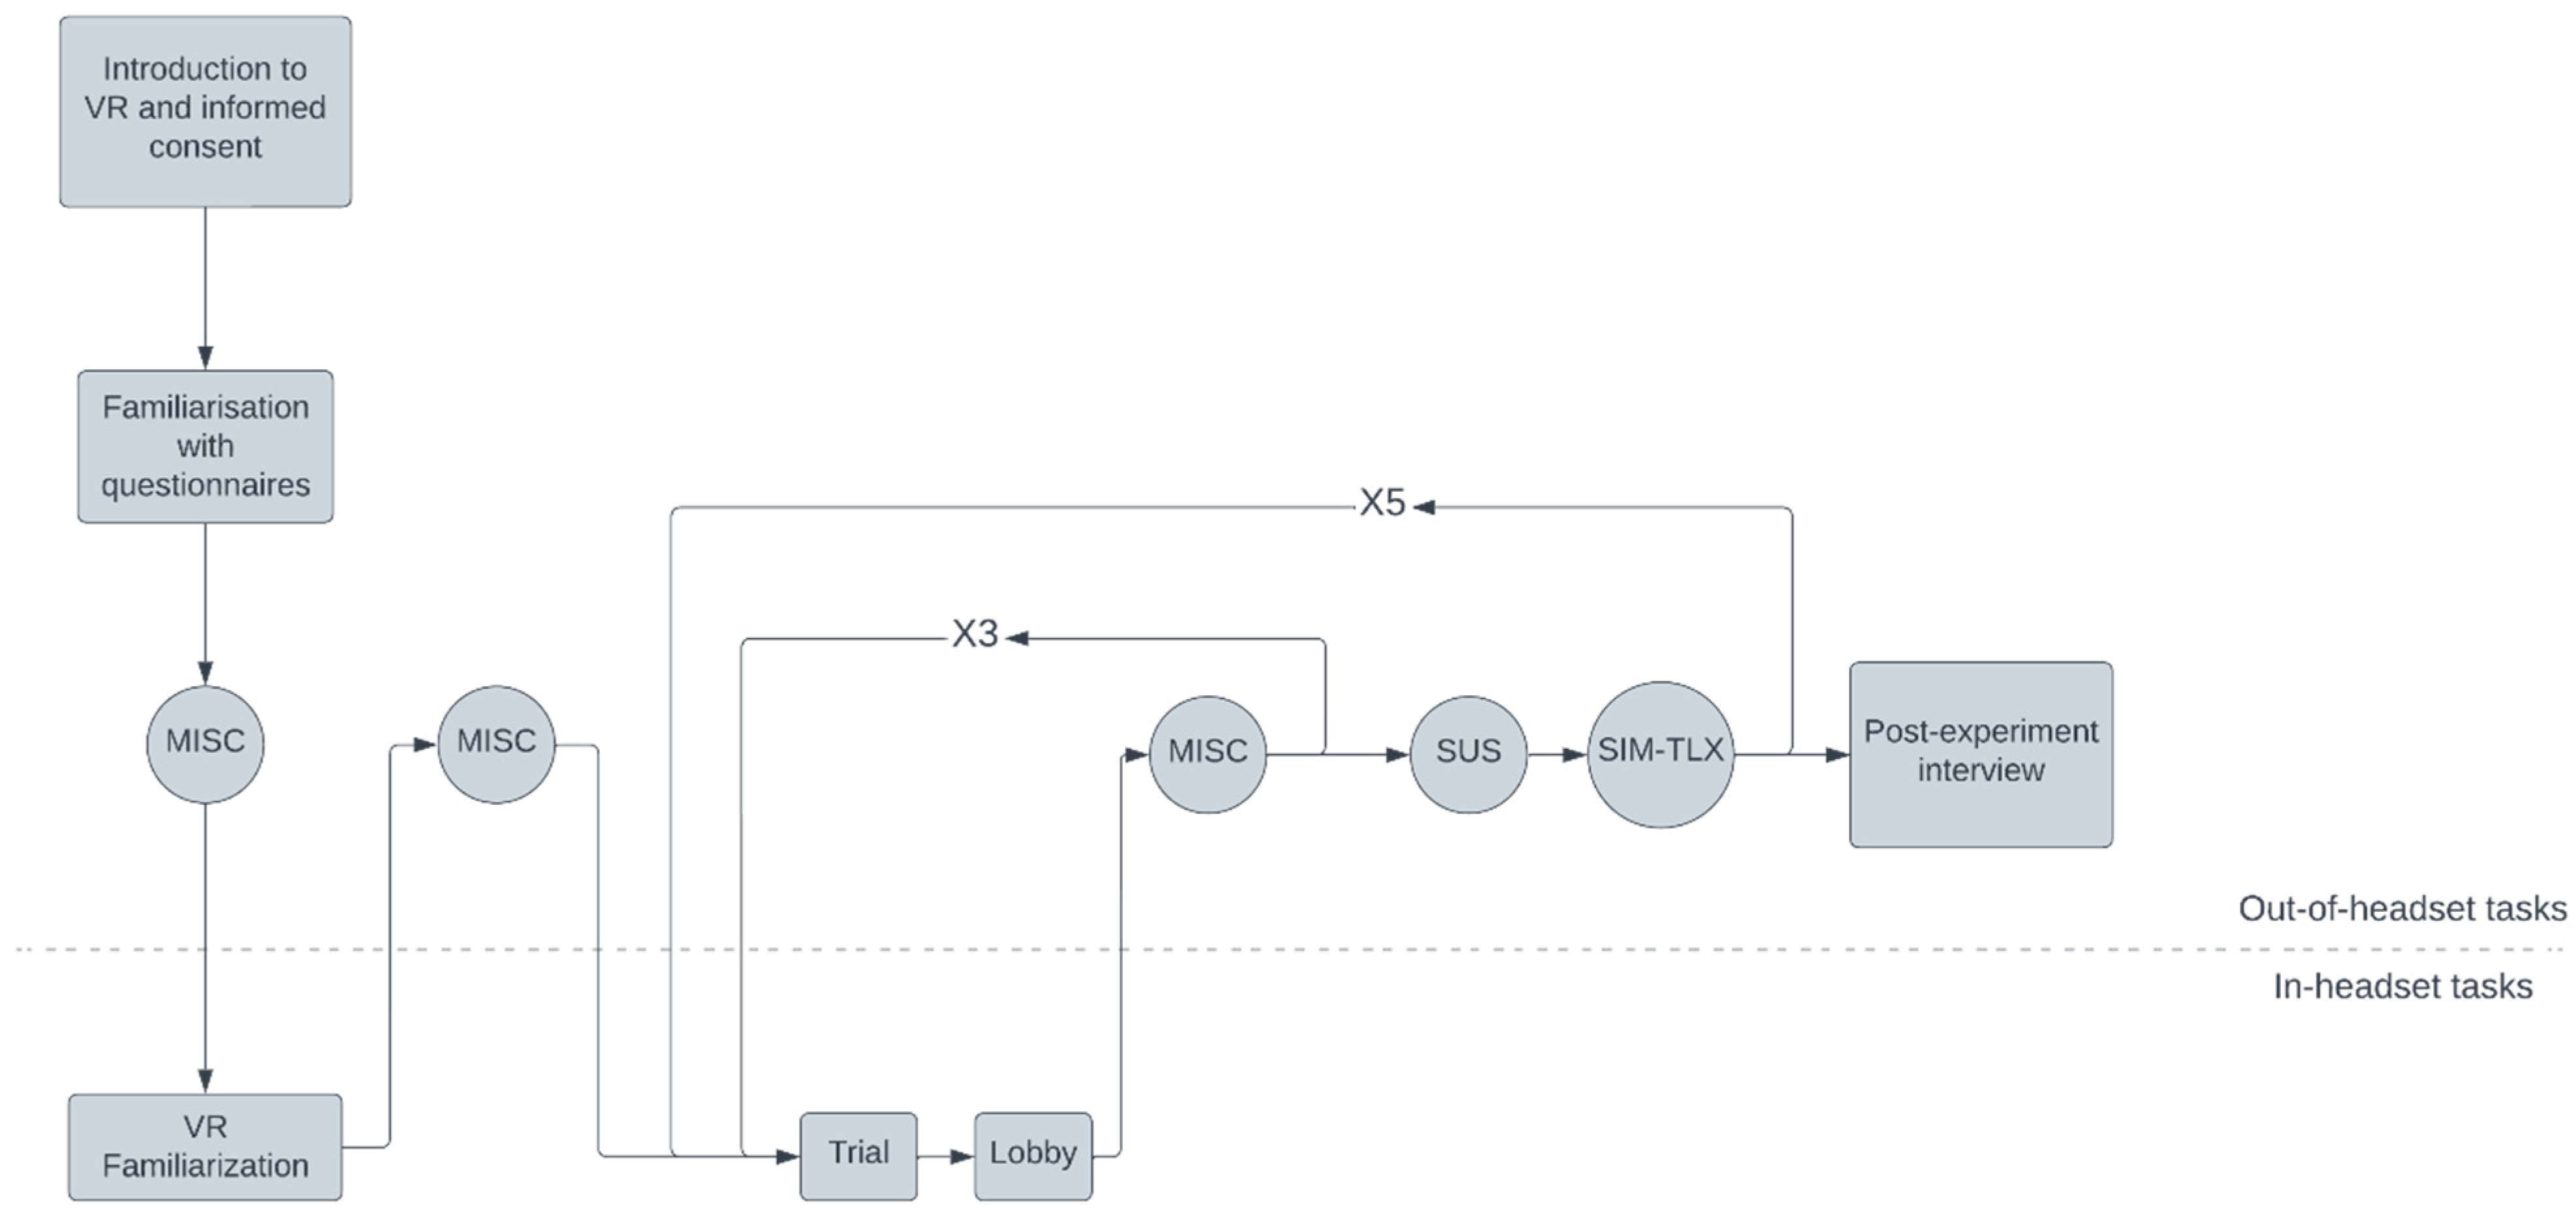
3. Experimental Procedure
3.1. Introduction to VR, Informed Consent and Familiarisation with Questionnaires
3.2. VR Familiarisation
3.3. Data Analysis
4. Results
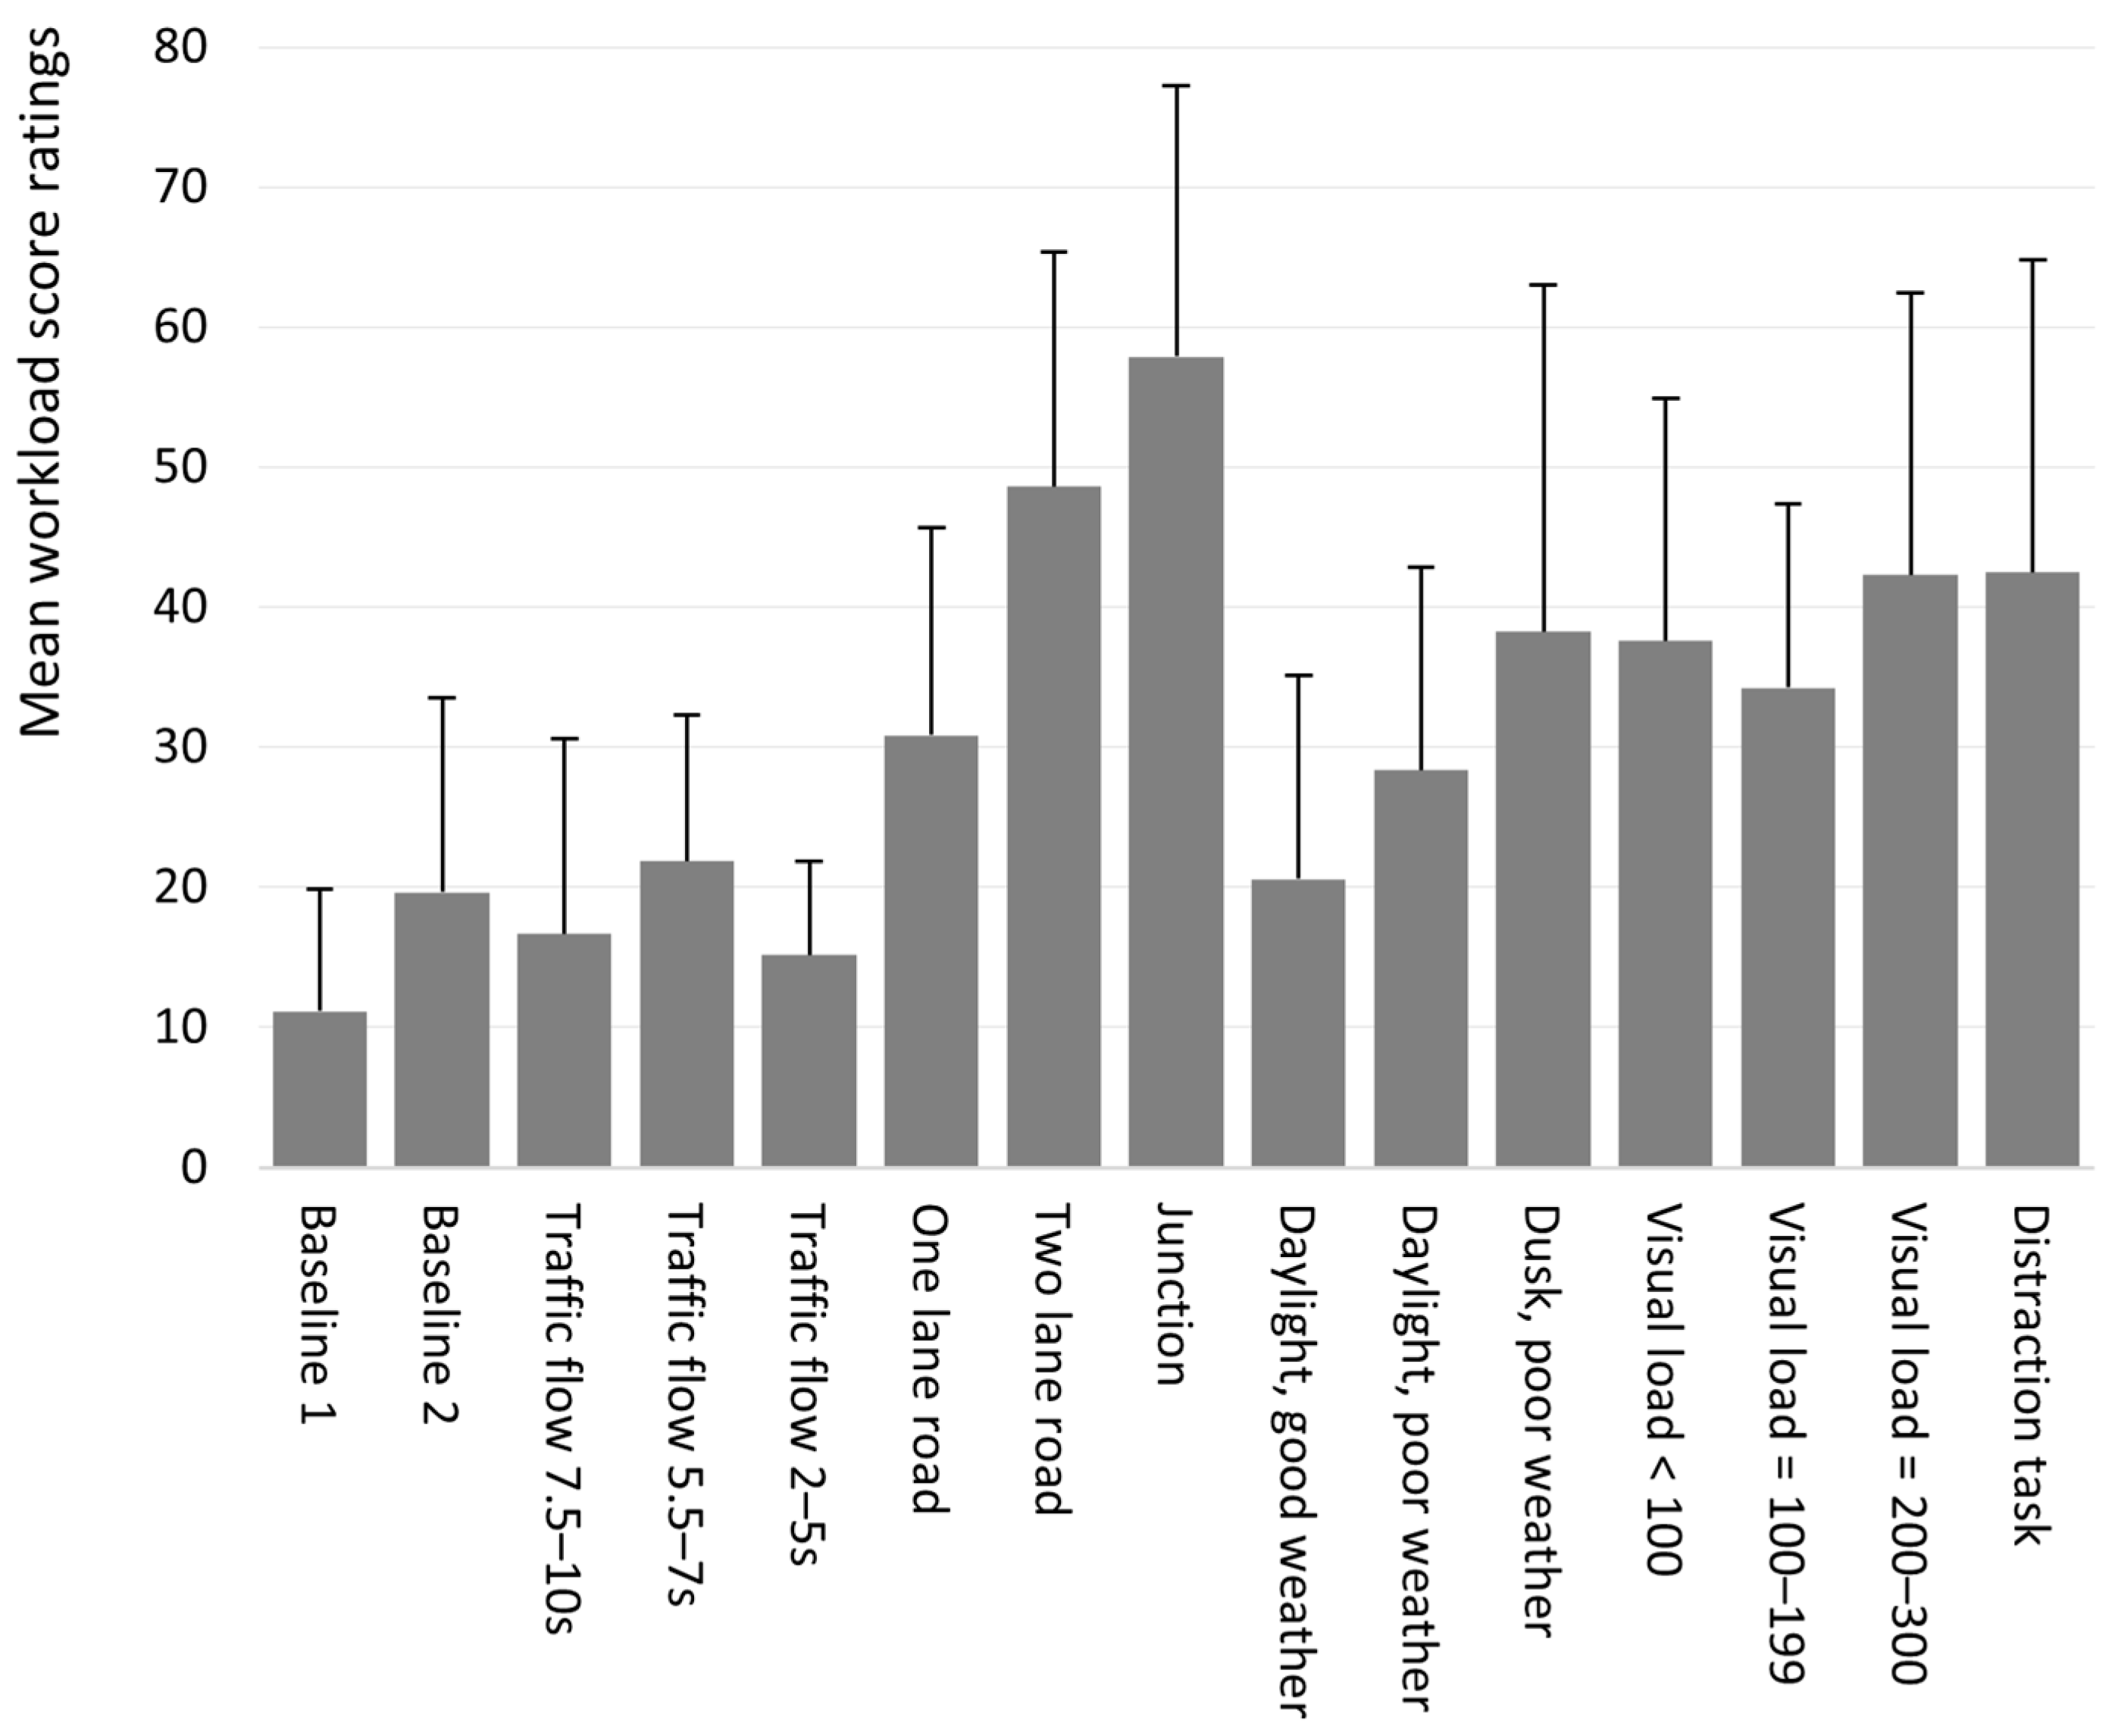
4.1. Subjective Measures
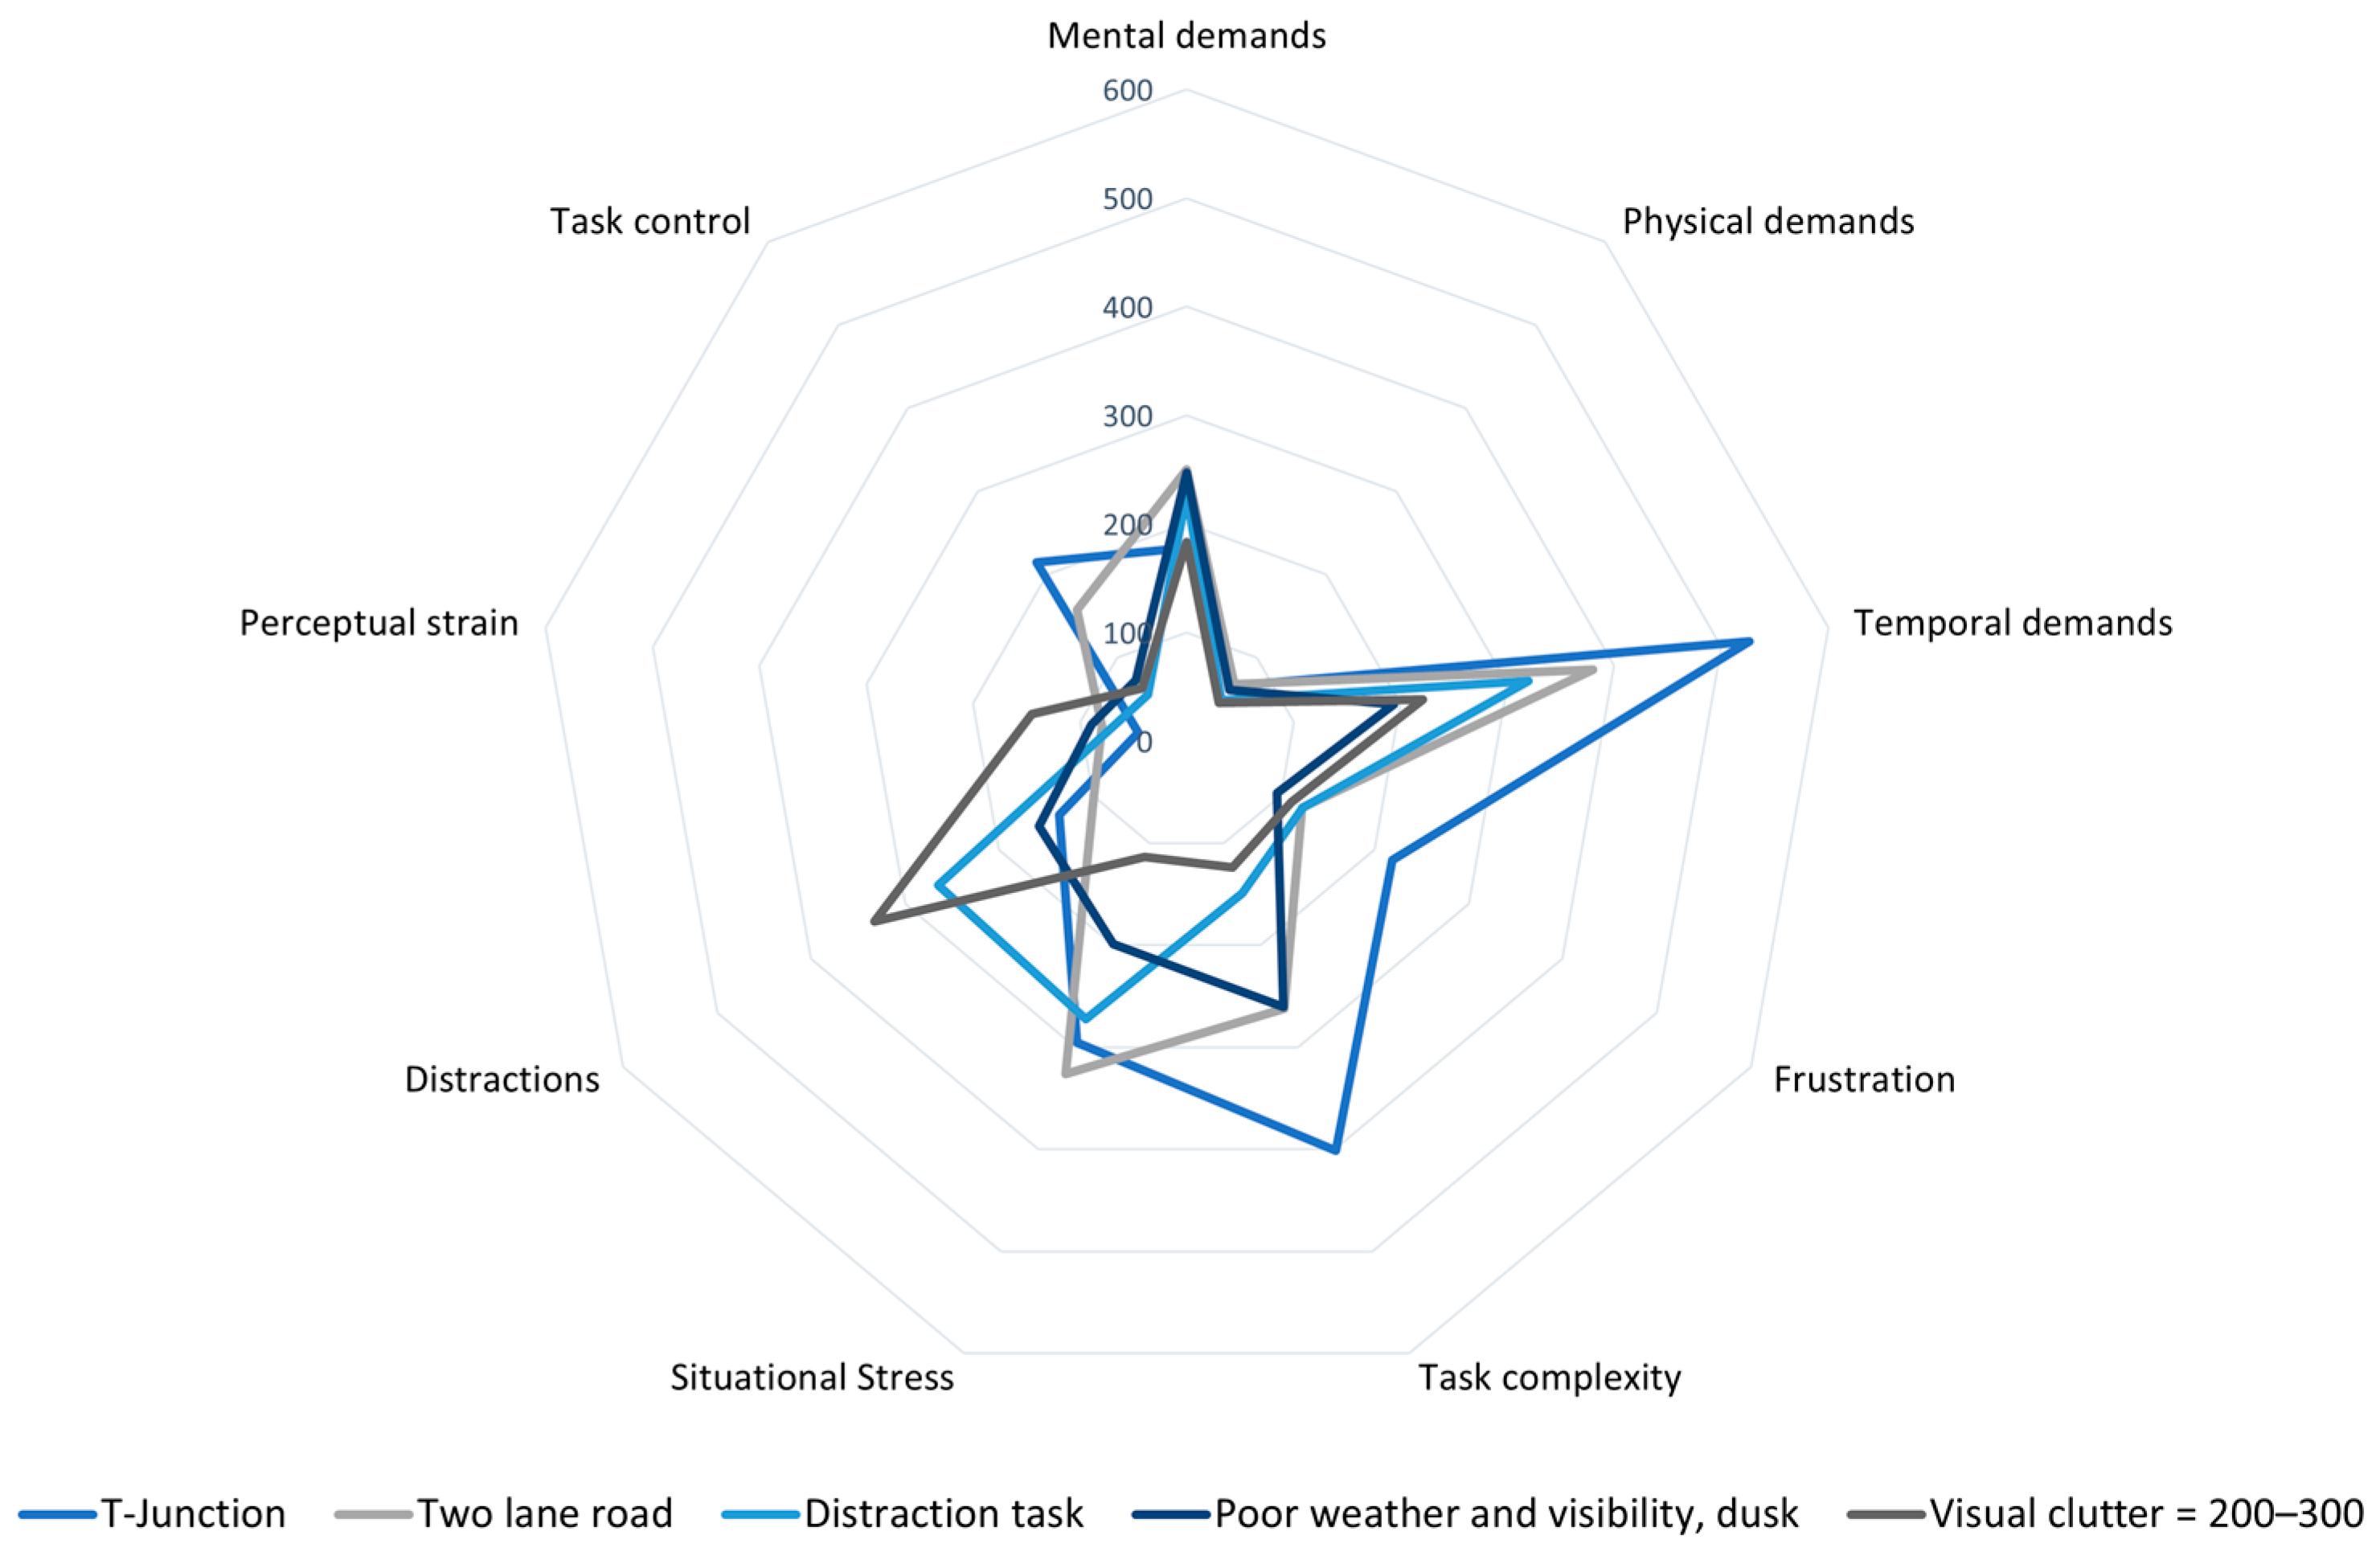
4.1.1. NASA SIM-TLX
4.1.2. SUS
4.1.3. Misery Scale
4.2. Objective Measures
4.2.1. Crossing Initiation Time
4.2.2. Crossing Speed
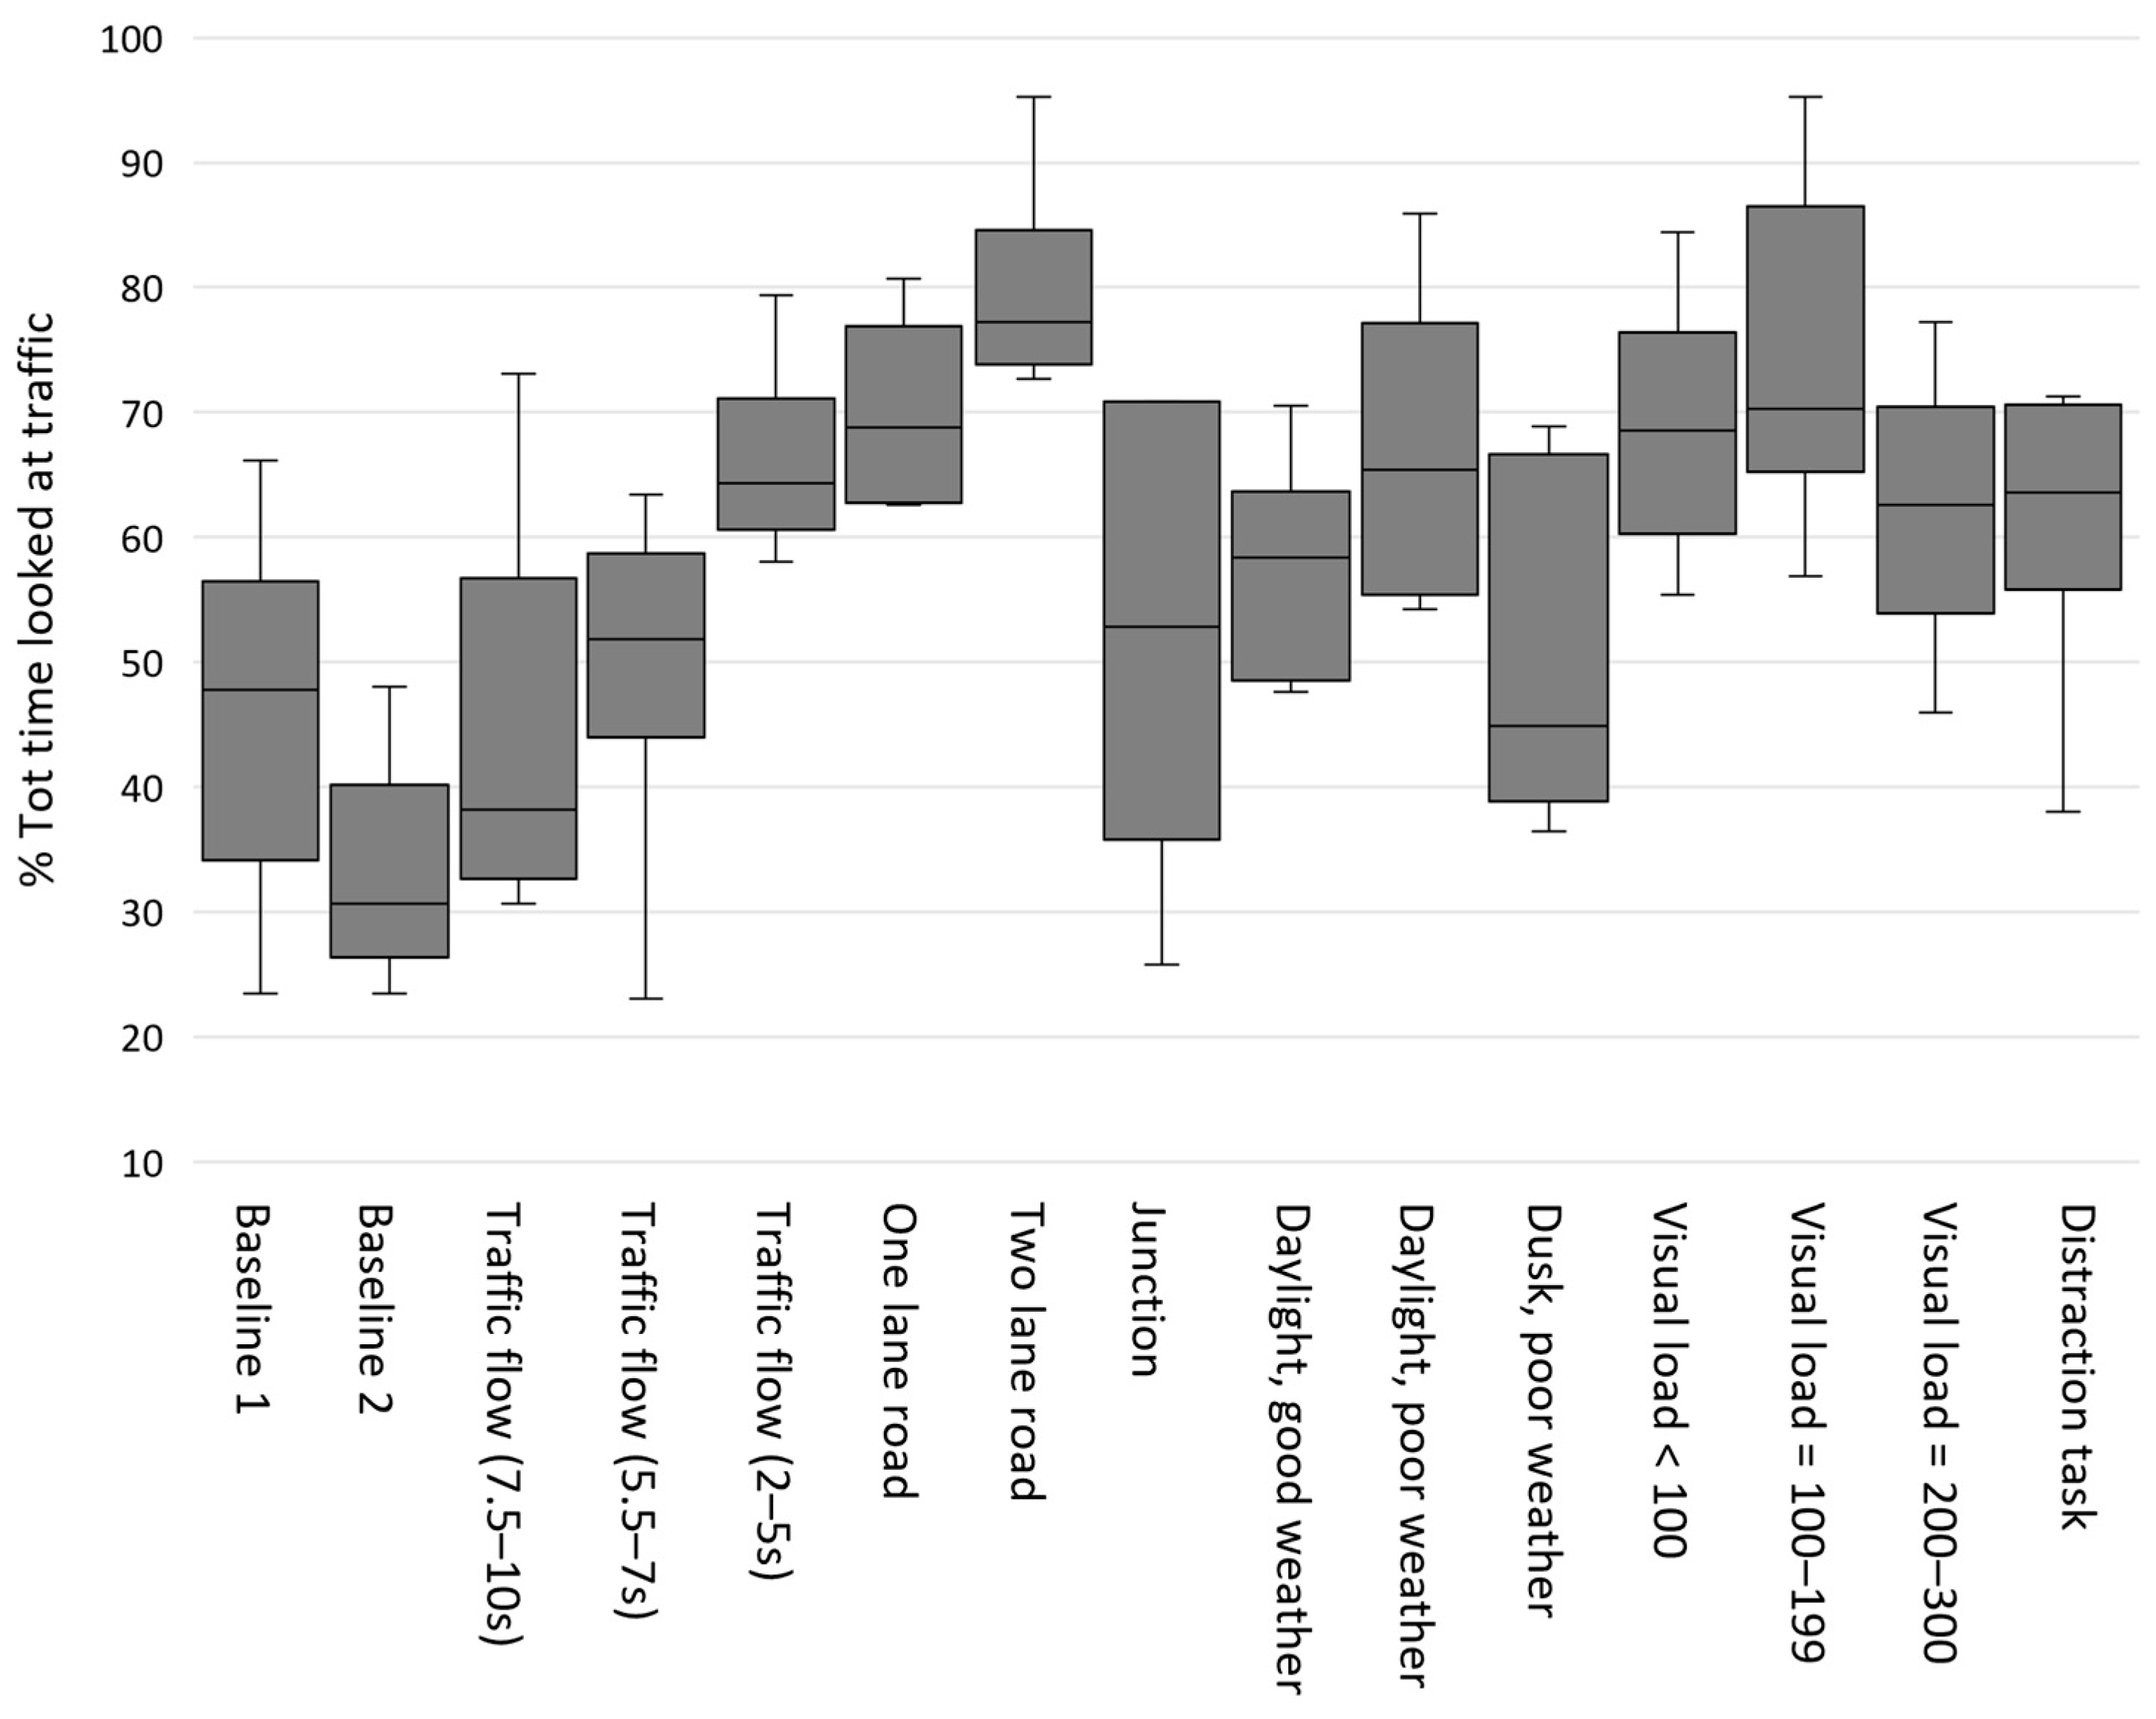
4.2.3. Gaze Behaviour
4.3. Qualitative Analysis
4.3.1. Distracting Tasks and Environments
‘more difficult was the distraction, when those screens for example were playing something, or people talking, or people passing, that became more distracting’, ‘several distractions, made me not pay much attention to traffic’, ‘I think when there are more distractions, you probably won’t be looking for a gap as often’. So there were some gaps where I was probably the same. But if I was distracted, I would wait a second, maybe to see it and then I’d be too late. So yeah, I think distractions was a key thing. Things like sound, or like a lot of bright things moving around like, in your peripheral vision’, ‘The environment felt extremely realistic and distracting’, ‘With a lot of people that was a bit more difficult ‘cause you get distracted’, ‘(it) was very loud, there were a lot of loud noises, that also made it very distracting for me’.
‘Was very distracting and although the environment was less complicated because there was less detail overall, it raised the task complexity much higher’, ‘The distracting phone call made me focus left on the surroundings’.
‘When there are more elements in the environment the task becomes more realistic and engaging and there is also more pressure to cross’, ‘seeing other people at the bus stop made me feel rushed to cross the road’. This was also the case for the lower levels of visual load condition (<100): ‘I felt very rushed off and frustrated’, ‘this experience felt more real to me and I did feel the pressure of getting across safely and watching out for cars’.
‘The more the noise and the detail in the environment and also the presence of other pedestrians, the more engaged and comfortable I felt’, ‘Very lively environment (... it felt) less stressful and more comfortable because there were people’.
4.3.2. Pressure to Cross and Sense of Danger
‘The rain and the darkness did feel real and in some way urged me to cross as soon as I had a chance. It felt more urgent’, ‘(with) things like rain, like darkness it became a little more difficult for me to perform the task’. One individual reported the condition feeling dangerous ‘The cars and the headlights didn’t look very realistic but the scenario overall laid down on be a bit of fear, so it felt like, scary and dangerous to cross. So it’s a bit contradictory, it didn’t feel as real as the others but at the same time if felt more dangerous to cross’.
‘Yes, on the one with the junction, I felt really pressured. I felt I was never gonna be able to see so I had to take a chance. Because of the two corners I was never gonna be able to see when it was clear’, ‘Felt dangerous. One of the cars surprised me, had to look a few times before crossing’, ‘the corner and high traffic are challenging, visibility is an issue, that made me go for a run even without being one hundred percent sure it was safe’.
‘With traffic coming from both sides, I felt rushed to cross’, ‘Was scared to be hit by a car’, ‘I felt really pressured, I think it was the one with the two-lane road’ and in general reported that this road layout required more concentration on their side to find a suitable gap to cross the road.
‘open fields with light traffic, that was easy’, ‘when there were less elements in the scene, when there was just the road’.
4.3.3. Sense of Presence and Perceived Realism of the Virtual Environment
‘it was difficult as it was still crossing the road, you had to look after distractions, treat it like a real-life experience’, ‘I felt like it was the real world, and I was making decisions as I would make them in the real world’ ‘In completing the task I did feel the rush to cross and sensed the danger of cars. To me that is very much an experience of being there’, ‘Cars made me act as if I was on an actual road. While crossing I didn’t think of the experiment but felt instinctive instead’.
Level of Detail and Visual and Auditory Accuracy of the Scene
‘When there are more elements in the environment, the task becomes more realistic and engaging and there is more pressure to cross as well’, There were many elements—buildings/pedestrians—that made it feel real’, ‘The higher number of cars didn’t leave time to think whether it was real or not’, ‘Very detailed landscape, made it more realistic’, ‘Very lively environment, looks like a city. Seeing people around helps feel like you are actually present’ ‘People moving about helped realism’, ‘Pedestrians and more street furniture made it much more realistic’.
‘Flatness of the scenery pulled me out’, ‘Open fields with light traffic. It was easy so I could think about being in a simulation’ ‘Very plain settings, less realistic’ ‘Plainer surroundings, made it less realistic’.
‘The sensorial experience was well orchestrated—the road felt real, the sounds (birds chirping and road noise) gave the idea of a real place’, ‘Seeing the virtual environment along with the audio helps feel like you are really there’, ‘Noises of traffic made it feel more real’ ‘The car noise when it came closer made it more realistic. I crossed too soon and I felt that it (the approaching vehicle) was too close’, ‘(With vehicle’s noises embedded in the environment), you feel like the cars are quite close to you. And I think that really made you ‘Oooh’ more aware of your surroundings ‘cause you know it’s coming, it can hit you’.
Engaging in Lifelike Tasks
‘Needing to pay attention to the “phone call” made me almost forget I wasn’t on an actual road’ ‘The phone call was actually a very realistic task and it made me feel like I was there’, ‘Real life activity e.g. being on the phone’ contributed to enhanced sense of presence, ‘The urgency of wanting to complete a task when there were cars made the VR experience believable and like I was really there’, ‘The bus approaching made it feel more real’ the ‘timing element of waiting for a bus’, made the experience more realistic.
‘Walking and moving provided a sense of being on the road’, ‘It was better than I expected. I was kind of expecting the use of controllers but the fact that you got the whole room set up, it was much more immersive and real’.
5. Discussion
5.1. Self-Reported Workload
5.2. Crossing Behaviour
5.3. Presence and Sickness
5.4. Complex “Worst Case” Scenario
6. Conclusions, Limitations and Future Work
Author Contributions
Funding
Institutional Review Board Statement
Informed Consent Statement
Data Availability Statement
Conflicts of Interest
References
- European Commission. Ethics of Connected and Automated Vehicles: Recommendations on Road Safety, Privacy, Fairness, Explainability and Responsibility; EU Publications: Brussels, Belgium, 2020. [Google Scholar]
- Fitch, G.M.; Bowman, D.; Llaneras, R. Distracted Driver Performance to Multiple Alerts in a Multiple-Conflict Scenario. Hum. Factors 2014, 56, 1497–1505. [Google Scholar] [CrossRef]
- Ye, L.; Yamamoto, T. Evaluating the impact of connected and autonomous vehicles on traffic safety. Phys. A Stat. Mech. Appl. 2019, 526, 121009. [Google Scholar] [CrossRef]
- WHO. Global Status Report on Road Safety 2018: Summary; World Health Organization: Geneva, Switzerland, 2018. [Google Scholar]
- Faas, S.M.; Mathis, L.-A.; Baumann, M. External HMI for self-driving vehicles: Which information shall be displayed? Transp. Res. Part F Traffic Psychol. Behav. 2020, 68, 171–186. [Google Scholar] [CrossRef]
- Dey, D.; Terken, J. Pedestrian Interaction with Vehicles: Roles of Explicit and Implicit Communication. Automotiveui 2017. In Proceedings of the 9th International Conference on Automotive User Interfaces and Interactive Vehicular Applications, Oldenburg, Germany, 24–27 September 2017; pp. 109–113. [Google Scholar]
- de Clercq, K.; Dietrich, A.; Núñez Velasco, J.P.; De Winter, J.; Happee, R. External Human-Machine Interfaces on Automated Vehicles: Effects on Pedestrian Crossing Decisions. Hum. Factors 2019, 61, 1353–1370. [Google Scholar] [CrossRef]
- Habibovic, A.; Lundrgren, V.M.; Andersson, J.; Klingegård, M.; Lagström, T.; Sirkka, A.; Fagerlönn, J.; Edgren, C.; Fredriksson, R.; Krupenia, S.; et al. Communicating Intent of Automated Vehicles to Pedestrians. Front. Psychol. 2018, 9, 1336. [Google Scholar] [CrossRef]
- Hollander, K.; Colley, A.; Mai, C.; Häkkilä, J.; Alt, F.; Pfleging, B. Investigating the Influence of External Car Displays on Pedestrians’ Crossing Behavior in Virtual Reality. In Proceedings of the 21st International Conference on Human-Computer Interaction with Mobile Devices and Services (Mobilehci’19), Taipei, Taiwan, 1–4 October 2019. [Google Scholar]
- Kooijman, L.; Happee, R.; de Winter, J. How Do eHMIs Affect Pedestrians’ Crossing Behavior? A Study Using a Head-Mounted Display Combined with a Motion Suit. Information 2019, 10, 386. [Google Scholar]
- Kaleefathullah, A.A.; Merat, N.; Lee, Y.M.; Eisma, Y.B.; Madigan, R.; Garcia, J.; Winter, J.D. External Human-Machine Interfaces Can Be Misleading: An Examination of Trust Development and Misuse in a CAVE-Based Pedestrian Simulation Environment. Hum. Factors 2022, 64, 1070–1085. [Google Scholar] [CrossRef]
- Dey, D.; van Vastenhoven, A.; Cuijpers, R.H.; Martens, M.; Pfleging, B. Towards Scalable eHMIs. In Proceedings of the 13th International Conference on Automotive User Interfaces and Interactive Vehicular Applications, AutomotiveUI 2021, Leeds, UK, 9–14 September 2021. [Google Scholar]
- Mahadevan, K.; Sanoubari, E.; Somanath, S.; Young, J.E.; Sharlin, E. AV-Pedestrian Interaction Design Using a Pedestrian Mixed Traffic Simulator. In Proceedings of the 2019 on Designing Interactive Systems Conference, San Diego, CA, USA, 23–28 June 282019; pp. 475–486. [Google Scholar]
- Hoggenmüller, M.; Tomitsch, M.; Worrall, S. Designing Interactions With Shared AVs in Complex Urban Mobility Scenarios. Front. Comput. Sci. 2022, 4, 866258. [Google Scholar] [CrossRef]
- Lee, J.; Daimon, T.; Kitazaki, S. Negative Effect of External Human-Machine Interfaces in Automated Vehicles on Pedestrian Crossing Behaviour: A Virtual Reality Experiment. In Proceedings of the 21st Congress of the International Ergonomics Association (IEA 2021), Online, 13–18 June 2021. [Google Scholar]
- Bazilinskyy, P.; Kooijman, L.; Dodou, D.; De Winter, J.C.F. How should external human-machine interfaces behave? Examining the effects of colour, position, message, activation distance, vehicle yielding, and visual distraction among 1434 participants. Appl. Ergon. 2021, 95, 103450. [Google Scholar] [CrossRef]
- Schieben, A.; Wilbrink, M.; Kettwich, C.; Madigan, R.; Louw, T.; Merat, N. Designing the interaction of automated vehicles with other traffic participants: Design considerations based on human needs and expectations. Cogn. Technol. Work. 2019, 21, 69–85. [Google Scholar] [CrossRef]
- Björklund, G.M.; Åberg, L. Driver behaviour in intersections: Formal and informal traffic rules. Transp. Res. Part F Traffic Psychol. Behav. 2005, 8, 239–253. [Google Scholar] [CrossRef]
- Endsley, M.R. Measurement of Situation Awareness in Dynamic-Systems. Hum. Factors 1995, 37, 65–84. [Google Scholar] [CrossRef]
- Shor, R.E. Shared Patterns of Nonverbal Normative Expectations in Automobile Driving. J. Soc. Psychol. 1964, 62, 155–163. [Google Scholar] [CrossRef]
- Ampofo-Boateng, K.; Thomson, J.A. Child pedestrian accidents: A case for preventive medicine. Health Educ. Res. 1990, 5, 265–274. [Google Scholar] [CrossRef]
- Bendak, S.; Al-Saleh, K. The role of roadside advertising signs in distracting drivers. Int. J. Ind. Ergon. 2010, 40, 233–236. [Google Scholar] [CrossRef]
- Horberry, T.; Anderson, J.; Regan, M.A.; Triggs, T.J.; Brown, J. Driver distraction: The effects of concurrent in-vehicle tasks, road environment complexity and age on driving performance. Accid. Anal. Prev. 2006, 38, 185–191. [Google Scholar] [CrossRef]
- Tapiro, H.; Oron-Gilad, T.; Parmet, Y. Pedestrian distraction: The effects of road environment complexity and age on pedestrian’s visual attention and crossing behavior. J. Saf. Res. 2020, 72, 101–109. [Google Scholar] [CrossRef]
- Neider, M.B.; McCarley, J.S.; Crowell, J.A.; Kaczmarski, H.; Kramer, A.F. Pedestrians, vehicles, and cell phones. Accid. Anal. Prev. 2010, 42, 589–594. [Google Scholar] [CrossRef]
- Schwebel, D.C.; Stavrinos, D.; Byington, K.W.; Davis, T.; O’Neal, E.E.; De Jong, D. Distraction and pedestrian safety: How talking on the phone, texting, and listening to music impact crossing the street. Accid. Anal. Prev. 2012, 45, 266–271. [Google Scholar] [CrossRef]
- Stavrinos, D.; Byington, K.; Schwebel, D. Distracted walking: Cell phones increase injury risk for college pedestrians. J. Saf. Res. 2011, 42, 101–107. [Google Scholar] [CrossRef]
- Tapiro, H.; Oron-Gilad, T.; Parmet, Y. Cell phone conversations and child pedestrian’s crossing behavior; a simulator study. Saf. Sci. 2016, 89, 36–44. [Google Scholar] [CrossRef]
- Larue, G.S.; Watling, C.N.; Black, A.A.; Wood, J.M.; Khakzar, M. Pedestrians distracted by their smartphone: Are in-ground flashing lights catching their attention? A laboratory study. Accid. Anal. Prev. 2020, 134, 105346. [Google Scholar] [CrossRef]
- Thomson, J.A.; Tolmie, A.; Foot, H.C.; McLaren, B. Department for Transport (Funder), Child development and the aims of road safety education. In Safety Research Reports; HMSO: London, UK, 1996. [Google Scholar]
- Eisma, Y.B.; van Bergen, S.; Ter Brake, S.M.; Hensen, M.T.T.; Tempelaar, W.J.; de Winter, J.C. External Human–Machine Interfaces: The Effect of Display Location on Crossing Intentions and Eye Movements. Information 2020, 11, 13. [Google Scholar] [CrossRef]
- Ackermann, C.; Beggiato, M.; Schubert, S.; Krems, J.F. An experimental study to investigate design and assessment criteria: What is important for communication between pedestrians and automated vehicles? Appl. Ergon. 2019, 75, 272–282. [Google Scholar] [CrossRef] [PubMed]
- Oxley, J.; Fildes, B.; Ihsen, E.; Charlton, J.; Day, R. Differences in traffic judgements between young and old adult pedestrians. Accid. Anal. Prev. 1997, 29, 839–847. [Google Scholar] [CrossRef]
- Rosenboom, T.; Ben-Ellyahu, A.; Nemrodov, D. Children’s crossing behavior with an accompanying adult. Saf. Sci. 2008, 46, 1248–1254. [Google Scholar] [CrossRef]
- Granie, M.A. Effects of gender, sex-stereotype conformity, age and internalization on risk-taking among adolescent pedestrians. Saf. Sci. 2009, 47, 1277–1283. [Google Scholar] [CrossRef]
- Holland, C.; Hill, R. The effect of age, gender and driver status on pedestrians’ intentions to cross the road in risky situations. Accid. Anal. Prev. 2007, 39, 224–237. [Google Scholar] [CrossRef]
- Tom, A.; Granie, M.A. Gender differences in pedestrian rule compliance and visual search at signalized and unsignalized crossroads. Accid. Anal. Prev. 2011, 43, 1794–1801. [Google Scholar] [CrossRef]
- Rankavat, S.; Tiwari, G. Pedestrians perceptions for utilization of pedestrian facilities—Delhi, India. Transp. Res. Part F Traffic Psychol. Behav. 2016, 42, 495–499. [Google Scholar] [CrossRef]
- Herrero-Fernández, D.; Macía-Guerrero, P.; Silvano-Chaparro, L.; Merino, L.; Jenchura, E.C. Risky behavior in young adult pedestrians: Personality determinants, correlates with risk perception, and gender differences. Transp. Res. Part F Traffic Psychol. Behav. 2016, 36, 14–24. [Google Scholar] [CrossRef]
- Morrongiello, B.A.; Dayler, L. A community-based study of parents’ knowledge, attitudes and beliefs related to childhood injuries. Can. J. Public Health-Rev. Can. De Sante Publique 1996, 87, 383–388. [Google Scholar]
- Sisiopiku, V.P.; Akin, D. Pedestrian behaviors at and perceptions towards various pedestrian facilities: An examination based on observation and survey data. Transp. Res. Part F Traffic Psychol. Behav. 2003, 6, 249–274. [Google Scholar] [CrossRef]
- Papadimitriou, E.; Lassarre, S.; Yannis, G. Introducing human factors in pedestrian crossing behaviour models. Transp. Res. Part F-Traffic Psychol. Behav. 2016, 36, 69–82. [Google Scholar] [CrossRef]
- Borgers, A.; Timmermans, H. A Model of Pedestrian Route Choice and Demand for Retail Facilities within Inner-City Shopping Areas. Geogr. Anal. 1986, 18, 115–128. [Google Scholar] [CrossRef]
- Flohr, L.A.; Wallach, D.P. The Value of Context-Based Interface Prototyping for the Autonomous Vehicle Domain: A Method Overview. Multimodal Technol. Interact. 2023, 7, 4. [Google Scholar] [CrossRef]
- Tran, T.; Parker, C.; Tomitsch, M. A Review of Virtual Reality Studies on Autonomous Vehicle-Pedestrian Interaction. IEEE Trans. Hum.-Mach. Syst. 2021, 51, 641–652. [Google Scholar] [CrossRef]
- Velasco, J.P.N.; Farah, H.; van Arem, B.; Hagenzieker, M.P. Studying pedestrians’ crossing behavior when interacting with automated vehicles using virtual reality. Transp. Res. Part F-Traffic Psychol. Behav. 2019, 66, 1–14. [Google Scholar] [CrossRef]
- Bindschadel, J.; Krems, I.; Kiesel, A. Interaction between pedestrians and automated vehicles: Exploring a motion-based approach for virtual reality experiments. Transp. Res. Part F-Traffic Psychol. Behav. 2021, 82, 316–332. [Google Scholar] [CrossRef]
- Lee, Y.M.; Madigan, R.; Uzondu, C.; Garcia, J.; Romano, R.; Markkula, G.; Merat, N. Learning to interpret novel eHMI: The effect of vehicle kinematics and eHMI familiarity on pedestrian’ crossing behavior. J. Saf. Res. 2022, 80, 270–280. [Google Scholar] [CrossRef] [PubMed]
- Heeter, C. Being There: The Subjective Experience of Presence. Presence Teleoperators Virtual Environ. 1992, 1, 262–271. [Google Scholar] [CrossRef]
- Cummings, J.J.; . Bailenson, J.N. How Immersive Is Enough? A Meta-Analysis of the Effect of Immersive Technology on User Presence. Media Psychol. 2016, 19, 272–309. [Google Scholar] [CrossRef]
- Slater, M.; Khanna, P.; Mortensen, J.; Yu, I. Visual Realism Enhances Realistic Response in an Immersive Virtual Environment. IEEE Comput. Graph. Appl. 2009, 29, 76–84. [Google Scholar] [CrossRef]
- Feldstein, I.; Dietrich, A.; Milinkovic, S.; Bengler, K. A Pedestrian Simulator for Urban Crossing Scenarios. Ifac Pap. 2016, 49, 239–244. [Google Scholar] [CrossRef]
- Farooq, B.; Cherchi, E.; Sobhani, A. Virtual Immersive Reality for Stated Preference Travel Behavior Experiments: A Case Study of Autonomous Vehicles on Urban Roads. Transp. Res. Rec. 2018, 2672, 35–45. [Google Scholar] [CrossRef]
- Deb, S.; Carruth, D.W.; Sween, R.; Strawderman, L.; Garrison, T.M. Efficacy of virtual reality in pedestrian safety research. Appl. Ergon. 2017, 65, 449–460. [Google Scholar] [CrossRef]
- Hoggenmüller, M.; Tomitsch, M.; Hespanhol, L.; Tran, T.T.M.; Worrall, S.; Nebot, E. Context-Based Interface Prototyping: Understanding the Effect of Prototype Representation on User Feedback; (CHI’21). In Proceedings of the 2021 CHI Conference on Human Factors in Computing Systems, Yokohama, Japan, 8–13 May 2021; pp. 1–14. [Google Scholar]
- Morrongiello, B.A.; Corbett, M.; Switzer, J.; Hall, T. Using a Virtual Environment to Study Pedestrian Behaviors: How Does Time Pressure Affect Children’s and Adults’ Street Crossing Behaviors? J. Pediatr. Psychol. 2015, 40, 697–703. [Google Scholar] [CrossRef]
- Das, S.; Manski, C.; Manuszak, M. Walk or wait? An empirical analysis of street crossing decisions. J. Appl. Econom. 2005, 20, 529–548. [Google Scholar] [CrossRef]
- Rasouli, A.; Kotseruba, I.; Tsotsos, J. Understanding Pedestrian Behavior in Complex Traffic Scenes. IEEE Trans. Intell. Veh. 2018, 3, 61–70. [Google Scholar] [CrossRef]
- Brewer, M.A.; Fitzpatrick, K.; Whitacre, J.A.; Lord, D. Exploration of Pedestrian Gap-Acceptance Behavior at Selected Locations. Transp. Res. Rec. 2006, 1982, 132–140. [Google Scholar] [CrossRef]
- Plumert, J.M.; Kearney, J.K. Linking Decisions and Actions in Dynamic Environments: How Child and Adult Cyclists Cross Roads with Traffic. Ecol. Psychol. 2014, 26, 125–133. [Google Scholar] [CrossRef] [PubMed]
- Zhai, X.Q.; Huang, H.; Sze, N.N.; Song, Z.; Hon, K.K. Diagnostic analysis of the effects of weather condition on pedestrian crash severity. Accid. Anal. Prev. 2019, 122, 318–324. [Google Scholar] [CrossRef] [PubMed]
- Li, Y.; Fernie, G. Pedestrian behavior and safety on a two-stage crossing with a center refuge island and the effect of winter weather on pedestrian compliance rate. Accid. Anal. Prev. 2010, 42, 1156–1163. [Google Scholar] [CrossRef]
- Bagheri, M.; Ayoubinejad, J.; Asl, F.N.; Feizbahr, M. The Effect of Rain on Pedestrians Crossing Speed. Comput. Res. Prog. in Appl. Sci. Engr. 2020, 6, 186–190. [Google Scholar]
- Bargegol, I.; Ginali, V.N.M.; Hosseinian, M. Pedestrians Crossing and Walking Speeds Analysis in Urban Areas under the Influence of Rain and Personality Characteristics. Math. Probl. Eng. 2022, 2022, 7768160. [Google Scholar] [CrossRef]
- Liu, Y.C.; Tung, Y.C. Risk analysis of pedestrians’ road-crossing decisions: Effects of age, time gap, time of day, and vehicle speed. Saf. Sci. 2014, 63, 77–82. [Google Scholar] [CrossRef]
- Sun, R.X.; Zhuang, X.; Wu, C.; Zhao, G.; Zhang, K. The estimation of vehicle speed and stopping distance by pedestrians crossing streets in a naturalistic traffic environment. Transp. Res. Part F-Traffic Psychol. Behav. 2015, 30, 97–106. [Google Scholar] [CrossRef]
- Banducci, S.E.; Ward, N.; Gaspar, J.G.; Schab, K.R.; Crowell, J.A.; Kaczmarski, H.; Kramer, A.F. The Effects of Cell Phone and Text Message Conversations on Simulated Street Crossing. Hum. Factors 2016, 58, 150–162. [Google Scholar] [CrossRef] [PubMed]
- Lin, M.I.B.; Huang, Y.P. The impact of walking while using a smartphone on pedestrians’ awareness of roadside events. Accid. Anal. Prev. 2017, 101, 87–96. [Google Scholar] [CrossRef] [PubMed]
- Nasar, J.; Hecht, P.; Wener, R. Mobile telephones, distracted. Attention, and pedestrian safety. Accid. Anal. Prev. 2008, 40, 69–75. [Google Scholar] [CrossRef]
- Wiehr, F.; Cakar, B.; Daiber, F.; Krüger, A. The Effect of Surrounding Scenery Complexity on the Transfer of Control Time in Highly Automated Driving. In Proceedings of the IUI 21—26th International Conference on Intelligent User Interfaces, College Station, TX, USA, 14–17 April 2021; pp. 92–97. [Google Scholar]
- Pesic, D.; Antić, B.; Glavić, D.; Milenković, M. The effects of mobile phone use on pedestrian crossing behaviour at unsignalized intersections – Models for predicting unsafe pedestrians behaviour. Saf. Sci. 2016, 82, 1–8. [Google Scholar] [CrossRef]
- Endsley, M.R.; Kaber, D.B. Level of automation effects on performance, situation awareness and workload in a dynamic control task. Ergonomics 1999, 42, 462–492. [Google Scholar] [CrossRef] [PubMed]
- Kaber, D.B.; Endsley, M.R. The effects of level of automation and adaptive automation on human performance, situation awareness and workload in a dynamic control task. Theor. Issues Ergon. Sci. 2004, 5, 113–153. [Google Scholar] [CrossRef] [Green Version]
- Harris, D.; Wilson, M.; Vine, S. Development and validation of a simulation workload measure: The simulation task load index (SIM-TLX). Virtual Real. 2020, 24, 557–566. [Google Scholar] [CrossRef]
- Usoh, M.; Catena, E.; Arman, S.; Slater, M. Using presence questionnaires in reality. Presence-Teleoperators Virtual Environ. 2000, 9, 497–503. [Google Scholar] [CrossRef]
- Kalantarov, S.; Riemer, R.; Oron-Gilad, T. Pedestrians’ road crossing decisions and body parts’ movements. Transp. Res. Part F-Traffic Psychol. Behav. 2018, 53, 155–171. [Google Scholar] [CrossRef]
- Fugger, T.F.; Randles Jr, B.C.; Stein, A.C.; Whiting, W.C.; Gallagher, B. Analysis of pedestrian gait and perception-reaction at signal-controlled crosswalk intersections. Pedestr. Bicycl. Transp. Res. 2000, 2000, 20–25. [Google Scholar] [CrossRef]
- Tapiro, H.; Meir, A.; Parmet, Y.; Oron-Gilad, T. Visual Search Strategies of Child-Pedestrians in Road Crossing Tasks. In Proceedings of the Human Factors and Ergonomics Society Europe Chapter 2013 Annual Conference; de Waard, D., Brookhuis, K., Wiczorek, R., di Nocera, F., Brouwer, R., Barham, P., Weikert, C., Kluge, A., Gerbino, W., Toffetti, A., Eds.; HFES: Torino, Italy, October 2013; pp. 119–130. [Google Scholar]
- Geruschat, D.R.; Hassan, S.; Turano, K. Gaze behavior while crossing complex intersections. Optom. Vis. Sci. 2003, 80, 515–528. [Google Scholar] [CrossRef]
- Bos, J.E.; de Vries, S.C.; van Emmerik, M.L.; Groen, E.L. The effect of internal and external fields of view on visually induced motion sickness. Appl. Ergon. 2010, 41, 516–521. [Google Scholar] [CrossRef]
- Field, A.P. Discovering Statistics Using IBM SPSS Statistics, 5th ed.; North American, Ed.; Sage Publications Inc.: Thousand Oaks, CA, USA, 2018. [Google Scholar]
- Landis, J.R.; Koch, G.G. The Measurement of Observer Agreement for Categorical Data. Biometrics 1977, 33, 159–174. [Google Scholar] [CrossRef]
- Castro, S.C.; Strayer, D.L.; Matzke, D.; Heathcote, A. Cognitive workload measurement and modeling under divided attention. J. Exp. Psychol. Hum. Percept. Perform. 2019, 45, 826–839. [Google Scholar] [CrossRef]
- Neider, M.B.; Gaspar, J.G.; McCarley, J.S.; Crowell, J.A.; Kaczmarski, H.; Kramer, A.F. Walking and Talking: Dual-Task Effects on Street Crossing Behavior in Older Adults. Psychol. Aging 2011, 26, 260–268. [Google Scholar] [CrossRef]
- Vieira, E.R.; Lim, H.H.; Brunt, D.; Hallal, C.Z.; Kinsey, L.; Errington, L.; Gonçalves, M. Temporo-spatial gait parameters during street crossing conditions: A comparison between younger and older adults. Gait Posture 2015, 41, 510–515. [Google Scholar] [CrossRef]
- Tapiro, H.; Oron-Gilad, T.; Parmet, Y. The effect of environmental distractions on child pedestrian’s crossing behavior. Saf. Sci. 2018, 106, 219–229. [Google Scholar] [CrossRef]
- Kaber, D.B.; Liang, Y.; Zhang, Y.; Rogers, M.L.; Gangakhedkar, S. Driver performance effects of simultaneous visual and cognitive distraction and adaptation behavior. Transp. Res. Part F-Traffic Psychol. Behav. 2012, 15, 491–501. [Google Scholar] [CrossRef]
- Liang, Y.L.; Lee, J.D. Combining cognitive and visual distraction: Less than the sum of its parts. Accid. Anal. Prev. 2010, 42, 881–890. [Google Scholar] [CrossRef] [PubMed]
- Dommes, A. Street-crossing workload in young and older pedestrians. Accid Anal. Prev. 2019, 128, 175–184. [Google Scholar] [CrossRef] [PubMed]
- Rosenholtz, R.; Li, Y.; Nakano, L. Measuring visual clutter. J. Vis. 2007, 7, 17–22. [Google Scholar] [CrossRef]
- Ashmead, D.H.; Grantham, D.W.; Maloff, E.S.; Hornsby, B.; Nakamura, T.; Davis, T.J.; Pampel, F.; Rushing, E.G. Auditory perception of motor vehicle travel paths. Hum. Factors 2012, 54, 437–453. [Google Scholar] [CrossRef]
- Emerson, R.W.; Sauerburger, D. Detecting Approaching Vehicles at Streets with No Traffic Control. J. Vis. Impair. Blind. 2008, 102, 747–760. [Google Scholar] [CrossRef] [PubMed]
- Stelling-Konczak, A.; Hagenzieker, M.; Commandeur, J.J.; Agterberg, M.J.; van Wee, B. Auditory localisation of conventional and electric cars: Laboratory results and implications for cycling safety. Transp. Res. Part F-Traffic Psychol. Behav. 2016, 41, 227–242. [Google Scholar] [CrossRef]
- Franěk, M.; Režný, L.; Šefara, D.; Cabal, J. Effect of Traffic Noise and Relaxations Sounds on Pedestrian Walking Speed. Int. J. Environ. Res. Public Health 2018, 15, 752. [Google Scholar] [CrossRef]
- Tillman, G.; Strayer, D.; Eidels, A.; Heathcote, A. Modeling cognitive load effects of conversation between a passenger and driver. Atten. Percept. Psychophys. 2017, 79, 1795–1803. [Google Scholar] [CrossRef]
- Zafri, N.M.; Sultana, R.; Himal, M.R.H.; Tabassum, T. Factors influencing pedestrians’ decision to cross the road by risky rolling gap crossing strategy at intersections in Dhaka, Bangladesh. Accid. Anal. Prev. 2020, 142, 105564. [Google Scholar] [CrossRef] [PubMed]
- Mukherjee, D.; Mitra, S. What affects pedestrian crossing difficulty at urban intersections in a developing country? IATSS Res. 2022, 46, 586–601. [Google Scholar] [CrossRef]
- Faria, J.J.; Krause, S.; Krause, J. Collective behavior in road crossing pedestrians: The role of social information. Behav. Ecol. 2010, 21, 1236–1242. [Google Scholar] [CrossRef]
- Franek, M. Environmental Factors Influencing Pedestrian Walking Speed. Percept. Mot. Ski. 2013, 116, 992–1019. [Google Scholar] [CrossRef]
- Fleury, D.; Peytavin, J.F.; Alam, T.; Brenac, T. Excess accident risk among residents of deprived areas. Accid. Anal. Prev. 2010, 42, 1653–1660. [Google Scholar] [CrossRef]
- Montel, M.C.; Elslande, P.; Brenac, T. Categorisation of streets by drivers and associated expectancies: A cognitive analysis of driving activity for safer urban design. Adv. Transp. Stud. 2005, 12, 23–38. [Google Scholar]
- Montel, M.C.; Brenac, T.; Granié, M.A.; Millot, M.; Coquelet, C. Urban Environments, Pedestrian-Friendliness and Crossing Decisions. In Proceedings of the Transportation Research Board 92nd Annual Meeting, Washington, DC, USA, 13–17 January 2013; p. 13. [Google Scholar]
- Ackermann, C.; Beggiato, M.; Bluhm, L.-F.; Low, A.; Krems, J.F. Deceleration parameters and their applicability as informal communication signal between pedestrians and automated vehicles. Transp. Res. Part F Traffic Psychol. Behav. 2019, 62, 757–768. [Google Scholar] [CrossRef]
- Dietrich, A.; Maruhn, P.; Schwarze, L.; Bengler, K. Implicit Communication of Automated Vehicles in Urban Scenarios: Effects of Pitch and Deceleration on Pedestrian Crossing Behavior. In Human Systems Engineering and Design II, Proceedings of the 2nd International Conference on Human System Engineering and Design (IHSED2019): Future Trends and Applications, Cham, Switzerland, 16–18 September 2020; Springer International Publishing: Cham, Switzerland, 2020; pp. 176–181. [Google Scholar]
- Davis, S.J.; Barton, B.K.; Pugliese, B.J.; Lopez, G. The influences of listening and speaking on pedestrians’ assessments of approaching vehicles. Transp. Res. Part F Traffic Psychol. Behav. 2021, 82, 348–358. [Google Scholar] [CrossRef]
- Malone, S.; Brunken, R. Hazard Perception, Presence, and Simulation Sickness-A Comparison of Desktop and Head-Mounted Display for Driving Simulation. Front. Psychol. 2021, 12, 647723. [Google Scholar] [CrossRef] [PubMed]
- Deniaud, C.; Honnet, V.; Jeanne, B.; Mestre, D. The concept of “presence” as a measure of ecological validity in driving simulators. J. Interact. Sci. 2015, 3, 1. [Google Scholar] [CrossRef]
- Bailey, J.H.; Witmer, B.G. Learning and Transfer of Spatial Knowledge in a Virtual Environment. Proc. Hum. Factors Ergon. Soc. Annu. Meet. 1994, 38, 1158–1162. [Google Scholar] [CrossRef]
- Cobb, S.V.G.; Nichols, S.; Ramsey, A.; Wilson, J.R. Virtual reality-induced symptoms and effects (VRISE). Presence-Teleoperators Virtual Environ. 1999, 8, 169–186. [Google Scholar] [CrossRef]
- Kim, J.; Luu, W.; Palmisano, S. Multisensory integration and the experience of scene instability, presence and cybersickness in virtual environments. Comput. Hum. Behav. 2020, 113, 106484. [Google Scholar] [CrossRef]
- Weech, S.; Kenny, S.; Barnett-Cowan, M. Presence and Cybersickness in Virtual Reality Are Negatively Related: A Review. Front. Psychol. 2019, 10, 158. [Google Scholar] [CrossRef]
- Rebenitsch, L. Cybersickness Prioritization and Modeling. Ph.D. Thesis, Michigan State University, East Lansing, MI, USA, 2015. [Google Scholar]
- Slater, M.; Usoh, M.; Steed, A. Taking steps: The influence of a walking technique on presence in virtual reality. ACM Trans. Comput.-Hum. Interact. (TOCHI) 1995, 2, 201–219. [Google Scholar] [CrossRef]
- Psotka, J.; Davinson, S. Cognitive Factors Associated with Immersion in Virtual Environments. In Proceedings of the 1993 Conference on Intelligent Computer-Aided Training and Virtual Environment Technology, Houston, TX, USA, 15 April 1993; Hyde, P.R., Loftin, R.B., Eds.; NASA, Johnson Space Centre: Houston, TX, USA, 1993. [Google Scholar]
- Barfield, W.; Hendrix, C. The effect of update rate on the sense of presence within virtual environments. Virtual Real. 1995, 1, 3–15. [Google Scholar] [CrossRef]
- Caldas, O.I.; Aviles, O.; Rodriguez-Guerrero, C. Effects of Presence and Challenge Variations on Emotional Engagement in Immersive Virtual Environments. IEEE Trans. Neural Syst. Rehabil. Eng. 2020, 28, 1109–1116. [Google Scholar] [CrossRef]
- Marucci, M.; Di Flumeri, G.; Borghini, G.; Sciaraffa, N.; Scandola, M.; Pavone, E.F.; Babiloni, F.; Betti, V.; Aricò, P. The impact of multisensory integration and perceptual load in virtual reality settings on performance, workload and presence. Sci. Rep. 2021, 11, 4831. [Google Scholar] [CrossRef] [PubMed]
- Barton, B.K.; Ulrich, T.; Lew, R. Auditory detection and localization of approaching vehicles. Accid. Anal. Prev. 2012, 49, 347–353. [Google Scholar] [CrossRef] [PubMed]
- Bhagavathula, R.; Williams, B.; Owens, J.; Gibbons, R. The Reality of Virtual Reality: A Comparison of Pedestrian Behavior in Real and Virtual Environments. Proc. Hum. Factors Ergon. Soc. Annu. Meet. 2018, 62, 2056–2060. [Google Scholar] [CrossRef]
- Simpson, G.; Johnston, L.; Richardson, M. An investigation of road crossing in a virtual environment. Accid. Anal. Prev. 2003, 35, 787–796. [Google Scholar] [CrossRef] [PubMed]
- Schieber, H.; Kleinbeck, C.; Pradel, C.; Theelke, L.; Roth, D. A Mixed Reality Guidance System for Blind and Visually Impaired People. In Proceedings of the 2022 IEEE Conference on Virtual Reality and 3D User Interfaces Abstracts and Workshops (VRW), Christchurch, New Zealand, 12–16 March 2022. [Google Scholar]
- Stiefelhagen, H. HIDA: Towards Holistic Indoor Understanding for the Visually Impaired via Semantic Instance Segmentation with a Wearable Solid-State LiDAR Sensor. In Proceedings of the 2021 IEEE/CVF International Conference on Computer Vision Workshops (ICCVW), Montreal, BC, Canada, 11–17 October 2021. [Google Scholar]


| Scenario | Description |
|---|---|
| Baseline 1 | No time pressure, bus arriving after some time |
| Baseline 2 | Time pressure (bus arriving any minute) |
| Traffic flow (2–5 s) | High traffic flow = 2–5 s gaps |
| Traffic flow (5.5–7 s) | Medium traffic flow = 5.5–7 s gaps |
| Traffic flow (7.5–10) | High traffic flow = 7.5–10 s gaps |
| One lane road | One lane, straight road |
| Two-lane road | Two-lane road with two-way traffic |
| T-Junction | T-junction with traffic coming from multiple directions |
| Daylight, good weather | Daytime with good weather and visibility |
| Daylight, poor weather | Daytime, rainy weather and poor visibility |
| Dusk, poor weather | Dusk, rainy weather and poor visibility |
| Visual load < 100 | Low visual load, No. of elements in the scene < 100 |
| Visual load = 100–199 | Medium visual load, No. of elements in the scene = 100–199 |
| Visual load = 200–300 | Medium visual load, No. of elements in the scene = 200–300 |
| Distraction (phone call) | Participants engaged in a simulated phone call |
| Category | Sub-Category | Frequency (N) |
|---|---|---|
| Sex | Male Female | 4 6 |
| Age | 18–24 25–34 35+ | 3 4 3 |
| Driving license | Yes No | 8 2 |
| Scenario | Mean | SD | Min | Max |
|---|---|---|---|---|
| Baseline 1 | 11.17 | 8.63 | 0.00 | 28.33 |
| Traffic flow (7.5–10 s) | 16.65 | 13.97 | 2.08 | 41.39 |
| Baseline 2 | 19.65 | 13.90 | 0.00 | 43.47 |
| Traffic flow (5.5–7 s) | 21.85 | 10.41 | 7.50 | 36.25 |
| Daylight and good weather | 20.59 | 14.51 | 5.14 | 50.69 |
| Traffic flow (2–5 s) | 15.14 | 6.65 | 9.03 | 27.36 |
| One lane road | 30.83 | 14.85 | 8.61 | 47.78 |
| Daylight, poor weather | 28.36 | 14.49 | 9.58 | 53.61 |
| Visual load =100–199 | 34.30 | 13.17 | 23.89 | 64.58 |
| Visual load < 100 | 37.61 | 17.32 | 11.81 | 68.06 |
| Dusk, poor weather * | 38.24 | 24.73 | 11.81 | 86.11 |
| Visual load =200–300 ** | 42.28 | 20.14 | 10.97 | 79.17 |
| Distraction task (phone call) ** | 42.50 | 22.27 | 15.42 | 89.86 |
| Two-lane road *** | 48.61 | 16.77 | 24.86 | 72.22 |
| Junction *** | 57.90 | 19.30 | 38.19 | 73.61 |
| Scenario | Count Mean Scores (SD) | Cumulative Mean Scores (SD) |
|---|---|---|
| Baseline 1 | 2.50 (1.65) | 5.00 (0.94) |
| Baseline 2 | 3.40 (1.58) | 5.31 (0.88) |
| Traffic flow (7.5–10 s) | 2.70 (2.11) | 5.40 (0.76) |
| Traffic flow (5.5–7 s) | 3.30 (2.11) | 5.20 (1.69) |
| Traffic flow (2–5 s) | 2.30 (2.26) | 5.35 (0.88) |
| One lane road | 2.50 (1.65) | 5.00 (0.94) |
| Two-lane road | 3.40 (1.58) | 5.31 (0.88) |
| Junction | 2.70 (2.11) | 5.40 (0.76) |
| Daylight, good weather | 3.30 (2.11) | 5.20 (1.69) |
| Daylight, poor weather | 2.30 (2.26) | 5.35 (0.88) |
| Dusk, poor weather | 2.50 (1.65) | 5.00 (0.94) |
| Visual load < 100 | 3.40 (1.58) | 5.31 (0.88) |
| Visual load = 100–199 | 2.70 (2.11) | 5.40 (0.76) |
| Visual load = 200–300 | 3.30 (2.11) | 5.20 (1.69) |
| Distraction task (Phone call) | 2.30 (2.26) | 5.35 (0.88) |
| Scenario | Crossed the Road (N) | Median and IQR | Mean SD |
|---|---|---|---|
| CIT (s) | Average Crossing Speed (m/s) | ||
| Baseline 1 | 10 | 8.2 (3.8–10.8) | 1.17 (0.17) |
| Baseline 2 | 10 | 3.2 (2.6–3.7) | 1.35 (0.12) |
| Traffic flow (7.5–10 s) | 10 | 4.6 (3.2–8.0) | 1.47 (0.16) |
| Traffic flow (5.5–7 s) | 10 | 5.7 (3.4–9.5) | 1.56 (0.22) |
| Traffic flow (2–5 s) | 10 | 6.4 (6.0–9.8) | 1.77 (0.52) |
| One lane road | 10 | 10.7 (6.9–17.7) | 1.33 (0.31) |
| Two-lane road | 8 | 32.5 (23.4–36.7) | 1.25 (0.08) |
| Junction | 7 | 10.7 (8.5–18.8) | 1.37 (0.51) |
| Daylight, good weather | 10 | 5.7 (5.5–10.2) | 1.54 (0.29) |
| Daylight, poor weather | 10 | 9.3 (5.9–17.8) | 1.50 (0.27) |
| Dusk, poor weather | 10 | 7.5 (5.2–9.7) | 1.37 (0.18) |
| Visual load < 100 | 10 | 8.2 (7.3–15.7) | 1.46 (0.21) |
| Visual load = 100–199 | 10 | 12.3 (8.5–31.2) | 1.31 (0.20) |
| Visual load = 200–300 | 10 | 8.3 (7.6–8.7) | 1.65 (0.55) |
| Distraction task (Phone call) | 10 | 9.8 (8.1–10.1) | 1.45 (0.22) |
| Workload (SIM-TLX) (Lower to Higher ↓) | Crossing Initiation Time (Shorter to Longer ↓) | % Tot Time Gazed at Traffic (Shorter to Longer ↓) |
|---|---|---|
| Baseline 1 | Baseline 2 | Baseline 2 |
| Traffic flow (7.5–10 s) | Traffic flow (7.5–10 s) | Traffic flow (7.5–10 s) |
| Baseline 2 | Traffic flow (5.5–7 s) | Dusk, poor weather |
| Traffic flow (5.5–7 s) | Daylight, good weather | Baseline 1 |
| Daylight and good weather | Traffic flow (2–5 s) | Traffic flow (5.5–7 s) |
| Traffic flow (2–5 s) | Dusk, poor weather | Junction |
| One lane road | Baseline 1 | Daylight and good weather |
| Daylight, poor weather | Visual load < 100 | Visual load =200–300 |
| Visual load =100–199 | Visual load = 200–300 | Distraction task (Phone call) |
| Visual load < 100 | Daylight, poor weather | Traffic flow (2–5 s) |
| Dusk, poor weather | Distraction task (Phone call) | Daylight, poor weather |
| Visual load =200–300 | One lane road | Visual load < 100 |
| Distraction task (phone call) | Junction | One lane road |
| Two-lane road | Visual load = 100–199 | Visual load =100–199 |
| Junction | Two-lane road | Two-lane road |
Disclaimer/Publisher’s Note: The statements, opinions and data contained in all publications are solely those of the individual author(s) and contributor(s) and not of MDPI and/or the editor(s). MDPI and/or the editor(s) disclaim responsibility for any injury to people or property resulting from any ideas, methods, instructions or products referred to in the content. |
© 2023 by the authors. Licensee MDPI, Basel, Switzerland. This article is an open access article distributed under the terms and conditions of the Creative Commons Attribution (CC BY) license (https://creativecommons.org/licenses/by/4.0/).
Share and Cite
Fratini, E.; Welsh, R.; Thomas, P. Ranking Crossing Scenario Complexity for eHMIs Testing: A Virtual Reality Study. Multimodal Technol. Interact. 2023, 7, 16. https://doi.org/10.3390/mti7020016
Fratini E, Welsh R, Thomas P. Ranking Crossing Scenario Complexity for eHMIs Testing: A Virtual Reality Study. Multimodal Technologies and Interaction. 2023; 7(2):16. https://doi.org/10.3390/mti7020016
Chicago/Turabian StyleFratini, Elena, Ruth Welsh, and Pete Thomas. 2023. "Ranking Crossing Scenario Complexity for eHMIs Testing: A Virtual Reality Study" Multimodal Technologies and Interaction 7, no. 2: 16. https://doi.org/10.3390/mti7020016