Article

Principal Preferred Orientation Evaluation of Steel Materials Using Time-of-Flight Neutron Diffraction

1
Materials Sciences Research Center, Japan Atomic Energy Agency, Tokai 319-1195, Ibaraki, Japan
2
ISIS Facility, Rutherford Appleton Laboratory, Harwell Science and Innovation Campus, Didcot OX11 0QX, UK
3
J-PARC Center, Japan Atomic Energy Agency, Tokai 319-1195, Ibaraki, Japan
4
Los Alamos Neutron Science Center (LANSCE), Los Alamos National Laboratory, Los Alamos, NM 87545, USA
5
Graduate School of Science and Engineering, Ibaraki University, Hitachi 316-8511, Ibaraki, Japan
*
Author to whom correspondence should be addressed.
Current address: Centre of Excellence for Advanced Materials, Dongguan 523808, Guangdong, China.
Quantum Beam Sci. 2024, 8(1), 7; https://doi.org/10.3390/qubs8010007
Submission received: 9 August 2023 / Revised: 26 December 2023 / Accepted: 5 January 2024 / Published: 17 January 2024

Abstract

:
Comprehensive information on in situ microstructural and crystallographic changes during the preparation/manufacturing processes of various materials is highly necessary to precisely control the microstructural morphology and the preferred orientation (or texture) characteristics for achieving an excellent strength–ductility–toughness balance in advanced engineering materials. In this study, in situ isothermal annealing experiments with cold-rolled 17Ni-0.2C (mass%) martensitic steel sheets were carried out by using the TAKUMI and ENGIN-X time-of-flight neutron diffractometers. The inverse pole figures based on full-profile refinement were extracted to roughly evaluate the preferred orientation features along three principal sample directions of the investigated steel sheets, using the General Structure Analysis System (GSAS) software with built-in generalized spherical harmonic functions. The consistent rolling direction (RD) inverse pole figures from TAKUMI and ENGIN-X confirmed that the time-of-flight neutron diffraction has high repeatability and statistical reliability, revealing that the principal preferred orientation evaluation of steel materials can be realized through 90° TD ➜ ND (transverse direction ➜ normal direction) rotation of the investigated specimen on the sample stage during two neutron diffraction experiments. Moreover, these RD, TD, and ND inverse pole figures before and after the in situ experiments were compared with the corresponding inverse pole figures recalculated from the MUSASI-L complete pole figure measurement and the HIPPO in situ microstructure evaluation, respectively. The similar orientation distribution characteristics suggested that the principal preferred orientation evaluation method can be applied to the in situ microstructural evolution of bulk orthorhombic materials and spatially resolved principal preferred orientation mappings of large engineering structure parts.

1. Introduction

It is well known that the material properties of polycrystalline solids depend on their single-crystal anisotropic properties and the orientation distribution of the single crystals in the polycrystalline aggregate. Accurate texture measurements can help us to derive and optimize the process history of various thermomechanical treatments [1,2]. Considering that engineering materials usually involve inhomogeneous microstructural characteristics [1,2] due to the heterogeneous deformation and/or the steep temperature gradients and/or composition gradients, bulk texture measurement [3] and in situ preferred orientation evaluation [4,5,6,7] are valuable for elucidating the microstructure/texture evolution process, as well as for achieving the desired strength–ductility–toughness balance.
There were two angle-dispersive neutron diffractometers RESA-2 and MUSASI-L at Japan Research Reactor No.3 (JRR-3)’s guide hall for bulk texture evaluations of metallic materials. However, unlike the recently upgraded WOMBAT neutron diffractometer, with a wide-angle (Δ2θ = 120°), large-area, curved, position-sensitive detector located at the Open-Pool Australian Lightwater Reactor (OPAL) guide hall [8], the pole figure measurement speeds of RESA-2 (with a narrow one-dimensional position-sensitive detector) and MUSASI-L (with a single-tube detector) are very slow and not suitable for in situ time-sliced texture measurements. In view of the new era of stress and texture evaluation techniques involved in various neutron diffraction instruments from the steady-state reactor neutron source at JRR-3, the large spallation neutron source at J-PARC, and the compact neutron source at RANS, these RESA-2 and MUSASI-L instruments have been replaced by the residual stress analyzer RESA at the T2-1 neutron beamline port of JRR-3 in order to improve the cost performance.
To date, the time-of-flight neutron diffraction technique has been widely employed to investigate the hot/warm/room-temperature/cryogenic elastoplastic deformation, transformation, and recrystallization behaviors of metallic materials [9,10,11], and several new neutron diffractometers have been established to meet such rapidly increasing needs [12,13,14]. As a new-generation engineering materials neutron diffractometer, TAKUMI adopts the event-type neutron data recording technique, enabling good neutron diffractogram conversion treatment of the experimental raw data using optimal time-slicing parameters [15] in real time, bridging the bulk microstructure changes and the macroscopic mechanical and physical response evolutions of advanced materials under various extreme conditions, and even identifying the deep relationships among the microstructures, preferred orientations, and mechanical anisotropic properties of complex engineering components through the proper combination of radial collimators and adjustable beam slits. Moreover, the orientation investigation is essential for clarifying the complex microstructural evolution processes involved in several competitive behaviors (e.g., recrystallization and precipitation during the formation process of ultrafine-grained multiphase microstructures).
Moreover, the Z-Rietveld software [16] with built-in March–Dollase functions [17] has been developed to analyze the powder diffraction data obtained from various diffractometers, applicable for both needle- and plate-shaped crystals, which is explicitly correct when the sample has cylindrical symmetry along the diffraction vector and a reasonable approximation when the cylinder’s axis is perpendicular to the diffraction plane [18]. However, the generalized harmonic spherical function [19] has not been incorporated in this software to deal with the more complex preferred orientations during the full neutron diffractogram refinement. Considering that the General Structure Analysis System (GSAS) software [20] with the above two built-in functions is widely used, its application reliability for principal preferred orientation evaluation is worth examining for wider application to various in situ neutron diffraction experiments and principal preferred orientation mappings of large engineering structure parts.
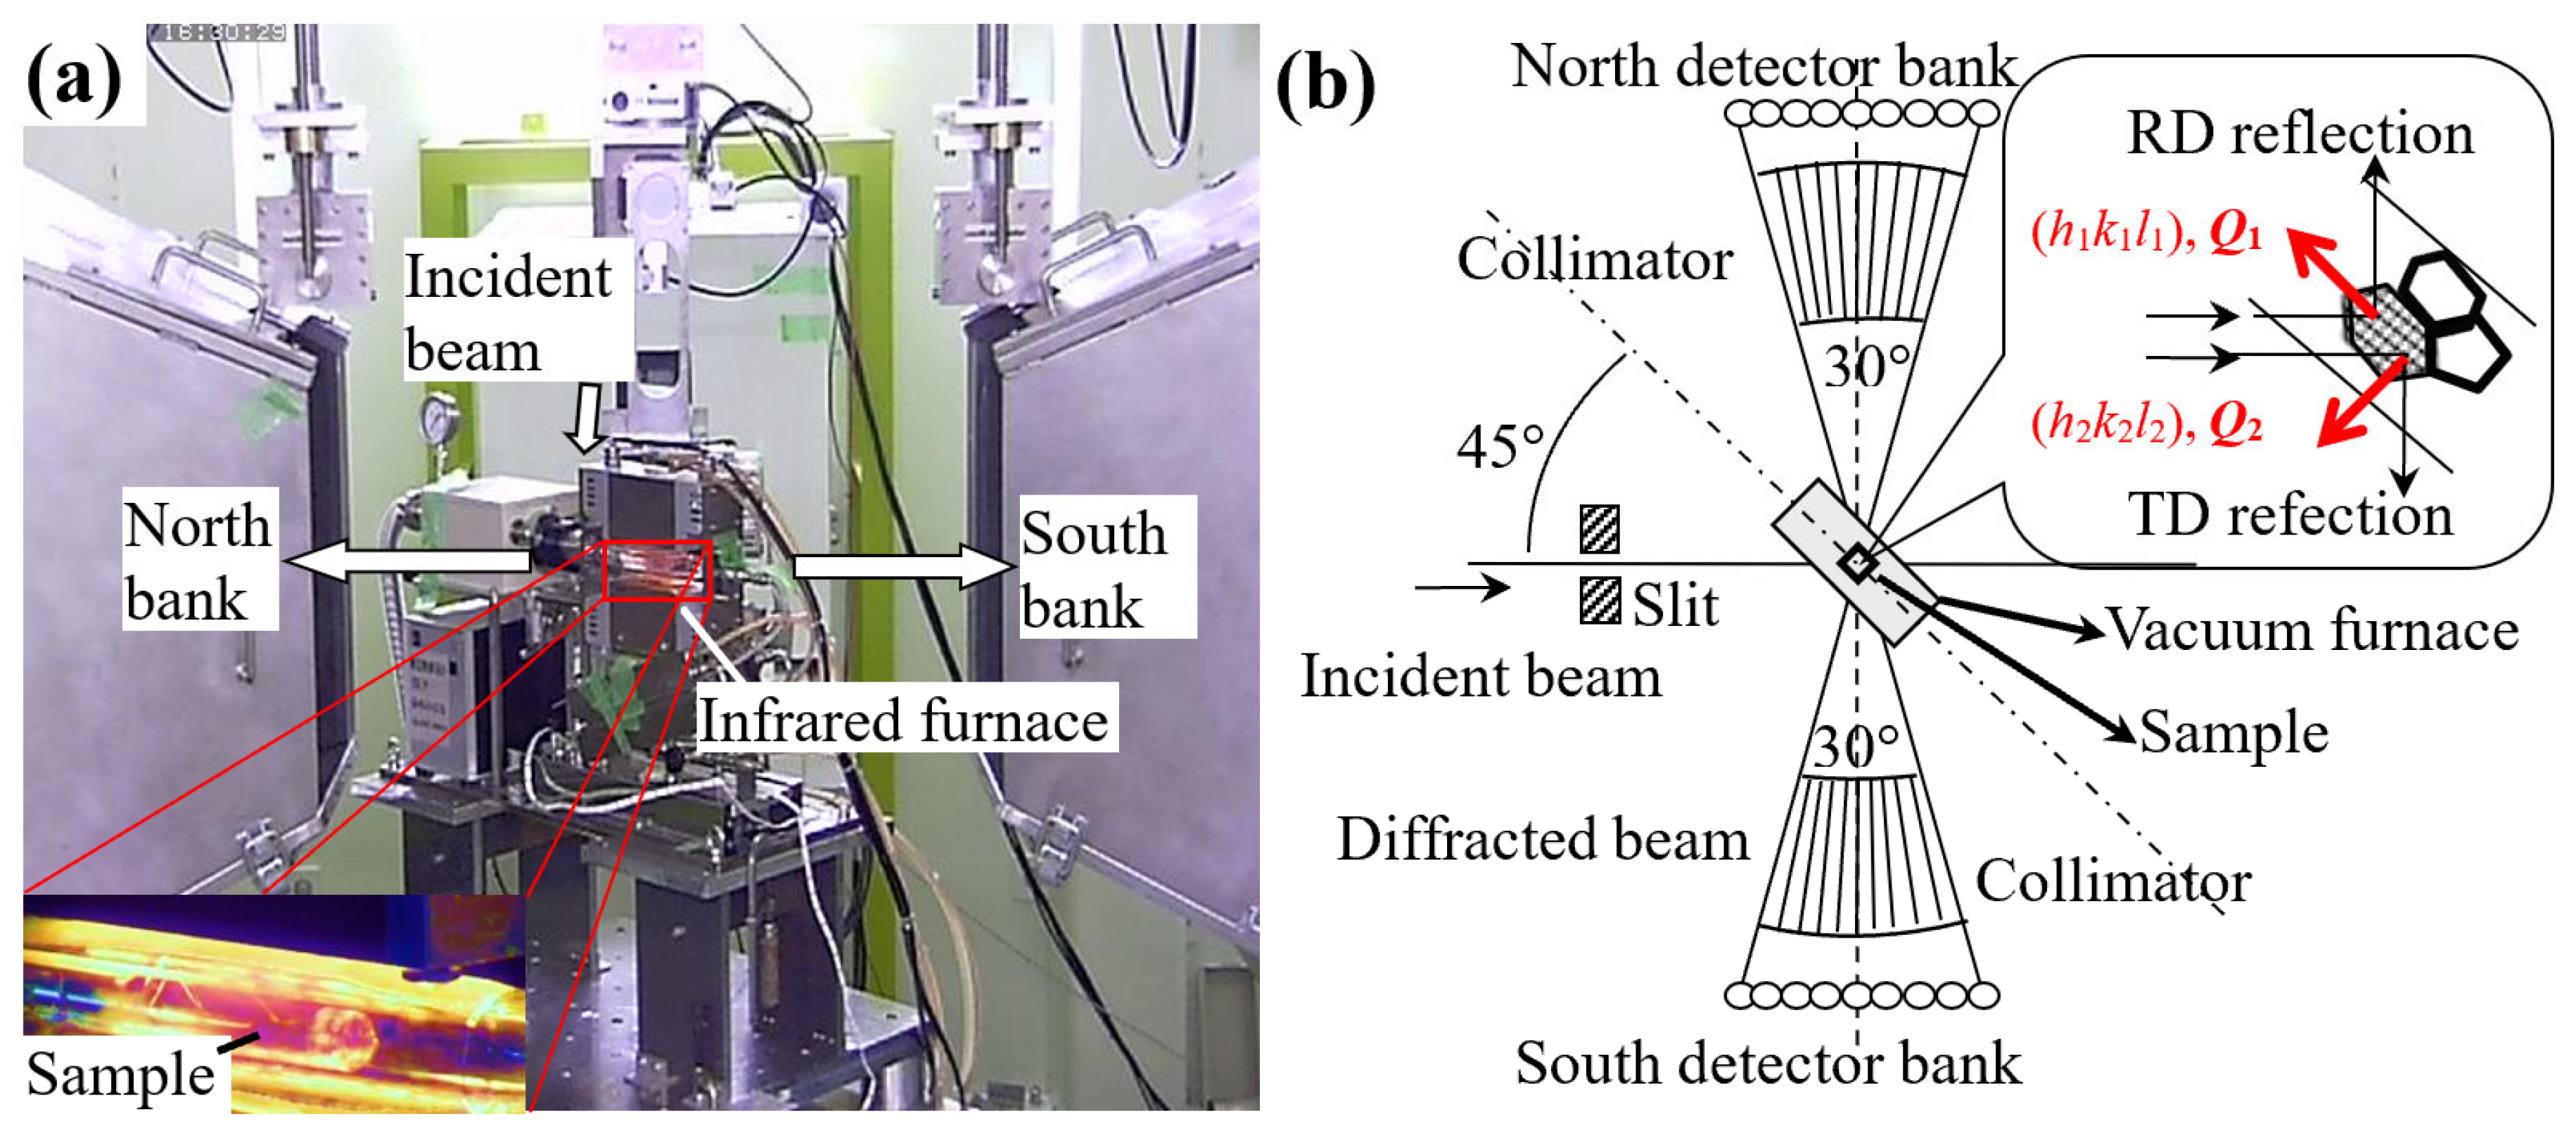
In this study, the in situ neutron diffraction event-type and histogram-type diffractograms of a cold-rolled 17Ni-0.2C (mass%) martensitic steel, as a typical textured material, were acquired from the TAKUMI and ENGIN-X neutron diffractometers, respectively, and the converted histogram-type neutron diffractograms were refined using the GSAS software. The inverse pole figures were extracted to roughly evaluate the preferred orientation features along the triaxial directions of the investigated steel sheets. The complete pole figures before and after the isothermal annealing were measured using the MUSASI-L angle-dispersive neutron diffractometer, and the microstructural changes and texture evolution during the isothermal annealing were measured in situ using the HIPPO time-of-flight neutron diffractometer to further confirm the above technique’s reliability. However, the in situ microstructural evolution will be discussed in detail in another paper on ultrafine-grained multiphase microstructures to clarify the competitive behavior between the static recrystallization of cold-rolled martensite and the static precipitation of austenite during the isothermal annealing.

2. Neutron Instruments and Analysis Method

2.1. Neutron Instruments

The TAKUMI engineering materials neutron diffractometer at J-PARC is equipped with 3600 channels of scintillator detectors with spatial resolutions of 3.0 mm horizontally and 200 mm vertically [21], located at L2 = 2.00 m from the sample center (the secondary flightpath). The north bank (2θ = −90° scattering bank) and the south bank (2θ = +90° scattering bank) cover a 2θ range of −105°~−75° and 75°~105°, respectively, at a vertical angle η range of −16°~16°. The distance from the neutron source target to the sample stage center (the primary flightpath, L1) is 40.00 m, and the pulsed neutron beam is supplied at 25 Hz for a high-intensity neutron beam mode (or 12.5 Hz for a high-resolution neutron beam mode), which enabled us to obtain the neutron diffractogram corresponding to a lattice spacing distance d range of 0.5~2.5 Å (or 0.5~5.0 Å). Figure 1 shows an example sample environment setup of the TAKUMI instrument for in situ isothermal annealing experiments using an infrared furnace.
ENGIN-X is a well-known time-of-flight neutron diffractometer located at the ISIS facility, with the flight paths L1 = 50.0 m and L2 = 1.50 m [22]. Its north and south banks are built with ZnS scintillators in a 3 mm horizontal resolution, covering a 2θ range of 76°~104° and a vertical angle range of −21°~21°. It was built for non-destructive stress evaluation in the research fields of materials science and engineering, including the new welding technologies for airframe manufacturing, the fatigue crack initiation and propagation in composite materials, the thermal cycling of materials used in the power generation industry, the development of strain measurement standards, and so on. It has been also employed to study the microstructural evolution during various thermomechanical controlled processes by using the GSAS full-diffractogram refinement technique.
Unlike the above two engineering materials neutron diffractometers, which have various radial collimators for reliably collecting the local neutron diffraction information of large semi-finished products, the HIPPO neutron diffractometer [23] is a well-known high-intensity powder diffractometer equipped with neutron diffraction detector panels for 2θ = 145, 90, 40° three-dimensional diffraction rings (about 1360 3He tubes) (note: in 2012, neutron detector panels for 2θ = 120 and 60° diffraction rings were added to the upgraded HIPPO to achieve a better stereographic angle coverage with reliable instrumental resolution Δd/d), mostly applying to in situ time-sliced high-pressure and/or crystallographic texture evolutions of various advanced materials.

2.2. Analysis Method

In general, for an arbitrary crystalline grain i in the gauge volume (Figure 1b), there were two lattice planes (hnknln)i and (hsksls)i, perpendicular to one another, to diffract the incident neutrons forward to the north and south banks, respectively, because their diffraction vectors Q1 and Q2 were about 45° from the incident beam direction in the horizontal plane. For all of the crystalline grains (i = 1, 2, 3……) in the gauge volume, these lattice planes (hnknln)i and (hsksls)i changed from the low (hkl)-index planes to the high (hkl)-index planes, with a specific diffraction intensity ratio related to the preferred orientation characteristics of the investigated specimen, as well as to the multiplicity of (hkl)-index reflection, the structure factor, and the Debye–Waller temperature factor [18,19,20]. All of the diffracted neutrons acquired by the two neutron detector banks finally formed the north-bank and south-bank neutron diffractograms, respectively. It should be mentioned that some diffracted neutrons from the high (hkl)-index lattice planes with a lattice plane spacing smaller than dc1 were not easy to distinguish because of the low diffraction intensities and the highly overlapping peaks. In addition, the frequency of neutron pulses also resulted in a limitation on the longest neutron flight time tc2, i.e., there was a specific lattice plane dc2 = htc2/(m⋅(L1 + L2)), where h was the Planck parameter and m was the neutron mass. Here, the crystallographic neutron diffraction characteristics of textured steel materials with a lattice plane spacing between dc1 = 0.5 and dc2 = 2.25 Å were usually taken into consideration.
During the neutron diffraction measurement, unlike the conventional histogram-type data acquisition system, the event-type data acquisition system records the relative time-of-flight neutron information for each detected neutron, including the spallation pulse information, the detector code number, and the position angle. On the base of the event-type neutron diffraction experimental data, the histogram-type neutron diffractograms are freely constructed after measurement [15]. If the obtained neutron diffractograms are not satisfactory, one may construct the histogram-type data again by simply changing the related parameters. The GSAS software [20] and the Materials Analysis Using Diffraction (MAUD) software [24] may be employed to analyze these time-of-flight neutron diffractograms through reading the TAKUMI instrumental parameter file and obtaining the analysis template file for further batch analysis, respectively.
Using the GSAS software together with a built-in generalized spherical harmonic function, the Rietveld method uses the least-squares approach to refine a theoretical line profile until it matches the measured profile [20]. The residual error yioyic from the neutron intensities of the experimental observation (yio) and the refinement calculation (yic) were comprehensively considered through the residual of least-squares refinement Rp and the weighted residual of least-squares refinement Rwp, calculated as follows [20]:
R p = y i o y i c y i o
R w p = w i · y i o y i c 2 w i · y i o 2 1 2
where wi is the weighted coefficient dependent on the wavelength distribution of the incident neutron beam. The general criterion for an acceptable crystal structure diffraction analysis is Rp ≤ 0.10 or Rwp ≤ 0.10, where Rwp is only favorable when the higher-intensity data points are presumed to be more important than the lower-intensity data points.

3. Experimental Procedures

3.1. Sample Preparation

The chemical composition of the investigated steel was 17.2Ni–0.22C in mass%, which was employed in comparison with 18Ni steel for a fundamental investigation of the influence of the addition of carbon on the formation of ultrafine-grained multiphase microstructures toward a higher strength–plasticity–toughness balance. The steel was induction-melted, forged at 1100~900 °C, and groove-rolled into a 38 mm × 38 mm steel bar. A 65 mm × 22 mm × 3.6 mm steel block spark-cut from the volume center of the steel bar was solution-treated again at 1100 °C for 30 min, followed by water quenching and multi-pass cold rolling to achieve a 70% reduction in total thickness. The obtained 1.1 mm thick martensitic steel sheet was spark-cut into small specimens of 10 mm (rolling direction, RD) × 10 mm (transverse direction, TD) and stacked into cubes.

3.2. Experimental Procedures

During the TAKUMI neutron diffraction isothermal annealing experiment at 823 K, these cubic specimens were set up to enable their RDs along the nominal diffraction vector for the north-bank neutron detectors (Q1) and their TDs along the nominal diffraction vector for the south-bank neutron detectors (Q2). The pulsed neutron beam power was about 123 kW (note: the neutron beam power at J-PARC in 2023 is more than 800 kW) in the high-intensity neutron beam mode, covering a lattice spacing range of 0.5~2.5 Å; the incident beam size was 5 mmW × 8 mmH. Considering that the steel specimen was somewhat small, the average crystallographic information from a large gauge volume was necessary to improve the reliability of the orientation information in a short time, so the radial collimators at TAKUMI were not installed in these neutron diffraction experiments. The obtained preferred orientation parameters during the TAKUMI full-diffraction-profile refinement were extracted to draw the corresponding inverse pole figures.
During the similar ENGIN-X in situ neutron diffraction experiment for reference, the stacked specimens were set up through a 90° cubic sample rotation of TD➜ND (transverse direction ➜ normal direction) to enable their RDs along the nominal diffraction vector for the north-bank neutron detectors (Q1) and their NDs (normal directions) along the nominal diffraction vector for the south-bank neutron detectors (Q2). The pulsed neutron beam power was about 158 kW and the incident beam size was 5 mmW × 8 mmH during the in situ isothermal annealing experiment at 823 K. During the GSAS Rietveld full-diffractogram refinement [20], the rolling sample symmetry was employed, and the maximum expansion series of the spherical harmonic function was Lmax = 8.
Before and after the TAKUMI and ENGIN-X in situ neutron diffractions, the ferrite (200) and (211) and the austenite (200) and (220) complete pole figures of these steel specimens were measured by using the MUSASI-L versatile angle-dispersive neutron diffractometer quipped with a pyrolytic graphite (PG) monochromator at the JRR-3 guide hall. According to the classic texture analysis theory [19], two complete pole figures from individual (non-overlapping) diffraction peaks may provide enough crystallographic orientation information to calculate the orientation distribution function of engineering materials with a cubic crystal symmetry; the complete pole figure measurements of ferrite (110) and austenite (111) with overlapping peaks were avoided here. The 20 mmW × 20 mmH incident and diffraction neutron beams at a wavelength of λ = 1.23 Å were employed to ensure that the sample was completely bathed in them at each stereographic angle position. The distance between the φ50 mm (40 mm in the effective detect width) single-tube detector and the sample center was about 600 mm. The incident and diffracted collimators with a selective collimation angle α3 = 0.33° and 0.67°, respectively, were employed. The LaboTex 3.0 texture software with a direct discrete ADC (arbitrary defined cells) method [25] was employed to calculate the inverse pole figures.
Furthermore, an in situ neutron diffraction experiment using the same 17Ni-0.2C (mass%) martensitic steel was carried out on HIPPO with step-by-step sample rotations of ω = 0, 45, 67.5, and 90° to further confirm the principal preferred orientation evaluation through avoiding the possible sample misalignment. The Rietveld texture analysis was carried out using the MAUD software [24], using the generalized spherical harmonic function with the orthorhombic sample symmetry, and the same expansion series of spherical harmonic function Lmax = 8 was employed here for reference.

4. Results and Discussion

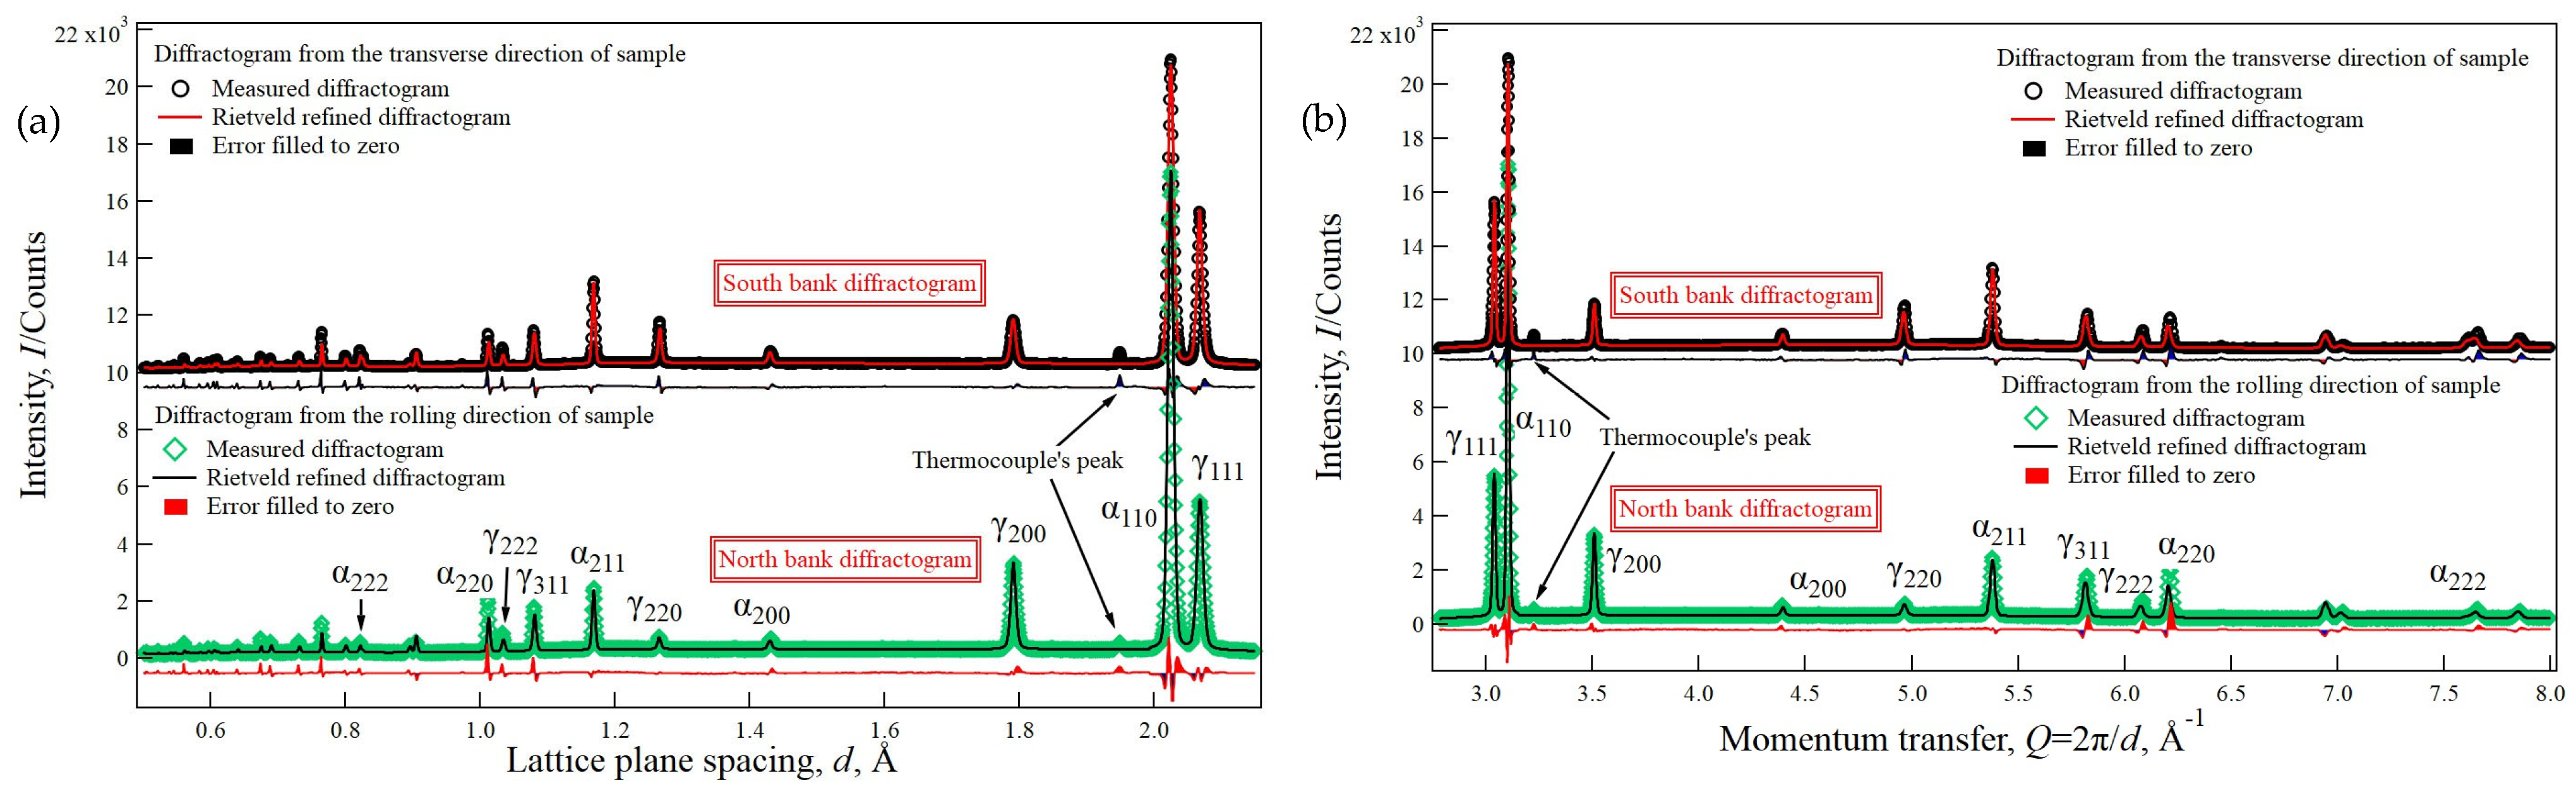
Figure 2 shows examples of TAKUMI’s north-bank and south-bank neutron diffractograms, acquired for 90 min at room temperature after isothermal annealing. Here, these diffractograms were comparably plotted according to the lattice plane spacing (d) and the momentum transfer (Q = 2π/d), respectively. In the north-bank diffractogram, the ferrite-110 peak was much higher than that in the south-bank diffractogram (about 17,000 counts vs. 10,900 counts), while the ferrite-200 peaks had almost the same intensity (about 710 counts vs. 760 counts); on the other hand, the austenite-200 peak in the north-bank diffractogram was higher than that in the south-bank diffractogram (about 3450 counts vs. 1910 counts), while their austenite-111 peaks had almost the same intensity (about 5600 counts vs. 5500 counts). These two different neutron diffractograms of the investigated steel specimens from the north bank and the south bank (corresponding to the RD and the TD, respectively) revealed that a strong texture indeed exists in the steel specimens after isothermal annealing.
Using the GSAS Rietveld refinement considering the orthorhombic sample symmetry, the residual of least-squares refinement Rp and the weighted residual of least-squares refinement Rwp were 0.075/0.079 and 0.116/0.132 for the north-/south-bank neutron profiles, respectively, revealing that the full Rietveld refinement was satisfactory. The mass fraction of austenite was 37.0 ± 0.4% from the north-bank diffractogram, and it was about 39.3 ± 0.8% from the south-bank diffractogram, providing a good reference for the transformation evolution process, although the weak neutron intensities of the high-index diffraction peaks easily led to a large refinement error. The lattice parameter of ferrite was a = 2.86309 ± 0.00004 Å from the north-bank diffractogram and a = 2.86297 ± 0.00004 Å from the south-bank diffractogram. The lattice parameter of austenite was a = 3.58158 ± 0.00008 Å from the north-bank diffractogram and a = 3.58067 ± 0.00008 Å from the south-bank diffractogram. The relative errors in the lattice parameters of ferrite and austenite were about 4.2 × 10⁻⁵ and 2.5 × 10⁻⁴, respectively, resulting from the slight error in position and the possible residual strain.
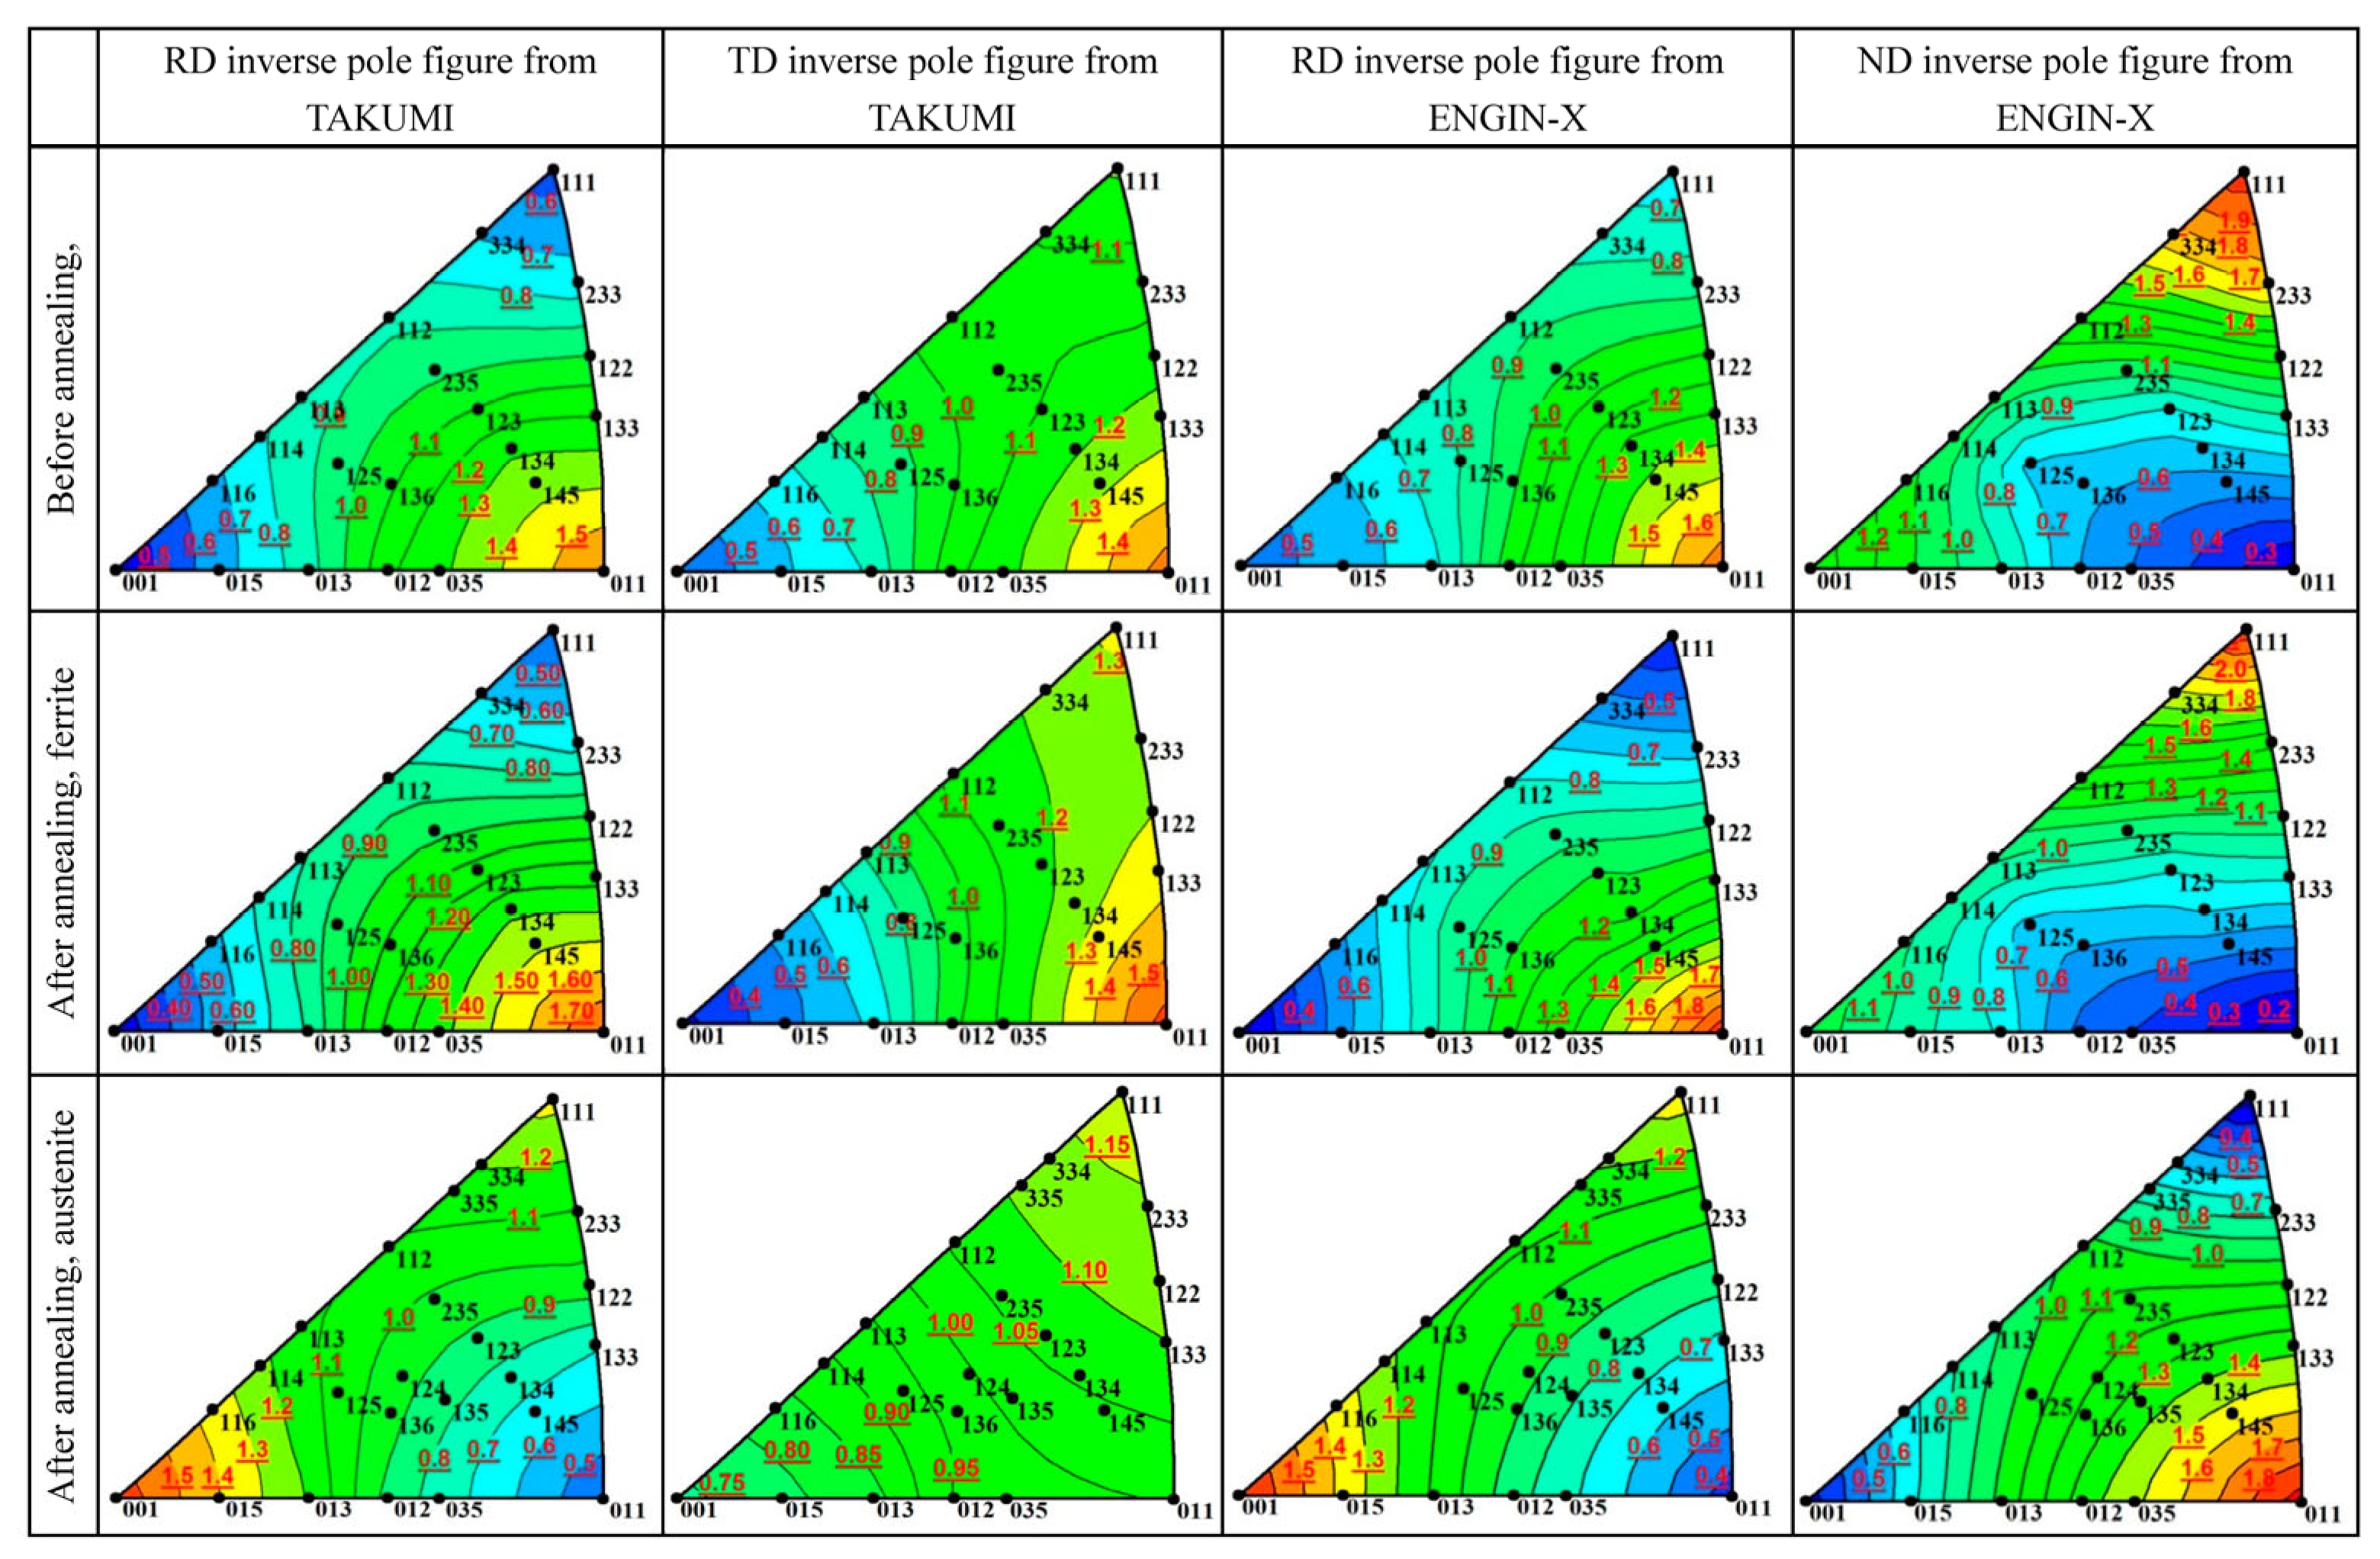
Figure 3 shows the inverse pole figures extracted from the north-bank and south-bank neutron diffractogram refinement. After the GSAS Rietveld analysis including spherical harmonic (ODF) preferred orientations, we can obtain the fitting process list, including the preferred orientation parameter known as “Prfo”, which is the relative intensity ratio of each hkl peak after considering the multiplicity and the structure factor of each hkl reflection. We constructed a data array including the plane coordinate (xhkl, yhkl) of each inverse pole figure orientation hkl and its relative intensity ratio (Prfohkl), and then we can draw a contour plot using Igor Pro 8.0/OriginPro 9.6 or other plotting software for all hkl-index orientations to construct Figure 3, marking all the orientation indices in advance in the figure. It should be noted that more than eight of such hkl peaks are needed for each phase, i.e., the time-of-flight neutron diffractogram should have high neutron counts, and its lattice plane spacing range should be wide enough.
From the RD inverse pole figures from TAKUMI, it was clear that the crystallographic orientations of martensite/ferrite were relatively concentrated from the orientations [100]//RD and [111]//RD to the orientation [011]//RD during the isothermal annealing. For the ENGIN-X neutron diffraction with 90° TD ➜ ND rotation of the investigated specimen relative to the TAKUMI sample orientation, the obtained RD inverse pole figures of martensite/ferrite showed good consistency in the crystallographic orientation distribution, and their texture evolution trend was almost same. Moreover, good consistency was also found in the RD inverse pole figures of precipitated austenite during the isothermal annealing. This suggests that reliable preferred orientation characteristics were obtained from the neutron diffractograms even though the samples were in different orientation setups for the different neutron diffractometers. For the TD inverse pole figures from TAKUMI, it was found that the crystallographic orientations of ferrite concentrated from the orientation [010]//TD to the orientations [101]//TD and [111]//TD; for the ND inverse pole figures from ENGIN-X, it was found that the crystallographic orientations of the ferrite grains became relatively sharper at the orientation [111]//ND due to the static recrystallization. The precipitated austenite showed a principal preferred orientation with [100]//RD, [111]//TD and [110]//ND.
Figure 4 shows the RD, TD, and ND triaxial inverse pole figures calculated from the complete pole figures measured on MUSASI-L. It was evident that for the martensite/ferrite, the orientations [100]//RD and [111]//RD concentrated to the orientation [110]//RD during the isothermal annealing, while the orientations [101]//TD and [111]//ND became much sharper during the isothermal annealing. The precipitated austenite showed a principal preferred orientation with [100]//RD, [111] //TD, and ~[110]//ND. The similar trends of principal preferred orientation distribution evolution suggested that the GSAS full Rietveld refinement together with a spherical harmonic function is very valuable to semi-quantitatively monitor the in situ microstructure/texture evaluation under some extreme environments.
On the other hand, it should be mentioned that there was a clear difference in the absolute orientation distribution intensities of the inverse pole figures obtained from the bulk texture measurements and the time-of-flight neutron diffraction full-diffractogram refinements. The most important reason for this can be attributed to the different analysis methods: the MUSASI-L result using the direct discrete LaboTex ADC method [25] avoids any truncation errors of the expansion series of the spherical harmonic method (note: the background noise information comparable with the real diffraction intensity information of textured materials during a rapid texture measurement is possibly overcalculated, resulting in a low symmetry of the recalculated pole figures), while for the time-of-flight neutron diffraction profile refinement the lower expansion series of the generalized spherical harmonic function (Lmax = 8) enables a full-diffractogram refinement with a relatively smooth preferred orientation evaluation from only one time-of-flight diffractogram, at the expense of larger truncation errors [19,20]. If the multiple time-of-flight neutron diffractograms with wide stereographic angle coverage are employed simultaneously to provide more fruitful orientation information, the available higher maximum expansion series Lmax may enable the full-diffractogram refinement to achieve a high-precision preferred orientation evaluation, including the calculation of pole figures and orientation distribution function.
Moreover, the above difference is also related to the lower stereographic angle resolution of the north-bank and south-bank neutron detectors for each diffractogram, averaged by the large stereographic angle coverage of TAKUMI (and ENGIN-X) in the case of no stereographic angle division of the neutron detector panels. When using the high stereographic angle resolution method involved in our recent TAKUMI time-of-flight neutron diffraction bulk texture measurement technique [26], a better reliability of principal preferred orientation evolution can be achieved for most in situ neutron diffraction materials experiments. Here, during the angle-dispersive neutron diffraction measurements, the neutron diffraction peaks were detected in a small stereographic angle coverage of the single-tube detector (less than 2° × 2° in Δχ and Δφ, defined by the 20 mm × 20 mm beam slits at about 600 mm from the sample center) at each stereographic angle grid of 5° × 5°.
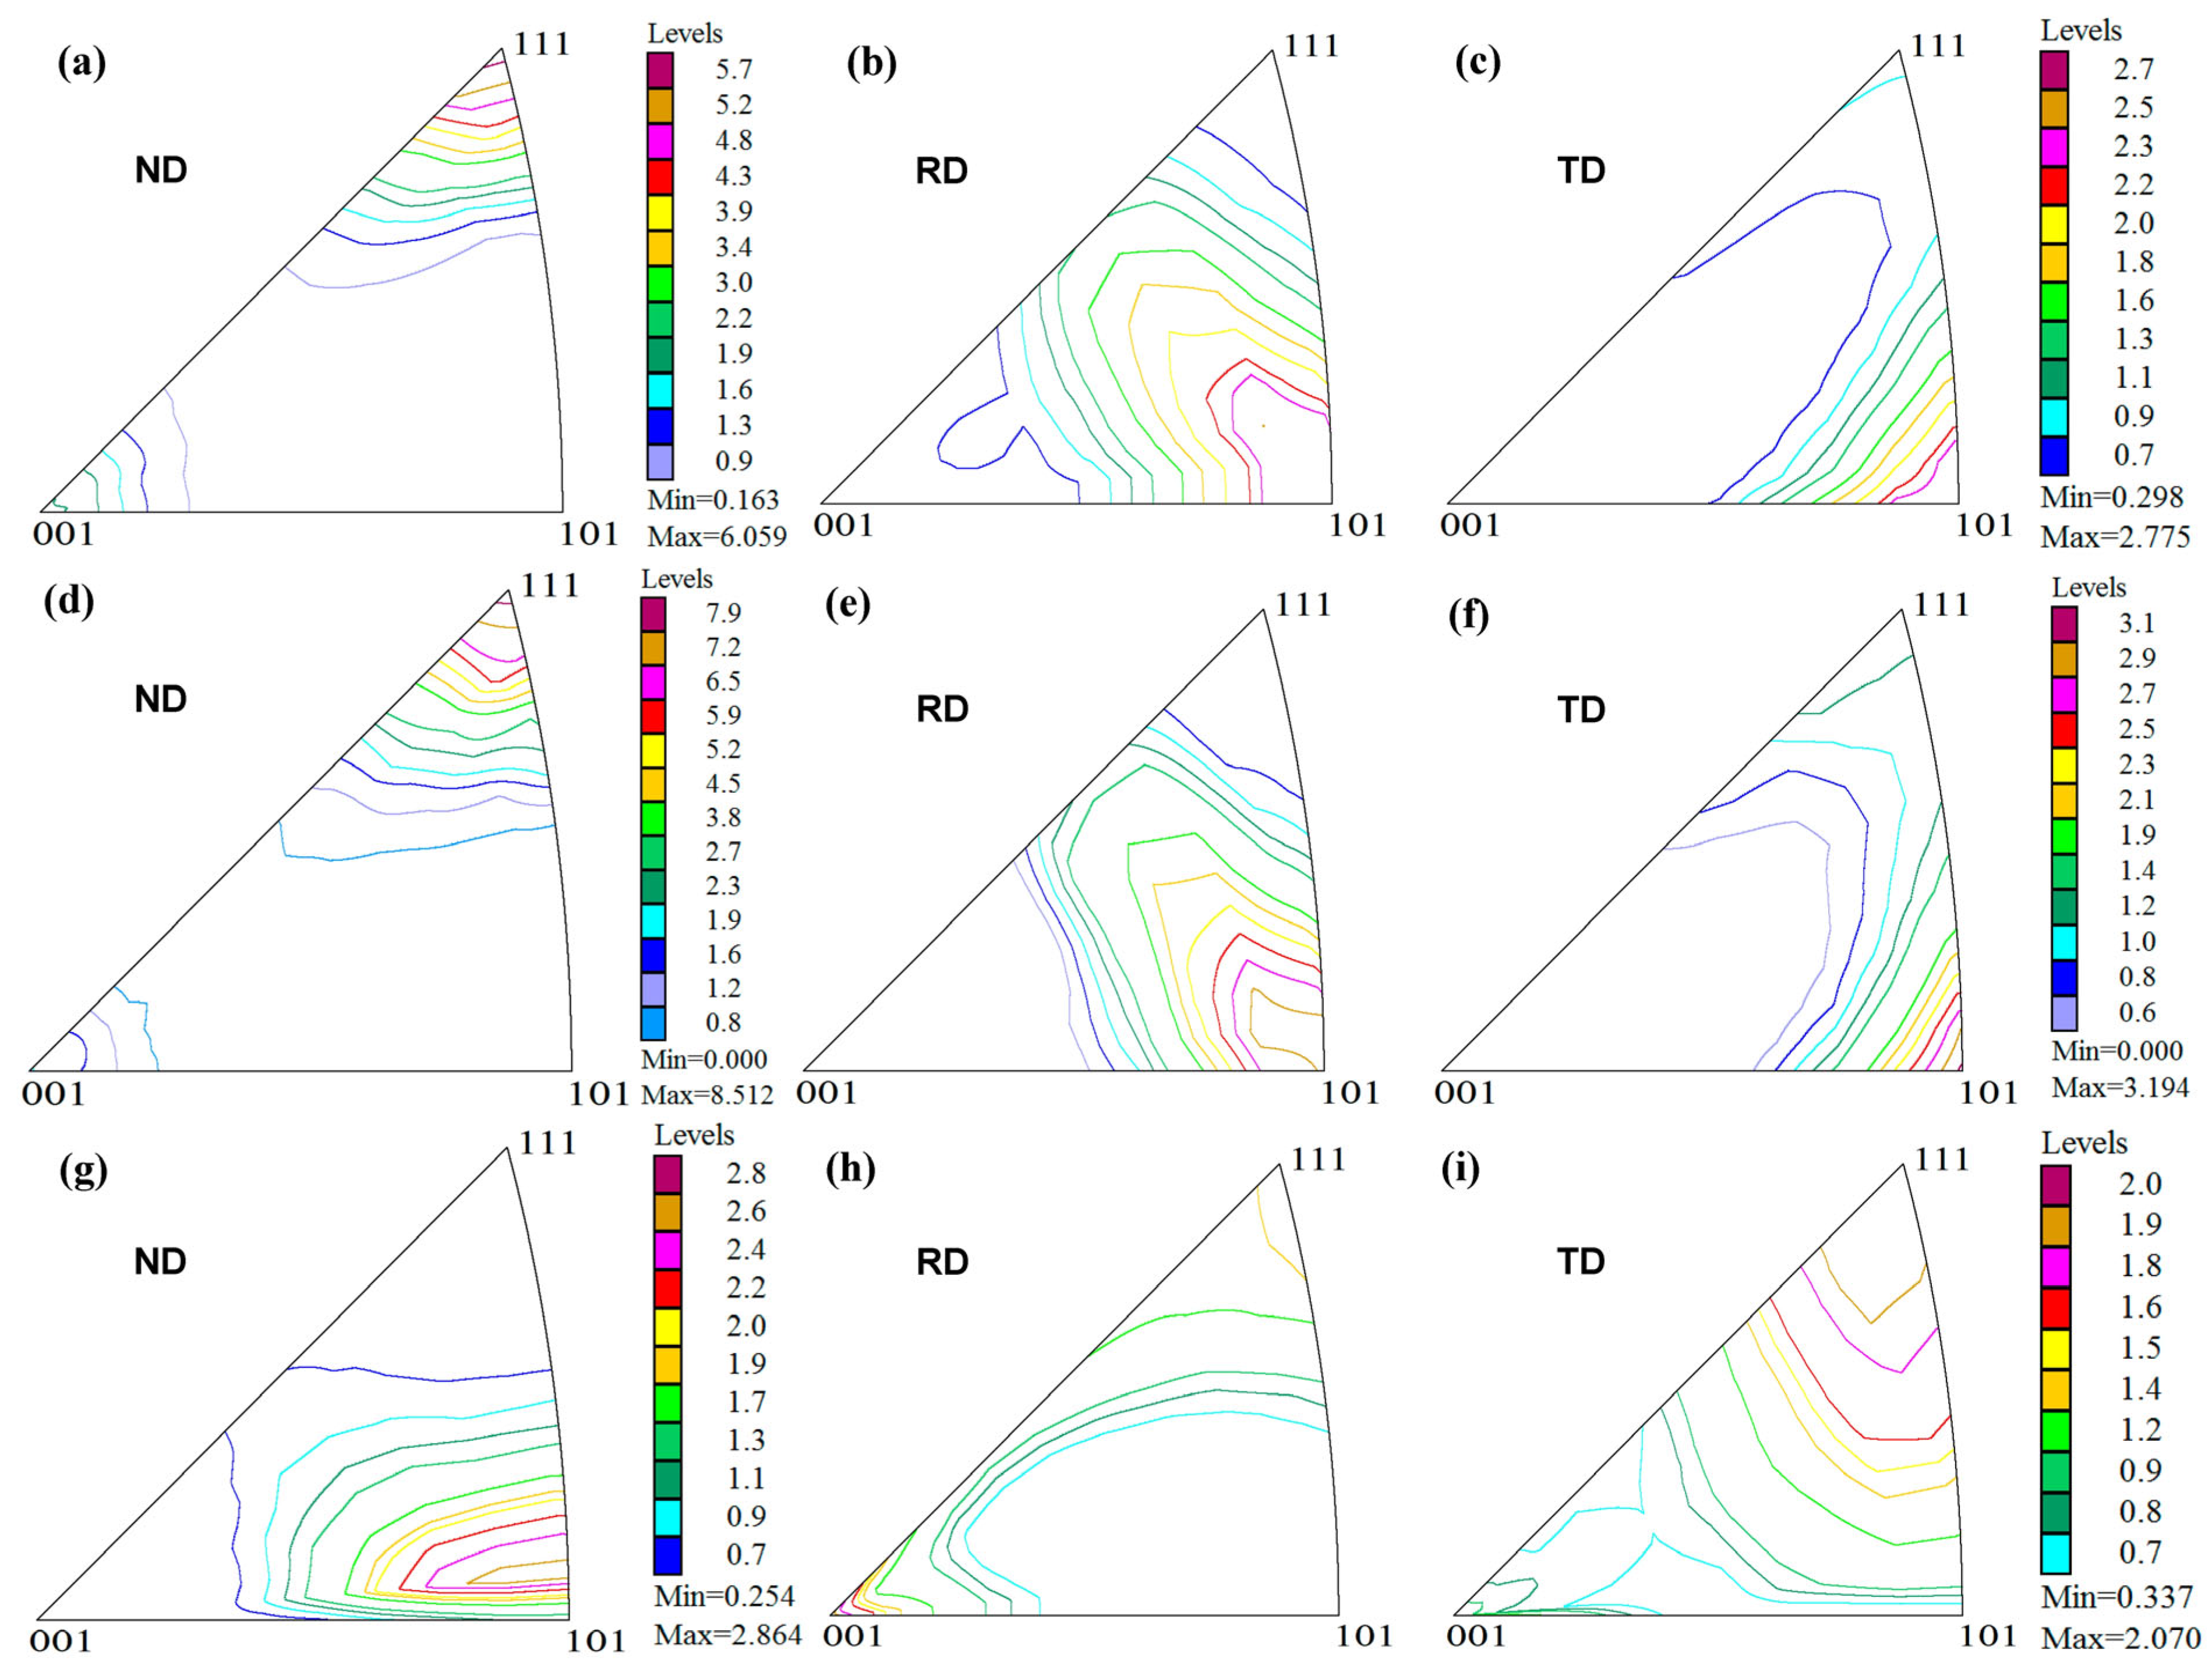
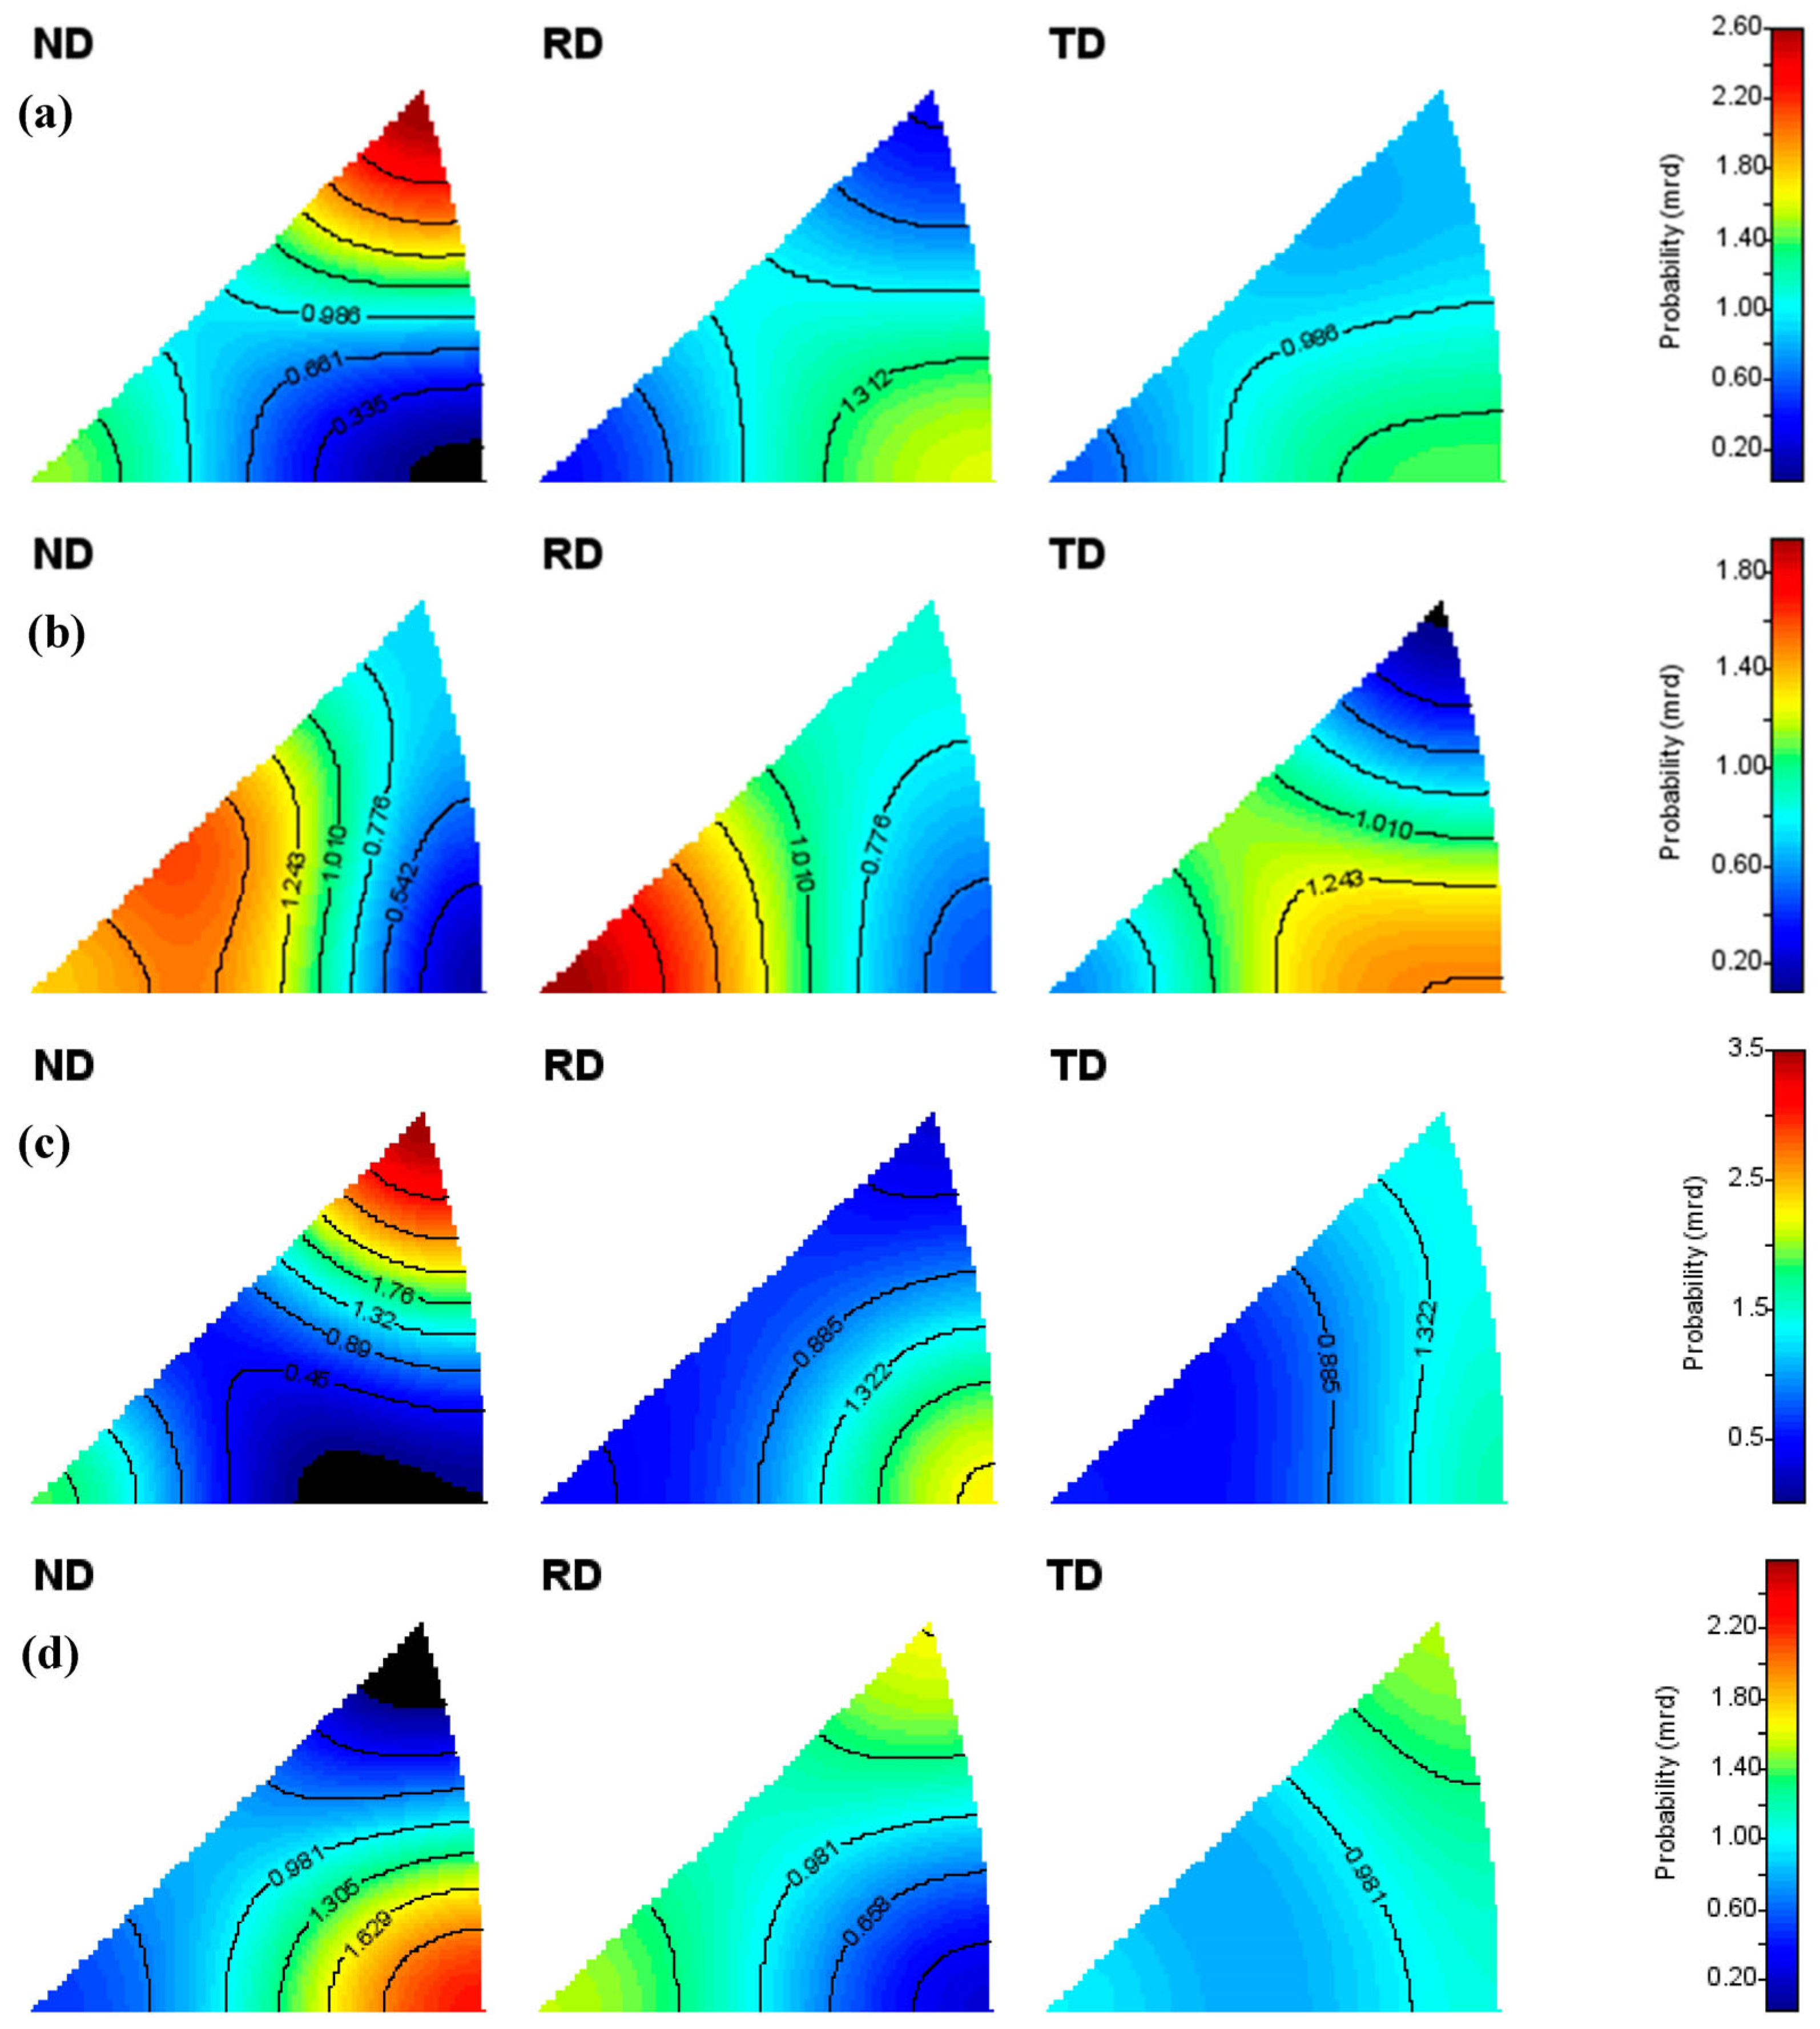
Figure 5 shows the inverse pole figures obtained from the MAUD Rietveld texture analysis before (a,b) and after (c,d) isothermal annealing during the HIPPO in situ neutron diffraction experiment. It can be seen here that there was 1.4 ± 0.7 mass% austenite retained in the cold-rolled martensitic matrix, and its principal preferred orientation characteristics were successfully extracted, confirming that the phase fraction analysis method of retained austenite through the combined Rietveld texture analysis of a textured steel [27] is highly reliable. However, 1~2 full-range time-of-flight neutron diffractograms of textured steels containing 1.4 ± 0.7 mass% retained austenite with a certain principal preferred orientation cannot provide enough reliable diffraction peak intensity information to plot the inverse pole figure of a tiny amount of austenite. After the isothermal annealing, the recrystallized ferrite and the precipitated austenite had a good mass fraction balance, allowing them to be easily evaluated using a full-range time-of-flight neutron diffractogram. Comparing the corresponding inverse pole figures in Figure 3 and Figure 5, a similar orientation distribution can be found in the cold-rolled martensite before isothermal annealing, the recrystallized ferrite, and the precipitated austenite after isothermal annealing. Such similar orientation distribution characteristics among these inverse pole figures suggest that the principal crystallographic orientation evaluation method based on time-of-flight neutron diffractograms can be reasonably applied to in situ crystallographic structure evolution studies of bulk orthorhombic materials and spatially resolved principal preferred orientation mappings of large engineering structure parts.
From the HIPPO combined Rietveld texture analysis, the lattice parameter of ferrite was found to be a = 2.866 ± 0.002 Å, and the lattice parameter of austenite was a = 3.585 ± 0.003 Å, while the phase fraction of precipitated austenite was about 36.8 ± 0.8 mass%. Here, the larger error of the lattice parameters for austenite and ferrite was mostly related to the combined usage of 2θ = 40° detector panels with a low instrumental resolution of Δd/d = 1.8%; for HIPPO, 2θ = 145° detector panels with a high instrumental resolution of Δd/d = 0.37% are usually employed to evaluate the lattice parameters of powder samples [23].
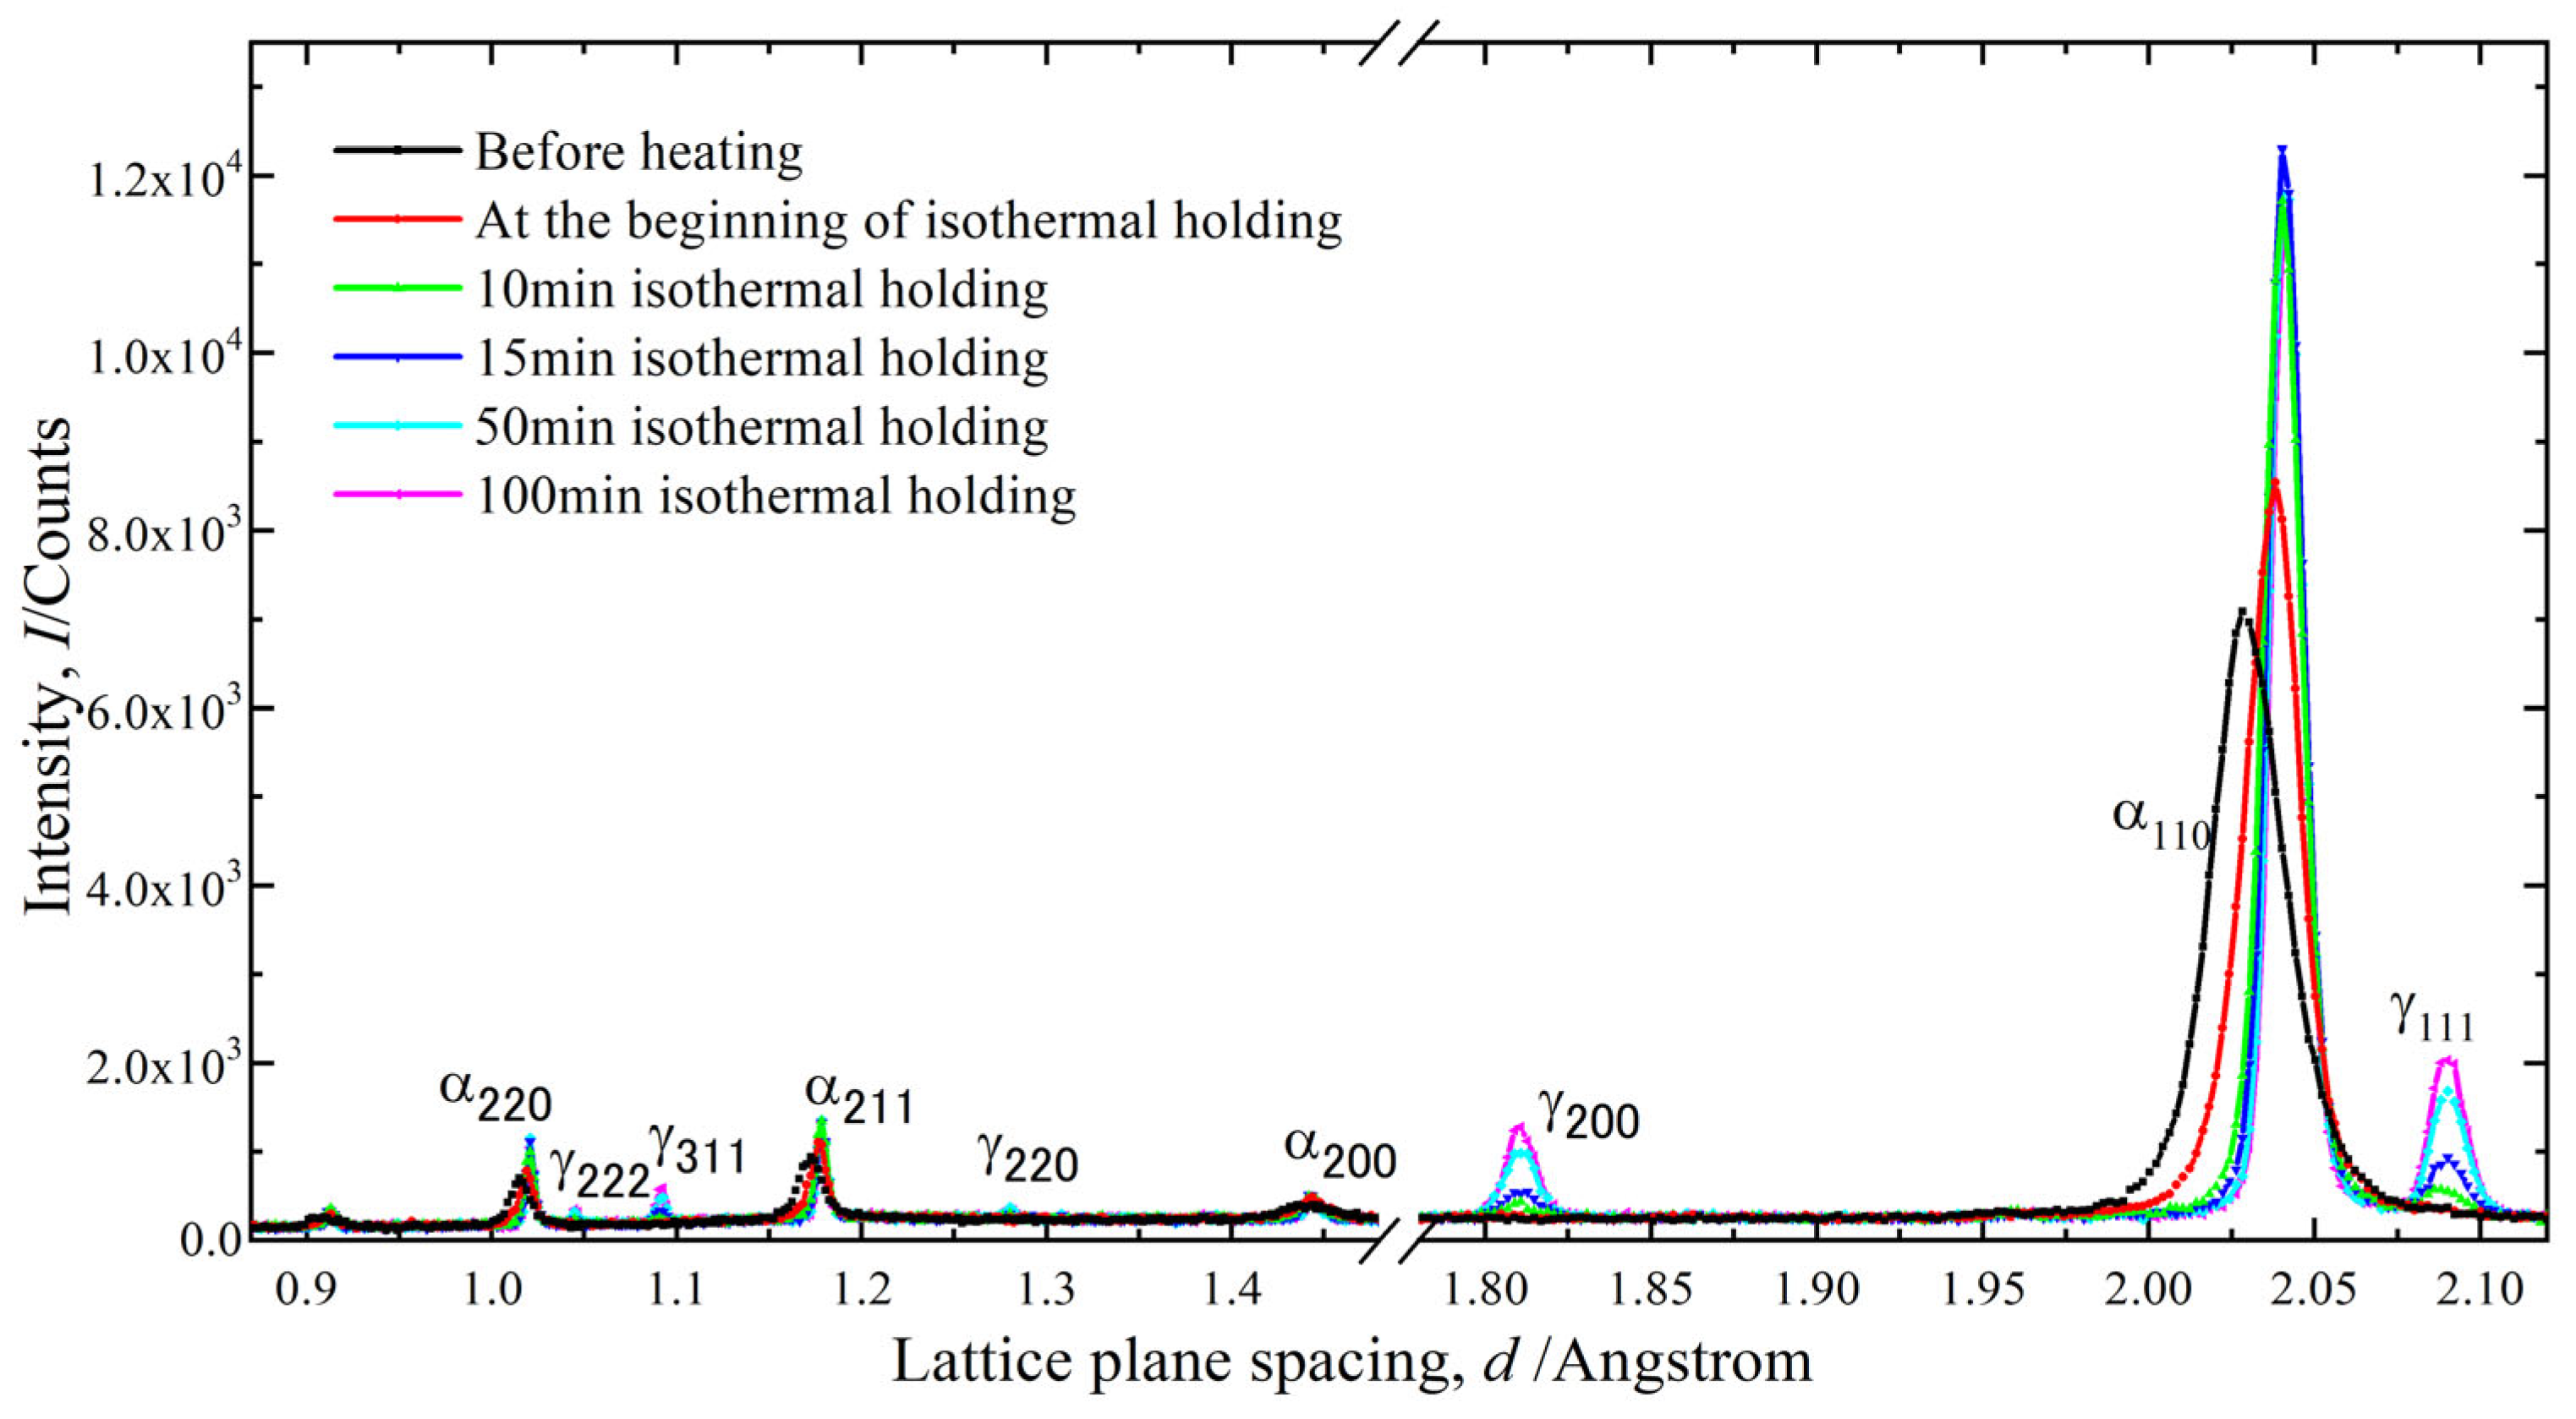
It should be noted that the phase fraction of retained austenite in the cold-rolled 17Ni-0.2C steel before 823 K isothermal annealing was not well analyzed in the GSAS fitting of single TAKUMI/ENGIN-X diffractograms (Figure 6), while the phase fraction of austenite from HIPPO as 1.4 ± 0.7 mass%. This inconsistency is mainly related to the 120 neutron diffractograms from various sample orientations employed together in the HIPPO texture analysis, where some diffractograms form specific orientations that may provide distinguishable austenite peaks for the phase fraction analysis. If we carry out a high-stereographic-resolution texture measurement with TAKUMI and/or ENGIN-X [26,27], we may also obtain a reliable phase fraction of retained austenite. For MUSASI-L, the single-tube neutron detector does not have a high enough angle accuracy to detect the tiny second phase of austenite before in situ neutron diffraction.
Figure 6 primarily reveals the competitive microstructural evolution process to obtain an ultrafine-grained multiphase microstructure involved in (a) the static recrystallization of cold-rolled martensite (with broadened and flattened peaks) to obtain newly recrystallized ferrite grains with sharp and strong ferrite-110 peaks and (b) the static precipitation of austenite grains with sharp and strong austenite-111 peaks.
If the main research purpose is related to the lattice structural changes and stress/strain evolution during an in situ time-of-flight neutron diffraction experiment, the engineering materials neutron diffractometers with high stereographic angles and spatial resolutions [26,27] may be recommended; if the main research purpose is related to the phase fraction and the textures, the powder diffractometers with high stereographic angle coverage [8,23,28,29,30] are3 high-throughput candidates. The complementary use of two kinds of time-of-flight neutron diffractometer may provide us with more fruitful information for a deeper understanding of the microstructure and texture evolutions of advanced multiphase materials in some extreme environments.

5. Conclusions

Based on the GSAS full Rietveld refinement of the TAKUMI north-bank and south-bank neutron diffractograms, the principal preferred orientation analysis was carried out, and the extracted inverse pole figures were compared with those obtained from ENGIN-X neutron diffraction. The consistent RD inverse pole figures before and after the isothermal annealing suggested that the principal preferred orientation evaluation of bulk materials can be realized through 90° TD ➜ ND rotation of the investigated specimen during two neutron diffraction experiments. The same texture evolution trend was confirmed through the bulk texture measurements using the MUSASI-L angle-dispersive neutron diffraction. The similar orientation distribution characteristics suggested that the above inverse pole figure analysis method based on the time-of-flight neutron diffraction full-diffractogram refinement may be applied to monitor the changes in the principal preferred orientation evolution of bulk orthorhombic materials during various in situ neutron diffraction experiments.

Author Contributions

Conceptualization, P.X. and Y.T.; sample preparation, P.X. and Y.T., experimental methodology, P.X.; neutron diffraction experiments, P.X., S.Z., S.H. and S.C.V.; experimental data conversion, P.X., S.Z., S.H. and S.C.V.; neutron diffraction analysis, P.X.; investigation, P.X. and Y.T.; neutron facility resources, P.X., S.Z., S.H. and S.C.V.; writing—original draft preparation, P.X.; writing—review and editing, P.X., S.Z., S.H., Y.T. and S.C.V.; supervision, P.X.; project administration, P.X.; funding acquisition, P.X. and S.H. All authors have read and agreed to the published version of the manuscript.

Funding

This research project was financially supported by the Japan Society for the Promotion of Science (Grant No. 21860090, JP17K06852) and by the MEXT Program: Data Creation and Utilization Type Materials Research and Development (JPMXP1122684766).

Data Availability Statement

Data will be made available on request.

Acknowledgments

The neutron experiment at the Materials and Life Science Experimental Facility of J-PARC was performed under a user program (Proposal No. 2009B0006); the neutron experiment at ISIS was performed under a user program (Proposal No. RB1110337); the neutron experiment at LANL was performed under a user program (Proposal No. 20102030).

Conflicts of Interest

The authors declare no conflicts of interest.

References

  1. Raabe, D. Textures of strip cast and hot-rolled ferritic and austenitic stainless steel. Mater. Sci. Technol. 1995, 11, 461–468. [Google Scholar] [CrossRef]
  2. Liu, M.X.; Song, C.J.; Cui, Z.S. Crystallographic texture evolution and martensite transformation in the strain hardening process of a ferrite-based low density steel. J. Mater. Sci. Technol. 2021, 78, 247–259. [Google Scholar] [CrossRef]
  3. Bunge, H.J. Advantages of neutron diffraction in texture analysis. Textures Microstruct. 1989, 10, 265–307. [Google Scholar] [CrossRef]
  4. Wenk, H.R.; Huensche, I.; Kestens, L. In situ observation of texture changes during phase transformations in ultra-low-carbon steel. Metall. Mater. Trans. A 2007, 38, 261–267. [Google Scholar] [CrossRef]
  5. Gurao, N.P.; Ashkar, A.A.; Suwas, S. Study of texture evolution in metastable β-Ti alloy as a function of strain path and its effect on α transformation texture. Mater. Sci. Eng. A 2009, 504, 24–35. [Google Scholar] [CrossRef]
  6. Brokmeier, H.G.; Gan, W.M.; Randau, C.; Völler, M.; Rebelo-Kornmeier, J.; Hofmann, M. Texture analysis at neutron diffractometer STRESS-SPEC. Nucl. Instrum. Methods Phys. Res. A 2011, 642, 87–92. [Google Scholar] [CrossRef]
  7. Wei, Z.G.; Yang, P.; Gu, X.F.; Onuki, Y.; Sato, S. Transformation textures in pure titanium: Texture memory vs surface effect. Mater. Charact. 2020, 164, 110359. [Google Scholar] [CrossRef]
  8. Xu, P.G.; Liss, K.D. Multiple wavelengths texture measurement using angle dispersive neutron diffraction at WOMBAT. Quantum Beam Sci. 2021, 5, 11. [Google Scholar] [CrossRef]
  9. Daymond, M.R.; Bourke, M.A.M.; Von Dreele, R.B.; Clausen, B.; Lorentzen, T. Use of Rietveld refinement for elastic macrostrain determination and for evaluation of plastic strain history from diffraction spectra. J. Appl. Phys. 1997, 82, 1554–1562. [Google Scholar] [CrossRef]
  10. Sun, Y.N.; Choo, H.; Liaw, P.K.; Lu, Y.L.; Yang, B.; Brown, D.W.; Bourke, M.A.M. Neutron diffraction studies on lattice strain evolution around a crack-tip during tensile loading and unloading cycles. Scr. Mater. 2005, 53, 971–975. [Google Scholar] [CrossRef]
  11. Ma, D.; Stoica, A.D.; An, K.; Yang, L.; Bei, H.; Mills, R.A.; Skorpenske, H.; Wang, X.L. Texture Evolution and Phase Transformation in Titanium Investigated by In Situ Neutron Diffraction. Metall. Mater. Trans. A 2011, 42, 1444–1448. [Google Scholar] [CrossRef]
  12. Matthies, S.; Lutterotti, L.; Wenk, H.R. Advances in texture analysis from diffraction spectra. J. Appl. Crystallogr. 1997, 30, 31–42. [Google Scholar] [CrossRef]
  13. Wang, X.L. Conceptual Design of the SNS Engineering Diffractometer; SNS Report No. IS-1.1.8.2-6035-RE-A-00; Oak Ridge National Laboratory: Oak Ridge, TN, USA, 2000.
  14. Kockelmann, W.; Chapon, L.C.; Radaelli, P.G. Neutron texture analysis on GEM at ISIS. Phys. B 2006, 385–386, 639–643. [Google Scholar] [CrossRef]
  15. Ito, T.; Nakatani, T.; Harjo, S.; Arima, H.; Abe, J.; Aizawa, K.; Moriai, A. Application software development for the engineering materials diffractometer, TAKUMI. Mater. Sci. Forum 2010, 652, 238–242. [Google Scholar] [CrossRef]
  16. Oishi, R.; Yonemura, M.; Nishimaki, Y.; Torii, S.; Hoshikawa, A.; Ishigaki, T.; Morishima, T.; Mori, K.; Kamiyama, T. Rietveld analysis software for J-PARC. Nucl. Instr. Methods Phys. Res. A 2009, 600, 94–96. [Google Scholar] [CrossRef]
  17. Dollase, W.A. Correction of intensities for preferred orientation in powder diffractometry—Application of the March model. J. Appl. Crystallogr. 1986, 19, 267–272. [Google Scholar] [CrossRef]
  18. Von Dreele, R.B. Quantitative texture analysis by Rietveld refinement. J. Appl. Crystallogr. 1997, 30, 517–525. [Google Scholar] [CrossRef]
  19. Bunge, H.J. Texture Analysis in Materials Science; Butterworths: London, UK, 1982. [Google Scholar]
  20. Larson, A.C.; Von Dreele, R.B. General Structure Analysis System (GSAS); Los Alamos National Laboratory Report LAUR 86-748; The Regents of the University of California: Oakland, CA, USA, 2004. [Google Scholar]
  21. Harjo, S.; Moriai, A.; Torii, S.; Suzuki, H.; Suzuya, K.; Morii, Y.; Arai, M.; Tomota, Y.; Akita, K.; Akiniwa, Y. Design of engineering diffractometer at J-PARC. Mater. Sci. Forum 2006, 524–525, 199–204. [Google Scholar] [CrossRef]
  22. Haynes, R.; Paradowska, A.M.; Chowdhury, M.A.H.; Goodway, C.M.; Done, R.; Kirichek, O.; Oliver, E.C. An inert-gas furnace for neutron scattering measurements of internal stresses in engineering materials. Meas. Sci. Technol. 2012, 23, 047002. [Google Scholar] [CrossRef]
  23. Wenk, H.R.; Lutterotti, L.; Vogel, S.C. Texture analysis with the new HIPPO TOF diffractometer. Nucl. Instrum. Methods Phys. Res. A 2003, 515, 575–588. [Google Scholar] [CrossRef]
  24. Lutterotti, L.; Matthies, S.; Wenk, H.R.; Schultz, A.S.; Richardson, J.W.J. Combined texture and structure analysis of deformed limestone from time-of-flight neutron diffraction spectra. J. Appl. Phys. 1997, 81, 594–600. [Google Scholar] [CrossRef]
  25. Pawlik, K.; Pospiech, J.; Lücke, K. The ODF approximation from pole figures with the aid of the ADC method. Textures Microstruct. 1991, 14–18, 25–30. [Google Scholar] [CrossRef]
  26. Xu, P.G.; Harjo, S.; Ojima, M.; Suzuki, H.; Ito, T.; Gong, W.; Vogel, S.C.; Inoue, J.; Tomota, Y.; Aizawa, K.; et al. High stereographic resolution texture and residual stress evaluation using time-of-flight neutron diffraction. J. Appl. Crystallogr. 2018, 51, 746–760. [Google Scholar] [CrossRef]
  27. Xu, P.G.; Tomota, Y.; Arakaki, Y.; Harjo, S.; Sueyoshi, H. Evaluation of austenite volume fraction in TRIP steel sheets using neutron diffraction. Mater. Charact. 2017, 127, 104–110. [Google Scholar] [CrossRef]
  28. Onuki, Y.; Hoshikawa, A.; Sato, S.; Ishigaki, T.; Tomida, T. Quantitative phase fraction analysis of steel combined with texture analysis using time-of-flight neutron diffraction. J. Mater. Sci. 2017, 52, 11643–11658. [Google Scholar] [CrossRef]
  29. Mori, M.; Yamanaka, K.; Onuki, Y.; Sato, S.; Chiba, A. Analysis of hierarchical microstructural evolution in electron beam powder bed fusion Ti–6Al–4V alloys via time-of-flight neutron diffraction. Addit. Manuf. Let. 2022, 3, 100053. [Google Scholar] [CrossRef]
  30. Li, Q.; Onuki, Y.; Ahadi, A.; Sun, Q.P. Large tunable thermal expansion in ferroelastic alloys by stress. Acta Mater. 2022, 240, 118350. [Google Scholar] [CrossRef]
Figure 1. (a) General view and (b) instrumental distribution of the TAKUMI time-of-flight neutron diffractometer during in situ neutron diffraction measurements.
Qubs 08 00007 g001
Figure 2. North-bank and south-bank time-of-flight neutron diffractograms and their Rietveld-refined results obtained after the TAKUMI in situ neutron diffraction experiment: (a) lattice plane spacing, where the low (hkl)-index lattice planes with large lattice spacing are usually paid more attention during rapid preferred orientation/texture measurement in the real space; (b) momentum transfer, usually involved in the calculation of the orientation distribution function in the reciprocal space.
Qubs 08 00007 g002
Figure 3. Inverse pole figures before and after the in situ neutron diffraction experiments, extracted from the north-bank and south-bank time-of-flight neutron diffractograms of TAKUMI and ENGIN-X: before annealing, cold-rolled martensite; after annealing, statically recrystallized ferrite and precipitated austenite. The red underlined text in the inverse pole figures is employed for the orientation distribution intensity to mark the contour lines, where 1.0 is for random, >1.0 for higher orientation distribution intensity and <1.0 for lower orientation distribution intensity.
Qubs 08 00007 g003
Figure 4. Inverse pole figures (ac) before and (di) after the in situ neutron experiments, calculated from the complete pole figures measured on MUSASI-L: (a) ND inverse pole figure of cold-rolled martensite; (b) RD inverse pole figure of cold-rolled martensite; (c) TD inverse pole figure of cold-rolled martensite; (d) ND inverse pole figure of statically recrystallized ferrite; (e) RD inverse pole figure of statically recrystallized ferrite; (f) TD inverse pole figure of statically recrystallized ferrite; (g) ND inverse pole figure of precipitated austenite; (h) RD inverse pole figure of precipitated austenite; (i) TD inverse pole figure of precipitated austenite.
Qubs 08 00007 g004
Figure 5. Inverse pole figures (a,b) before and (c,d) after the HIPPO in situ neutron experiment, obtained from MAUD Rietveld texture analysis: (a) cold-rolled martensite and (b) retained austenite (phase fraction: 1.4 ± 0.7 mass%); (c) recrystallized ferrite and (d) precipitated austenite (36.8 ± 0.8 mass%).
Qubs 08 00007 g005
Figure 6. Change in the ENGIN-X time-of-flight neutron diffractograms obtained along the rolling direction of 17Ni-0.2C steel before and during 823 K isothermal holding.
Qubs 08 00007 g006
Disclaimer/Publisher’s Note: The statements, opinions and data contained in all publications are solely those of the individual author(s) and contributor(s) and not of MDPI and/or the editor(s). MDPI and/or the editor(s) disclaim responsibility for any injury to people or property resulting from any ideas, methods, instructions or products referred to in the content.

