
Strength of Composite Columns Consists of Welded Double CF Sigma-Sections Filled with Concrete—An Experimental Study


Abstract
:1. Introduction
2. Materials and Methods
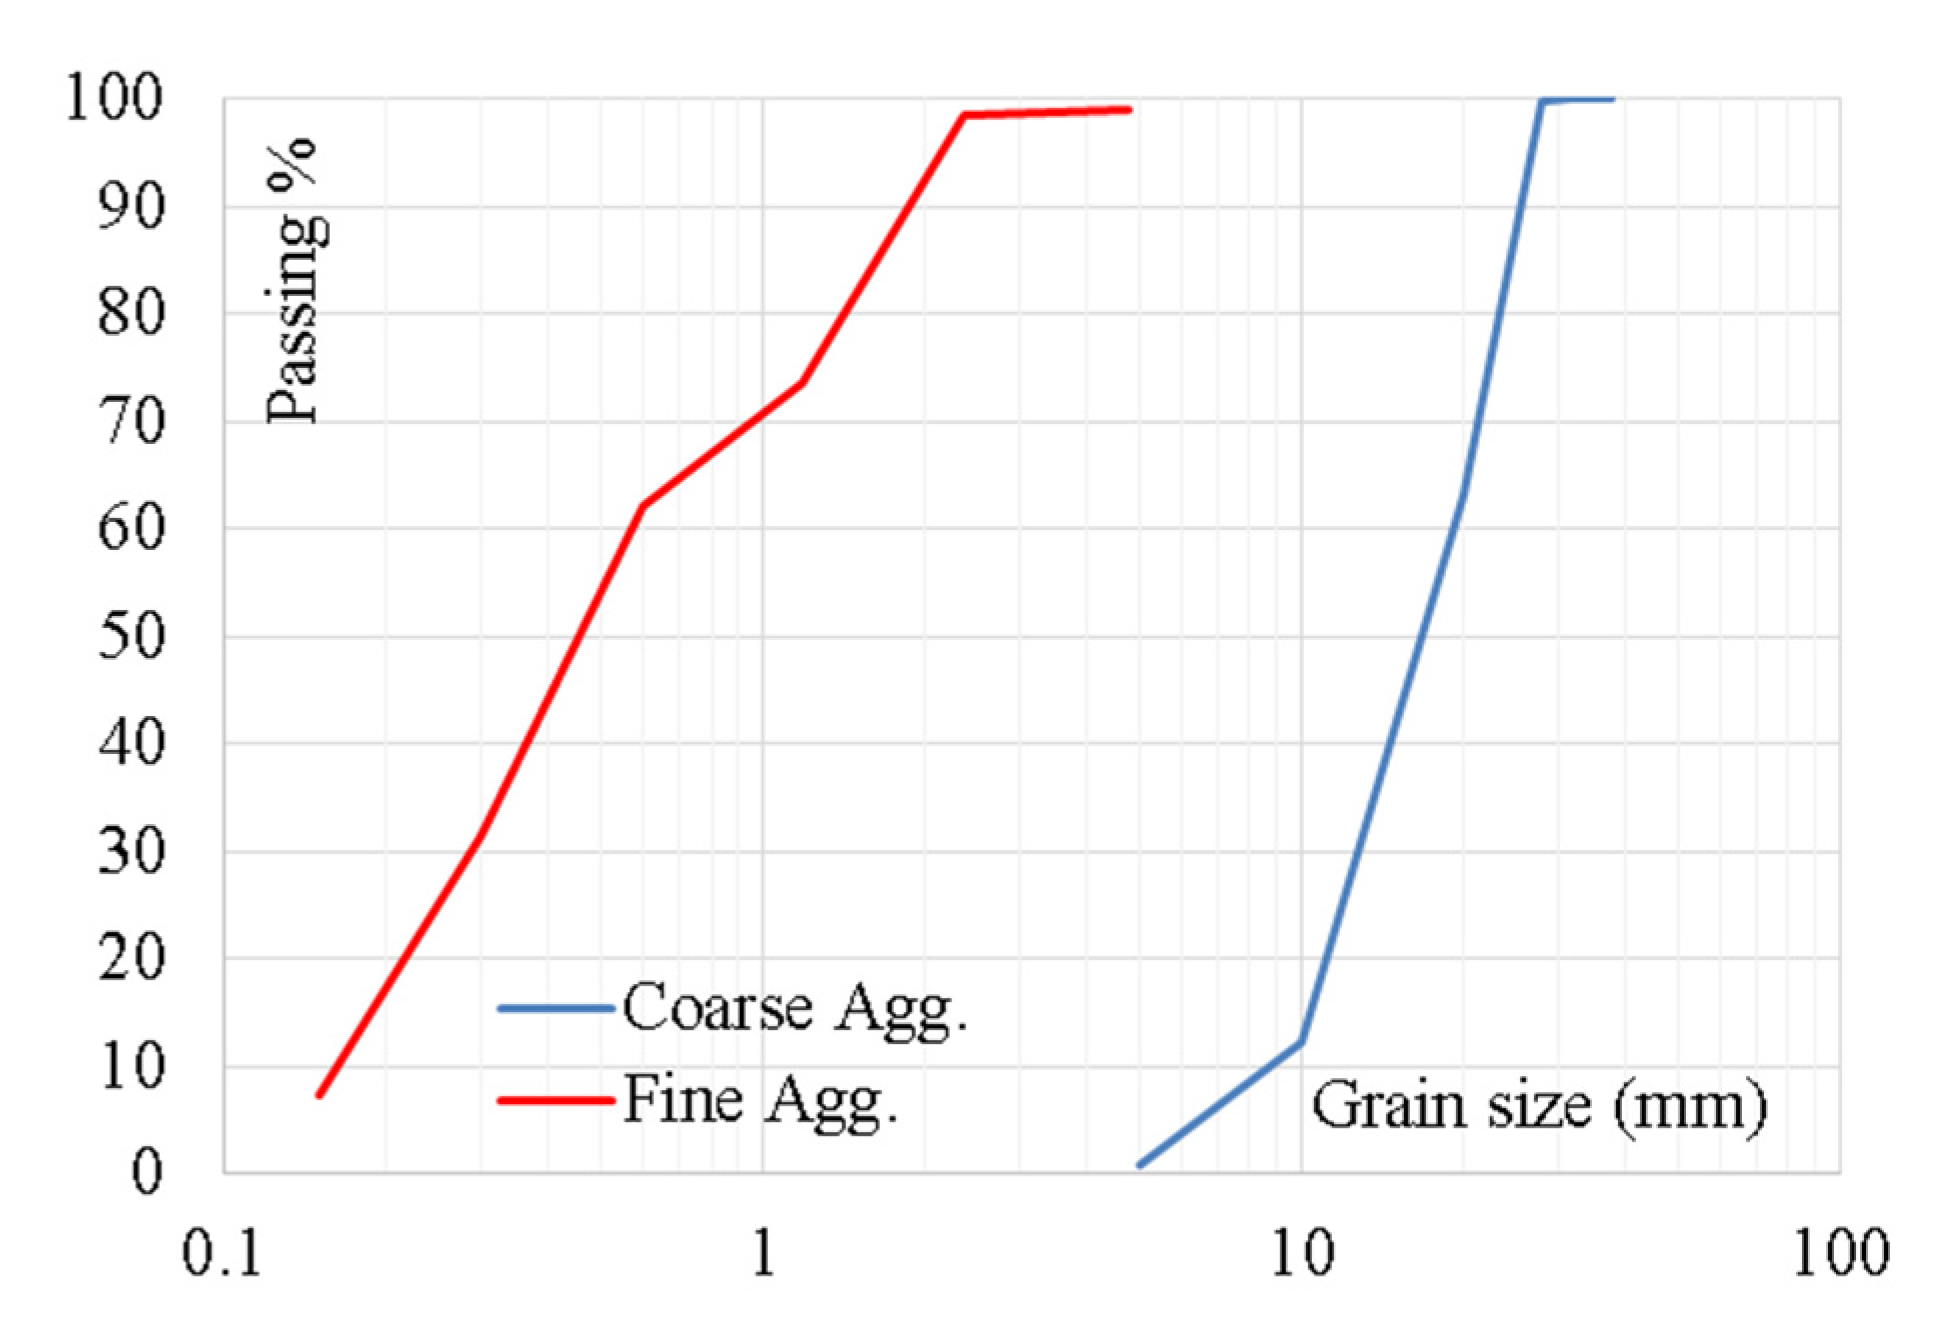
2.1. Concrete
2.2. Steel
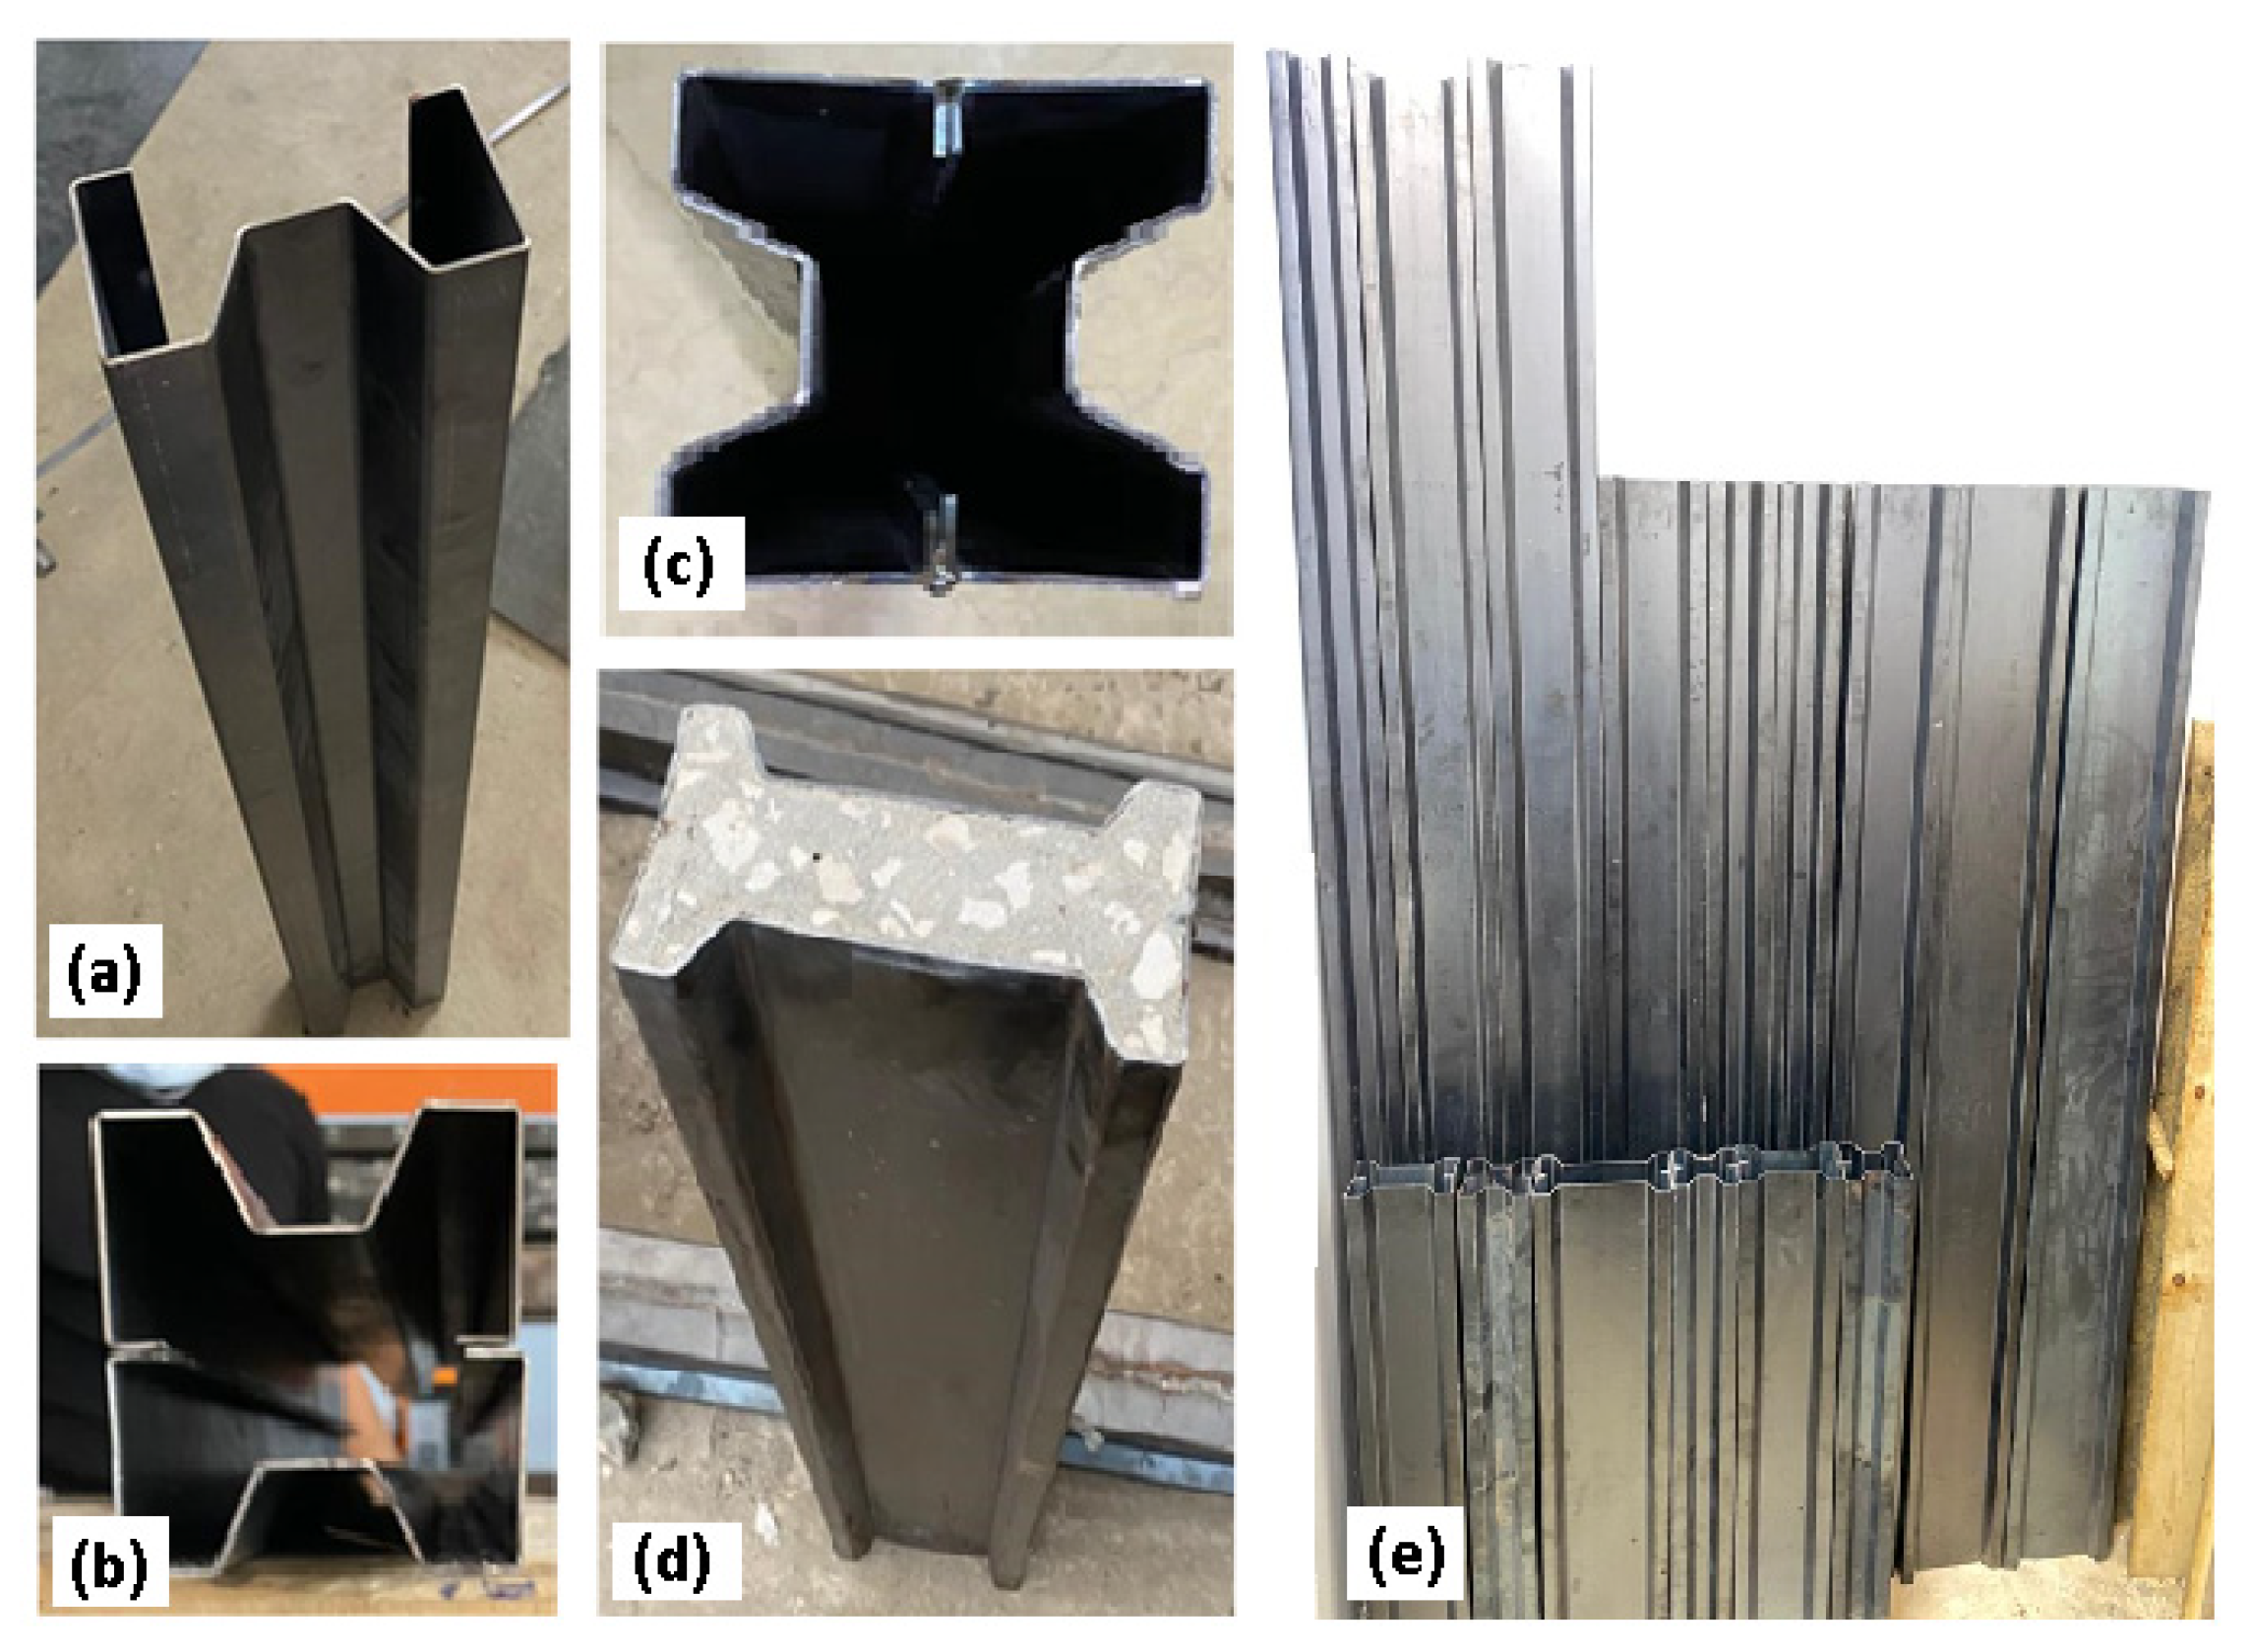
2.3. Test Specimens
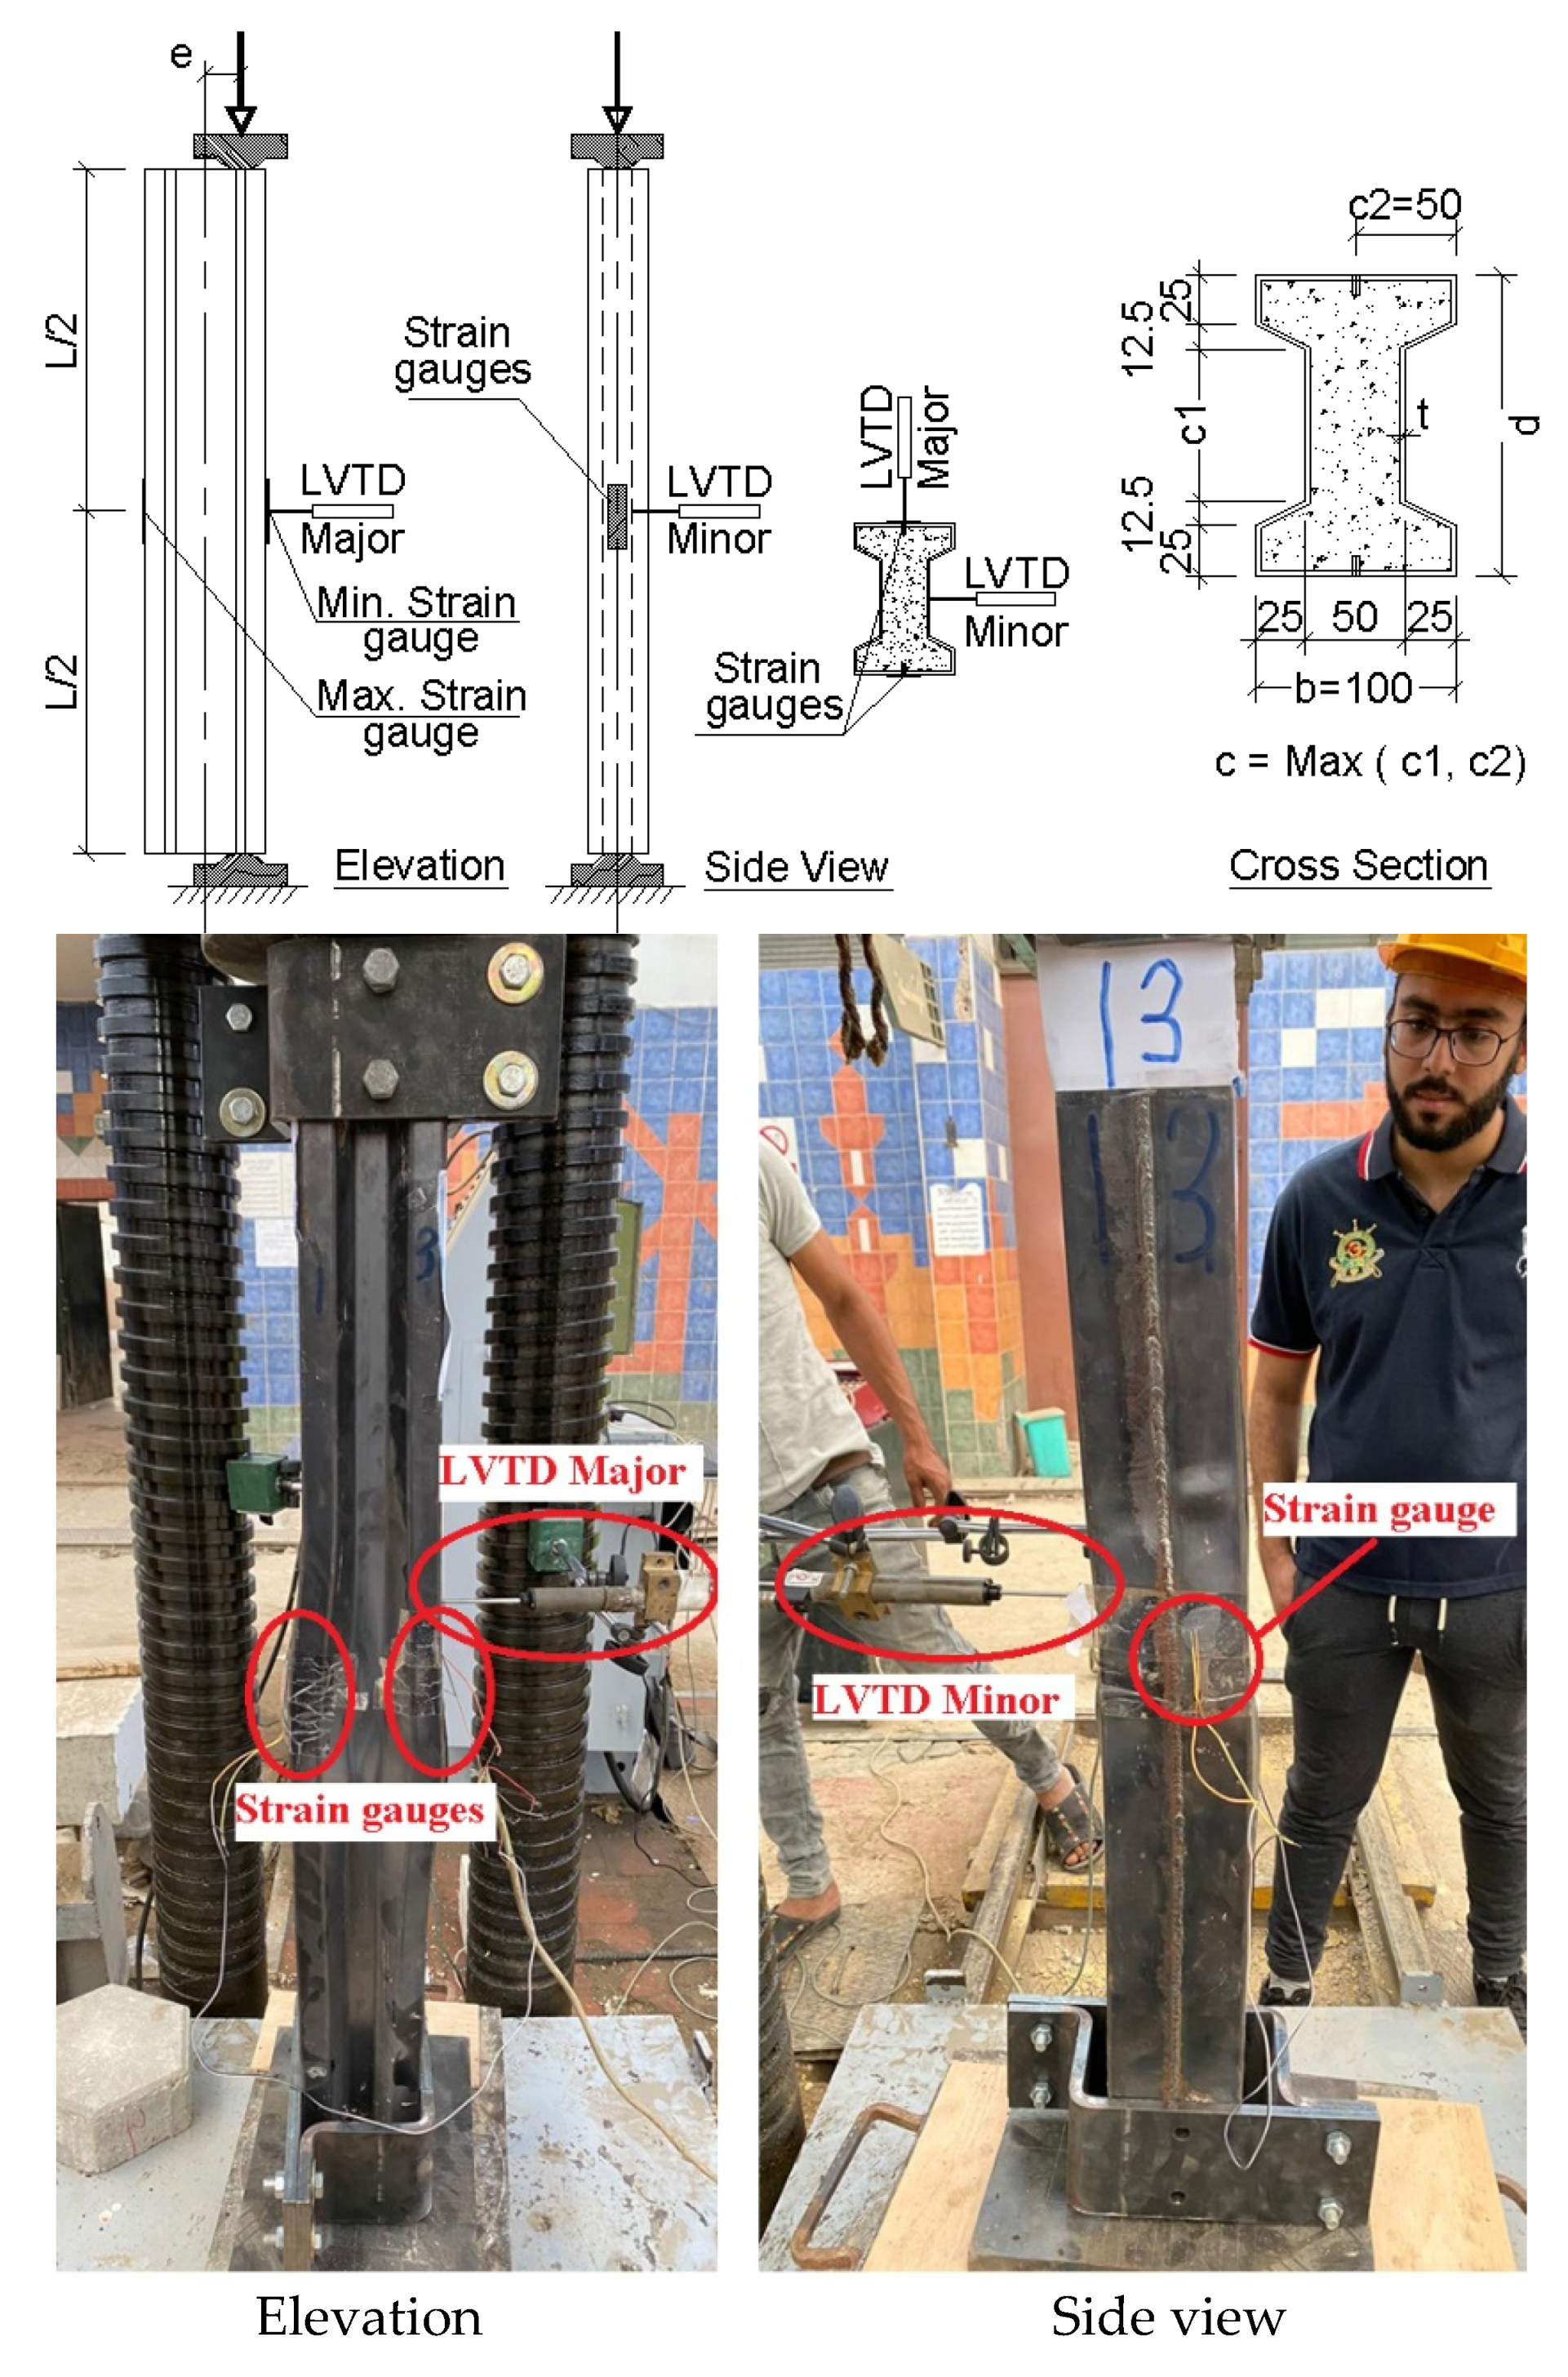
2.4. Test Setup and Instrumentation
2.5. Test Procedure
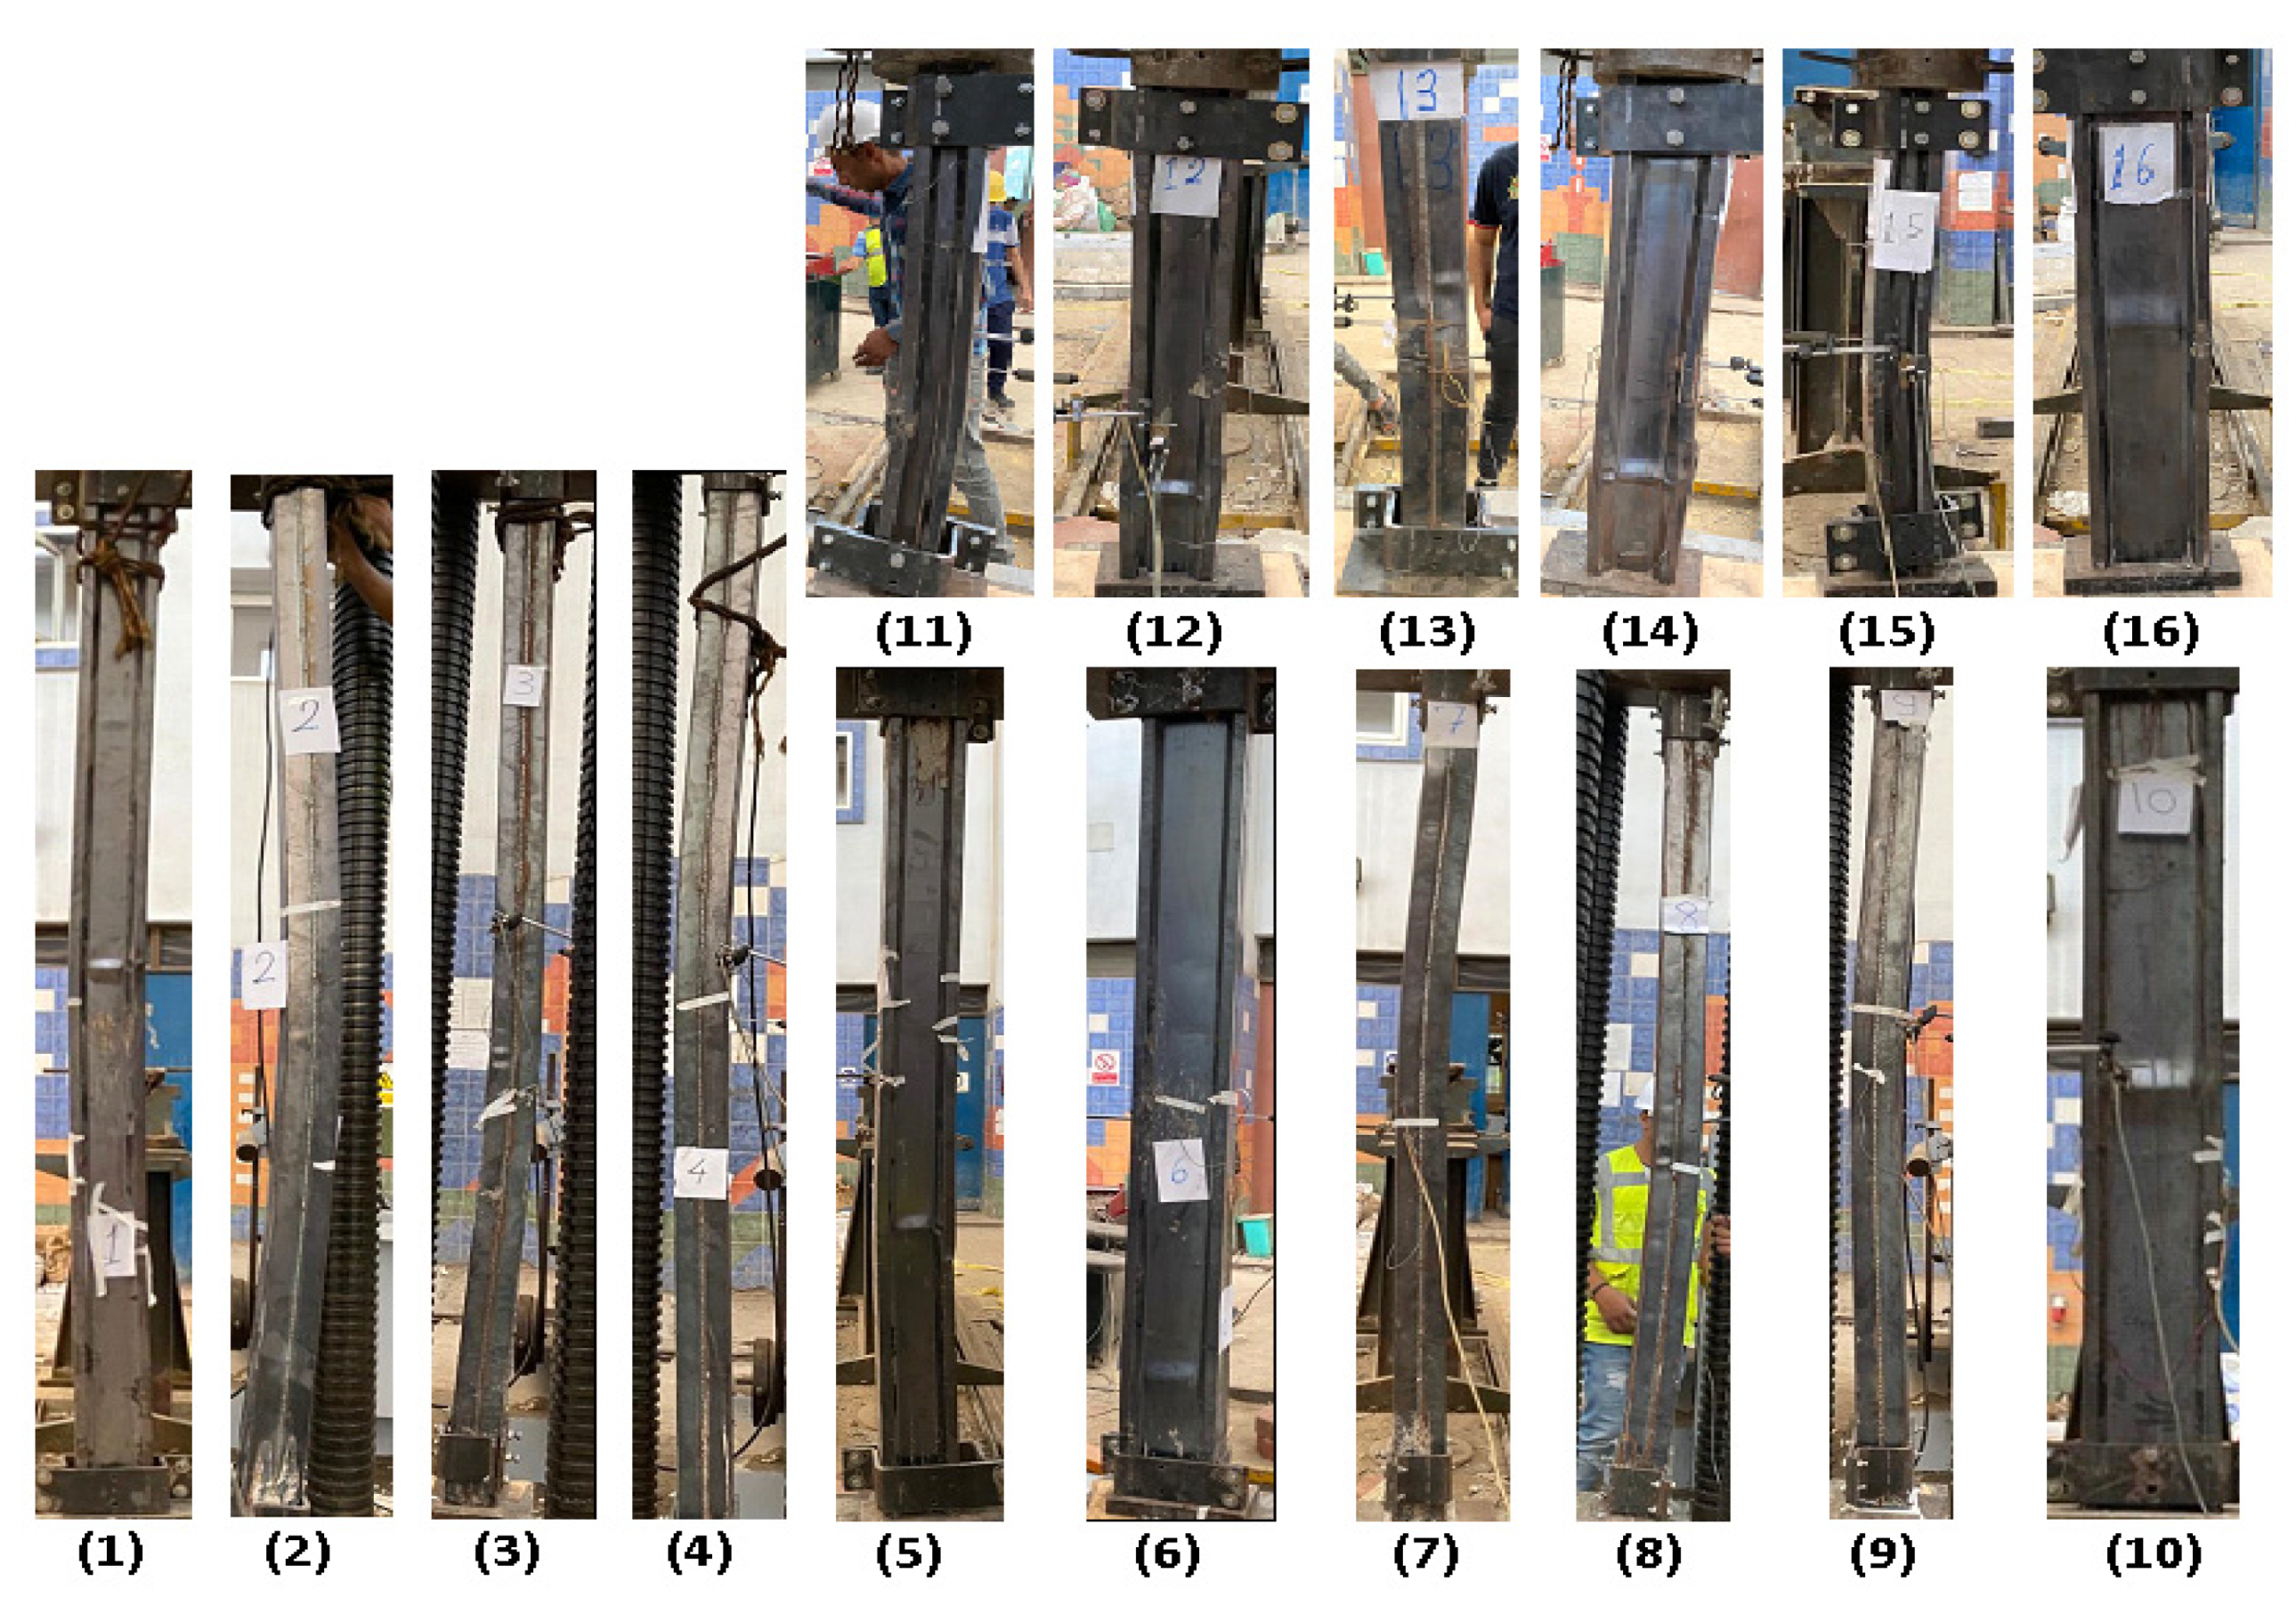
3. Experimental Results
- The lateral deformation due to eccentricity (in major direction) is estimated for each specimen using Equation (1):where (EI) is the fully bonded composite flexural stiffness; hence, if the measured Δ-major was close to or exceeded this value, that indicated flexural failure.
- The lateral deformation due to global buckling (in a minor direction) is estimated for each specimen using Equation (2):where (λ) is the fully bonded composite global slenderness ratio. If the measured Δ-minor was near or more than this value, that indicated global buckling failure.
- Yield strain equals (Fy/Es) which is (0.33/210 = 1570 μ-strain). If the minimum measured strain was within this range or more, this value indicated overstressing failure.
- Finally, if none of the above conditions occurred, this indicated a local buckling failure.
4. Theoretical Analysis
4.1. AISC-LRFD-94 Code
- fs and As are yield strength and cross sectional area of steel section
- Fc and Ac are compressive strength and cross sectional areas of concrete
- fyr and Ar are yield strength and cross sectional area of reinforcement bars
- c1 = 1.00, c2 = 0.68 and c3 = 0.40 for in-filled composite columns.
- P, Mx and My are the actual vertical load and bending moments in X and Y directions
- Pn is the axial capacity of a section considering buckling, as shown in Equations (6) and (7)
- Mxn and Myn are the flexural capacity of column section in X and Y directions without axial load and considering plastic stress distribution
= 0.648 Fym/λm2 for λm > 1.1
- λm is the normalized slenderness ratio = .
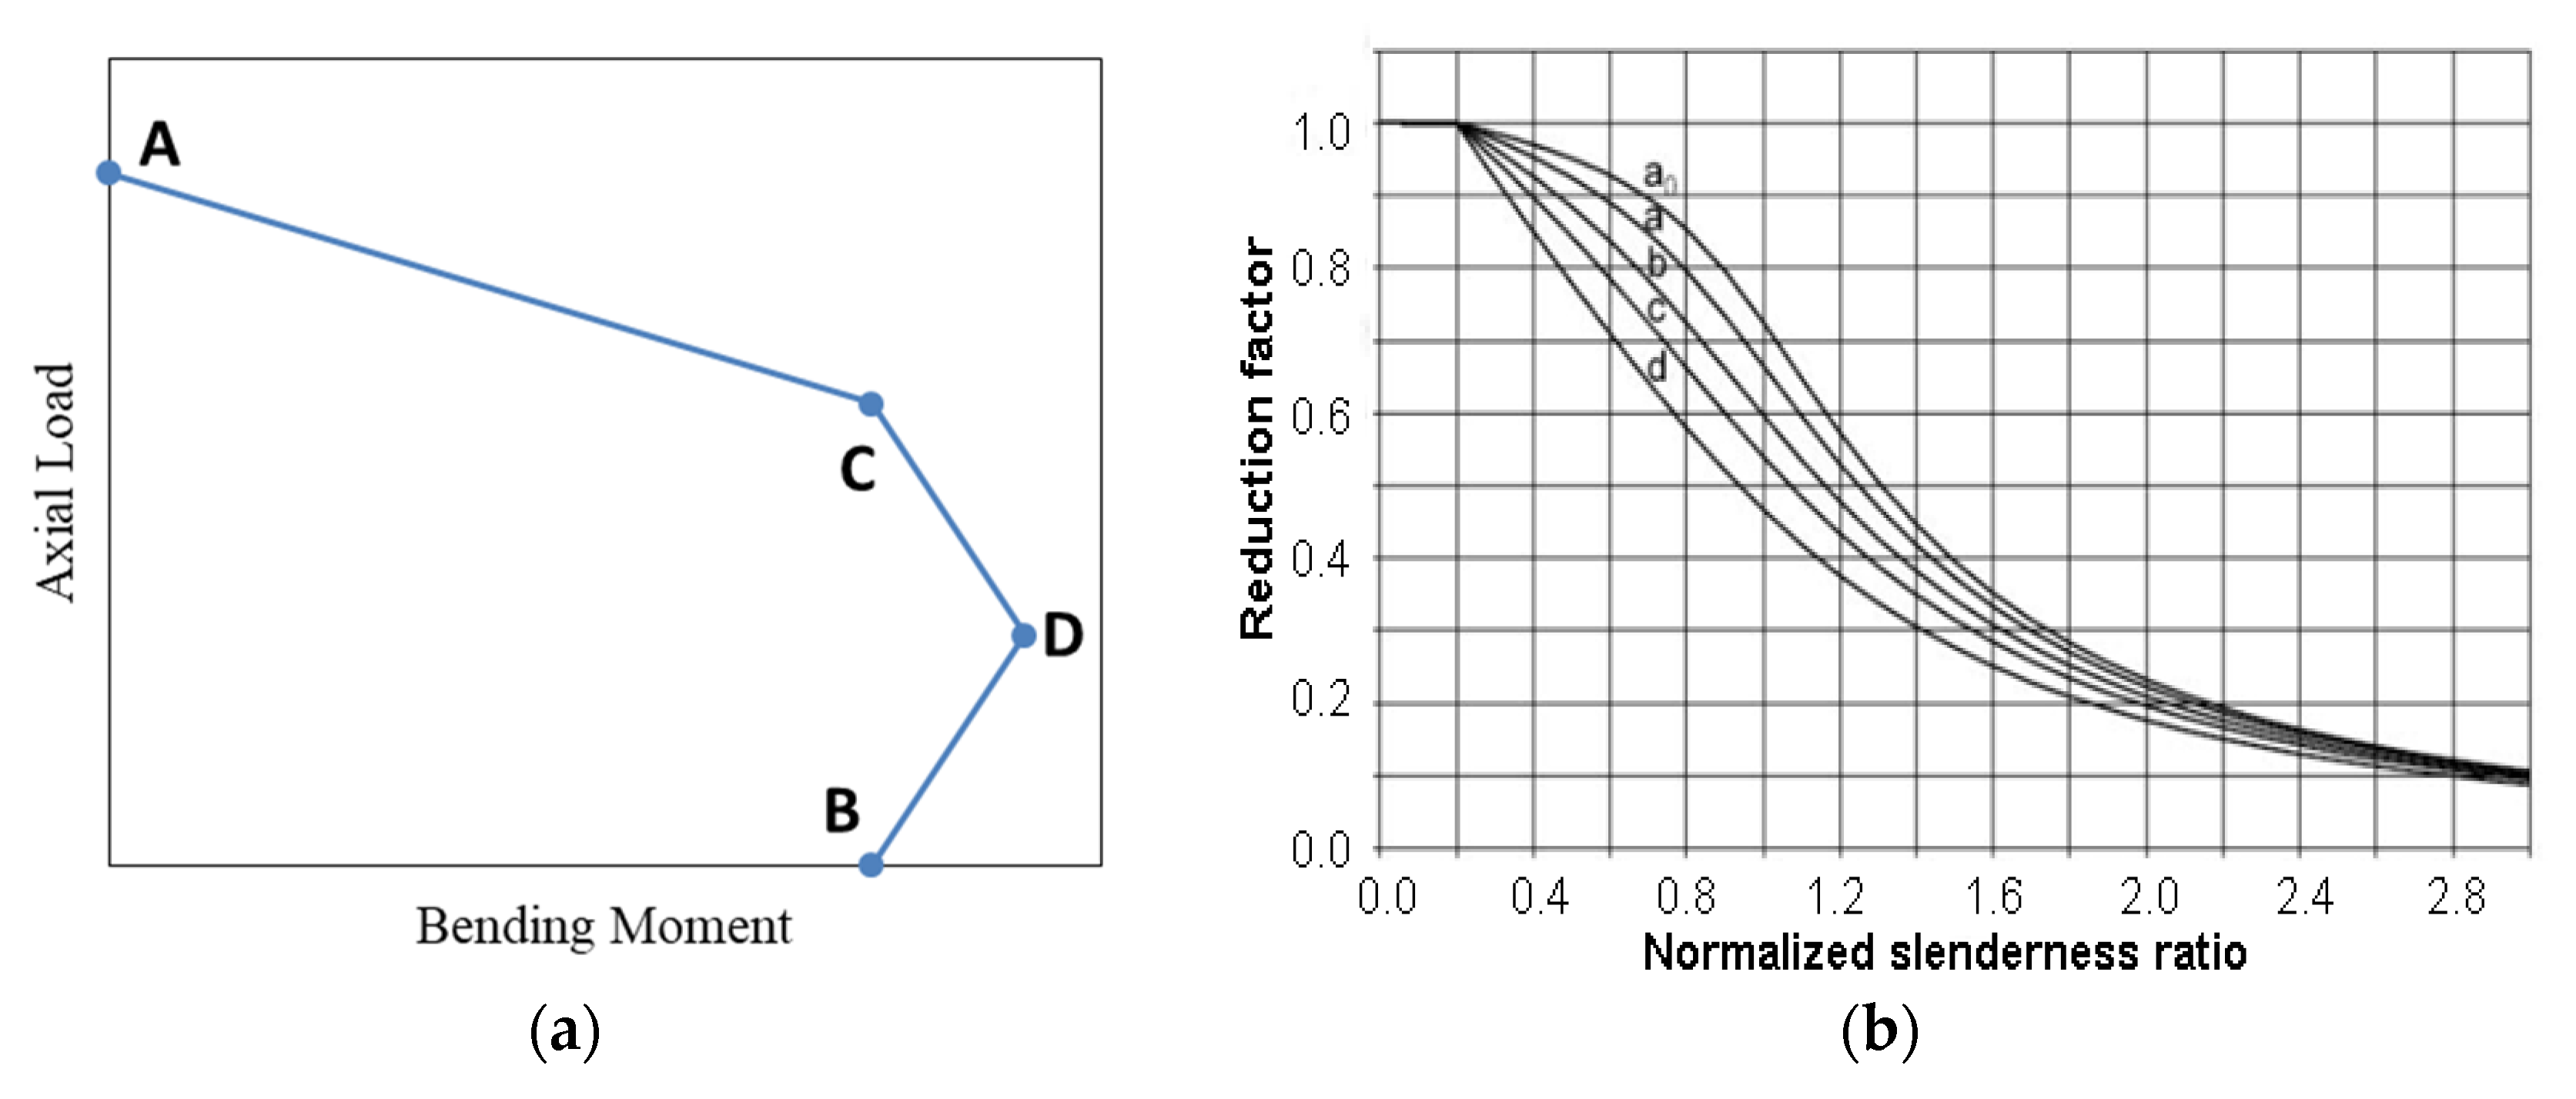
4.2. EN-1994-04 Code
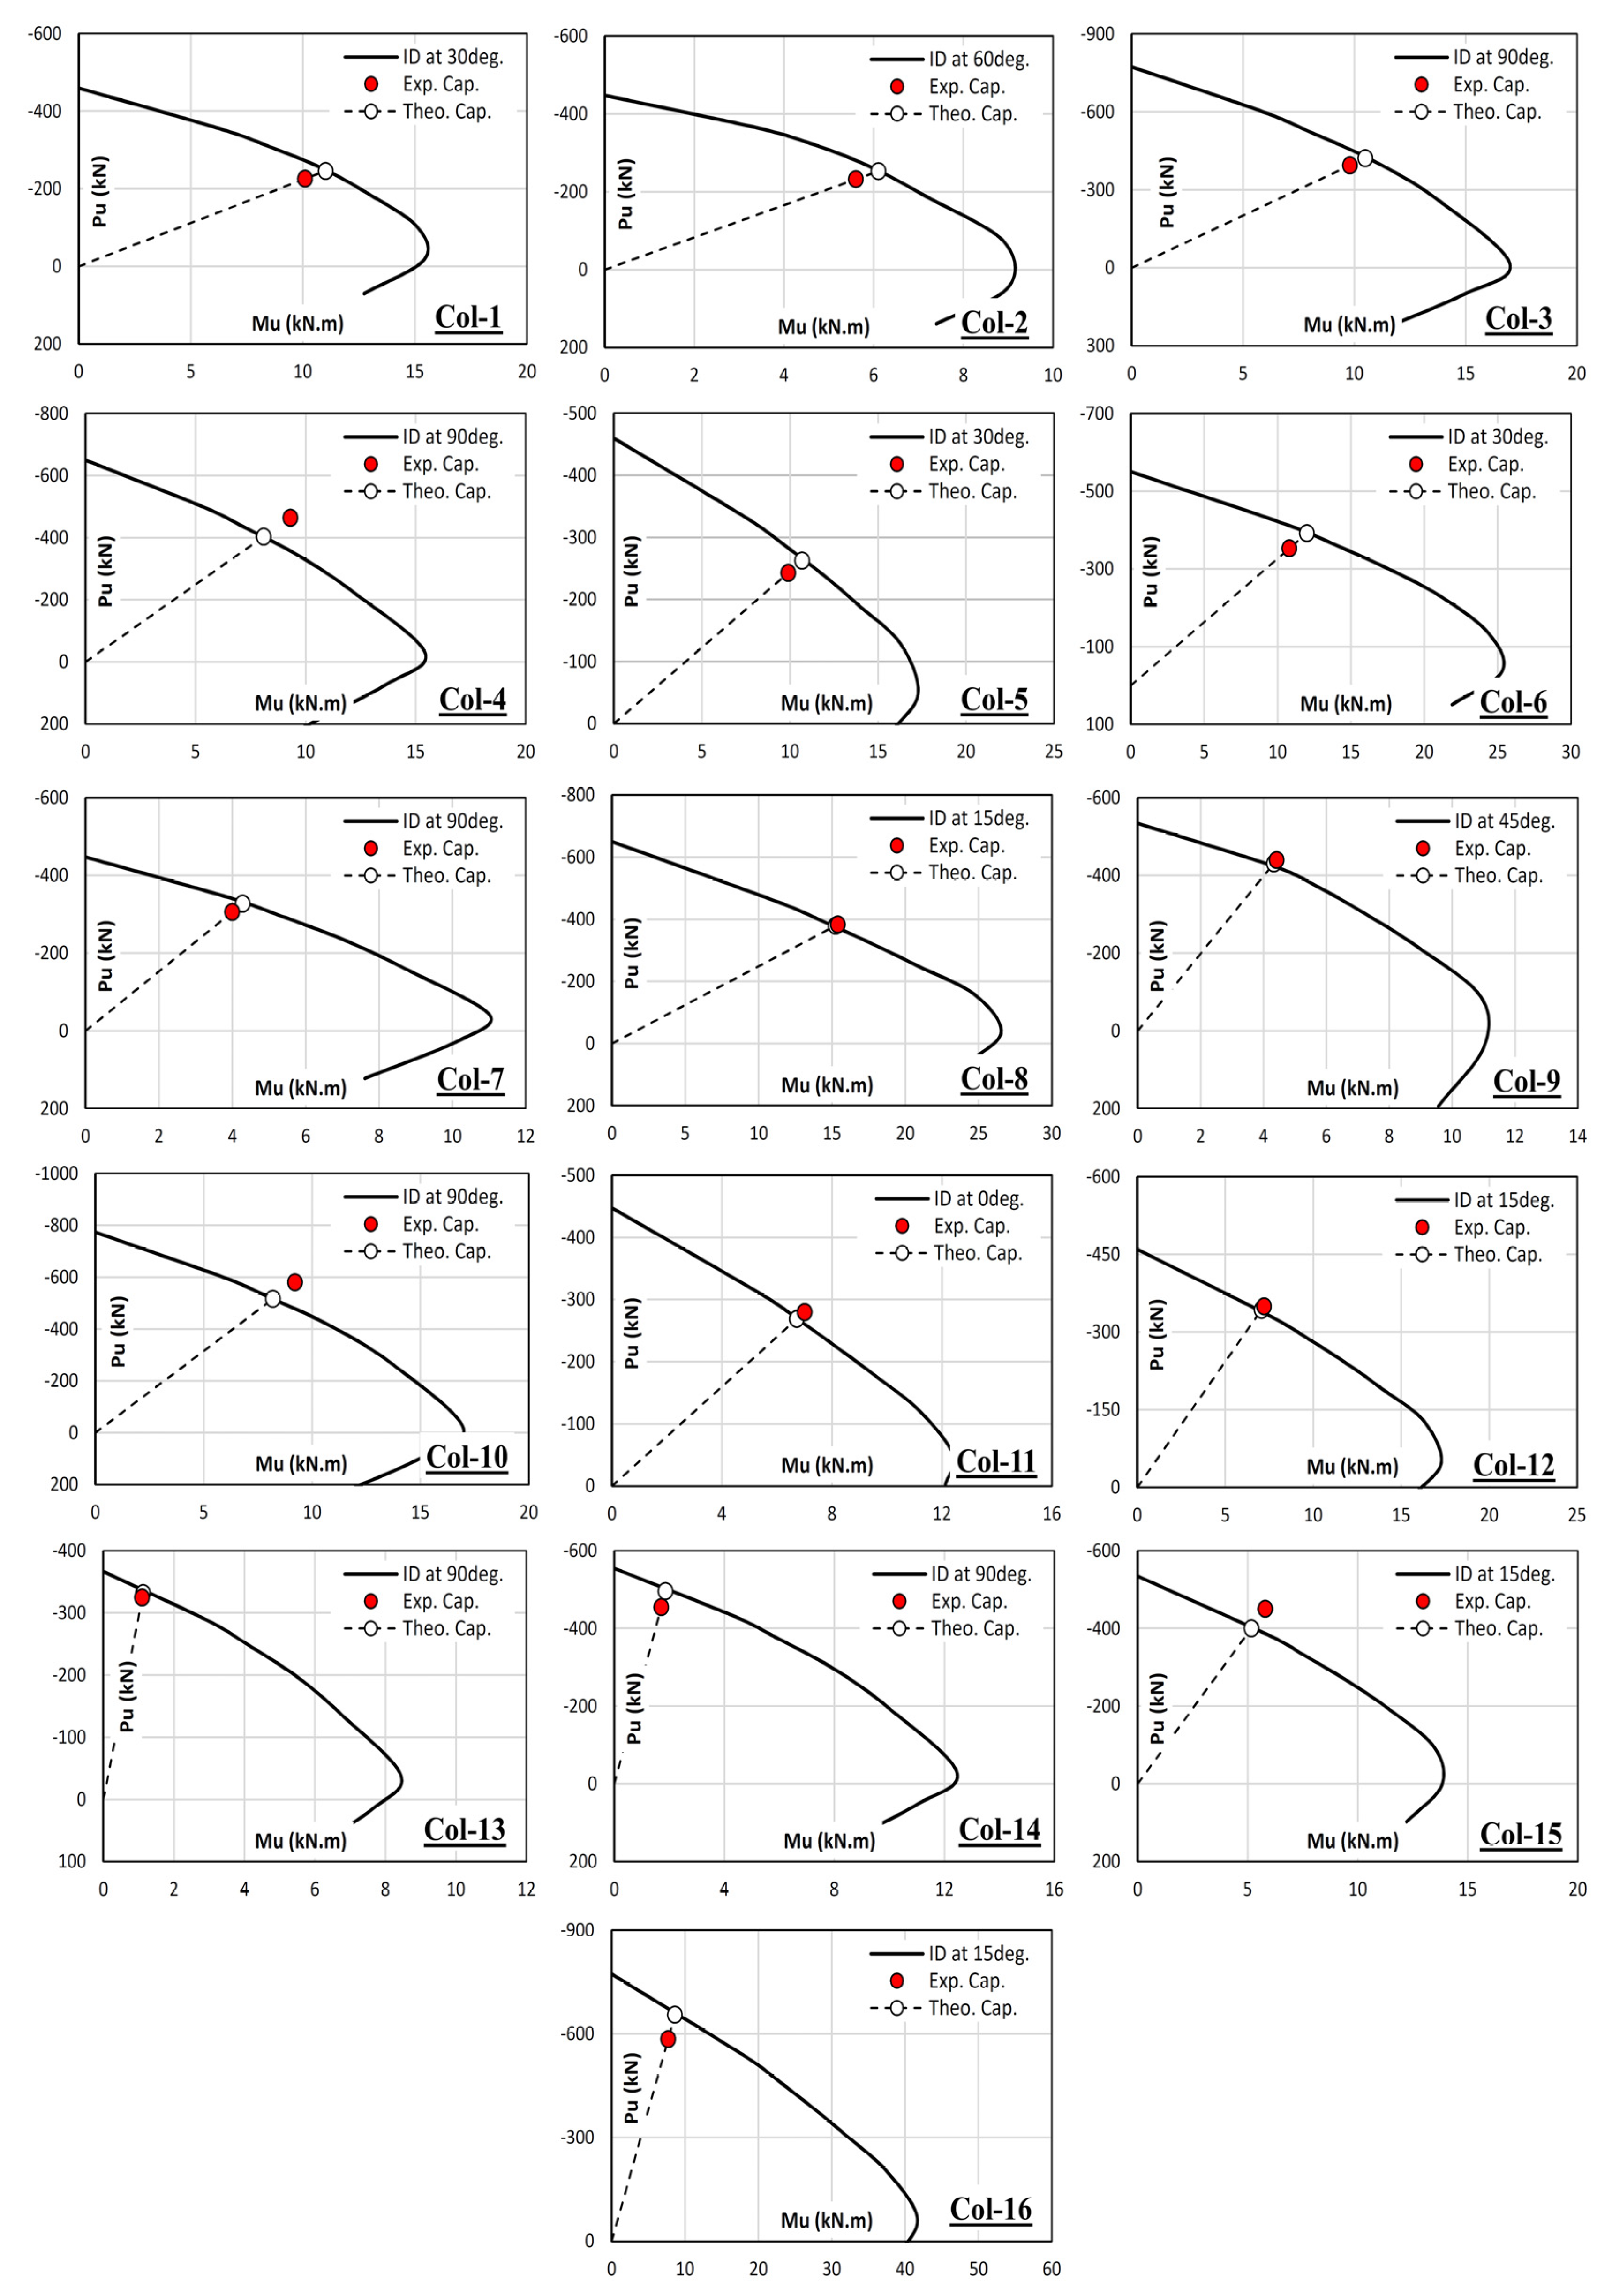
4.3. Using CSI-COL Software (Computers & Structures INC., California, USA)
5. Discussion
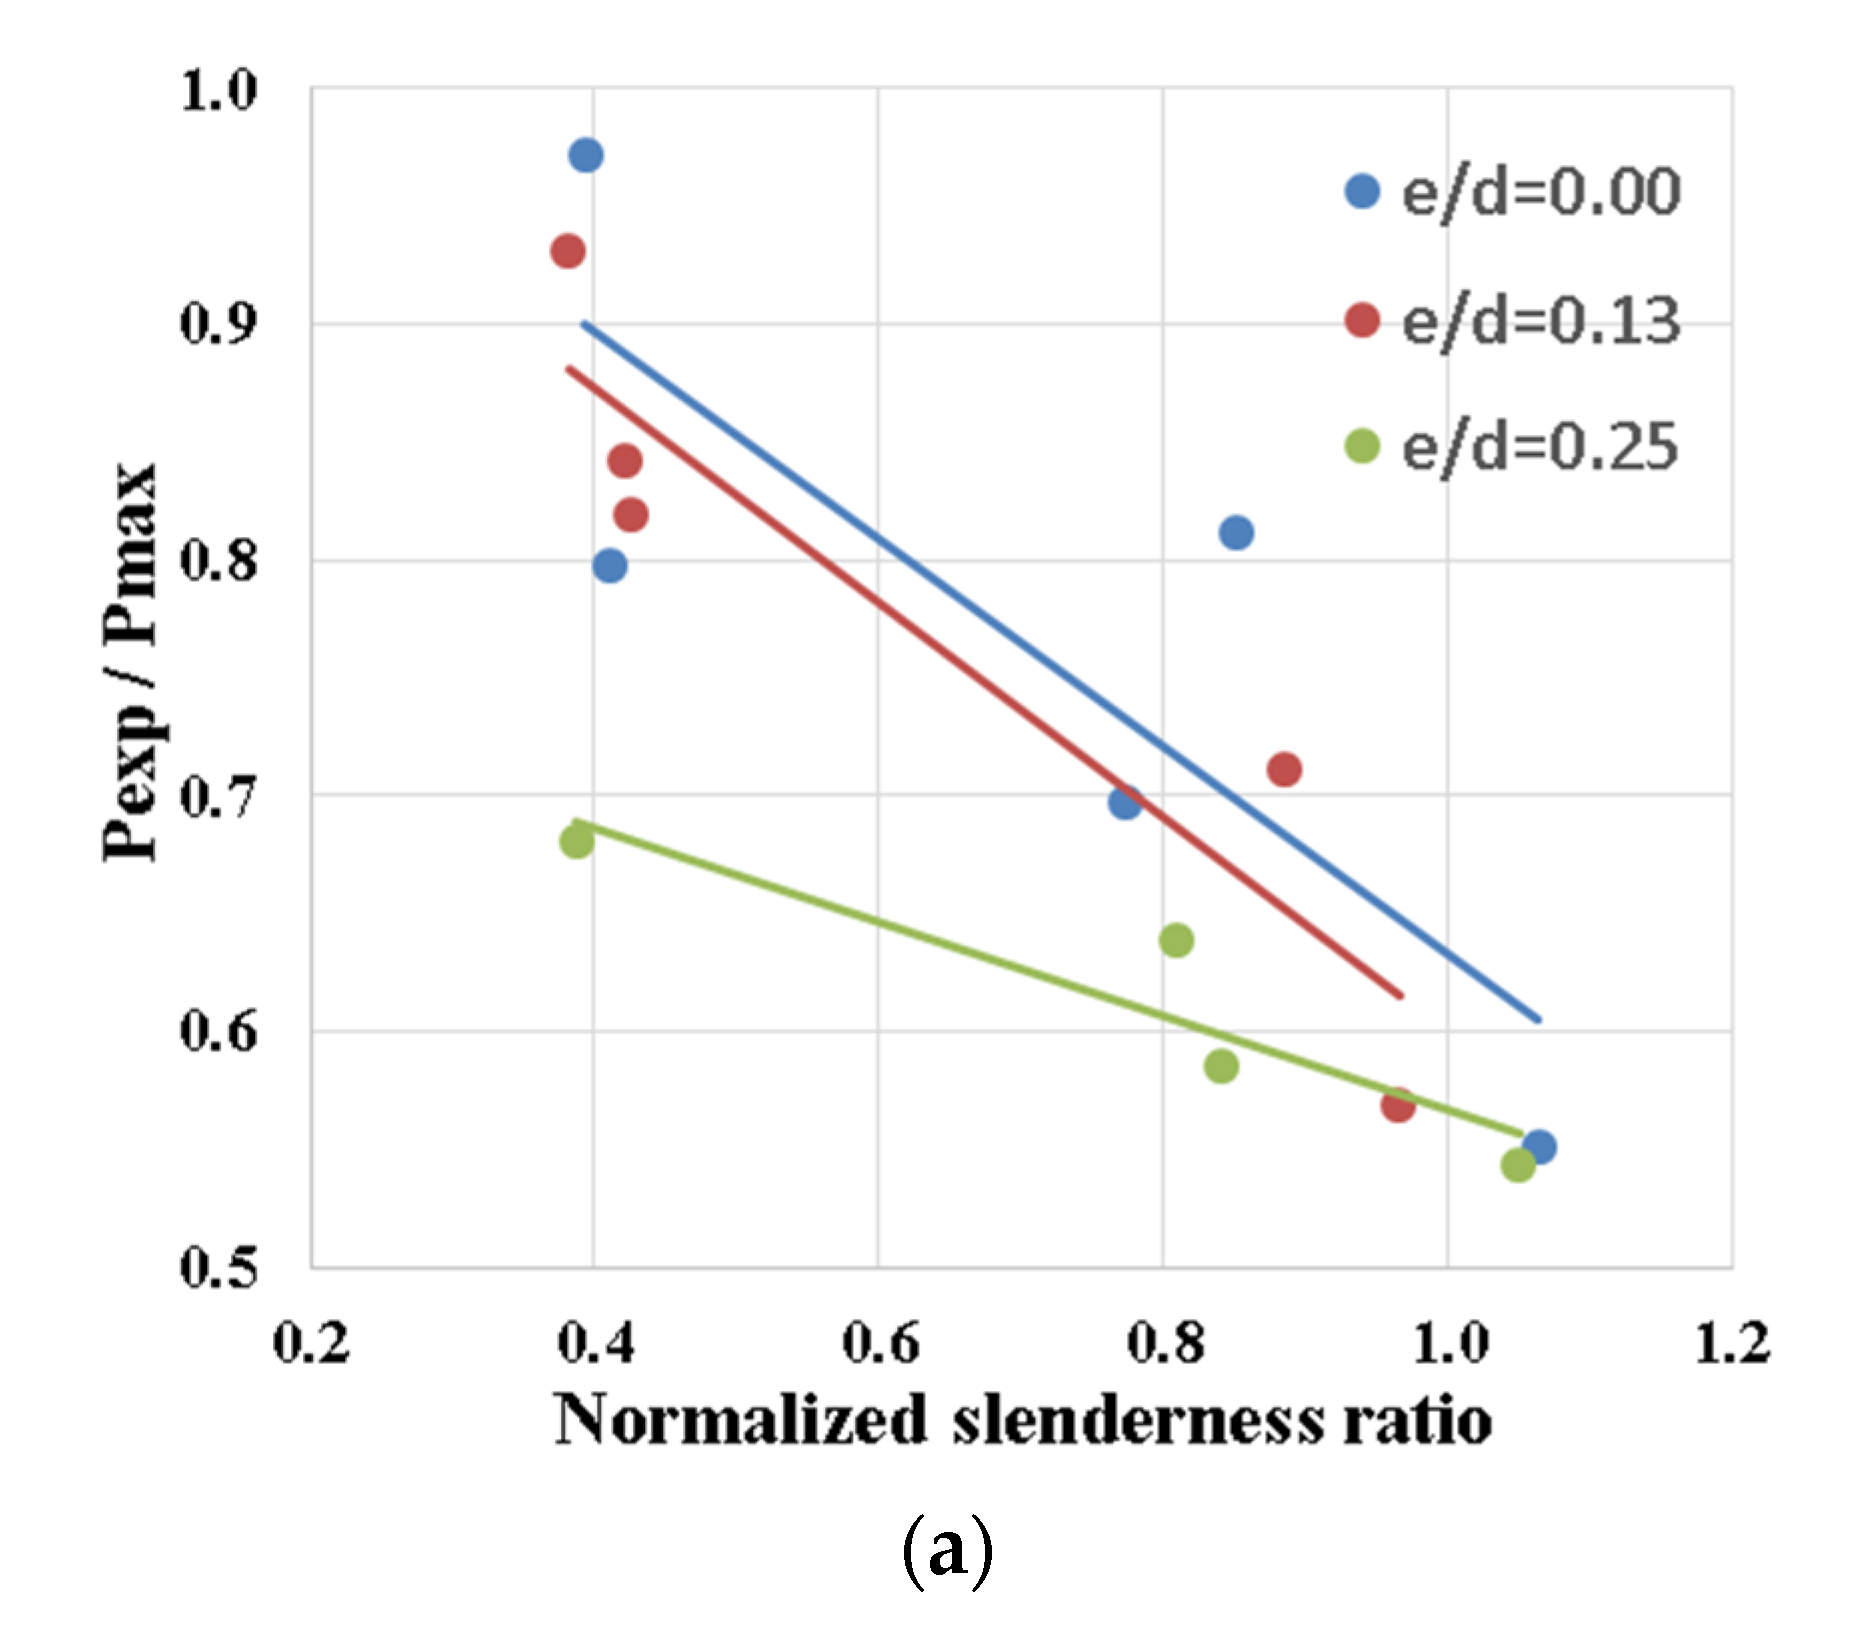
- The reduction factor (Pexp/Pmax) decreases with increasing the global normalized slenderness ratio regardless of the relative eccentricity.
- For centric loading (e/d = 0) the reduction factor ranged between 90% and 60% for global normalized slenderness ratio of 0.4–1.1, respectively, which matches (EN-1994) curve “b” in Figure 5b.
- For small eccentricity (e/d = 0.13), where the axial force acts inside the core of the section, the reduction factor is slightly less than the centric case, which indicates that plastic failure due to vertical load dominates the behavior.


- For critical eccentricity (e/d = 0.25), where the axial force acts on the core edge of the section, the reduction factor is significantly reduced, which indicates that flexural plastic failure dominates the behavior.
- Finally, all fitting lines almost intersected at a normalized slenderness ratio of 1.1, which matches the elastic buckling limit of AISC that showed in Equation (7).
- The rate of reduction factor decreasing is decreased with increasing the slenderness ratio. The maximum decreasing rate was observed for the lowest slenderness ratio (λ = 32 or λ = 0.4), while the reduction factor was almost constant for the highest slenderness ratio (λ = 85 or λ = 1.05).
- The slenderness limit that separates plastic failure from elastic buckling is about (λ = 90 or λ = 1.10), which matches the recommendations of the AISC code.
- Both experimental and analytical results showed that the core of the considered composite section lies at e/d = 0.25. At this relative eccentricity, the minimum normal stress is almost zero (as shown in Table 5, specimens 1, 8 and 11).
- The enhanced accuracy of CSI-COL may be justified as follows:
- -
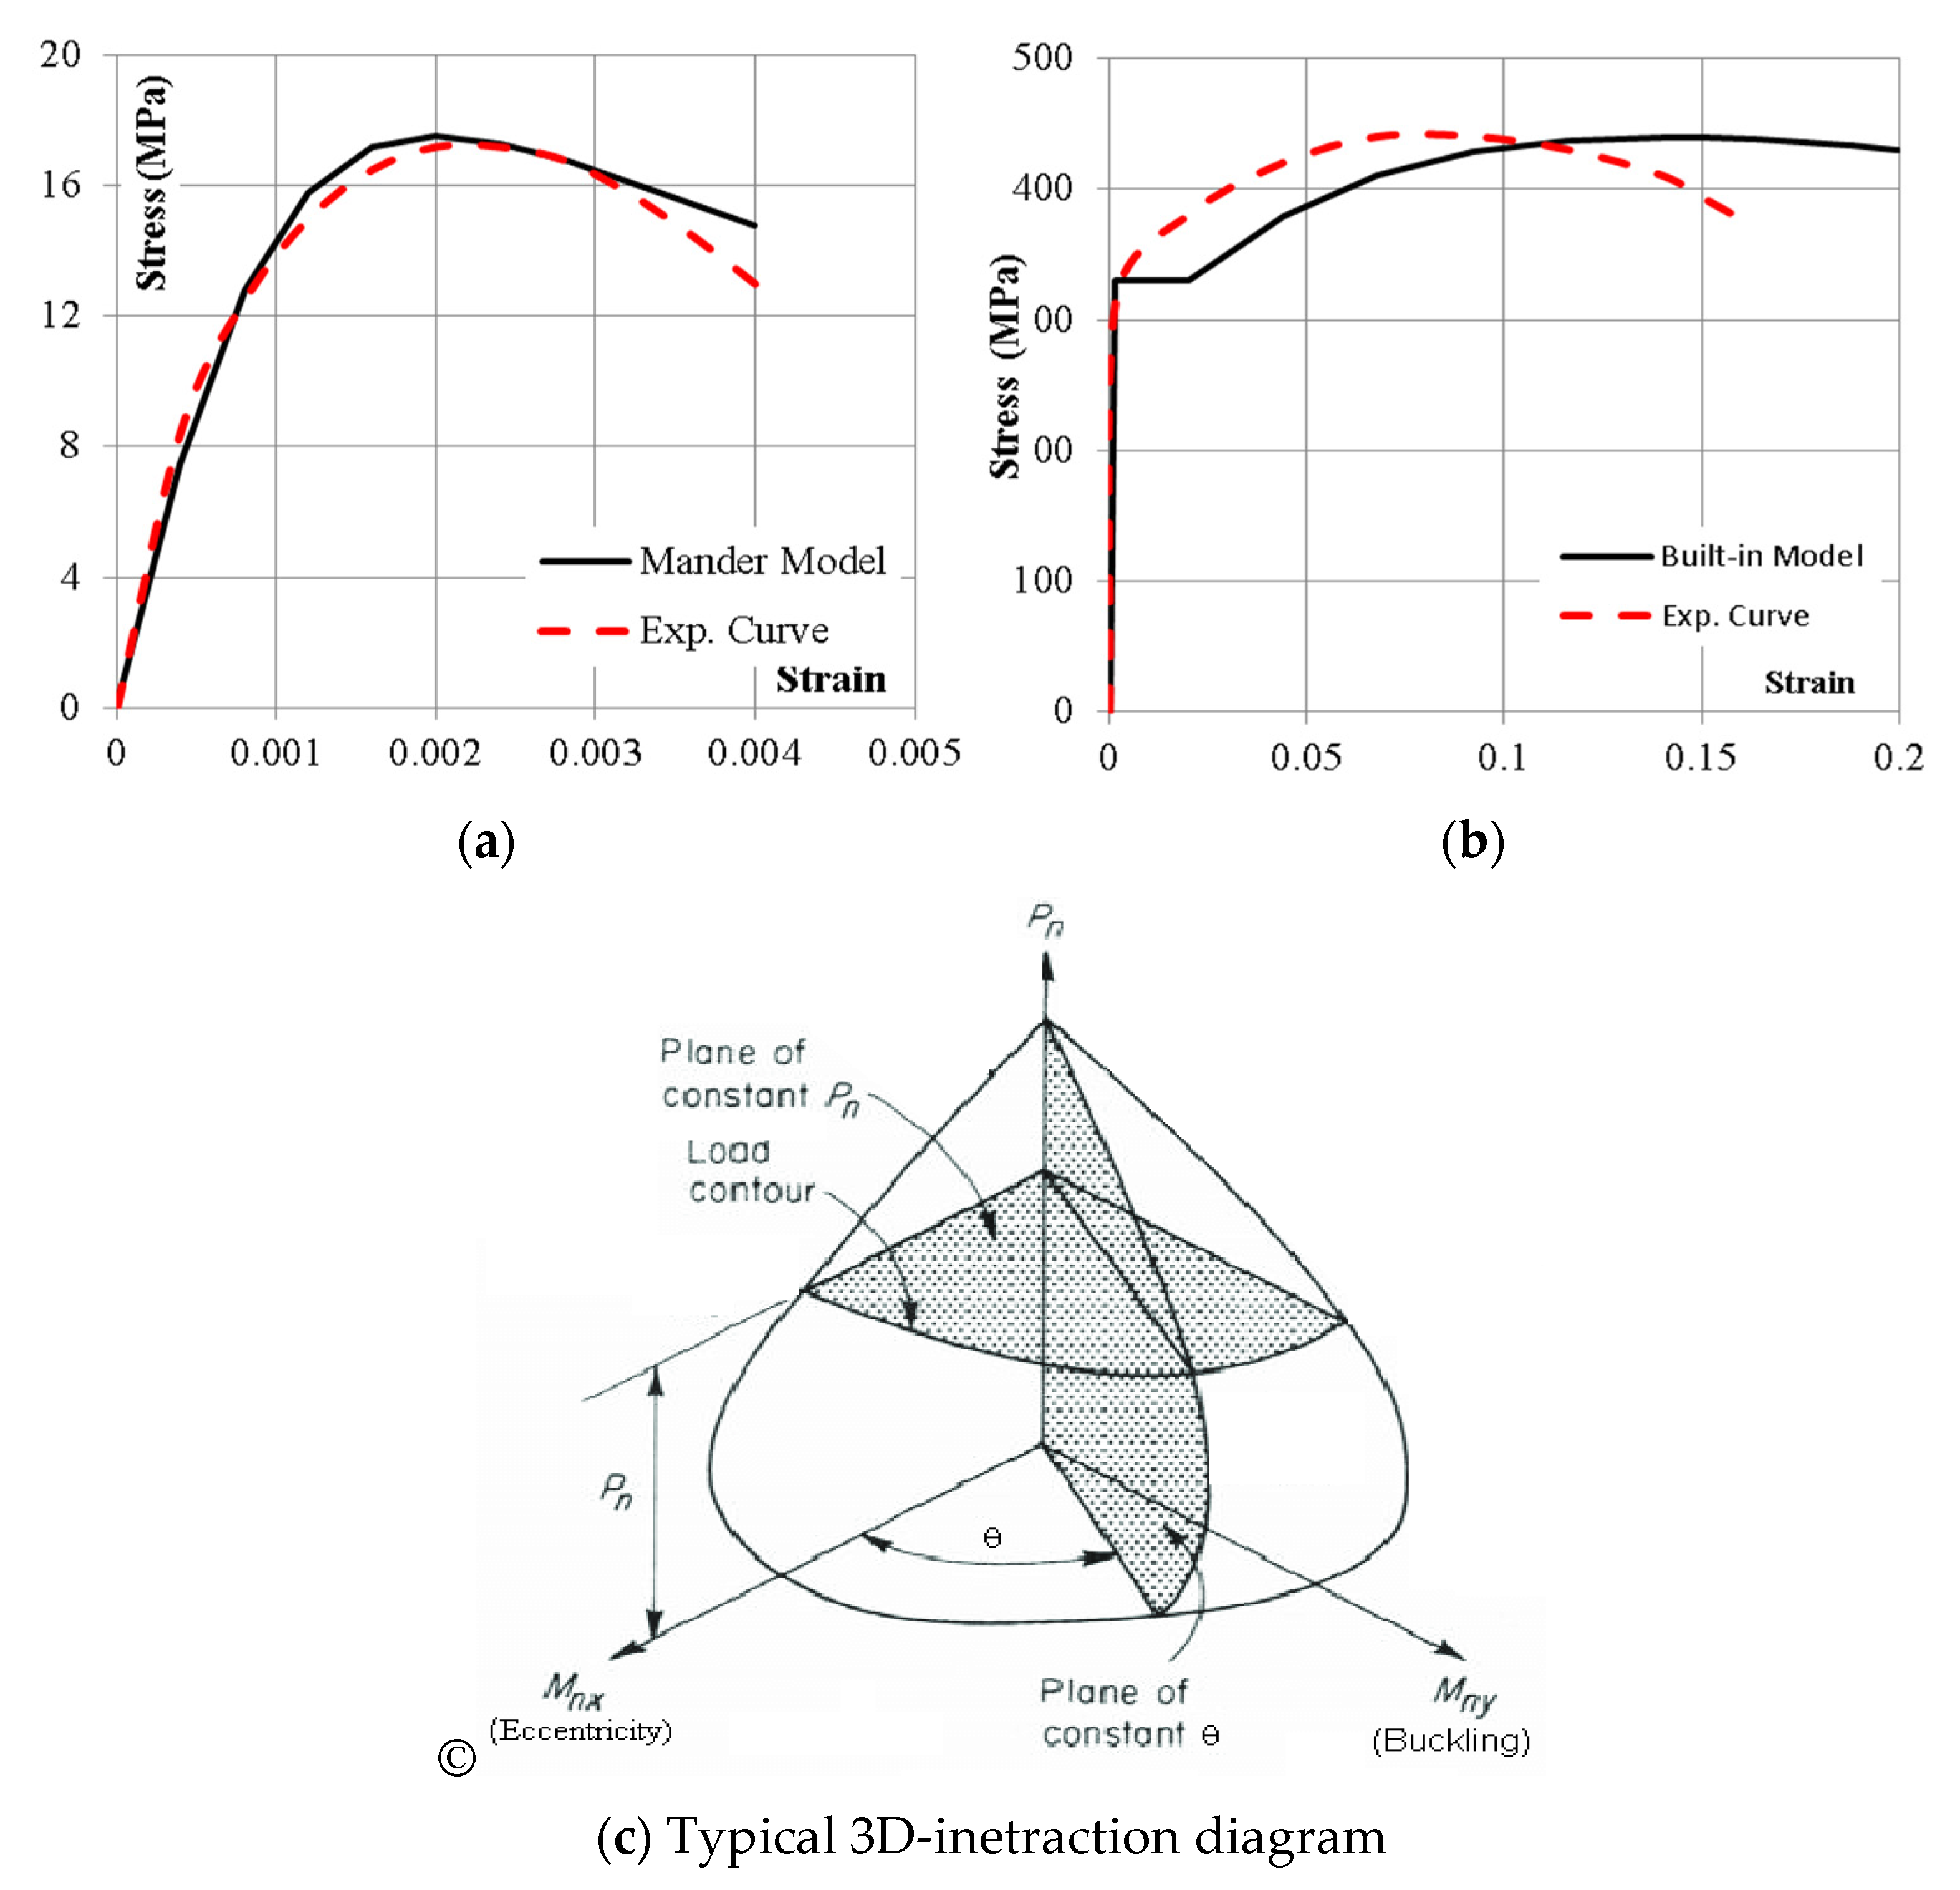
- CSI-COL considered the Mander model for concrete behavior, which is so close to the experimental one (as shown in Figure 6a). On the other hand, most design codes (including AISC and EN-1994) considered a simplified equivalent block distribution to simulated concrete behavior.
- -
- CSI-COL considered a non-linear stress–strain relation for steel sections, while design codes used simplified bilinear elastic–perfect plastic relation.
- -
- The formulas in design codes were developed based on regular cross sections (rectangular or circular in-filled tubes), while CSI-COL considered the actual non-regular cross section of double sigma face-to-face.
- -
- The software used generates a 3D-interaction diagram, while AISC uses an interaction formula and EN-1994 uses a simplified polygon 2D interaction diagram.
- Although CSI-COL showed better accuracy than design codes, it still has a significant deviation from the experimental results. This deviation could be justified as follows:
- -
- The built-in stress–strain curve for steel sections in CSI-COL has a significant deviation from the actual one, as shown in Figure 6b.
- -
- CSI-COL does not consider the effect of local buckling of the thin steel shell.
- -
- There must be some imperfections and random errors in manufacturing and testing the samples, which cannot be considered in any theoretical analysis.
6. Conclusions
- Experimental tests, design codes and CSI-COL software results indicated that overstressing plastic failure is distinguished from elastic buckling failure at a normalized slenderness ratio of about 1.1 (λ ≈ 90).
- Both theoretical calculations and strain measurements showed that the core edge of this section is located at relative eccentricity (e/d) equals 0.25.
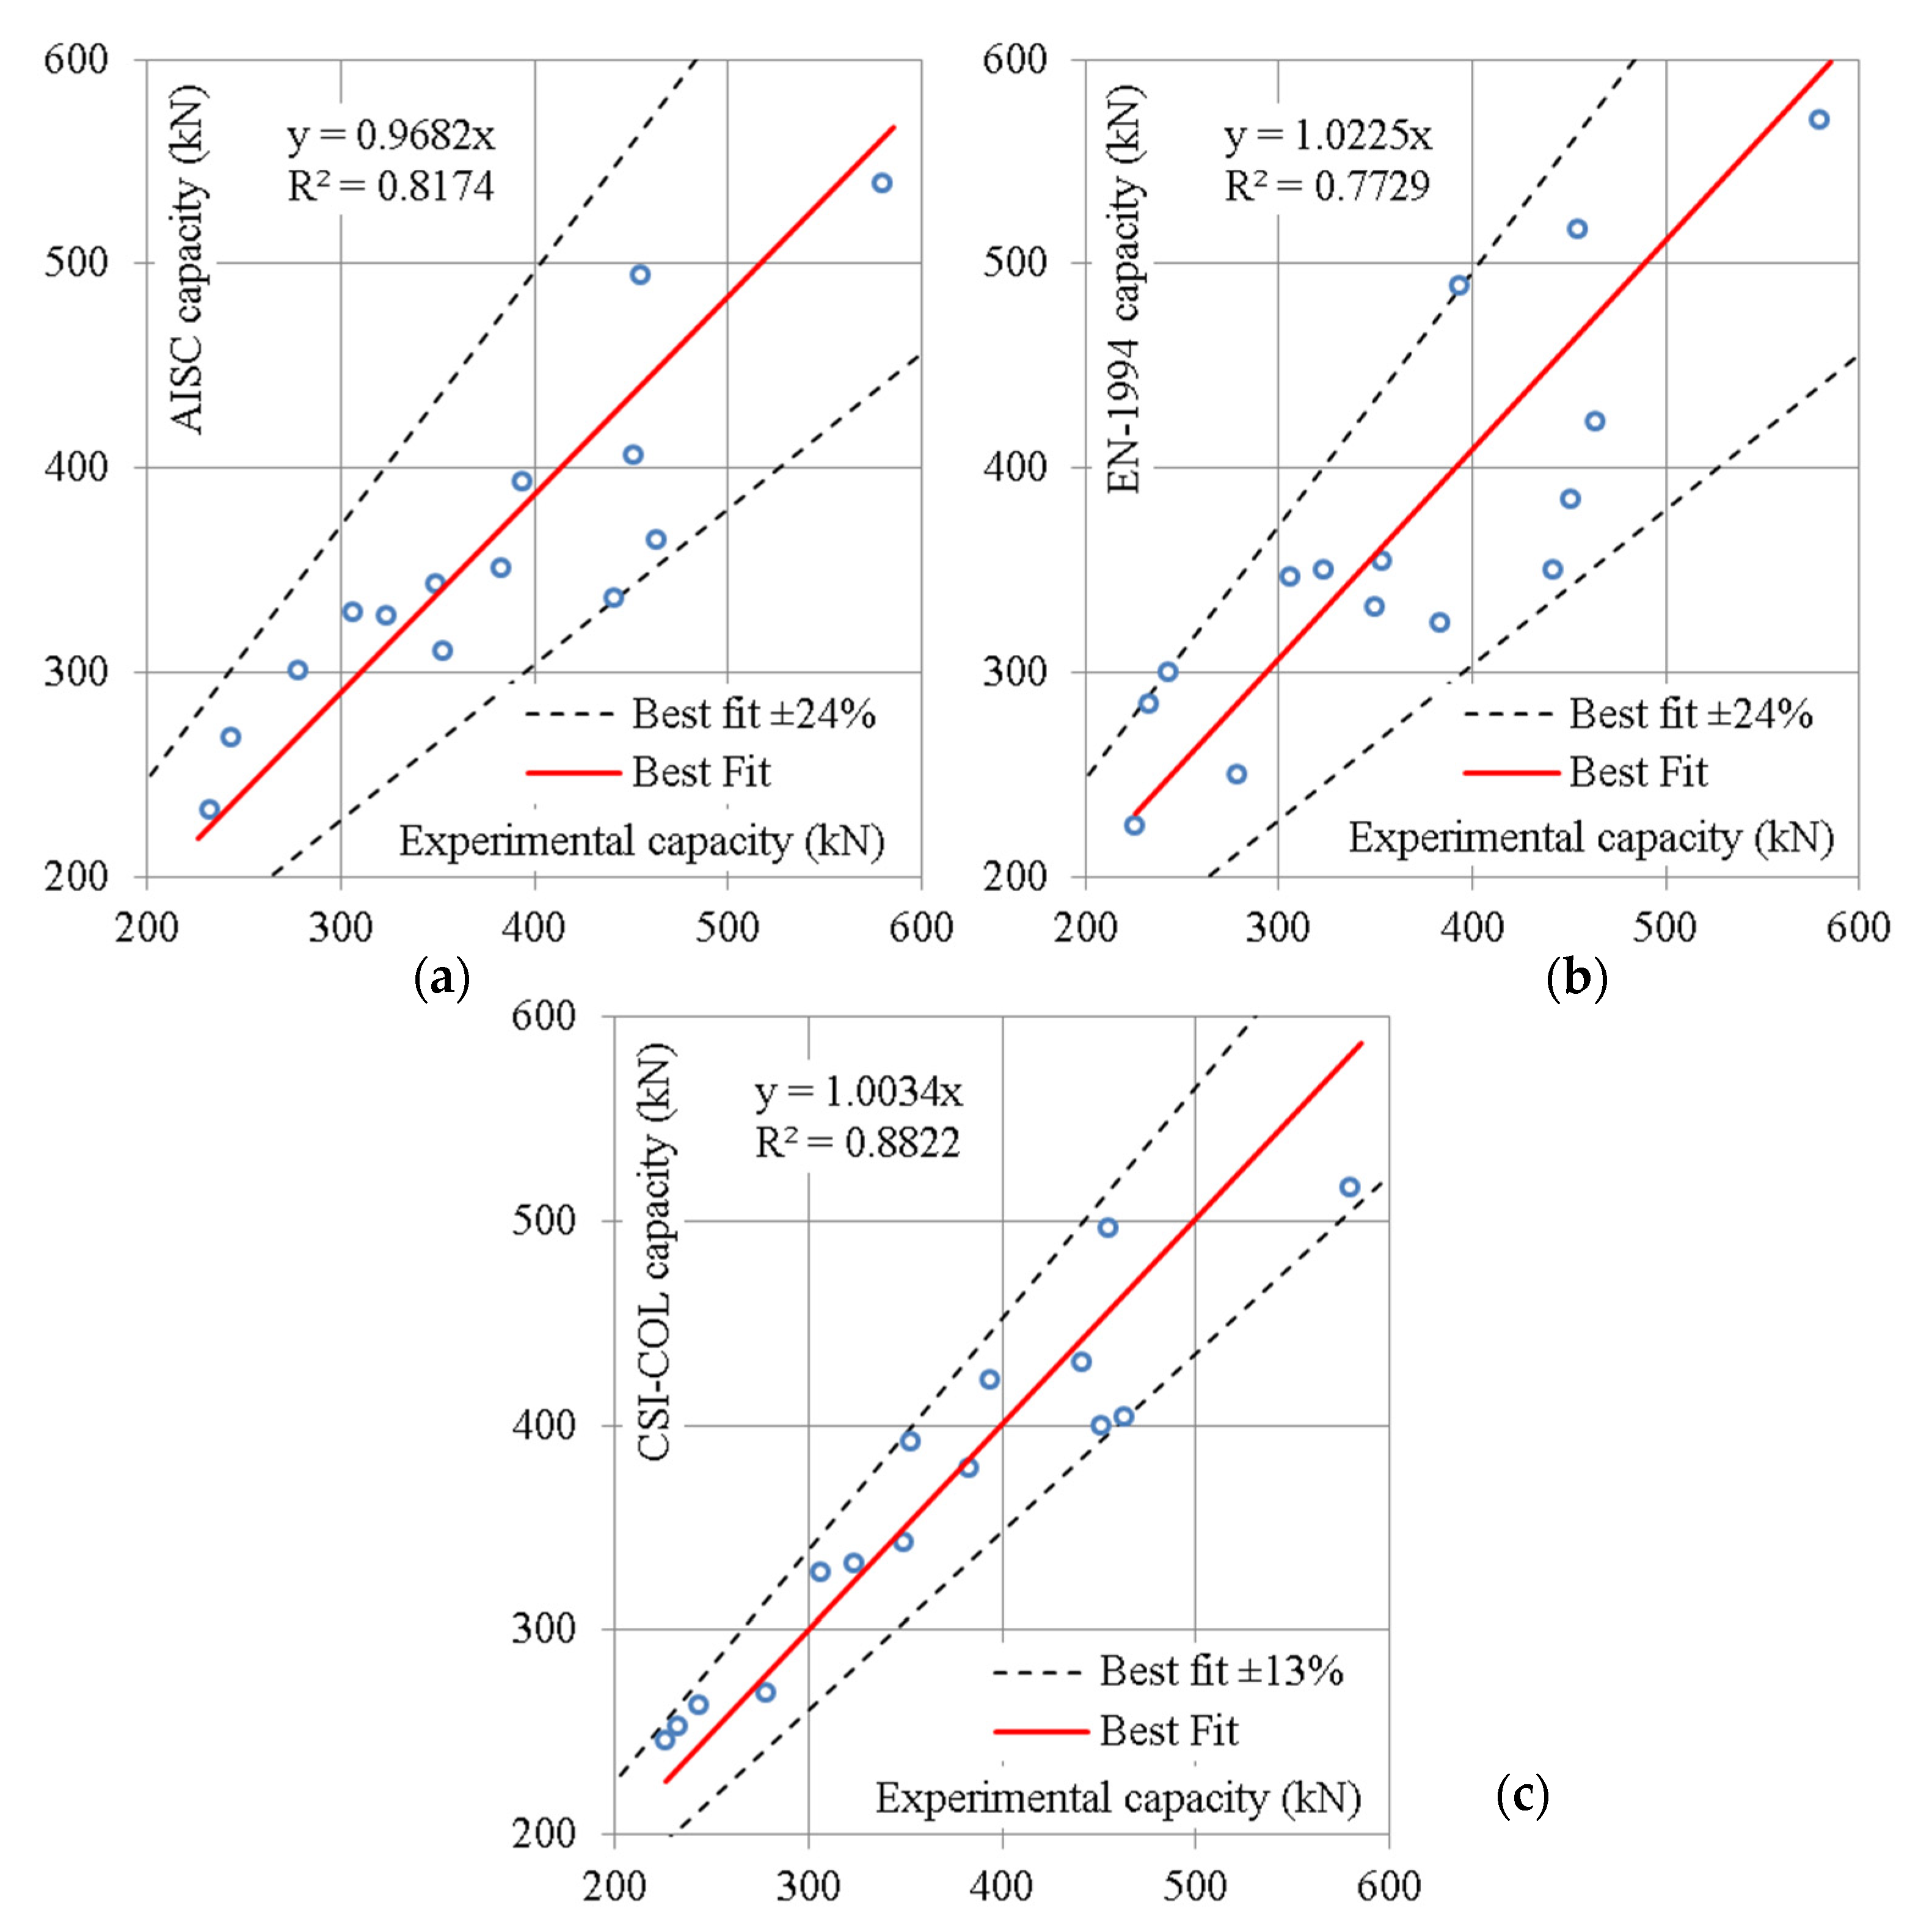
- The calculated capacities using CSI-COL software, AISC-LRFD-94 and EN-1994-04 had deviations of (13%, 24% and 24%) from the experimental capacities, respectively.
- Although the local buckling failure was experimentally observed for local slenderness ratio (c/t = 80), none of the three used theoretical methods was able to capture this behavior. An advanced non-linear 3D FEM modeling may be needed to simulate this phonon.
- The good matching between experimental and CSI-COL capacities indicated that the studied section could achieve full composite behavior without using any shear connectors.
- The results of this study are limited by the size of the tested sample; more full-scale samples should be tested to verify the accuracy of the concluded results.
- Further studies may be carried out using more advanced 3D-FEM modeling to investigate the local buckling behavior of this section.
Author Contributions
Funding
Data Availability Statement
Conflicts of Interest
References
- Alimohammadi, H.; Hesaminejad, A.; Yaghin, M.L. Effects of different parameters on inelastic buckling behavior of composite concrete-filled steel tubes. Int. Res. J. Eng. Technol. 2019, 6, 603–609. [Google Scholar]
- Liu, D.; Gho, W.; Yuan, J. Ultimate capacity of high-strength rectangular. J. Constr. Steel Res. 2003, 59, 1499–1515. [Google Scholar] [CrossRef]
- Zhu, L.; Ma, L.; Bai, Y.; Li, S.; Song, Q. Large diameter concrete-filled high strength steel tubular stub. Thin-Walled Struct. 2016, 108, 12–19. [Google Scholar] [CrossRef]
- Han, L.; Yao, G.; Zhao, X. Tests and calculations for hollow structural steel (HSS) stub columns filled with self-consolidating. J. Constr. Steel Res. 2005, 61, 1241–1269. [Google Scholar] [CrossRef]
- Zhang, S.; Guo, L. Behavior of High Strength Concrete-Filled Slender RHS Steel Tubes. Adv. Struct. Eng. 2007, 10, 337–351. [Google Scholar] [CrossRef]
- Guo, L.; Zhang, S.; Xu, Z. Behavior of Filled Rectangular Steel HSS Composite Columns under Bi-Axial Bending. Adv. Struct. Eng. 2011, 14, 295–306. [Google Scholar] [CrossRef]
- Bahrami, A.; Badaruzzaman, W.H.W.; Osman, S.A. Finite Element Analysis of Ultimate Load Capacity of Slender Concrete-Filled Steel Composite Columns. In Proceedings of the International Conference on Advanced Science, Engineering and Information Technology 2011, Bangi-Putrajaya, Malaysia, 14–15 January 2011. [Google Scholar] [CrossRef]
- Ren, Q.X.; Han, L.H.; Lam, D.; Hou, C. Experiments on special-shaped CFST stub columns under axial compression. J. Constr. Steel Res. 2014, 98, 123–133. [Google Scholar] [CrossRef]
- Wang, Z.B.; Tao, Z.; Yu, Q. Axial compressive behavior of concrete-filled double-tube stub columns with stiffeners. Thin-Walled Struct. 2017, 120, 91–104. [Google Scholar] [CrossRef]
- Ding, F.X.; Wang, W.J.; Lu, D.R.; Liu, X.M. Study on the behavior of concrete-filled square double-skin steel tubular stub columns under axial loading. In Structures; Elsevier: Amsterdam, The Netherlands, 2020; pp. 665–676. [Google Scholar] [CrossRef]
- Ci, J.; Jia, H.; Chen, S.; Yan, W.; Song, T.; Kim, K.S. Performance analysis and bearing capacity calculation on circular concrete filled double steel tubular stub columns under axial compression. In Structures; Elsevier: Amsterdam, The Netherlands, 2020; pp. 554–565. [Google Scholar] [CrossRef]
- Tao, Z.; Uy, B.; Han, L.H.; Wang, Z.B. Analysis and design of concrete-filled stiffened thin-walled steel tubular columns under axial compression. Thin-Walled Struct. 2009, 47, 1544–1556. [Google Scholar] [CrossRef]
- Young, B.; Ellobody, E. Experimental investigation of concrete-filled cold-formed high strength stainless steel tube columns. J. Constr. Steel Res. 2005, 62, 484–492. [Google Scholar] [CrossRef]
- Dai, P.; Yang, L.; Wang, J.; Zhou, Y. Compressive strength of concrete-filled stainless steel tube stub columns. Eng. Struct. 2020, 205, 110106. [Google Scholar] [CrossRef]
- He, A.; Liang, Y.; Zhao, O. Flexural buckling behaviour and resistances of circular high strength concrete-filled stainless steel tube columns. Eng. Struct. 2020, 219, 110893. [Google Scholar] [CrossRef]
- Azad, S.K.; Li, D.; Uy, B. Axial slenderness limits for austenitic stainless steel-concrete composite columns. J. Constr. Steel Res. 2020, 166, 105856. [Google Scholar] [CrossRef]
- El Aghoury, M.A.; Hana, M.T.; Amoush, E.A. Axial stability of columns composed of combined sigma CFS. In Proceedings of the Annual Conference of Structural Stability Research Council, Orlando, FL, USA, 12–15 April 2016. [Google Scholar]
- el Aghoury, M.A.; Hana, M.T.; Amoush, E.A. Strength of combined sigma cold formed section columns. In Proceedings of the EUROSTEEL 2017, Copenhagen, Denmark, 13–15 September 2017. [Google Scholar]
- ASTM E8/E8M−13a; Standard Test Methods for Tension Testing of Metallic Materials. ASTM International: West Conshohocken, PA, USA, 2022. [CrossRef]
- American Institute of Steel Construction (AISC). Manual of Steel Construction-Load & Resistance Factor Design-Volume I-Structural Members, Specifications, & Codes; American Institute of Steel Construction: Chicago, IL, USA, 1994; ISBN 1-56424-042-8. [Google Scholar]
- EN 1994-1-1:2004; Eurocode 4: Design of Composite Steel and Concrete Structures–Part 1-1: General Rules and Rules for Buildings. European Committee for Standardization (CEN): Brussels, Belgium, 2004.
- Mander, J.B.; Priestley, M.J.N.; Park, R. Theoretical stress-strain model of confined concrete. J. Struct. Eng. 1988, 114, 1804–1826. [Google Scholar] [CrossRef] [Green Version]


| Item | OPC Grade R42.5 | Coarse Aggregate (Crushed Stone) | Fine Aggregate (Natural Sand) | Potable Water |
|---|---|---|---|---|
| Unit | kg | kg | kg | Liter |
| Value | 250 | 1300 | 650 | 125 |
| Sample | Thickness (mm) | Fy (Mpa) | Fu (Mpa) |
|---|---|---|---|
| 1 | 1.5 | 336 | 445 |
| 2 | 2.0 | 329 | 438 |
| 3 | 2.5 | 322 | 431 |
| Variable | Considered Values |
|---|---|
| Column height (L) | 1000, 2000 and 2500 mm |
| Cross section depth (d) | 100, 150 and 200 mm |
| Load eccentricity ratio (e/d) | 0.00, 0.125 and 0.25 |
| Steel shell thickness (t) | 1.5, 2.0 and 2.5 mm |
| Spec. | L | b | d | t | c | e | rmin | λmax | d/b | c/t | e/d |
|---|---|---|---|---|---|---|---|---|---|---|---|
| ID | (mm) | (mm) | (mm) | (mm) | (mm) | (mm) | (mm) | ||||
| 1 | 2500 | 100 | 150 | 1.5 | 75 | 37.5 | 29 | 86 | 1.5 | 50 | 0.25 |
| 2 | 2500 | 100 | 100 | 2.0 | 50 | 12.5 | 32 | 78 | 1.0 | 25 | 0.13 |
| 3 | 2500 | 100 | 200 | 2.5 | 125 | 0.0 | 29 | 86 | 2.0 | 50 | 0.00 |
| 4 | 2500 | 100 | 150 | 2.5 | 75 | 0.0 | 31 | 82 | 1.5 | 30 | 0.00 |
| 5 | 2000 | 100 | 150 | 1.5 | 75 | 37.5 | 29 | 69 | 1.5 | 50 | 0.25 |
| 6 | 2000 | 100 | 200 | 1.5 | 125 | 25.0 | 28 | 72 | 2.0 | 83 | 0.13 |
| 7 | 2000 | 100 | 100 | 2.0 | 50 | 0.0 | 32 | 63 | 1.0 | 25 | 0.00 |
| 8 | 2000 | 100 | 150 | 2.5 | 75 | 37.5 | 31 | 66 | 1.5 | 30 | 0.25 |
| 9 | 2000 | 100 | 100 | 2.5 | 50 | 12.5 | 32 | 62 | 1.0 | 20 | 0.13 |
| 10 | 2000 | 100 | 200 | 2.5 | 125 | 0.0 | 29 | 69 | 2.0 | 50 | 0.00 |
| 11 | 1000 | 100 | 100 | 2.0 | 50 | 25.0 | 32 | 31 | 1.0 | 25 | 0.25 |
| 12 | 1000 | 100 | 150 | 1.5 | 75 | 20.0 | 29 | 34 | 1.5 | 50 | 0.13 |
| 13 | 1000 | 100 | 100 | 1.5 | 50 | 0.0 | 31 | 32 | 1.0 | 33 | 0.00 |
| 14 | 1000 | 100 | 150 | 2.0 | 75 | 0.0 | 30 | 33 | 1.5 | 38 | 0.00 |
| 15 | 1000 | 100 | 100 | 2.5 | 50 | 12.5 | 32 | 31 | 1.0 | 20 | 0.13 |
| 16 | 1000 | 100 | 200 | 2.5 | 125 | 25.0 | 29 | 34 | 2.0 | 50 | 0.13 |
| Spec. ID | P Exp | Δ Minor Measured | Δ Minor Calc. | Δ Major Measured | Δ Major Calc. | Strain- Min | Strain- Max | Mode of Failure |
|---|---|---|---|---|---|---|---|---|
| (KN) | (mm) | (mm) | (mm) | (mm) | (με) | (με) | ||
| 1 | 226 | 18 | 25 | 5 | 20 | −1062 | 10 | GB |
| 2 | 233 | 40 | 21 | 53 | 6 | −935 | −329 | GB, F |
| 3 | 394 | 29 | 25 | 7 | 0 | −731 | −661 | GB |
| 4 | 464 | 28 | 23 | 2 | 0 | −968 | −891 | GB |
| 5 | 243 | 3 | 16 | 13 | 14 | −952 | −293 | F |
| 6 | 353 | 3 | 18 | 7 | 12 | −1080 | −373 | LB |
| 7 | 285 | 31 | 13 | 15 | 0 | −807 | −788 | GB, F |
| 8 | 383 | 29 | 14 | 19 | 15 | −1709 | −2 | GB, F and C |
| 9 | 442 | 1 | 13 | 29 | 6 | −1497 | −518 | F, C |
| 10 | 580 | 79 | 16 | 68 | 0 | −937 | −922 | GB, F |
| 11 | 278 | 2 | 3 | 9 | 3 | −1611 | 16 | F, C |
| 12 | 350 | 1 | 4 | 2 | 3 | −1260 | −371 | F |
| 13 | 324 | 4 | 3 | 1 | 0 | −935 | −827 | GB |
| 14 | 405 | 3 | 3 | 1 | 0 | −913 | −891 | GB |
| 15 | 451 | 2 | 3 | 7 | 2 | −1749 | −519 | F, C |
| 16 | 586 | 8 | 4 | 6 | 4 | −1028 | −881 | GB, F |
| Spec. | EXP. | AISC | Error | EN-1994 | Error | CSI-COL. | Error |
|---|---|---|---|---|---|---|---|
| ID | (kN) | (kN) | (%) | (kN) | (%) | (kN) | (%) |
| 1 | 226.0 | 172.0 | −24% | 225.0 | 0% | 246.0 | 9% |
| 2 | 233.0 | 233.0 | 0% | 284.0 | 22% | 253.0 | 9% |
| 3 | 394.0 | 393.0 | 0% | 489.0 | 24% | 422.0 | 7% |
| 4 | 464.0 | 365.0 | −21% | 423.0 | −9% | 404.0 | −13% |
| 5 | 243.0 | 268.0 | 10% | 300.0 | 23% | 263.0 | 8% |
| 6 | 353.0 | 310.0 | −12% | 354.0 | 0% | 392.0 | 11% |
| 7 | 285.0 | 329.0 | 8% | 347.0 | 13% | 328.0 | 7% |
| 8 | 383.0 | 351.0 | −8% | 324.0 | −15% | 379.0 | −1% |
| 9 | 442.0 | 336.0 | −24% | 350.0 | −21% | 431.0 | −2% |
| 10 | 580.0 | 539.0 | −7% | 570.0 | −2% | 516.0 | −11% |
| 11 | 278.0 | 301.0 | 8% | 250.0 | −10% | 269.0 | −3% |
| 12 | 350.0 | 343.0 | −2% | 332.0 | −5% | 343.0 | −2% |
| 13 | 324.0 | 328.0 | 1% | 350.0 | 8% | 332.0 | 3% |
| 14 | 405.0 | 494.0 | 9% | 517.0 | 14% | 496.0 | 9% |
| 15 | 451.0 | 406.0 | −10% | 385.0 | −15% | 400.0 | −11% |
| 16 | 586.0 | 690.0 | 18% | 714.0 | 22% | 655.0 | 12% |
Publisher’s Note: MDPI stays neutral with regard to jurisdictional claims in published maps and institutional affiliations. |
© 2022 by the authors. Licensee MDPI, Basel, Switzerland. This article is an open access article distributed under the terms and conditions of the Creative Commons Attribution (CC BY) license (https://creativecommons.org/licenses/by/4.0/).
Share and Cite
Reda, M.A.; Ebid, A.M.; Ibrahim, S.M.; El-Aghoury, M.A. Strength of Composite Columns Consists of Welded Double CF Sigma-Sections Filled with Concrete—An Experimental Study. Designs 2022, 6, 82. https://doi.org/10.3390/designs6050082
Reda MA, Ebid AM, Ibrahim SM, El-Aghoury MA. Strength of Composite Columns Consists of Welded Double CF Sigma-Sections Filled with Concrete—An Experimental Study. Designs. 2022; 6(5):82. https://doi.org/10.3390/designs6050082
Chicago/Turabian StyleReda, Mohamed A., Ahmed M. Ebid, Sherif M. Ibrahim, and Mohamed A. El-Aghoury. 2022. "Strength of Composite Columns Consists of Welded Double CF Sigma-Sections Filled with Concrete—An Experimental Study" Designs 6, no. 5: 82. https://doi.org/10.3390/designs6050082