Cholesterols, Apolipoproteins, and Their Associations with the Presence and Severity of Diabetic Retinopathy: A Systematic Review

 , and
, and
Abstract
:1. Introduction
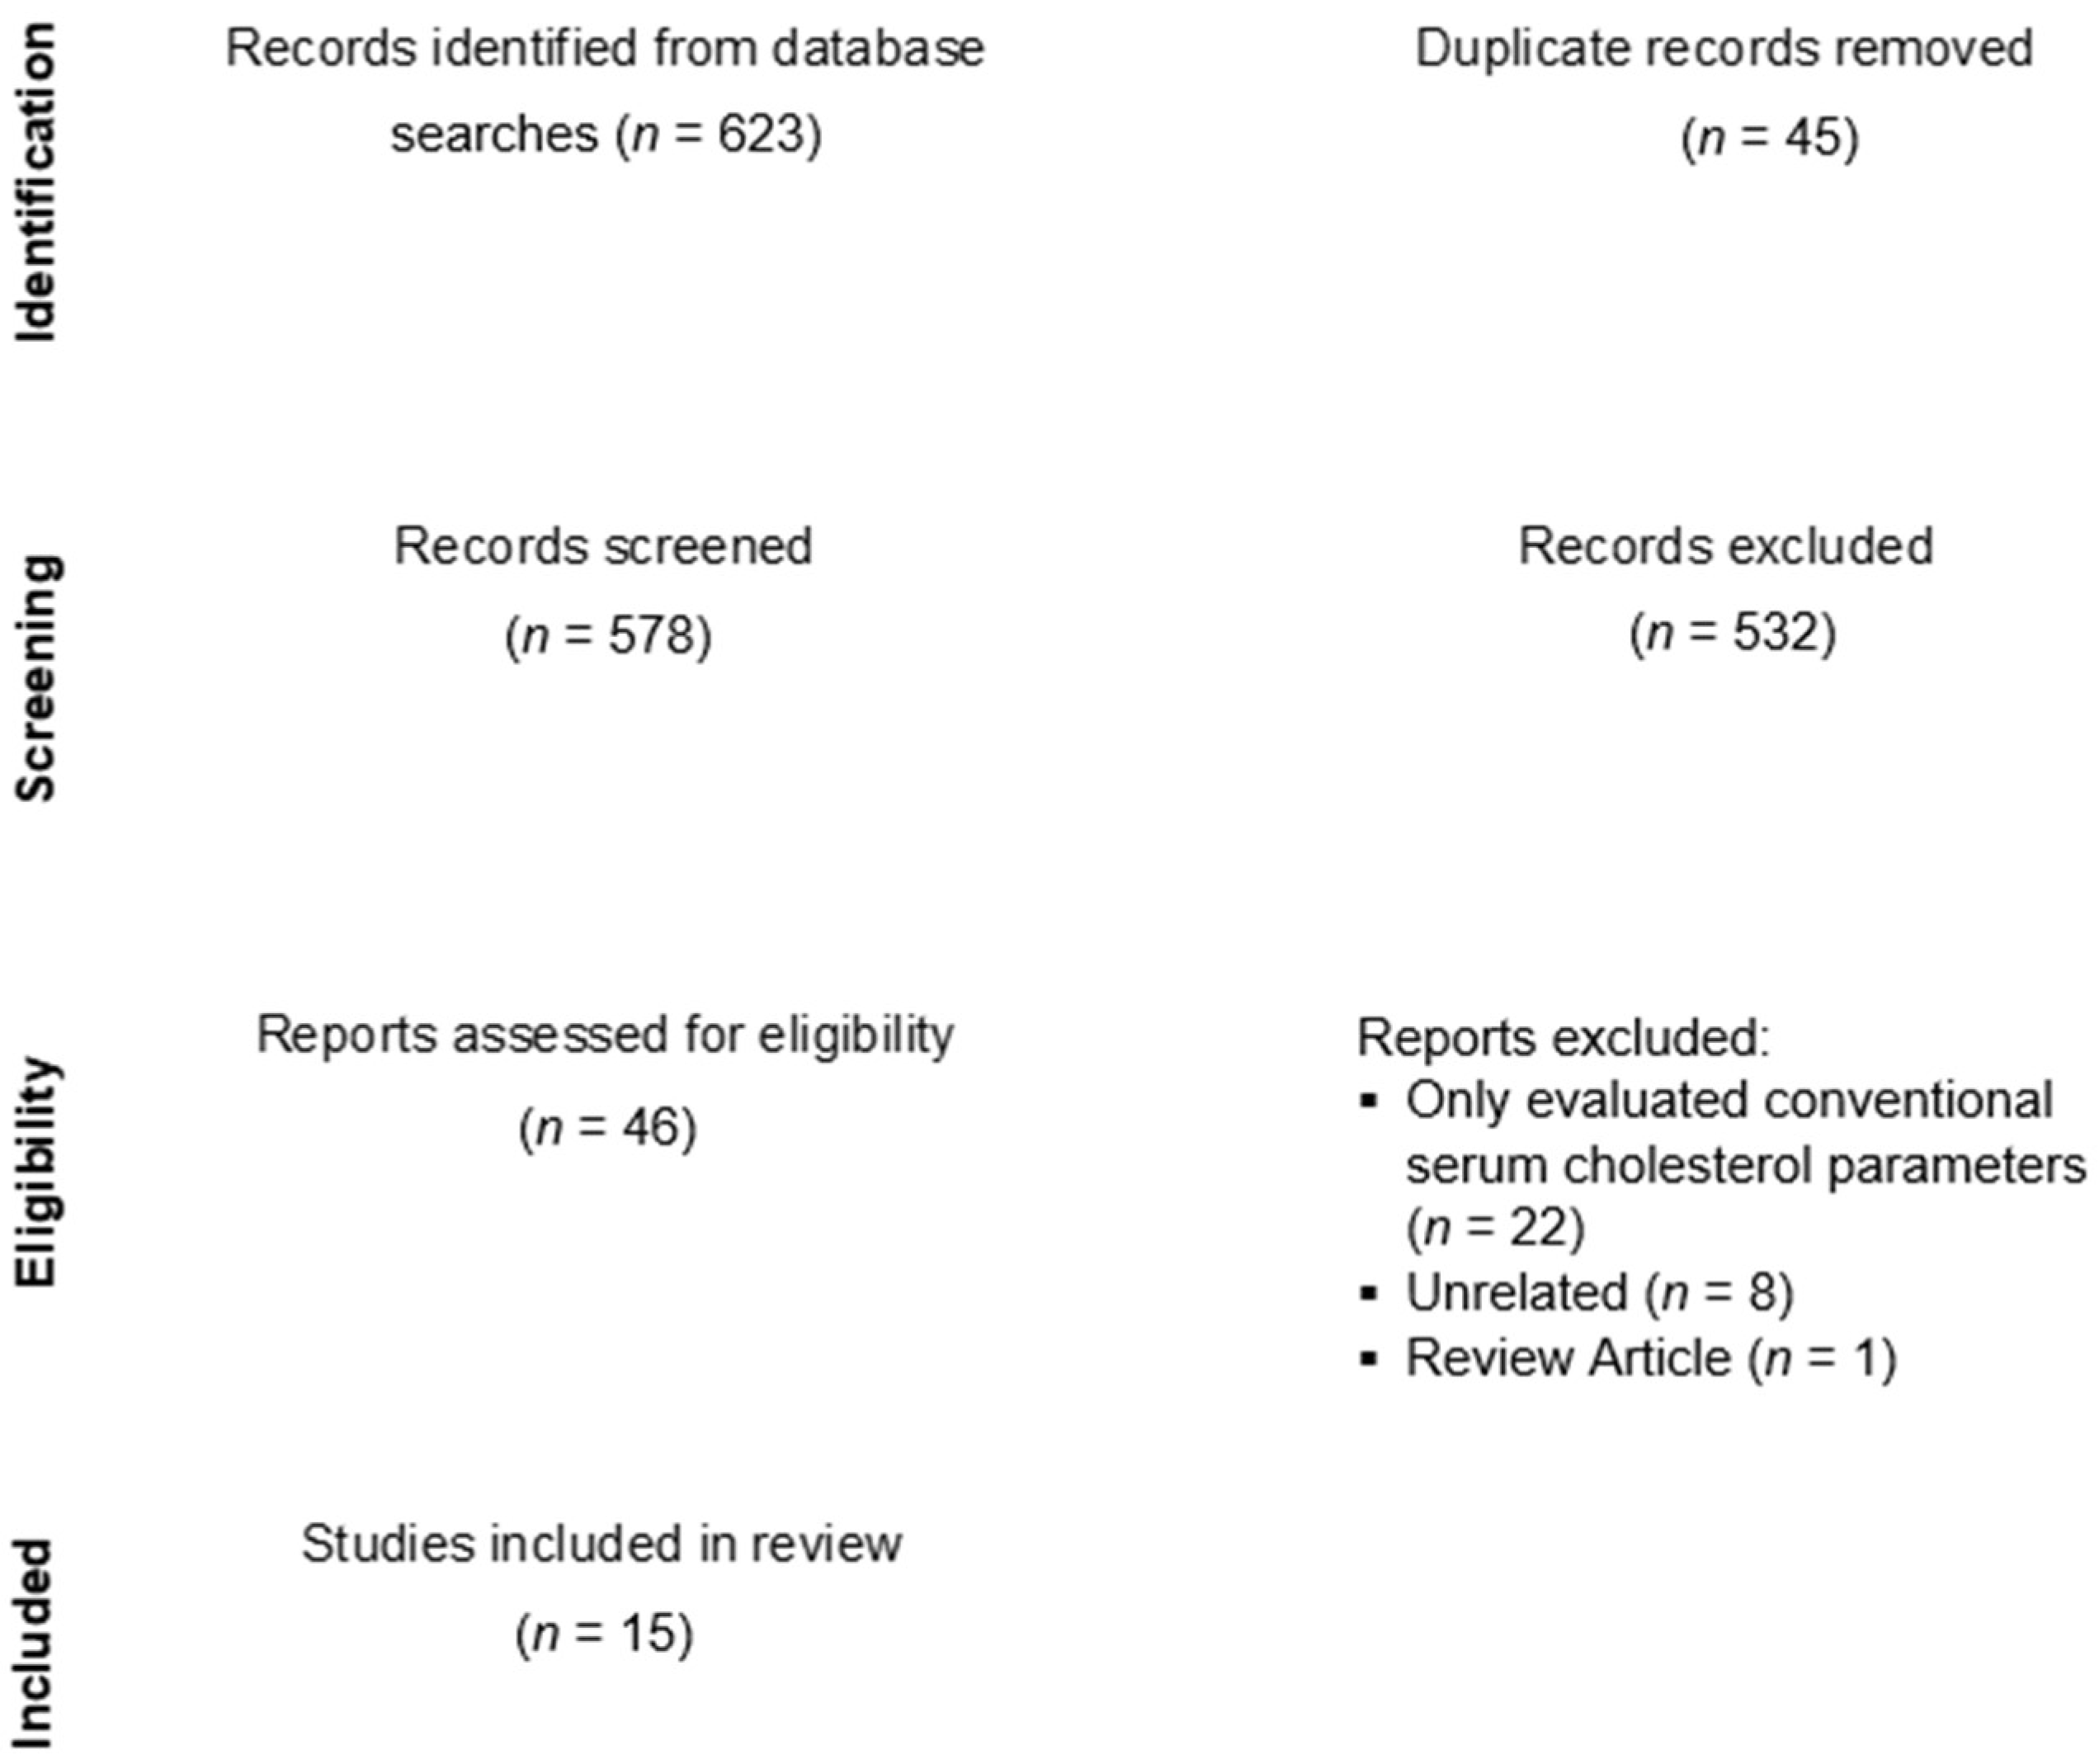
2. Materials and Methods
2.1. Search Strategy
2.2. Eligibility Criteria
2.3. Data Extraction and Quality Assessment
3. Results
3.1. Association between Serum Cholesterol, Apolipoprotein Parameters, and the Presence of DR
3.2. Association between Serum Cholesterol, Apolipoprotein Parameters, and DR Severity
4. Discussion
5. Conclusions
Author Contributions
Funding
Institutional Review Board Statement
Informed Consent Statement
Data Availability Statement
Conflicts of Interest
References
- Wilkinson-Berka, J.L.; Miller, A.G. Update on the treatment of diabetic retinopathy. Sci. World J. 2008, 8, 98–120. [Google Scholar] [CrossRef] [Green Version]
- Stratton, I.M.; Adler, A.I.; Neil, H.A.W.; Matthews, D.R.; Manley, S.E.; Cull, C.A.; Hadden, D.; Turner, R.C.; Holman, R.R. Association of glycaemia with macrovascular and microvascular complications of type 2 diabetes (UKPDS 35): Prospective observational study. BMJ 2000, 321, 405–412. [Google Scholar] [CrossRef] [Green Version]
- Selvin, E.; Francis, L.M.A.; Ballantyne, C.M.; Hoogeveen, R.C.; Coresh, J.; Brancati, F.L.; Steffes, M.W. Nontraditional markers of glycemia: Associations with microvascular conditions. Diabetes Care 2011, 34, 960–967. [Google Scholar] [CrossRef] [Green Version]
- The DCCT Research Group. The relationship of glycemic exposure (HbA1c) to the risk of development and progression of retinopathy in the diabetes control and complications trial. Diabetes 1995, 44, 968–983. [Google Scholar] [CrossRef]
- Ting, D.S.W.; Cheung, G.C.M.; Wong, T.Y. Diabetic retinopathy: Global prevalence, major risk factors, screening practices and public health challenges: A review. Clin. Exp. Ophthalmol. 2016, 44, 260–277. [Google Scholar] [CrossRef] [Green Version]
- Rema, M.; Srivastava, B.K.; Anitha, B.; Deepa, R.; Mohan, V. Association of serum lipids with diabetic retinopathy in urban South Indians—the Chennai Urban Rural Epidemiology Study (CURES) Eye Study—2. Diabet. Med. 2006, 23, 1029–1036. [Google Scholar] [CrossRef] [Green Version]
- Lyons, T.J.; Jenkins, A.J.; Zheng, D.; Lackland, D.T.; McGee, D.; Garvey, W.T.; Klein, R.L. Diabetic retinopathy and serum lipoprotein subclasses in the DCCT/EDIC cohort. Investig. Ophthalmol. Vis. Sci. 2004, 45, 910–918. [Google Scholar] [CrossRef] [Green Version]
- Chang, Y.C.; Wu, W.C. Dyslipidemia and diabetic retinopathy. Rev. Diabet. Stud. 2013, 10, 121–132. [Google Scholar] [CrossRef]
- Ferris, F.L., III; Chew, E.Y.; Hoogwerf, B.J. Serum lipids and diabetic retinopathy. Early Treatment Diabetic Retinopathy Study Research Group. Diabetes Care 1996, 19, 1291–1293. [Google Scholar] [CrossRef]
- Landmesser, U.; Hornig, B.; Drexler, H. Endothelial dysfunction in hypercholesterolemia: Mechanisms, pathophysiological importance, and therapeutic interventions. Semin. Thromb. Hemost. 2000, 26, 529–537. [Google Scholar] [CrossRef]
- Mohamed, Q.; Gillies, M.C.; Wong, T.Y. Management of diabetic retinopathy: A systematic review. JAMA 2007, 298, 902–916. [Google Scholar] [CrossRef] [Green Version]
- Sabanayagam, C.; Yip, W.F.; Ting, D.S.W.; Tan, G.; Wong, T.Y. Ten emerging trends in the epidemiology of diabetic retinopathy. Ophthalmic Epidemiol 2016, 23, 209–222. [Google Scholar] [CrossRef]
- Crosby-Nwaobi, R.; Chatziralli, I.; Sergentanis, T.; Dew, T.; Forbes, A.; Sivaprasad, S. Cross talk between lipid metabolism and inflammatory markers in patients with diabetic retinopathy. J. Diabetes Res. 2015, 2015, 191382. [Google Scholar] [CrossRef] [Green Version]
- Sasongko, M.B.; Wong, T.Y.; Nguyen, T.T.; Kawasaki, R.; Jenkins, A.; Shaw, J.; Wang, J.J. Serum apolipoprotein AI and B are stronger biomarkers of diabetic retinopathy than traditional lipids. Diabetes Care 2011, 34, 474–479. [Google Scholar] [CrossRef] [Green Version]
- Simó, R.; García-Ramírez, M.; Higuera, M.; Hernández, C. Apolipoprotein A1 is overexpressed in the retina of diabetic patients. Am. J. Ophthalmol. 2009, 147, 319–325. [Google Scholar] [CrossRef]
- Simó, R.; Higuera, M.; García-Ramírez, M.; Canals, F.; García-Arumí, J.; Hernández, C. Elevation of apolipoprotein A-I and apolipoprotein H levels in the vitreous fluid and overexpression in the retina of diabetic patients. Arch. Ophthalmol. 2008, 126, 1076–1081. [Google Scholar] [CrossRef] [Green Version]
- Deguchi, Y.; Maeno, T.; Saishin, Y.; Hori, Y.; Shiba, T.; Takahashi, M. Relevance of the serum apolipoprotein ratio to diabetic retinopathy. Jpn. J. Ophthalmol. 2011, 55, 128–131. [Google Scholar] [CrossRef]
- Hu, A.; Luo, Y.; Li, T.; Guo, X.; Ding, X.; Zhu, X.; Wang, X.; Tang, S. Low serum apolipoprotein A1/B ratio is associated with proliferative diabetic retinopathy in type 2 diabetes. Graefes Arch. Clin. Exp. Ophthalmol. 2012, 250, 957–962. [Google Scholar] [CrossRef]
- Malaguarnera, G.; Gagliano, C.; Bucolo, C.; Vacante, M.; Salomone, S.; Malaguarnera, M.; Leonardi, D.G.; Motta, M.; Drago, F.; Avitabile, T. Lipoprotein(a) serum levels in diabetic patients with retinopathy. BioMed Res. Int. 2013, 2013, 943505. [Google Scholar] [CrossRef] [Green Version]
- Prakash, G.; Agrawal, R.; Satsangi, S.K.; Prakash, S. Comparison of serum apolipoproteins and traditional lipids in eyes with diabetic retinopathy in Indian population: A case series. Middle East Afr. J. Ophthalmol. 2016, 23, 212–214. [Google Scholar]
- Aryan, Z.; Afarideh, M.; Ghajar, A.; Esteghamati, S.; Esteghamati, A.; Nakhjavani, M. Conflicting interactions of apolipoprotein A and high density lipoprotein cholesterol with microvascular complications of type 2 diabetes. Diabetes Res. Clin. Pract. 2017, 133, 131–141. [Google Scholar] [CrossRef]
- Sharma, Y.; Saxena, S.; Mishra, A.; Saxena, A.; Natu, S.M. Apolipoprotein A-I and B and Subjective Global Assessment relationship can reflect lipid defects in diabetic retinopathy. Nutrition 2017, 33, 70–75. [Google Scholar] [CrossRef]
- Mukherjee, B.; Shankar, S.; Ahmed, R.; Singh, K.; Bhatia, K. Association of glycated haemoglobin and serum apolipoproteins with diabetic retinopathy: An Indian overview. J. Clin. Diagn Res. 2017, 11, BC19–BC23. [Google Scholar] [CrossRef]
- Ankit, B.S.; Mathur, G.; Agrawal, R.P.; Mathur, K.C. Stronger relationship of serum apolipoprotein A-1 and B with diabetic retinopathy than traditional lipids. Indian J. Endocrinol. Metab. 2017, 21, 102–105. [Google Scholar]
- Zhang, Q.; Hu, J.; Hu, Y.; Ding, Y.; Zhu, J.; Zhuang, C. Relationship between serum apolipoproteins levels and retinopathy risk in subjects with type 2 diabetes mellitus. Acta Diabetol. 2018, 55, 681–689. [Google Scholar] [CrossRef]
- Chung, J.O.; Park, S.Y.; Cho, D.H.; Chung, D.J.; Chung, M.Y. Associations between serum apolipoproteins, urinary albumin excretion rate, estimated glomerular filtration rate, and diabetic retinopathy in individuals with type 2 diabetes. Med. (Baltim.) 2019, 98, e15703. [Google Scholar] [CrossRef]
- Moosaie, F.; Davatgari, R.M.; Firouzabadi, F.D.; Esteghamati, S.; Deravi, N.; Meysamie, A.; Khaloo, P.; Nakhjavani, M.; Esteghamati, A. Lipoprotein(a) and apolipoproteins as predictors for diabetic retinopathy and its severity in adults with type 2 diabetes: A case-cohort study. Can. J. Diabetes 2020, 44, 414–421. [Google Scholar] [CrossRef]
- Hanifah, S.; Mahayana, I.T.; Suhardjo; Agni, A.N.; Triyono, T. Differences of apolipoprotein A1 and apolipoprotein B levels in type 2 diabetes mellitus (T2DM) patients with diabetic retinopathy and without diabetic retinopathy. Int. J. Retin. 2021, 4, 93–98. [Google Scholar] [CrossRef]
- Liu, Z.; Shao, M.; Ren, J.; Qiu, Y.; Li, S.; Cao, W. Association between increased lipid profiles and risk of diabetic retinopathy in a a population-based case-control study. J. Inflamm. Res. 2022, 15, 3433–3446. [Google Scholar] [CrossRef]
- Chou, Y.; Ma, J.; Su, X.; Zhong, Y. Emerging insights into the relationship between hyperlipidemia and the risk of diabetic retinopathy. Lipids Health Dis. 2020, 19, 241. [Google Scholar] [CrossRef]
- Rao, H.; Jalali, J.A.; Johnston, T.P.; Koulen, P. Emerging roles of dyslipidemia and hyperglycemia in diabetic retinopathy: Molecular mechanisms and clinical perspectives. Front. Endocrinol. (Lausanne) 2021, 12, 620045. [Google Scholar] [CrossRef]
- Klein, B.E.; Moss, S.E.; Klein, R.; Surawicz, T.S. The Wisconsin Epidemiologic Study of Diabetic Retinopathy. XIII. Relationship of serum cholesterol to retinopathy and hard exudate. Ophthalmology 1991, 98, 1261–1265. [Google Scholar] [CrossRef]
- Benarous, R.; Sasongko, M.B.; Qureshi, S.; Fenwick, E.; Dirani, M.; Wong, T.Y.; Lamoureux, E.L. Differential association of serum lipids with diabetic retinopathy and diabetic macular edema. Investig. Ophthalmol. Vis. Sci. 2011, 52, 7464–7469. [Google Scholar] [CrossRef]
- Davidson, M.H. Apolipoprotein measurements: Is more widespread use clinically indicated? Clin. Cardiol. 2009, 32, 482–486. [Google Scholar] [CrossRef]
- Marcovina, S.; Packard, C.J. Measurement and meaning of apolipoprotein AI and apolipoprotein B plasma levels. J. Intern. Med. 2006, 259, 437–446. [Google Scholar] [CrossRef]
- Sniderman, A.D.; Bergeron, J.; Frohlich, J. Apolipoprotein B versus lipoprotein lipids: Vital lessons from the AFCAPS/TexCAPS trial. CMAJ 2001, 164, 44–47. [Google Scholar]
- Robbesyn, F.; Augé, N.; Vindis, C.; Cantero, A.-V.; Barbaras, R.; Negre-Salvayre, A.; Salvayre, R. High-density lipoproteins prevent the oxidized low-density lipoprotein-induced epidermal [corrected] growth factor receptor activation and subsequent matrix metalloproteinase-2 upregulation. Arterioscler. Thromb. Vasc. Biol. 2005, 25, 1206–1212. [Google Scholar] [CrossRef] [Green Version]
- Tserentsoodol, N.; Gordiyenko, N.V.; Pascual, I.; Lee, J.W.; Fliesler, S.J.; Rodriguez, I.R. Intraretinal lipid transport is dependent on high density lipoprotein-like particles and class B scavenger receptors. Mol. Vis. 2006, 12, 1319–1333. [Google Scholar]
- Wu, M.; Chen, Y.; Wilson, K.; Chirindel, A.; Ihnat, M.A.; Yu, Y.; Boulton, M.E.; Szweda, L.I.; Ma, J.-X.; Lyons, T.J. Intraretinal leakage and oxidation of LDL in diabetic retinopathy. Investig. Ophthalmol. Vis. Sci. 2008, 49, 2679–2685. [Google Scholar] [CrossRef]
- Walldius, G.; Jungner, I. The apoB/apoA-I ratio: A strong, new risk factor for cardiovascular disease and a target for lipid-lowering therapy--a review of the evidence. J. Intern. Med. 2006, 259, 493–519. [Google Scholar] [CrossRef]
- Xiong, X.; Liu, H.; Hua, L.; Zhao, H.; Wang, D.; Li, Y. The association of HDL-apoCIII with coronary heart disease and the effect of statin treatment on it. Lipids Health Dis. 2015, 9, 127. [Google Scholar] [CrossRef] [Green Version]
- Singh, P.P.; Singh, M.; Mastana, S.S. APOE distribution in world populations with new data from India and the UK. Ann. Hum. Biol. 2006, 33, 279–308. [Google Scholar] [CrossRef]
- Civeira, F.; Pocoví, M.; Cenarro, A.; Casao, E.; Vilella, E.; Joven, J.; González, J.; Garcia-Otín, A.L.; Ordovás, J.M. Apo E variants in patients with type III hyperlipoproteinemia. Atherosclerosis 1996, 127, 273–282. [Google Scholar] [CrossRef]
- Mahley, R.W. Apolipoprotein E: Cholesterol transport protein with expanding role in cell biology. Science 1988, 240, 622–630. [Google Scholar] [CrossRef]
- Masuda, T.; Shimazawa, M.; Hashimoto, Y.; Kojima, A.; Nakamura, S.; Suemori, S.; Mochizuki, K.; Kawakami, H.; Kawase, K.; Hara, H. Apolipoprotein E2 and E3, but not E4, promote retinal pathologic neovascularization. Investig. Ophthalmol. Vis. Sci. 2017, 58, 1208–1217. [Google Scholar] [CrossRef] [Green Version]
- Galvano, F.; Malaguarnera, M.; Vacante, M.; Motta, M.; Russo, C.; Malaguarnera, G.; D’Orazio, N.; Malaguarnera, L. The physiopathology of lipoprotein (a). Front. Biosci. (Schol. Ed.) 2010, 2, 866–875. [Google Scholar]
- Lenzi, S.; Scanu, A.; De Caterina, R. Lipoprotein(a) as an athero-thrombotic risk factor: Epidemiologic evidence and possible pathogenetic mechanisms. G. Ital. Di Cardiol. 1996, 26, 1203–1225. [Google Scholar]
- Tu, W.J.; Liu, H.; Liu, Q.; Cao, J.L.; Guo, M. Association between serum lipoprotein(a) and diabetic retinopathy in Han Chinese patients with type 2 diabetes. J. Clin. Endocrinol. Metab. 2017, 102, 2525–2532. [Google Scholar] [CrossRef] [Green Version]
- Yun, J.S.; Lim, T.S.; Cha, S.A.; Ahn, Y.B.; Song, K.H.; Choi, J.A.; Kwon, J.; Jee, D.; Cho, Y.K.; Park, Y.M.; et al. Lipoprotein(a) predicts the development of diabetic retinopathy in people with type 2 diabetes mellitus. J. Clin. Lipidol. 2016, 10, 426–433. [Google Scholar] [CrossRef]
- Maioli, M.; Tonolo, G.; Pacifico, A.; Ciccarese, M.; Brizzi, P.; Kohner, E.M.; Porta, M. Raised serum apolipoprotein (a) in active diabetic retinopathy. Diabetologia 1993, 36, 88–90. [Google Scholar] [CrossRef] [Green Version]
- Woodman, R.J.; Watts, G.F.; Playford, D.A.; Best, J.D.; Chan, D.C. Oxidized LDL and small LDL particle size are independently predictive of a selective defect in microcirculatory endothelial function in type 2 diabetes. Diabetes Obes. Metab. 2005, 7, 612–617. [Google Scholar] [CrossRef]


| Author | Age, Years | Diabetes Duration, Years | HbA1C Level, % | Lipid Lowering Treatment | Apolipoprotein Measurement Assay |
|---|---|---|---|---|---|
| Deguchi et al. [17] (2011) | NPDR: 64.8 ± 7.36 PDR: 59.4 ± 10.0 | NPDR: 10.4 ± 7.17 PDR: 12.5 ± 8.72 | NPDR: 7.72 ± 1.62 PDR: 7.13 ± 1.04 | NPDR: 29% PDR: 24% | Serum immunonephelometric |
| Sasongko et al. [14] (2011) | With DR: 60 (52–66) Without DR: 58 (49–66) | With DR: 18 (10–24) Without DR: 10 (6–17) | With DR: 8.0 ± 1.2 Without DR: 7.6 ± 1.7 | With DR: 58.1% Without DR: 46.3% | Serum immunonephelometric |
| Hu et al. [18] (2012) | NPDR: 64.44 ± 7.86 PDR: 59.28 ± 7.49 | Not mentioned | Not mentioned | NPDR: 80% PDR: 88% | Serum immunoturbidimetric |
| Malaguarnera et al. [19] (2013) | All: 66.8 ± 12.4 | With DR: 13.8 Without DR: 5.4 | With DR: 8.8 ± 0.6 Without DR: 7.2 ± 0.7 | Not mentioned | Serum nephelometric |
| Crosby-Nwaobi et al. [13] (2015) | NPDR: 67.3 ± 12.9 PDR: 66.4 ± 9.9 | NPDR: 18.8 ± 8.8 PDR: 13.5 ± 6.4 | Not mentioned | Not mentioned | Serum immunoturbidimetric |
| Prakash et al. [20] (2016) | Not mentioned | Mild NPDR: 9.5 ± 0.57 Mod NPDR: 10.50 ± 2.32 VTDR: 13 ± 1.90 | Mild NPDR: 8.3 ± 0.57 Moderate NPDR: 8.67 ± 0.20 VTDR: 11.48 ± 2.25 | Not mentioned | Serum immunonephelometric |
| Aryan et al. [21] (2017) | With DR: 57.9 ± 9.7 Without DR: 57.5 ± 9.1 | With DR: 9.8 ± 7.8 Without DR: 6.5 ± 6.1 | With DR: 8.1 ± 1.7 Without DR: 7.6 ± 1.5 | Not mentioned | Serum immunoturbidimetric |
| Sharma et al. [22] (2017) | NPDR: 55.5 ± 7.0 PDR: 51.9 ± 7.5 | NPDR: 10.0 ± 5.2 PDR: 14.1 ± 6.9 | NPDR: 7.7 ± 1.5 PDR: 7.3 ± 1.2 | Not mentioned | Serum immunoturbidimetric |
| Mukherjee et al. [23] (2017) | Not mentioned | Not mentioned | Mild NPDR: 8.82 ± 1.64 Mod NPDR: 6.34 ± 0.89 Sev NPDR: 7.85 ± 0.97 PDR: 7.00 ± 1.15 | Not mentioned | Serum nephelometric |
| Ankit et al. [24] (2017) | Not mentioned | Not mentioned | Not mentioned | Not mentioned | Serum immunoturbidimetric |
| Zhang et al. [25] (2018) | With DR: 57.8 ± 5.8 Without DR: 56.7 ± 5.8 | With DR: 8.0 ± 3.3 Without DR: 3.4 ± 1.0 | With DR: 8.6 ± 1.7 Without DR: 7.9 ± 1.7 | With DR: 37.2% Without DR: 35.9% | Serum immunonephelometric |
| Chung et al. [26] (2019) | With DR: 63 ± 11.3 Without DR: 57.8 ± 14.1 | With DR: 11.3 (10.3–12.4) Without DR: 4.1 (3.8–4.4) | With DR:9.0 ± 2.2 Without DR: 8.7 ± 2.5 | With DR: 36.7% Without DR: 31.9% | Serum immunoturbidimetric |
| Moosaie et al. [27] (2020) | NPDR: 58.92 ± 9.46 PDR: 60.9 ± 7.4 | NPDR: 13.65 ± 6.41 PDR: 17.3 ± 7.9 | NPDR: 7.85 ± 1.73 PDR: 8.4 ± 1.6 | NPDR: 49.5% PDR: 50.5% | Serum immunoturbidimetric |
| Hanifah et al. [28] (2021) | With DR: 54.5 ± 6.72 Without DR: 57.4 ± 7.5 | With DR: 9.8 ± 5.7 Without DR: 8.1 ± 5.5 | With DR: 8.9 ± 2.5 Without DR: 8.7 ± 2.2 | Not mentioned | Not mentioned |
| Liu et al. [29] (2022) | With DR: 56.6 ± 11.8 Without DR: 57.3 ± 10.6 | With DR: 12.85 ± 8.16 Without DR: 5.24 ± 6.12 | With DR: 7.70 ± 1.53 Without DR: 7.10 ± 1.29 | With DR: 6.47% Without DR: 4.84 % | Serum immunoturbidimetric |
| Author | Number of Participants | Mean Levels of Apolipoprotein Parameters | Mean Levels of Cholesterol Parameters | Outcomes Related to the Presence of DR |
|---|---|---|---|---|
| Sasongko et al. [14] (2011) | With DR: 129 Without DR: 95 | Apo-A1 With DR: 1.4 ± 0.3 g/L Without DR: 1.5 ± 0.2 g/L Apo-B With DR: 0.9 ± 0.3 g/L Without DR: 0.8 ± 0.2 g/L Apo-B/Apo-A1 With DR: 0.7 ± 0.2 Without DR: 0.6 ± 0.2 | TG With DR: 1.3 (0.9, 1.9) mmol/L Without DR: 1.3 (0.9, 1.9) mmol/L HDL With DR: 1.3 ± 0.5 mmol/L Without DR: 1.5 ± 0.4 mmol/L LDL With DR: 2.5 ± 0.9 mmol/L Without DR: 2.5 ± 0.7 mmol/L | Odds ratio (95% CI) for any DR per SD increase of: Apo-A1: 0.76 (0.59–0.98) Apo-B: 1.31 (1.02–1.68) Apo-B/Apo-A1: 1.48 (1.13–1.95) Odds ratio (95% CI) for VTDR per SD increase of: Apo-A1: 0.53 (0.38–0.76) Apo-B: 1.47 (1.10–1.96) Apo-B/Apo-A1: 1.76 (1.27–2.45) |
| Malaguarnera et al. [19] (2013) | With DR: 67 Without DR: 78 | Apo-A1 With DR: 1.54 ± 0.18 g/L Without DR: 1.47 ± 0.20 g/L Apo-B With DR: 1.08 ± 0.21 g/L Without DR: 1.06 ± 0.19 g/L Lp(a) With DR: 56.4 ± 28.2 mg/dL Without DR: 34.1 ± 12.4 mg/dL | TG With DR: 1.67 ± 0.76 mmol/L Without DR: 1.48 ± 0.88 mmol/L HDL With DR: 1.44 ± 0.36 mmol/L Without DR: 1.36 ± 0.30 mmol/L LDL With DR: 4.19 ± 0.99 mmol/L Without DR: 3.87 ± 0.95 mmol/L | Mean difference between groups for each parameter: Apo-A1: p = 0.03 Apo-B: p = 0.55 Lp(a): p < 0.01 LDL: p = 0.05 HDL: p = 0.15 TG: p = 0.17 |
| Aryan et al. [21] (2017) | With DR: 444 Without DR: 439 | Apo-A1 With DR: 141.8 ± 28.5 mg/dL Without DR: 135.6 ± 27.9 mg/dL Apo-B With DR: 88.1 ± 27.5 mg/dL Without DR: 85.8 ± 26.2 mg/dL Lp(a) With DR: 35.9 ± 42.2 mg/dL Without DR: 31.5 ± 34.4 mg/dL Apo-B/Apo-A1 With DR: 0.63 ± 0.24 Without DR: 0.64 ± 0.24 | TG With DR: 175.9 ± 82.9 mg/dL Without DR: 170.8 ± 111.0 mg/dL HDL With DR: 45.7 ± 11.8 mg/dL Without DR: 45.6 ± 12.4 mg/dL LDL With DR: 106.5 ± 34.6 mg/dL Without DR: 102.5 ± 31.4 mg/dL | Logistic regression analysis for association with DR: Lp(a): β 0.37; OR 2.8; 95% CI 0.93–8.4 (p = 0.37) Apo-A1: β 0.01; OR 1.1; 95% CI 0.41–2.9 (p = 0.34) Apo-B: β 0.20; OR 2.4; 95% CI 0.8–7.2 (p = 0.87) Apo-B/Apo-A1: β 0.56; OR 3.4; 95% CI 0.89–12.9 (p = 0.45) |
| Zhang et al. [25] (2018) | With DR: 315 Without DR: 708 | Apo-A1 With DR: 7.3 ± 1.2 μmol/L Without DR: 7.5 ± 1.2 μmol/L Apo-CIII With DR: 6.4 ± 1.1 μmol/L Without DR: 6.2 ± 1.1 μmol/L Apo-D With DR: 3.9 ± 0.6 μmol/L Without DR: 4.0 ± 0.6 μmol/L Apo-E With DR: 1.2 ± 0.2 μmol/L Without DR: 1.1 ± 0.2 μmol/L | TG With DR: 1.3 ± 0.4 mmol/L Without DR: 1.2 ± 0.5 mmol/L HDL With DR: 1.4 ± 0.6 mmol/L Without DR: 1.5 ± 0.5 mmol/L | Cox proportional hazard analysis for DR risk: Apo-A1 ≥ 7.4: HR 0.86; 95% CI 0.70–0.99 Apo-CIII ≥ 6.3: HR 1.25; 95% CI 1.04–1.49 Apo-E ≥ 1.1: HR 1.23; 95% CI 1.03–1.47 Apo-CIII/Apo-A1 ≥ 0.9: HR 1.34; 95% CI 1.11–1.60 Apo-E/Apo-A1 ≥ 0.2: HR 1.21; 95% CI 1.01–1.46 |
| Chung et al. [26] (2019) | Without DR: 743 With DR: 472 | Apo-A1 With DR: 1.20 (1.17–1.23) g/L Without DR: 1.26 (1.24–1.29) g/L Apo-B With DR: 0.86 (0.84–0.89) g/L Without DR: 0.87 (0.85–0.90) g/L Apo-B/Apo-A1 With DR: 0.72 (0.70–0.74) Without DR: 0.75 (0.73–0.78) | TG With DR: 1.46 (1.39–1.53) mmol/L Without DR: 1.54 (1.48–1.60) mmol/L HDL With DR: 1.12 ± 0.37 mmol/L Without DR: 1.17 ± 0.35 mmol/L LDL With DR: 2.78 ± 1.01 mmol/L Without DR: 2.84 ± 1.03 mmol/L | Logistic regression analyses for DR risk: Apo-A1 OR per SD increase 0.55; 95% CI: 0.32–0.97 (p = 0.04) Apo-B OR per SD increase 1.28; 95% CI: 0.85–1.93 (p = 0.23) Apo-B/Apo-A1 OR per SD increase 2.83; 95% CI: 1.18–6.76 (p = 0.02) |
| Liu et al. [29] (2022) | With DR: 309 Without DR: 186 | Apo-A1 With DR: 1.29 ± 0.29 mmol/L Without DR: 1.34 ± 0.41 mmol/L Apo-B With DR: 1.01 ± 0.34 mmol/L Without DR: 1.02 ± 0.26 mmol/L Apo-E With DR: 45.74 ± 20.80 mmol/L Without DR: 47.36 ± 24.96 mmol/L Lp(a) With DR: 179.12 ± 256.68 mmol/L Without DR: 141.64 ± 183.54 mmol/L | TG With DR: 1.80 ± 1.26 mmol/L Without DR: 2.24 ± 2.01 mmol/L HDL With DR: 1.25 ± 0.34 mmol/L Without DR: 1.40 ± 2.13 mmol/L LDL With DR: 2.85 ± 1.11 mmol/L Without DR: 3.00 ± 0.88 mmol/L | Logistic regression analyses for DR risk: Apo-A1 OR 1.91; 95% CI: 0.94–3.88 (p = 0.07) Apo-B OR 7.04; 95% CI: 3.37–14.70 (p < 0.001) Apo-E OR 1.06; 95% CI: 1.04–1.08 (p < 0.001) Lp(a) OR 1.00; 95% CI: 1.00–1.00 (p = 0.27) |
| Author | Number of Participants | Mean Levels of Apolipoprotein Parameters | Mean Levels of Cholesterol Parameters | Outcomes Related to DR Severity |
|---|---|---|---|---|
| Deguchi et al. [17] (2011) | NPDR: 34 PDR: 82 | Apo-A1 NPDR: 145.6 ± 21.2 mg/dL PDR: 136.9 ± 24.9 mg/dL Apo-B NPDR: 90.8 ± 21.4 mg/dL PDR: 102.5 ± 25.3 mg/dL Apo-B/Apo-A1 NPDR: 0.64 ± 0.20 PDR: 0.77 ± 0.24 | TG NPDR: 121.3 ± 52.4 mg/dL PDR: 139.1 ± 92.9 mg/dL HDL NPDR:55.4 ± 12.3 mg/dL PDR: 47.8 ± 13.0 mg/dL LDL NPDR: 108.8 ± 32.0 mg/dL PDR: 118.9 ± 33.5 mg/dL | Apo-B/Apo-A1 to PDR: Standard regression coefficient 0.28 t value 3.06 p = 0.003 |
| Hu et al. [18] (2012) | Mild NPDR: 25 PDR: 25 | Apo-A1 Mild NPDR: 1.38 ± 0.22 g/L PDR: 1.22 ± 0.26 g/L Apo-B Mild NPDR: 0.78 ± 0.16 g/L PDR: 0.82 ± 0.18 g/L Apo-E Mild NPDR: 43.02 ± 11.12 mg/L PDR: 43.57 ± 13.10 mg/L Apo-A1/Apo-B Mild NPDR: 1.81 ± 0.40 PDR: 1.52 ± 0.33 | TG Mild NPDR: 1.82 ± 0.85 mmol/L PDR: 1.97 ± 0.86 mmol/L HDL Mild NPDR: 1.36 ± 0.30 mmol/L PDR: 1.19 ± 0.27 mmol/L LDL Mild NPDR: 3.30 ± 1.12 mmol/L PDR: 3.41 ± 1.08 mmol/L | Logistic regression analysis for association with PDR: Apo-A1: OR 0.026; 95% CI < 0.01–0.45 (p = 0.03) Apo-A1/Apo-B: OR 0.05, 95% CI 0.01–0.42 (p = 0.02) |
| Crosby-Nwaobi et al. [13] (2015) | NPDR: 252 PDR: 128 | Apo-A NPDR: 1.4 ± 0.5 g/L PDR: 1.5 ± 0.3 g/L Apo-B NPDR: 0.5 ± 0.5 g/L PDR: 0.8 ± 0.2 g/L Apo-B/Apo-A NPDR: 0.39 ± 0.32 PDR: 0.54 ± 0.18 | Not reported | Multinomial logistic regression analysis for (compared with NPDR without CSME as reference): PDR (without CSME): Apo-B: OR 1.20; 95% CI 1.06–1.36 (p <0.01) Apo-B/Apo-A: OR 1.18; 95% CI 1.01–1.38 (p = 0.04) PDR (with CSME): Apo-B: OR 1.20; 95% CI 1.01–1.43 (p = 0.04) Apo-B/Apo-A: OR 1.25; 95% CI 0.99–1.59 (p = 0.06) |
| Prakash et al. [20] (2016) | Mild NPDR: 4 Moderate NPDR: 8 VTDR:12 | Apo-A1 * Mild NPDR: 211.16 ± 2.02 Moderate NPDR: 168.77 ± 33.97 VTDR: 132.25 ± 2.02 Apo-B * Mild NPDR: 99.40 ± 0.69 Moderate NPDR: 144.50 ± 36.33 VTDR: 188.98 ± 41.57 Apo-B/Apo-A1 Mild NPDR: 0.67 ± 0.08 Moderate NPDR: 1.11 ± 0.28 VTDR: 1.66 ± 0.56 | TG * Mild NPDR: 130 ± 0 Moderate NPDR: 136 ± 16.47 VTDR: 163.08 ± 23.06 HDL * Mild NPDR: 45.50 ± 4.0 Moderate NPDR: 47.75 ± 6.6 VTDR: 40 ± 6.0 LDL* Mild NPDR: 119.90 ± 13.97 Moderate NPDR: 119.90 ± 28.59 VTDR: 139.83 ± 19.78 | Mean difference between groups for each parameter: Apo-A1: p < 0.01 Apo-B: p < 0.01 Apo-B/Apo-A1: p < 0.01 LDL: p = 0.10 HDL: p = 0.02 TG: p = 0.01 |
| Sharma et al. [22] (2017) | NPDR: 49 PDR: 48 | Apo-A1 NPDR: 126.9 ± 12.5 mg/dL PDR: 118.6 ± 9.7 mg/dL Apo-B NPDR: 94.5 ± 17.7 mg/dL PDR: 101.5 ± 15.7 mg/dL Apo-B/Apo-A1 NPDR: 0.7 ± 0.1 PDR: 0.8 ± 0.1 | TG NPDR: 145.7 ± 60.0 mg/dL PDR: 165.0 ± 63.3 mg/dL HDL NPDR: 48.1 ± 14.7 mg/dL PDR: 45.9 ± 10.9 mg/dL LDL NPDR: 108.5 ± 37.5 mg/dL PDR: 121.2 ± 41.4 mg/dL | Mean difference between groups: Apo-A1: p < 0.01 Apo-B: p < 0.01 Apo-B/Apo-A1: p < 0.01 TG: p < 0.05 HDL: p = 0.14 LDL: p < 0.05 |
| Mukherjee et al. [23] (2017) | Mild NPDR: 25 Mod NPDR: 25 Severe NPDR: 25 PDR: 35 | Apo-A1 Mild NPDR: 1.47 ± 0.12 mg/dLMod NPDR: 1.23 ± 0.21 mg/dL Severe NPDR: 1.67 ± 0.17 mg/dL PDR: 1.21 ± 0.34 mg/dL Apo-B Mild NPDR: 0.84 ± 0.08 mg/dL Mod NPDR: 0.67 ± 0.13 mg/dL Severe NPDR: 1.14 ± 0.18 mg/dL PDR: 1.13 ± 0.43 mg/dL | TG Mild NPDR: 132.3 ± 27.6 mg/dL Mod NPDR: 167.7 ± 28.7 mg/dL Sev NPDR: 286.4 ± 64.4 mg/dL PDR: 191.1 ± 50.8 mg/dL HDL Mild NPDR: 41.0 ± 3.6 mg/dL Mod NPDR: 36.6 ± 2.5 mg/dL Severe NPDR: 39.8 ± 3.2 mg/dL PDR: 41.6 ± 3.4 mg/dL LDL Mild NPDR: 116.2 ± 31.9 mg/dL Mod NPDR: 113.8 ± 23.8 mg/dL Sev NPDR: 183.8 ± 69.8 mg/dL PDR: 99.8 ± 38.4 mg/dL | Significant mean difference (p < 0.05) between groups for each parameter: Apo-A1: Between any type of DR with patients without DR. Apo-B: Between severe NPDR and PDR with patients without DR. |
| Ankit et al. [24] (2017) | Mild NPDR: 50 Moderate NPDR: 38 Severe NPDR: 20 PDR: 9 | Apo-A1 Mild NPDR: 148.86 mg/dL Moderate NPDR: 124.39 mg/dL Severe NPDR: 110.30 mg/dL PDR: 103.22 mg/dL Apo-B Mild NPDR: 74.98 mg/dL Moderate NPDR: 96.45 mg/dL Severe NPDR: 101.00 mg/dL PDR: 108.11 mg/dL Apo-B/Apo-A1 Mild NPDR: 0.51 Moderate NPDR: 0.78 Severe NPDR: 0.92 PDR: 1.05 | HDL Mild NPDR: 39.96 mg/dL Moderate NPDR: 36.74 mg/dL Severe NPDR: 32.95 mg/dL PDR: 29.33 mg/dL LDL Mild NPDR: 119.74 mg/dL Moderate NPDR: 124.76 mg/dL Severe NPDR: 132.60 mg/dL PDR: 128.11 mg/dL TG Not reported | Apo-B/Apo-A1 had a stronger correlation with DR severity (p ≤ 0.001) compared with Apo-B or Apo-A1 alone. |
| Moosaie et al. [27] (2020) | NPDR: 162 PDR: 163 | Apo-A1 NPDR: 129.8 ± 25.3 g/L PDR: 128 ± 28.85 g/L Apo-B NPDR: 92.2 ± 25.8 g/L PDR: 98.2 ± 27.1 g/L Apo-A1/Apo-B NPDR: 0.8 ± 0.4 PDR: 0.76 ± 0.31 Lp(a) NPDR: 65.8 ± 28.0 mg/dL PDR: 63.81 ± 35.97 mg/dL | TG NPDR: 160.7 ± 80.8 mg/dL PDR: 168.26 ± 110.76 mg/dL HDL NPDR: 44.7 ± 10.8 mg/dL PDR: 45.69 ± 11.41 mg/dL LDL NPDR: 100.9 ± 32.4 mg/dL PDR: 100.87 ± 31.95 mg/dL | Logistic regression analysis for the association with DR severity: Lp(a): OR 1.00; 95% CI 0.1–1.01 (p = 0.29) Apo-A1: OR 0.42; 95% CI 0.14–1.3 (p = 0.13) Apo-B: OR 1.02; 95% CI 1.01–1.04 (p < 0.01) Apo-B/Apo-A1: OR 1.07; 95% CI 1.03–1.1 (p < 0.01) |
| Hanifah et al. [28] (2021) | Sev NPDR: 6 Early PDR: 9 High risk PDR: 20 Advanced PDR: 11 | Apo-A1 Sev NPDR: 1.4 ± 0.2 mg/dL Early PDR: 1.5 ± 0.2 mg/dL High risk PDR: 1.4 ± 0.2 mg/dL Advanced PDR: 1.5 ± 0.2 mg/dL Apo-B Sev NPDR: 0.9 ± 0.2 mg/dL Early PDR: 1.2 ± 0.2 mg/dL High risk PDR: 1.3 ± 0.3 mg/dL Advanced PDR: 1.1 ± 0.3 mg/dL Apo-B/Apo-A1 Sev NPDR: 0.7 ± 1.0 Early PDR: 0.8 ± 0.2 High risk PDR: 0.9 ± 0.2 Advanced PDR: 0.8 ± 0.3 | Not reported | Mean difference between groups: Apo-A1: p = 0.32 Apo-B: p = 0.06 Apo-B/Apo-A1: p = 0.08 |
Publisher’s Note: MDPI stays neutral with regard to jurisdictional claims in published maps and institutional affiliations. |
© 2022 by the authors. Licensee MDPI, Basel, Switzerland. This article is an open access article distributed under the terms and conditions of the Creative Commons Attribution (CC BY) license (https://creativecommons.org/licenses/by/4.0/).
Share and Cite
Soedarman, S.; Kurnia, K.H.; Prasetya, A.D.B.; Sasongko, M.B. Cholesterols, Apolipoproteins, and Their Associations with the Presence and Severity of Diabetic Retinopathy: A Systematic Review. Vision 2022, 6, 77. https://doi.org/10.3390/vision6040077
Soedarman S, Kurnia KH, Prasetya ADB, Sasongko MB. Cholesterols, Apolipoproteins, and Their Associations with the Presence and Severity of Diabetic Retinopathy: A Systematic Review. Vision. 2022; 6(4):77. https://doi.org/10.3390/vision6040077
Chicago/Turabian StyleSoedarman, Soefiandi, King Hans Kurnia, Alberthus Donni Budi Prasetya, and Muhammad Bayu Sasongko. 2022. "Cholesterols, Apolipoproteins, and Their Associations with the Presence and Severity of Diabetic Retinopathy: A Systematic Review" Vision 6, no. 4: 77. https://doi.org/10.3390/vision6040077