Binocular Information Improves the Reliability and Consistency of Pictorial Relief


Abstract
:1. Introduction
2. Materials and Methods
2.1. Apparatus
2.2. Participants
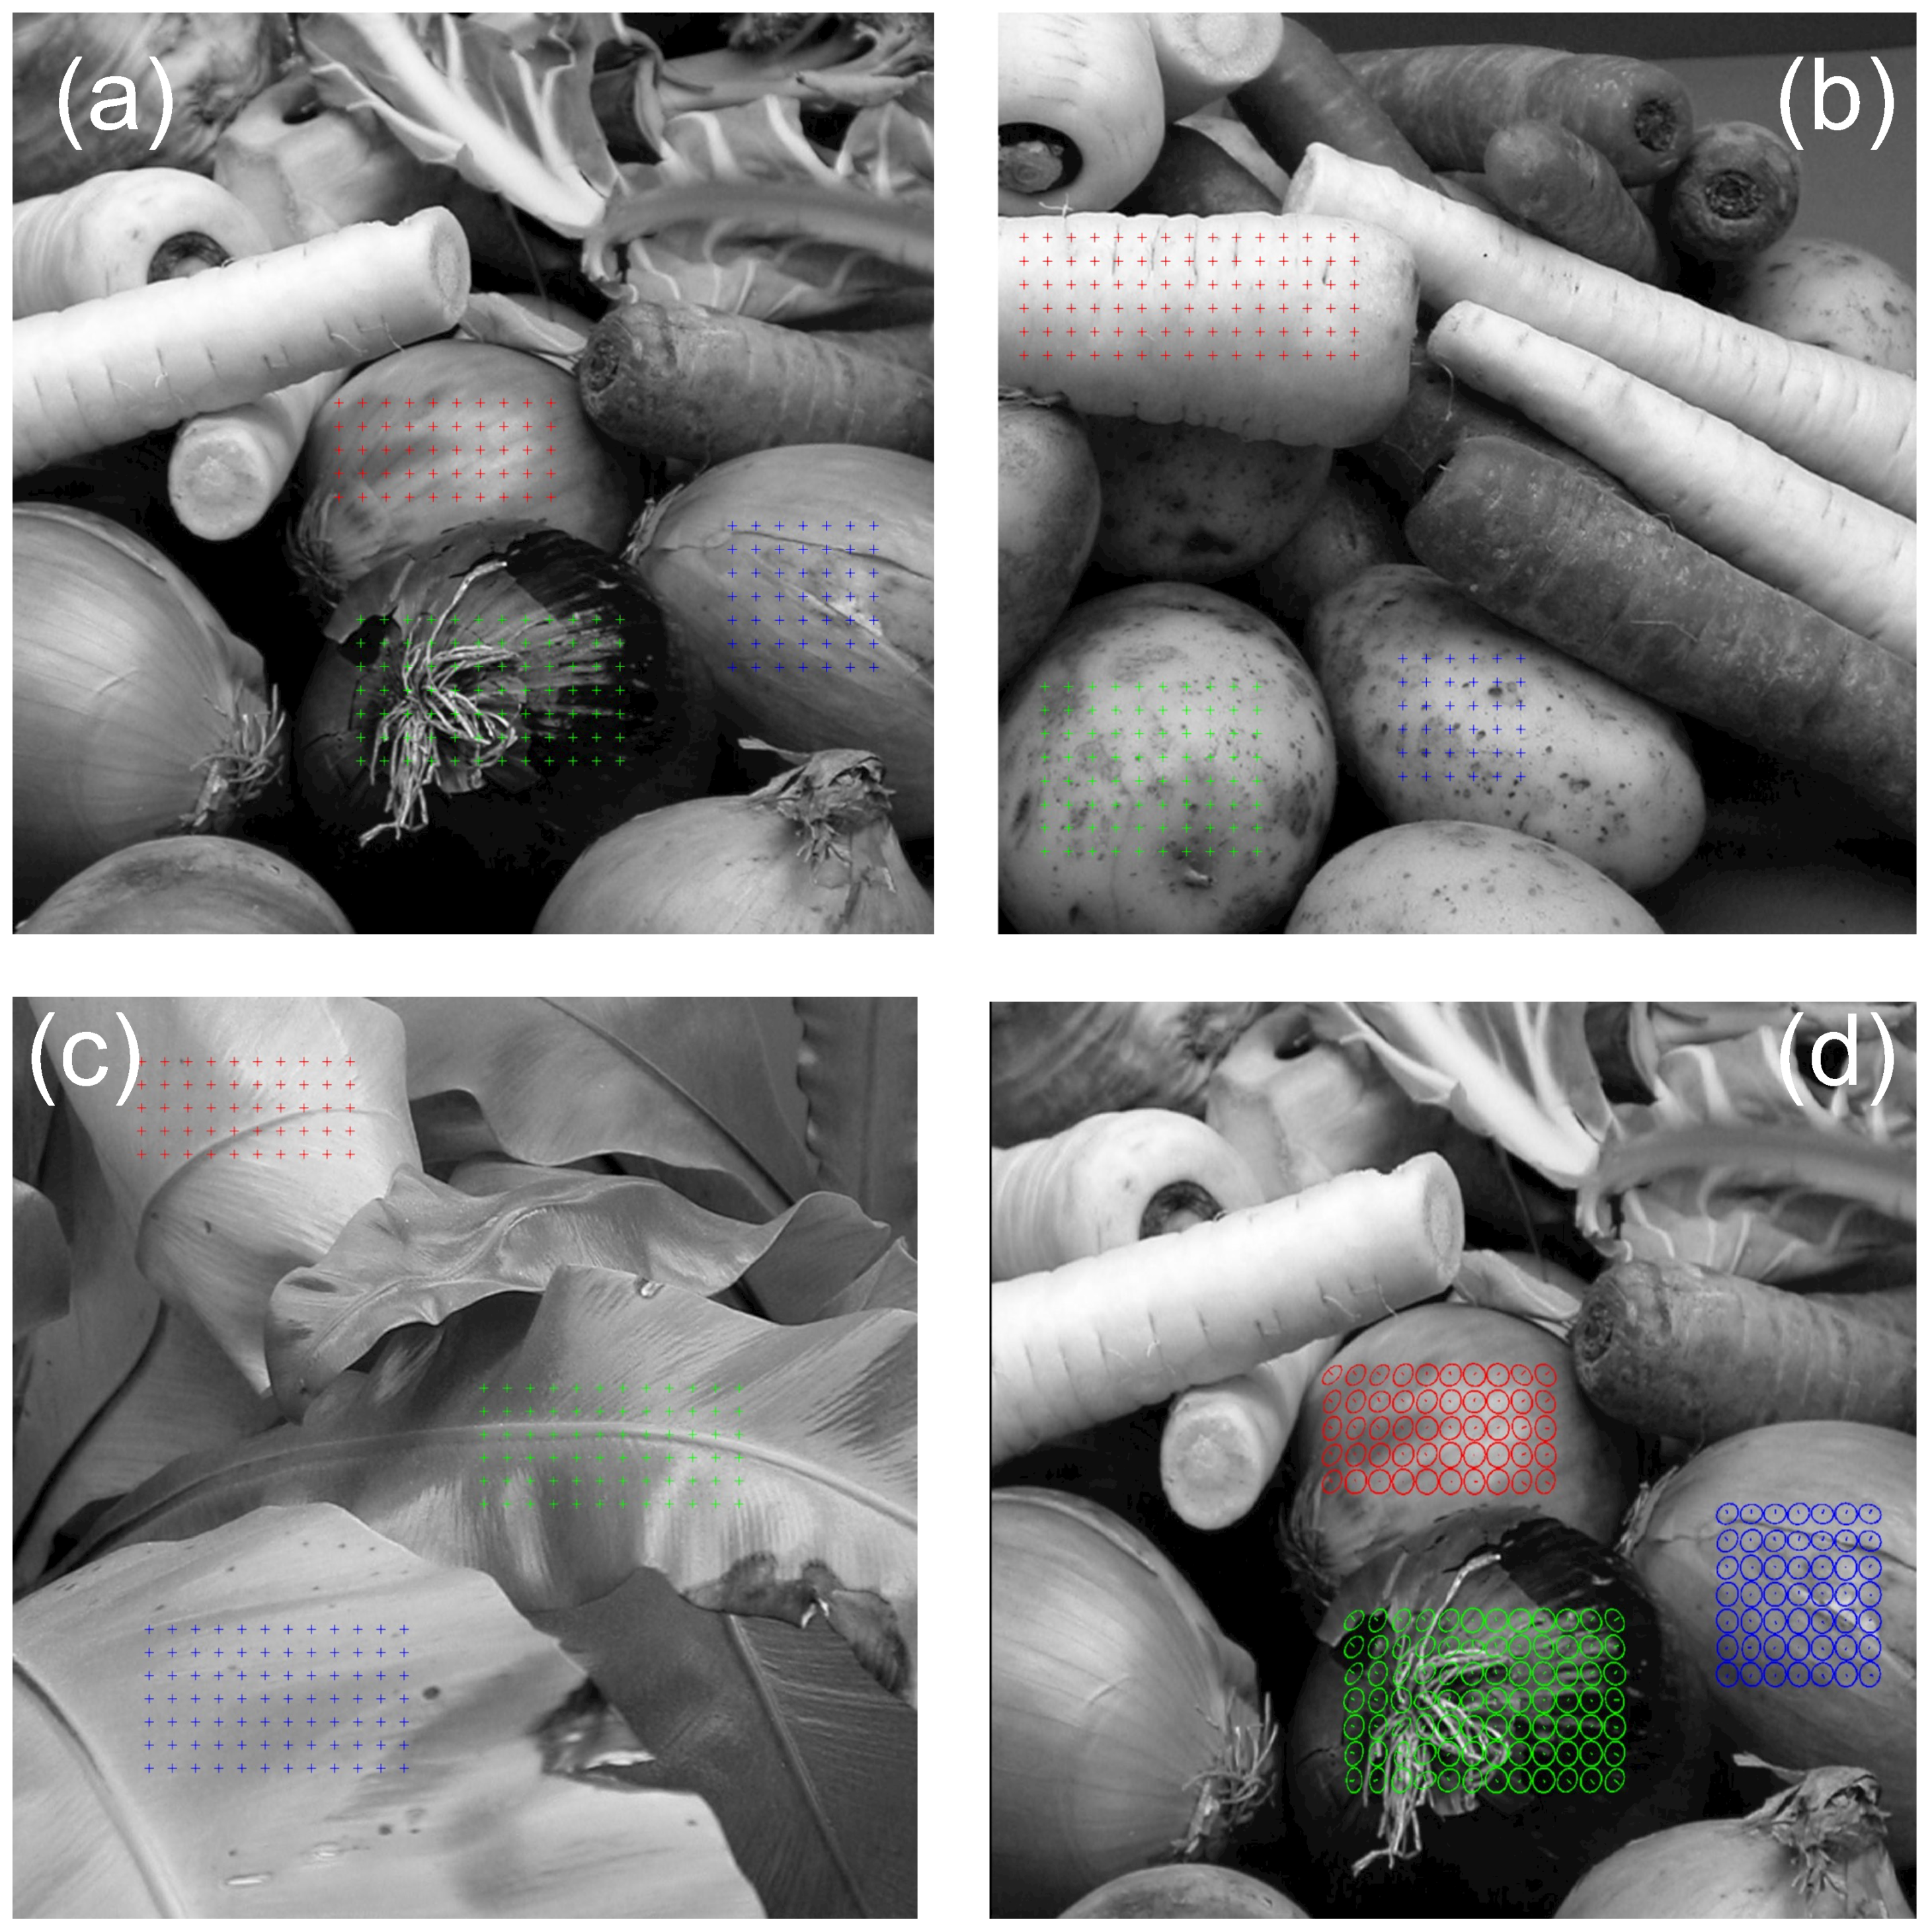
2.3. Stimuli
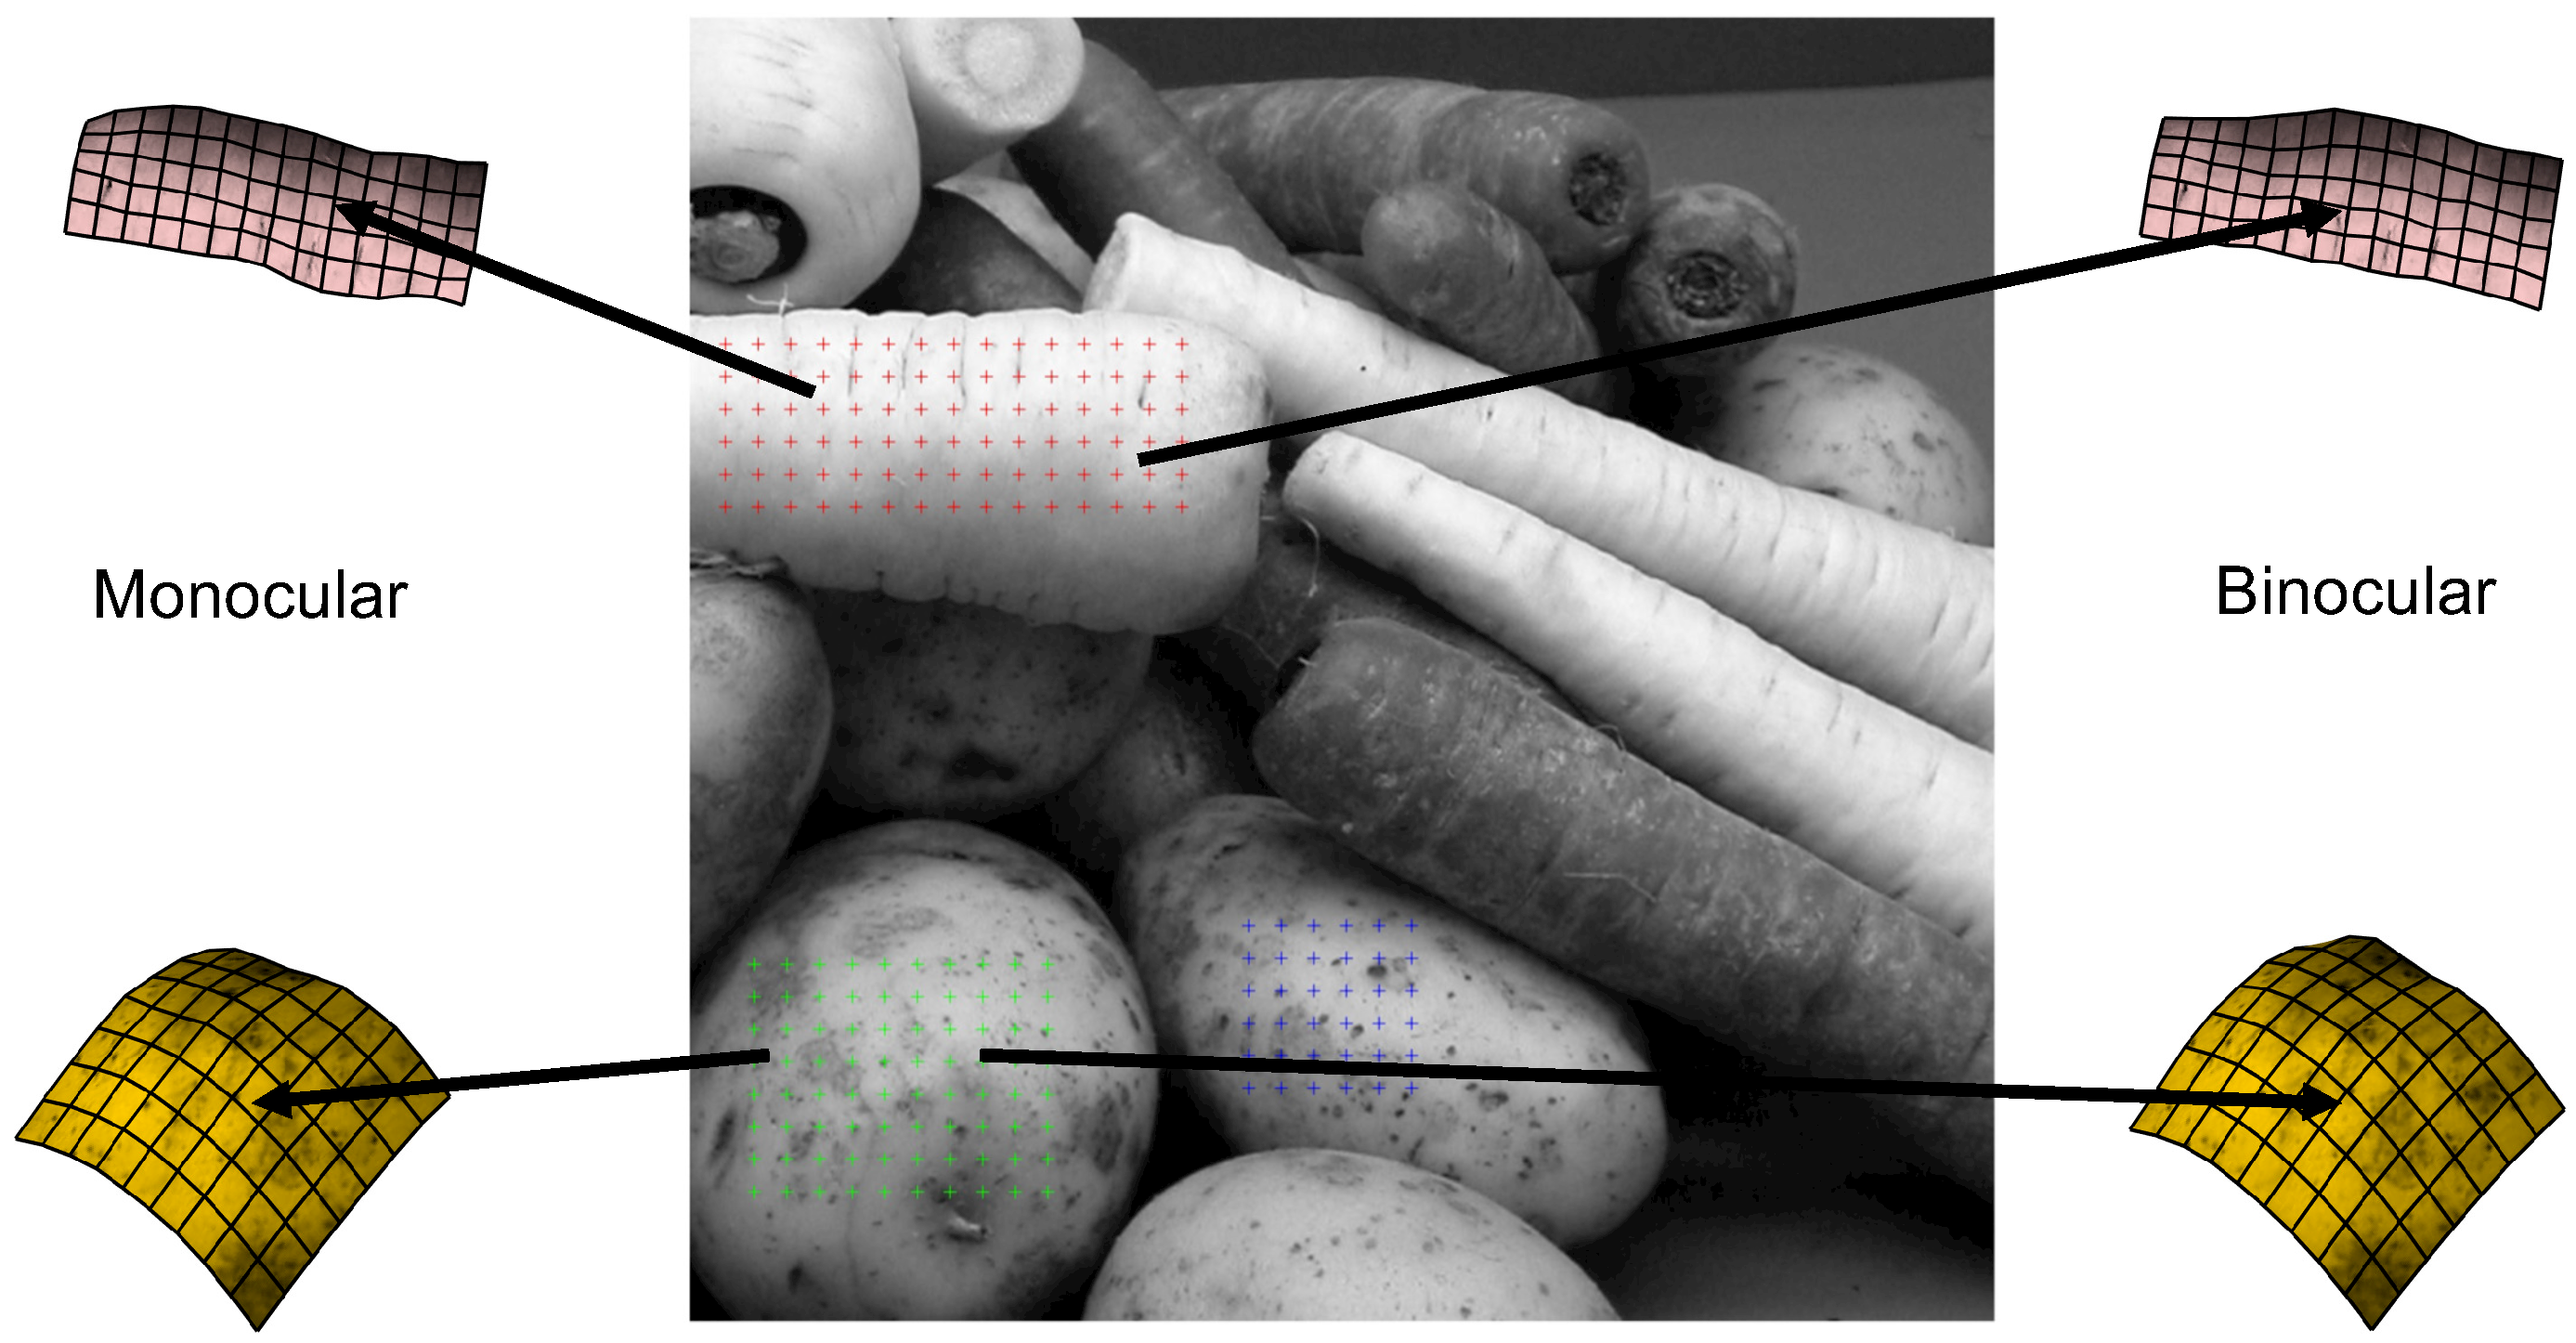
2.4. Procedure
3. Results
3.1. Analysis
3.2. Magnitude
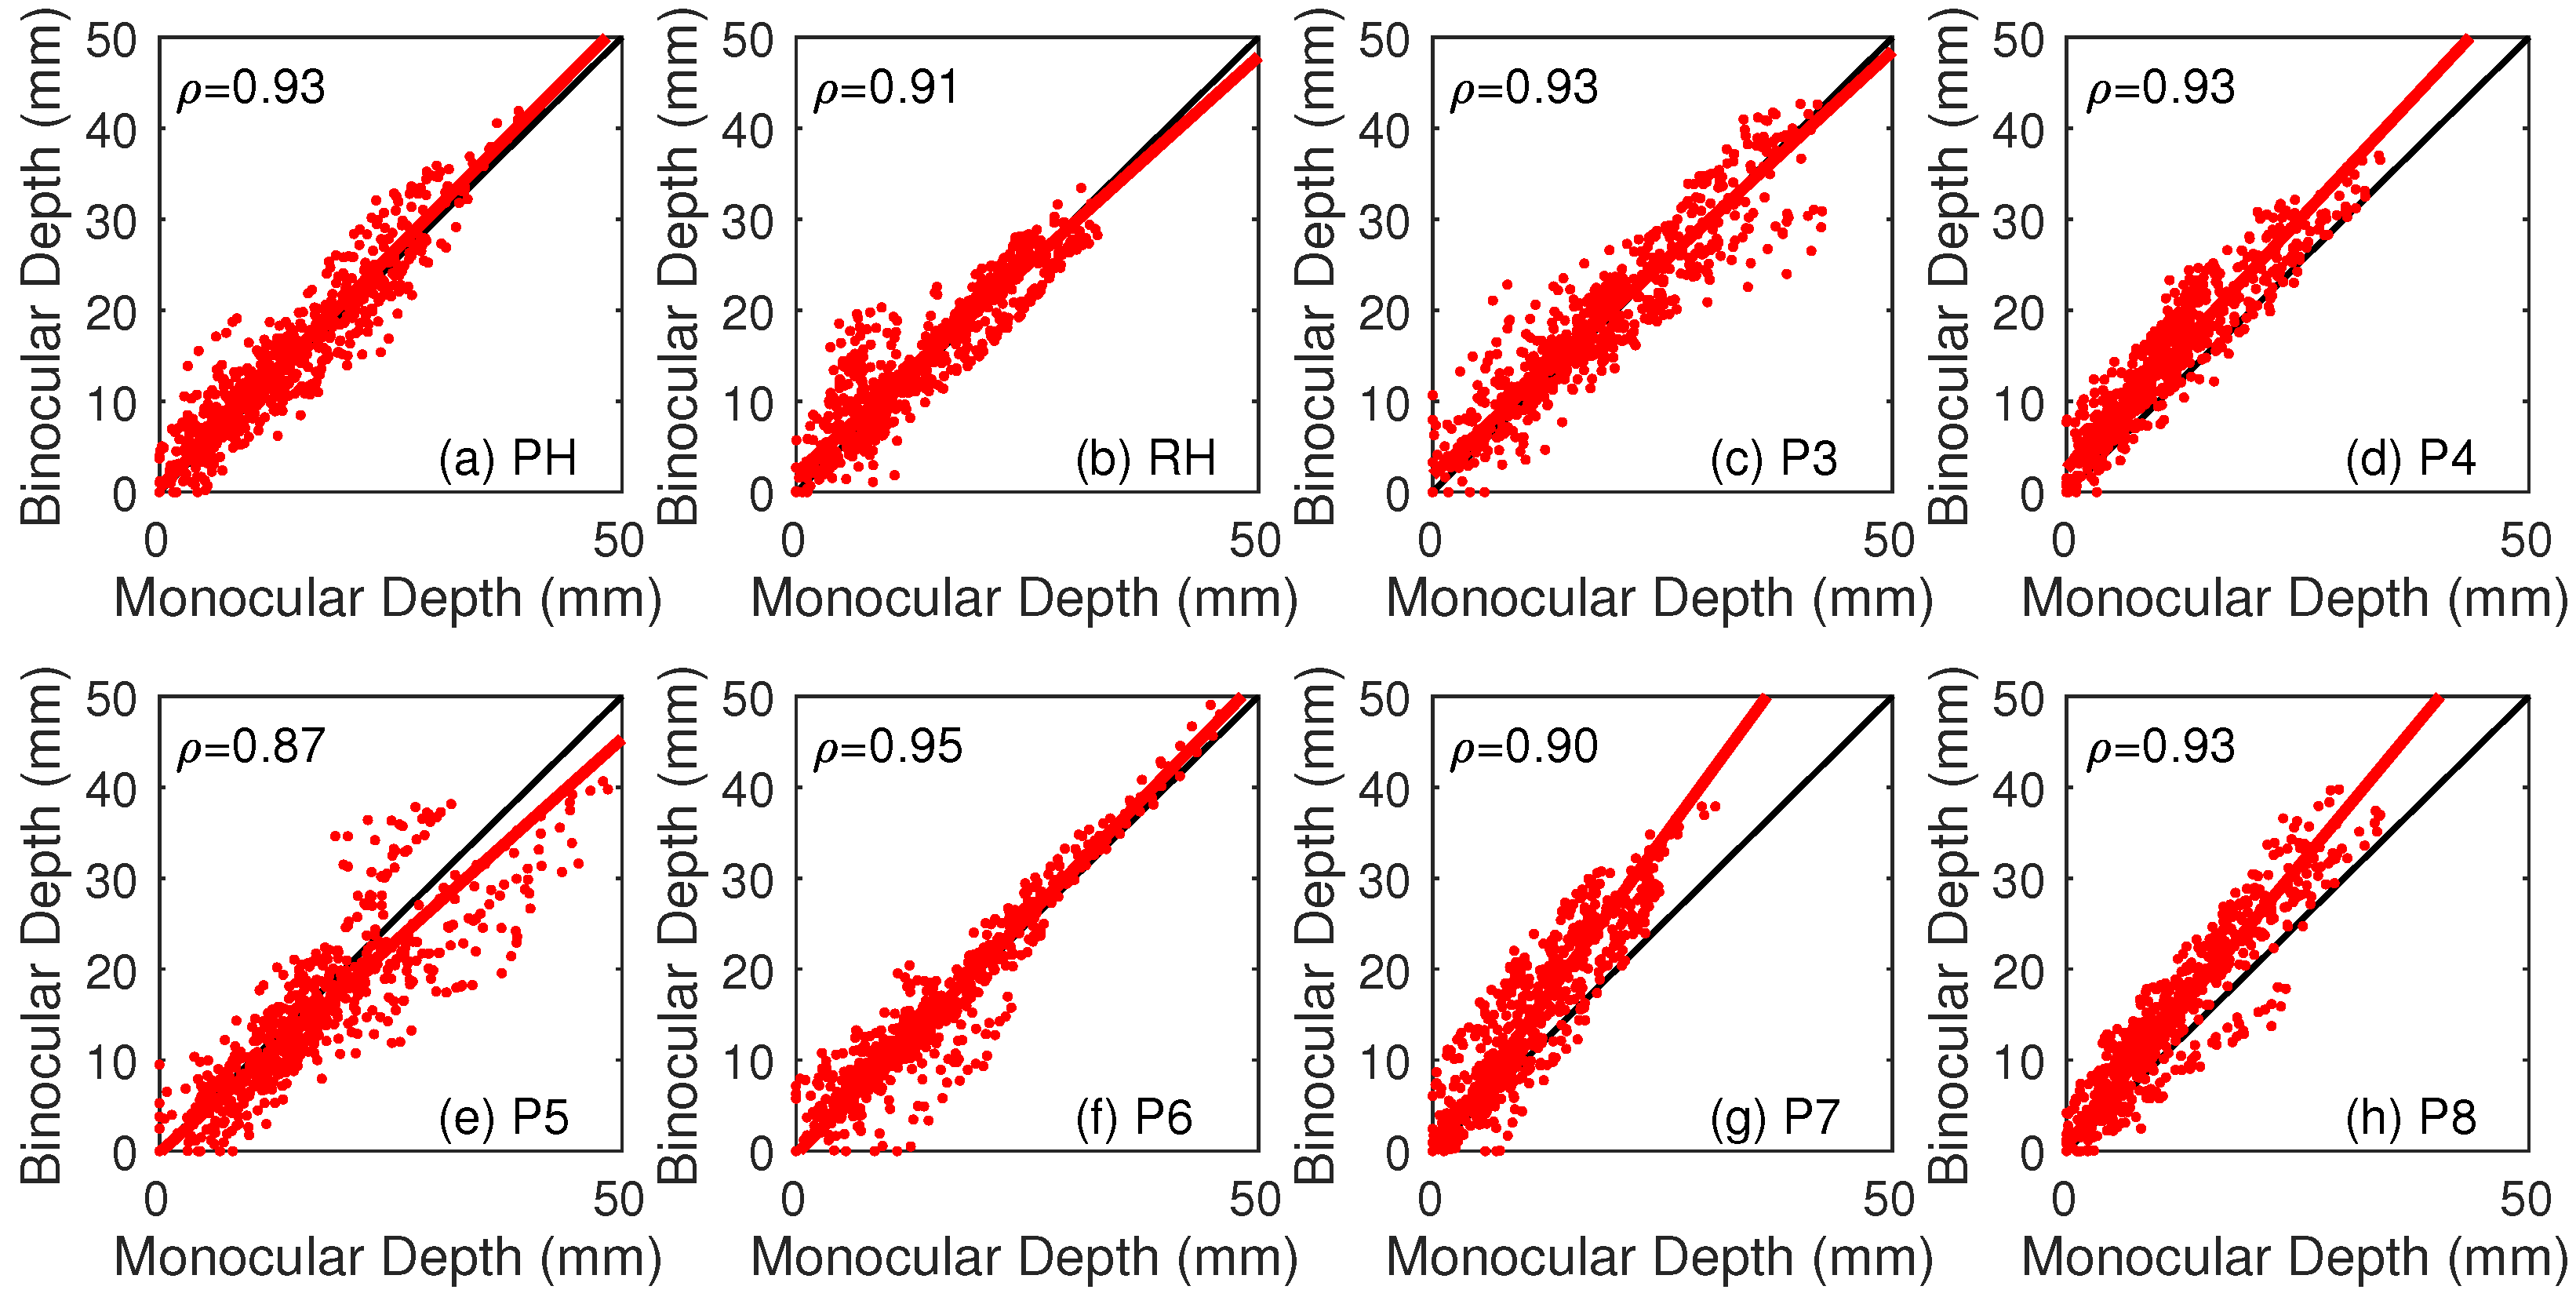
3.3. Reliability
3.4. Consistency
4. Discussion
4.1. Magnitude
4.2. Reliability
4.3. Consistency
4.4. Veridicality and the Operational Definition of Pictorial Relief
4.5. Binocular and Pictorial Information in Stereoscopic Photographs
4.6. Implications for Virtual Reality and Everyday Vision
Author Contributions
Funding
Institutional Review Board Statement
Informed Consent Statement
Data Availability Statement
Conflicts of Interest
References
- Patla, A.E.; Niechwiej, E.; Racco, V.; Goodale, M.A. Understanding the contribution of binocular vision to the control of adaptive locomotion. Exp. Brain Res. 2002, 142, 551–561. [Google Scholar] [CrossRef]
- Hayhoe, M.; Gillam, B.; Chajka, K.; Vecellio, E. The role of binocular vision in walking. Vis. Neurosci. 2009, 26, 73–80. [Google Scholar] [CrossRef] [Green Version]
- Watt, S.J.; Bradshaw, M.F. The visual control of reaching and grasping: Binocular disparity and motion parallax. J. Exp. Psychol. Hum. Percept. Perform. 2003, 29, 404. [Google Scholar] [CrossRef]
- Bradshaw, M.F.; Elliott, K.M.; Watt, S.J.; Hibbard, P.B.; Davies, I.R.; Simpson, P. Binocular cues and the control of prehension. Spat. Vis. 2004, 17, 95–110. [Google Scholar]
- Servos, P.; Goodale, M.A.; Jakobson, L.S. The role of binocular vision in prehension: A kinematic analysis. Vis. Res. 1992, 32, 1513–1521. [Google Scholar] [CrossRef]
- Hibbard, P.B.; Bradshaw, M.F. Reaching for virtual objects: Binocular disparity and the control of prehension. Exp. Brain Res. 2003, 148, 196–201. [Google Scholar] [CrossRef]
- Melmoth, D.R.; Grant, S. Advantages of binocular vision for the control of reaching and grasping. Exp. Brain Res. 2006, 171, 371–388. [Google Scholar] [CrossRef]
- Cristino, F.; Davitt, L.; Hayward, W.G.; Leek, E.C. Stereo disparity facilitates view generalization during shape recognition for solid multipart objects. Q. J. Exp. Psychol. 2015, 68, 2419–2436. [Google Scholar] [CrossRef] [Green Version]
- Cutting, J.E.; Vishton, P.M. Perceiving layout and knowing distances: The integration, relative potency, and contextual use of different information about depth. In Perception of Space and Motion; Elsevier: Amsterdam, The Netherlands, 1995; pp. 69–117. [Google Scholar]
- Johnston, E.B.; Cumming, B.G.; Landy, M.S. Integration of stereopsis and motion shape cues. Vis. Res. 1994, 34, 2259–2275. [Google Scholar] [CrossRef]
- Landy, M.S.; Maloney, L.T.; Johnston, E.B.; Young, M. Measurement and modeling of depth cue combination: In defense of weak fusion. Vis. Res. 1995, 35, 389–412. [Google Scholar] [CrossRef] [Green Version]
- Trommershauser, J.; Kording, K.; Landy, M.S. Sensory Cue Integration; Computational Neuroscience; Oxford University Press: Oxford, UK, 2011. [Google Scholar]
- Ernst, M.O.; Banks, M.S. Humans integrate visual and haptic information in a statistically optimal fashion. Nature 2002, 415, 429–433. [Google Scholar] [CrossRef] [PubMed]
- Hillis, J.M.; Watt, S.J.; Landy, M.S.; Banks, M.S. Slant from texture and disparity cues: Optimal cue combination. J. Vis. 2004, 4, 1. [Google Scholar] [CrossRef] [PubMed] [Green Version]
- Keefe, B.D.; Hibbard, P.B.; Watt, S.J. Depth-cue integration in grasp programming: No evidence for a binocular specialism. Neuropsychologia 2011, 49, 1246–1257. [Google Scholar] [CrossRef] [PubMed]
- Lovell, P.G.; Bloj, M.; Harris, J.M. Optimal integration of shading and binocular disparity for depth perception. J. Vis. 2012, 12, 1. [Google Scholar] [CrossRef] [Green Version]
- Cochran, W.G. Problems arising in the analysis of a series of similar experiments. Suppl. J. R. Stat. Soc. 1937, 4, 102–118. [Google Scholar] [CrossRef]
- Rohde, M.; van Dam, L.C.; Ernst, M.O. Statistically optimal multisensory cue integration: A practical tutorial. Multisens. Res. 2016, 29, 279–317. [Google Scholar] [CrossRef]
- Muller, C.M.; Brenner, E.; Smeets, J.B. Testing a counter-intuitive prediction of optimal cue combination. Vis. Res. 2009, 49, 134–139. [Google Scholar] [CrossRef] [Green Version]
- Scarfe, P.; Hibbard, P.B. Statistically optimal integration of biased sensory estimates. J. Vis. 2011, 11, 12. [Google Scholar] [CrossRef] [Green Version]
- Alais, D.; Burr, D. The ventriloquist effect results from near-optimal bimodal integration. Curr. Biol. 2004, 14, 257–262. [Google Scholar] [CrossRef]
- Rosas, P.; Wagemans, J.; Ernst, M.O.; Wichmann, F.A. Texture and haptic cues in slant discrimination: Reliability-based cue weighting without statistically optimal cue combination. J. Opt. Soc. Am. A 2005, 22, 801–809. [Google Scholar] [CrossRef]
- Domini, F.; Caudek, C.; Tassinari, H. Stereo and motion information are not independently processed by the visual system. Vis. Res. 2006, 46, 1707–1723. [Google Scholar] [CrossRef] [PubMed]
- Chen, C.C.; Tyler, C.W. Shading beats binocular disparity in depth from luminance gradients: Evidence against a maximum likelihood principle for cue combination. PLoS ONE 2015, 10, e0132658. [Google Scholar] [CrossRef] [PubMed]
- Hibbard, P.B. Estimating the contributions of pictorial, motion and binocular cues to the perception of distance. Perception 2021, 50, 152. [Google Scholar]
- Felsen, G.; Dan, Y. A natural approach to studying vision. Nat. Neurosci. 2005, 8, 1643–1646. [Google Scholar] [CrossRef]
- Scarfe, P.; Glennerster, A. Using high-fidelity virtual reality to study perception in freely moving observers. J. Vis. 2015, 15, 3. [Google Scholar] [CrossRef] [Green Version]
- Harris, J.M. Volume perception: Disparity extraction and depth representation in complex three-dimensional environments. J. Vis. 2014, 14, 11. [Google Scholar] [CrossRef] [Green Version]
- Goutcher, R.; Wilcox, L. Representation and measurement of stereoscopic volumes. J. Vis. 2016, 16, 16. [Google Scholar] [CrossRef] [Green Version]
- Koenderink, J.J. Pictorial relief. Philos. Trans. R. Soc. Lond. Ser. A Math. Phys. Eng. Sci. 1998, 356, 1071–1086. [Google Scholar] [CrossRef]
- Koenderink, J.J.; Van Doorn, A.J.; Wagemans, J. Geometry of pictorial relief. Annu. Rev. Vis. Sci. 2018, 4, 451–474. [Google Scholar] [CrossRef]
- Koenderink, J.J.; Van Doorn, A.J.; Kappers, A.M. Surface perception in pictures. Percept. Psychophys. 1992, 52, 487–496. [Google Scholar] [CrossRef] [Green Version]
- Koenderink, J.J.; Van Doorn, A.J. Relief: Pictorial and otherwise. Image Vis. Comput. 1995, 13, 321–334. [Google Scholar] [CrossRef] [Green Version]
- Koenderink, J.J.; Van Doorn, A.J.; Kappers, A.M.; Todd, J.T. Ambiguity and the ‘mental eye’ in pictorial relief. Perception 2001, 30, 431–448. [Google Scholar] [CrossRef] [PubMed]
- Koenderink, J. Virtual psychophysics. Perception 1999, 28, 669–674. [Google Scholar] [CrossRef] [PubMed] [Green Version]
- Todd, J.T.; Koenderink, J.J.; van Doorn, A.J.; Kappers, A.M. Effects of changing viewing conditions on the perceived structure of smoothly curved surfaces. J. Exp. Psychol. Hum. Percept. Perform. 1996, 22, 695. [Google Scholar] [CrossRef] [PubMed]
- Doorschot, P.C.; Kappers, A.M.; Koenderink, J.J. The combined influence of binocular disparity and shading on pictorial shape. Percept. Psychophys. 2001, 63, 1038–1047. [Google Scholar] [CrossRef] [PubMed] [Green Version]
- Noë, A. On what we see. Pac. Philos. Q. 2002, 83, 57–80. [Google Scholar] [CrossRef]
- Hibbard, P.B. Can appearance be so deceptive? Representationalism and binocular vision. Spat. Vis. 2008, 21, 549–559. [Google Scholar] [CrossRef] [Green Version]
- Gibson, J.J. The Ecological Approach to Visual Perception: Classic Edition; Psychology Press: New York, NY, USA, 2014. [Google Scholar]
- Gombrich, E.H. The visual image. Sci. Am. 1972, 227, 82–97. [Google Scholar] [CrossRef]
- Longuet-Higgins, H.C. A computer algorithm for reconstructing a scene from two projections. Nature 1981, 293, 133–135. [Google Scholar] [CrossRef]
- Garding, J.; Porrill, J.; Mayhew, J.; Frisby, J. Stereopsis, vertical disparity and relief transformations. Vis. Res. 1995, 35, 703–722. [Google Scholar] [CrossRef] [PubMed] [Green Version]
- Luong, Q.T.; Faugeras, O.D. The fundamental matrix: Theory, algorithms, and stability analysis. Int. J. Comput. Vis. 1996, 17, 43–75. [Google Scholar] [CrossRef]
- Vishwanath, D.; Girshick, A.R.; Banks, M.S. Why pictures look right when viewed from the wrong place. Nat. Neurosci. 2005, 8, 1401–1410. [Google Scholar] [CrossRef] [PubMed]
- Burton, M.; Pollock, B.; Kelly, J.W.; Gilbert, S.; Winer, E.; de la Cruz, J. Diagnosing perceptual distortion present in group stereoscopic viewing. In Human Vision and Electronic Imaging XVII; SPIE: Bellingham, DC, USA, 2012; Volume 8291, pp. 201–211. [Google Scholar]
- Pollock, B.; Burton, M.; Kelly, J.W.; Gilbert, S.; Winer, E. The right view from the wrong location: Depth perception in stereoscopic multi-user virtual environments. IEEE Trans. Vis. Comput. Graph. 2012, 18, 581–588. [Google Scholar] [CrossRef] [Green Version]
- Hands, P.; Smulders, T.V.; Read, J.C. Stereoscopic 3D content appears relatively veridical when viewed from an oblique angle. J. Vis. 2015, 15, 6. [Google Scholar] [CrossRef] [PubMed] [Green Version]
- Kurtz, H.F. Orthostereoscopy. J. Opt. Soc. Am. 1937, 27, 323–339. [Google Scholar] [CrossRef]
- Banks, M.S.; Read, J.C.; Allison, R.S.; Watt, S.J. Stereoscopy and the human visual system. SMPTE Motion Imaging J. 2012, 121, 24–43. [Google Scholar] [CrossRef] [PubMed] [Green Version]
- Hibbard, P.B.; van Dam, L.C.; Scarfe, P. The implications of interpupillary distance variability for virtual reality. In Proceedings of the 2020 International Conference on 3D Immersion (IC3D), Brussels, Belgium, 15 December 2020; pp. 1–7. [Google Scholar]
- Rogers, B. Optic arrays and celestial spheres. Perception 2007, 36, 1269–1273. [Google Scholar] [CrossRef] [PubMed]
- Frisby, J. Optic arrays and retinal images. Perception 2009, 38, 1–4. [Google Scholar] [CrossRef] [Green Version]
- Howard, I.P.; Rogers, B.J. Perceiving in Depth, Stereoscopic Vision; Oxford University Press: Oxford, UK, 2012; Volume 2. [Google Scholar]
- Hands, P.; Read, J.C. Perceptual compensation mechanisms when viewing stereoscopic 3D from an oblique angle. In Proceedings of the 2013 International Conference on 3D Imaging, Liege, Belgium, 3–5 December 2013; pp. 1–5. [Google Scholar]
- Mayhew, J.; Longuet-Higgins, H. A computational model of binocular depth perception. Nature 1982, 297, 376–378. [Google Scholar] [CrossRef]
- Rogers, B.J.; Bradshaw, M.F. Vertical disparities, differential perspective and binocular stereopsis. Nature 1993, 361, 253–255. [Google Scholar] [CrossRef]
- O’Kane, L.M.; Hibbard, P.B. Vertical disparity affects shape and size judgments across surfaces separated in depth. Perception 2007, 36, 696–702. [Google Scholar] [CrossRef] [PubMed] [Green Version]
- Koenderink, J.J.; van Doorn, A.J.; Kappers, A.M. On so-called paradoxical monocular stereoscopy. Perception 1994, 23, 583–594. [Google Scholar] [CrossRef] [PubMed]
- Dodgson, N.A. Variation and extrema of human interpupillary distance. In Stereoscopic Displays and Virtual Reality Systems XI; SPIE: Bellingham, DC, USA, 2004; Volume 5291, pp. 36–46. [Google Scholar]
- Murray, N.P.; Hunfalvay, M.; Bolte, T. The reliability, validity, and normative data of interpupillary distance and pupil diameter using eye-tracking technology. Transl. Vis. Sci. Technol. 2017, 6, 2. [Google Scholar] [CrossRef] [PubMed]
- Watt, S.J.; Akeley, K.; Ernst, M.O.; Banks, M.S. Focus cues affect perceived depth. J. Vis. 2005, 5, 7. [Google Scholar] [CrossRef] [Green Version]
- Johnston, E.B. Systematic distortions of shape from stereopsis. Vis. Res. 1991, 31, 1351–1360. [Google Scholar] [CrossRef] [PubMed]
- Todd, J.T.; Christensen, J.C.; Guckes, K.M. Are discrimination thresholds a valid measure of variance for judgments of slant from texture? J. Vis. 2010, 10, 20. [Google Scholar]
- Brainard, D.H.; Vision, S. The psychophysics toolbox. Spat. Vis. 1997, 10, 433–436. [Google Scholar] [CrossRef] [Green Version]
- Pelli, D.G.; Vision, S. The VideoToolbox software for visual psychophysics: Transforming numbers into movies. Spat. Vis. 1997, 10, 437–442. [Google Scholar] [CrossRef] [Green Version]
- Kleiner, M.; Brainard, D.; Pelli, D. What’s new in Psychtoolbox-3? Perception 2007, 36, 1–16. [Google Scholar]
- Hibbard, P.B. Binocular energy responses to natural images. Vis. Res. 2008, 48, 1427–1439. [Google Scholar] [CrossRef]
- Nefs, H.T. Three-dimensional object shape from shading and contour disparities. J. Vis. 2008, 8, 11. [Google Scholar] [CrossRef] [PubMed]
- Petráš, I.; Bednárová, D. Total least squares approach to modeling: A Matlab toolbox. Acta Montan. Slovaca 2010, 15, 158. [Google Scholar]
- Marshall, J.A.; Burbeck, C.A.; Ariely, D.; Rolland, J.P.; Martin, K.E. Occlusion edge blur: A cue to relative visual depth. J. Opt. Soc. Am. A 1996, 13, 681–688. [Google Scholar] [CrossRef] [Green Version]
- Mather, G. Image blur as a pictorial depth cue. Proc. R. Soc. Lond. Ser. B Biol. Sci. 1996, 263, 169–172. [Google Scholar]
- Mather, G. The use of image blur as a depth cue. Perception 1997, 26, 1147–1158. [Google Scholar] [CrossRef] [PubMed] [Green Version]
- MacKenzie, K.J.; Hoffman, D.M.; Watt, S.J. Accommodation to multiple-focal-plane displays: Implications for improving stereoscopic displays and for accommodation control. J. Vis. 2010, 10, 22. [Google Scholar] [CrossRef]
- Zhong, F.; Jindal, A.; Yöntem, Ö.; Hanji, P.; Watt, S.; Mantiuk, R. Reproducing reality with a high-dynamic-range multi-focal stereo display. ACM Trans. Graph. 2021, 40, 241. [Google Scholar] [CrossRef]
- Tyler, C.W. An accelerated cue combination principle accounts for multi-cue depth perception. J. Percept. Imaging 2020, 3, 10501-1–10501-9. [Google Scholar] [CrossRef]
- Hibbard, P.B.; Haines, A.E.; Hornsey, R.L. Magnitude, precision, and realism of depth perception in stereoscopic vision. Cogn. Res. Princ. Implic. 2017, 2, 1–11. [Google Scholar] [CrossRef] [Green Version]
- Rogers, B.J.; Bradshaw, M.F. Disparity scaling and the perception of frontoparallel surfaces. Perception 1995, 24, 155–179. [Google Scholar] [CrossRef]
- Bradshaw, M.F.; Glennerster, A.; Rogers, B.J. The effect of display size on disparity scaling from differential perspective and vergence cues. Vis. Res. 1996, 36, 1255–1264. [Google Scholar] [CrossRef] [PubMed] [Green Version]
- Mon-Williams, M.; Tresilian, J.R.; Roberts, A. Vergence provides veridical depth perception from horizontal retinal image disparities. Exp. Brain Res. 2000, 133, 407–413. [Google Scholar] [CrossRef] [PubMed]
- Perkins, D.N. Compensating for distortion in viewing pictures obliquely. Percept. Psychophys. 1973, 14, 13–18. [Google Scholar] [CrossRef] [Green Version]
- Bereby-Meyer, Y.; Leiser, D.; Meyer, J. Perception of artificial stereoscopic stimuli from an incorrect viewing point. Percept. Psychophys. 1999, 61, 1555–1563. [Google Scholar] [CrossRef]
- Banks, M.S.; Held, R.T.; Girshick, A.R. Perception of 3D Layout in Stereo Displays. Inf. Disp. 2009, 25, 12–16. [Google Scholar]
- Woods, A.J.; Docherty, T.; Koch, R. Image distortions in stereoscopic video systems. In Stereoscopic Displays and Applications IV; SPIE: Bellingham, DC, USA, 1993; Volume 1915, pp. 36–48. [Google Scholar]
- Held, R.T.; Banks, M.S. Misperceptions in stereoscopic displays: A vision science perspective. In Proceedings of the 5th Symposium on Applied Perception in Graphics and Visualization, Los Angeles, CA, USA, 9–10 August 2008; pp. 23–32. [Google Scholar]


Disclaimer/Publisher’s Note: The statements, opinions and data contained in all publications are solely those of the individual author(s) and contributor(s) and not of MDPI and/or the editor(s). MDPI and/or the editor(s) disclaim responsibility for any injury to people or property resulting from any ideas, methods, instructions or products referred to in the content. |
© 2022 by the authors. Licensee MDPI, Basel, Switzerland. This article is an open access article distributed under the terms and conditions of the Creative Commons Attribution (CC BY) license (https://creativecommons.org/licenses/by/4.0/).
Share and Cite
Hibbard, P.B.; Hornsey, R.L.; Asher, J.M. Binocular Information Improves the Reliability and Consistency of Pictorial Relief. Vision 2023, 7, 1. https://doi.org/10.3390/vision7010001
Hibbard PB, Hornsey RL, Asher JM. Binocular Information Improves the Reliability and Consistency of Pictorial Relief. Vision. 2023; 7(1):1. https://doi.org/10.3390/vision7010001
Chicago/Turabian StyleHibbard, Paul B., Rebecca L. Hornsey, and Jordi M. Asher. 2023. "Binocular Information Improves the Reliability and Consistency of Pictorial Relief" Vision 7, no. 1: 1. https://doi.org/10.3390/vision7010001