
Development and Application of an Open Power Meter Suitable for NILM


 ,
,  and
and
Abstract
:1. Introduction and Literature Review
- Supervised methods: these methods use tagged training datasets where individual exposures are known. Some examples of supervised methods are Bayesian [12], Vector Support Machines (SVM) [13], the algorithm of Discriminative Disaggregation Sparse Coding (DDSC) [14], and Artificial Neural Networks (ANN) [15], as well as their extensions;
- Unsupervised methods: use clustering techniques and statistical models for pattern recognition and load segmentation. Examples of unsupervised methods include Combinatorial Optimization (CO) [16], Hidden Markov Models (HMM) and their extensions, such as the FHMM (Factorial Hidden Markov Model) [17];
- Other approaches: in addition to the above categories, other approaches and techniques are used in NILM. Especially interesting is the processing of transient active power responses, measured when powered on and sampled at 100 Hz [18], so that using three stages (adaptive threshold event detection, convolutional neural network, and k-nearest neighbors’ classifier), new devices can be automatically identified without the need for additional retraining or modeling for future expansions. Other ways can include semi-supervised learning methods, methods based on signal decomposition, approaches based on change detection, and different approaches proposed in the literature.
- AMPds16 (Anomaly detection in the network traffic dataset of 2016, Canada) [19]: provides detailed readings, such as voltage, current, frequency, and power for an overall meter and 19 individual circuits with 20 Hz of sampling;
- BERDS (Berkeley Energy Disaggregation Dataset, USA) [20]: provides active, reactive, and apparent power measurements at 20” increments;
- BLOND (Technical University of Munich, Germany) [21]: contains voltage and current readings in two versions (BLOND-50 and BLOND-250) with different sample rates (50 kHz for aggregated circuits and 6.4 kHz for individual appliances);
- BLUED (Building-Level Fully Labeled Electricity Disaggregation Dataset, USA) [22]: includes high-frequency data (with 12 kHz of sampling) at the household level for approximately eight days, with events recorded whenever an appliance changes state;
- COOLL (Controlled On/Off Loads Library–University of Orleans, USA) [23]: Provides current and voltage data at a sampling rate of 100 kHz for 12 distinct types of appliances;
- DEPS (Higher Polytechnic School of the University of Seville, Spain) [24]: power, voltage, and current readings at the frequency of 1 Hz on six devices present in a classroom taken during a month;
- iAWE (Indian Ambient Water and Energy, India) [25]: it provides comprehensive real-time electricity and gas consumption data from 33 household sensors in an apartment in Delhi, covering both aggregate and individual appliance consumption patterns.
- OpenEnergyMonitor [33]: this system was designed for home energy monitoring, providing real-time analysis of energy usage. It supports active power, root mean square (RMS) voltage, and RMS current measurements at a high sampling rate and features an HTML5 interface, Wi-Fi and ethernet support, and an API. However, it lacks capabilities for measuring reactive power and power factor.
- Arduino Energy Monitor: this open-source project leverages an Arduino board and a non-invasive current sensor, displaying measurements on an LCD screen or a web interface. It offers real-time consumption data, storage, and communication capabilities, making it suitable for home monitoring and energy efficiency projects.
- EmonTx: aimed at energy efficiency, renewable energy, and building monitoring projects, EmonTx is an open-source system that measures and records electricity consumption in real time. It includes hardware that connects to electrical circuits and uses sensors to measure energy consumption. The data are transmitted via radio frequency or wires to a receiver that sends it to a computer or cloud platform for visualization and analysis. The software associated with EmonTx v4 allows the system to be configured, calibrated, and visualize the collected data. It also offers logging and long-term data storage functions, allowing detailed energy consumption monitoring and usage pattern detection.
- There are also commercial Arduino-based projects that are not open-source:
- Smappee [36] is a commercial energy monitor that offers a variety of devices to measure and monitor electrical energy consumption. It provides a user-friendly interface and provides detailed information about real-time energy consumption. It also offers logging and analysis capabilities through its online platform.
2. Materials and Methods
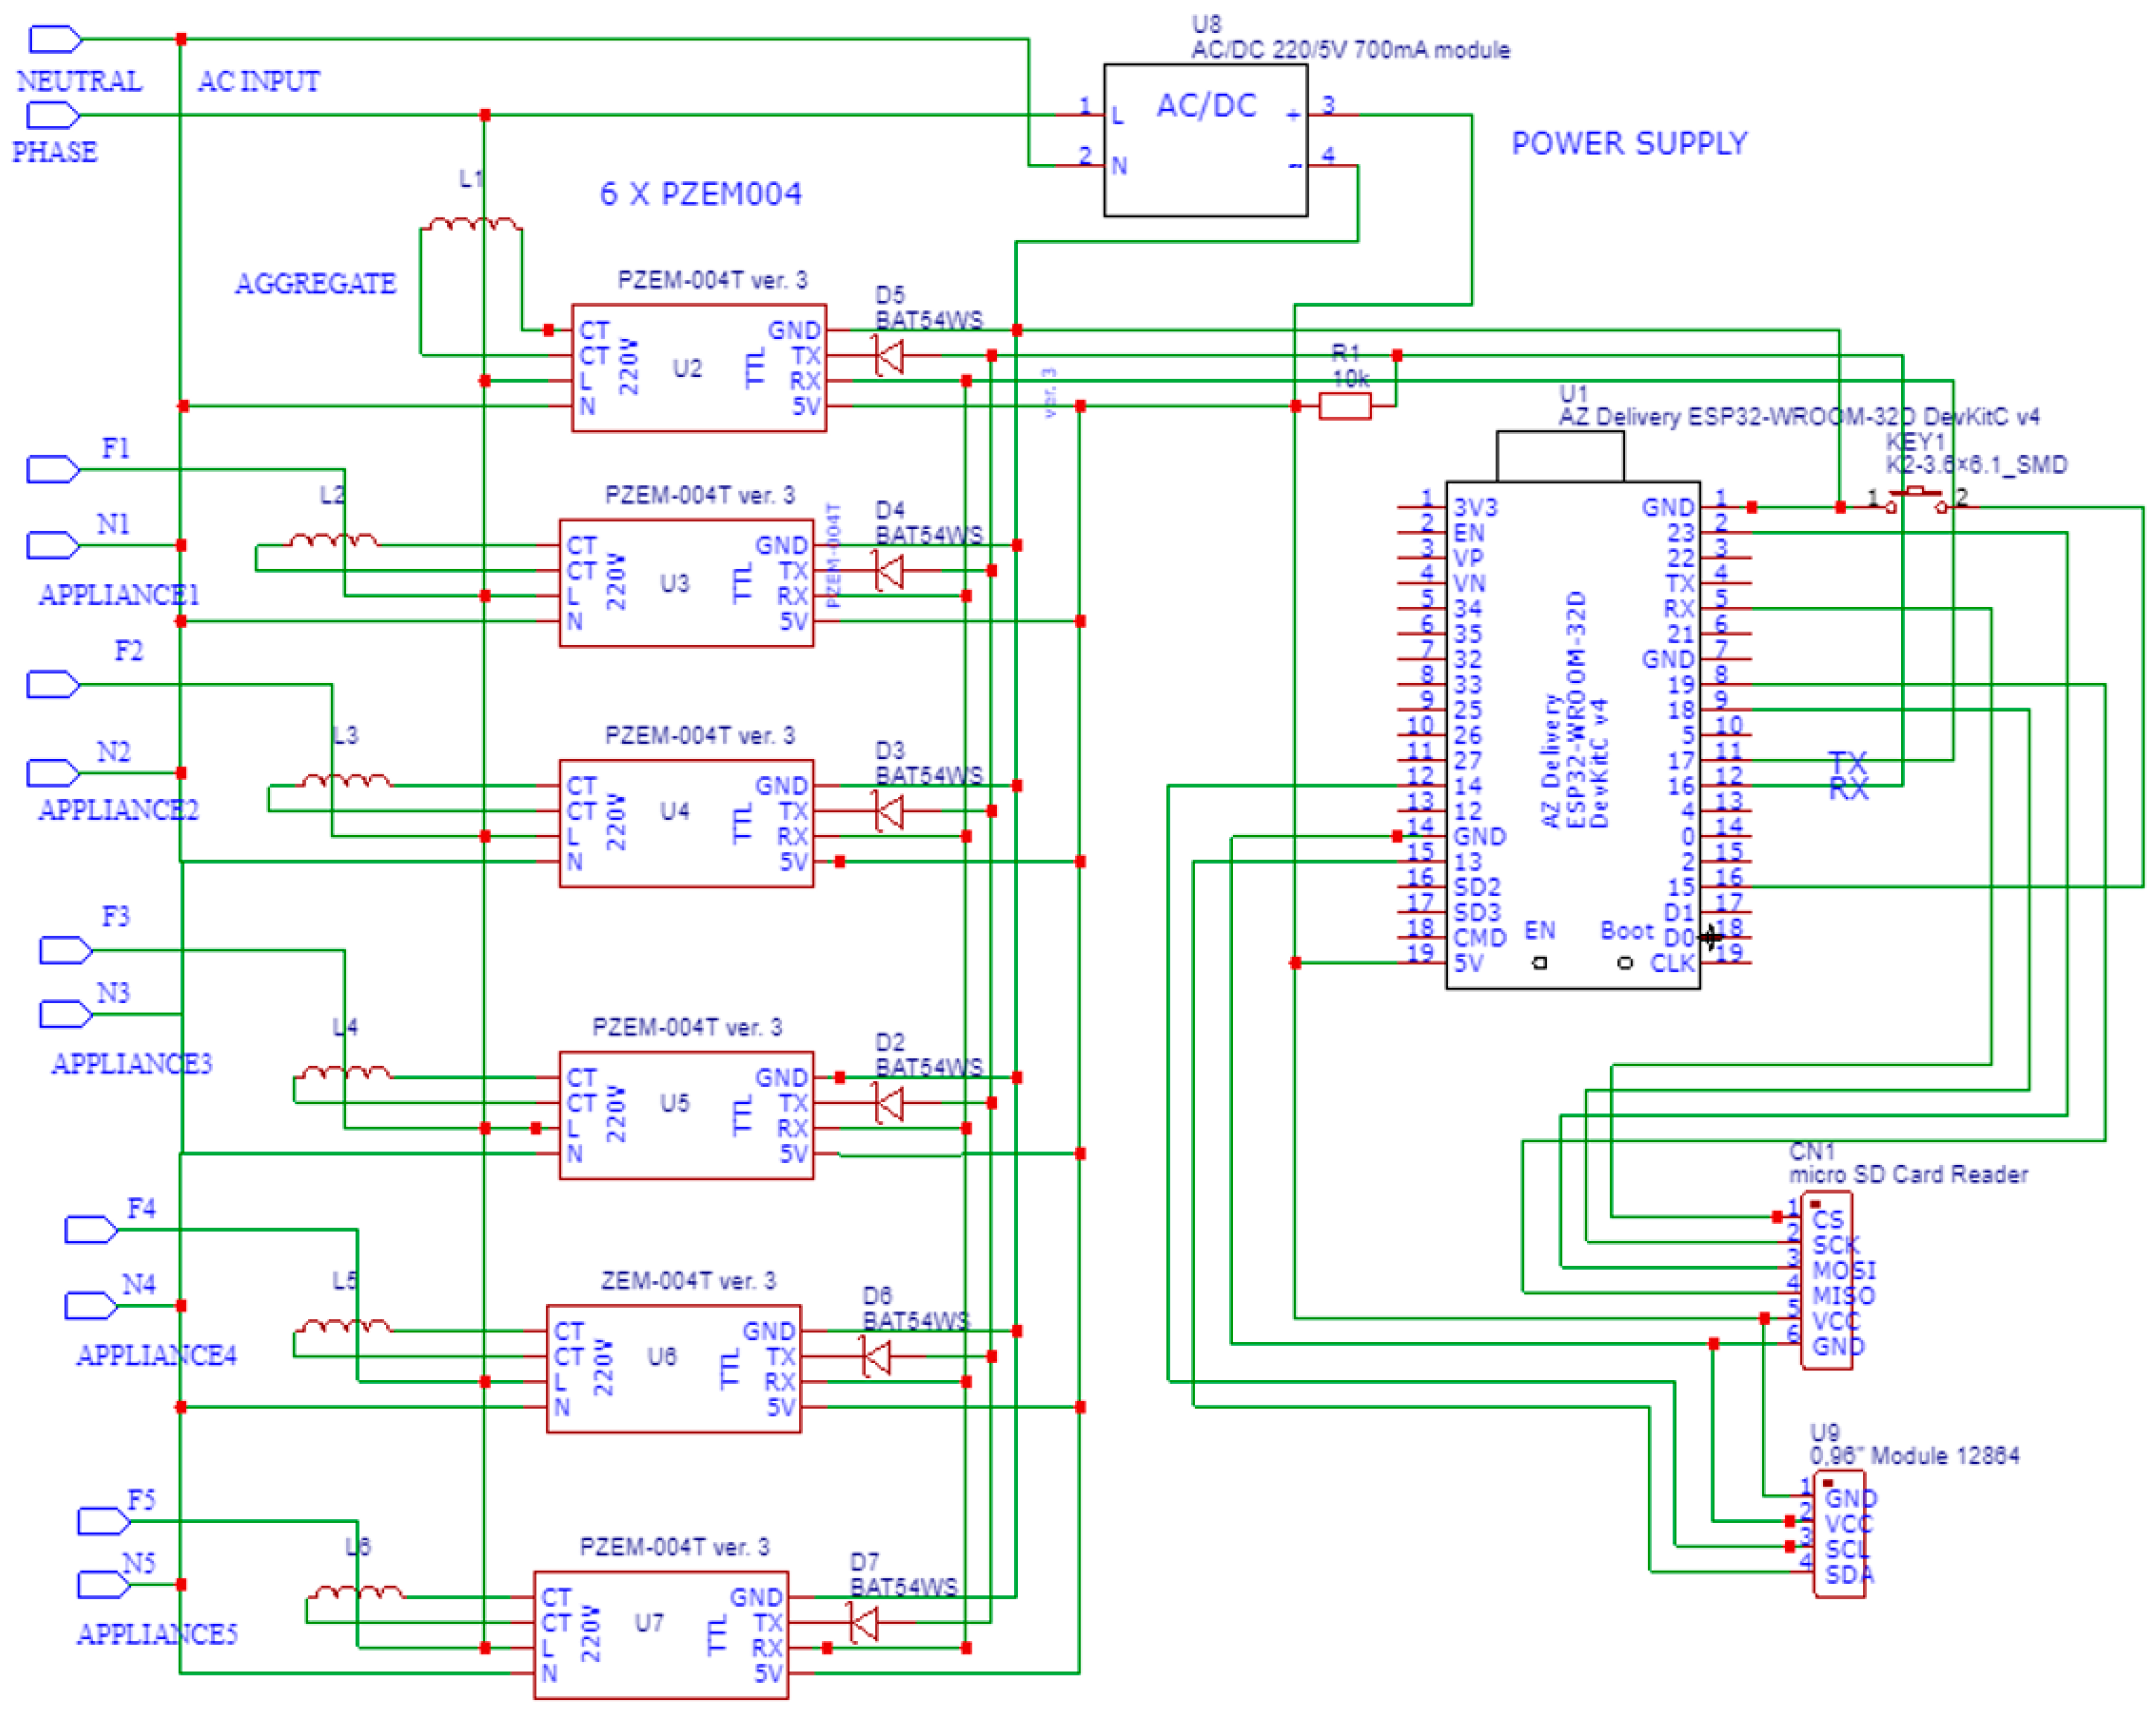
- ESP32 nodeMCU: the central processing unit that manages the hardware’s operations and data processing;
- PZEM-004 modules (one for measure module): these modules are crucial for measuring various electrical parameters since, in a single device, we obtain the voltage, current, power, and power factor,
- SD card reader: for reading data stored on SD cards;
- SD card: used for data storage and retrieval,
- Schottky diodes BAT54SW (one for measure module): essential for preventing reverse current flow,
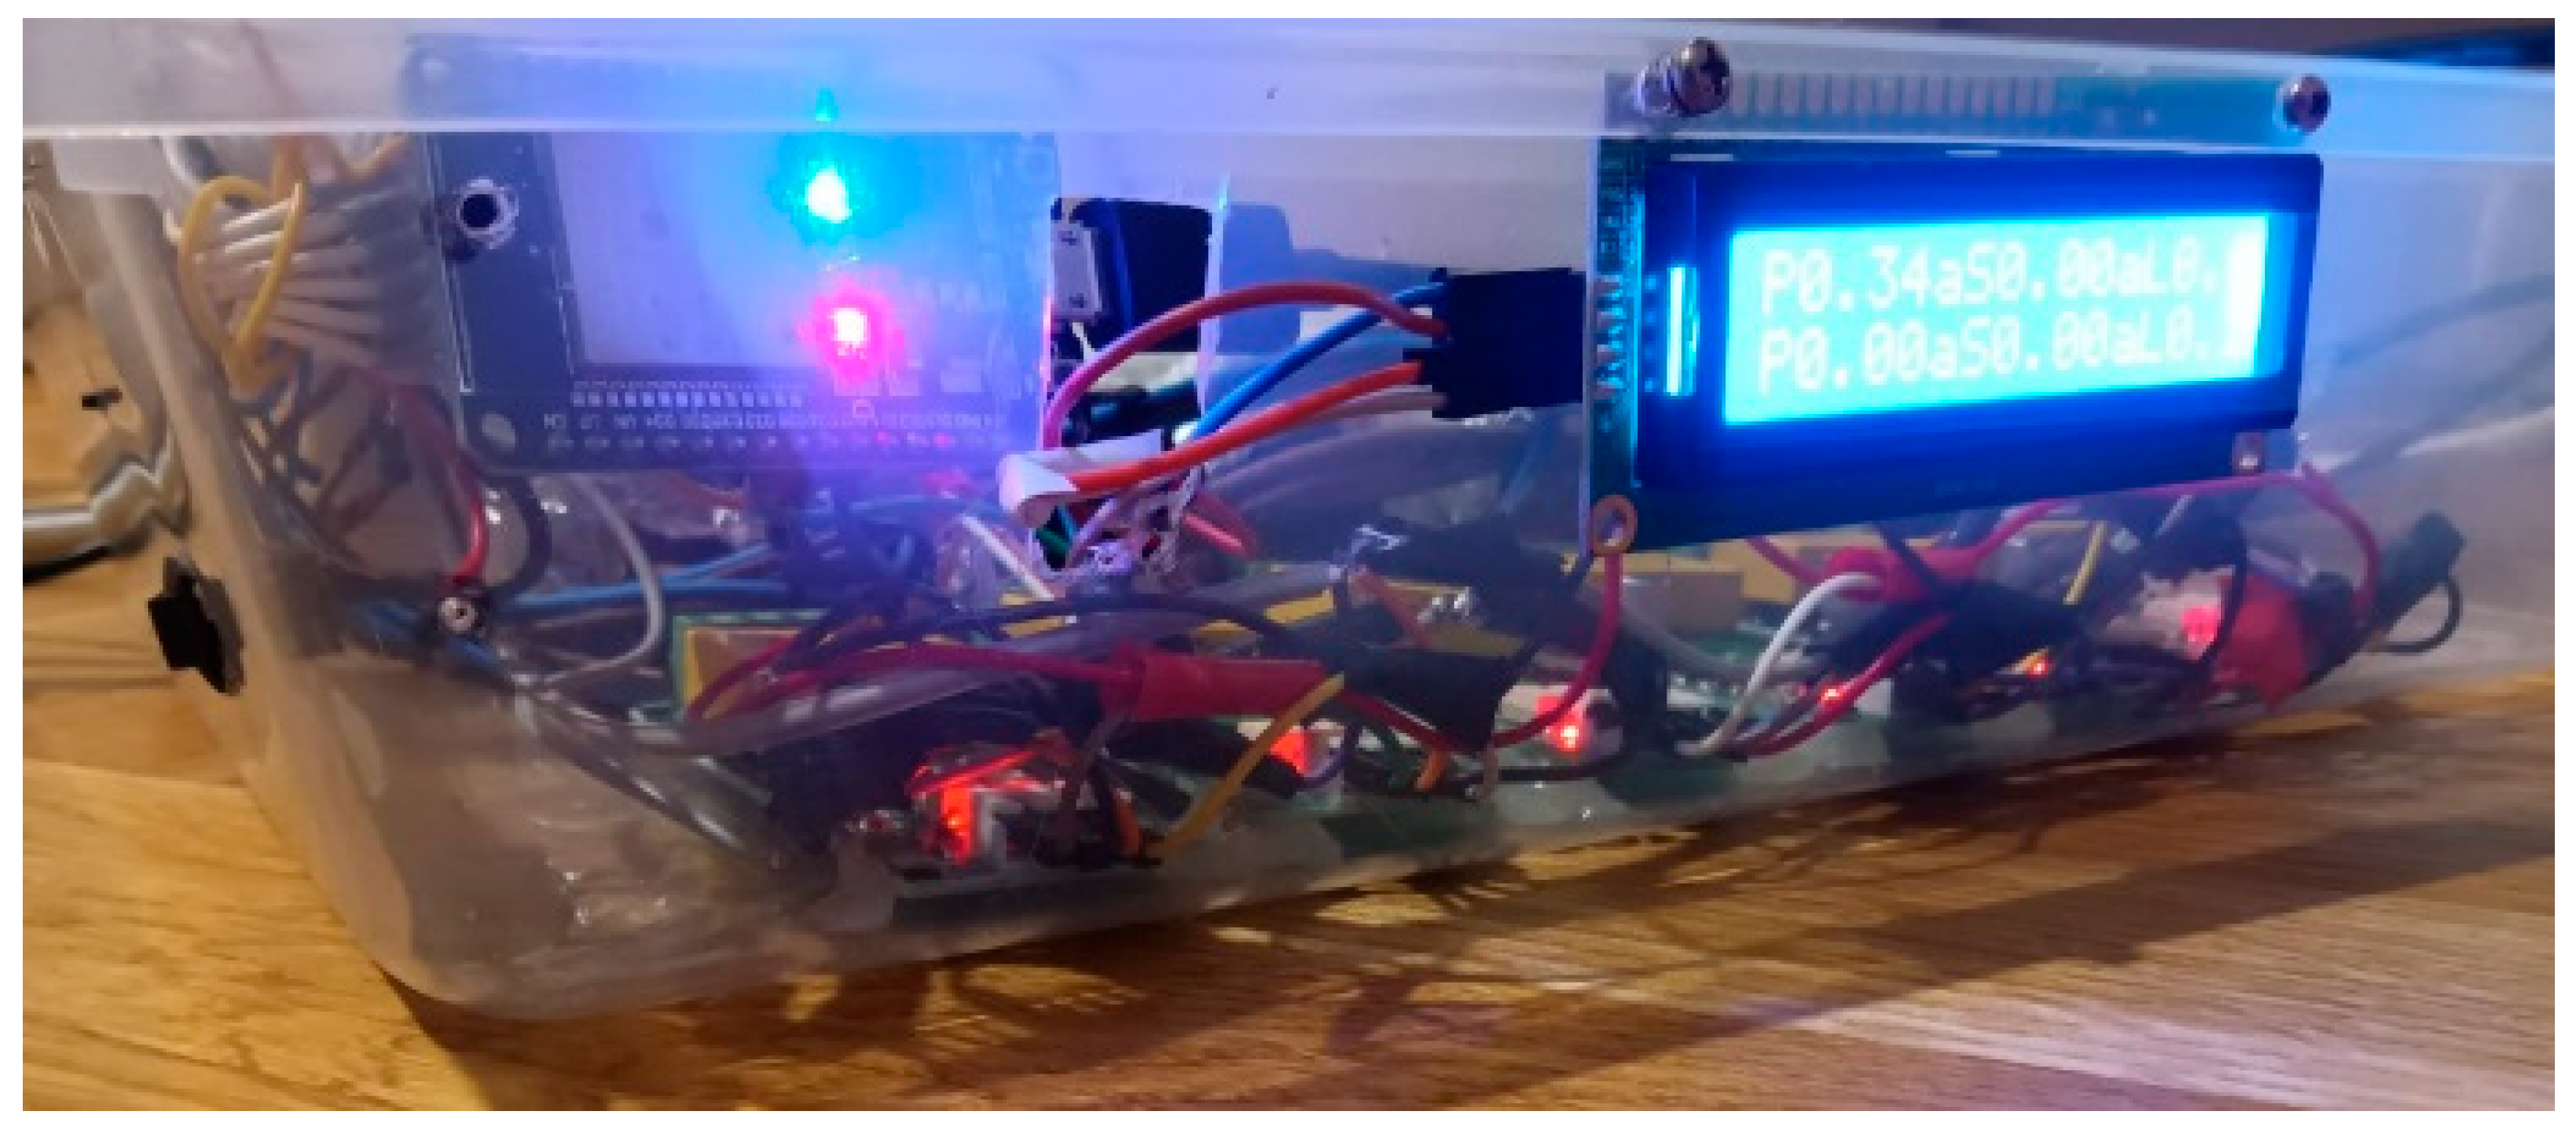
- I2C screen (16 × 2, optional): this screen displays system information and measurements,
- Power supply (5 V/800 mA): provides the necessary power to the system,
- Additional components: including a simple switch, a resistor, an enclosure box, etc., for the complete hardware setup.
- Arduino One: serves as the primary controller for the sequencer circuit;
- Optoisolated relay module (8×, compatible with Arduino): these relays enable controlled switching operations,
- Power Supply (12 V, 1 A): powers the sequencer system.
- Adding the price of all the components, the budget of the control unit with the display, the SD card reader, one 8 GB memory card, and the power supply to power the entire assembly is around EUR 22, to which EUR 5 would have to be added for each measurement channel, which would mean a total of EUR 52 at most for a 6-channel acquisition unit (5 measurement channels for applications plus one for the aggregate). It should be noted that each additional measurement channel, thanks to the expandable design using an RS485 bus, only needed a measurement module and a Schottky diode, removing about EUR 5 from the budget. In summary, the cost of this simple optional unit would be around EUR 13.
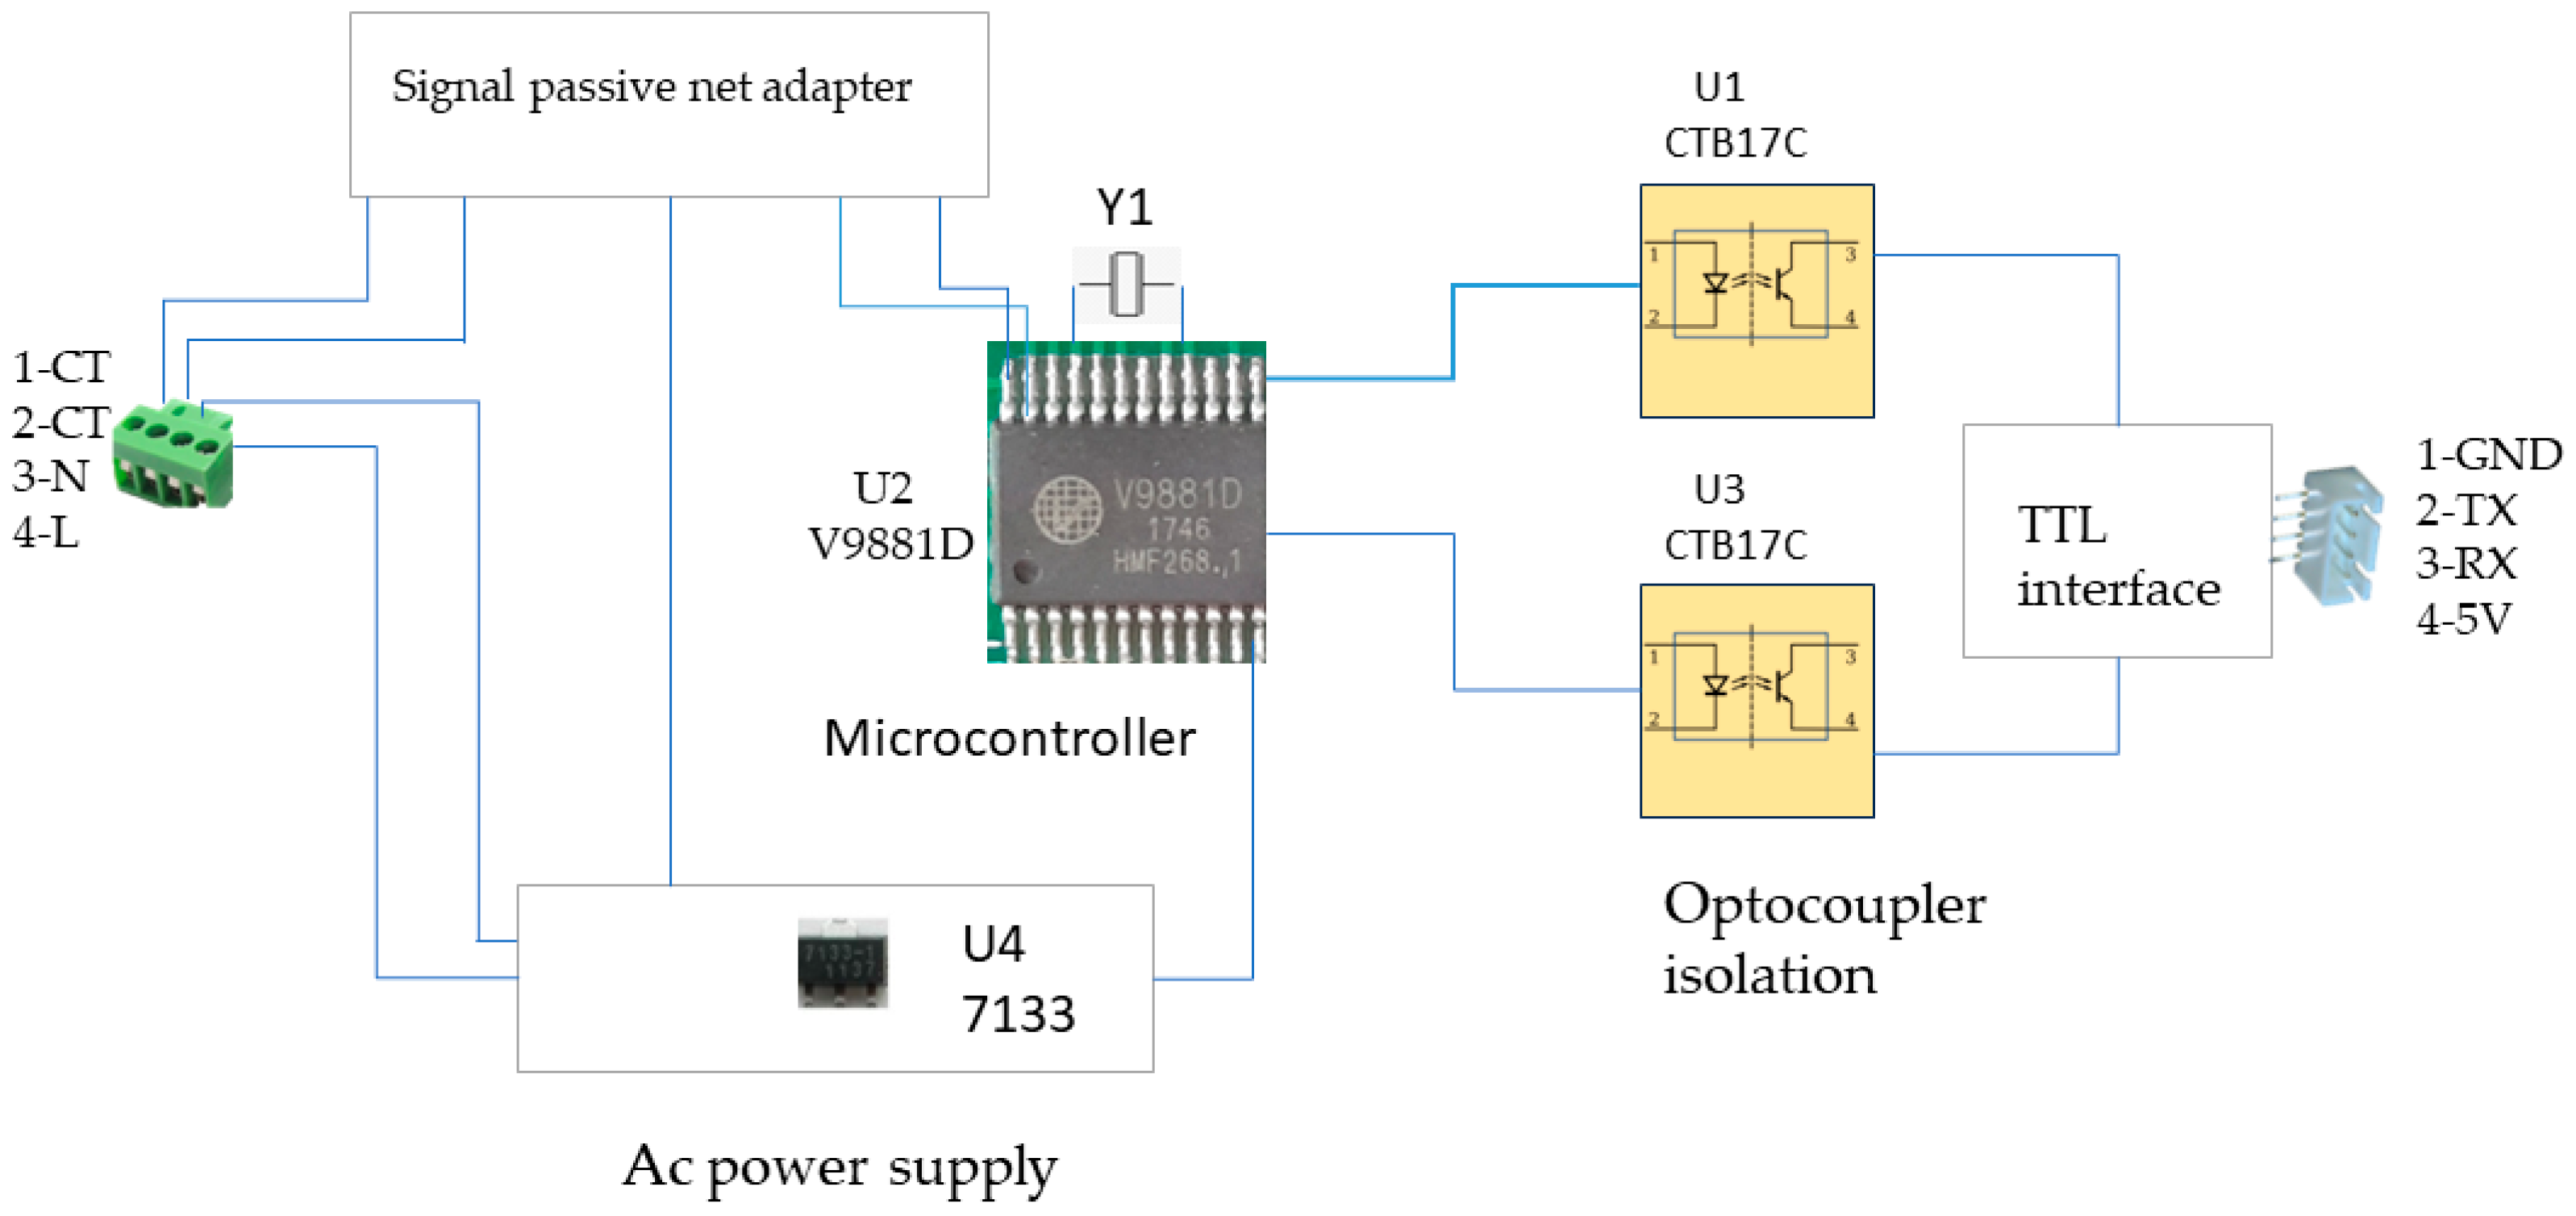
2.1. PZEM-004 Module
- Voltage: 80–260 V; Resolution: 0.1 V; Accuracy: 0.5%.
- Current: measuring range: 0–100 A; Initial measuring current: 0.024; Resolution: 0.001; Accuracy: 0.5%.
- Active power: measuring range: 0–23 kW; Initial power: 0.4 W; Resolution: 0.1 W; Display format: <1000 W (e.g., 999.9 W) and ≥1000 W (e.g., 1000 W); Accuracy: 0.5%.
- Power factor: measurement range: 0.00–1.00; Resolution: 0.01; Accuracy: 1%.
- Frequency: Measuring range: 45 Hz–65 Hz; Resolution: 0.1 Hz; Accuracy: 0.5%.
- Active energy: measuring range: 0–9999.99 kWh; Resolution: 1 Wh; Accuracy: 0.5%; Display format: <10 kWh (Wh unit) and ≥10 kWh (kWh unit).
- The PZEM module is a versatile tool that can be used in a variety of industrial automation projects. However, in most cases, it is used in isolation. A solution has been developed using multiple PZEM modules connected to an RS485 bus. The RS485 bus is a physical layer standard widely used in industrial automation. It is known for its noise resistance, extended data transmission range, and ability to support up to 127 devices on a single network. OMPM’s solution takes advantage of the RS485 bus to enable communication between multiple PZEM modules. This allows users to collect data from a variety of sources and perform more complex analyses.
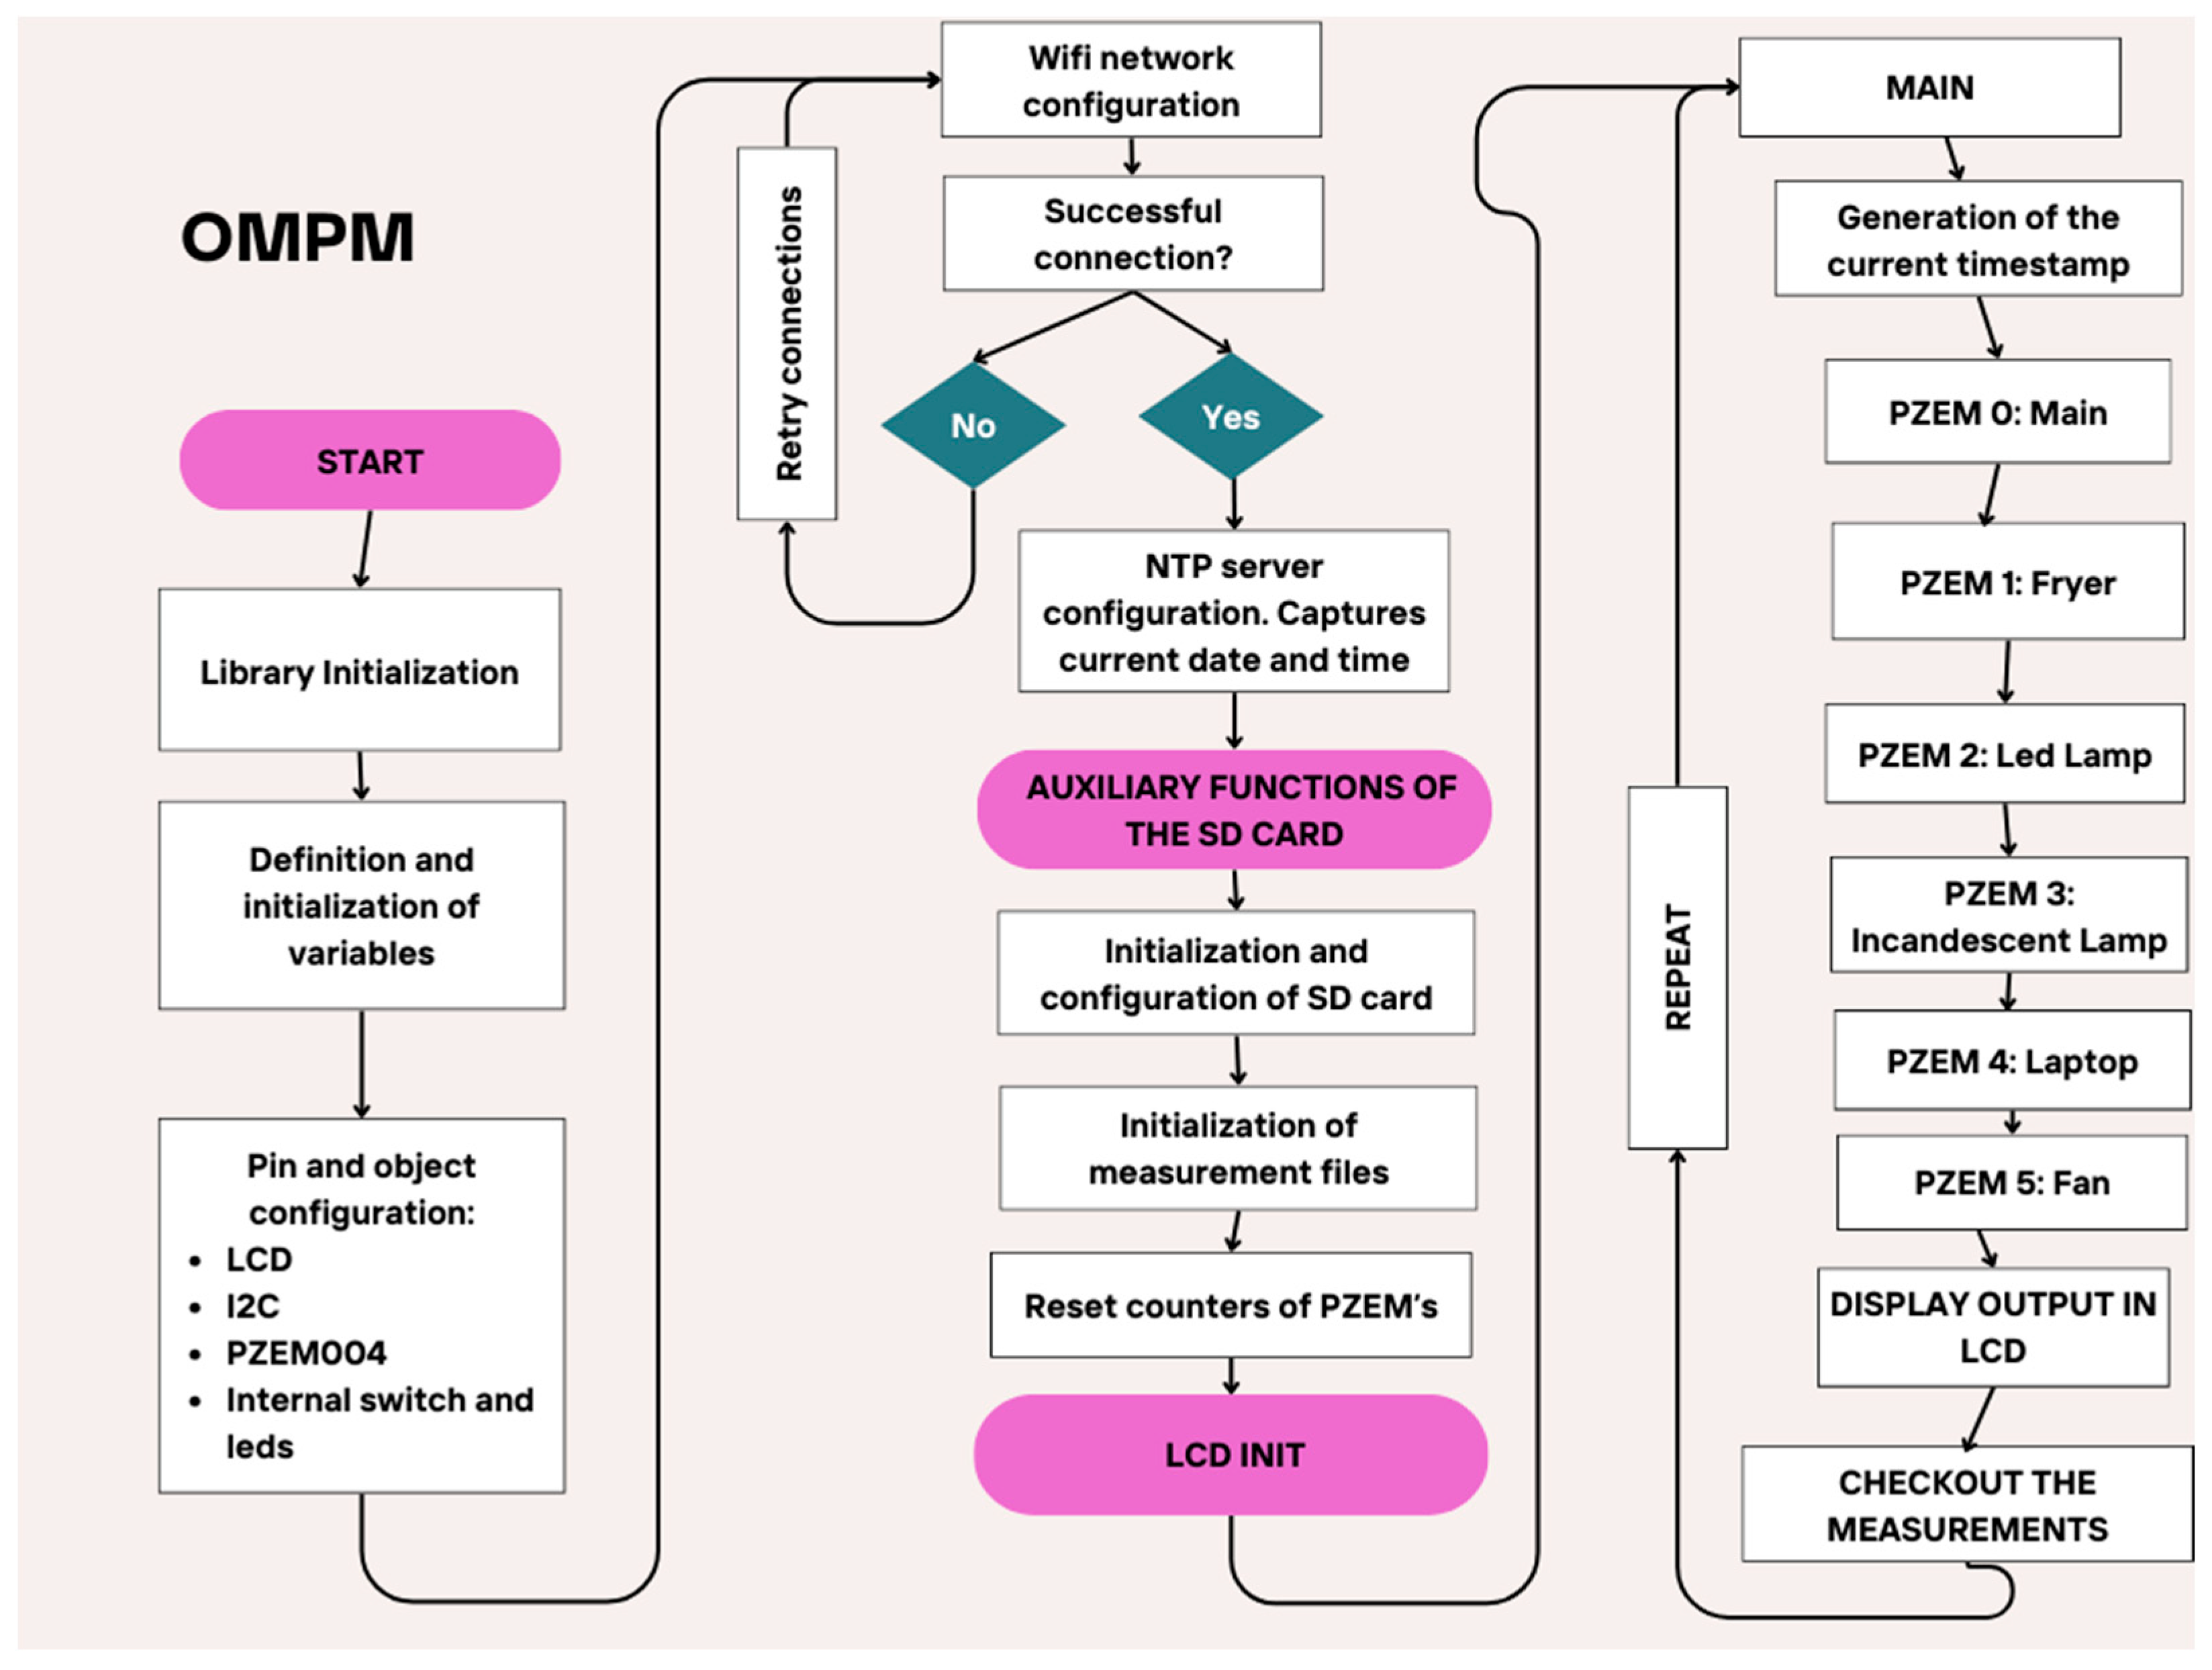
2.2. Measurement Module
- CS: GPIO 5;
- MOSI: GPIO 23;
- MISO: GPIO 19;
- SCK: GPIO 18.
- SDA: GPIO 13;
- SCL: GPIO 14.
- 0 × 110: aggregate consumption;
- 0 × 120: plug 1;
- 0 × 130: plug 2;
- 0 × 140: plug 3,
- 0 × 150: plug 4;
- 0 × 160: plug 5.
2.3. Sequencer Module
2.4. Metrics Used in This Work Available in NILMTK
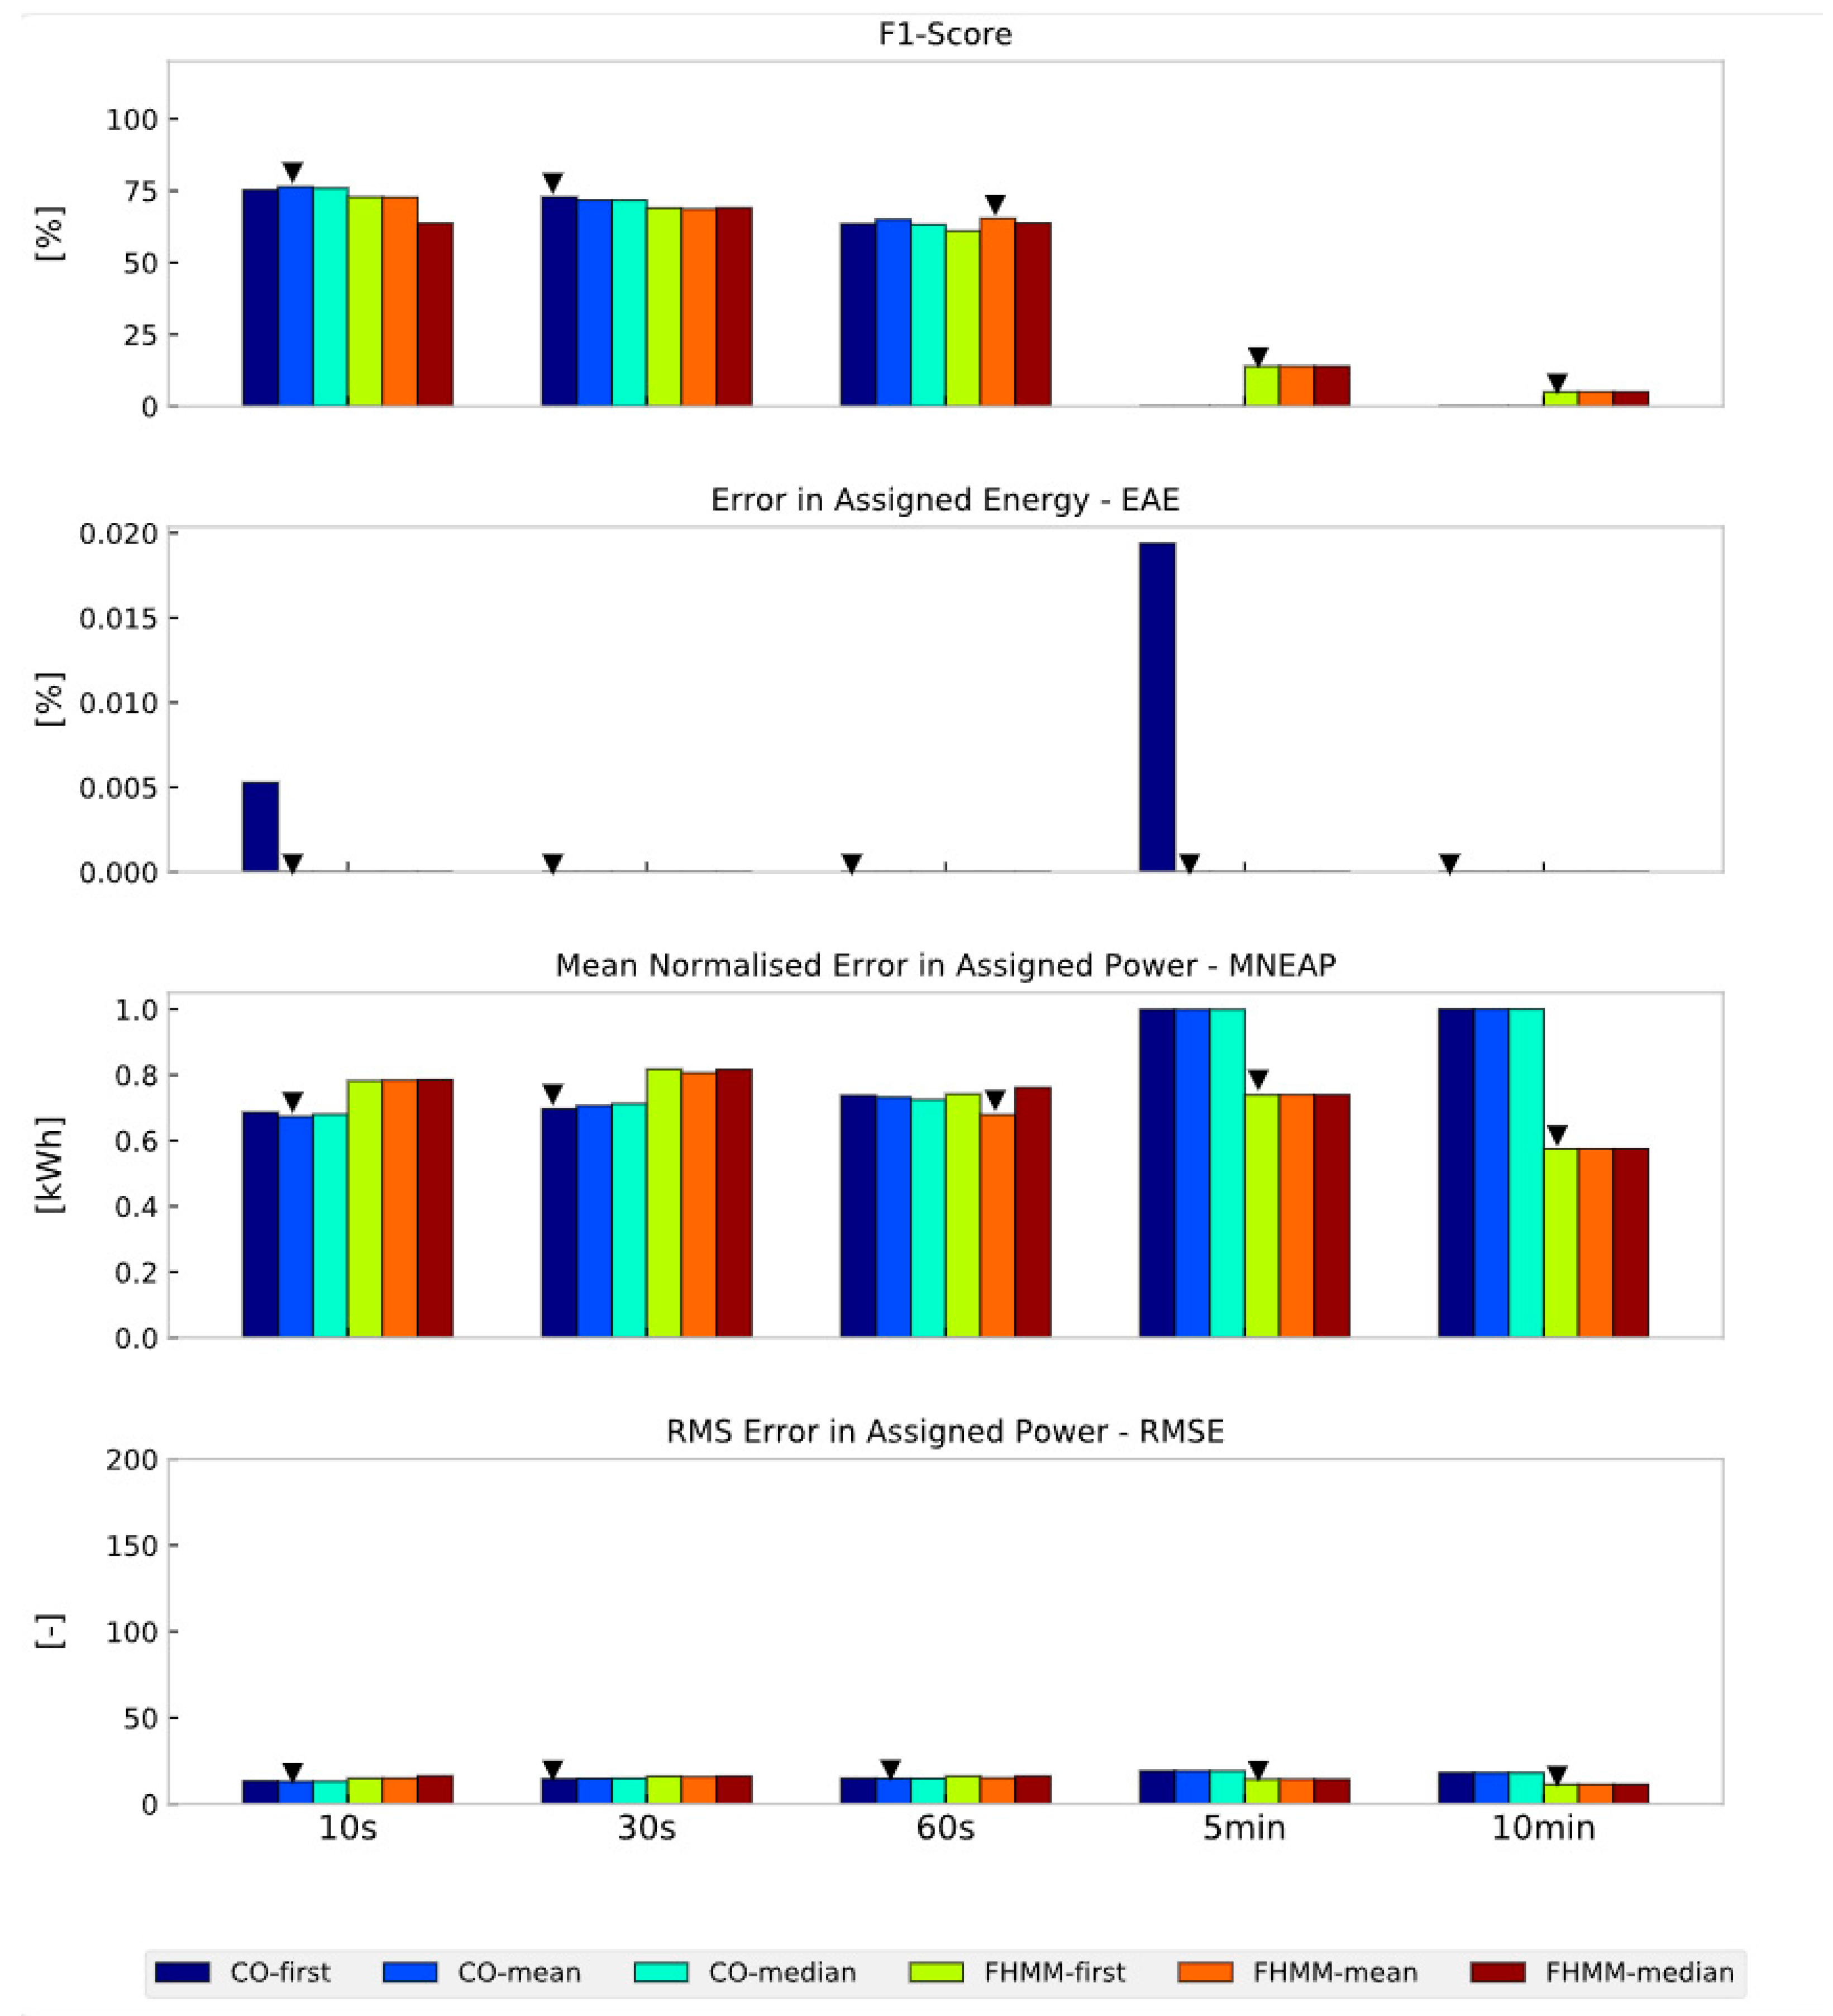
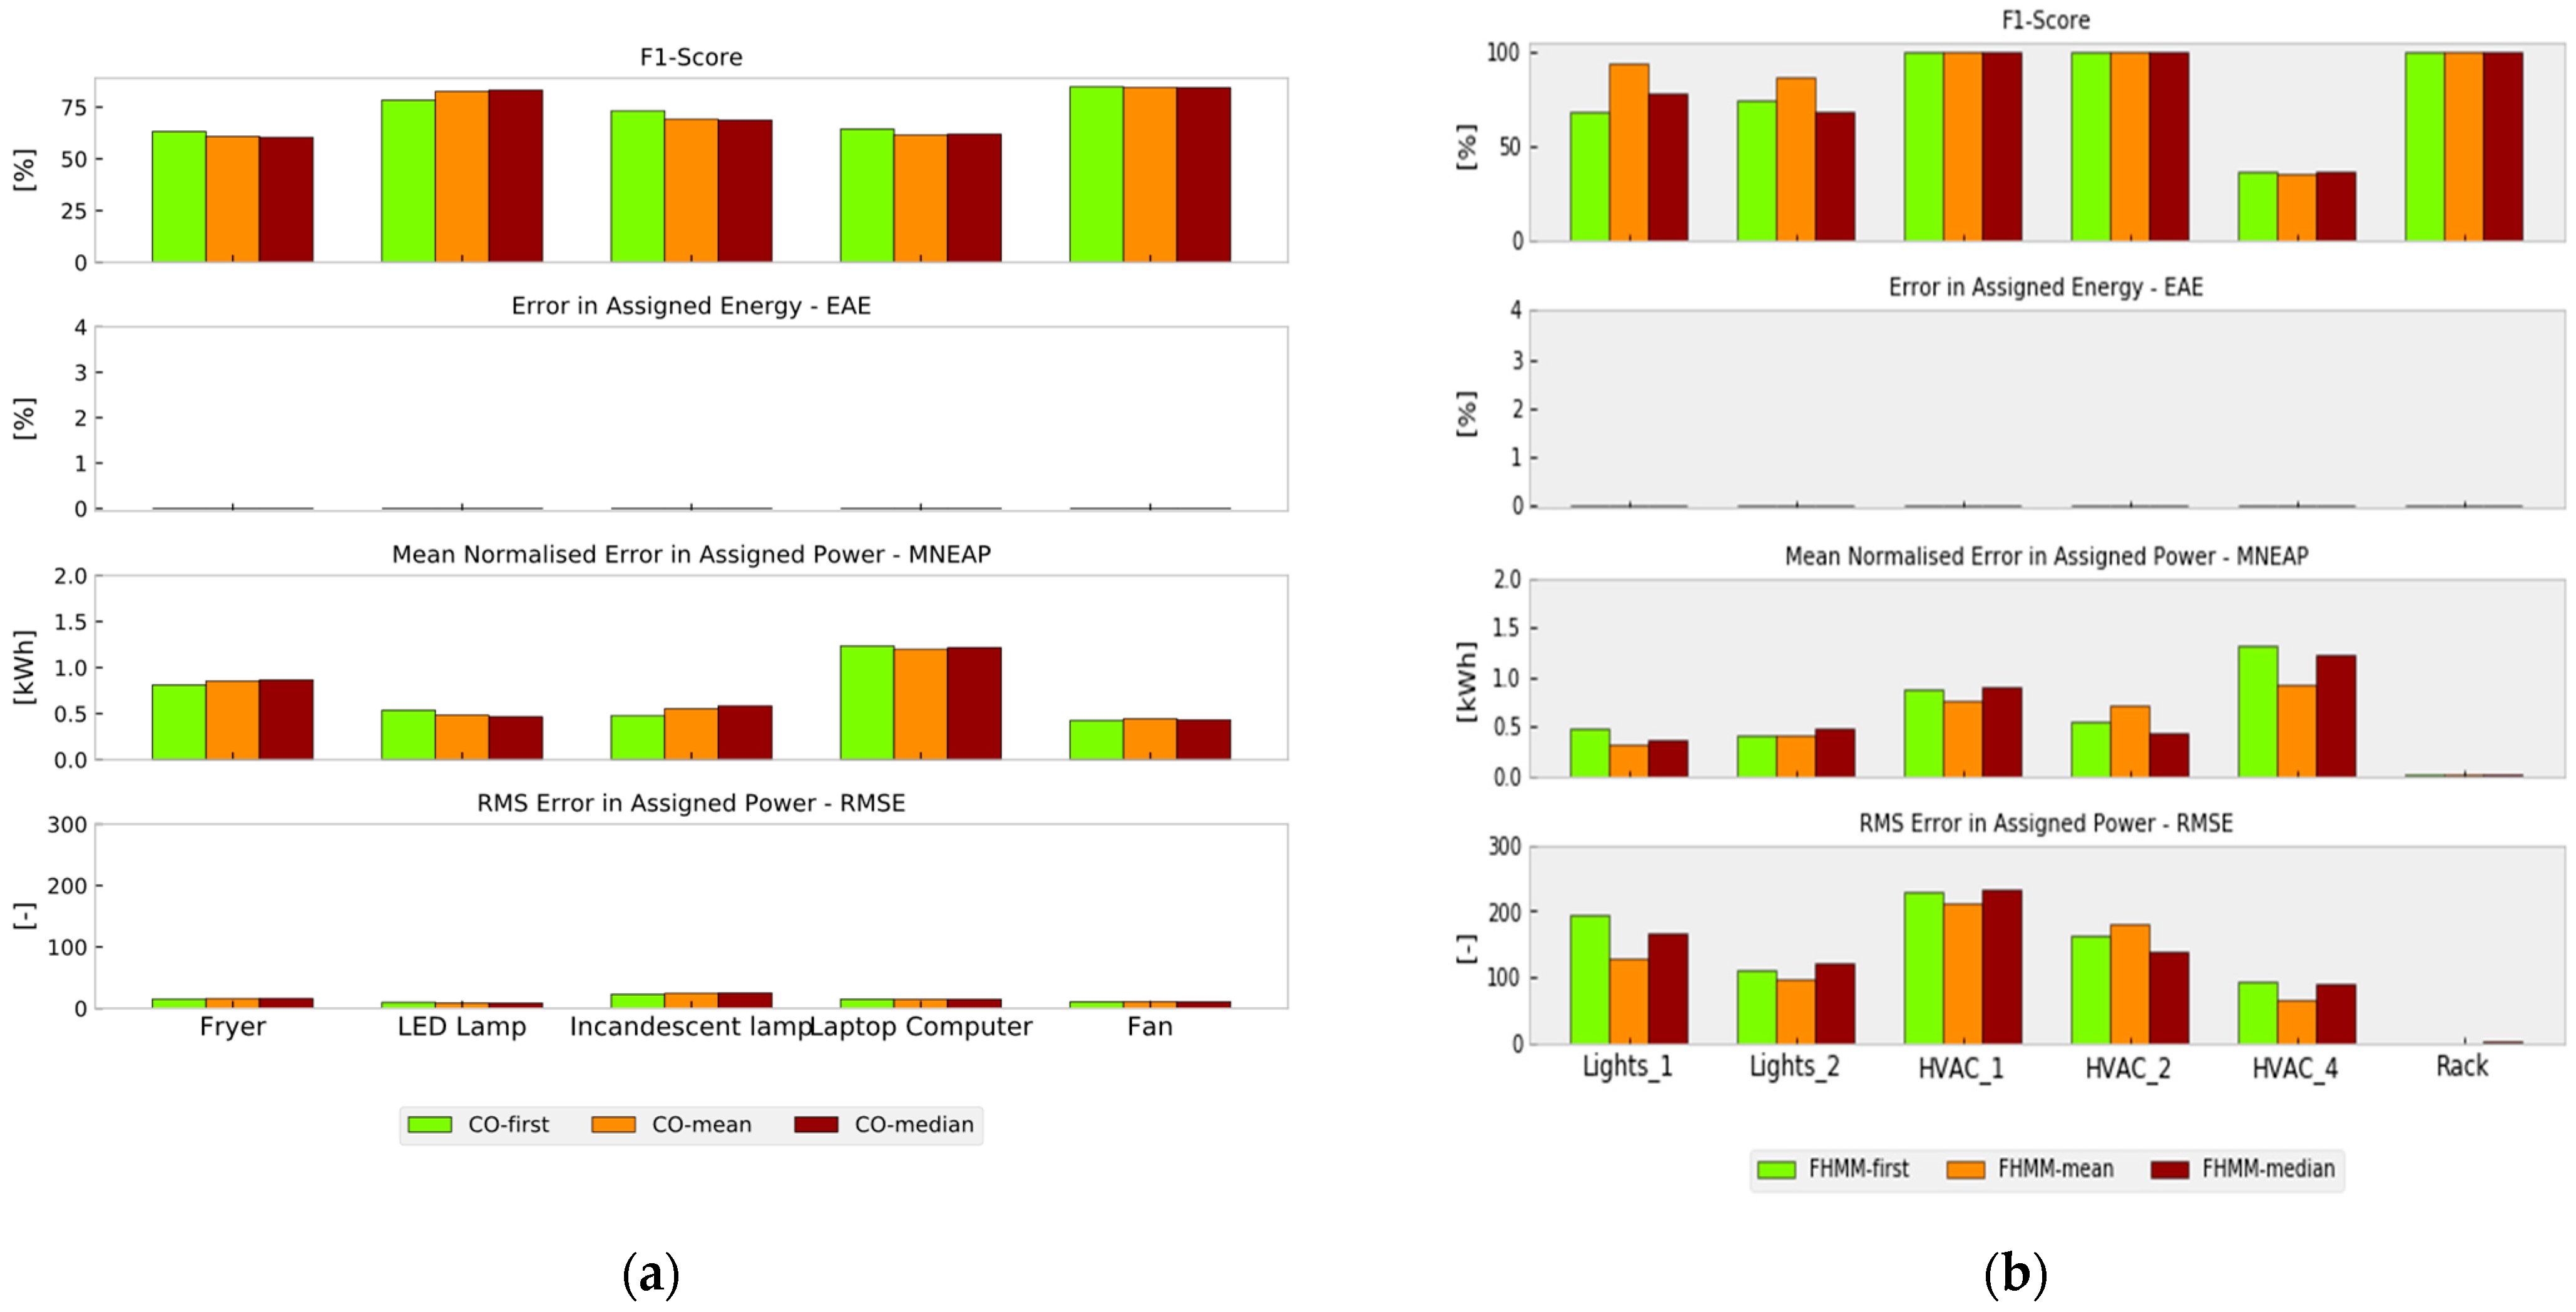
- Error in total Allocated Energy (EAE) [48] quantifies the mean absolute error in energy estimation, calculated by Equation (1) as follows:where is the assigned power of appliance n at each time interval t, and is the real power of the same appliance. This metric effectively quantifies the discrepancies between estimated and actual energy usage, indicating algorithm precision. A lower EAE means greater accuracy of the algorithm;
- Mean Normalized Error in Assigned Power (MNEAP) [48] is a metric that evaluates the average absolute error in a normalized form, expressed as a percentage. It is articulated as follows in Equation (2):where is the assigned power of appliance n at each time interval t, and y is the real power of the same appliance. A lower MNEAP value signifies enhanced accuracy of the algorithm;
- Root Mean Square Error (RMSE) [49] is a standard metric that quantifies the magnitude of deviation in energy estimations, providing insight into the variance between energy consumption values predicted by the model and the real figures, as depicted in Equation (3).where is the assigned power of appliance n at each time interval t, is the real power of the same appliance, and T represents the total number of observations or time intervals over which the energy consumption is recorded;
- F-score. Known as the F1-score [50], this critical metric in machine learning evaluates the balance between model precision and recall. Derived from the confusion matrix within NILMTK, it embodies an amalgamation of precision and recall. Precision (positive predictive values), given in Equation (4), is concerned with the accurate prediction of ‘ON’ states. At the same time, Recall (Sensitivity), calculated as per Equation (5), focuses on correctly identifying actual appliance activations.TP represents true positives, FP false positives, and FN false negatives.
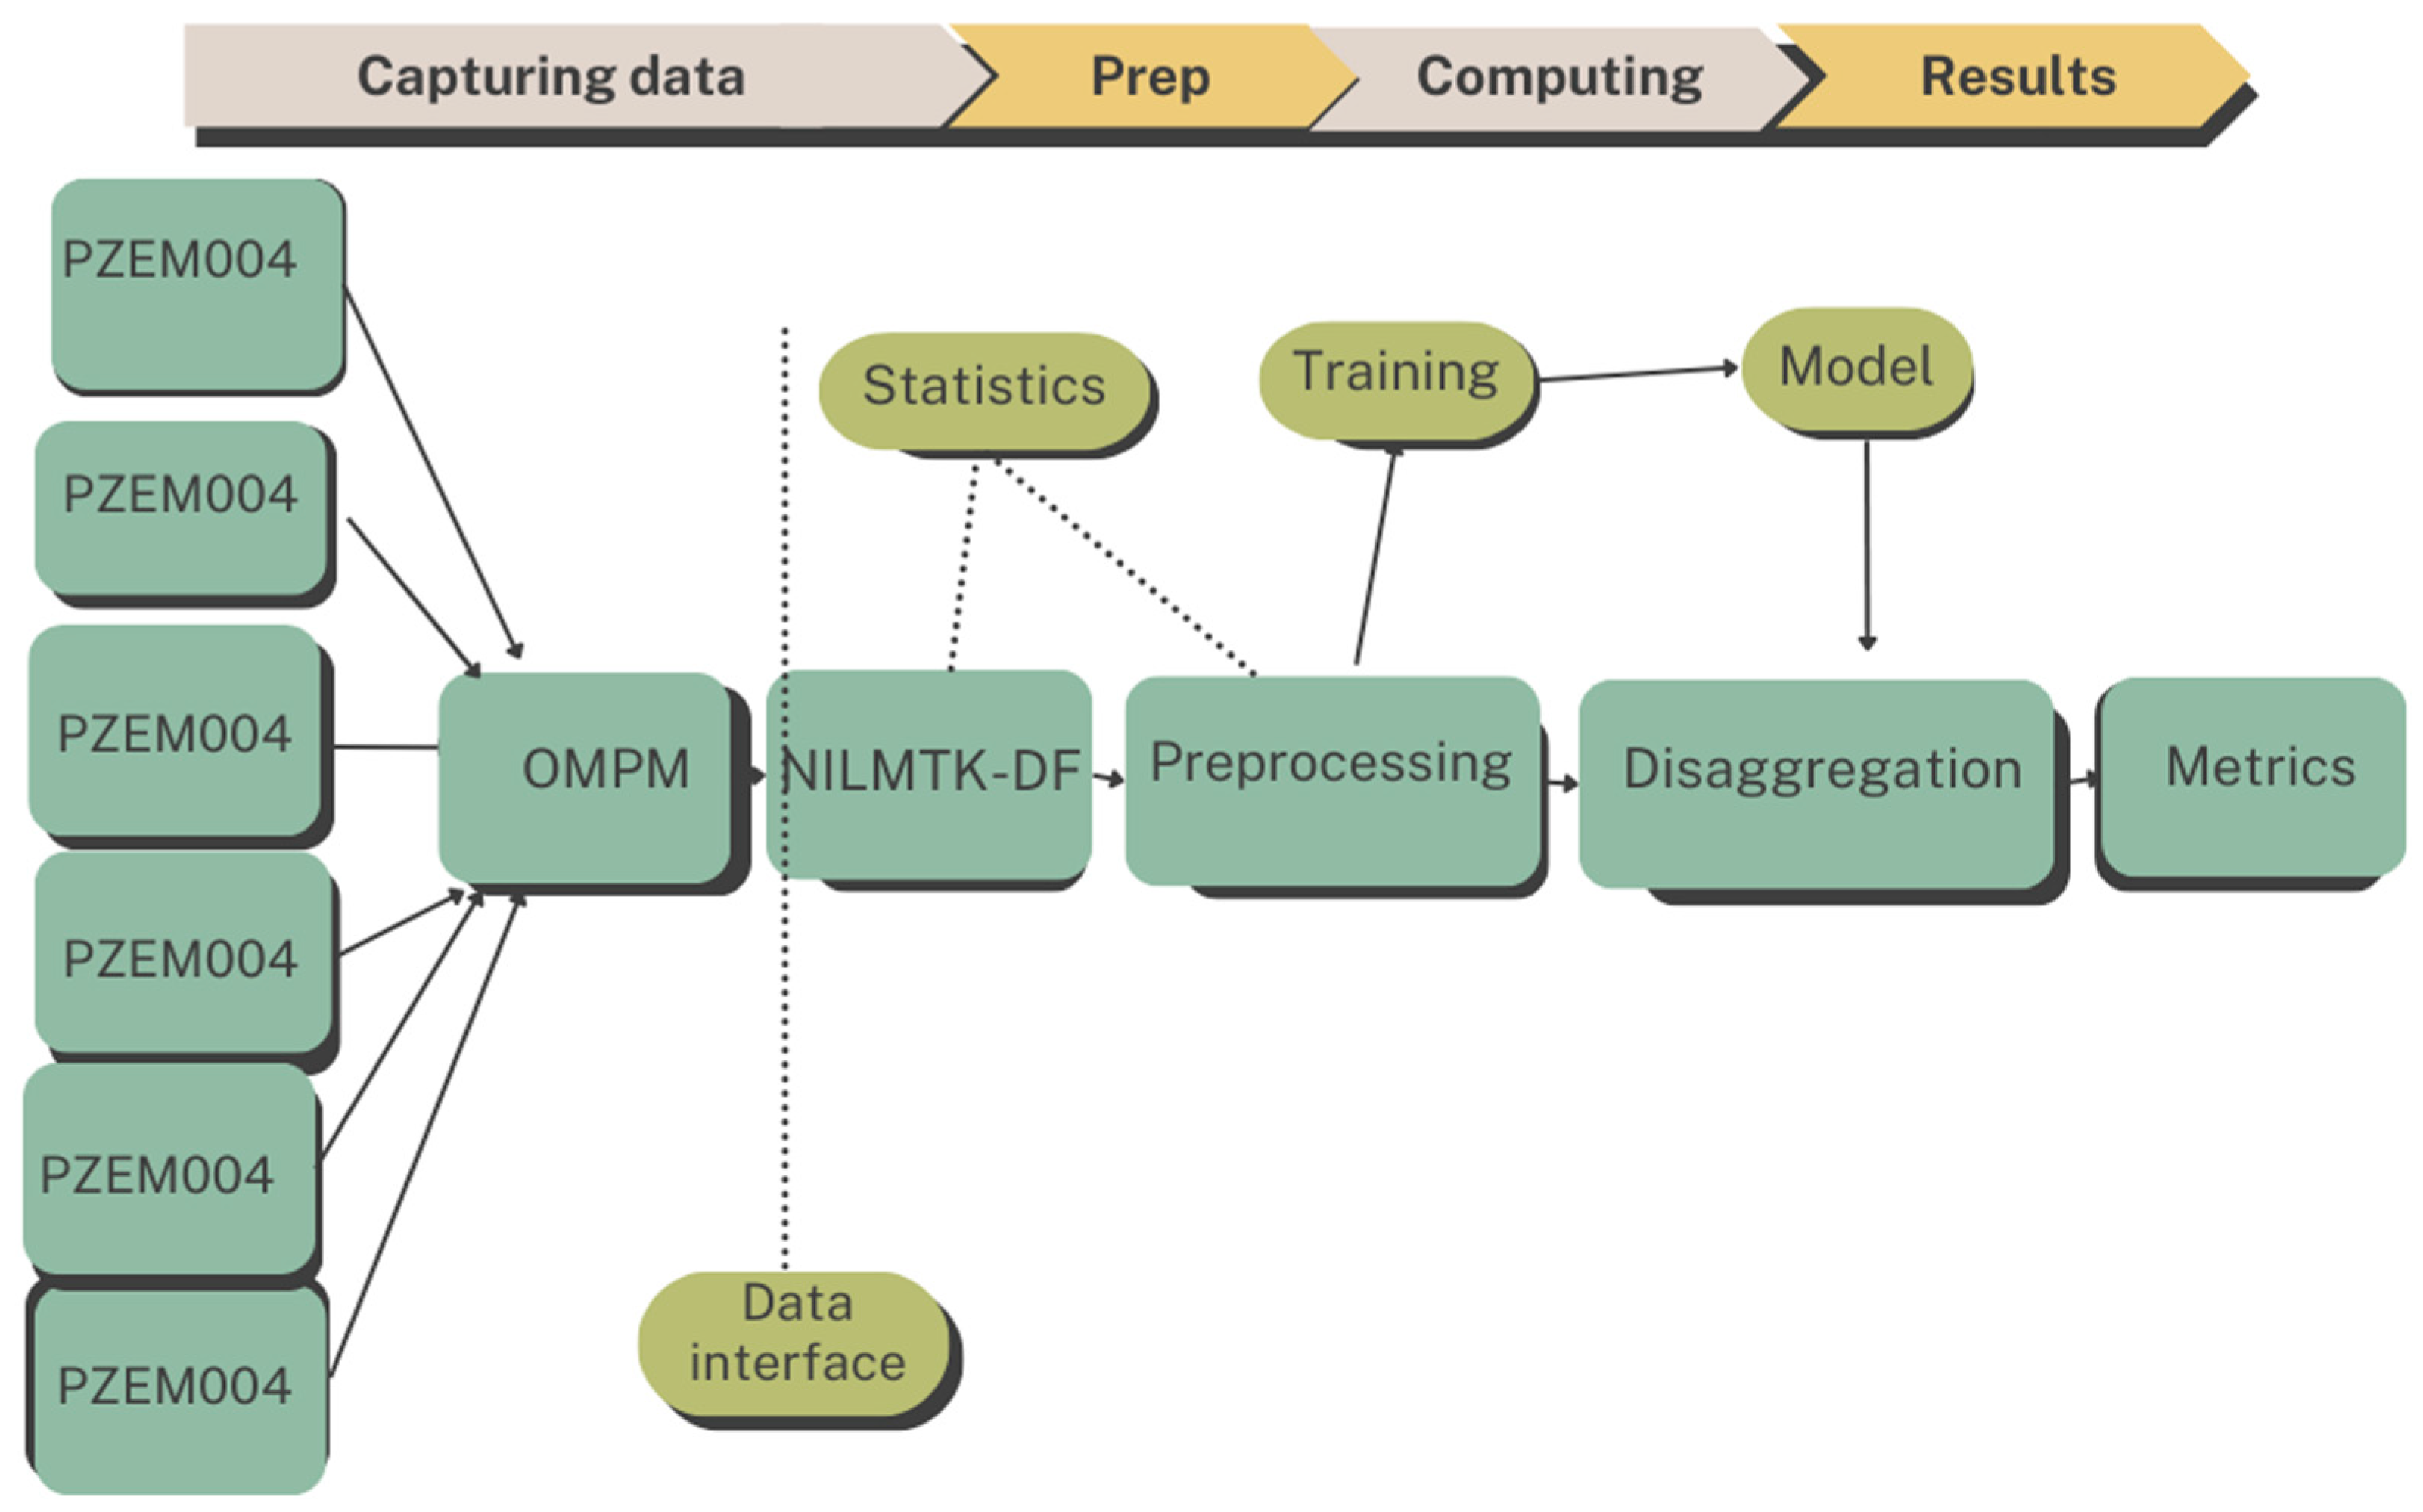
2.5. Disaggregation with NILMTK
3. Results and Discussion
4. Conclusions
Author Contributions
Funding
Data Availability Statement
Conflicts of Interest
References
- Lian, J.; Zhang, Y.; Ma, C.; Yang, Y.; Chaima, E. A review on recent sizing methodologies of hybrid renewable energy systems. Energy Convers. Manag. 2019, 199, 112027. [Google Scholar] [CrossRef]
- Juaidi, A.; AlFaris, F.; Saeed, F.; Salmeron-Manzano, E.; Manzano-Agugliaro, F. Urban Design to Achieving the Sustainable Energy of Residential Neighbourhoods in Arid Climate. J. Clean. Prod. 2019, 228, 135–152. [Google Scholar] [CrossRef]
- Alcayde, A.; Robalo, I.; Montoya, F.G.; Manzano-Agugliaro, F. SCADA System for Online Electrical Engineering Education. Inventions 2022, 7, 115. [Google Scholar] [CrossRef]
- Meliani, M.; Barkany, A.E.; Abbassi, I.E.; Darcherif, A.M.; Mahmoudi, M. Energy Management in the Smart Grid: State-of-the-Art and Future Trends. Int. J. Eng. Bus. Manag. 2021, 13, 18479790211032920. [Google Scholar] [CrossRef]
- Machlev, R.; Belikov, J.; Beck, Y.; Levron, Y. MO-NILM: A Multi-Objective Evolutionary Algorithm for NILM Classification. Energy Build. 2019, 199, 134–144. [Google Scholar] [CrossRef]
- Hart, G.W. Nonintrusive Appliance Load Monitoring. Proc. IEEE 1992, 80, 1870–1891. [Google Scholar] [CrossRef]
- Fortuna, L.; Buscarino, A. Non-Intrusive Load Monitoring. Sensors 2022, 22, 6675. [Google Scholar] [CrossRef]
- Papageorgiou, P.G.; Christoforidis, G.C.; Bouhouras, A.S. Odd Harmonic Distortion Contribution on a Support Vector Machine NILM Approach. In Proceedings of the SyNERGY MED 2022—2nd International Conference on Energy Transition in the Mediterranean Area, Thessaloniki, Greece, 17–19 October 2022. [Google Scholar]
- Melin, P.; Miramontes, I.; Carvajal, O.; Prado-Arechiga, G. Fuzzy Dynamic Parameter Adaptation in the Bird Swarm Algorithm for Neural Network Optimization. Soft Comput. 2022, 26, 9497–9514. [Google Scholar] [CrossRef] [PubMed]
- Chui, K.T.; Lytras, M.D.; Visvizi, A. Energy Sustainability in Smart Cities: Artificial Intelligence, Smart Monitoring, and Optimization of Energy Consumption. Energies 2018, 11, 2869. [Google Scholar] [CrossRef]
- Gong, F.; Liu, C.; Jiang, L.; Li, H.; Lin, J.Y.; Yin, B. Load Disaggregation in Non-Intrusive Load Monitoring Based on Random Forest Optimized by Particle Swarm Optimization. In Proceedings of the 2017 IEEE Conference on Energy Internet and Energy System Integration, Beijing, China, 26–28 November 2017. [Google Scholar]
- Bing, Q.; Liya, L.; Xin, W. Low-Rate Non-Intrusive Load Disaggregation with Graph Shift Quadratic Form Constraint. Appl. Sci. 2018, 4, 554. [Google Scholar] [CrossRef]
- Quanbo, Y.; Huijuan, W.; Botao, W.; Yaodong, S.; Hejia, W. A Fusion Load Disaggregation Method Based on Clustering Algorithm and Support Vector Regression Optimization for Low Sampling Data. Future Internet 2019, 11, 51. [Google Scholar] [CrossRef]
- Albert, F. Algorithms for Energy Disaggregation. Master’s Thesis, Universitat Politècnica de Catalunya, Barcelona, Spain, 2016. Available online: https://upcommons.upc.edu/handle/2117/89937 (accessed on 30 November 2023).
- Lei, J.; Jiaming, L.; Suhuai, L.; Sam, W.; Glenn, P. Power Load Event Detection and Classification Based on Edge Symbol Analysis and Support Vector Machine. Appl. Comput. Intell. Soft Comput. 2012, 2012, 742461. [Google Scholar] [CrossRef]
- Berrettoni, G.; Bourelly, C.; Capriglione, D.; Ferrigno, L.; Miele, G. Preliminary Sensitivity Analysis of Combinatorial Optimization (CO) for NILM Applications: Effect of the Meter Accuracy. In Proceedings of the 2021 IEEE 6th International Forum on Research and Technology for Society and Industry (RTSI), Naples, Italy, 6–9 September 2021. [Google Scholar] [CrossRef]
- Hui, L. Non-Intrusive Load Monitoring; Liu, H., Ed.; Science Press: Beijing, China; Central South University: Chansha, China, 2020; Volume 1, ISBN 978-9811518591. [Google Scholar]
- Athanasiadis, C.L.; Papadopoulos, T.A.; Doukas, D.I. Real-Time Non-Intrusive Load Monitoring: A Light-Weight and Scalable Approach. Energy Build. 2021, 253, 111523. [Google Scholar] [CrossRef]
- Makonin, S.; Popowich, F.; Bartram, L.; Gill, B.; Bajić, I.V. AMPds: A Public Dataset for Load Disaggregation and Eco-Feedback Research. In Proceedings of the 2013 IEEE Electrical Power & Energy Conference, Halifax, NS, Canada, 21–23 August 2013. [Google Scholar]
- Maasoumy, M.; Sanandaji, B.M.; Poolla, K.; Vincentelli, A.S. BERDS-BERkeley EneRgy Disaggregation Data Set. In Proceedings of the Workshop on Big Learning at the Conference on Neural Information Processing Systems (NIPS), Lake Tahoe, NV, USA, 9 December 2013. [Google Scholar]
- Kriechbaumer, T.; Jacobsen, H.A. BLOND, a Building-Level Office Environment Dataset of Typical Electrical Appliances. Sci. Data 2018, 5, 180048. [Google Scholar] [CrossRef] [PubMed]
- Cannas, B.; Carcangiu, S.; Carta, D.; Fanni, A.; Muscas, C.; Sias, G.; Canetto, B.; Fresi, L.; Porcu, P. NILM Techniques Applied to a Real-Time Monitoring System of the Electricity Consumption. Acta IMEKO 2021, 10, 139–146. [Google Scholar] [CrossRef]
- Yu, M.; Wang, B.; Lu, L.; Bao, Z.; Qi, D. Non-Intrusive Adaptive Load Identification Based on Siamese Network. IEEE Access 2022, 10, 11564–11573. [Google Scholar] [CrossRef]
- Arias, S. DEPS: Dataset de La Escuela Politécnica Superior. Available online: https://github.com/AriasSilva/DEPS_NILM_Dataset (accessed on 3 June 2022).
- Batra, N.; Gulati, M.; Singh, A.; Srivastava, M.B. It’s Different: Insights into Home Energy Consumption in India. In Proceedings of the BuildSys 2013—5th ACM Workshop on Embedded Systems For Energy-Efficient Buildings, New York, NY, USA, 11–15 November 2013. [Google Scholar]
- Montoya, F.G.; García-Cruz, A.; Montoya, M.G.; Manzano-Agugliaro, F. Power Quality Techniques Research Worldwide: A Review. Renew. Sustain. Energy Rev. 2016, 54, 846–856. [Google Scholar] [CrossRef]
- Montoya, F.G.; Manzano-Agugliaro, F.; López, J.G.; Alguacil, P.S. Power Quality Research Techniques: Advantages and Disadvantages. Dyna 2012, 79, 66–74. [Google Scholar]
- Montoya, F.; Baños, R.; Alcayde, A.; Montoya, M.; Manzano-Agugliaro, F. Power Quality: Scientific Collaboration Networks and Research Trends. Energies 2018, 11, 2067. [Google Scholar] [CrossRef]
- Biansoongnern, S.; Plangklang, B. Nonintrusive Load Monitoring (NILM) Using an Artificial Neural Network in Embedded System with Low Sampling Rate. In Proceedings of the 2016 13th International Conference on Electrical Engineering/Electronics, Computer, Telecommunications and Information Technology (ECTI-CON), Chiang Mai, Thailand, 28 June–1 July 2016; pp. 1–4. [Google Scholar]
- Kromanis, R.; Forbes, C. A Low-Cost Robotic Camera System for Accurate Collection of Structural Response. Inventions 2019, 4, 47. [Google Scholar] [CrossRef]
- Mousavi, P.; Ghazizadeh, M.S.; Vahidinasab, V. A Decentralized Blockchain-Based Energy Market for Citizen Energy Communities. Inventions 2023, 8, 86. [Google Scholar] [CrossRef]
- Klimt, J.; Eiling, N.; Wege, F.; Baude, J.; Monti, A. The Role of Open-Source Software in the Energy Sector. Energies 2023, 16, 5855. [Google Scholar] [CrossRef]
- OpenEnergyMonitor. Available online: https://openenergymonitor.org/ (accessed on 30 November 2023).
- IoTaWatt. Available online: https://iotawatt.com/ (accessed on 30 November 2023).
- ESP32. Available online: http://esp32.net/ (accessed on 30 November 2023).
- Smappee. Available online: https://www.smappee.com/ (accessed on 30 November 2023).
- Raspberry Pi. Available online: https://www.raspberrypi.com/ (accessed on 30 November 2023).
- OpenZmeter. Available online: https://openzmeter.com/ (accessed on 30 November 2023).
- Viciana, E.; Alcayde, A.; Montoya, F.; Baños, R.; Arrabal-Campos, F.; Zapata-Sierra, A.; Manzano-Agugliaro, F. OpenZmeter: An Efficient Low-Cost Energy Smart Meter and Power Quality Analyzer. Sustainability 2018, 10, 4038. [Google Scholar] [CrossRef]
- Viciana, E.; Arrabal-Campos, F.M.; Alcayde, A.; Baños, R.; Montoya, F.G. All-in-One Three-Phase Smart Meter and Power Quality Analyzer with Extended IoT Capabilities. Measurement 2023, 206, 112309. [Google Scholar] [CrossRef]
- OMPM. Available online: https://github.com/crn565/OMPM (accessed on 30 November 2023).
- Batra, N.; Kelly, J.; Parson, O.; Dutta, H.; Knottenbelt, W.; Rogers, A.; Singh, A.; Srivastava, M. NILMTK: An Open Source Toolkit for Non-Intrusive Load Monitoring. In Proceedings of the e-Energy 2014—5th ACM International Conference on Future Energy Systems, Cambridge, UK, 11–13 June 2014. [Google Scholar]
- Ebrahim, A.F.; Mohammed, O.A. Pre-Processing of Energy Demand Disaggregation Based Data Mining Techniques for Household Load Demand Forecasting. Inventions 2018, 3, 45. [Google Scholar] [CrossRef]
- Bonfigli, R.; Principi, E.; Fagiani, M.; Severini, M.; Squartini, S.; Piazza, F. Non-intrusive load monitoring by using active and reactive power in additive Factorial Hidden Markov Models. Appl. Energy 2017, 208, 1590–1607. [Google Scholar] [CrossRef]
- Carrie Armel, K.; Gupta, A.; Shrimali, G.; Albert, A. Is Disaggregation the Holy Grail of Energy Efficiency? The Case of Electricity. Energy Policy 2013, 52, 213–234. [Google Scholar] [CrossRef]
- Zoha, A.; Gluhak, A.; Imran, M.; Rajasegarar, S. Non-Intrusive Load Monitoring Approaches for Disaggregated Energy Sensing: A Survey. Sensors 2012, 12, 16838–16866. [Google Scholar] [CrossRef]
- Peacefair Peacefair Site. Available online: https://www.peacefairmeter.com/ (accessed on 11 December 2023).
- Celi Peñafiel, C.E.; Guartan Castro, F.E. Aplicación de Técnicas de Machine Learning Para La Desagregación y Pronóstico Del Perfil de Carga En El Sector Industrial. Bachelor's Thesis, Universidad Politécnica Salesiana, Cuenca, Ecuador, 2021. Available online: http://dspace.ups.edu.ec/handle/123456789/21273 (accessed on 30 November 2023).
- Klemenjak, C.; Makonin, S.; Elmenreich, W. Towards Comparability in Non-Intrusive Load Monitoring: On Data and Performance Evaluation. In Proceedings of the 2020 IEEE Power and Energy Society Innovative Smart Grid Technologies Conference, ISGT 2020, Washington, DC, USA, 17–20 February 2020. [Google Scholar]
- Kelly, J.; Knottenbelt, W. Neural NILM: Deep Neural Networks Applied to Energy Disaggregation. In Proceedings of the BuildSys 2015—Proceedings of the 2nd ACM International Conference on Embedded Systems for Energy-Efficient Built, Seoul, Republic of Korea, 4–5 November 2015; pp. 55–64. [Google Scholar]
- DSUAL. Available online: https://github.com/crn565/DSUAL_without-armonics (accessed on 30 November 2023).
- Rodriguez-Navarro, C.; Alcayde, A.; Isanbaev, V.; Castro-Santos, L.; Filgueira-Vizoso, A.; Montoya, F.G. DSUALMH-A New High-Resolution Dataset for NILM. Renew. Energy Power Qual. J. 2023, 21, 238–243. [Google Scholar] [CrossRef]
- IAWE. Available online: https://iawe.github.io/ (accessed on 30 November 2023).
- OZm vs IAWE. Available online: https://github.com/crn565/NILMTK_ozm_vs_iawe (accessed on 30 November 2023).


| CO (Mean) | FHMM (Mean) | CO (Median) | FHMM (Median) | |
|---|---|---|---|---|
| 1 s | 6.45 | 8.47 | 7.21 | 11.07 |
| 10 s | 5.68 | 5.81 | 5.61 | 6.62 |
| 30 s | 4.84 | 4.62 | 4.61 | 4.83 |
| 60 s | 3.94 | 4.27 | 3.90 | 4.33 |
| 5 min | 6.46 | 9.66 | 5.71 | 8.39 |
| 15 min | 7.49 | 11.95 | 7.74 | 14.72 |
| CO (Mean) | FHMM (Mean) | CO (Median) | FHMM (Median) | CO (First) | FHMM (First) | |
|---|---|---|---|---|---|---|
| 1 s | 7.74 | 14.65 | 12.56 | 13.18 | 10.12 | 13.96 |
| 10 s | 8.57 | 7.68 | 9.73 | 8.10 | 5.38 | 7.11 |
| 30 s | 4.00 | 5.12 | 4.22 | 5.02 | 4.16 | 5.60 |
| 60 s | 3.70 | 5.57 | 3.77 | 4.84 | 4.25 | 5.47 |
| 5 min | 7.78 | 10.28 | 7.49 | 11.42 | 13.31 | 12.41 |
| 10 min | 8.73 | 13.49 | 8.95 | 13.10 | 10.88 | 14.54 |
| 15 min | 9.18 | 14.61 | 8.95 | 15.43 | 12.60 | 16.38 |
| 30 min | 9.34 | 14.46 | 9.13 | 13.74 | 9.69 | 14.29 |
| CO (Mean) | FHMM (Mean) | CO (Median) | FHMM (Median) | CO (First) | FHMM (First) | |
|---|---|---|---|---|---|---|
| 1 s | 11.01 | 124.36 | 12.65 | 117.12 | 11.46 | 112.09 |
| 10 s | 11.02 | 23.09 | 10.43 | 22.02 | 10.31 | 21.79 |
| 30 s | 10.23 | 15.35 | 10.29 | 15.65 | 10.24 | 15.41 |
| 60 s | 9.93 | 12.88 | 9.93 | 12.83 | 9.81 | 12.45 |
| 5 min | 9.94 | 10.38 | 9.47 | 10.41 | 9.48 | 10.27 |
| 10 min | 9.23 | 10.02 | 9.33 | 10.05 | 9.27 | 10.03 |
| Meter | Registered Measures | Sampling Period |
|---|---|---|
| 1 × Three-phase main meter (RST) | P, Q | 1 s |
| 3 × Phase meters (R, S y T) | P, Q, V, I | 1 s |
| 6 × Device Meters | P, Q, V, I | 1 s |
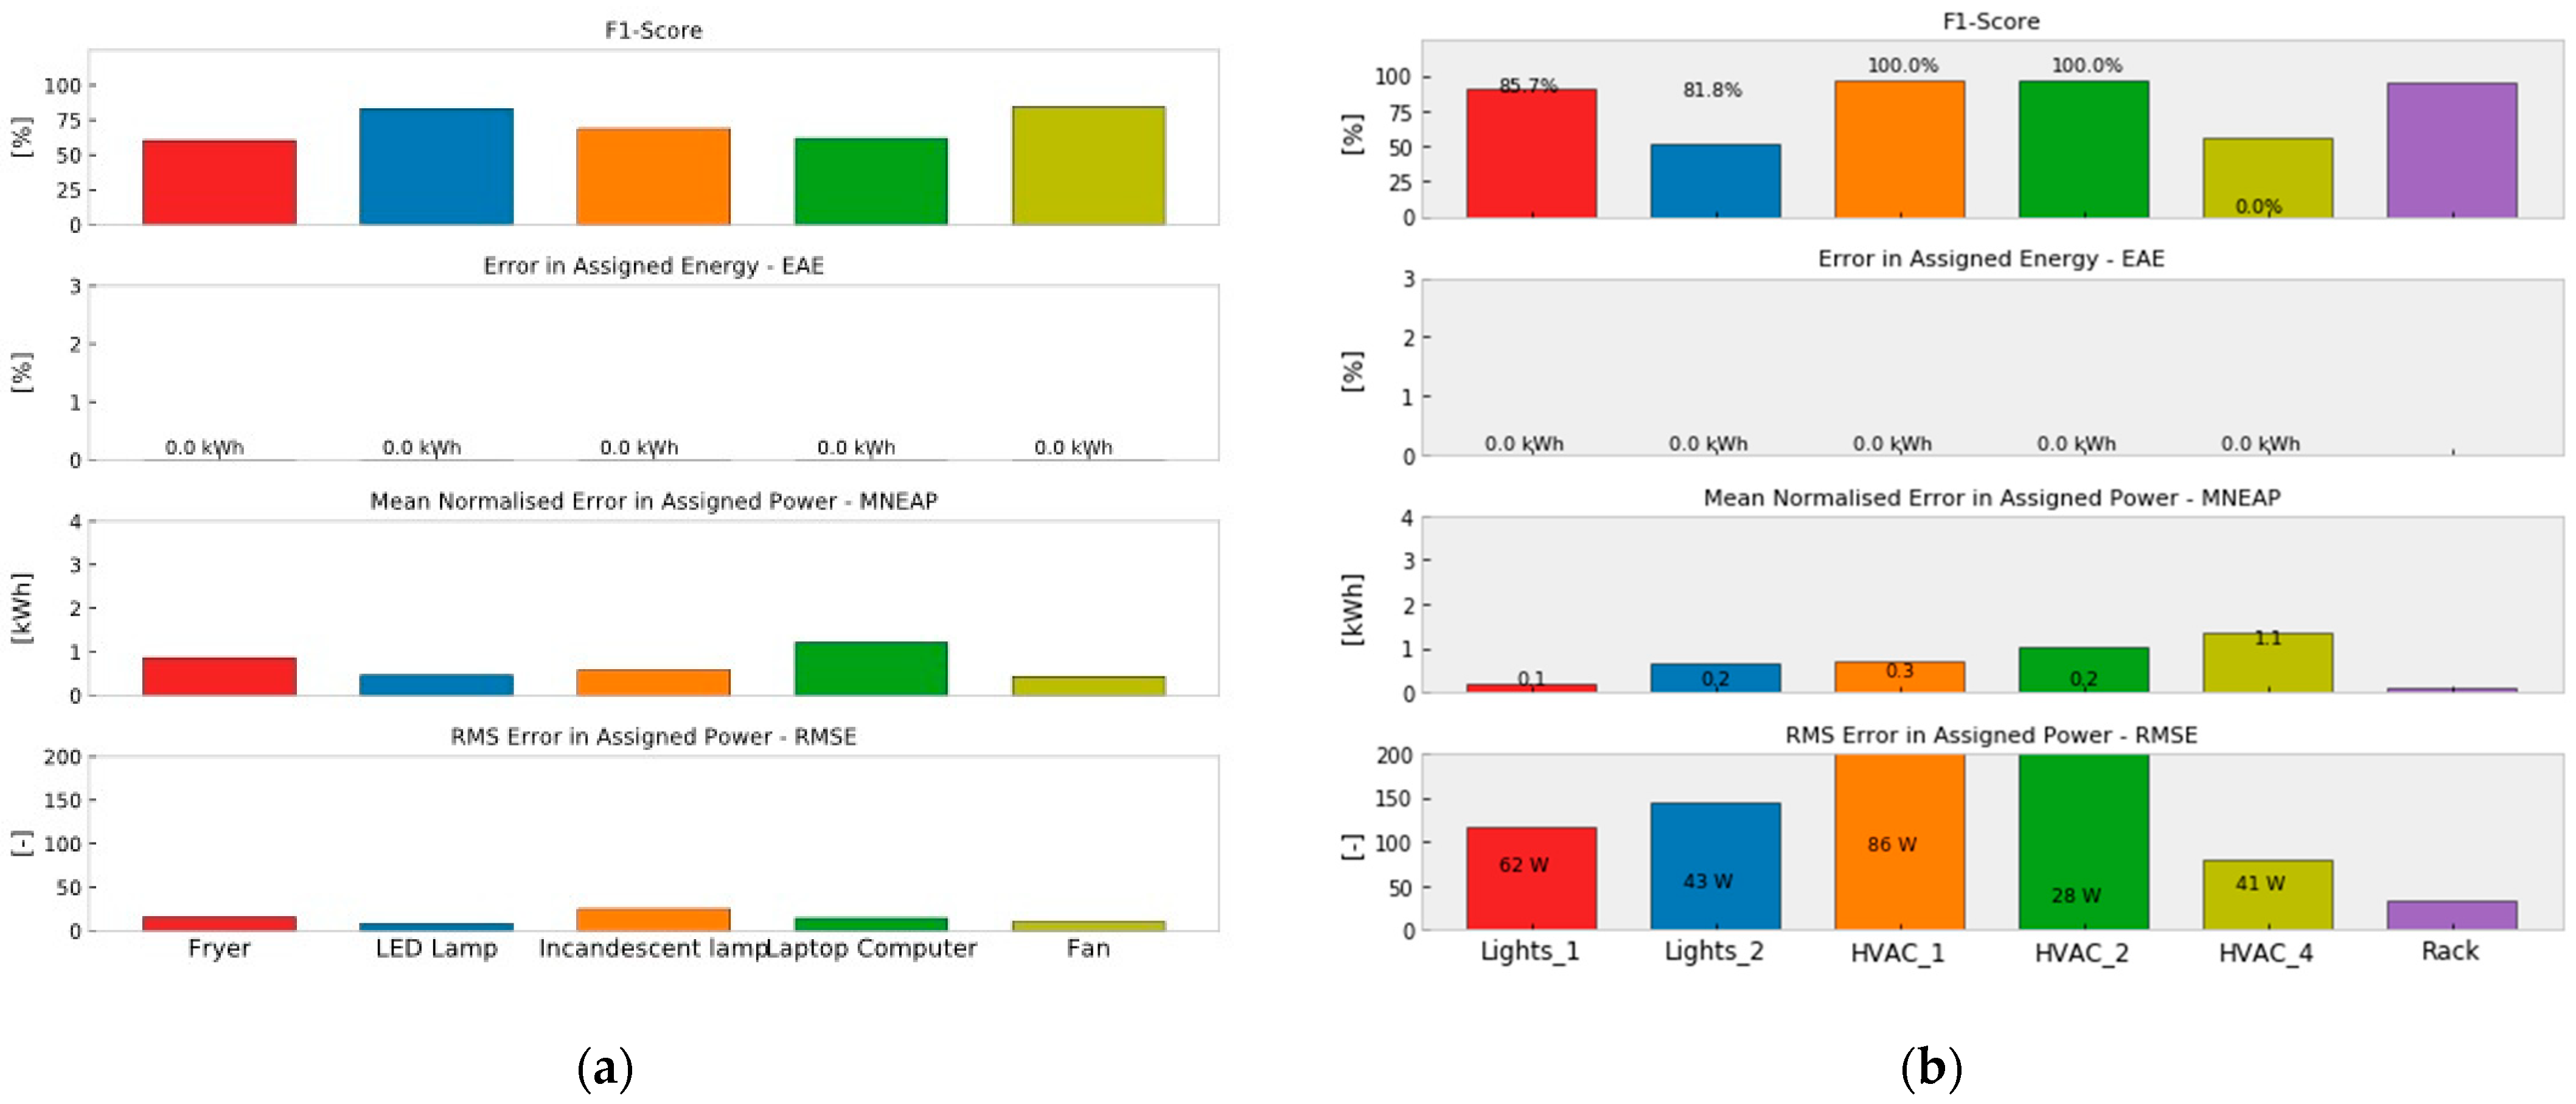
| Fryer | LED Lamp | Bulb Lamp | Laptop | Fan | |
|---|---|---|---|---|---|
| F1-score | 0.420 | 0.789 | 0.756 | 0.453 | 0.741 |
| EAE | 0.002 | 0.001 | 0.011 | 0.002 | 0.012 |
| MNEAP | 1.138 | 0.349 | 0.484 | 1.150 | 0.502 |
| RMSE | 17.417 | 7.339 | 22.688 | 13.816 | 12.651 |
| Lights_1 | Lights_2 | HVAC_1 | HVAC_2 | HVAC_4 | Rack | |
|---|---|---|---|---|---|---|
| F1-score | 0.915 | 0.860 | 0.968 | 0.972 | 0.463 | 0.945 |
| EAE | 0.61 | 0.59 | 1.62 | 2.56 | 0.49 | 0.49 |
| MNEAP | 0.16 | 0.26 | 0.59 | 0.94 | 1.23 | 0.12 |
| RMSE | 108.8 | 88.9 | 165.9 | 194.0 | 72.5 | 36.0 |
Disclaimer/Publisher’s Note: The statements, opinions and data contained in all publications are solely those of the individual author(s) and contributor(s) and not of MDPI and/or the editor(s). MDPI and/or the editor(s) disclaim responsibility for any injury to people or property resulting from any ideas, methods, instructions or products referred to in the content. |
© 2023 by the authors. Licensee MDPI, Basel, Switzerland. This article is an open access article distributed under the terms and conditions of the Creative Commons Attribution (CC BY) license (https://creativecommons.org/licenses/by/4.0/).
Share and Cite
Rodríguez-Navarro, C.; Portillo, F.; Martínez, F.; Manzano-Agugliaro, F.; Alcayde, A. Development and Application of an Open Power Meter Suitable for NILM. Inventions 2024, 9, 2. https://doi.org/10.3390/inventions9010002
Rodríguez-Navarro C, Portillo F, Martínez F, Manzano-Agugliaro F, Alcayde A. Development and Application of an Open Power Meter Suitable for NILM. Inventions. 2024; 9(1):2. https://doi.org/10.3390/inventions9010002
Chicago/Turabian StyleRodríguez-Navarro, Carlos, Francisco Portillo, Fernando Martínez, Francisco Manzano-Agugliaro, and Alfredo Alcayde. 2024. "Development and Application of an Open Power Meter Suitable for NILM" Inventions 9, no. 1: 2. https://doi.org/10.3390/inventions9010002