Article

Analysis of Some Essential Aspects Related to the Navigation Conditions on the Danube River

by
Andra Luciana Marcu Turcanu
1,*,
Liliana Mihaela Moga
1 and
Eugen Victor Cristian Rusu
2
1
Department of Economics, Faculty of Economics and Business Administration, University “Dunarea de Jos” of Galati, 800008 Galaţi, Romania
2
Department of Mechanical Engineering, Faculty of Engineering, University “Dunarea de Jos” of Galati, 800008 Galaţi, Romania
*
Author to whom correspondence should be addressed.
Inventions 2021, 6(4), 97; https://doi.org/10.3390/inventions6040097
Submission received: 10 September 2021 / Revised: 3 November 2021 / Accepted: 10 December 2021 / Published: 17 December 2021

Abstract

:
The European Union has emphasized the creation of an appropriate framework to optimize the internal market and inland transport waterways, and remove barriers to their wider use. Administrative barriers in the logistics of goods on the Danube waterway and its navigable tributaries constitute a significant obstacle to the efficient and sustainable use of the Danube as the region’s central transport hub. The approach proposed in this paper was designed to identify and analyze the relationship between the main variables leading to problematic inland waterway traffic, in this case, on the Danube, and the measures taken by the European Commission to improve it. In terms of the applied research method, “Quality Function Deployment” (QFD), we assign global (overall) and local priority degrees. The proposed framework for adapting QFD as a tool for improving quality and, therefore, performance, aims to identify and prioritize directions for this improvement. The House of Quality (HOQ) is the tool that links areas for improvement to technical requirements. The disclosure of these connections helps identify and prioritize the technical features that will generate the most significant improvements.

1. Introduction

A single European transport area should facilitate the movement of citizens and freight transport [1], reduce costs, and increase the sustainability of European transport [2]. Regarding maritime transport, the existence of a “Blue Belt” in European seas will simplify formalities for ships traveling between European Union (EU) ports. It is necessary to establish an appropriate framework for European inland waterway transport. Market access to ports needs to be improved further.
Water transport accounts for 90% of world trade, and cargo ships are part of the backbone of the global economy. Internationally, it has been found that transported goods have an estimated annual value of USD 4.5 trillion, and this value is expected to increase by about 4.7% in coming years, according to the Water Quality Assurance Union (2020) [3].
In addition, specialists have indicated that this means of transport is not exploited to its true potential [4]. Inland waterways transport should be developed because it plays a significant role in environmental protection and developing small enterprises [5]. However, this is a challenge for shipowners, and progress can be made only with the help of the European Commission.
International trade undertaken on the water is essential to provide direct links. Inland waterways are essential for the European States [6] because they connect these States, and for import–export activities to and from Asia. It is a significant priority for the European Commission to develop a unified navigation system to connect and maximize trans-European navigation potential.
The significant advantage of river navigation is the capability to transport a large quantity of heavy and oversized goods, simultaneously with price advantages [7]. Considerations of operationality also concern the estimated travel time and the related time costs. When calculating the estimated time, it is essential to consider crew costs, fuel, docking, transshipment, waste discharging, waiting times for customs formalities, and waiting times for unloading–loading. Economic conditions and territorial aspects can stimulate water transport [8], and these two factors must be in concordance with the needs of shipowners. The primary conditions for efficient water transport can be improved, and the bottlenecks addressed, by the relevant authorities.
The abundance of administration burdens reduces the economic and environmental potential of water transport, thus harming the economic growth and social welfare of the entire region. The international legal regulation of rivers represents one major problem [9]. Mitigating significant administrative barriers in a transnational coordinated manner is the primary step towards better governance of this mode of transport, and reduces the logistical costs of large industries that depend on inland waterway transport. The European Commission has sought to address administrative barriers and derivatives, and reduction of these factors is a significant priority in the agenda of its current transport policy. Consultation between the Directorate General for Mobility and Transport of the European Commission, which is responsible for the EU’s mobility and transport policy (DG MOVE), and the Department of the European Commission, which is responsible for the EU policy on the development of European regions and cities (DG Regio), led to the development of a program for the implementation of the EU Strategy for the Danube Region (and its priority area 1a). This implementation—the Transnational Danube Program—is a platform on which stakeholders can efficiently identify essential, concrete, and specific solutions to the many existing barriers.
The European institutions responsible for the Danube Region have developed many strategies and projects in order to improve shipping quality. We consider that it is essential to prioritize the measures implemented by the European Commission considering the bottlenecks identified by the shipowners, as presented in Section 3 of this paper.
Quality Function Deployment (QFD) was selected for the analysis in this study. This method was used to measure the impact of administrative burdens identified by shipowners on technical measures implemented by the European Commission to optimize the flow of goods on the Danube. Implementing the quality function is an approach to quality assurance in the product development process, but is not necessarily applied at every stage [10].
Quality Function Deployment is an instrument that is used in many fields, including maritime transport. Many studies have been conducted to help decision makers to improve their activities. Zeiner Sener and Ece Ozturk (2015) proposed the use of QFD to select an appropriate ship considering the company’s needs [11]. Ship routing is another vital element related to water transport. Many experts have used QFD for selecting suitable routes for the successful transfer of goods and passengers [12,13,14].
The results of the applied methodology indicate the essential point of intervention. In this study, we developed a set of recommendations to improve the navigation conditions on the Danube River.

2. Materials and Methods

Developed in Japan in 1960, Quality Function Deployment (QFD) was introduced into the United States in the early 1980s, and was adopted due to its popularity and history of success in the automotive industry [15]. Copying the model from manufacturers such as Toyota and Mitsubishi, the “Big Three” United States car manufacturers used QFD to better meet customer requirements in their industry. Once adopted, this method significantly shortened the design cycles and reduced the total number of employees required in the design process. Subsequent to its success in Japan, this method has been extensively developed [16,17].
The new standard of the International Organization for Standardization (ISO) 16355 -2015 [10] defines and demonstrates the dynamic nature of a customer-based approach. Since its establishment in 1966, the quality function has expanded and deepened the methods and tools to respond to changing business conditions of QFD users, management, customers, and products. Those who used QFD older models will find that these improvements QFD easier and faster to use. Methods and tools presented in the standards represent decades of improvements QFD list is neither exhaustive nor exclusive.
ISO 16355 describes the process of implementing the quality function, its purpose, users, and tools. It is not a standard management system, and it does not provide requirements or guidance for organizations to systematically develop and manage their policies, processes, and procedures to achieve specific objectives. Users of this part of ISO 16355 will include all organizational functions necessary to ensure customer satisfaction, including business planning, marketing, sales, research and development (R&D), engineering, information technology (IT) [18], production, procurement, quality, production, services, packaging and logistics, support, testing, regulation and other phases in hardware, software, services, and system organizations.
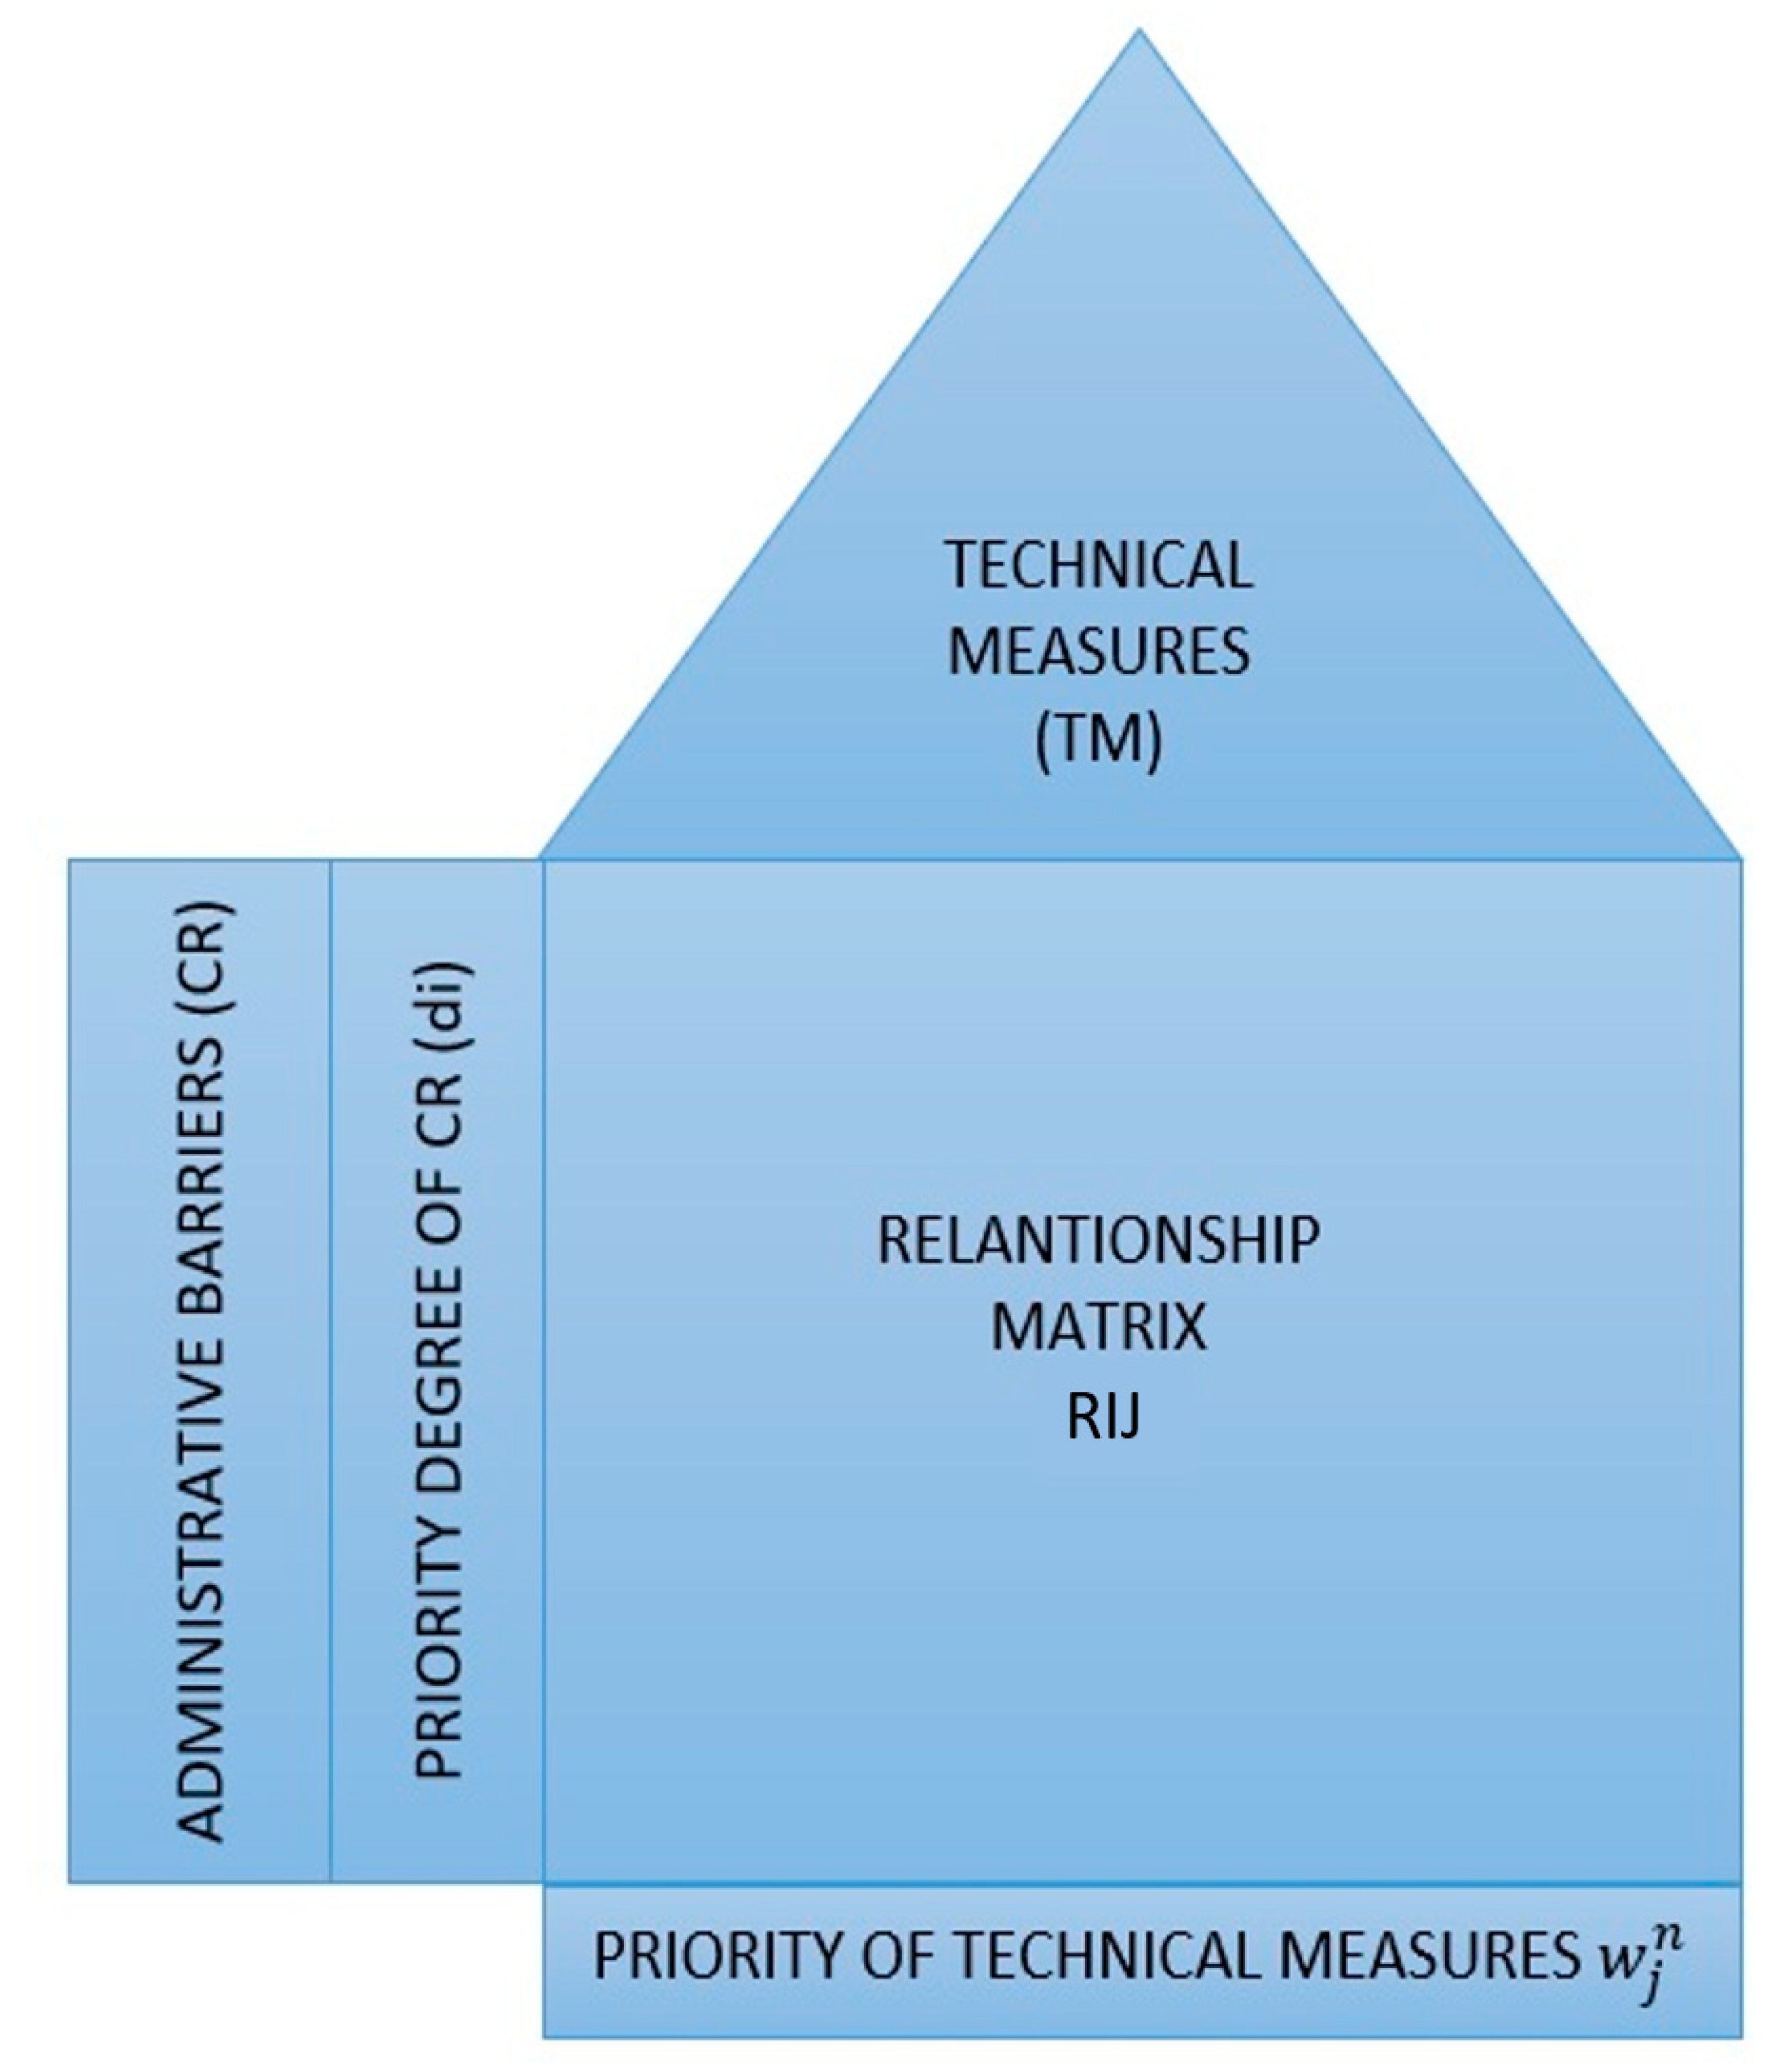
The primary tool developed in this method is the House of Quality. The “House of Quality” is obtained through the development of matrices that allow the identification of areas for improvement, their classification, and their weighting in a final matrix [16,19]. The quality house (HoQ) is the essential tool by this method [20]. The house consists of a matrix that links the input and output data [16]. This stage is the most important. Over time, this method has been applied and adapted in various products, tourism, medical services, electricity, and transportation.
The traditional HoQ matrix is composed of seven major parts, including shipowners’ requirements (CR), priority requirements, technical measures (TM), correlation matrix, relationship matrix (between TM and CR), the sum of products of priority degrees and degrees of relationship, and, finally, the degree of priority of TMs [21]. With the help of this graphic representation, the needs of the shipowners concerning the technical measures will be visible.
In practice, it is both difficult, and unnecessary to include all HOQ elements and build different HOQ models involving different elements. The simplest but most widely used HOQ model contains only customer needs and their relative importance, technical measures and the relationships between the two elements, and assessments of the importance of technical measures. Some authors add correlation matrices to this simple model [22]. Fewer models include technical competitive assessment because this information is challenging to treat. As such, the objectives and probability factors for technical measures are rare in HOQ studies—even if they are included, they are challenging to incorporate into the calculation of importance ratings, which does not refer to the competitive technical assessment.
To avoid inconsistencies and facilitate applications, we propose in this paper a unified HOQ model in 5 steps (Figure 1 House of Quality) after the model of Chan and Wu [23] contains the frequently used HOQ elements. The needs of customers, in our case shipowners, which are listed in the left column and are connected to the technical requirements, in our case to the action pillars, listed at the top, completing the section called the Rij relationship matrix [24]. Here, the weighted matrix of customer requirements is used to determine the weighted characteristics of the product.
The model applied by us have five steps presented in Figure 1 and detailed below:
(a)
The left side is represented by the voice of customers (CR), in our specific case by the administrative barriers identified by the shipowners, detailed in Section 3.1.
(b)
It is necessary to calculate a priority degree of shipowner’s needs (di), detailed in Section 3.2. By prioritizing them, we can find out that the most critical shipowners’ needs are not the most important regarding the technical measures taken.
(c)
The roof is represented by the Technical Measures (TM) and is detailed in Section 3.3.
(d)
Rij: This matrix is a systematic means of identifying the relationship level between CR and TM. Usually, these relationships are measured by the following scale (1), which places more weight on the solid relationship [25,26].
Without relationshipLow relationshipModerate relationshipStrong relationship
0159(1)
Either R or the matrix of the relationship between CR and TM, the element Rij indicates the level of impact of TM on CR satisfaction.
The correlation matrix allows the identification of conflicting design requirements, i.e., the rows or columns that remain blank indicate that there are no relationships between them. This means that shipowners’ requirements do not affect any performance indicator selected. That step is detailed in Section 3.4. The numerical process for assigning the priority degree of TMs is as follows:
  • Let m be the requirements of the shipowners indicated by CRi, (i = 1, 2, ..., m) and n technical measures indicated by TMi (i = 1, 2, ..., n).
  • Let di (i = 1, 2, ..., m) be the priority degree of i between the whole set of CR, while we (j = 1, 2, ..., n) which indicates the relative weight of the importance j TM, is determined by the relationship between CR and TM.
The sum of the product of the priority degree, di and Rij is calculated as follows:
w j = i = 1 m d i R i j J = 1 , 2 ,   ,   n
So, barriers identified by shipowners will be marked with CR. The priority level of a requirement is derived through the sum-product measures the relative weight of the European Commission in terms of performance and degree of relationship corresponding technical measures provided. The pillars of the European Commission’s action will be marked with TM (technical measures). A normalized value of the result will show the relative weight (the priority) technical measure to satisfy the need of the shipowner.
This method offers us an appropriate approach to prioritize the technical measures (TM). By developing this research method in this paper, we have the entire decision-making problem process and the possibility of prioritizing the best solution and even offering a set of recommendations by using a one-to-one relationship [27]. One of the most common issues in the decision-making process is the connectivity with the customers’ desires (CR). After we browse all the steps mentioned in Figure 1, the technical measures will be prioritized by their impact on the system. We will have an objective point of view that will give the action direction.

3. Results

3.1. Administrative Barriers Identified

Ensuring clear visibility throughout the supply chain is vital to ensure safe and appropriate timely delivery from end to end. Without it, organizations can become victims of countless inefficiencies, leading to delays, transport damage, or loss.
The purpose of the project Improving Administrative Procedures and Processes for IWT Danube (DANTE), founded by the Transnational Danube, was to identify and eliminate administrative barriers that prevent the development of inland waterway transport (IWT) its full potential. Through this project was developed a global online reporting of administrative barriers. According to IWT Administration Danube Strategy and Action Plan [28], developed within the mentioned project, the main variables that determine the delay of freight on the Danube are presented in Table 1. Furthermore, the identified barriers received an identification number for better recognition in Appendix A.

3.2. Prioritization of Administrative Barriers

First of all, we identified the main factors that determine the delays in freight transport. The shipowner’s requirements were the most important. The next step was to prioritize them by the multicriteria analysis method. This method is often used in transport problems [29]. After prioritizing the variables, the matrix analysis can be done.
Analytic hierarchy priority (AHP) is made using the online software provided by Business Performance Management Singapore, available at https://bpmsg.com (accessed on 10 May 2021). Klaus D. Goepel [30] implemented a free online AHP system with notable features, allowing detailed analysis of decision-making issues. The author intended to provide a complete and free software tool for education and research the calculations and algorithms are well documented, and all input data and results can be exported in an open format for further processing or presentation [30].
The resulting weights, presented in Appendix A (Normalized matrix) are based on the principal eigenvector of the decision matrix. A number of 190 comparisons were made, with the CR consistency ratio equal to 8.1%, which demonstrates the coherence of the judgment, which means that the AHP process was correctly performed and can be continued. The resulting weights for the criteria based on pairwise comparisons are presented in Table 2. It can be seen that the main barriers leading to traffic delays on the Danube are: lack of software applications, complex formalities at the RO-BG border, as well as inappropriate staff behavior, problems related primarily to the border police, taxes, and customs.

3.3. Technical Measures for Streamlining Freight Transport on the Danube

The Danube region can become a safe area where conflicts, marginalization, and crime are adequately addressed. According to European Commission directives, all citizens of this region should enjoy better prospects for higher education, employment, and prosperity in the areas where they live. The Danube Strategy should make this region, which truly belongs to the 21st century, safe and confident in its strengths and one of the most attractive in Europe [31]. The pillars of action proposed by the authority mentioned above are presented in Table 3, and in this research, technical measures are called, as they have the functional role of responding to the immediate needs of shipowners.

3.4. Relationship between Administrative Barriers and Technical Measure

The relationship matrix was built on the premise that there is a strong relationship between “Inappropriate staff behavior” and “Investing in people and skills,” as well as between “Difficult formalities at the RO-BG border” and “Strengthening institutional capacity and of cooperation, “respectively” Lack of software applications in the customs sector “and” Development of society, through research, education and information technology. “
At the same time, we considered that there is a moderate relationship between “Delayed transit in the area of Serbia” and “Restoration and maintenance of water quality,” as well as with “Strengthening cooperation to promote security and fight crime.” “Reduced relationship” was considered between “Communication with the police on public channels” and “Investing in people and skills,” as well as between “Problems of radio signal and speed” and “Restoring and maintaining water quality.” The relationships established can be seen in Appendix B (Relationship between administrative barriers in the navigation sector on the Danube and the action pillars proposed by the European Commission).

4. Summary and Discussion

Based on the correlation matrix and the prioritization performed on the needs of shipowners, the relative importance of the technical measures concerning the identified needs could be determined, applying Equation (2) exemplified above. This set of competitive priority ratings is presented in the last line of Appendix B. The relationship between administrative barriers in the Danube navigation sector and the action pillars proposed by the European Commission, presented in Figure 2, from which we note that “Improving mobility and intermodality” is the highest priority, followed by “Developing society through research, education and information technology” and “Investing in people and skills.
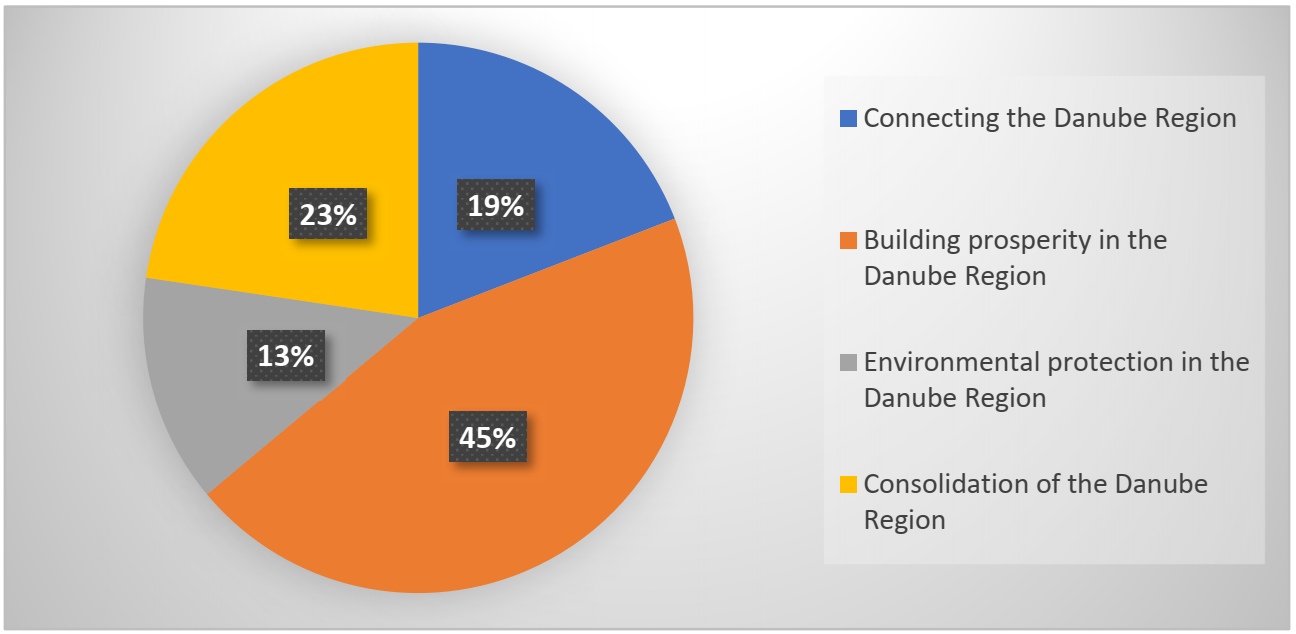
Of the four significant intervention directions in the Danube region, we can see in Figure 2 that the main direction is towards “Building prosperity in the Danube Region,” with a need intensity of 45%. According to the measures proposed by European Commission in “Action Plan- European Union Strategy for the Danube Region”, this direction of intervention refers primarily to:
  • Smart growth strengthens all three themes of this goal [32]: innovation by improving the framework conditions to turn ideas into marketable products or services; education by improving the human capital of the region; and the digital society by improving internet access and availability of electronic content.
  • Sustainable growth, as innovation and new technologies will help combat climate change, increase energy efficiency and reduce transport pollution. In addition, the priority area of business competitiveness will improve the business environment, especially for SMEs [32].
  • Inclusive growth strengthens human capital through education and training, and that issue will be complemented by a better functioning of the macro-regional labor market. It also emphasizes the fight against poverty, especially against marginalized communities [32].
The second most crucial direction of intervention in the Danube Region is represented by “Consolidation of Danube Region.” The main focus in that direction is to ensure the most substantial cooperation between institutions and increase security.
A harmonized administrative process will have a substantial contribution in optimizing the shipping time. Furthermore, in that direction, the European Authorities develop projects that fight against corruption. They consider that a well-governed and safer region is more attractive for people, and their standard of living will increase.
Through the research method applied, we have demonstrated that in shipowners’ opinion, the priority directions should be those who have a central focus on the investment in human capacity and their standard of life. If the water transport is stimulated, the ports and the cities from riparian states will also be developed like commercial hubs. Part of the advantages will be:
  • The framework conditions will be improved by innovation, the products and services will be developed in order to be merchandized;
  • The education of the human capital will be improved by accessing new technologies and new markets;
  • Sustainable growth will occur because the businesses will be more competitive and will improve their business environment.
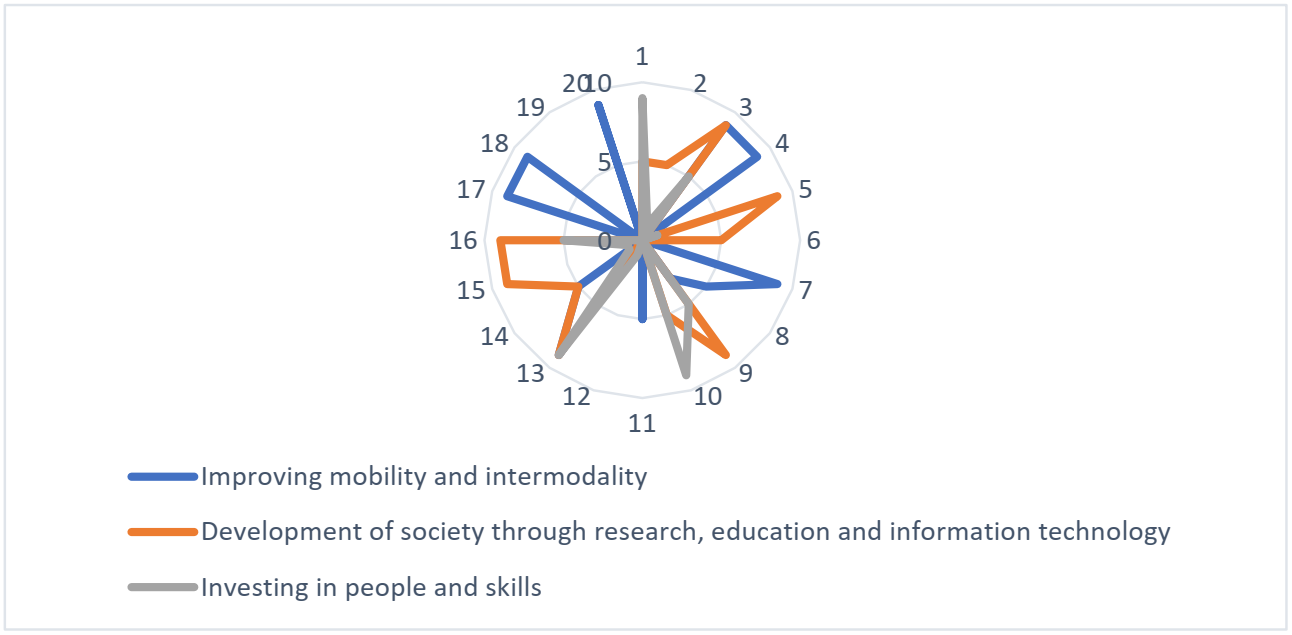
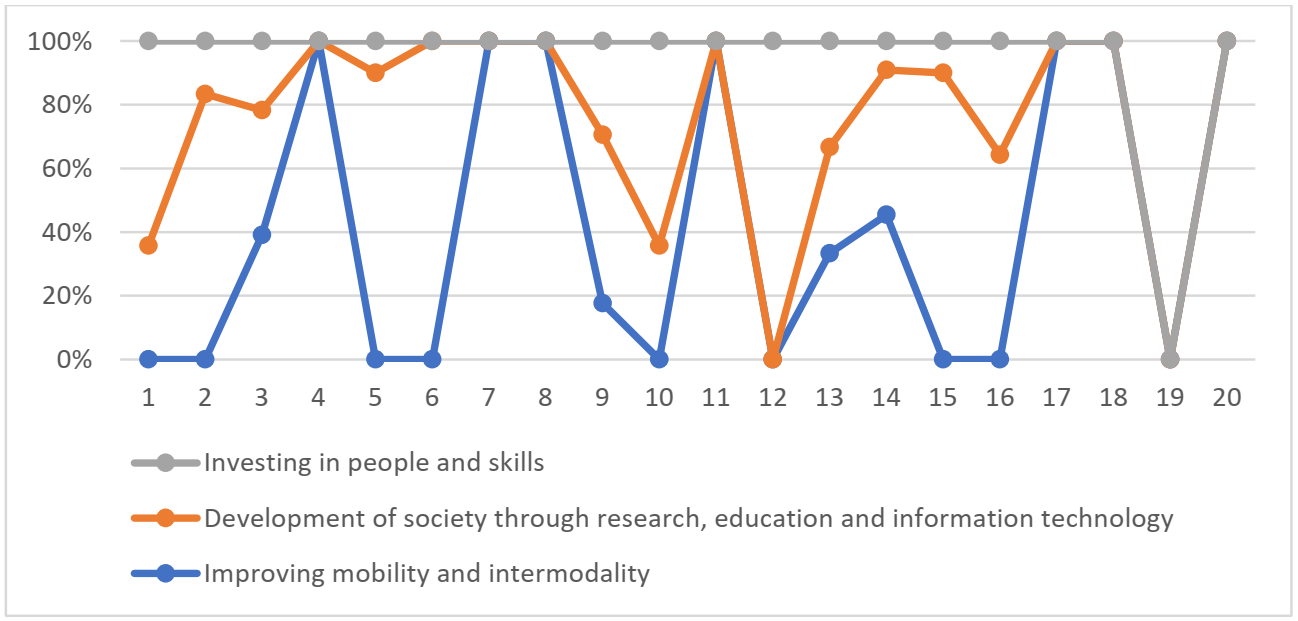
Based on the applied method results, we think it is essential to show through diagrams the relationship based on the influence degree between the shipowner’s needs and the authority position. For this, we used two excel tools, a spider chart (Figure 3) and a histogram chart (Figure 4). We will analyze the first three measures according to their relationship resulting from Appendix B, with the barriers identified by shipowners. For shipowner’s needs, we maintain the same numeration as in Table 1.
From Figure 3, we can see the linear relationship between the 3 measures, so there are no significant differences between them, their degree of priority being similar. In contrast, from Figure 4, we can see that human resources have the most outstanding contribution in reducing existing barriers. The main direction of the action “Building Prosperity in the Danube Region” is given by investing in people’s skills, improving access to information technology, and raising living standards. Several research projects have shown that organizational performance is greatly improved by paying special attention and giving human resources clear work directions.
QFD results lead to preventive action or corrective actions depending on whether efforts to improve were to address quality problems or improve a product or process. In case this method has helped to prioritize variables depending on the degree of relationship with technical measures. The tools used have shown that the main factor that all technical measures have in common and that could significantly optimize travel time is human resources. Certain but also uncertain factors are taken into account in the planning of river transport. Usually, uncertainty is given by weather conditions, but through this study, we have shown that human resources represent an equally important factor.

5. Conclusions

In this paper, we have prioritized the main measures to be taken in order to take advantage of the opportunities offered by the Danube River at the international level. These are in line with the directions set out in the “White Paper Roadmap to a Single European Transport Area—Towards a competitive and resource-efficient transport system.”
The proposed approach uses the QFD methodology to identify and prioritize areas for improvement. HOQ links the areas for improvement to the technical barriers mentioned. The disclosure of these connections helps identify and prioritize the technical features that will generate the most significant improvement impacts.
Congestion, in the case of this type of transport, takes place in ports. If the operations were more efficient in the transit and transshipment points, the planned time and the time traveled would be the same or the diminished delays.
The main actors involved in the import–export process on inland waterways are shipowners. Their main objective is to be more efficient considering the travel time and the quality of the goods. That requirement comes to them from the customers.
Through the applied research method, we met their main requirements, with the technical measures provided by the European Commission, and thus a prioritization could be performed. The tools used have shown that the main factor that all technical measures have in common and that could significantly optimize travel time is human resources. Certain but also uncertain factors are taken into account in the planning of river transport. Usually, uncertainty is given by weather conditions, but through this study, we have shown that also an important factor is human resources. The goals established can be achieved through programs developed by well-trained and dedicated people. Human resources constitute an essential factor in improving the value chain process. It has been observed a necessity to strengthen collaboration through academic entities and shipping companies, and authorities. It could be necessary to develop specialized training pieces and ensure a technological transfer from academia to the workplace. The communication between those entities can be done bidirectional, and the curricula improvement should be made in partnership.
Another critical point observed in the study conducted in this paper is done by information technology. Digitalization of the process, considering the border, fiscal, loading, unloading formalities, will optimize the time spent by a ship in a port. That factor is essential to connect with the curricula developed to train people with advanced digital skills.
One of the most urgent demands of the shipowners is to harmonize the legislation in all Danube countries though the principle if we cross the same river is essential to have the same rules in all riparian countries. It is mandatory to have more transparent and efficient border control procedures, which could be achieved through digitalization. The new direction should be well-trained people in digitalized ports.

Author Contributions

Conceptualization, A.L.M.T. and L.M.M.; methodology, A.L.M.T.; validation, A.L.M.T., L.M.M. and E.V.C.R.; formal analysis, A.L.M.T.; investigation, A.L.M.T.; resources, A.L.M.T. and E.V.C.R.; data curation, A.L.M.T.; writing—original draft preparation, A.L.M.T.; review and editing, L.M.M. and E.V.C.R.; visualization, A.L.M.T.; supervision, L.M.M. and E.V.C.R.; funding acquisition, E.V.C.R. All authors have read and agreed to the published version of the manuscript.

Funding

This work was carried out in the framework of the research project DREAM (Dynamics of the Resources and technological Advance in harvesting Marine renewable energy), supported by the Romanian Executive Agency for Higher Education, Research, Development, and Innovation Funding—UEFISCDI, grant number PN-III-P4-ID-PCE-2020-0008.

Data Availability Statement

The data that support the findings of this study are available in the public domain.

Acknowledgments

This work was carried out in the framework of the Project ANTREPRENORDOC, in the framework of Human Resources Development Operational Programme 2014- 2020, financed from the European Social Fund under the contract number 36355/23.05.2019 HRD OP/380/6/13—SMIS code: 123847. The results of this work have been presented to the 9th edition of the Scientific Conference organized by the Doctoral Schools of “Dunărea de Jos” University of Galati (http://www.cssd-udjg.ugal.ro/ accessed on 5 September 2021), that was held on 10–11 June 2021 in Galati, Romania.

Conflicts of Interest

The authors declare no conflict of interest.

Appendix A

Table A1. Normalized Matrix.
1234567891011121314151617181920
111127333314 333533337
211114333553344444353
311127933755555553343
40.510.517711441142331433
50.140.250.140.14110.20.20.3310.20.330.330.50.330.330.1410.51
60.330.330.110.14110.330.170.330.330.330.140.330.3310.330.14111
70.330.330.3315311244133751324
80.330.330.3315611113143331534
90.330.20.140.25330.51111113131333
1010.20.20.25130.251114144441333
110.250.330.21530.250.3310.251133331414
120.330.330.213711111155551313
130.330.250.20.25330.330.2510.250.330.211110.33313
140.330.250.20.5230.330.330.330.250.330.211331413
150.20.250.20.33310.140.3310.250.330.210.33131111
160.330.250.20.33330.20.330.330.250.330.210.330.3311313
170.330.250.3317711111131111615
180.330.330.330.25110.330.20.330.330.250.330.330.2510.330.1710.332
190.330.20.250.33210.50.330.330.331111111313
200.140.330.330.33110.250.250.330.330.250.330.330.3310.330.20.50.331

Appendix B

Table A2. Relationship between Administrative Barriers in the Navigation Sector on the Danube and the Action Pillars Proposed by the European Commission.
Connecting the Danube RegionBuilding Prosperity in the Danube RegionEnvironmental Protection in the Danube RegionConsolidation of the Danube Region
Priority grade (AHP) Improving mobility and intermodalityDevelopment of society through research, education and information technologySupporting the competitiveness of enterprises, including cluster developmentInvesting in people and skillsRestoring and maintaining water qualityEnvironmental risk managementPreserving biodiversity, landscapes, reducing pollutionStrengthening institutional capacity and cooperationStrengthen cooperation to promote security and fight crime
42.810.3Border police, taxes and customsMisconduct of staff;055900011
11.4Difficult formalities at the RO-BG border;055100095
13.7Lack of software applications in the customs sector;995500010
7.4Delayed transit in the Serbian area900050055
16.31.4Navigation/traffic control authoritiesCommunication with the police on public channels;095100050
1.5Radio signal and speed issues;055010500
7.3Temporary canal closures;900051100
6.1Lack of maintenance work-depth;500095130
204.1Port authorities/administrationsLarge number of documents requested in RO;390500050
5.6Non-professional staff (RO; BG; RS);050900030
4.4Additional taxes in RO;509000030
5.9Theft/Smuggling in RO/RS;000100059
10.12.5Unknown authority / multiple authorities involvedForms with the same content in each country;995900030
3Additional border controls with BG;551100095
2.32017—a number of 7 additional documents;095100030
2.3Uploading data to BULRIS —additional delay;095500050
115Waterway and canal managementLow water level reported in HU;900095100
1.7Radar signals from HU buoys;900055510
2.8High taxes through the Danube-Black Sea Canal;009000030
1.5Lack of coordination between RO-RS dispatchers;900090050
Relationship CR-TM4.3173.9572.72493.43391.9690.7130.3443.3941.724

References

  1. Bendkowski, J.M.; Bendkowski, J.M. Development of Freight Transport in the European Union—Selected Issues; Silesian University of Technology Publishing House: Gliwice, Poland, 2020; pp. 23–45. [Google Scholar]
  2. European Commission. White Paper—Roadmap to a Single European Transport Area—Towards a Competitive and Resource Efficient Transport System; Publications Office of the European Union: Brussels, Belgium, 2011. [Google Scholar]
  3. Syndicate of Water Quality Insurance. Top Risks Facing the Cargo Shipping Industry. 2020. Available online: https://www.wqis.com/top-risks-facing-the-cargo-shipping-industry/ (accessed on 25 October 2021).
  4. Miloslavskaya, S.; Panychev, A.; Myskina, A.; Kurenkov, P. Intermodal transportation using inland water transport in Russia and abroad. In IOP Conference Series: Materials Science and Engineering; IOP Publishing: Bristol, UK, 2019. [Google Scholar]
  5. Laude, A. For the European Parliament, Sustainable Transport Goes through Inland Waterways (2021). September 2021. Available online: https://www.reneweuropegroup.eu/news/2021-09-14/pour-le-parlement-europeen-le-transport-durable-passe-par-les-voies-navigables-interieures (accessed on 25 October 2021).
  6. Scholten, A.; Rothstein, B. Navigation on the Danube—Limitations by Low Water Levels and Their Impacts; Publications Office of the European Union: Luxembourg, 2017. [Google Scholar]
  7. Backalic, T.; Maslaric, M. Navigation Conditions and the Risk Management in Inland Waterway Transport on the Middle Danube. Transp. Probl. 2012, 7, 13–24. [Google Scholar]
  8. Dávid, A.; Madudová, E. The Danube river and its importance on the Danube countries in cargo transport. In Proceedings of the 13th International Scientific Conference on Sustainable, Modern and Safe Transport, Žilina, Slovakia, 29–31 May 2019; Transportation Research Procedia: Amsterdam, The Netherlands, 2019; pp. 1010–1016. [Google Scholar]
  9. Vdovenko, T. Principles of Legal Regulation of Navigation on International Rivers in Europe. Problems and Solutions (on the Example of the Danube and Rhine Rivers). J. Danub. Stud. Res. 2020, 2, 206–216. [Google Scholar]
  10. ISO. International Standard (ISO-16355-1). Application of Statistical and Related Methods to New Technology and Product Development Process—General Principles and Perspectives of Quality Function Deployment (QFD); ISO Copyright Office: Geneva, Switzerland, 2015. [Google Scholar]
  11. Sener, Z.; Ozturk, E. A QFD-Based Decision Model for Ship Selection in Maritime Transportation. Int. J. Innov. Manag. Technol. 2015, 6, 202–205. [Google Scholar] [CrossRef] [Green Version]
  12. Celik, M.; Cebi, S.; Kahraman, C.; Er, I.D. An integrated fuzzy QFD model proposal on routing of shipping investment decisions in crude oil tanker market. Expert Syst. Appl. 2009, 36, 6227–6235. [Google Scholar] [CrossRef]
  13. LeeLam, J.S. Designing a sustainable maritime supply chain: A hybrid QFD-ANP approach. Transp. Res. Part E Logist. Transp. Rev. 2015, 78, 70–81. [Google Scholar] [CrossRef]
  14. Plazibat, V.; Krčum, M.; Skračić, T. Tools of Quality in Determining the Characteristics of Services in Maritime Passenger Transport. Naše More 2015, 62, 53–58. [Google Scholar] [CrossRef]
  15. Chan, L.K.; Wu, M.L. Prioritizing the Technical Measures in Quality Function Deployment. Qual. Eng. 1998, 10, 467–479. [Google Scholar] [CrossRef]
  16. Shabestari, S.S. Enhanced integrated sensitivity analysis in model-based OFD method. In Proceedings of the 21st International Conference on Engineering Design (ICED17), Vancouver, BC, Canada, 21–25 August 2017; pp. 317–326. [Google Scholar]
  17. Zhang, F.E. Using integrated quality function deployment and theory of creative problem-solving approach for ergonomic product design. Comput. Ind. Eng. 2014, 76, 60–74. [Google Scholar] [CrossRef]
  18. Mohamad, S.M. Improvement of Take-Away Water Cup Design by Using Concurrent Engineering Approach; University Malaysia Pahang: Gambang, Malaysia, 2012. [Google Scholar]
  19. Chan, L.K.; Wu, M.L. A systematic approach to quality function deployment with a complete illustrative example. Int. J. Manag. Sci. 2015, 33, 119–139. [Google Scholar]
  20. Duru, O.; Bulut, E.; Huang, S.; Yoshida, S. Shipping performance assessment and the role of key performance indicators (KPIs): “Quality Function Deployment” for transforming shipowner's expectation. In Proceedings of the Conference of International Association of Maritime Economists, Taipei, Taiwan, 15–18 July 2013; pp. 1–18. [Google Scholar]
  21. Tsamboulas, D.; Yiotis, G.S.; Panou, K.D. The use of multicriteria methods for the assessment of transport infrastructure projects: A comparative analysis. J. Transp. Eng. Am. Soc. Civ. Eng. 1999, 125, 407–414. [Google Scholar]
  22. Quality Function Deployment. Available online: https://www.productplan.com/glossary/quality-function-deployment/ (accessed on 2 September 2021).
  23. Hauser, J.R.; Clausing, D. The House of Quality. Harvard Business Review. 1988. Available online: https://hbr.org/1988/05/the-house-of-quality (accessed on 14 December 2021).
  24. Sharma, J. A cross-disciplinary approach to product development and design through quality function deployment, target costing and value engineering. Int. J. Product. Qual. Manag. 2012, 9, 309–331. [Google Scholar] [CrossRef]
  25. Erdil, N.O.; Arani, O.M. Quality Function Deployment: More than a Design Tool. Int. J. Qual. Serv. Sci. 2018, 11, 142–166. [Google Scholar] [CrossRef]
  26. Raharjo, H. On normalizing the relationship matrix in quality function deployment. Int. J. Qual. Reliab. Manag. 2013, 30, 647–661, ISSN: 0265-671X. [Google Scholar] [CrossRef]
  27. Wu, H. Applying grey model to prioritise technical measures in quality function deployment. Int. J. Adv. Manuf. Technol. 2005, 29, 1278–1283. [Google Scholar] [CrossRef]
  28. Danube IWT Administration Strategy & Action Plan. 2019. Available online: http://www.interreg-danube.eu/uploads/media/approved_project_output/0001/34/f39c91f7e4e7666bbba9f8e064bdbf97df1c1954.pdf (accessed on 29 July 2021).
  29. Brunelli, M. Introduction to the Analytic Hierarchy Process; Springer: Helsinki, Finland, 2015. [Google Scholar]
  30. Goepel, K.D. Implementation of an Online Software Tool for the Analytic Hierarchy Process (AHP-OS). In Proceedings of the International Symposium on the Analytic Hierarchy Process, Hong Kong, China, 13–15 July 2018. [Google Scholar]
  31. Communication from the Commission to the European Parliament, the Council, the European Economic and Social Committee and the Committee of the Regions. European Union Strategy for the Danube Region; Communication from the Commission to the European Parliament, the Council, the European Economic and Social Committee and the Committee of the Regions: Bruxelles, Belgium, 2010; Available online: https://ec.europa.eu/regional_policy/sources/docoffic/official/communic/danube/com2010_715_danube_ro.pdf (accessed on 29 July 2021).
  32. European Commission. Action Plan—European Union Strategy for the Danube Region; European Commission: Brussels, Belgium, 2010. [Google Scholar]
Figure 1. House of Quality.
Inventions 06 00097 g001
Figure 2. Major directions of intervention in the Danube region.
Inventions 06 00097 g002
Figure 3. The relationship between technical measures taken by the European Commission.
Inventions 06 00097 g003
Figure 4. Contribution measures taken by the European Commission to remove barriers identified by shipowners.
Inventions 06 00097 g004
Table 1. Presentation of the main administrative barriers and competent authorities.
Responsible AuthorityBarrier IdentifiedIdentification Number in Appendix A
Border police, taxes and customsMisconduct of staff;1
Difficult formalities at the RO-BG border;2
Lack of software applications in the customs sector;3
Delayed transit in the Serbian area4
Navigation/traffic control authoritiesCommunication with the police on public channels;5
Radio signal and speed issues;6
Temporary canal closures;7
Lack of maintenance work-depth;8
Port authorities/administrationsLarge number of documents requested in RO;9
Non-professional staff (RO; BG; RS);10
Additional taxes in RO;11
Theft/Smuggling in RO/RS;12
Unknown authority / multiple authorities involvedForms with the same content in each country;13
Additional border controls with BG;14
2017, 7 additional documents;15
Uploading data to BULRIS—additional delay;16
Waterway and canal managementLow water level reported in HU;17
Radar signals from HU buoys;18
High taxes through the Danube–Black Sea Canal;19
Lack of coordination between RO-RS dispatchers;20
Source: Danube IWT Administration Strategy & Action Plan, 2019.
Table 2. Priority ranking of the variables.
CategoryPriorityRank
Inappropriate staff behavior10.3%3
Difficult formalities at the RO-BG border11.4%2
Lack of software applications in the customs sector13.7%1
Delayed transit in the Serbian area7.4%4
Communication with the police on public channels1.4%20
Radio signal and speed problems1.5%19
Temporary channel closures7.3%5
Lack of maintenance work-depth6.1%6
Large number of documents requested in RO4.1%11
Non-professional staff (RO; BG; RS)5.6%8
Additional taxes in RO4.4%10
Theft/Smuggling in RO/RS5.9%7
Forms with the same content in each country2.5%14
Additional border controls with BG3.0%12
2017, 7 additional documents2.3%16
Loading data in BULRIS—additional delays2.3%15
Low water level reported in HU5.0%9
Radar signals from HU buoys1.7%17
High taxes through the Danube-Black Sea Canal2.8%13
Lack of coordination between RO-RS dispatchers1.5%18
Table 3. Technical measures taken by the European Commission to streamline freight traffic on the Danube.
Main ObjectiveProposed Measure
Connecting the Danube RegionImproving mobility and intermodality
Building prosperity in the Danube RegionDevelopment of society through research, education and information technology
Supporting the competitiveness of enterprises, including cluster development
Investing in people and skills
Environmental protection in the Danube RegionRestoring and maintaining water quality
Environmental risk management
Preserving biodiversity, landscapes, reducing pollution
Consolidation of the Danube RegionStrengthening institutional capacity and cooperation
Strengthen cooperation to promote security and fight crime
Source: European Union Strategy for the Danube Region.
Publisher’s Note: MDPI stays neutral with regard to jurisdictional claims in published maps and institutional affiliations.

