Article

Study of Resistance to Disturbances of the Main Types of Communication Systems on Board Military Ships Used during Interception or Search and Rescue Missions

1
Doctoral School of Fundamental Sciences and Engineering, ‘Dunarea de Jos’ University of Galati, 800008 Galați, Romania
2
Department of Military Electronic Systems and Equipment, ‘Ferdinand I’ Military Technical Academy, 050141 Bucharest, Romania
*
Author to whom correspondence should be addressed.
Inventions 2021, 6(4), 72; https://doi.org/10.3390/inventions6040072
Submission received: 7 September 2021 / Revised: 21 October 2021 / Accepted: 22 October 2021 / Published: 27 October 2021

Abstract

:
In addition to combat missions, military ships often participate in search-and-rescue missions or interception of ships with refugees or migrants. The communication systems and modes of work that may be used during these missions will be in accordance with the International Convention for the Safety of Life at Sea (SOLAS). This paper aims to demonstrate by theoretical methods (analytical and numerical) the noise stability of communication systems using analog modulation in high-noise conditions, characteristic of the marine environment. The stability of analog systems employing amplitude (AM), frequency (FM), and phase (PM) modulations is investigated. The analyzed systems are currently under use in distress maritime communications.

1. Introduction

Radio communications technology was first used in maritime rescue operations in 1899 and since then, tens of thousands of lives have been saved [1]. Organizational deficiencies in the field of saving lives at sea were brought to light by the tragedy of the Titanic on April 15/16, 1912. The special media impact of this disaster led to the appearance of the first version of the SOLAS (International Convention for the Safety of Life at Sea) in 1914 [2]. The need for interstate cooperation for the adoption of common rules in the naval field led to the adoption, at the ONU conference in Geneva in 1948, of the convention for the establishment of the Inter-Governmental Maritime Consultative Organization—IMCO, a name that was changed to IMO in 1982. One of the first tasks of the IMO was to adopt a new version of SOLAS (in 1960), which thus became the most important international treaty dealing with maritime safety [3].
The current SOLAS convention contains, in 14 chapters, standards considered minimum and mandatory for the construction and operation of ships and equipment from the point of view of maritime safety. Chapter IV—Radiocommunications—incorporates the Global Maritime Distress and Safety System (GMDSS) which addresses all passenger ships and all cargo ships with a gross tonnage of over 300 tons sailing in international waters. The equipment, standards, procedures/protocols, and communication frequencies provided herein are designed to increase the chances of rescue in the event of a maritime accident. They were developed through cooperation between the IMO and the International Telecommunication Union (ITU) [4].
Chapter V—Safety of navigation—provides provisions of an operational nature that are applicable to all ships on all types of voyage and provides for the obligation of all ship-masters to provide assistance to those in difficulty. Additionally, in this chapter there are established the obligatory navigation safety services that must be provided by the governments of the signatory states as well as their obligation to ensure that all ships are efficiently and sufficiently equipped from the point of view of maritime safety [2,5].
A critical aspect of maritime safety is ensuring adequate radio communications in distress situations, in the conditions of an overcrowded electromagnetic spectrum and a noisy propagation environment. One proposed solution is the joint use of the communication and radar spectrum of various services [6]. Another solution signals the necessity of modernizing the current GMDSS system, by turning from analog to digital communications, and from voce to data transmissions [7]. This idea is supported by the development of several maritime safety systems, such as: AIS (Automatic Information System), DSC (Digital Selective Calling), or VDE (VHF Data Exchange) [7]. Other solutions rely on the use of artificial intelligence for increasing the quality of maritime communications [8]. However, in the era of digital communications, maritime distress transmissions still use analog communications, due to the paramount importance of ensuring an efficient communication framework in such situations—voice communications still remain critical in organizing SAR (search-and-rescue) operations.
Also, another critical aspect supports preserving the use of analog systems in distress communications, and this is related to the vulnerability to cyberattacks. One of the strongest cyberattacks was NotPetya and took place in 2017. It caused a total loss of USD 10 billion, of which USD 300 million was the losses of the shipping company Maersk, which also lost most of its data. However, in a maritime cyber security survey conducted in 2020 by Safety at Sea and BIMCO Maritime Cyber Security, only 42% of respondents said their organizations had taken measures to protect ships from cyber threats. Moreover, with the onset of the COVID 19 pandemic, the number of cyberattacks increased by 400% [9]. Thus, although the trend in maritime communications is to modernize the infrastructure to allow the interconnection of ships and shore facilities through broadband communications, “VHF voice digitalization, currently under studies, is one more expectation.” [4].
Recent years have witnessed a dramatic increase in traffic and maritime activities, which has inevitably led to an increase in accidents and distress situations [8,10]. Another consequence of this phenomenon is the exponential increase of both functional and non-functional noise sources, implicitly of the increasing agglomeration of the frequency spectrum. Given the particular importance of the providing adequate transmission of distress calls, distress messages, and distress traffic, the question is whether the emission classes currently used are sufficiently resistant to disturbances or whether other technical solutions, including the transition to digital communications, must be adopted. This information is particularly useful because a possible change must be adopted at the same time by all states signing the SOLAS convention, for both civilian and military ships, which are among the first ones to intervene in distress situations. In addition, for these ships, the bureaucratic circuit of endowment/modification programs is particularly long and difficult. An optimal planning of the use of electromagnetic spectrum in military naval operations, requires the knowledge of emission classes and frequencies used in search-and-rescue communications to eliminate the risk of disrupting these communications both by common channel, adjacent channel, or secondary reception channel disturbances.
This paper aims to demonstrate by theoretical methods (analytical and numerical) the effectiveness of using analog systems in high-noise conditions—with a low signal-to-noise ratio (SNR), characteristic of the marine environment. The stability of analog systems employing amplitude (AM), frequency (FM), and phase (PM) modulations is investigated. The analyzed systems are currently under use in distress maritime communications. The paper is thus structured: Part 2 provides some technical details on how maritime communications are organized and regulated at international level; Part 3 is the main one and it performs a thorough analysis from the perspective of interference stability, on the behavior of analog modulation systems similar to those implemented in the communication systems on board ships and used in SAR operations. Part 4 verifies the theoretical results by simulating the analog systems in the Matlab-Simulink environment. Part 5 comprises the results discussion and Part 6 provides the paper conclusions.

2. Materials and Methods

2.1 Technical—Organizational Details

Technical details regarding working frequencies, bandwidths, gap between channels, etc. are established by the radio regulations issued by the ITU. These regulations are updated/revised every 3–4 years at World Radiocommunication Conferences (WRCs), and their impact extends over long periods of time, between 10 and 20 years after the conference [10]. The GMDSS concept from Chapter IV of the SOLAS convention stipulates the obligation to provide ships with different communications equipment depending on the 4 maritime areas in which they can sail. These areas are defined according to the radio coverage and illustrated in Figure 1a:
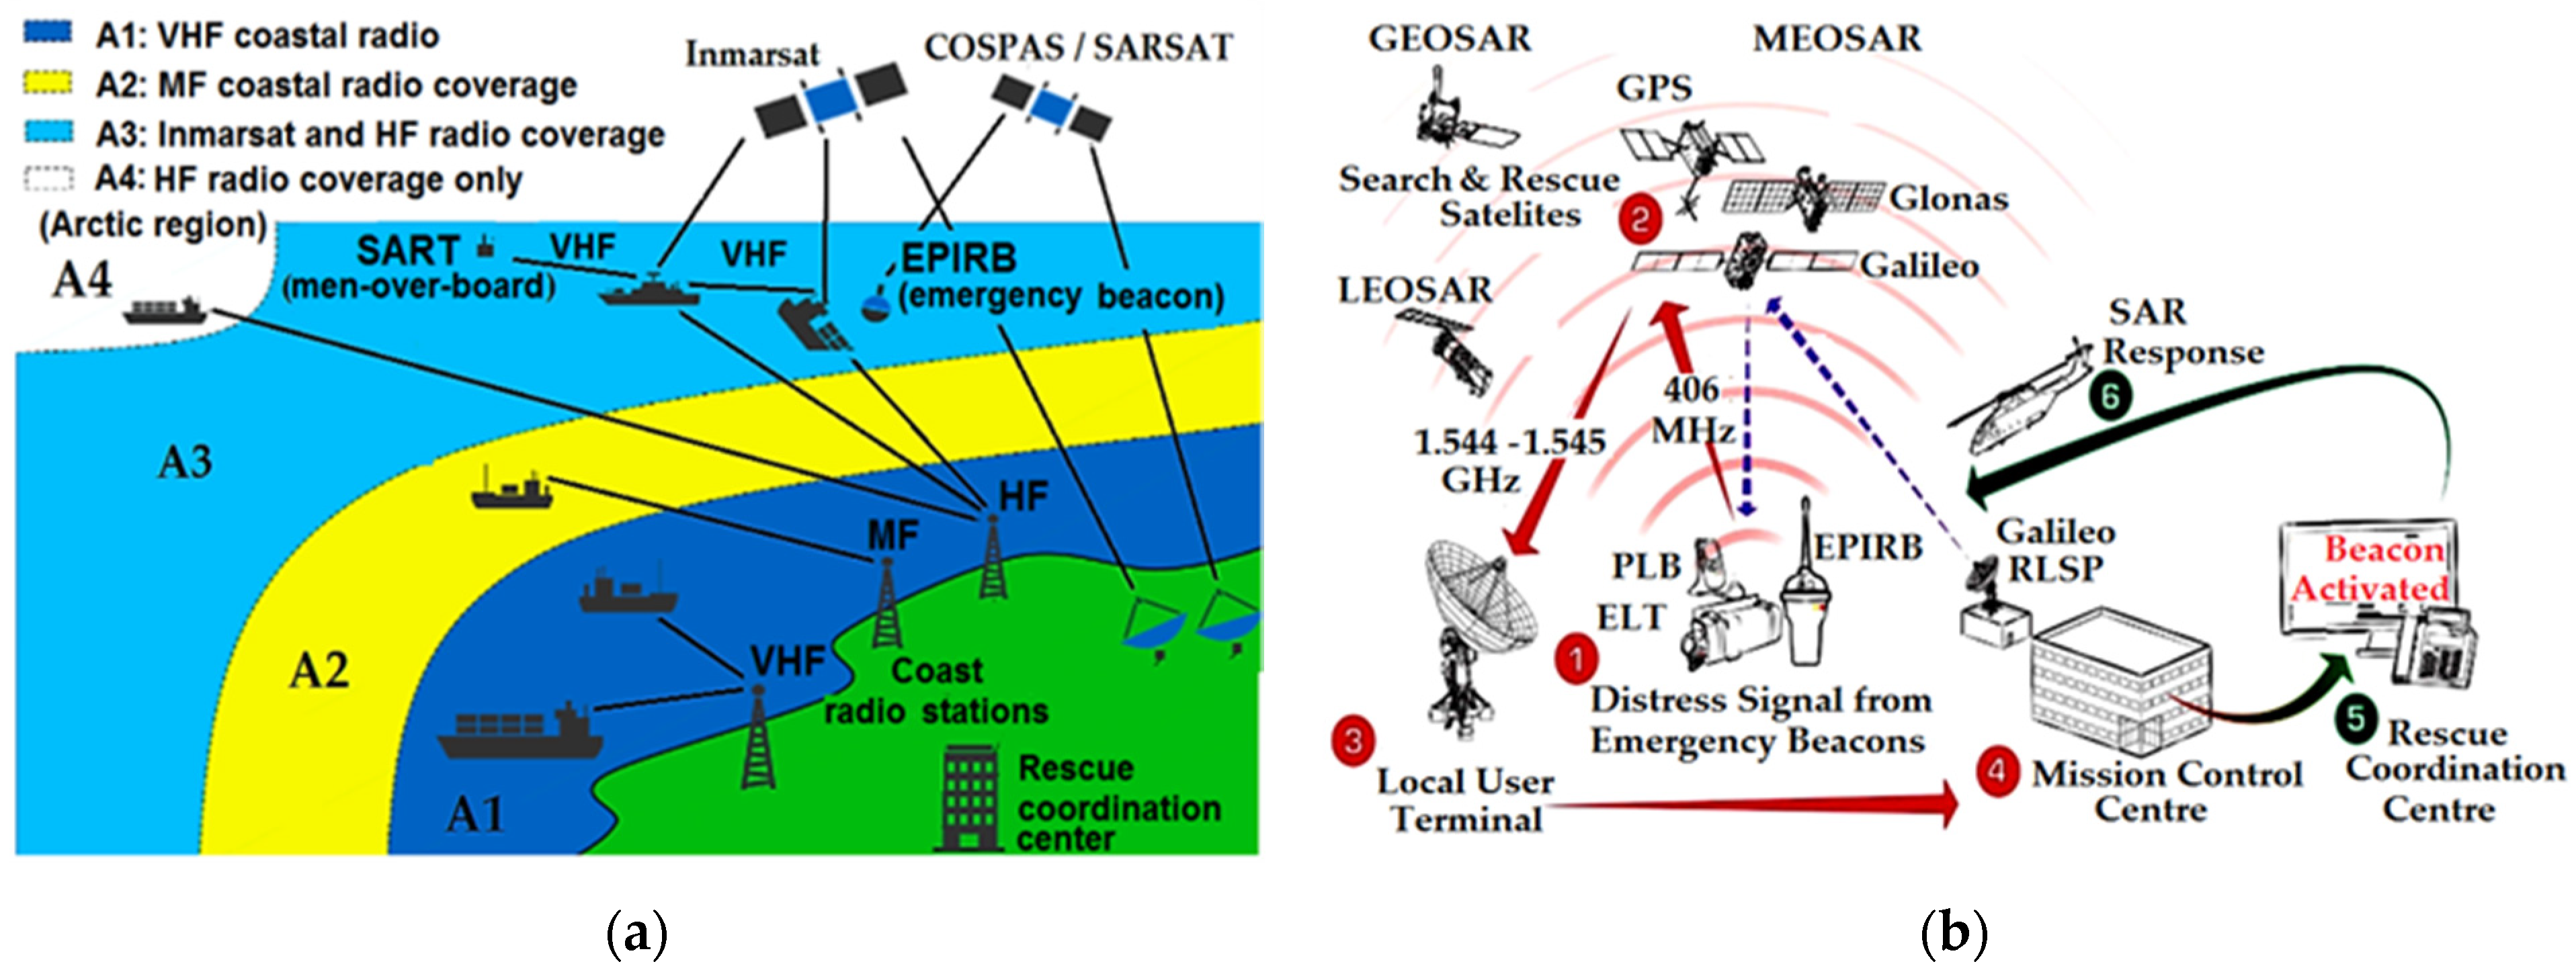
  • Sea area A1 is defined as the area covered by VHF radio enabling Digital Selective Calling (DSC) and Radio Telephone (RT)—up to 20–30 nautical miles from shore;
  • Sea area A2—covered by MF radio, also enabling DSC and RT—up to about 150 nautical miles from shore;
  • Sea area A3 is covered by HF radio and Inmarsat geostationary satellite enabling DSC and satellite communications—global area between 70° N and 70° S;
  • Sea area A4 is comprising polar regions above 70° N and below 70° S and is covered by radio communications in the HF radio range with DSC.
In [11,12,13] there are presented the frequencies, structure, and destination of the radio channels allocated for the maritime mobile service in the MF, HF and VHF maritime bands as well as the changes that came into force starting with 1 January 2017. Thus, distress calls, distress messages, and distress traffic have absolute priority over all other types of messages/communications. Emergency communications, safety communications, and other communications follow. Moreover, all ships are required to be able to transmit distress alerts by at least two independent methods.
Figure 1. (a) Area of the Global Maritime Distress and Safety System (GMDSS) [14]. (b) The concept of the Global Satellite System for Search and Rescue [15].
Inventions 06 00072 g001
Vessels equipped with DSC systems will transmit distress alerts through this system on one of the following frequencies in the MF/HF ranges: 2187.5 kHz, 4207.5 kHz, 6312 kHz, 8414.5 kHz, 12,577 kHz, 16,804, 5 kHz using F1B emission class (frequency modulation with digital information, without a sub-carrier for automatic reception) with a bandwidth of 300 Hz or in VHF on the frequency 156.525 MHz using G2B emission class with a bandwidth of 16 KHz. The ETSI EN 300 338-1 V1.4.2 (2017-11) standard stipulates that the integrated equipment used for communications in the MF/HF range must also be able to operate in J2B mode (“Single Side Band SSB with digital information, with the use of a modulating sub-carrier, with the carrier suppressed to at least 40 dB below peak envelope power”) [16].
According to Recommendation ITU-R M.489-2 (WRC-07), for ships not equipped with DSC systems, distress alerts will be transmitted on one of 4125 kHz; 6215 kHz; 8291 kHz; 12,290 kHz; 16,420 kHz using a J3E (single-sideband radiotelephony) emission class with a bandwidth of 3 kHz or 165.8 MHz using a G3E emission class with a bandwidth of 16 kHz [13].
Additionally, for the transmission of distress and safety messages through narrow-band direct-printing telegraphy (NBDP) are allocated the frequencies 4177.5 kHz, 6268 kHz, 8376.5 kHz, 12,520 kHz and 16,695 kHz, specifying that the transmission speed is not must exceed 100 Baud for FSK and 200 Baud for PSK. The bandwidth occupied for NBDP communications is 304 Hz.
DSC equipment must comply with the standards IEC 61097-3, IEC 61097-8, IEC 62238, EN 300 338, EN 301 025, EN 301 033 and maritime radiocommunication equipment and systems must comply with IEC 60,533 (Electrical and electronic installations in ships—Electromagnetic compatibility), IEC 60945, IEC 61097-7, IEC 61162, ETS 300 162, ETS 300 225 [17].
A special category of signals transmitted by radio waves are location signals. These signals are issued for the location of ships in distress, lifeboats, or survivors. In this regard there are: Emergency Position Indicating Radio Beacons (EPIRB), Emergency Locator Transmitters (ELT), Personal Locator Beacons (PLB), and Maritime Survivor Locator Devices (MSLD). Common frequencies assigned to these devices are:
  • 121.5 MHz and 243 MHz with the use of emission class A3X (amplitude modulated with full carrier and both sidebands) with a modulation factor between 85 and 100%, not allowing overmodulation and N0N. The carrier must be identifiable separately from the 2 sidebands and the level of its carrier must be at least 30% above the sidebands. During the A3X broadcast, depending on the mode of variation of the audio signals that modulate the carrier, a distinction can be made between EPIRB, ELT, PLB or MSLD [18];
  • 406.025 MHz using G1B emission class (phase modulation using ± 1.1 + 0.1 radians peak, referenced to an unmodulated carrier) for satellite emergency position indicating radio beacons [19];
  • 156.525 MHz for EPIRBs operating on VHF Channel 70 (G2B).
Communications performed during search-and-rescue (SAR) operations are called “on scene communication” [20]. The frequencies used for these communications are 2182 kHz (J3E) and 158.6 MHz (G3E). In communications with SAR aircraft, in addition to the frequencies listed above, the following may be used: 3023 kHz, 4125 kHz, 5680 kHz, 121.5 MHz, 123.1 MHz and VHF channel 6 (156.30 MHz). For passenger ships it is mandatory to have radiocommunication equipment that can make calls on the aero-nautical air/sea VHF frequencies of 121.5 MHz and 123.1 MHz. To perform distress, emergency, and safety communications with seagoing vessels, aircraft will be able to communicate in J3E mode when using the carrier frequency 2182 kHz or 4125 kHz and in G3E mode when using the frequency 156.8 MHz and, optionally, frequency 156.3 MHz. Additionally, during SAR operations, the aircraft can use DSC equipment on the frequency 156.525 MHz and automatic identification system (AIS) equipment on the AIS frequencies 161.975 MHz and 162.025 MHz [17].

2.2 Theoretical Considerations

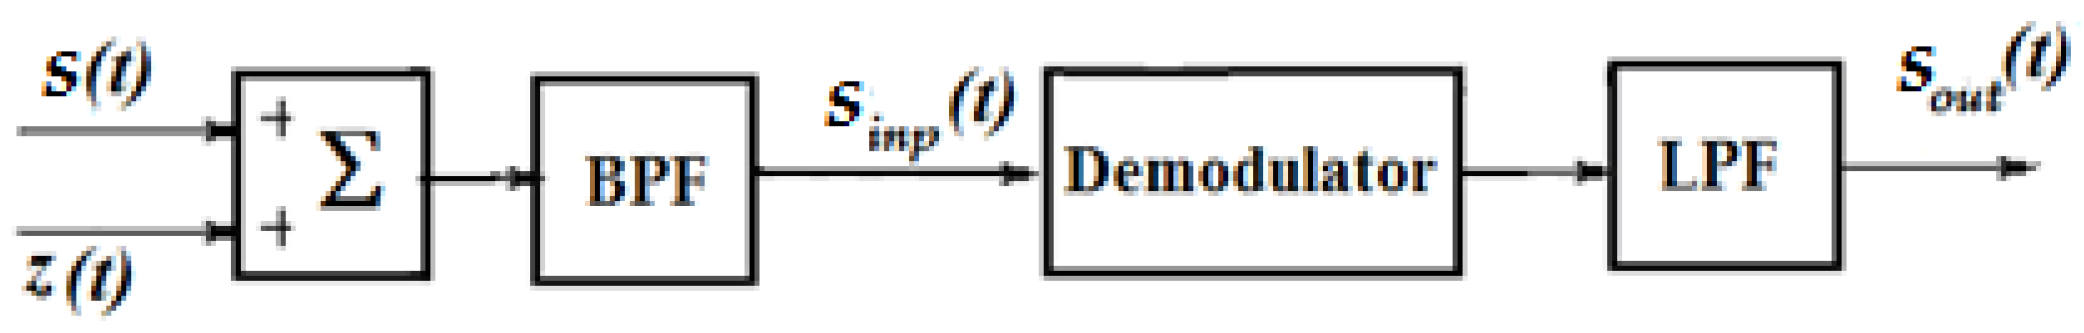
2.2.1. Formulation of the Problem

One method to analyze the interference resistance of communication systems is to sum up at the reception, over the signal modulated with modulation signal x(t), a white Gaussian noise, uncorrelated, with zero mean value z(t) [21,22,23,24]. In this sense, the improvement factor of the demodulator (IFD) is defined in Equation (1) as the ratio between the SNR (signal-to-noise ratio) at the demodulator output and the SNR (PSinp/PZinp) at the demodulator input:
ρ = ( P S o u t / P Z o u t ) / ( P S i n p / P Z i n p ) ,
Here, PSout and PZout represent the signal power and the noise power, respectively, at the demodulator output, whereas PSinp and PZinp represent the signal power and the noise power, respectively, at the demodulator input. The quantities are noted on the schematic diagram illustrated in Figure 2.
The demodulator input noise power PZinp is considered equal to the output noise at the band-pass filter (BPF) with bandwidth B and the central frequency, fc, i.e., a narrow-band noise that can be written as Equation (2):
z ( t ) = n 1 ( t ) cos ω c t n 2 ( t ) sin ω c t ,
where ωc is the central angular frequency, t is the time, and n1(t) and n2(t) are white, Gaussian, uncorrelated, low frequency noises with zero mean value, ( n 1 ( t ) ¯ = 0 , n 2 ( t ) ¯ = 0 ). If we denote by N0 the power spectral densities of n1(t) and n2(t), the power of the noise at the input to the demodulator PZinp can be calculated with Equation (3):
P Z i n p = 1 2 π ω c π B ω c + π B N 0 d ω = N 0 B ,
The signal and noise power at the demodulator output PSout and PZout, respectively, are evaluated according to the ideal low-pass filter (LPF) with a transfer factor equal to the unit in the passband and the cut-off frequency equal to the maximum modulation frequency (fmM). Additionally, in this analysis there is considered that the amplitude of the signal is higher in relation to the noise for most of the time (with a maximum probability).

2.2.2. Determining the IFD for Emission Classes A3X

If the modulation signal is represented as x(t) = Xm f(t) in which Xm—is the amplitude of the modulation signal, f(t)—represents the normalized modulation signal with zero mean value ( f ( t ) ¯ = 0 ), and m represents the degree or index of modulation, the amplitude-modulated signal sA3X(t) with double sideband can be described by Equation (4):
s A 3 X ( t ) = A p [ 1 + m f ( t ) ] cos ω p t ,
where Ap is the carrier amplitude, and ωp is the carrier angular frequency. The signal power PSinp at the demodulator input is given in Equation (5):
P S i n p = s 2 A 3 X ( t ) ¯ = 1 2 A p 2 [ 1 + m f ( t ) ] 2 ¯ = 1 2 A p 2 [ 1 + m 2 f ( t ) 2 ¯ ] ,
Considering that the efficiency of the detector (demodulator) is ηd, the following signal in Equation (6) is obtained at its output:
s o u t ( t ) = η d [ A p m f ( t ) + n 1 ( t ) ] ,
At the output, the signal power, PSout, and the noise power, PZout, are expressed as in Equations (7) and (8):
P S o u t = η d 2 A p 2 m 2 f 2 ( t ) ¯ ,
P Z o u t = η d 2 n 1 2 ( t ) ¯ = η d 2 N 0 B ,
It turns out that the IFD is computed with Equation (9)
ρ A 3 X = P S o u t / P Z o u t P S i n p / P Z i n p = A p 2 m 2 f 2 ( t ) ¯ / N 0 B A p 2 [ 1 + m 2 f ( t ) 2 ¯ ] / 2 N B 0 = 2 m 2 f 2 ( t ) ¯ 1 + m 2 f 2 ( t ) ¯ ,

2.2.3. Determining the IFD for Emission Classes J3E and J2B

In the following paragraph, the case of a J3E/J2B signal that uses the upper sideband is analysed, considering the case of coherent detection (the carrier generated at the receiver is perfectly aligned in phase with the carrier generated at the transmitter). Therefore, the signals belonging to these emission classes can be expressed as in Equation (10):
s J 3 E ( t ) = ( 1 / 2 ) x ( t ) cos ω P t ( 1 / 2 ) x ^ ( t ) sin ω P t ,
where x ^ ( t ) —represents the Hilbert transform of the modulation signal x(t).
The signal power at the input of the demodulator is as follows in Equation (11):
P S i n p = s J 3 E 2 ( t ) ¯ = ( 1 / 4 ) x 2 ( t ) ¯ ,
At the output of the product detector (with the same efficiency ηd as in the previous case), a signal proportional to the amplitude of the phase component is obtained in Equation (12):
s o u t ( t ) = η d [ ( 1 / 2 ) x ( t ) + n 1 ( t ) cos π B t n 2 ( t ) sin π B t ] ,
such that the output signal power is expressed in Equation (13):
P S o u t = ( 1 / 4 ) η d 2 x 2 ( t ) ¯ ,
At the demodulator input, PZin is expressed according to Equation (3), and PZout is given by Equation (8). Therefore, IFD can be deducted as mentioned below in Equation (14):
ρ J 3 E = ( P S o u t / P Z o u t ) / ( P S i n p / P Z i n p ) = [ ( 1 / 4 ) η d 2 x 2 ( t ) ¯ / η d 2 N 0 B ] / [ ( 1 / 4 ) η d 2 x 2 ( t ) ¯ / N 0 B ] = 1 ,

2.2.4. Determining the IFD for Emission Classes G3E, G2B and G1B

The following notations are made: KMG is the slope of the phase modulator, the phase deviation and Δφ = KMG ·Xm is expressed as product between the phase modulator slope KMG and the modulation signal amplitude Xm, and f(t) is the normalized modulation signal with zero mean value (the same quantities as in Section 2.2.2). Thus, the phase-modulated signals can be expressed as in Euation (15):
s M G ( t ) = A p cos [ ω p t + φ ( t ) ] = A p cos [ ω p t + K M G x ( t ) ] = A p cos [ ω p t + Δ φ f ( t ) ] = A p cos [ ω p t + K M G X m f ( t ) ]
Because the actual information is contained only in the received signal phase φ ( t ) , before demodulation the signal is passed through an amplitude limiter. Therefore, at the demodulator input the limited signal power PSMG is expressed with Equation (16):
P S M G = s M G 2 ( t ) ¯ = A p 2 / 2 ,
and the noise power is the same as in relationship (3).
The shape of the noise-affected signal can be described by Equation (17):
s M G ( t ) = A p cos [ ω p t + φ ( t ) + φ z ( t ) ] = A p cos [ ω p t + Φ ] ,
where ϕz(t) is the noise component in the total phase of the signal Φ. The demodulated signal will be proportional to Φ = φ ( t ) + φ z ( t ) . Thus, the signal and noise power, respectively, will depend on the phase modulator slope KMG and/or the phase demodulator slope KDG, as seen in Equations (18) and (19):
P S o u t G 3 E = K D G 2 K M G 2 f 2 ( t ) ¯ ,
P Z o u t G 3 E = K D G 2 A p 2 1 2 π ω c π B ω c + π B N 0 d ω = 2 K D G 2 A p 2 N 0 B .
The result for G3E and G2E is an IFD expressed by Equation (20):
ρ G 3 E = P S o u t / P Z o u t P S i n p / P Z i n p = K D G 2 K M G 2 f 2 ( t ) ¯ 2 ( K D G 2 / A p 2 ) N 0 B 2 N 0 B A p 2 = K M G 2 f 2 ( t ) ¯ ,

2.2.5. Determining the IFD for Emission Classes F1B and F2B

Denoting KMF the modulator frequency conversion constant, and Δω = KMFXm—the angular frequency deviation, the general form of these frequency-modulated signals is described by the following Equation (21):
s M F ( t ) = A p cos [ ω p t + φ ( t ) ] = A p cos [ ω p t + Δ ω 0 t f ( τ ) d τ ] Δ ω 0 t f ( τ ) d τ ,
In the case of F1B and F2B emission classes, the actual information is transmitted by varying the frequency of the carrier signal. Therefore, an amplitude limiter is inserted before the demodulator. The power of the input signal will be given by the relation (16) and that of the input noise by the relation (3).
The demodulated signal will be proportional to the time variation of the signal’s total phase dΦ/dt. If we note with KDF the demodulator constant or efficiency, the respective powers of the output signal and the output noise are given by Equations (22) and (23):
P S o u t F 1 B = [ Δ ω M f ( t ) ] 2 ¯ = Δ ω M 2 f 2 ( t ) ¯ = K D F 2 K M F 2 X m 2 f 2 ( t ) ¯ ,
P Z o u t F 1 B = K D 2 A p 2 1 2 π ω c π B ω c + π B ω 2 N 0 d ω = 2 3 K D 2 N 0 B 3 A p 2 .
The result for the improvement factor is expressed by relationship (24):
ρ F 1 B = K D F 2 K M F 2 X m 2 f 2 ( t ) ¯ ( 2 / 3 ) ( K D F 2 N 0 B 3 / A p 2 ) 2 N 0 B A p 2 = 3 K M F 2 X m 2 B 2 f 2 ( t ) ¯ = 3 D 2 f 2 ( t ) ¯ ,
where D is the deviation ratio.

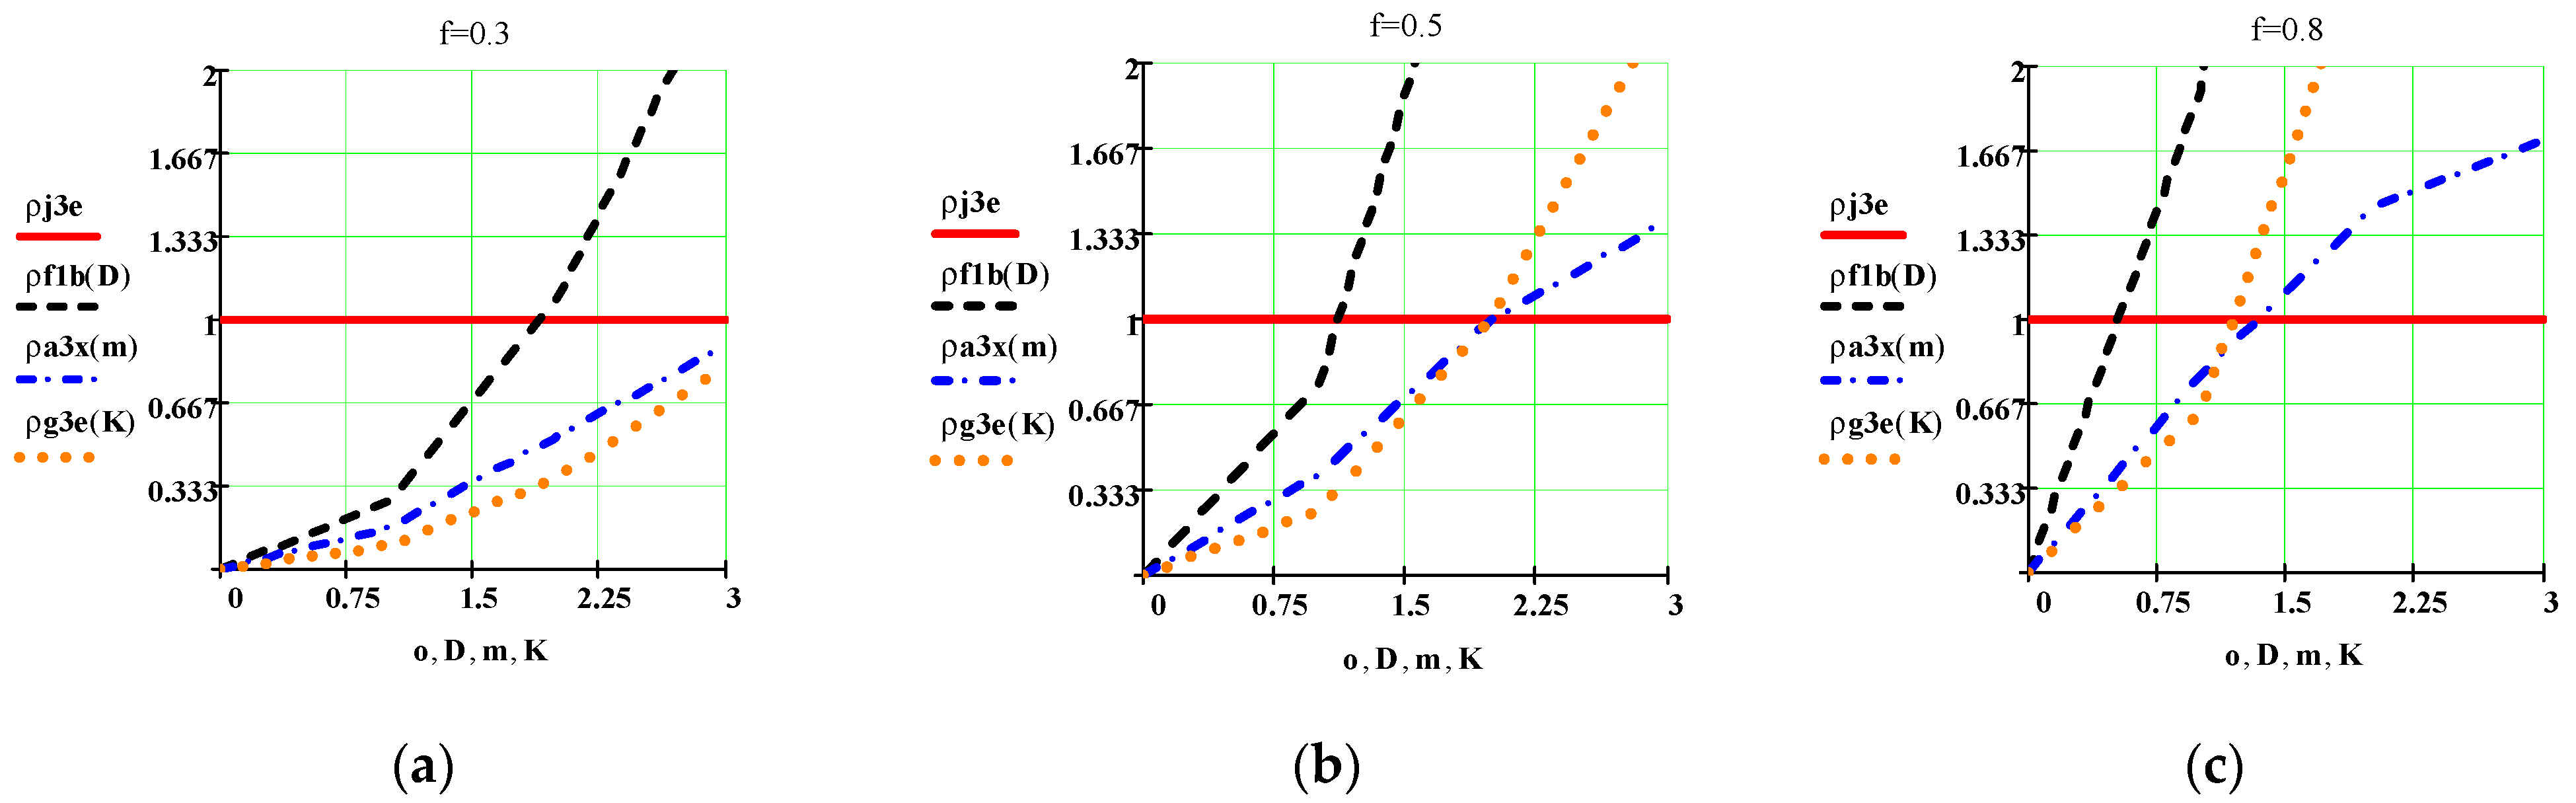
2.2.6. Comparison of IFD (with the Use of Mathcad)

Figure 3 illustrates the IFD for all the modulated signals discussed above, depending on the modulation index m/slope K/deviation D, and the normalized modulation signal power f 2 ( t ) ¯ . Therefore, the blue dash-dotted line represents ρa3x—the IFD of a Double Sideband Amplitude-Modulated signal according to A3X emission class, computed with Equation (9) and depending on the modulation index m; the continuous red line represents ρj3e—the IFD of a Single-Sideband Amplitude-Modulated signal according to J3E emission class and computed with Equation (14); the red dotted line represents ρg3e—the IFD of a phase-modulated signal according to G3E emission class, depending on the phase modulator shape KMG and computed with Equation (20); and finally, the black dashed line represents ρf1b—the IFD of a Frequency-Modulated signal according to F1B emission class, depending on de frequency deviation ratio D, and computed with Equation (24). Three values of the normalized modulation signal power f 2 ( t ) ¯ were considered 0.3, 0.5, and 0.8, respectively, and thus three graphs were drawn.
By analysing Equations (9), (14), (20) and (24) implemented in the Mathcad software and the graphs drawn in Figure 3, we can state that:
  • IFDs are constant and do not depend on the parameters of the modulating signal or of the modulation stage only for the analysed emission classes J3E and J2B;
  • For small values of the standard modulator signal power, of the slope of the phase modulator for G3E and of the deviation ratio for F1B (default for small occupied bandwidths), IFD for emission classes J3E and J2B are clearly superior to all other classes. Additionally, in this case, the superiority of IFD of A3X class over those of G3E, G2B and G1B is found;
  • A constant IFD of 1 for J3E and J2B could mean that we can recover the signal even if its power is equal to the noise power; thus, it is not depending on the standard modulating signal power, which gives these emission classes a special stability to disturbances;
  • For the emission classes G3E, G2B G1B, and especially for F1B, F2B, IFD classes, the obtained values are much higher than those of the other classes, but only for high values of the normalized modulation signal power, and of the deviation ratio or the phase modulator slope, respectively, which rise as the modulated signal band increases.

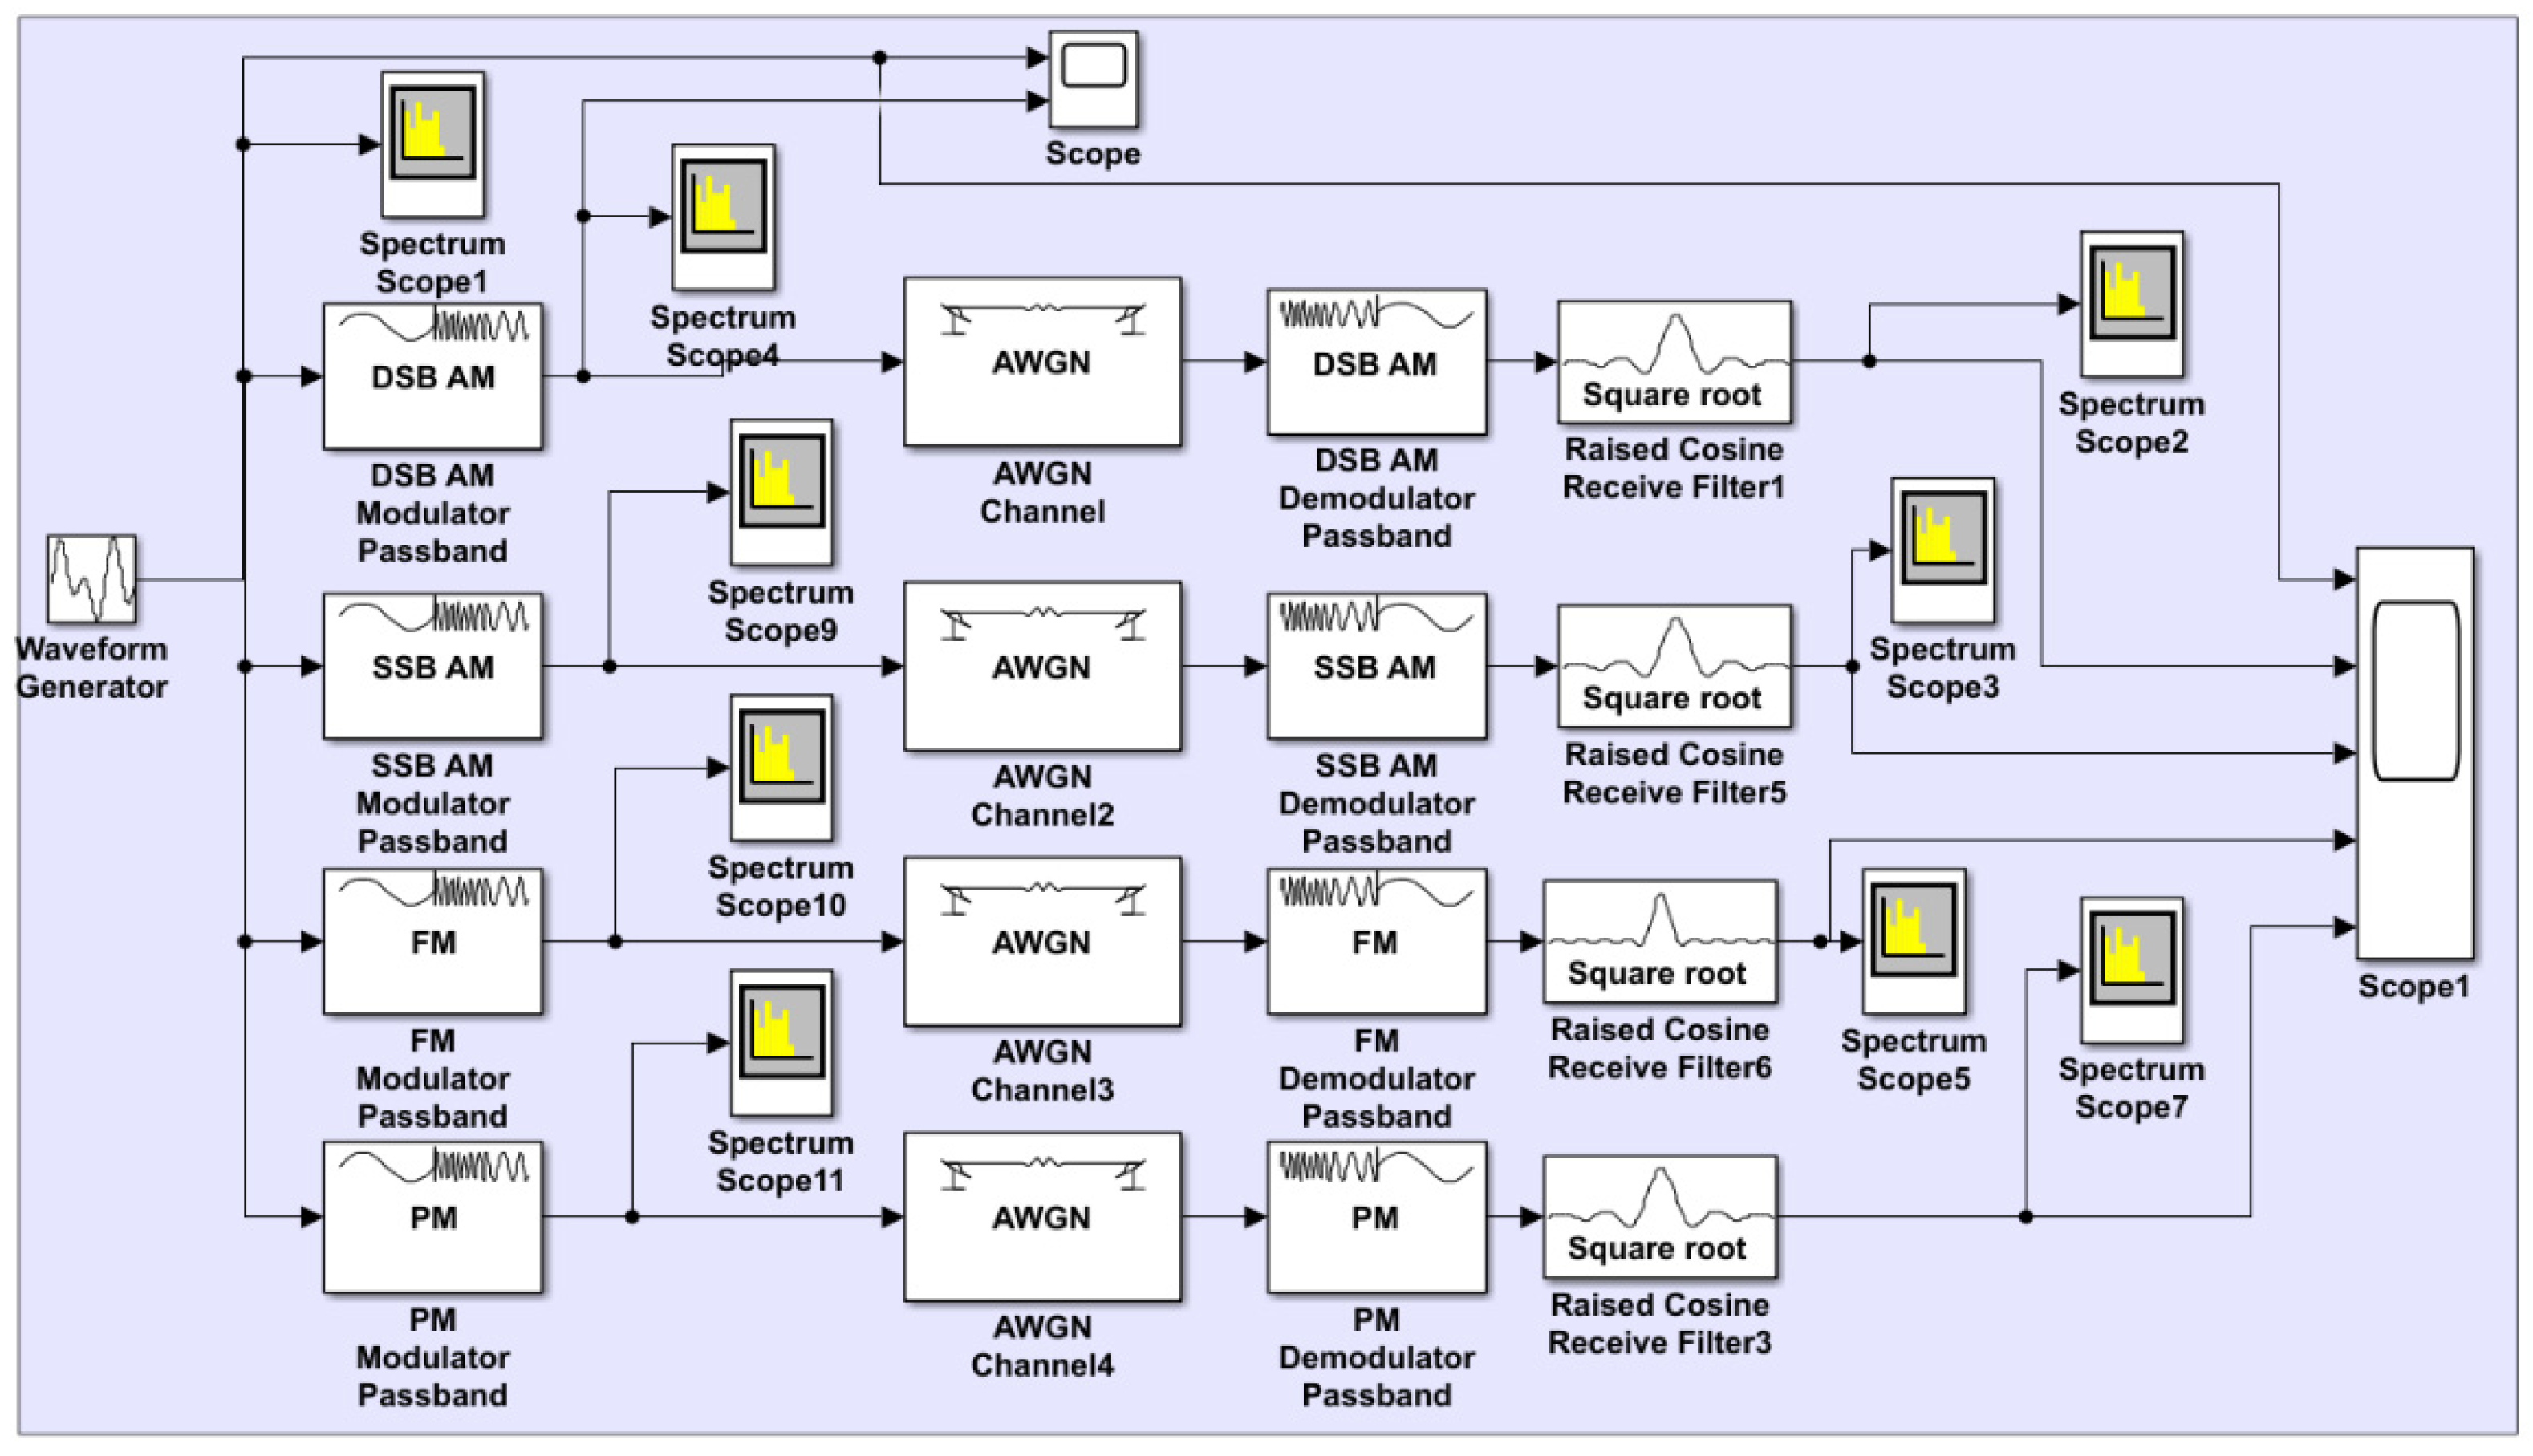
2.3. Verification of Results Using the Matlab—Simulink Simulation Program

To verify the analytically obtained results, and starting from the equivalent noise demodulation schematic diagram presented in Figure 2, a block diagram of four types of demodulators was designed and implemented in the Matlab-Simulink programming environment. The diagram is shown Figure 4 and it describes the following demodulators: Double Sideband Amplitude Modulation (DSB AM) demodulator representing the A3X class, Single-Sideband Amplitude Modulation (SSB AM) demodulator representing the J3E class, frequency modulation (FM) demodulator respresenting the F1B class, and phase modulation (PM) demodulator representing the G3E class. Gaussian white noise was introduced through the “AWGN Channel” blocks.
Figure 5 illustrates five signals, listed from top to bottom: the modulation signal x(t) created by the waveform generator, and the signals obtained at the output of the following demodulators: DSB AM (A3X class), SSB AM (J3E class), FM (F1B class), and PM (G3E class). The scales of the signal graphs are different and illustrated on the left side of each oscilloscope channel. All five signals were determined for various values of the SNR and the phase deviation Δφ (in the case of the PM demodulator).

3. Results and Discussion

Comparison of the results in Figure 5a,b provides an insight into the performance of the PM demodulator depending on the phase deviation value Δφ = π/2 in (a) as opposed to Δφ = π/3 in (b), for the same SNR = 20 dB. The following subfigures (c) to (f) maintain the same phase deviation Δφ = π/3 that yielded proper noise stability results of the PM demodulator, while varying the SNR, and in this case, an adequate comparison between various demodulator types can be carried out. Therefore:
  • Emission classes that use phase modulation have been shown to be more resistant to interference when a π/3 phase deviation has been used, which is much more resistant than those that use frequency modulation.
  • For emission classes using frequency modulation, at SNR values below 10 dB (considered to be the full improvement threshold) the actual signal shape can no longer be recognized—the effect of signal captured by noise occurs.
  • Emission classes using DSB AM showed similar resistance to disturbance using SSB AM, so that, for both, the useful signal can be recognized even in the conditions of an SNR of −3 dB.
When comparing the simulation results in Figure 5 to those obtained analytically and illustrated in Figure 3, it is noted that the demodulating systems ranking from the perspective of noise stability is similar only for the situation of a high SNR = 20 dB (Figure 5b), and for small values (below 1) of the corresponding dependence parameters m, K, D in Figure 3. In this case, the J3E system (SSB AM) yields the highest stability in terms of both simulation results and IFD value. However, there is a notable difference for the DSB AM system (A3X class) compared to the FM system (F1B class): although the simulation in Figure 5 indicates a low performance of the F1B class system compared to the A3X one, the analytical calculations give high IFD values for the F1B, regardless of the normalized modulator signal power, the modulation index m, or the frequency deviation D. G3E (PM) systems yield the lowest performance in both cases.
Table 1 presents a comparative situation between the results obtained by the two methods adopted and the conclusions formulated in the specialized technical literature and the bibliographic references.

4. Conclusions

The paper presents a comparative analysis of analog (de)modulation systems employed in maritime communications for search-and-rescue operations. The noise stability of the following systems is investigated: DSB AM (A3X class), SSB AM (J3E class), FM (F1B class), and PM (G3E class). The analysis is carried out through analytical calculation of the improvement factor of the demodulator (IFD), and by implementing the modulator-demodulator systems in the Matlab-Simulink simulation environment. The research method employed in the two-phased analysis is scientifically accurate and thorough. For particular value ranges of the modulation parameters, the two phases of the analysis yield similar results. However, one drawback of the research method employed in the analysis is that it needs to be supplemented by experimental validation. Based on the results discussion in the previous section, several conclusions regarding the deployment of analog communication system in SAR operations communications can be formulated.
For radio communications allocated to MF/HF and VHF maritime bands, systems using emission classes related to linear modulations (in amplitude) prove to be more resistant to disturbances than systems using emission classes related to phase and frequency modulations. This is true for all radio communications in environments affected by noise and in which we cannot provide a proper signal-to-noise ratio (over 10 dB).
Keeping the J3E emission class for the maritime MF/HF range, both in ordinary communications and especially in distress communications, for the next at least 10 years is a perfectly justified thing due to:
  • The constructive simplicity of the radio stations that use it;
  • Resistance to disturbances;
  • Very small occupied bandwidth, (default and lower transmission power);
  • Efficient use of the electromagnetic spectrum;
  • Propagation of HF waves at very long distances and on multiple paths, which leads to the summation at the input terminals of the receiver of both the multiple signals from the transmitter being worked with and from other transmitters;
  • The multitude of users of this range and the very high requirement of allocated frequencies/channels.
The advantages listed above make the emission classes that use SSB modulation particularly attractive for terrestrial radiocommunications or fiber optic communications [25,26,27,28,29].
Taking into consideration that in ETSI EN 300 338-1 V1.4.2 (2017-11) standard it is provided that the integrated equipment used for communications in the MF/HF range must be able to operate and in J2B mode, it is very possible that in the future it will be introduced the obligation to transmit distress alerts via DSC in the MF/HF ranges in J2B mode.
The use of phase modulation for distress communications is possible only in the VHF range where with the assurance of a higher bandwidth (16 kHz) better performance of this modulation can be obtained and with the imposition of restrictions/communication disciplines (during communications any other type of communication that may interfere with them is prohibited).
Because the impact of the WRC extends over long periods of time, between 10 and 20 years after the conference, the emission classes analysed in this paper will certainly be used for distress maritime communications for at least the next 10 years [30]. Moreover, because one of the basic principles of SOLAS is the transmission of distress alerts by at least two independent means, the introduction of digital modulations in naval radio communications will not lead to the disappearance of communications using analog modulations, especially when the risk of cyberattacks is on the rise.

Author Contributions

Conceptualization, V.S.; methodology, V.S.; software, V.S.; validation, V.S. and G.R.; formal analysis, V.S.; investigation, V.S.; resources, V.S. and G.R.; data curation, G.R.; writing—original draft preparation, G.R.; writing—review and editing, M.G.; visualization, V.S.; supervision, M.G.; project administration, M.G.; funding acquisition, M.G. All authors have read and agreed to the published version of the manuscript.

Funding

This research was funded by the doctoral school of ‘Dunarea de Jos’ University Galati, Romania.

Informed Consent Statement

Not applicable.

Conflicts of Interest

The authors declare no conflict of interest.

References

  1. Australian Global Maritime Distress and Safety System (GMDSS) Handbook 2018, 11th ed.; Australian Maritime Safety Authority (AMSA): Braddon, Australia, 2018.
  2. International Convention for the Safety of Life at Sea (SOLAS); International Maritime Organization (IMO): London, UK, 1974; Available online: https://www.imo.org/en/About/Conventions/Pages/International-Convention-for-the-Safety-of-Life-at-Sea-(SOLAS) (accessed on 10 March 2021).
  3. Brief History of IMO; International Maritime Organization (IMO): London, UK, 2019; Available online: https://www.imo.org/en/About/HistoryOfIMO/Pages/Default.aspx (accessed on 10 March 2021).
  4. Modern Maritime Communications. In Proceedings of the 29th World Radiocommunications Seminar, Online, 30 November–11 December 2020; Available online: https://www.itu.int/en/ITU-R/seminars/wrs/2020/ (accessed on 10 March 2021).
  5. SOLAS (Safety of Life at Sea) New or Upcoming Requirements; Lloid’s Register: London, UK, 2021; Available online: https://www.lr.org/en/solas/ (accessed on 24 April 2021).
  6. Raulefs, R.; Wang, W. Radio Spectrum Scarcity for Maritime Communication and Navigation Systems. In Proceedings of the 2021 IEEE 4th International Conference on Electronic Information and Communication Technology (ICEICT), Xi’an, China, 18–20 August 2021; pp. 588–591. [Google Scholar] [CrossRef]
  7. Gradiant. The Digitalisation of Maritime Communications; Gradiant: Vigo, Spain, 2019. [Google Scholar]
  8. John, O.; Reinmann, M. Increasing Quality of Maritime Communication through Intelligent Speech Recognition and Radio Direction Finding. In Proceedings of the European Navigation Conference ENC 2020, Dresden, Germany, 23–24 November 2020. [Google Scholar]
  9. A Comprehensive Guide to Maritime Cybersecurity, ©2021 Mission Secure. Available online: https://www.missionsecure.com/maritime-security-perspectives-for-a-comprehensive-approach (accessed on 24 April 2021).
  10. European Commission. Setting the World’s Radio Spectrum Rules. In Proceedings of the World Radiocommunication Conference, Sharm el-Sheikh, Egypt, 28 October–22 November 2019; Available online: https://ec.europa.eu/digital-single-market/en/world-radiocommunication-conference-setting-worlds-radio-spectrum-rules (accessed on 10 March 2021).
  11. ITU. Radio Regulations Articles, 2012 ed.; ITU: Geneva, Switzerland, 2012. [Google Scholar]
  12. ITU. Radio Regulations Appendices, 2016 ed.; ITU: Geneva, Switzerland, 2016. [Google Scholar]
  13. ITU. Final Acts WRC-15 World Radiocommunication Conference (GENEVA, 2015); ITU: Geneva, Switzerland, 2016. [Google Scholar]
  14. Sternula, Maritime Authority, Sternula ApS, Denmark. Available online: https://www.sternula.com/index.php/maritime-authorities/ (accessed on 24 April 2021).
  15. European Union Agency for the Space Programme. Search and Rescue (SAR)/Galileo Service. Available online: https://www.euspa.europa.eu/european-space/galileo/services/search-and-rescue-sar-galileo-service (accessed on 17 May 2021).
  16. European Standard. ETSI EN 300 338-1 V1.4.2 (2017-11)—Technical Characteristics and Methods of Measurement. Available online: https://www.etsi.org/deliver/etsi_en/300300_300399/30033801/01.04.02_60/en_30033801v010402p.pdf (accessed on 17 May 2021).
  17. Maritime Radio Transmitters and Receivers in the Band 156–162.5 MHz. Spectrum Management and Telecommunications Radio Standards Specification Industry Canada. Available online: https://www.ic.gc.ca/eic/site/smt-gst.nsf/vwapj/RSS182.pdf/$FILE/RSS182.pdf (accessed on 17 May 2021).
  18. RSS-287—Emergency Position Indicating Radio Beacons (EPIRB), Emergency Locator Transmitters (ELT), Personal Locator Beacons (PLB), and Maritime Survivor Locator Devices (MSLD); Government of Canada: Ottawa, ON, Canada, 2017.
  19. Specification for COSPAS-SARSAT 406 MHz Distress Beacons C/S T.001—Issue 4—Rev. 3; Cospas-Sarsat: Montreal, QC, Canada, 2018; Available online: http://www.cospas-sarsat.int/en/ (accessed on 17 May 2021).
  20. International Aeronautical and Maritime Search and Rescue Manual, Volume III, Mobile Facilities; International Maritime Organization: London, UK; International Civil Aviation Organization: Montréal, QC, Canada, 2016.
  21. Constantin, I.M.I. Transmisiuni Analogice şi Digitale; Editura Tehnică: Bucureşti, Romania, 1995. [Google Scholar]
  22. Ziemer, R.E.; Tranter, W.H. Principles of Communications, 7th ed.; Wiley: Hoboken, NJ, USA, 2014; Available online: https://it-ebooks.info/ (accessed on 19 May 2021).
  23. Carlson, A.; Crilly, P. Communication Systeems—An Introduction to Signals and Noise, 5th ed.; McGraw-Hill: New York, NY, USA, 2011. [Google Scholar]
  24. Agbo, S.O.; Sadiku, M.N.O. Principles of Modern Communication, 7-Systems Noise in Analog Communications; Cambridge University Press: Cambridge, UK, 2019. [Google Scholar]
  25. Safavi, H.; Hosseini, S.E. Optical SSB modulator/frequency shifter with ultralow spurious sidebands. Appl. Opt. 2020, 59, 7408–7418. [Google Scholar] [CrossRef] [PubMed]
  26. Zho, B.; Nai, W.; Ge, Y.; Xing, Y.; Zhu, H. Performance Analysis on Single Sideband Modulated Radio-Over-Fiber System Carrying Amplitude Shift Keying Signal with Different Duty Cycle. In Proceedings of the 2018 IEEE 9th International Conference on Software Engineering and Service Science (ICSESS), Beijing, China, 23–25 November 2018; Available online: https://ieeexplore.ieee.org/document/8663904 (accessed on 17 May 2021).
  27. Sampath, K.I.A.; Takano, K.; Maeda, J. Peak-to-Average Power Ratio Reduction of Carrier-Suppressed Optical SSB Modulation: Performance Comparison of Three Methods. Photonics 2021, 8, 67. [Google Scholar] [CrossRef]
  28. Yaakob, S.; Mahmood, R.M.; Zan, Z.; Rashidi, C.B.M.; Mahmud, A.; Anas, S.B.A. Modulation Index and Phase Imbalance of Dual-Sideband Optical Carrier Suppression (DSB-OCS) in Optical Millimeter-Wave System. Photonics 2021, 8, 153. [Google Scholar] [CrossRef]
  29. Ganjali, M.; Safavi, N.; Qashqaei, M.; Hosseini, S.E. Optical single-sideband polarization modulator based on Sagnac interferometers and its applications in radio-over-fiber systems. J. Opt. Soc. Am. B 2020, 37, 3268–3276. [Google Scholar] [CrossRef]
  30. ITU. Frequency Plans for Terrestrial Non-Broadcasting Services Document WRS20/8-E. In Proceedings of the ITU World Radiocommunication Seminar 2020 (WRS-20), Online, 3 November 2020. [Google Scholar]
Figure 2. Equivalent scheme for demodulation analysis in the presence of noise.
Inventions 06 00072 g002
Figure 3. IFD values plotted based on the relationships (9), (14), (20) and (24) for different values of the normalized modulation signal power f 2 ( t ) ¯ : (a) 0.3; (b) 0.5; (c) 0.8.
Inventions 06 00072 g003
Figure 4. Schematic diagram used in the Matlab-Simulink software for verifying the stability to disturbances of the main emission classes used in search-and-rescue communications at sea.
Inventions 06 00072 g004
Figure 5. Simulation results using the diagram in Figure 4, for different values of the noise signal ratio (SNR) at the demodulator input port: (a) SNR = 20 dB, for MP Δφ = π/2; (b) SNR = 20 dB, for MP Δφ = π/3; (c) SNR = 10 dB, for MP Δφ = π/3; (d) SNR = 3 dB, for MP Δφ = π/3; (e) SNR = 0 dB, for MP Δφ = π/3; (f) SNR = −3 dB, for MP Δφ = π/3.
Inventions 06 00072 g005aInventions 06 00072 g005b
Table 1. Comparison of analog system stability to disturbance results obtained from both research method and from technical literature.
SNREmission Classes Used in Distress CommunicationsStability to Disturbances
IFD ConclusionsSimulink ConclusionsConclusions from the Technical Literature/References [21,22,23,24]
>10 dBA3XDepending on the modulation index m and the normalized modulation signal power f 2 ( t ) ¯ . Performances for m < 1 are below F1B, J3E but above G3E.Very good. Similar performance as J3E and higher than F1B and G3E.Good. According to [23] the poorest performance. According to [24] poorer performance than J3E.
F1BDepending on the deviation ratio D, and the normalized modulation signal power f 2 ( t ) ¯ . For low values of D and f 2 ( t ) ¯ performing below J3E.Very good.Very good. Acording [21,22,23] the best performance.
J3EIFD = 1—goodVery good.Good.
G3EDepending on the phase modulator slope KMG and the normalized modulation signal power f 2 ( t ) ¯ . It has performance over J3E and A3X only for high values of KMG and f 2 ( t ) ¯ .Depends on the phase deviation; very good for phase deviation = π/3.Very good. According to [21,23,24] better performance than J3E and A3X.
3–10 dBA3XN/A—we considered that the amplitude of the useful signal is higher in relation to the noise for most of the timeVery goodGood only for case of coherent detection, unacceptable for system with envelope
detection.
F1BN/A—we considered that the amplitude of the useful signal is higher in relation to the noise for most of the timeUnacceptableVery low below the SNR threshold of 10 dB [21]. Can be improved with preemphasis/deemphasis systems [22,23,24]. According to [24] better than A3X and J3E.
J3EIFD = 1—good for case of coherent detection.Very good.Good for case of coherent detection.
G3EN/A—we considered that the amplitude of the useful signal is higher in relation to the noise for most of the time.Acceptable for phase deviation = π/3 (can be improved using additional processing methods).Good. According to [24] better than F1B for most practical signals.
0–3 dBA3XSimilar to case 3—10 dB.GoodUnacceptable
F1BSimilar to case 3—10 dB.UnacceptableUnacceptable [21].
J3ESimilar to case 3—10 dB.GoodGood for case of coherent detection.
G3ESimilar to case 3—10 dB.Bad, can be improved with additional processingAccording to [24] better than F1B.
0–(−3) dBA3XSimilar to case 3—10 dB.GoodUnacceptable
F1BSimilar to case 3—10 dB.UnacceptableUnacceptable
J3ESimilar to case 3—10 dB.GoodUnacceptable
G3ESimilar to case 3—10 dB.UnacceptableUnacceptable
Publisher’s Note: MDPI stays neutral with regard to jurisdictional claims in published maps and institutional affiliations.

