1. Introduction
Diabetes is a major health disease affecting a large number of people. It is assumed that in Europe about 9.1% of the total population suffers from diabetes [
1]. This, in the sequel, causes a great economic burden for the health care system which is estimated to an annual cost of about €7–10 billion across European Union countries. Diabetic foot ulceration (DFUs) is a major complication of diabetes, and diabetic patients have up to a 25% lifetime risk of developing a foot ulcer. If untreated, diabetic foot ulcers may become infected and require total or partial amputation of the affected limb. Changes in the large vessels and microcirculation of the diabetic foot are important in the development of diabetic foot ulceration and subsequent failure to heal existing ulcers. The problem derives from the low perspiration of the foot mainly due to vascular (blood vessel) problems. Annually, about the 4% of patients with diabetes will develop a foot ulcer, and 10–15% of those with diabetes will have at least one-foot ulcer during their lifetime [
2].
Diabetic Foot disease has psychological and behavioural consequences related to psychological constructs with ulcer risk, healing, amputation and mortality [
3,
4]. Some studies’ results suggested that depression is associated with a two to three-fold increase in the incidence of foot ulcers. Moreover, there are other social aspects where one should focus on, like decreasing the sick leaves and increasing the productivity at work and avoiding or delaying the DFU. Furthermore, early detection of diabetic foot can help people adjust their behavioural patterns: choose gentle exercise routines which will not strain their feet and wear suitable footwear which does not create unsuitable pressure on sensitive foot areas.
Hyperspectral Imaging (HSI), also called imaging spectroscopy, originated from remote sensing and environmental and military applications [
5], has been recently explored in medicine [
6]. HSI generates a three-dimensional (3D) hypercube that includes spatial and spectral information and covers a contiguous portion of the light spectrum up to few hundreds of bands able to identify pathological conditions in body tissues and offer potential for non-invasive disease diagnosis and surgical guidance in real-time. Light delivered to the biological tissue undergoes multiple scattering due to the inhomogeneity of biological structures and absorption primarily in haemoglobin, melanin, oxygen, elastin, collagen and water. It is assumed that the absorption, fluorescence and scattering of a tissue change during the progression of a disease and/or under different functional conditions of an organ. Therefore, the reflected, fluorescent and transmitted light from tissue captured by HSI carries quantitative diagnostic information about tissue pathology [
7,
8,
9].
Tissue Optics: Light entering biological tissue undergoes multiple scattering and absorption events as it propagates across the tissue [
10]. Biological tissues are heterogeneous in composition with spatial variations in optical properties [
11]. The scattering properties of support tissues composed of cells and extracellular proteins (elastin, collagen, etc.) are caused by the small-scale inhomogeneities and the large-scale variations in the structures they form. The penetration depth of light into biological tissues depends on how strongly the tissue absorbs light. Most tissues are sufficiently weak absorbers to permit significant light penetration within the therapeutic window, ranging from 600 to 1300 nm. During absorption processing, transitions between two energy levels of a molecule that are well defined at specific wavelengths could serve as a spectral fingerprint of the molecule for diagnostic purposes. For example, absorption spectra characterize the concentration and oxygen saturation of haemoglobin, metrics which are very important for vascular diseases.
Medical Hyperspectral Imaging (MHSI) technology is an indirect strategy to extract a spatial map of optical properties within the tissue since it deduces the interaction coefficients from measurements of reflectance and transmittance. MHSI is a non-invasive, non-ionizing technology, which provides a quantitative way of solving medical problems. MHSI systems can cover UV, VIS, NIR, and mid-IR spectral ranges based on different medical applications. Visible light penetrates only 1 to 2 mm below the skin and thus “reveals” information from the subpapillary [
12]. Such spectrum can be useful for monitoring and assessment of diabetic foot ulcer, since hyperspectral imaging provides information regarding oxyhaemoglobin and deoxyhaemoglobin, important factors for the progression of the disease. On the contrary, light in the NIR region penetrates deeper into the tissue than VIS or mid-IR radiation. NIR light is preferred for surgical guidance due to its deep penetration into the tissue, which can help the surgeon see through connective tissue for visualizing critical anatomical structures of interest that are not visible and detecting molecules with detectible spectra.
These innovations are exploited in the proposed
Photonic-based platform which is described in this paper of detecting and analysing Diabetic Foot Ulcers (DFUs). Our system has as an ultimate goal to
develop a photonic-based device towards a non-invasive monitoring and management of DFUs
either by the patients in their homes or at a medical office. Thus, two editions of our innovative product will be launched: (A) In-Home Edition (called HOME), designed to be used for the patients at their homes and (B) the professional Edition (called PRO) designed to be used by physicians at their offices or at hospitals. This research is supported by the PHOOTONICS European Union funded project [
13] (The name of this project is in fact a spelling and pronunciation anagramming of the words Photonics and Foot (Phoot)). The project integrates the latest advances in bio-photonics, multi-band hyperspectral imaging and diabetic research in order to design and develop this device which is of (i) low cost, (ii) non-invasive, (iii) non-ionizing and (iv) mobile, enabling screening and imaging foot tissue properties related to diabetes.
This paper describes the overall architecture of the project along with the technical specifications. The choices of the broad range of different technical components mentioned in this paper are based on medical requirements suggested by the medical staff of the project, experts in diabetes foot ulcers. Our device is to be clinically evaluated at three prominent European hospitals: one in Germany (Charité–University Hospital, Berlin, Germany), one in Romania (Vector Babes, Timisoara, Romania) and one in Greece (Attikon Athens University Hospital, Athens, Greece) to assess the efficiency and performance of the device in real-life cases.
This paper is organized as follows:
Section 2 describes the state of the art in the fields of hyperspectral and thermal imaging for diabetes, the adaptive signal processing and machine learning tools and the clinical study validation. In
Section 3, we present the whole components of our device and the two delivered editions.
Section 4 discusses the clinical indices used to quantitatively assess a foot ulcer and the sensors selected for our device. The technical specifications are given in
Section 5 while the architecture of the proposed software is presented in
Section 6. Finally,
Section 7 discusses the impact of our photonic-based device on managing diabetes and conclusions are drawn in
Section 8.
2. State of the Art Description
2.1. Hyperspectral Imaging (HSI) in Diabetes
HSI is actually a non-invasive and painless technique for discriminating pathology tissues from the healthy ones. This is very revolutionary for the diagnosis of a diabetic ulcer since the current conventional approaches is through biopsies which are invasive methods which may cause, apart from other, also permanent wounds on the foot. HSI continuously samples the reflectance spectra of light and reveals tissue phenomena which are not distinguishable with standard RGB imaging approaches. Clinical studies have shown that detecting these effects can improve the diagnosis and the prediction of pathology in diabetic ulcers [
12]. Extensive data sets from large scale studies are, however, required to further validate the assessment of tissue pathology of DFU via HSI [
14].
Our device is based on results from a meta data analysis [
15] which measure several biomarkers by HSI for estimating the health status of the foot. The biomarkers examined are oxyhaemoglobin (HbO2) and deoxyhaemoglobin (Hb), through which the Peripheral Oxygen Saturation (SpO2) and Tissue Oxygen Saturation (StO2) is computed; these factors are crucial for the early prediction and prognosis of a DFU [
16]. The goal of the new device is to carry out extensive clinical validation studies to assess the performance, accuracy and sensitivity of the device in terms of ulcer detection sensitivity and specificity. This is accomplished through the use of dedicated spectral bands and thus narrowing the HSI sensors to bands of interest. The sensor will operate at information rich spectral bands for the detection and diagnosis of DFU.
The goal of this analysis is to identify the spectral fingerprints of DFU disorders. It relates the spectral features with high level biomedical information and biomarkers that are important for the early detection and prognosis of a DFU. For this reason, the goal of the clinical study of the PHOOTONICS project is to collect a pool of ground truth data of people with or without ulcers in order to determine the hyperspectral signature of a vessel or arterial tissue in patients with and without DFUs. There is evidence that hyperspectral sensor is able to quantitatively measure the amount of haemoglobin, melanin, oxygen, elastin, collagen and water. These low-level biomarkers are important factors for quantitatively measuring the progress of a vascular disease. Usually, people with a peripheral arterial (or vascular) disease have narrower blood vessels and arteries. Hyperspectral acts as a “material” sensor, understands the vessel/arterial tissue properties, such as elastin, oxygen or collagen, that they are important risk factors for DFU.
2.2. Thermal Imaging in Diabetes
Another salient sensing technology towards a non-invasive DFU diagnosis and monitoring is thermal imaging. This sensor measures the temperature of the foot though the analysis of thermal patterns and its thermal fluctuations. Thermal imaging allows the measurement of the distribution of the vessel flow of a foot. Proven results have shown that a small different of about 2oC in the feet may be due to diabetes problem [
17,
18]. Yet, the association between diabetic foot and heat pattern on the plantar foot is subtle and often nonlinear. Also, the interpretation of the image is subjective to the doctor’s knowledge and experience, and thus, prone to errors. Very recently (in 2019), a validation analysis for the effectiveness of thermal imaging to assess the progress of a diabetic foot is proposed [
19].
The main limitation of thermal imaging is that is extremely sensitive to the environmental conditions (a cold environment may affect the results) and thus influence doctors’ decision regarding hypothermia and hyperthermia. In our case, we optimize an IR sensor to yield a discrimination analysis of less than 100 mK differences and of spatial resolution of 10 pixels/com. In addition, we use thermal images of relatively low cost to make them applicable for an in-home environment.
2.3. Embedded Adaptive Signal Processing and Machine Learning
In image/signal processing society, several algorithms have been proposed for noise removal and SNR increase. Examples include the application of low-pass filters (linear or non-linear) [
20], morphological filtering [
21] or adaptive masking methods [
22]. These processing techniques can be embedded onto hardware systems so as to respond in real-time [
23]. Other approaches face the application of novel super-resolution algorithms to improve the resolution of a sensor by using software tools and not through an increase of the hardware which also yields to an increase of the cost of the device. Thus, the increase of the resolution through a signal processing scheme is very efficient for our medical imaging case [
24]. In the image/signal processing society, several algorithms for super-resolution have been proposed, exploiting (i) sparse representation of the data [
25], (ii) example-based methods [
26] or (iii) stochastic processes [
27]. Spatial segmentation of the images to detect objects of interest can be also applied [
28,
29,
30]. In the diabetic foot domain, the image segmentation methods are combined with artificial neural networks [
31] and deep machine learning. Towards this direction, full convolutional neural network can be applied.
The machine learning tools can be also useful for extracting reliable decisions on how users (the patients) can understand the HSI content [
32]. These tools receive as inputs raw input data from the hyperspectral images and yield as outputs reliable decisions regarding the status and the progress of the disease. Classification models try to predict distinct classes, such as e.g., blood groups, while regression models predict numerical values. Some of the most common techniques are Decision Trees (DT), Rule Learning, and Instance Based Learning (IBL), such as k-Nearest Neighbours (k-NN), Genetic Algorithms (GA), Artificial Neural Networks (ANN), and Support Vector Machines (SVM). Novel methods have also been proposed to deal with features in diabetic patient data. Improved electromagnetism-like mechanism (IEM) algorithm [
33] was proposed for feature selection.
The PHOOTONICS device supports novel adaptive signal processing methods for noise removal, SNR increase and super resolution achievement in HSI images. These signal processing tools are embedded onto our device. The goal is to increase discrimination analysis among the pathology and the healthy foot tissues without a corresponding increase of the hardware cost. This is also accomplished with the use of state-of-the-art super resolution algorithms. The software component allows for the implementation of image analysis algorithms to assist physicians and the patients to focus on regions of interest and thus improving detection performance. In addition, a software platform will be deployed to run machine learning tools so as to get more reliable knowledge on the pathology of a diabetic foot. The learning tools will exploit deep algorithms such as convolutional neural networks (CNNs) and stacked auto-encoders. The platform will communicate with the device to get the raw input data over which the processing will take place. The goal is to improve the reliability in the analysis by non-linearly processing the data and thus getting some knowledge on diabetic foot disease progress.
2.4. Clinical Study Validation
Diabetic foot ulceration is a major complication of diabetes, and diabetic patients have up to a 25% lifetime risk of developing a foot ulcer. If untreated, diabetic foot ulcers may become infected and require total or partial amputation of the affected limb. Changes in the large vessels and microcirculation of the diabetic foot are important in the development of diabetic foot ulceration and subsequent failure to heal existing ulcers. Greenman et al. [
34] used an HSI system to investigate the haemoglobin saturation (HbO2) in the forearm and foot. It was found that tissue SpO2 (or HbO2) was reduced in the skin of patients with diabetes. Khaodhiar et al. [
35] carried on a clinical study of 10 type 1 diabetic patients with 21 foot-ulcer sites, 13 type 1 diabetic patients without ulcers, and 14 nondiabetic control subjects. HSI predicted diabetic foot ulcer healing with a sensitivity of 93% and specificity of 86%. Tissue oxy- and deoxyhaemoglobin (HbO2-Hb) on the upper and lower extremity distant from the ulcer were used to quantify the tissue in the study. Yudovsky et al. [
36] reviewed how HSI between 450 and 700 nm could be used to assess the risk of diabetic foot ulcer development and to predict the likelihood of healing noninvasively. Two methods were described to analyse the in-vivo hyperspectral measurements. The first method was based on the modified Beer–Lambert law and produced a map of oxyhaemoglobin and deoxyhaemoglobin concentrations in the dermis of the foot. The second was based on a two-layer optical model of skin. It could retrieve not only oxyhaemoglobin and deoxyhaemoglobin concentrations but also epidermal thickness and melanin concentration along with skin scattering properties. In [
37], the aim is to compare temperature changes following a challenge of limb elevation, in 3 forefoot angiosomes between type 2 diabetes mellitus patients with and without peripheral arterial disease (PAD). Forty-two limbs were analysed. Mean resting temperatures of all angiosomes of participants with PAD were higher than those with no peripheral arterial disease. In [
19], the authors acquired plantar IR images of feet of 32 participants with a current or recently healed DFU with the smartphone-based FLIR-One and the high-end FLIR-SC305. The results show that the smartphone-based IR-camera shows excellent validity for diabetic foot assessment.
Although clinical experiments have been conducted regarding the diabetic foot case, the current studies are fragmented in the sense that each clinical study surveys only specific biomarkers of a diabetic foot. PHOOTONICS device properly combines hyperspectral sensing, operating at NIR, with thermal imaging and active illuminators. This allows for the extraction of a set of many biomarkers such as StO2; SpO2; temperatures differences; proteomics and water, air and blood flows. Thus, we will support a clinical validation study to verify which of the aforementioned biomarkers yield high precision and reliable results and which are less important for a diabetic foot disease progress. Furthermore, the study will be collaboratively conducted across three main hospitals, one in Germany, one in Romania and one in Greece, to show a generic framework regarding the analysis of a diabetic foot. Furthermore, hyperspectral imaging is non-invasive and noncontact and thus very well tolerated by patients, especially those with painful ulcers secondary to vascular disease. This fact provides advantages compared to existing contact-dependent modalities. The noncontact nature and the relatively long distance from the target vessel required for image acquisition makes it user friendly in the environment of surgical suites. The device to be developed will have two editions, one for an in-home use and one for an in-medical office use. Thus, we will promote a massive use of DFU monitoring and management to improve quality of life for the patients. In addition, the automated nature of the imager makes this modality less vulnerable to the inaccuracies possibly associated with more user-dependent technologies such as Doppler waveform analysis. Since HSI yields a 2D oxygenation, elastin, collagen map, useful local tissue perfusion information can be acquired in addition to the more general information inferred about arterial wall pathology as opposed to current point-measurement oximeters. The new sensor is noncontact, non-ionizing, provides medical assessment in real-time and is capable of modelling different pathophysiological issues of arterial tissues and measures factors and cellular tissues that are not detectable by other medical devices.
3. The Implementation Phases Used to Develop the Proposed Photonics-Based Device
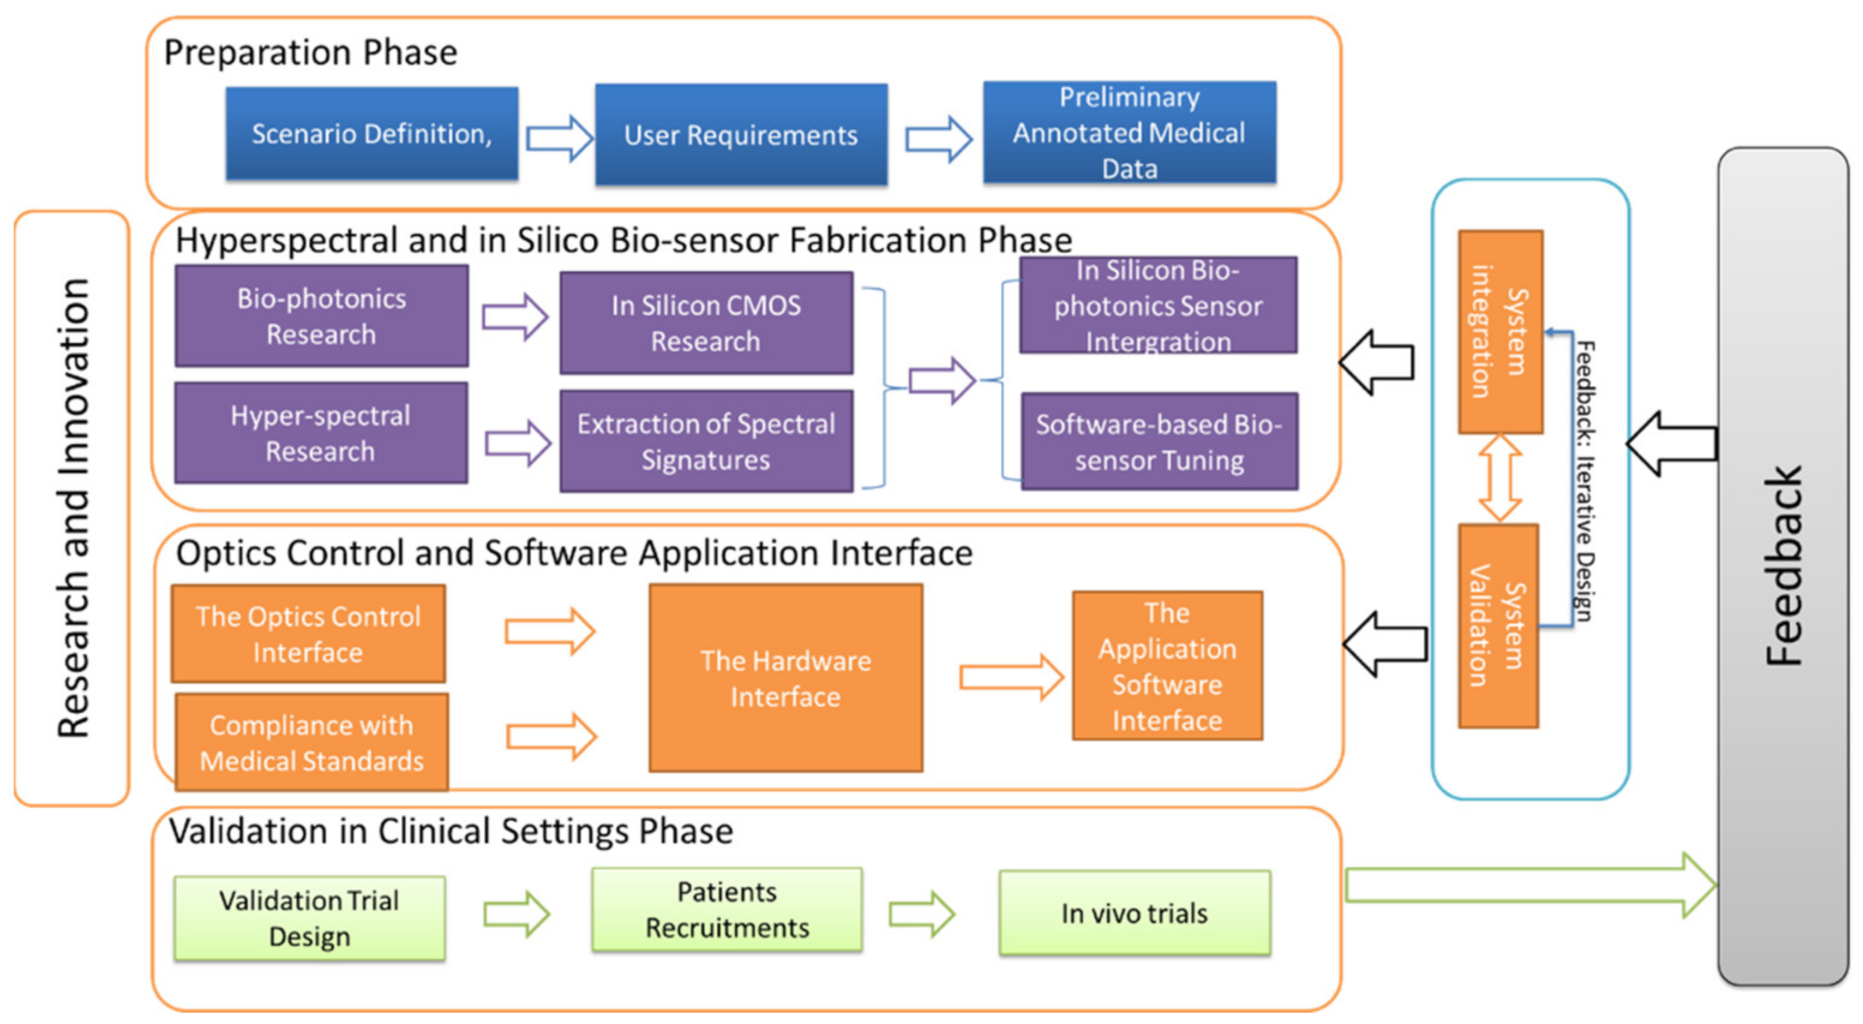
Figure 1 presents the main phases adopted in our work to implement the innovative device. The proposal includes five discrete phases, four needed for the implementation of the device and one acting as feedback between these four phases.
Preparation Phase: Our approach commences with the preparation phase. The outcome of this phase is the identification of the spectral fingerprints that are suitable for modelling vascular disease. As we expected, different application scenarios require different spectral signatures. Therefore, initially, the scenarios of the project are determined. For our specific cases, the diabetic foot ulcers are examined. In this scenario, the developed biosensor will analyse and monitor diabetic ulcers and diabetic skin properties expressed as the level of oxyhaemoglobin concentration, thickness and elastin. In this scenario, the biosensor is designed to capture tissue properties, through explosion and absorption to optical sources that are important for the progression, early diagnosis and assessment of a diabetic ulcer.
Preliminary experiments are first conducted including collection of data using high resolution hyperspectral sensors. The main purpose of the collected, annotated, hyperspectral data is to be analysed using hyperspectral imaging techniques, developed throughout the research and innovation phase. The goals of the algorithms are to unmix the captured whole spectrum and to extract spectral signatures (fingerprints) for the DFUs cases.
Research and Innovation Phase: The research and innovation phase consist of (i) hyperspectral research and (ii) bio-photonics research. Hyperspectral research aims at extracting the spectral signatures for the DFUs cases. The spectral signatures are provided using data unmixing, spectral information divergence and spectral angle mapper methods. The purpose of this research is to determine spectral similarity and dissimilarity. After the definition of the spectral signatures, each appropriate for a specific application scenario, the development/selection phase of the in-silicon biosensor commences. The objective of this phase is to fabricate a low cost, efficient and reliable in silico biosensor with the capability of capturing tissue pathology based on scattering and absorption events of the light as enters biological tissues. The biosensors are properly designed, selected and fabricated to be suitable for diabetic ulcers.
Hyperspectral and in silico biosensor fabrication: Although hyperspectral image analysis methods have been intensively investigated in the remote sensing area [
38,
39], their development and application in medical domain lag far behind. The relationships between spectral features and underlying biomedical mechanisms are not well understood. The purpose of this research aims to find out the main correlations between the extracted low-level features and the high-level medical factors, affecting the early diagnosis and vascular disease progress. Bio-photonics research is conducted to fabricate/select a low cost, high-SNR and reliable silicon biosensor sensor and optimize its application for DFUs disorders. Several methods, such as active tuning, driving and modulation, are expected to be added to enhance the performance of the biosensor spectrometer device and to realize in CMOS mass fabrication. The final stage of this phase is the application of software image-based processing algorithms for reducing the noise of the fabricated sensor and therefore increases its performance.
The Optics control and software application interface: In this phase, the optics interface of our biosensor is integrated. In particular, the fabricated hyperspectral sensor of the previous phase will be attached to an already certified imaging system, which provides a light of light spectrum wavelengths onto the subject. Furthermore, an imaging head is developed which will provide a hyperspectral cube of multiple wavelengths (40 +) at a high resolution (10nm bands). Additionally, in this phase, the software application interface is incorporated. This deals with the development of a software package able to act as an interface between the users (e.g., biosensor clients) and the device.
Validation in Clinical Settings Phase: In this phase. the developed biosensor device and the developed devices are evaluated under real-life application conditions. Validation covers both sensitivity and specificity of the device and the assessment of it under real-life conditions. Experimentation is carried out using a number of patients. The outcome of this stage is identification of possible limitations of the biosensor, acting as feedback to the previous stages in order to improve configuration of the sensor, the application interface and the overall operation of the system.
4. Description of the Clinical Indices to Quantify Diabetic Foot Ulcers and Based on Them Selection of the Sensorial Components of Our Device
In this section, we first describe clinical indices which are useful to quantify and measure diabetic foot ulcers (see
Section 4.1), and then, we describe the main sensors installed in our device and the two editions that we support (see
Section 4.2). As far as the clinical indices are concerned, these are derived from medical studies and a meta-analysis on diabetic foot ulcer management from the three hospitals collaborated in the implementation of our device. We recall that the collaborated hospitals are the Charité–University Hospital in Berlin, Germany; Attikon University Hospital in Athens, Greece; and the Victor Babes Hospital in Timisoara, Romania. Regarding the sensors needed to be installed in our device, these are selected in a way to capture the quantified measurements of the clinical indices.
4.1. Description of the Clinical Indices Used to Select the Sensorial Components
For selecting the sensors needed to be installed in our device, initially a medical meta-analysis study has been carried out in our project [
15] The goal of the meta-analysis is to identify the factors that influence the generation of an ulcer in the foot and conclude to particular indices which can quantify the stage and the penetration of an ulcer in the foot.
Table 1 shows the indices our device needs to address from a medical point of view perspective. As can be see, important factor are the temperature of the foot and the difference of the temperature across the feet, the arterial perfusion, the oxygenation and saturation of the skin of the foot, the plantar pressure distribution across the foot, skin and subcutaneous tissue biochemical composition and the visual investigation of a foot through images, investigation of the site of infection, cracks, fissures, detections of ulcers and necrosis and the footprints. Based on these indices, the sensors needed to be installed in our photonics-based device are defined and their technical specifications are described in
Section 5. Each sensor specification is categorized for the each of the two editions of our device.
4.2. Description of the Two Proposed Editions of Our Device: The In-Home (HOME) and the Professional (PRO) Edition
As we have stated in
Section 1, our photonics-based device for diabetic foot ulcer (DFU) detection is implemented using two different editions. The first (HOME Edition) is to be used by the patients in their own homes, and thus, it includes affordable and easily utilizable sensors. The second (PRO edition) is to be operated by physicians either in their own offices or in the hospitals. Thus, this PRO edition exploits more expensive sensor components resulting in high precise results regarding DFU detection.
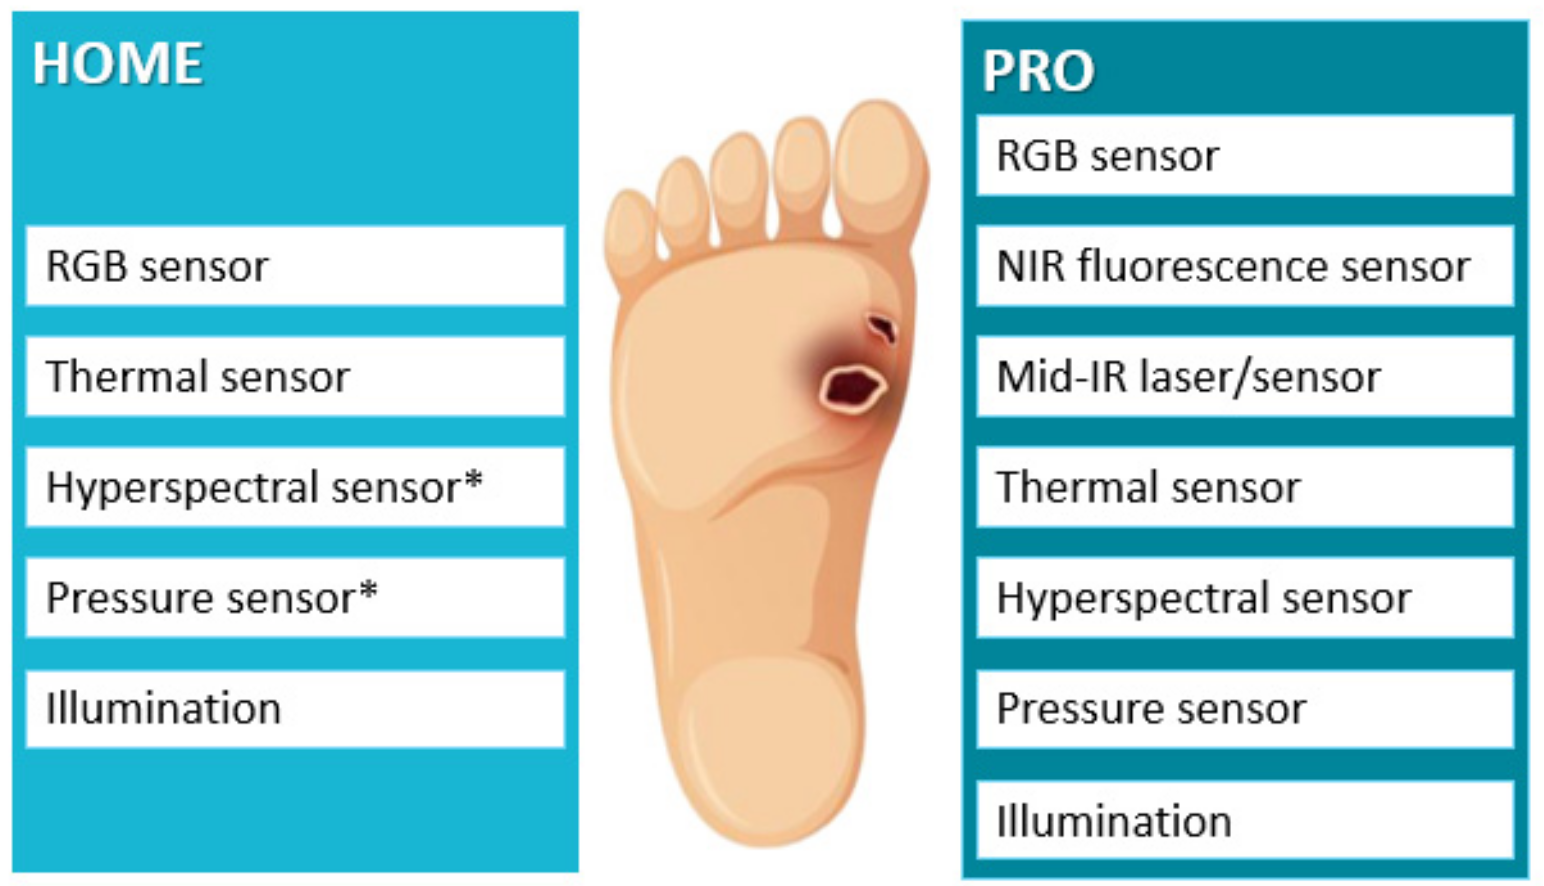
Figure 2 describes the sensorial components for each edition of our device.
Sensors Embedded for the In-Home (HOME) Edition: This edition includes (a) an RGB sensor, (b) a thermal sensor and potentially (c) a hyperspectral (using a low-cost hyperspectral sensor) and (d) a pressure sensor. Appropriate illumination of light sources is also supported for all these sensors to give accurate quantified results. The efficacy and effectiveness of all sensorial components of our device will be clinically evaluated. The hyperspectral and pressure sensor are indicated with a star (*) since their final inclusion in the HOME edition will depend on the results of the clinical trials which will be executed at the three collaborated hospitals (Charité–University Hospital, Berlin, Germany; Attikon University Hospital in Greece and Victor Babes in Timisoara, Romania) on a randomized group of recruited patients. The trials will be conducted taken into account all clinical requirements and ethics rules and will last for at least one and a half year. Other reasons that will affect the inclusion or not of the hyperspectral and pressure sensor in the in-home device edition will be the final price of the product and the usability of these devices for non-expert or older patients.
Sensors Embedded for the Professional (PRO) Edition: The PRO version is dedicated for physicians at their offices or at hospitals. It enhances the in-home version by including, apart from the five in-home components that is, the (a) RGB sensor, (b) thermal sensor, (c) pressure sensor, and (d) hyperspectral sensor (using an advanced hyperspectral sensor instead of the low-cost employed in the HOME edition), two additional components the (f) Near Infrared fluorescence sensors and (g) the Mid Infrared (IR) laser/sensor. Appropriate source lighting is also supported (illumination component). Again, all the sensorial components of the PRO edition will be clinically evaluated at the three collaborated hospitals.
In the following, we describe the technical specifications for each of the sensorial component of our device. The description is divided into two parts; the common sensorial components for both editions of our photonic-based device, that is, the in-home and the professional one and the extra components employed only for the professional edition. In all cases, the technical details are justified and derived by actual medical requirements as suggested by the three hospitals (Charité–University Hospital, Berlin, Germany; Attikon University Hospital in Greece and Victor Babes in Timisoara Romania) involved in the design and implementation of the proposed photonics-based device for detecting DFUs.
5. Technical Specifications of the Sensorial Components of the Proposed Photonics-Based Device
In this section, we describe the technical specifications for all the sensorial components embedded into the developed photonics-based device for diabetic foot ulcer detection. Initially, we discuss and analyse the technical specifications for the common sensors of both editions, HOME and PRO, (see
Section 5.1) and then the technical specifications of the advanced sensors utilizing only for the PRO edition (See
Section 5.2). We should state that the hyperspectral sensor (HSI) is used in two forms, one as a snapshot potentially to be employed for the HOME edition and one as snapscan employed for the PRO edition. The specifications of each HSI sensor are discussed in the respective section.
5.1. Technical Specifications for Common Sensors Employed for the HOME and PRO Editions
In this subsection, we analyse and justify the technical specifications for common sensors (RGB, thermal, hyperspectral, pressure employed both for the in-home (HOME) and the professional (PRO) edition).
5.1.1. RGB Sensor Technical Specifications
The goal of the RGB sensor is to capture colour images of the foot which are, in the sequel, analysed to detect regions of an ulcer. The RGB sensor is able to detect an ulcer region only if the ulcer has been progressed to be visibly detectable by an RGB camera. In addition, this sensor can identify complications that an ulcer can cause in a foot. A very cheap led-based RGB sensor is employed in our device of white light source. The size of the sensor is tiny so as to be easily embedded in the HOME edition of our device. The captured images will be in the common RGB format. The goal of this sensor is to quantify the last index of
Table 1 (i.e., index 6) which assesses the image of a foot, the site of infection, existence of potential cracks, fissures, ulcers, necrosis and footprints. A simple RGB sensor of resolution 1024 × 756 is selected.
5.1.2. Thermal Sensor Technical Specifications
InfraRed Thermography (IRT) is very useful for diabetic foot ulcer detection as discussed in
Section 2.2. IRT is a non-invasive, contactless diagnostic technique in which a thermal imager, i.e., a long-wave infrared (LWIR, 8–12 µm) camera, is used to measure the temperature at the surface of the foot in order to detect small temperature differences between a foot region and the same region on the contralateral foot. In particular, clinical studies have proven that a temperature difference of about 2 °C in a foot may be due to diabetes problem [
17,
18].
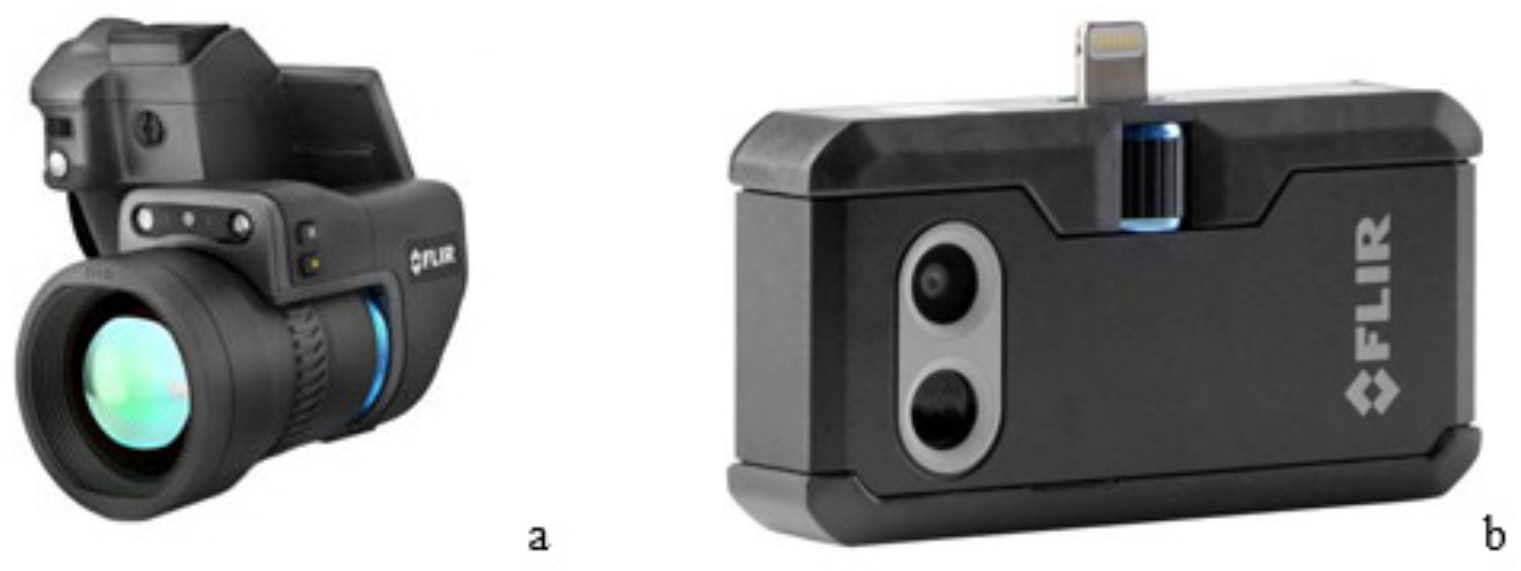
In our device, we use the commercial product of FLIR thermal cameras (
Figure 3) for the acquisition of thermal differences in feet suffering from diabetic foot ulcers. In particular, two different types of cameras have been selected. The first is the FLIR T1030SC camera of high sensitivity adopted for the PRO edition while the second is the FLIR ONE PRO thermal camera chosen for the in-home edition. These sensors are used to quantify the first index of
Table 1 dealing with foot temperature.
The technical specifications for the FLIR T1030SC camera are
HD-Quality Thermal Imaging at 1024 × 678 pixels;
Thermal Sensitivity (NETD) of < 20 mK—more than twice as sensitive as the industry standard. The T1030sc picks up on even the smallest differences in temperature;
FLIR OSX Precision HDIR Interchangeable Lenses—you can swap out the lens and gain high fidelity thermal images with accurate thermal measurements at any focal length;
FLIR’s Vision Processor delivers smooth, detailed imagery with thermal and digital image blending (FLIR MSX) the ability to enhance thermal images to even higher levels of detail using software with FLIR’s UltraMax mode;
Fast 30 Hz Frame Rate—smooth images, even when moving;
Ultra High Accuracy of ± 1 °C—the highest accuracy out of all products available in FLIR’s scientific range;
The technical specifications for the FLIR ONE PRO thermal camera are
Dimensions (H × W × D): 68 × 34 × 14 mm (2.7 × 1.3 × 0.6 in);
Non-Operating Temperature: −20–60 °C (−4–140 °F);
Phone: Android (Micro-USB);
Scene Dynamic Range: −20–400 °C (−4–752 °F);
Weight: 36.5 g.
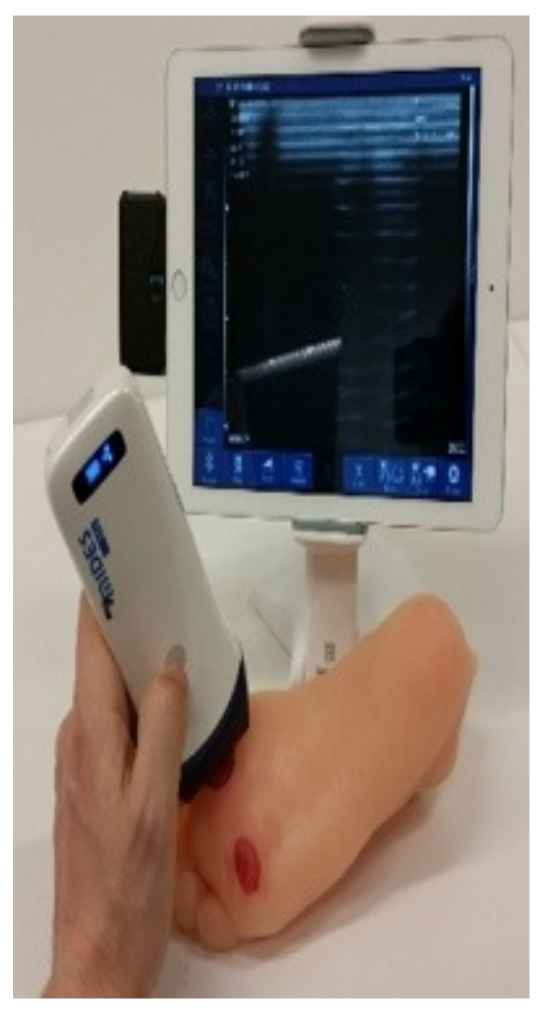
The measurement setup consists of a thermal imager pointing directly at the patient’s feet and taking a full temperature map in a single snapshot. Based on difference in measured temperature, the potential areas that are at risk for developing an ulcer can be indicated and therefore potentially prevent the onset of diabetic foot ulcers.
Figure 4 shows the interface and the thermal camera used by our device for diabetic foot ulcer detection.
5.1.3. Hyperspectral Sensor (HSI) Technical Specifications
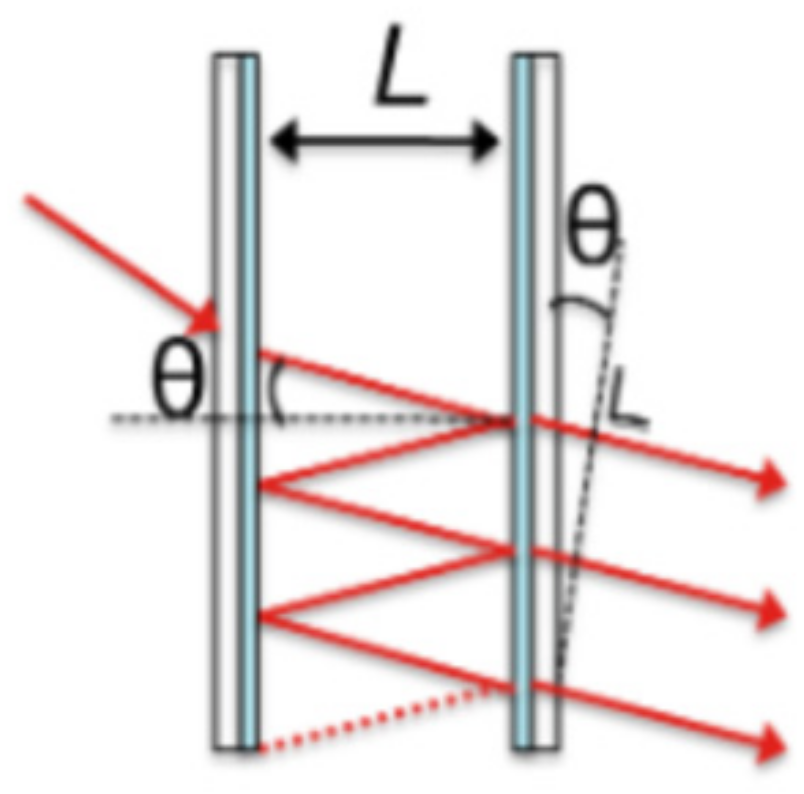
Hyperspectral (HSI) Sensor based on Fabry–Pérot Structures: The hyperspectral sensor used for our device has been manufactured by IMEC R&D hub for nano- and digital technologies in Belgium. The sensor is based on Fabry–Pérot structures. Such structures consist of two reflective surfaces with a cavity between them, as shown in
Figure 5. Simplified, the filter transmits wavelengths satisfying the equation
where
L equals the thickness of the cavity between the two mirrors,
θ equals the angle of the light inside the cavity,
n equals the refractive index of the material in the cavity,
λ equals the central wavelength of the filter, and
k equals the order of the harmonic. Equation (1) shows that given a certain thickness
L and refractive index
n, the transmission of the filter also depends on the angle
θ of the light inside the cavity, which is directly related to the chief ray angle (CRA) and the cone angle of the optical system; the harmonic number
k of the wavelength for which it is designed. Since the angular dependence is introduced through a cosine, the response is relatively insensitive to small angles of incidence.
Snapshot Hyperspectral Sensors: We integrate the hyperspectral (HSI) sensor into two categories of camera systems:
snapshot HSI cameras and the
snapscan HSI cameras. The snapshot camera system is to be used for the in-home edition and is detailed in this section (
Section 5.1.3). The snapscan HSI camera is to be used for the PRO edition and is detailed in
Section 5.2.2.
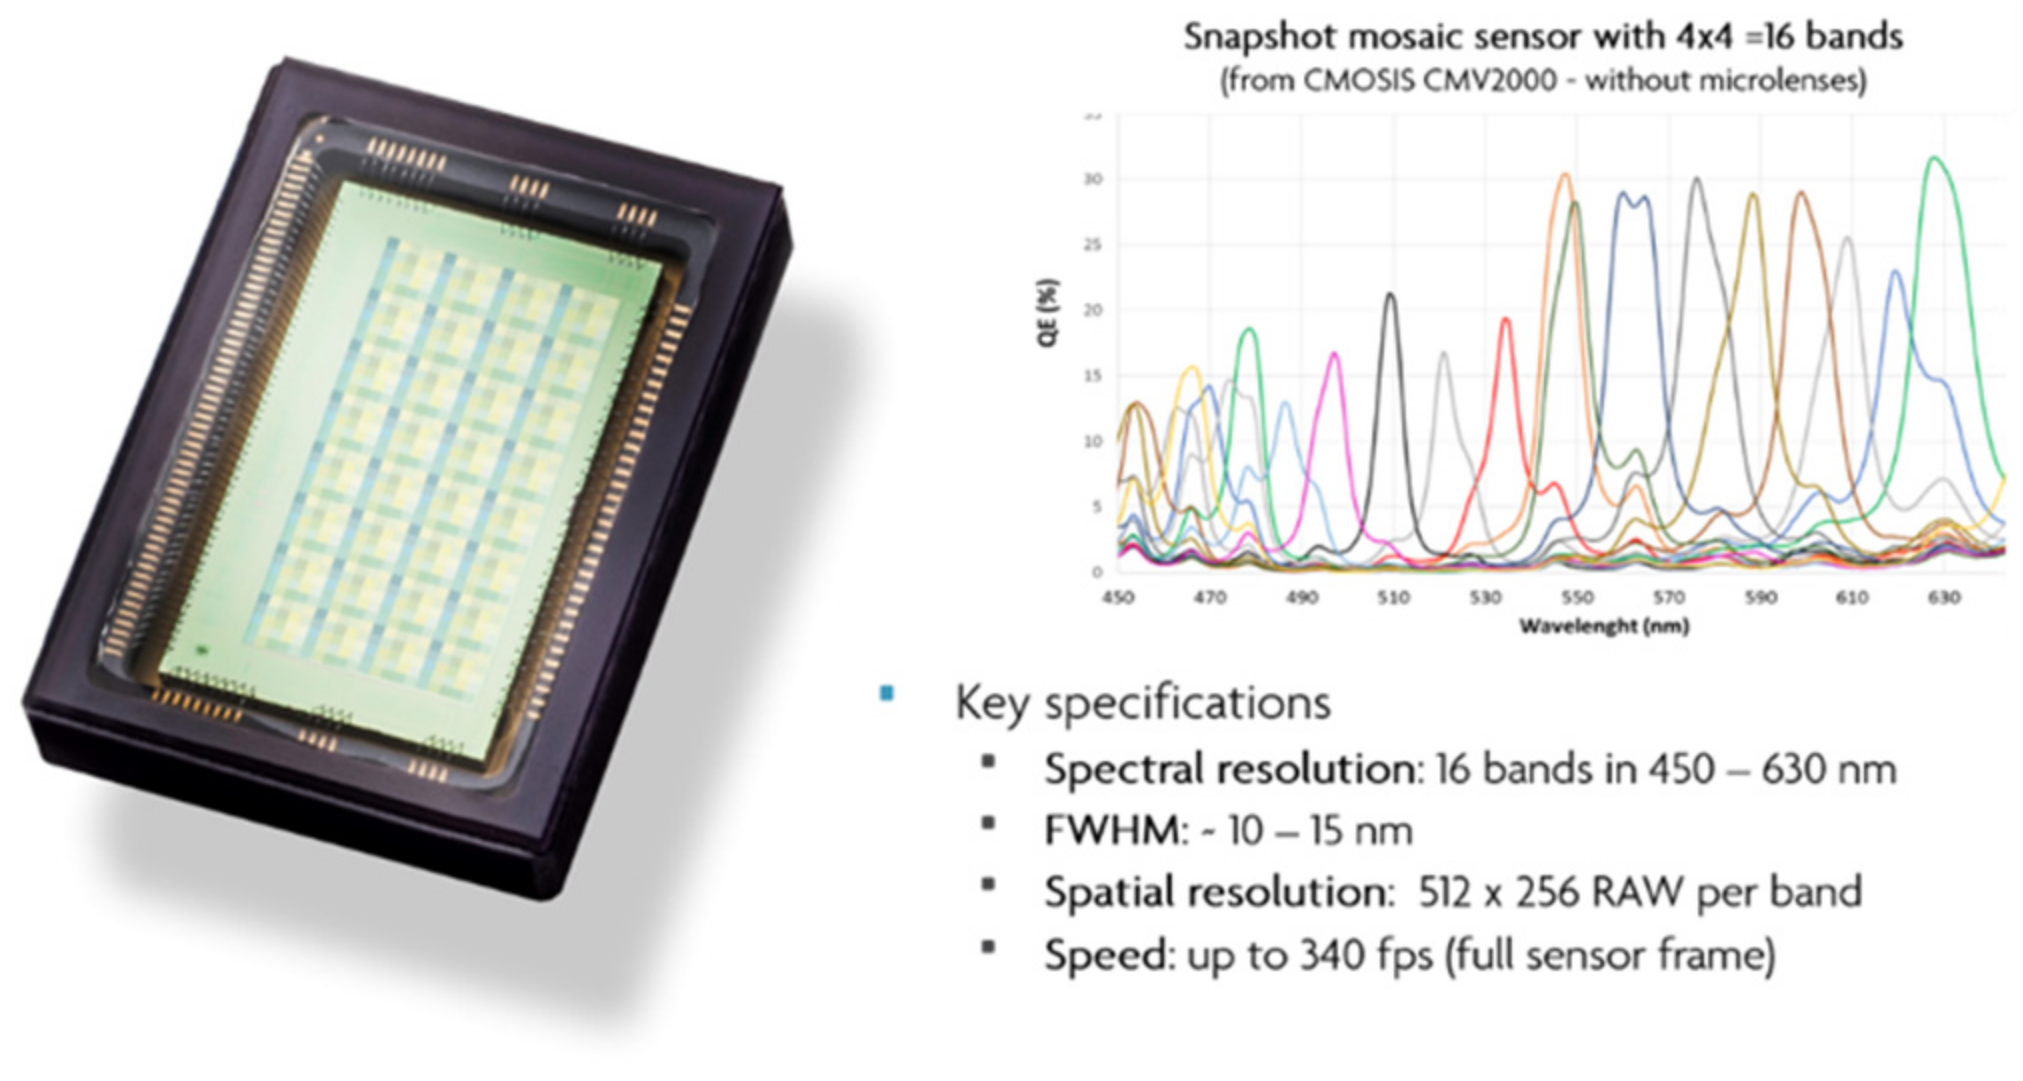
Snapshot HSI sensor sacrifices spectral and spatial resolution to achieve video-rate HSI in up to 25 spectral bands. The range of snapshot cameras each contain a spectrally resolving sensors where spectral filters are deposited in a mosaic pattern across the sensor’s pixels. The full HSI data cube can, therefore, be extracted from a single frame. Examples of spectral response curves of our HSI sensors are depicted in
Figure 6.
To manage an appropriate detection and diagnosis of DFU, sensors with the following active ranges are considered suitable in the scope of diabetic foot ulcer detection: 460–620 nm (snapshot; 16 spectral bands), 665–975 nm (snapshot; 25 spectral bands), 595–860 nm (snapshot; 16 spectral bands).
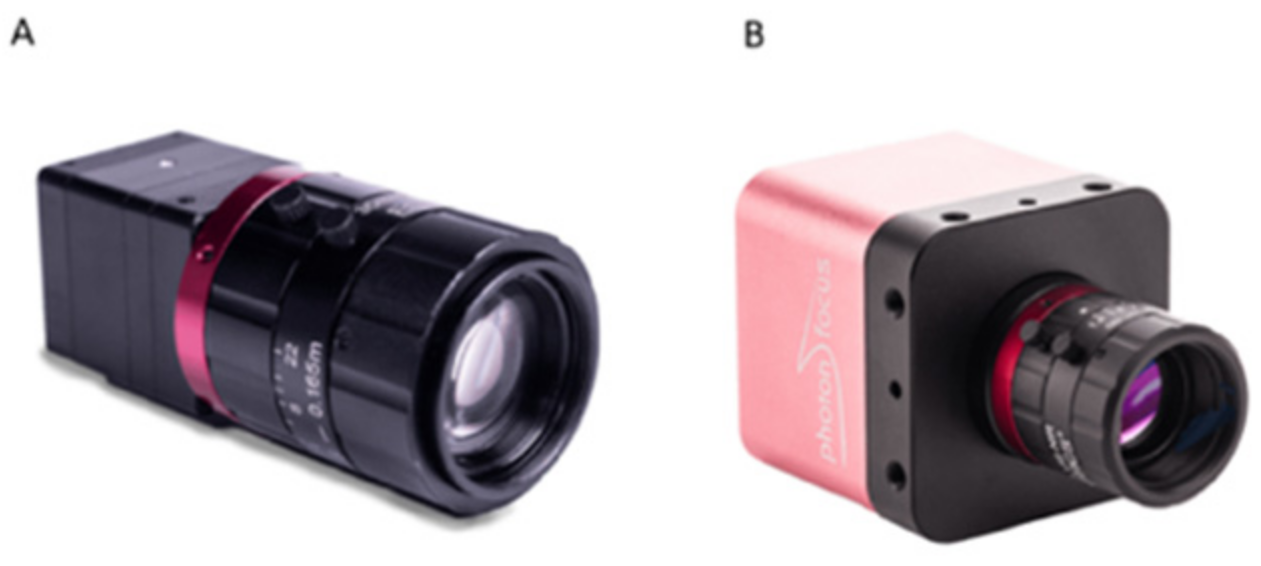
The snapshot sensors are made independently or pre-integrated into Ximea/Photonfocus cameras (see
Figure 7). These camera systems include band-pass filters to remove second order harmonics in the spectral sensors. As for any camera system, the Field of View (FOV) covered by the snapshot cameras is a function of the sensor and the objective lens used with the camera. As such, the snapshot cameras allow for non-contact large FOV HSI measurements. Since the standard data acquisition flow acquires reflectance based HSI data, the quality of the spectral data acquired with these cameras is a function of the scene illumination and the spectral transmission of components placed in the optical path of the camera (e.g., lenses, band-pass filters and any potential cover-glass used in the design of the proposed photonics-based device). The HSI sensor is used to quantify the third index of
Table 1 dealing with skin oxygenation and saturation and the last index of
Table 1 leading with a visual assessment of the foot status. As we have stated in
Section 4.2, HSI is implemented for the PRO edition, while its usage for the HOME edition will depend on the results of the clinical study and the total cost of the device. That is, it will be a trade-off of precision improvement and cost.
5.1.4. Pressure Sensor Technical Specifications
Regarding the pressure sensor, our device uses the pressure mapping sensor from Tekscan. This sensor is based on tactile array sensors (ultra-thin pressure-sensitive resistors). By situating these sensors in the mat, they can measure the pressure between two surfaces (e.g., the foot and the floor). The sensor consists of intersecting rows and columns of conductive material. At each intersection, there is a layer of pressure-sensitive material. As pressure is applied to the sensing area, the resistance of the pressure-sensitive material changes. Scanning electronics connected to the sensor collects and converts this resistance change into a digital signal, which is then transmitted to a computer for real-time analysis. The pressure sensor will be part of the PRO-version of the system. Depending on the pricing and usability of the system, the pressure sensor will potentially be part of the HOME-version. This index is used to quantify the fourth index of
Table 1 dealing with the plantar pressure distribution over a foot. Again, as we have stated in
Section 4.2, the pressure sensor will be included in PRO edition of our device, while for the HOME edition, its usage will depend on the results of the clinical trials and the final cost.
We select the Tekscan pressure sensor used for biomechanics applications, a low-cost pressure sensor for selected for the HOME edition. The sensor is ultra-thin, and it provides dynamic pressure, force and timing information for foot function and gait analysis. The pressure range is from 0.1 to 200 PSI (0.007 to 14.1 kg/cm2). The matrix size is up to 64 × 256 lines, the accuracy range is ± 10% and the repeatability ± 2%. For the PRO edition, a more reliable pressure sensor can be used with higher pressure range and accuracy up to ± 2%.
5.2. Technical Specifications for Sensors Only Employed in the PRO Edition
5.2.1. Mid-Infrared Hyperspectral Imaging Technical Specifications
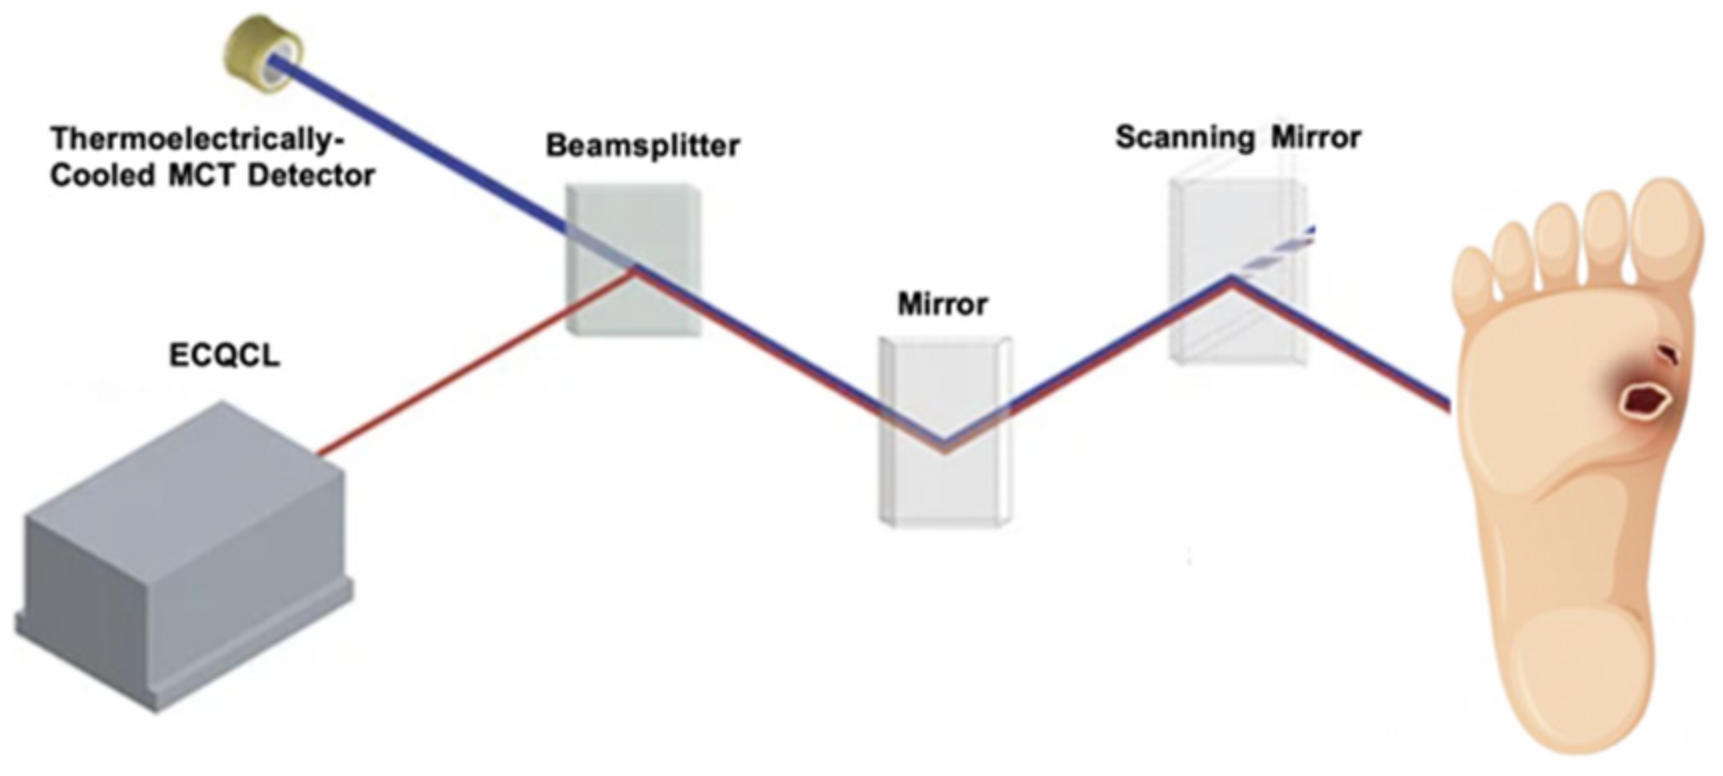
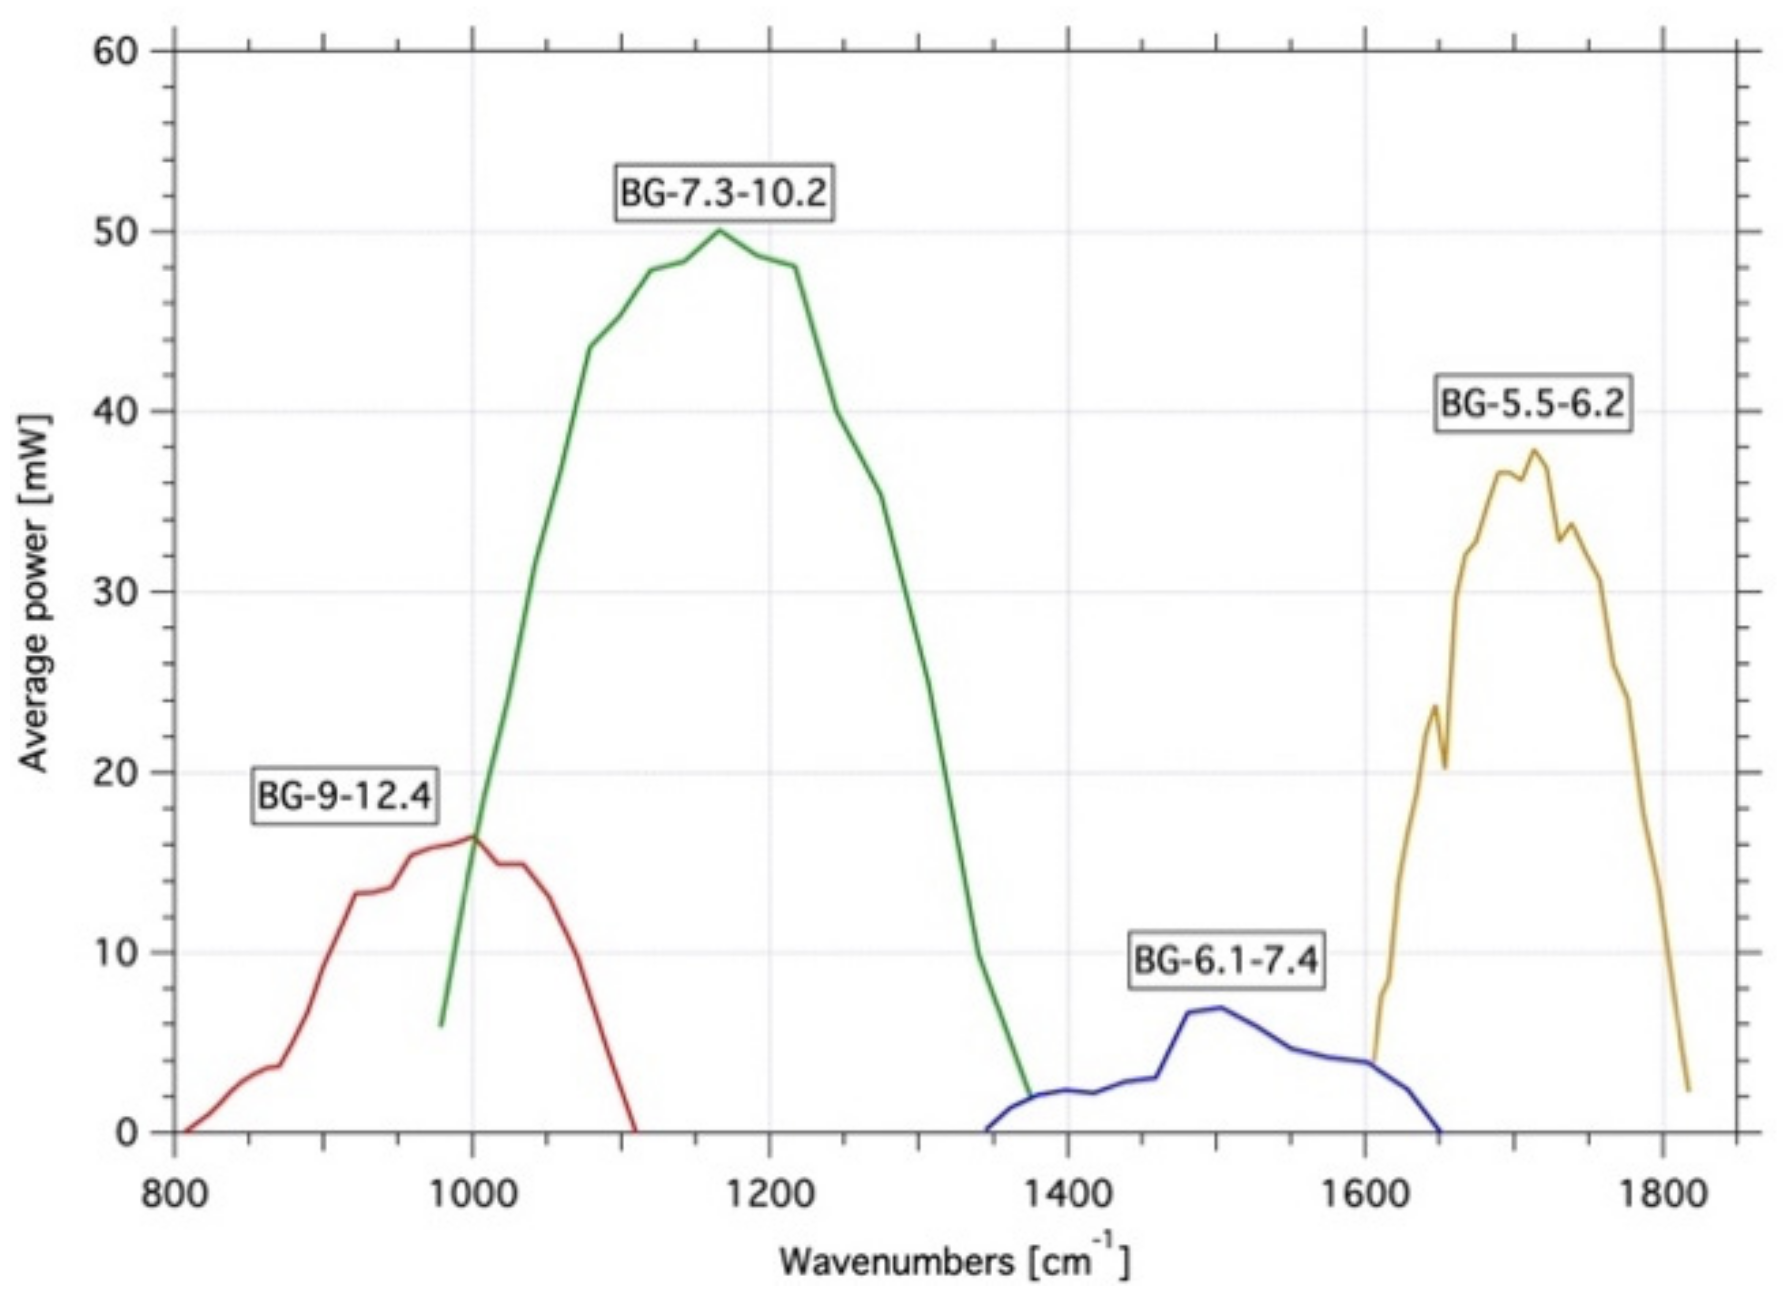
Hyperspectral imaging of the patient’s feet in the mid-infrared spectral region, which is often referred to as the “molecular fingerprint” region of the electromagnetic spectrum, allows the detect the presence and quantify the concentration and the spatial distribution of several biomarkers including elastin, collagen, glucose and water. We propose to use broadly tuneable mid-infrared external cavity quantum cascade lasers (ECQCLs) to perform laser direct infrared (LDIR, see
Figure 8) spectroscopy of the patient’s feet. In this method, the beam of the tuneable laser is scanned the sample surface, in this case the patient’s feet, and the intensity of the reflected beam is measured by point detector. To maximize the sensitivity, we will use a thermoelectrically cooled mercury-cadmium-telluride (MCT) detector.
Since the relevant biomarkers have strong and specific spectral features in the 5.5–12.4 µm range (835–1780 cm
−1), we selected four lasers whose combined tuning curves cover this range without gaps and with an average output power ≥ 2 mW. The details of the selected lasers are shown in
Table 2 together with an overview of the tuning curves in
Figure 9. These lasers are used to quantify the fifth index of
Table 1 that is the skin/subcutaneous tissue biochemical composition.
5.2.2. Snapscan HSI Sensor Technical Specifications
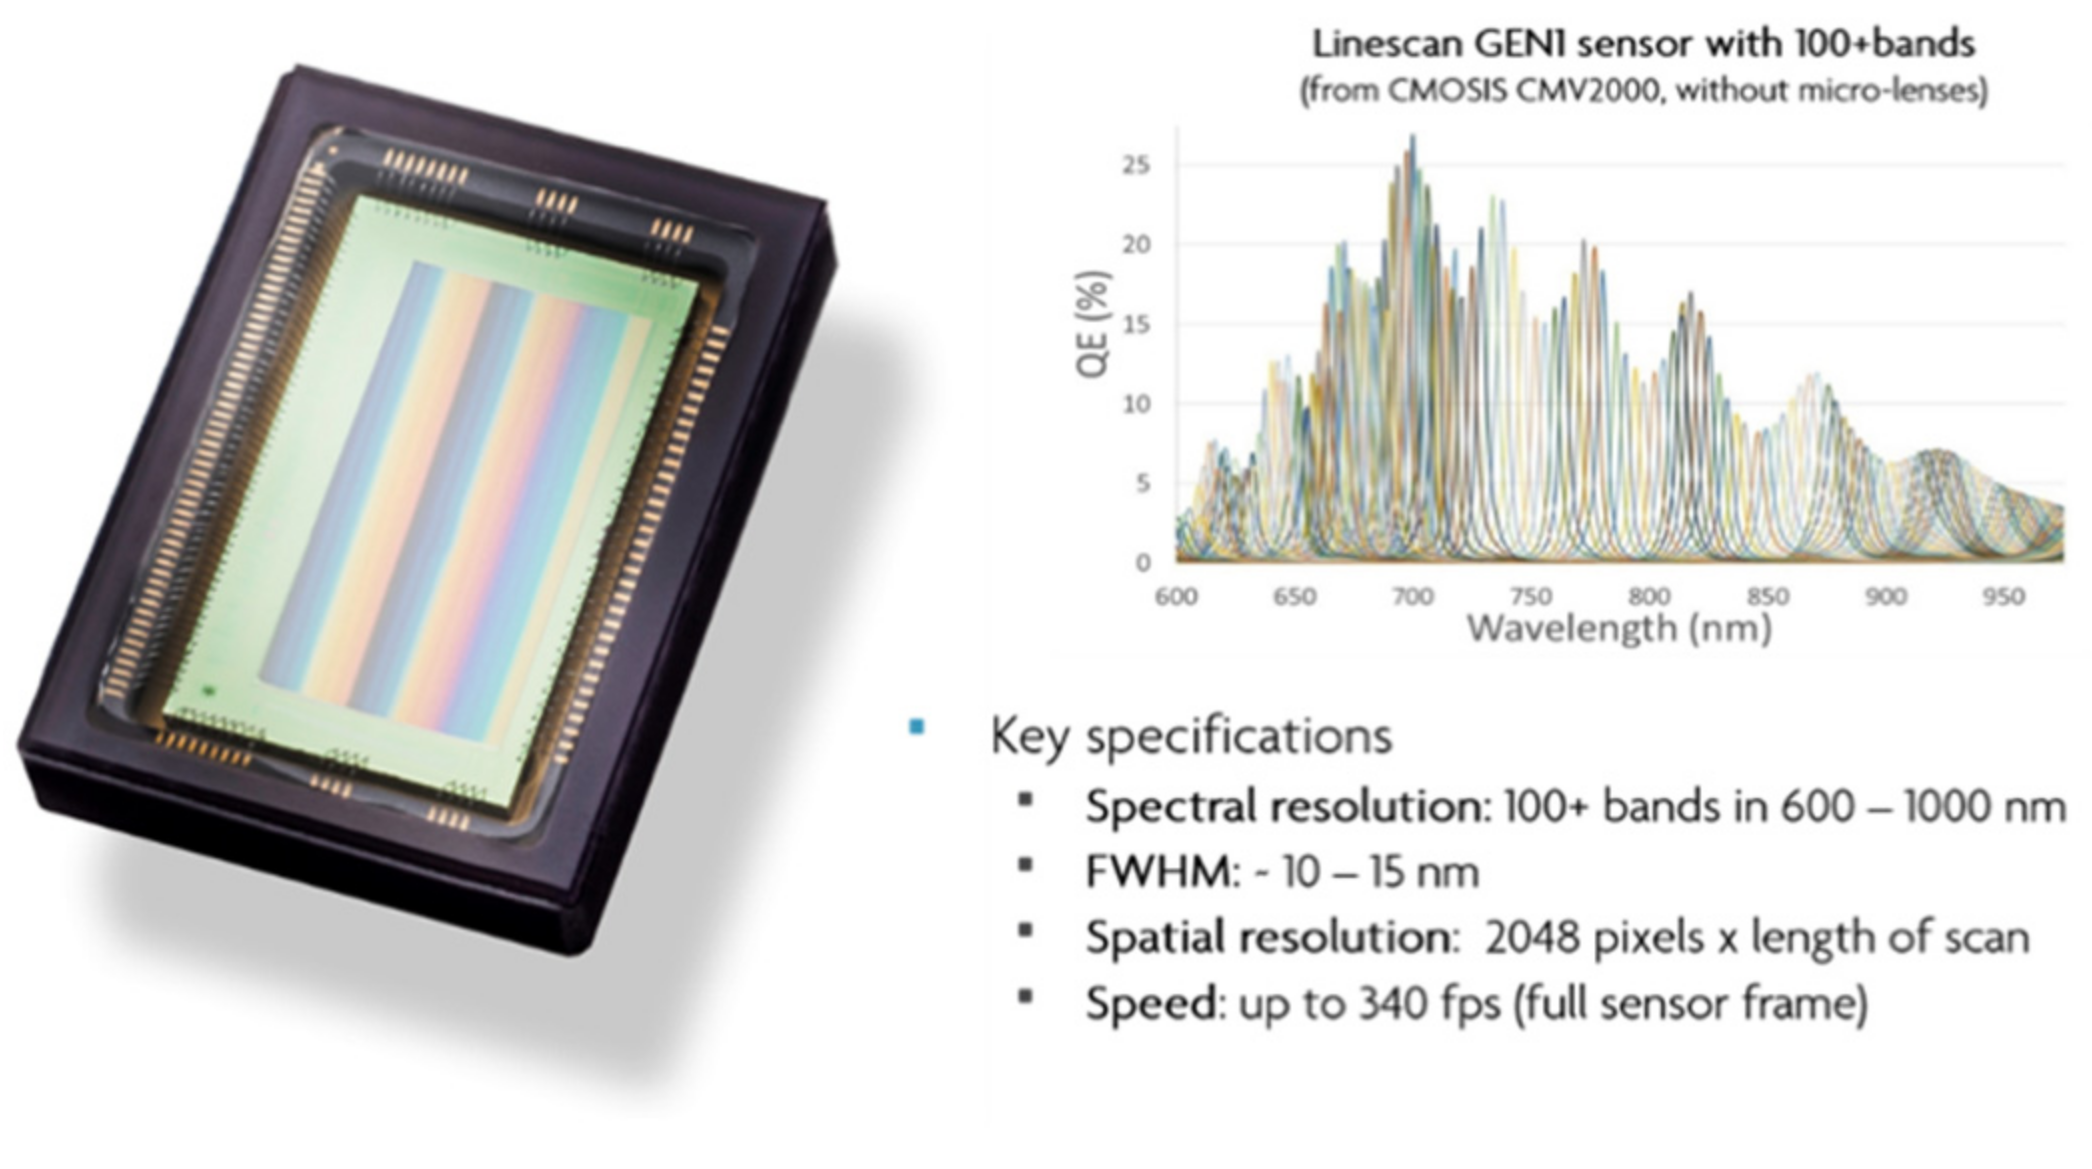
The snapscan HSI cameras exploit the relative motion between the camera’s sensor and the scene imaged to achieve high spectral and spatial resolution at the sacrifice of temporal resolution. An example is shown in
Figure 10. The spectral filters are deposited on pixel rows extending across the sensor. HSI data can be extracted by introducing relative motion between the scene imaged and the sensor. To cover the visible and NIR spectra, appropriate for detection and diagnosis of DFU, we select 470–900 nm (snapscan; 100 + spectral bands).
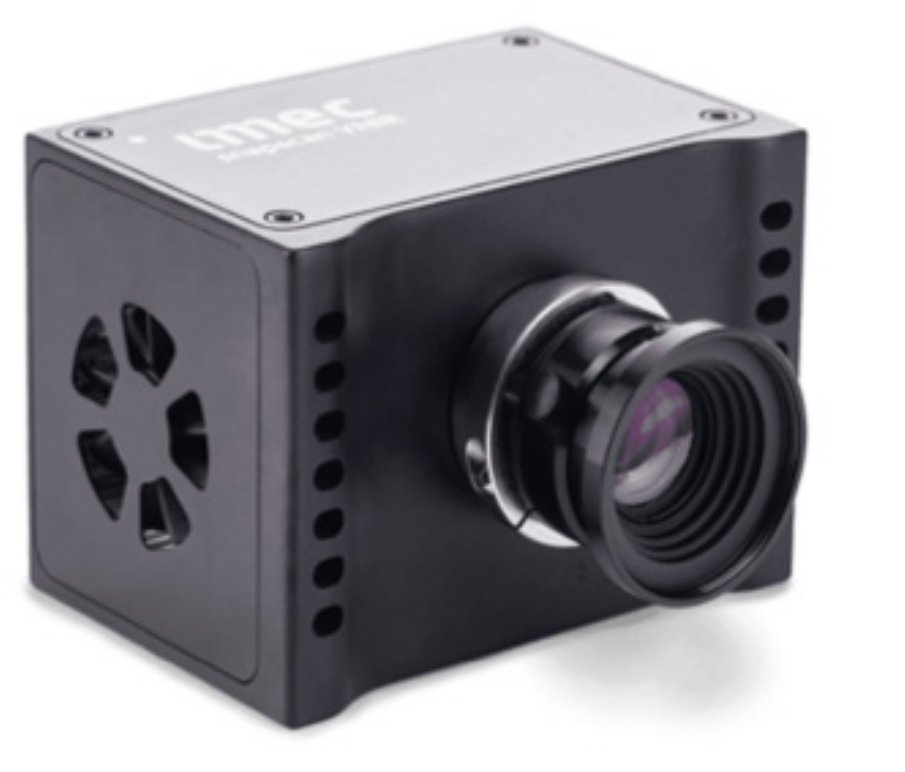
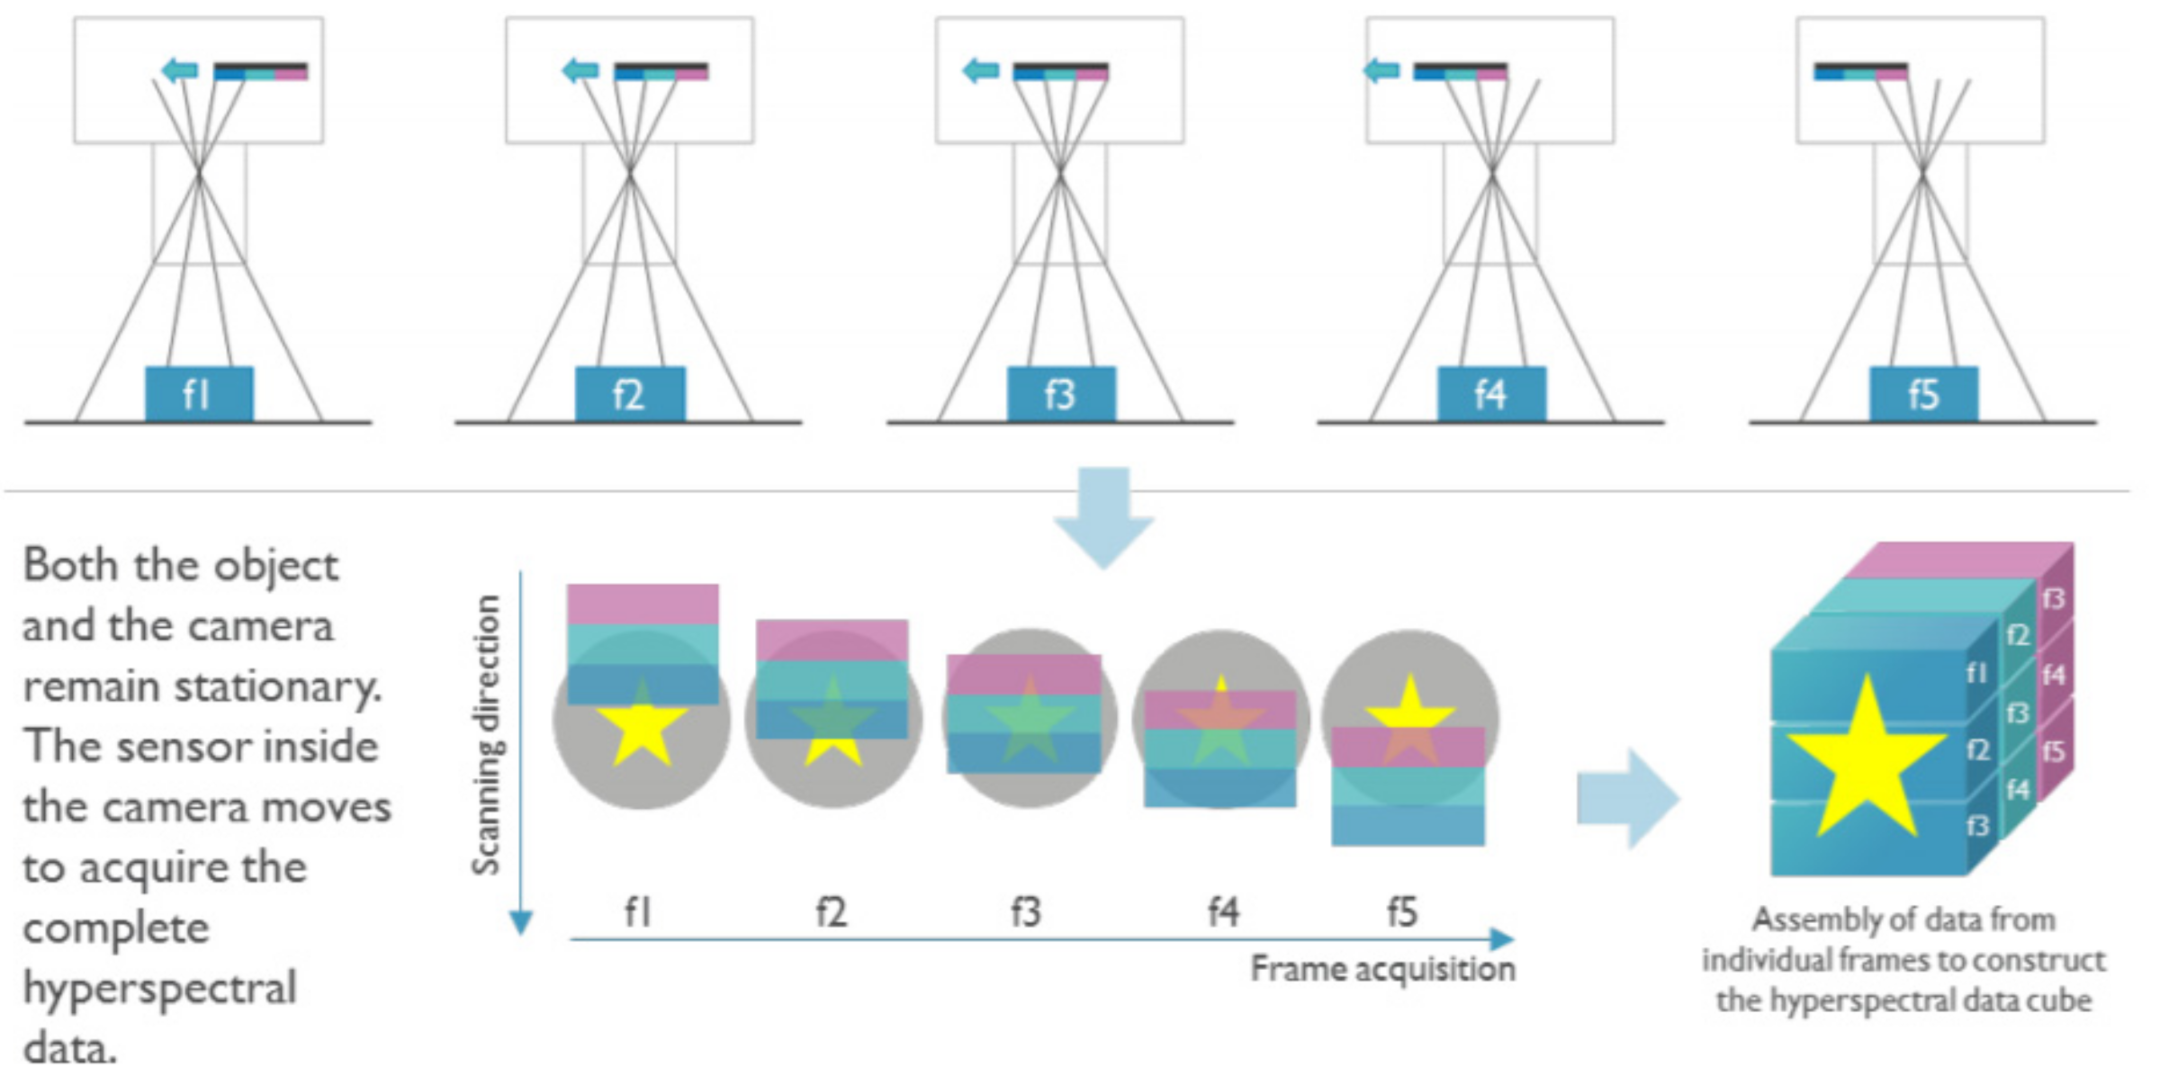
In our snapscan camera (see
Figure 11), both the object imaged and the camera remain stationery. The image sensor inside the camera and behind the lens moves linearly to scan the projection of the object on the image circle whilst both the object and the camera are kept still. The working principle is illustrated in
Figure 12. By stitching spectral band data from subsequently acquired frames, a full HSI data cube is reconstructed after the completion of the scan. By exploiting the translation of the sensor, the image circle accessible to the sensor is also expanded to 3650 × 2048 pixels at 5.5 um pitch. Snapscan technology thus yields an HSI data cube with high spatial and spectral resolution. The increased complexity of the technology does, however, yield an increased cost in comparison to snapshot cameras suggested for the HOME edition.
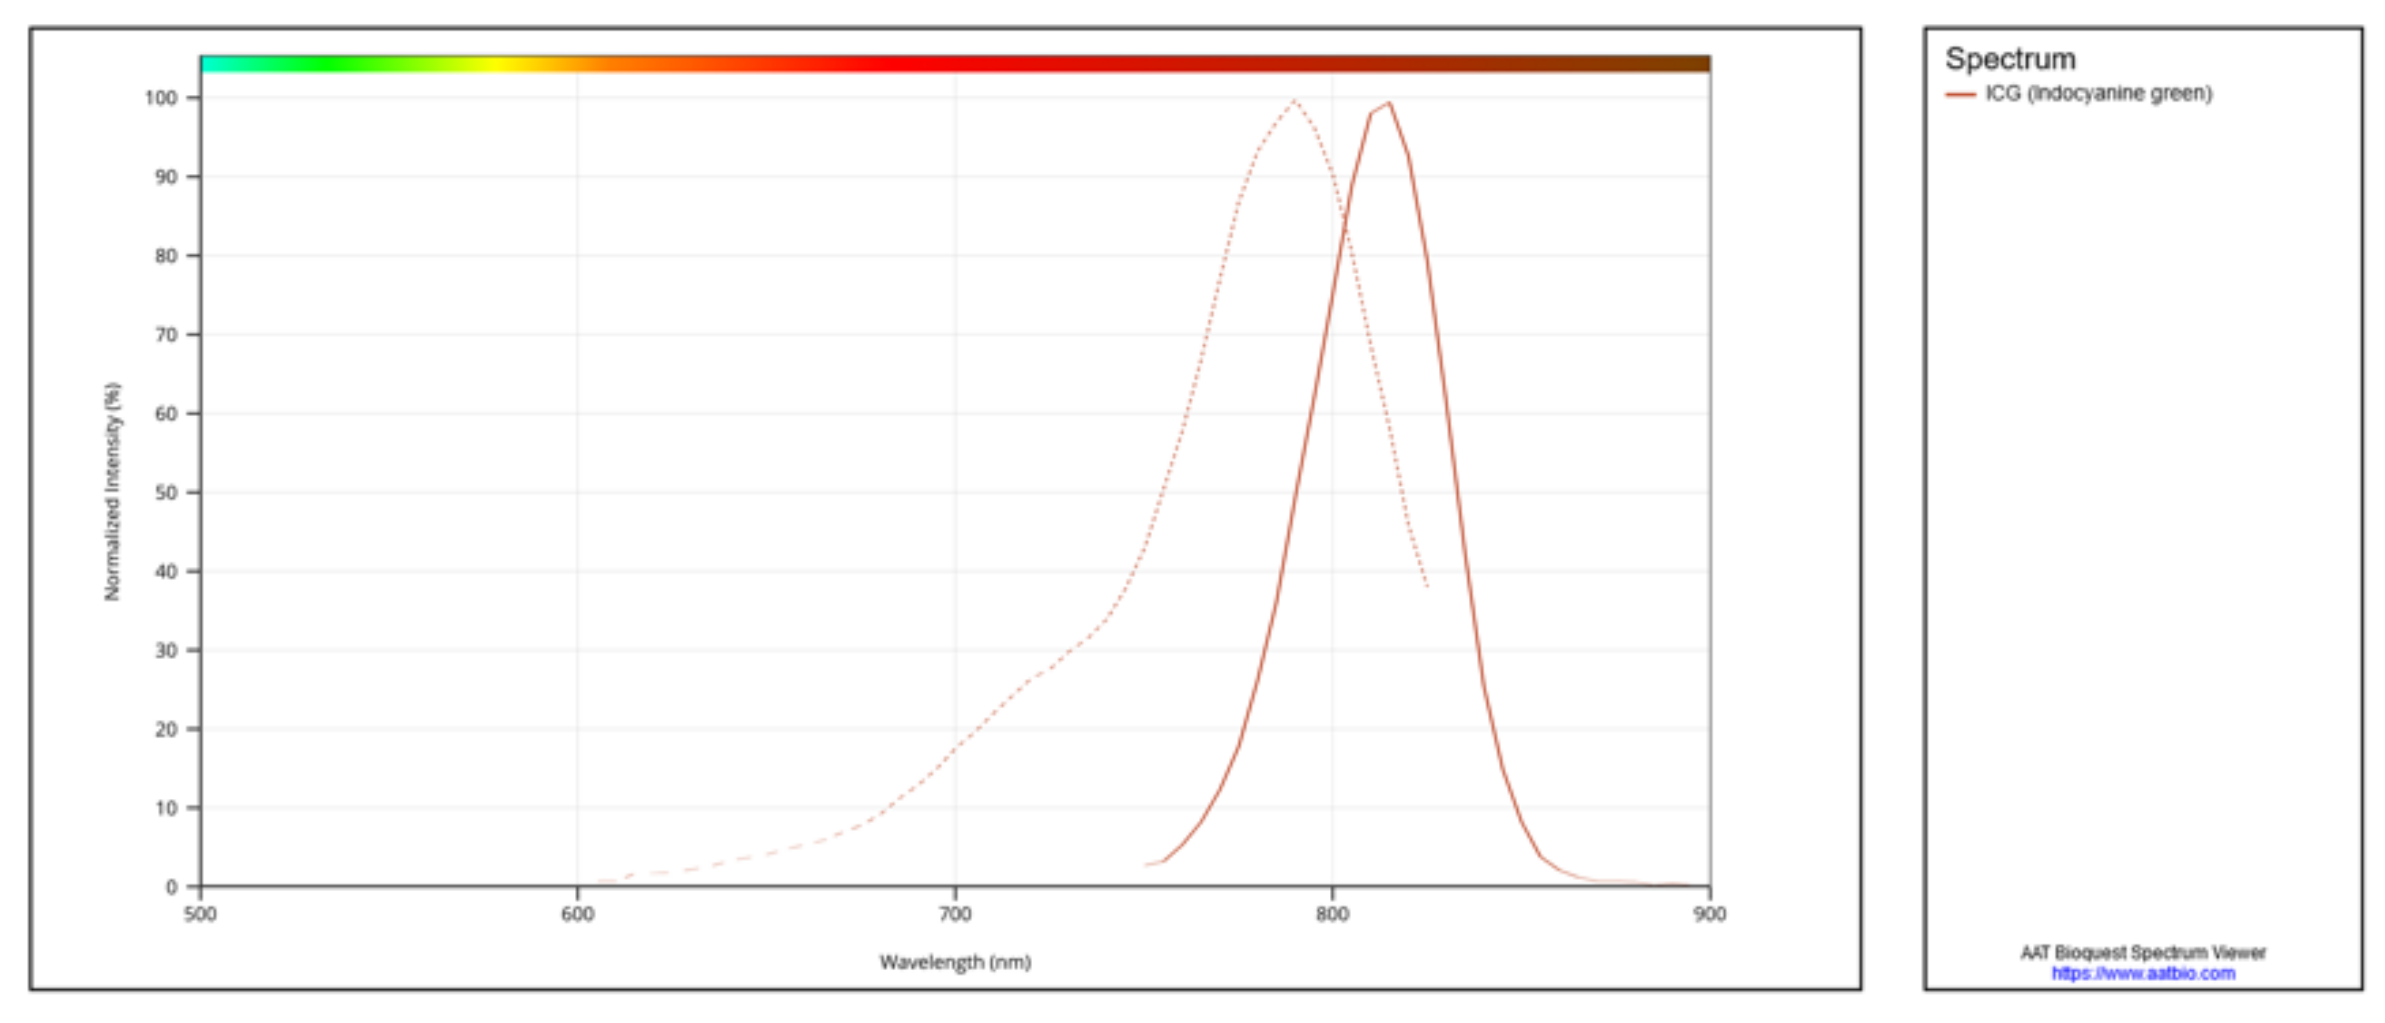
5.2.3. NIR Fluorescence and Colour Imaging Technical Specifications
Near infrared (NIR) fluorescence imaging is an image guided surgery technique where a fluorescent agent is injected in the patient to visualize perfusion related properties of tissue. Alternative applications are the use of a fluorescent dye for the localization of tumours or vital structures like the bile duct. The fluorescent dyes used in NIR fluorescence imaging are particular dyes with excitation wavelengths in the NIR wavelength range, an example is indocyanine green (ICG) with an excitation peak at 789 nm and emission peak at 814 nm as can be observed in the excitation emission spectrum in
Figure 13.
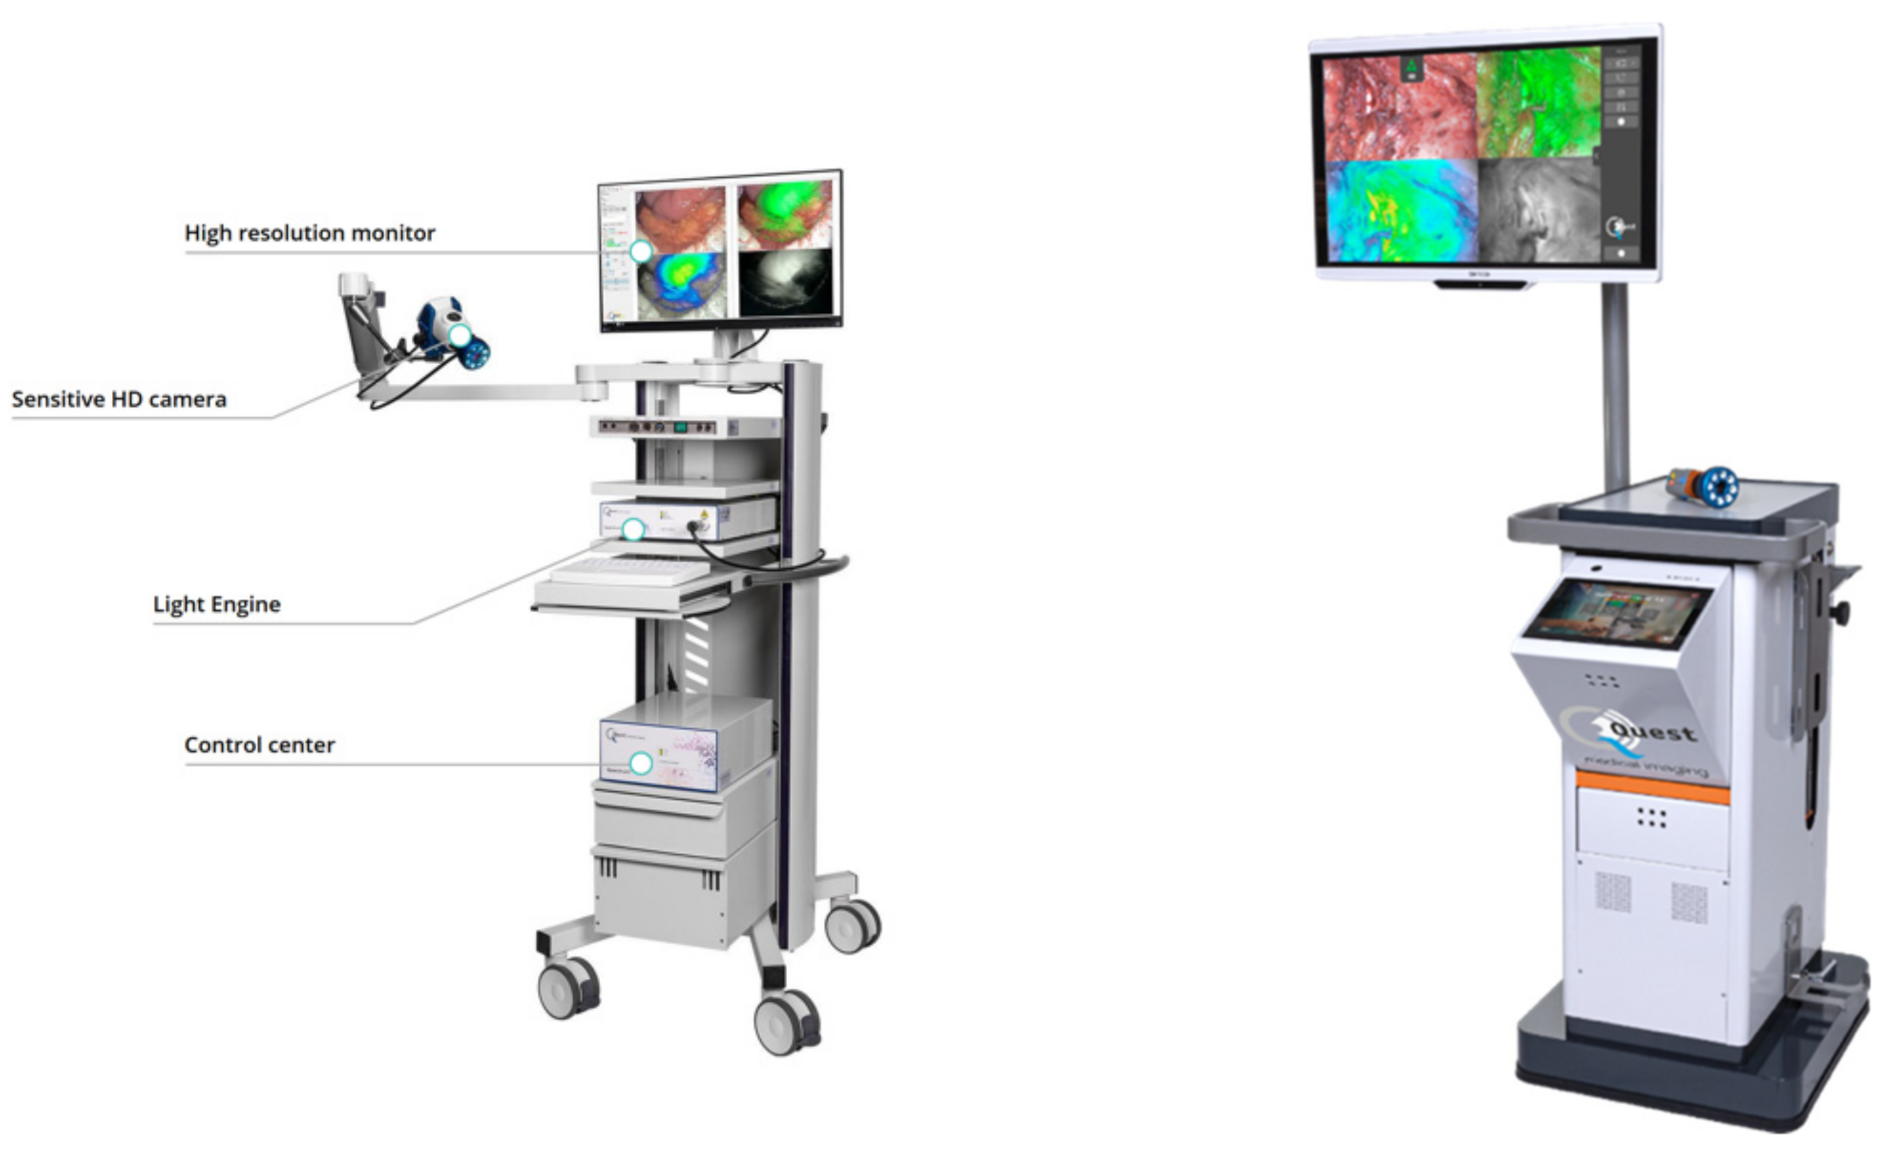
Our device is based on Quest Spectrum
®, a medical device for fluorescence guided surgery from Quest Medical Imaging (
Figure 14). The optical design of this device allows for the simultaneous acquisition of fluorescence images of two types of fluorophores methylene blue (MB) and ICG and the colour image for surgical guidance.
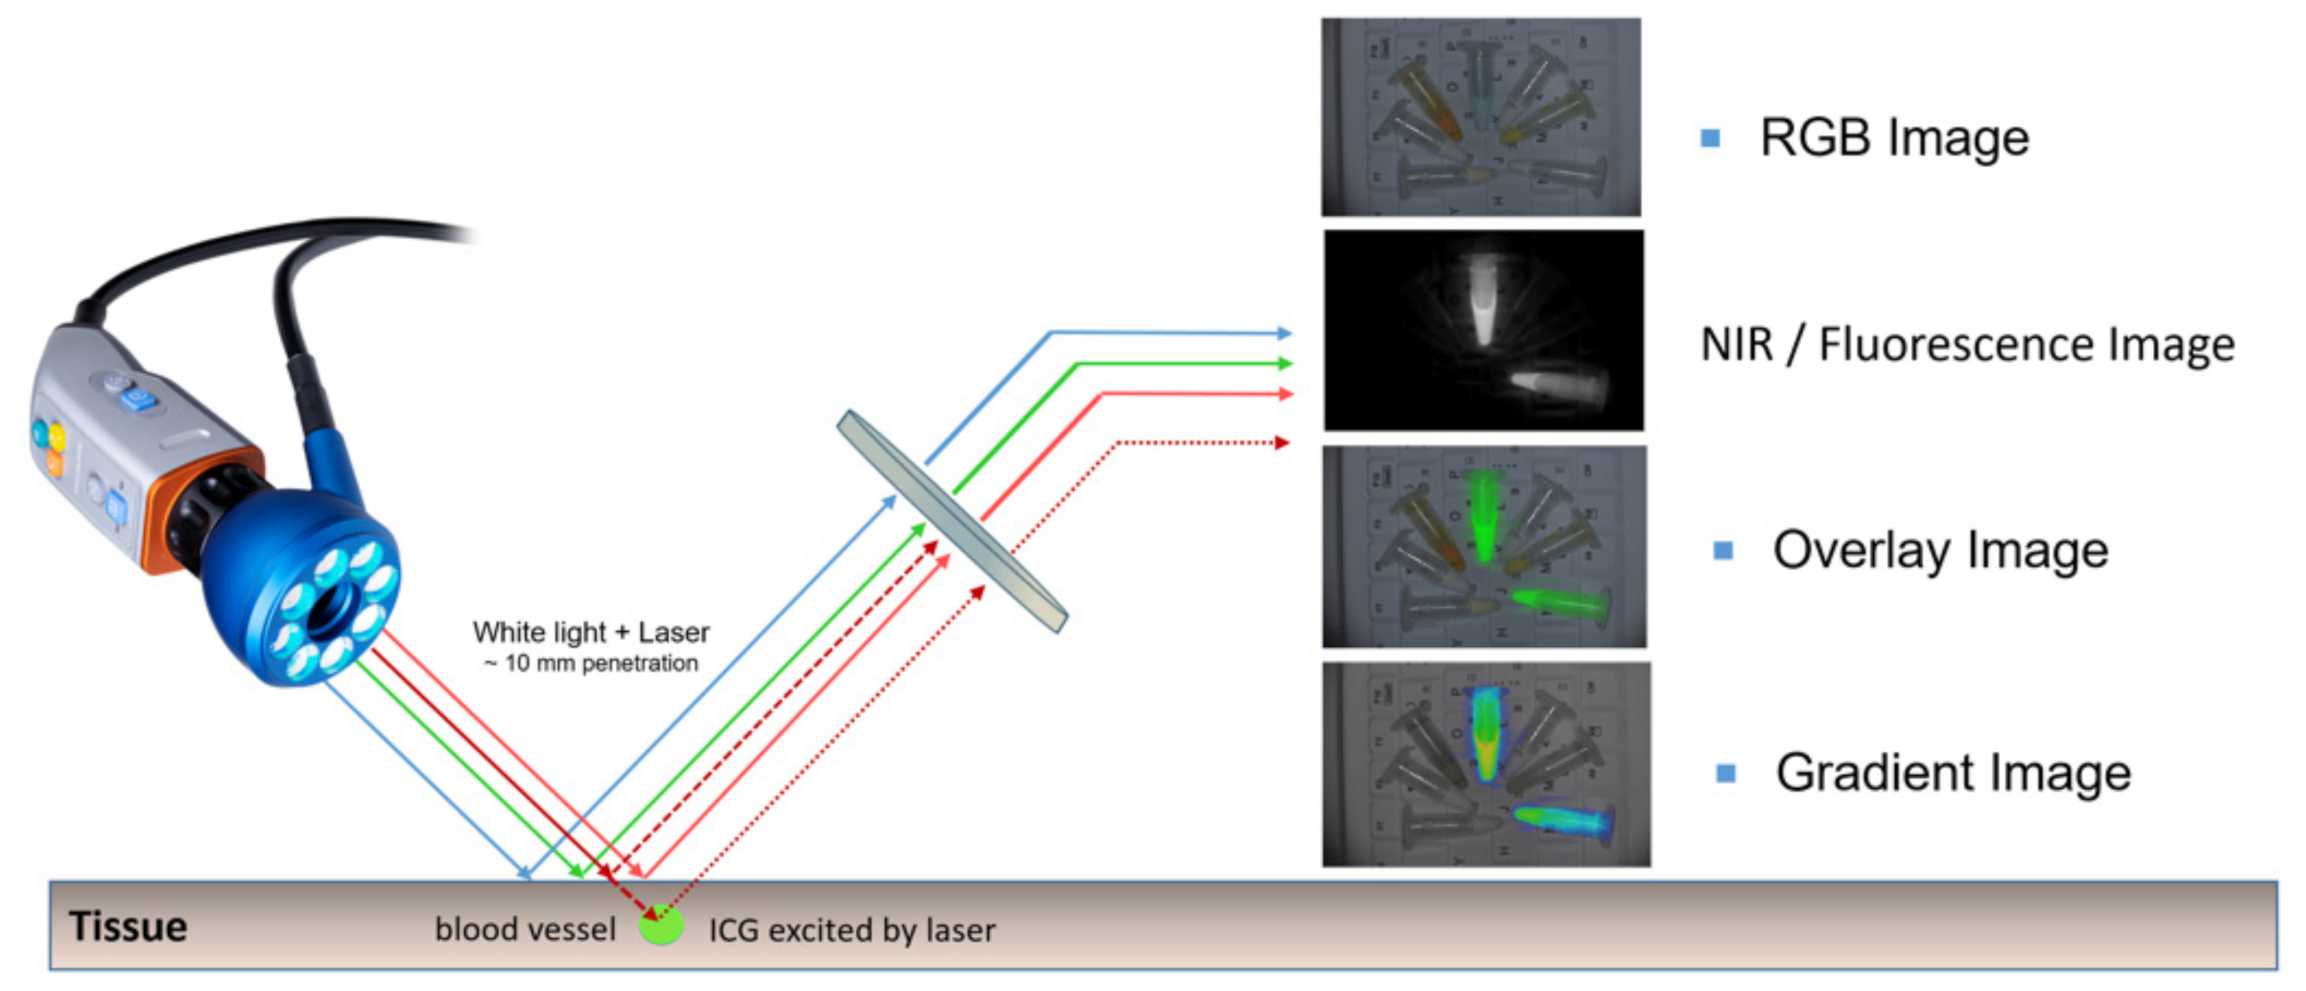
Due to the unique combination of the filters in the camera and the wavelengths of the lasers in the light source, the system can detect low amounts of fluorescence in the tissue and show the tissue viability by analysing the perfusion characteristics of the intravenously injected ICG (
Figure 15).
5.2.4. Technical Specifications for the Illumination
As the photonics imaging technologies each have their own requirements for the illumination of the sample, several light sources are envisioned for the different technologies. In
Table 3, an overview of the different light sources options is given per technology. Each required light source will be integrated in the most optimal way and will take into account the specifications for the illumination of the sample, in this case the feet.
6. Software Components of Our Device
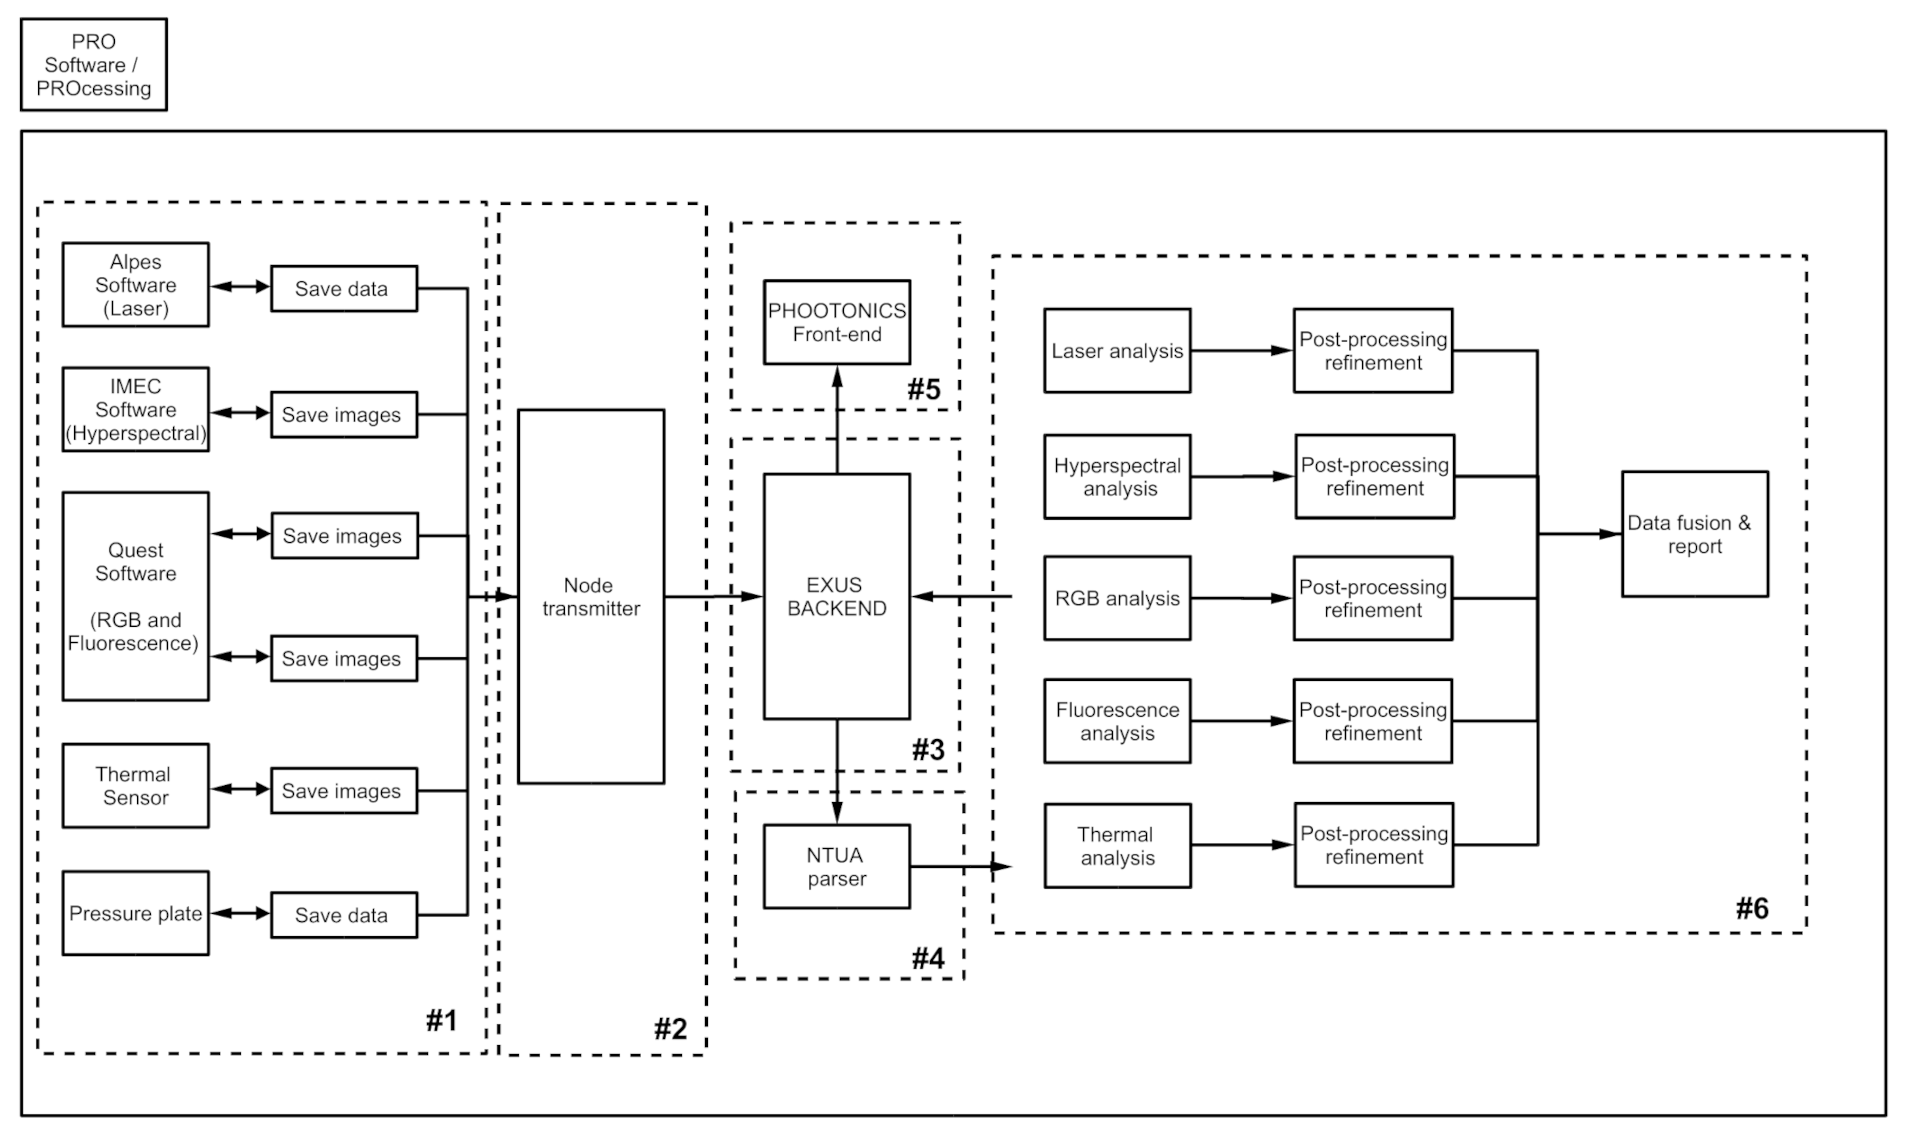
In the following overview, a brief insight into the software blocks is given, the different sections in
Figure 16 are described underneath. These blocks will help to make the division and separation of work between the different partners clear and at the same time the flow of data is displayed.
Software modules of the sensors: The sensors are connected to the processing unit. Every sensor provider will also provide the software to interface with the sensor. This software makes it possible to control the physical module and getting the data of the sensors. The raw data of the sensors will be stored on the processing unit. Depending on the module the data of the sensor will be pre-processed using the software and/or specifications provided by the manufacturing partner. No universal data format will be used for the modules.
Node transmitter: This part of the software is the interface between the back end and all the software of the connected modules. It collects all the data of the connected modules. Since the software of the connected modules does not save the data using a universal data format, the node transmitter will transform the incoming data to a universal format that will be used in the rest of the system. The node transmitter provides the universal data to the back end.
The back-end module: The back-end module exchanges data with the node transmitter, the parser, the data processing module and the frontend. The back end receives data, in a universal format from the node transmitter as described above, stores that data in database and sends it to the parser for processing and analysis. The result of the aforementioned process will be sent to the back end again from the parser module to be stored in the database.
The parser module: The parser is the interface between the back end and the data processing. The data that need to be processed are provided by the back end. The parsing module consists of multiple Python scripts, which utilize a JavaScript object notation and open-source libraries. This will help retrieving and parsing data through a secure line, in an efficient way, i.e., no possibilities of external interventions and a reliable and fast data exchange. The parser will simplify any request process for data from the back-end system, allowing for easy updates, if necessary.
The frontend module: The Frontend is the user interface (UI) through which the end user will interact to the system. There will be an application that will provide to the end user capabilities such as controlling the system, adding and editing patient information, modifying settings and seeing the processed results. The module will be user-friendly in order to assist the end user to focus on the benefits of the procedure and the provided services.
The data processing module: This part does the actual processing of the data. The data processing derives the data that need to be processed by the parser. The data will be processed in different steps and various algorithms will be used. Machine learning algorithms will be used in order to achieve results. The processed results will be provided to the back end. Machine learning (ML) and signal processing (SP) methods will contribute to early diagnosis, predictive modelling, analytics and status characterization of the diabetic foot. The ML/SP algorithms for detection and early diagnosis of diabetic foot ulcers will support the detection of abnormalities on medical images. The employed tools of such ML/SP algorithms are (i) classification (refers to a type of labelling where an image is assigned into a certain number of categories) and/or (ii) segmentation (draws outlines around the edges of target objects and labels them (semantic segmentation)) methods. These algorithms contribute to a better understanding of the signals captured by the photonic and imaging enabled devices. Practically, machine learning and signal processing method transforms low-level imagery information into high-level semantic indicators. The outcome results from the ML/SP algorithms will be send back to the back-end system. The algorithms will be deployed using Python. The input of the module will be the signal and imagery data from the various sensing components, deriving from back end using the parser. If available, additional data/parameters may be used. The output will be various indicators, supporting the decision making/treatment process for the physicians. These indicators could be (i) the different classes or clusters in the diabetic foot based on the temperature differences in foot sole zones, (ii) differences in oxyhaemoglobin and deoxyhaemoglobin concentrations and (iii) the glucose concentration.
7. Impact of Our Photonic Device on Diabetes Society
7.1. Technolgical Impact
Taking into account that around 10% of European population suffers from diabetes, one can see the direct benefits of our device in strengthening photonic-related research in diagnosis of DFU than other traditional methods. Diabetes represents a major economic burden for the healthcare system, with annual cost reaching €7–10 billion to direct yearly costs, across the EU. In this regard, the global market for diabetes diagnostics devices and systems generated a revenue of $9.040 million in 2014, and it is forecast to reach $14 billion by 2022.
Our device provides a cost-effective (almost zero operational cost and of high return of investment) and non-invasive photonics infrared device for early prediction and management of DFU. Its main advantage, apart from its cost-effectiveness, is that it can operate in a regular basis without any additional cost of usage, that is, no consumables are required. This is an important parameter for an efficient DFU management and prediction in order to avoid DFUs complications, leading to amputation. Therefore, the developed infrared photonics enabled device is competitive with traditional medical imaging and practices for management of DFUs, such as (i) ultrasound imaging for measuring blood flow and ulcer oedema, (ii) doppler for measuring Toe Brachial Index (TBI) and Ankle Branchial Index (ABI) and (iii) biopsy of skin lesions to measure ulcer lesion oedema. For example, skin lesions biopsy in order to determine important lesion attributes (such as lesions proteomics and metabolomics) for ulcers management is a procedure which cannot be carried out regularly, since it is an invasive approach, and each time expensive medical consumables are required. Additionally, duplex ultrasound requires special knowledge for operation. Only certified physicians are capable of proving duplex ultrasound scanning. Therefore, traditional medical examinations are not appropriate for a regular DFU management and monitoring. Instead, PHOOTONICS is a cost-effective, non-invasive and easy to use device for DFU management and prediction.
Our device measures several medical indices of DFU, proven by clinical trials to be of significant importance for management and prediction of DFU. These medical indices are difficult to be measured by traditional medical examinations, since they require invasive approaches, such as skin lesion biopsy. In this way, our device allows an easy regular (even daily) monitoring of critical medical indices for an efficient management and prediction of DFUs. Particularly, it is capable of detecting oxygen and haemoglobin saturations (SpO2, StO2m HbO2). According to our knowledge, there is not a photonic enabled device for continuous diabetic foot monitoring, measuring several medical indices of DFU, in a cost-effective manner.
7.2. Financial Impact
The global number of diabetes patients is expected to increase from 415 million in 2015 to 642 million in 2040. Consequently, the total diabetes-related health expenditure is also expected to rise at a rate of 19.2% to
$802 billion by 2040 [
40]. The global market for diabetes diagnostic devices and systems generated revenues of
$9040 million in 2014 and it is forecast to reach
$14 billion by 2022 [
41]. Some drivers are boosting this market: (i) the increasing prevalence of diabetes–associated with a rise in the obese population due to sedentary lifestyle and improper diet; (ii) technological advancements, the increasing need for faster and safer diagnosis and treatments for diabetes and the introduction of new technologies through the telemedicine and (iii) the rising awareness of diabetes care, by the patients that want to be able to more effectively manage their conditions at home. It is also being driven from the provider and payer side to reduce healthcare expenditure with an increased focus on prevention and outpatient care vs inpatient care, which has driven demand for more cost-effective and user-friendly devices. This represents the perfect scenario for the deployment of our photonic-based device, which will contribute to decrease the above-mentioned challenge, as it will represent a new, cost-effective diagnosis method that will contribute to create awareness and promote prevention amongst diabetes patients about DFUs.
The costs associated with diabetes include increased use of health services and loss of productivity and disability. As a result, diabetes imposes a large economic burden on individuals and families, national health systems and countries. The most conservative estimate suggests that health expenditure on diabetes accounted for 11.6% of the total health expenditure worldwide in 2015 according to IDF Diabetes Atlas [
42]. Over 80% of the countries covered in this report dedicated between 5% and 20% of their total health expenditure to diabetes, which includes the provision of health services (preventive and curative), family planning activities, nutrition activities and emergency aid designated for health from both public and private health budgets. It also shows that 75% of the global health expenditure on diabetes in 2015 was attributable to people between the ages of 50 and 79.
8. Conclusions
In this paper, we demonstrate the technical requirements and specifications of a non-invasive photonic-based device for managing diabetic foot ulcers. Instead of the current medical approaches which are costly and relatively painful, the new device we introduce is contactless while some versions of it can be used by the patients themselves and relatively affordable. The new device exploits photonics technologies as being captured in a diabetic foot by hyperspectral (HSI) and thermal cameras. The basic concept of the HSI system (operating at (700–1000 nm) Near InfraRed-NIR spectrum) utilizes the biomarkers of oxyhaemoglobin (HbO2) and deoxyhaemoglobin (Hb), through which the Peripheral Oxygen Saturation (SpO2) and Tissue Oxygen Saturation (StO2) are computed, in the upper layers of skin on the foot as a metric for assessing micro-circulation and therefore determining wound tissue healing at risk for forming new ulcers. The new device is launched at two editions; one for patients called in-home (HOME) device and one for the medical staff called professional (PRO) device. The latter is equipped, apart from passive, with active photonic technologies to enhance the diagnosis status and treatment.
The paper describes the technical specifications of the sensors to be installed in each edition. Initially, six clinical indices are concluded through a medical study to quantitatively assess a foot ulcer due to diabetes. Then, we propose several sensors which can measure the damage of the foot without any invasion. We conclude that different types of photonics-based sensors can measure quantify the clinical indices and thus to assess the status of the ulcer. In particular, the conclusions of our technical specifications are the following:
Low cost RGB, and thermal sensors can be useful to assess a foot ulcer at an affordable way. Potentially low-cost HSI sensors such as an IMEC snapshot HSI camera and a pressure sensor can be employed. The final inclusion of these two sensors in the HOME edition of our device will depend on the final results of a clinical study which is to be carried out to precisely measure the efficacy, effectiveness and the cost of our device.
More complex sensors such as advanced thermal and snapscan HSI, mid IR lasers and NIR fluorescence sensor are to be used for the professional edition to precisely evaluate the status of an ulcer in a foot.
The spectral bands needed to be exploited for each sensor and the illumination conditions are also precisely given.
A precise block diagram of software modules is described along with interrelations among them to assist medical diagnosis.
The new device is to be validated on patients recruited from three major hospitals in Europe under the aegis of PHOOTONICS European Union funded project. The three hospitals are Charité–University Hospital Berlin, Attikon in Greece and Victor Babes in Romania. The goal is to assess the sensitivity and specificity of the proposed non-invasive device in handling DFUs.


 ,
, 


