2. International Testing and Classification Standards
Over the past decades different regional or national standards for efficiency classification were in use around the world, such as NEMA and EPAct in the USA, CSA in Canada, CEMEP in Europe, COPANT in South America, AS/NZS in Australia and New Zealand, JIS in Japan, GB in China and others, relying on different test methods for the determination of the motor efficiency, which yielded significantly different results.
Nowadays, energy efficiency classification for direct-on-line (DOL) electric motors is harmonized by standard IEC 60034-30-1 [
3], which is used by most countries as the basis for their regulations. IEC 60034-30-1 standard defines the motor efficiency classes from IE1 (Standard) to IE4 (Super-Premium). In this standard, an additional class IE5 (Ultra-Premium) is proposed, but not defined. It is the goal to reduce the losses of IE5 motors by about 20% in relation to the IE4 class. The standard also determines that, for induction motors, the test method used shall be “Method 2-1-1B – Summation of losses, additional load losses according to the method of residual loss” as specified in IEC 60034-2-1 [
4], effectively harmonizing the motor efficiency test method used for regulatory purposes around the world.
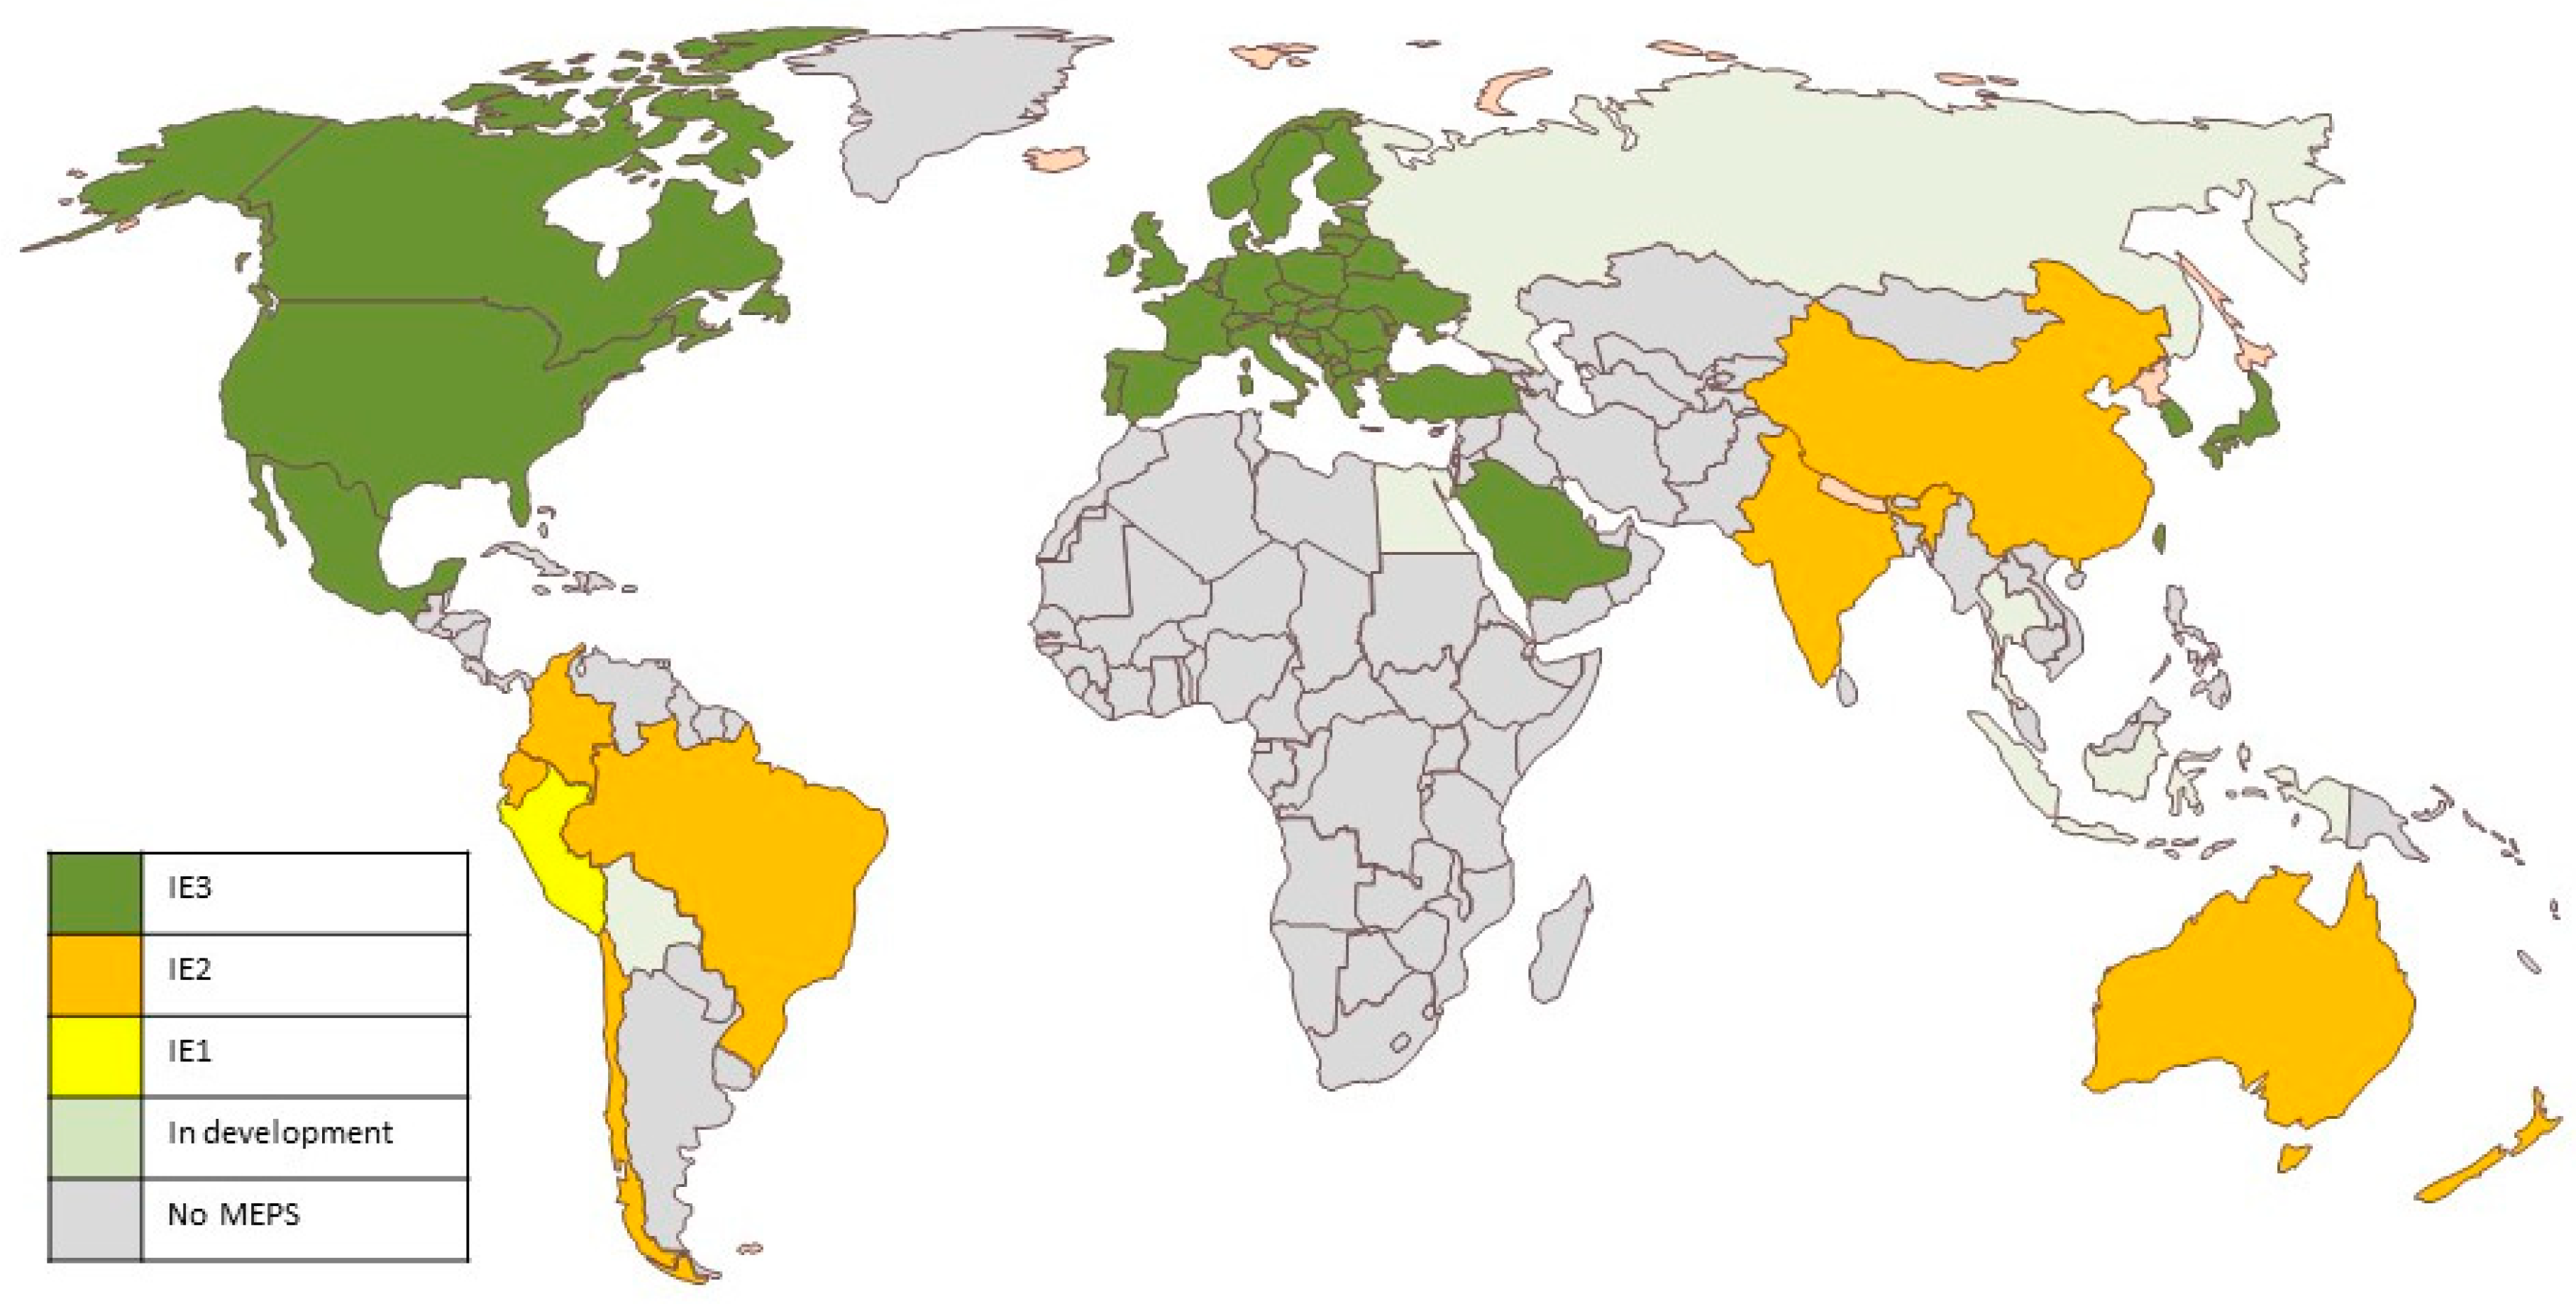
The United States and Canada were the first countries to implement MEPS, at the IE2 level, in 1997, which have, meanwhile been raised in 2010 to the IE3 level [
5]. Other countries have followed this model, using the IE2 level as a first MEPS tier to allow manufacturers some time to adapt to the market, before raising MEPS to IE3. The European Union has recently gone a step further, introducing MEPS at IE4 class level for motors in the 75 kW–200 kW power range, starting from 2021. For the first time, efficiency requirements for variable speed drives (VSDs) were also introduced, at the IE2 class level [
6]. The VSD efficiency classes are defined in the IEC61800-9-2 [
7].
New motor applications are increasingly being installed with VSDs, enabling speed and torque control. Motors equipped with VSD are expected to reach over 50% of all sold motors leading to significant energy savings for applications that benefit from partial speed operation.
This increasing market importance of motors driven by VSDs has led to the development and publication of efficiency testing and classification standards for motors operating on a non-sinusoidal supply, which leads to increased losses in the motor due to the non-sinusoidal supply (additional harmonic losses):
IEC/TS 60034-2-3:2013, Specific test methods for determining losses and efficiency of converter-fed AC induction motors [
8].
IEC/TS 60034-30-2:2016, Efficiency classes of variable speed AC motors (IE-code) [
9].
More recently, the recognition of the importance of the potential energy savings achievable by addressing the energy efficiency of the entire motor system, instead of regulating individual components, has led to the development of standards that tackle this complex subject [
10]. In the industry sector, efficiency improvement measures for electric motor systems would help to avoid nearly 3100 TWh of electricity consumption by 2040, cutting industrial electricity demand growth by nearly half when compared to a “business as usual” scenario. All these measures are cost-effective, being based on energy savings alone, and are designed to use technologies that are readily available today [
1].
3. Standards at Motor System Level
The use of VSDs for process control, matching the output to the demand of the process, can lead to substantial energy savings in particular in centrifugal fluid motion applications where the power varies with the cube of the speed (e.g., centrifugal pumps and fans). However, the VSD also introduces its own losses and, as referred before, leads to additional losses in the motor. Therefore, the analysis of VSD-fed motor applications needs to include these losses, measured or calculated at the different speed-torque points of operation [
11].
To support the introduction of regulations at system level, IEC has developed the IEC61800-9 standard based on previous work carried out by CENELEC at European level (EN 50598 series). This standard has two parts:
IEC 61800-9-1:2017, Adjustable speed electrical power drive systems—Part 9-1: Ecodesign for power drive systems, motor starters, power electronics and their driven applications—General requirements for setting energy efficiency standards for power driven equipment using the extended product approach (EPA) and semi analytic model (SAM) [
12];
IEC 61800-9-2:2017, Adjustable speed electrical power drive systems—Part 9-2: Ecodesign for power drive systems, motor starters, power electronics and their driven applications—Energy efficiency indicators for power drive systems and motor starters [
7].
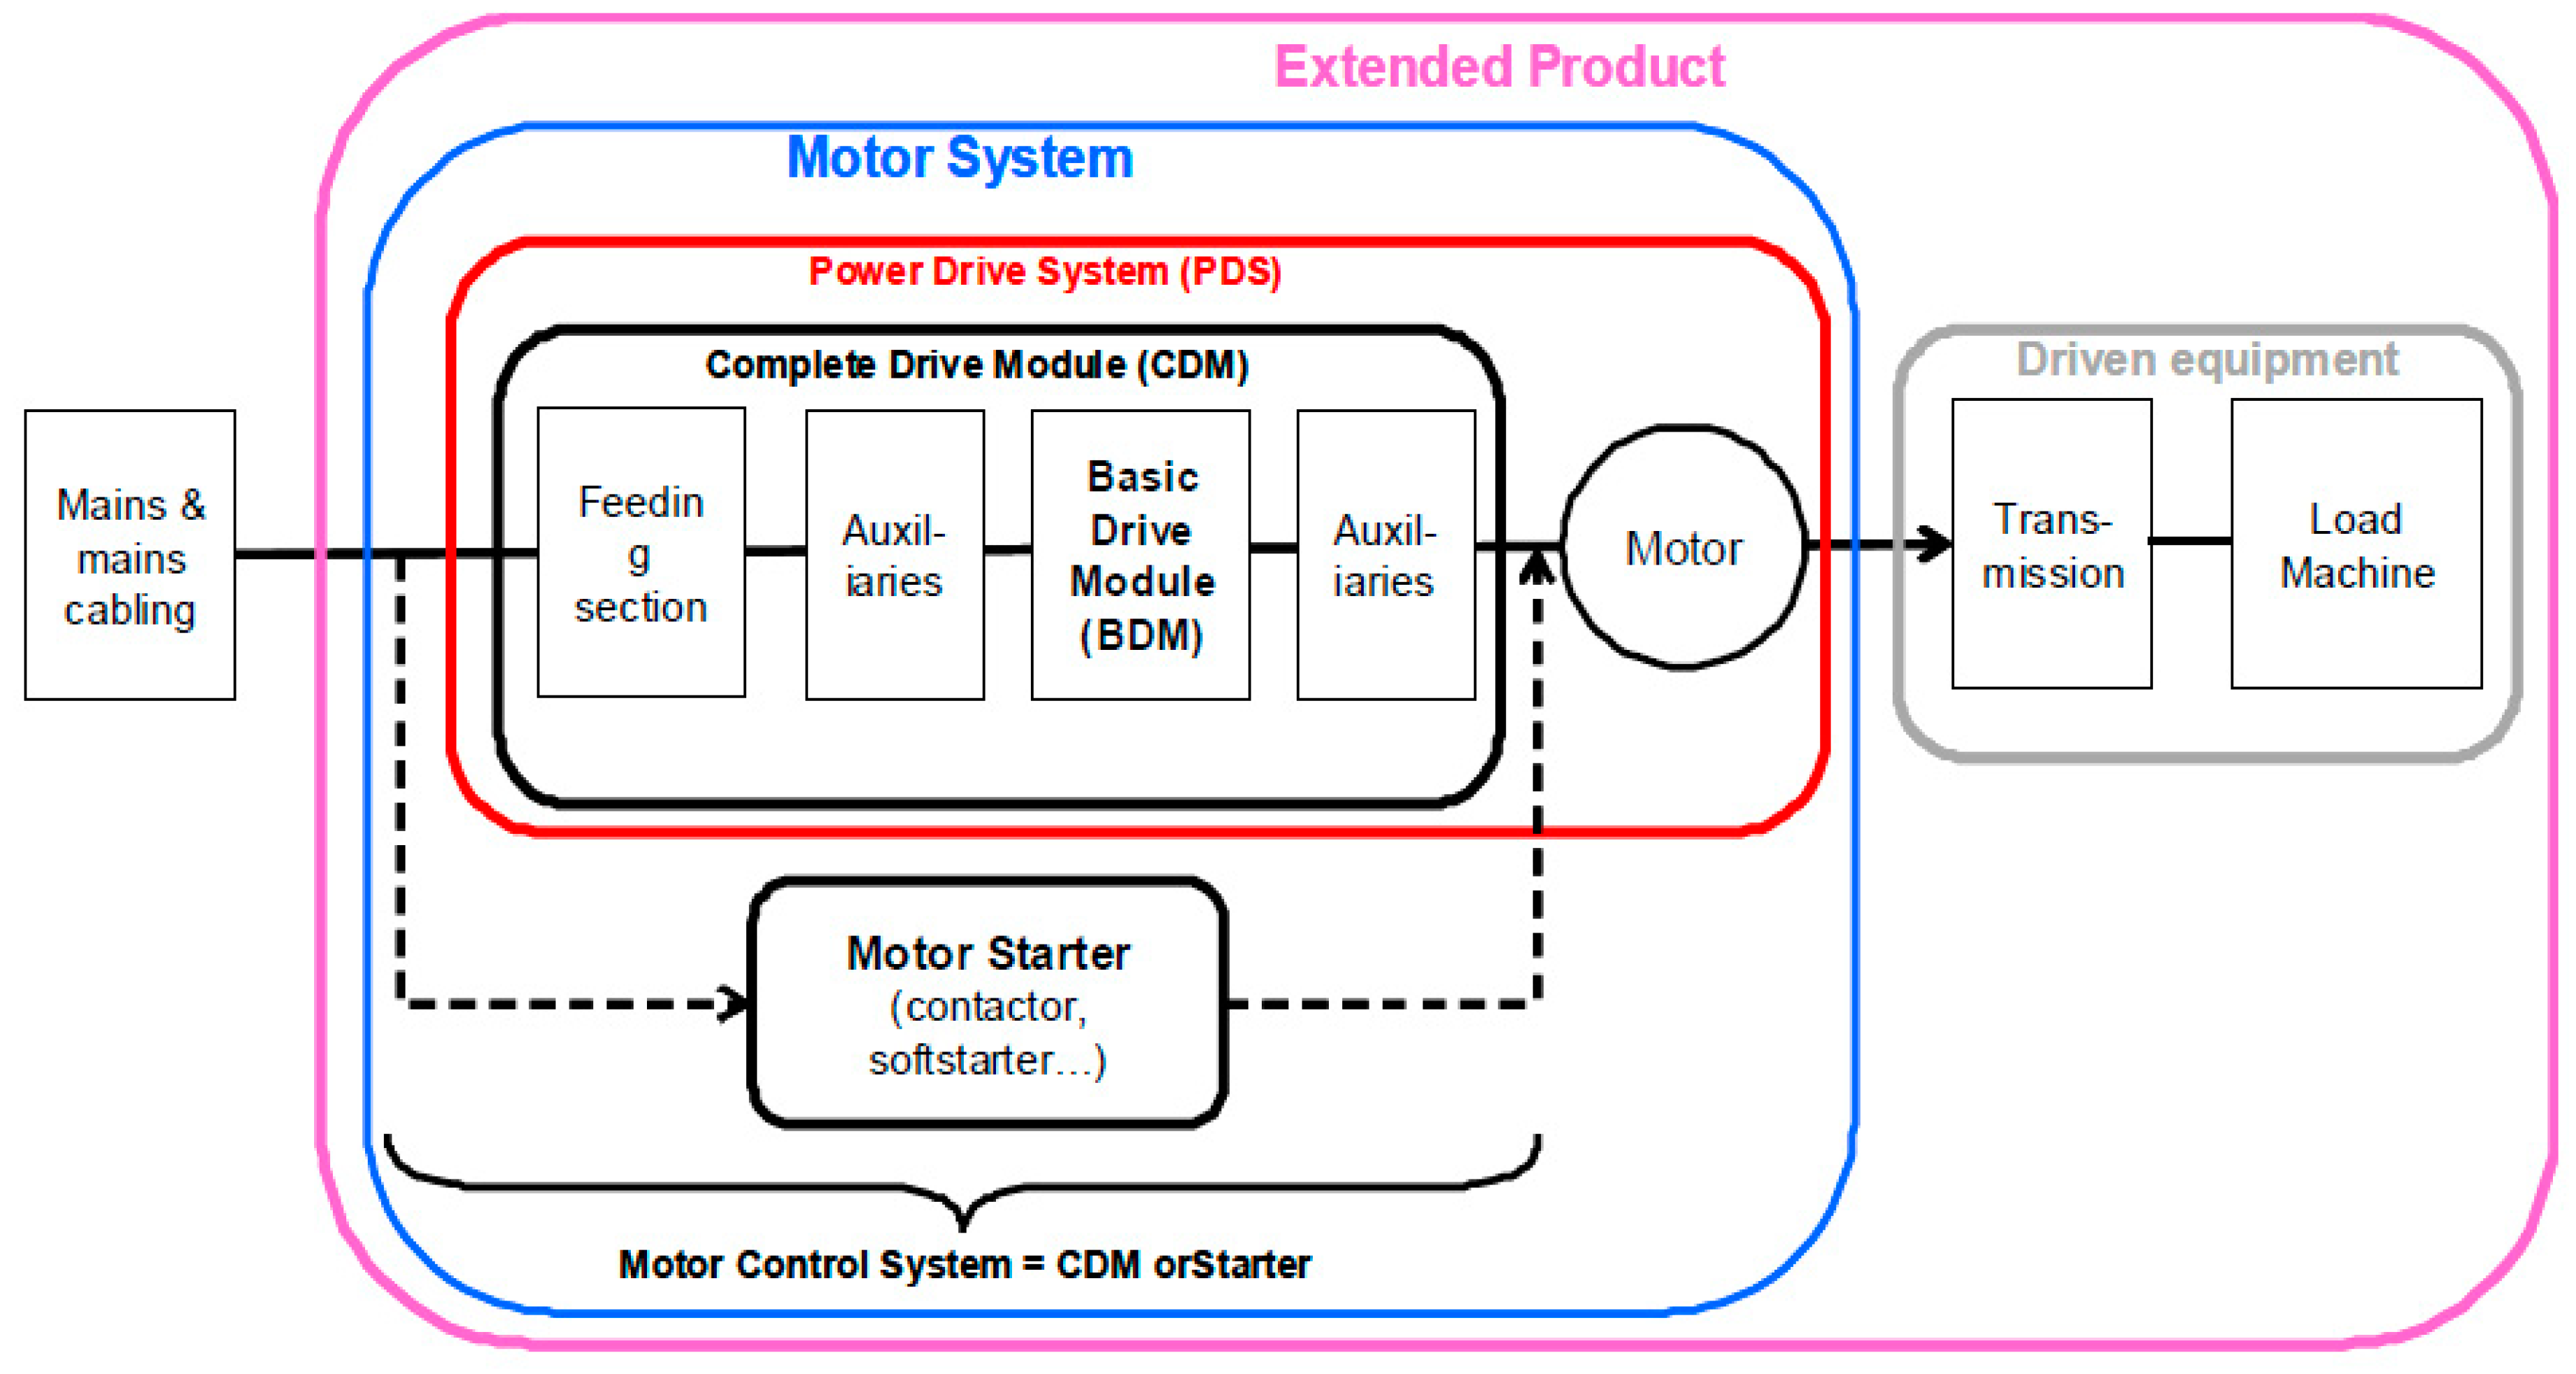
In
Figure 2, the boundaries of the electric motor, complete drive module (CDM; i.e., VSD), power drive system (PDS = CDM + motor), motor system, driven equipment (DRE, which includes the mechanical transmission and the load machine), and extended product (EPR = PDS + DRE), as set out in the IEC 61800-9 standard, are shown.
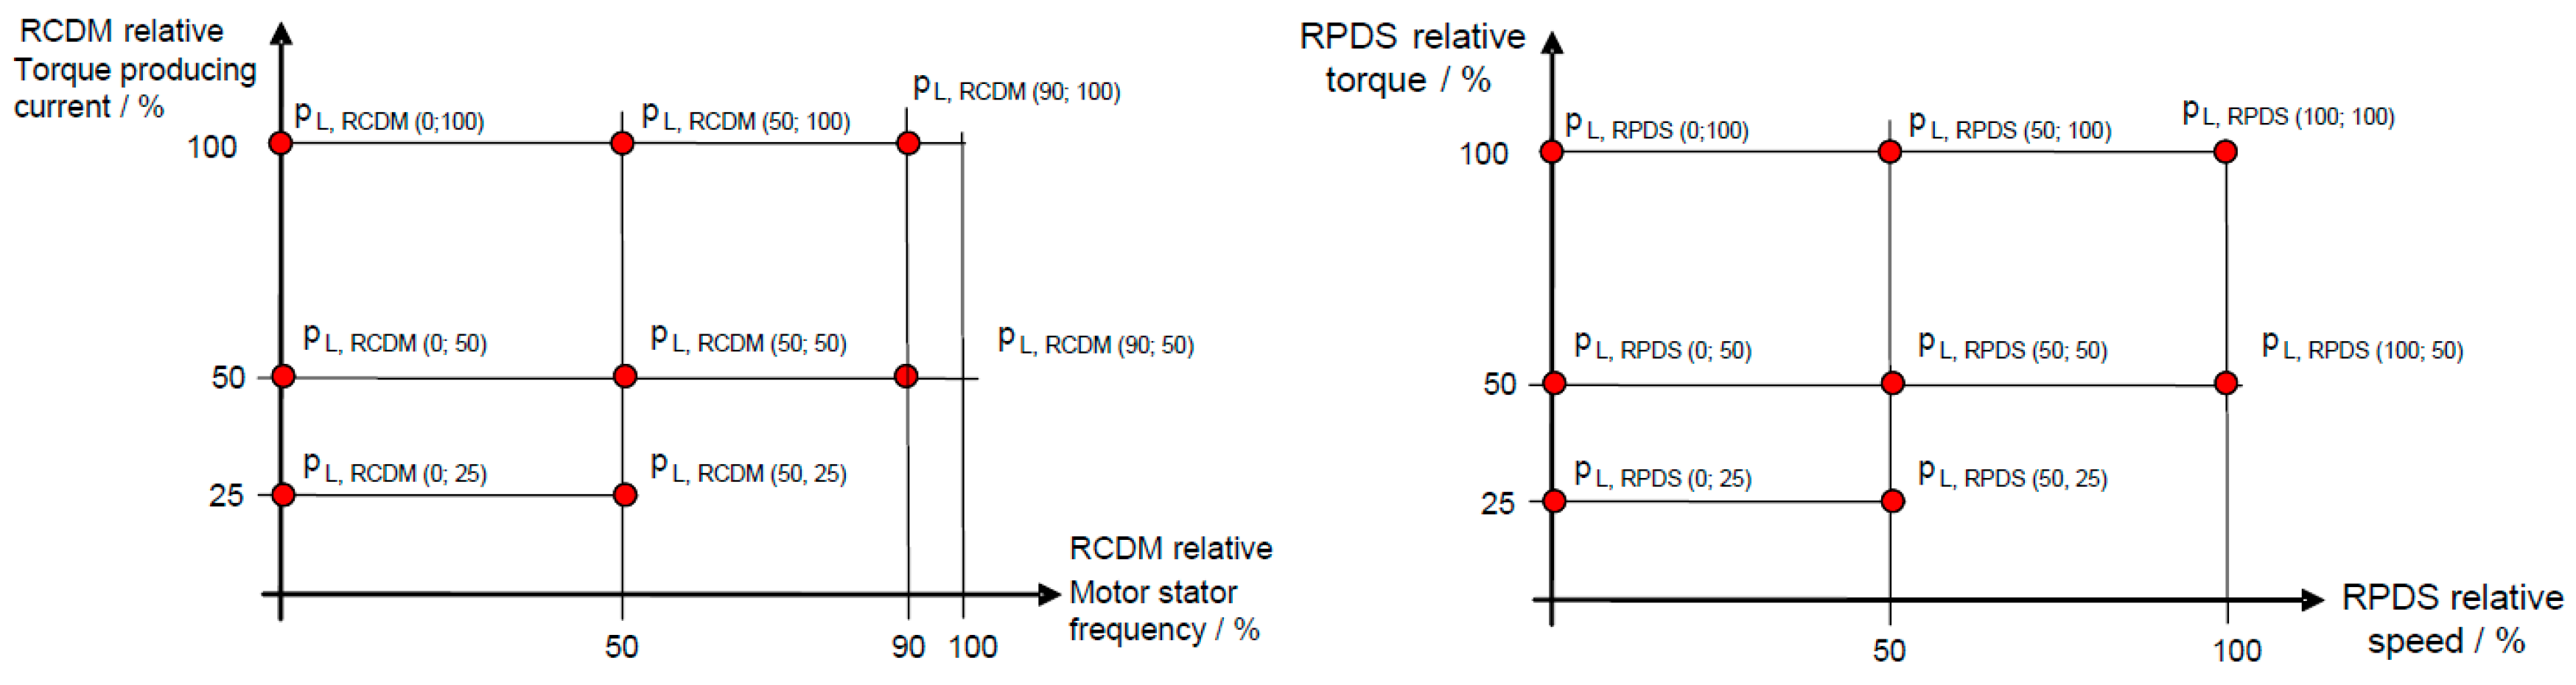
The standard defines different boundaries for the level at which the efficiency (or losses) are dealt with within its different parts (
Figure 3).
Part 1 of IEC 61800-9 standard specifies a methodology to combine the motor system data with the driven equipment data, in order to calculate the system energy efficiency for the whole application (extended product). The system efficiency is expressed by an Energy Efficiency Index (EEI) for a defined duty (load-time) profile. It allows the direct comparison of different motor systems, and to perform optimization at system level, by selecting the most efficient drive + motor + driven equipment combination.
Part 2 of IEC 61800-9 standard defines efficiency classes for the CDM and PDS. Because motors driven by VSDs are meant to be operated mainly at part load, eight operating points for testing are given, for the CDM and PDS, as shown in
Figure 3. This operating points are defined by the pair of values (% of rated frequency; % of rated torque) in the case of CDM and (% of rated speed; % of rated torque) in the case of PDS, where the percent frequency corresponds to the ratio between the actual supply fundamental frequency and the rated supply frequency of the motor, the percent speed corresponds to the ratio between the actual shaft speed and the rated speed of the motor, and the percent torque corresponds to the ratio between the actual shaft torque and the rated torque of the motor. For the CDM, losses are measured at 90% of motor rated frequency to avoid overmodulation in the voltage-source inverter PWM output. For CDM classification purposes, only the losses at the operating point (90; 100) are considered, hence, the energy efficiency classes are defined based on that single operation point.
For the determination of CDM losses three methods are specified, namely, (i) single component loss determination, (ii) input-output measurement, and (iii) calorimetric measurement.
For the first method the total CDM losses will be determined using an analytical calculation procedure, which allows the calculation of losses of a product without measurements and relies on the calculation of CDM individual component losses based on parameters supplied by manufacturers.
This loss calculation method includes (i) AC-AC output converter losses (transistor ON-state losses, freewheeling diode ON-state losses, transistor switching losses, and freewheeling diode switching losses), (ii) AC-DC or AC-AC input converter losses (diode rectifier losses or active infeed converter losses), (iii) input choke losses, (iv) DC link losses, (v) conductor/cable Joule losses; (vi) control module losses operation and standby losses, and (vi) cooling loss factor.
The remaining two methods, input-output and calorimetric, rely on testing.
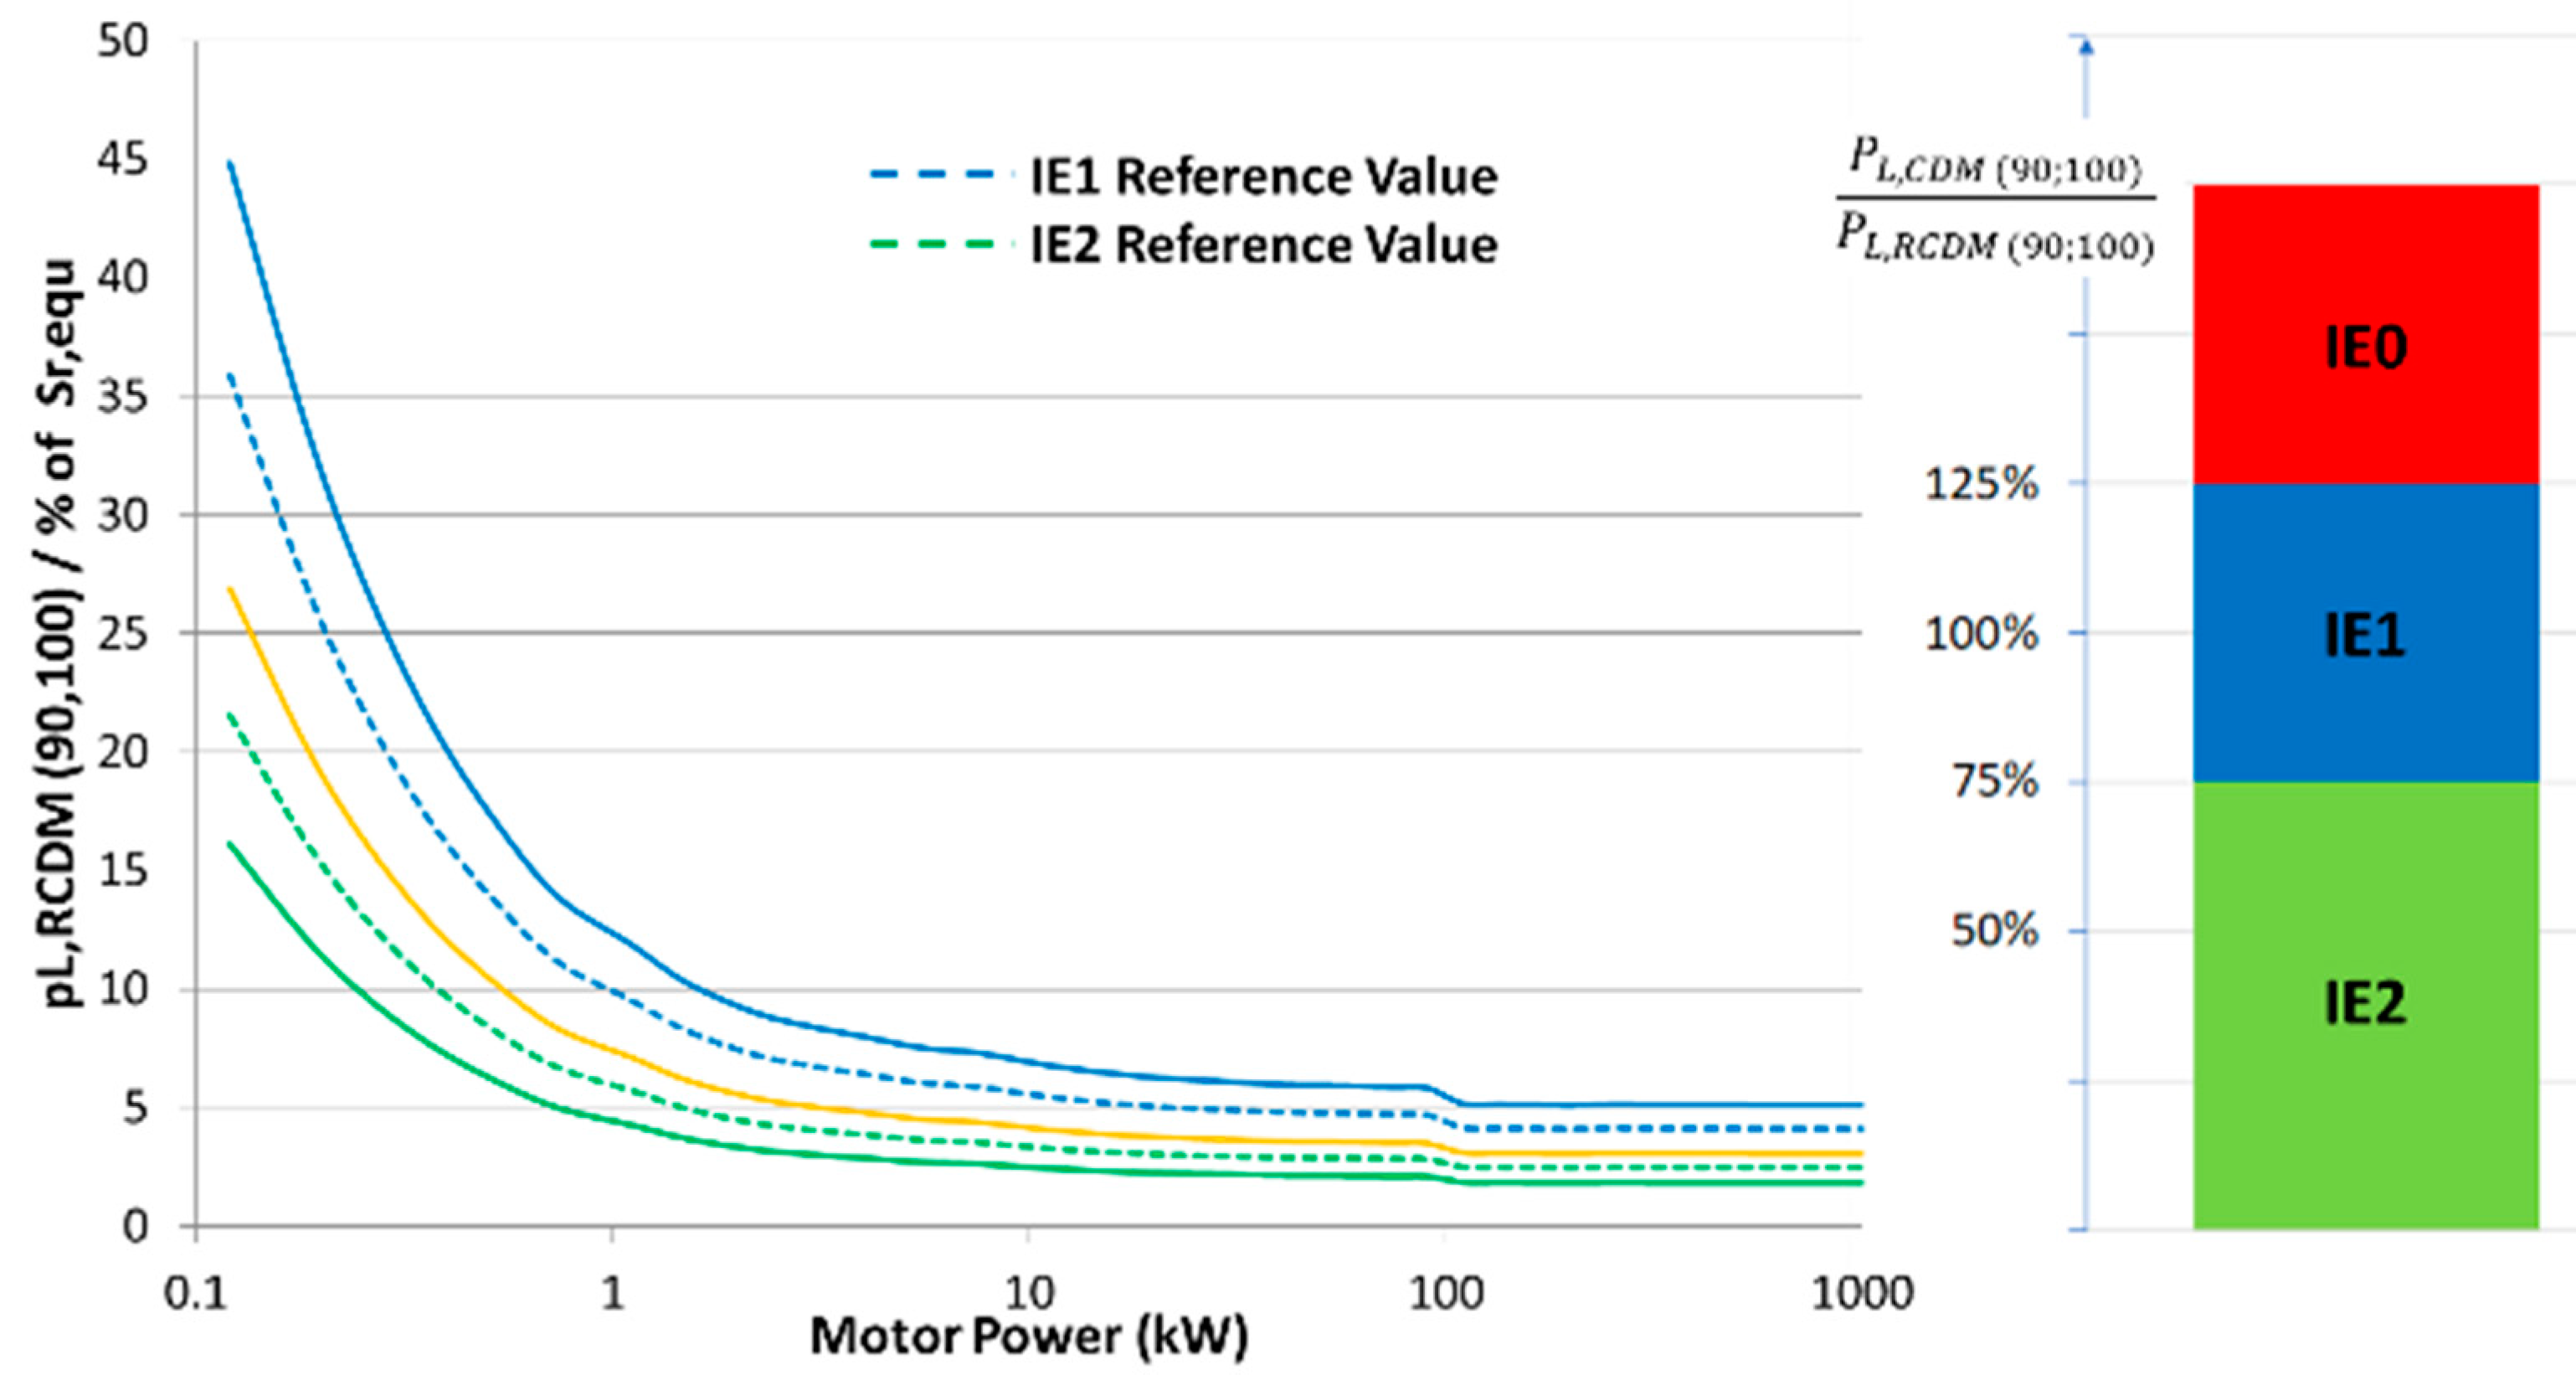
Reference values for the losses of the reference motor (RM), reference CDM (RCDM) and the reference PDS (RPDS) are laid down for the eight operating points and efficiency classes are defined for the PDS and for the CDM relative to these reference losses. The losses for the RM are based on the IE2 class as defined in 60034-30-1. For the CDM, the standard defines three classes, namely, IE0, IE1, and IE2, and a reference value for losses corresponding to IE1 class is defined for each power size. If the CDM has 25% more losses than the reference value, it will be classified as IE0. If it has at least 25% lower losses than the reference, it is classified as IE2, as shown in
Figure 4.
For the PDS, a similar reasoning is applied, again with three classes, namely, IES0, IES1, and IES2, with IES1 as the reference class. The distance to the reference losses is only 20%. IES energy efficiency classes are defined based on the single operation point (100; 100). For the determination of PDS losses (and efficiency class), two methods are specified: (i) loss calculation; (ii) input-output measurement. The calorimetric measurement method is excluded, as it is difficult to perform on electric motor systems.
Additionally, for the analysis of a particular EPR or PDS, all eight load points, a subset of these eight points, or the actual load points of a known application, can be used. For example, points (100; 100), (100; 50), (50; 25) can be used to estimate the losses in quadratic-torque applications such as centrifugal pumps and fans, while points (100; 100), (50; 100), (0; 100) are used for constant-torque applications (e.g., conveyer belts, hoisting machines, and extruders). For constant-power applications, such as winders and winches points (0; 100), (50; 50) and (100; 50) can be used. The standard also specifies the extrapolation procedure to calculate other intermediate points. For a more accurate analysis of an individual application, the actual operating points of a PDS (speed; torque) can be used, as well as the duty-cycle profile (load ratio as a function of time).
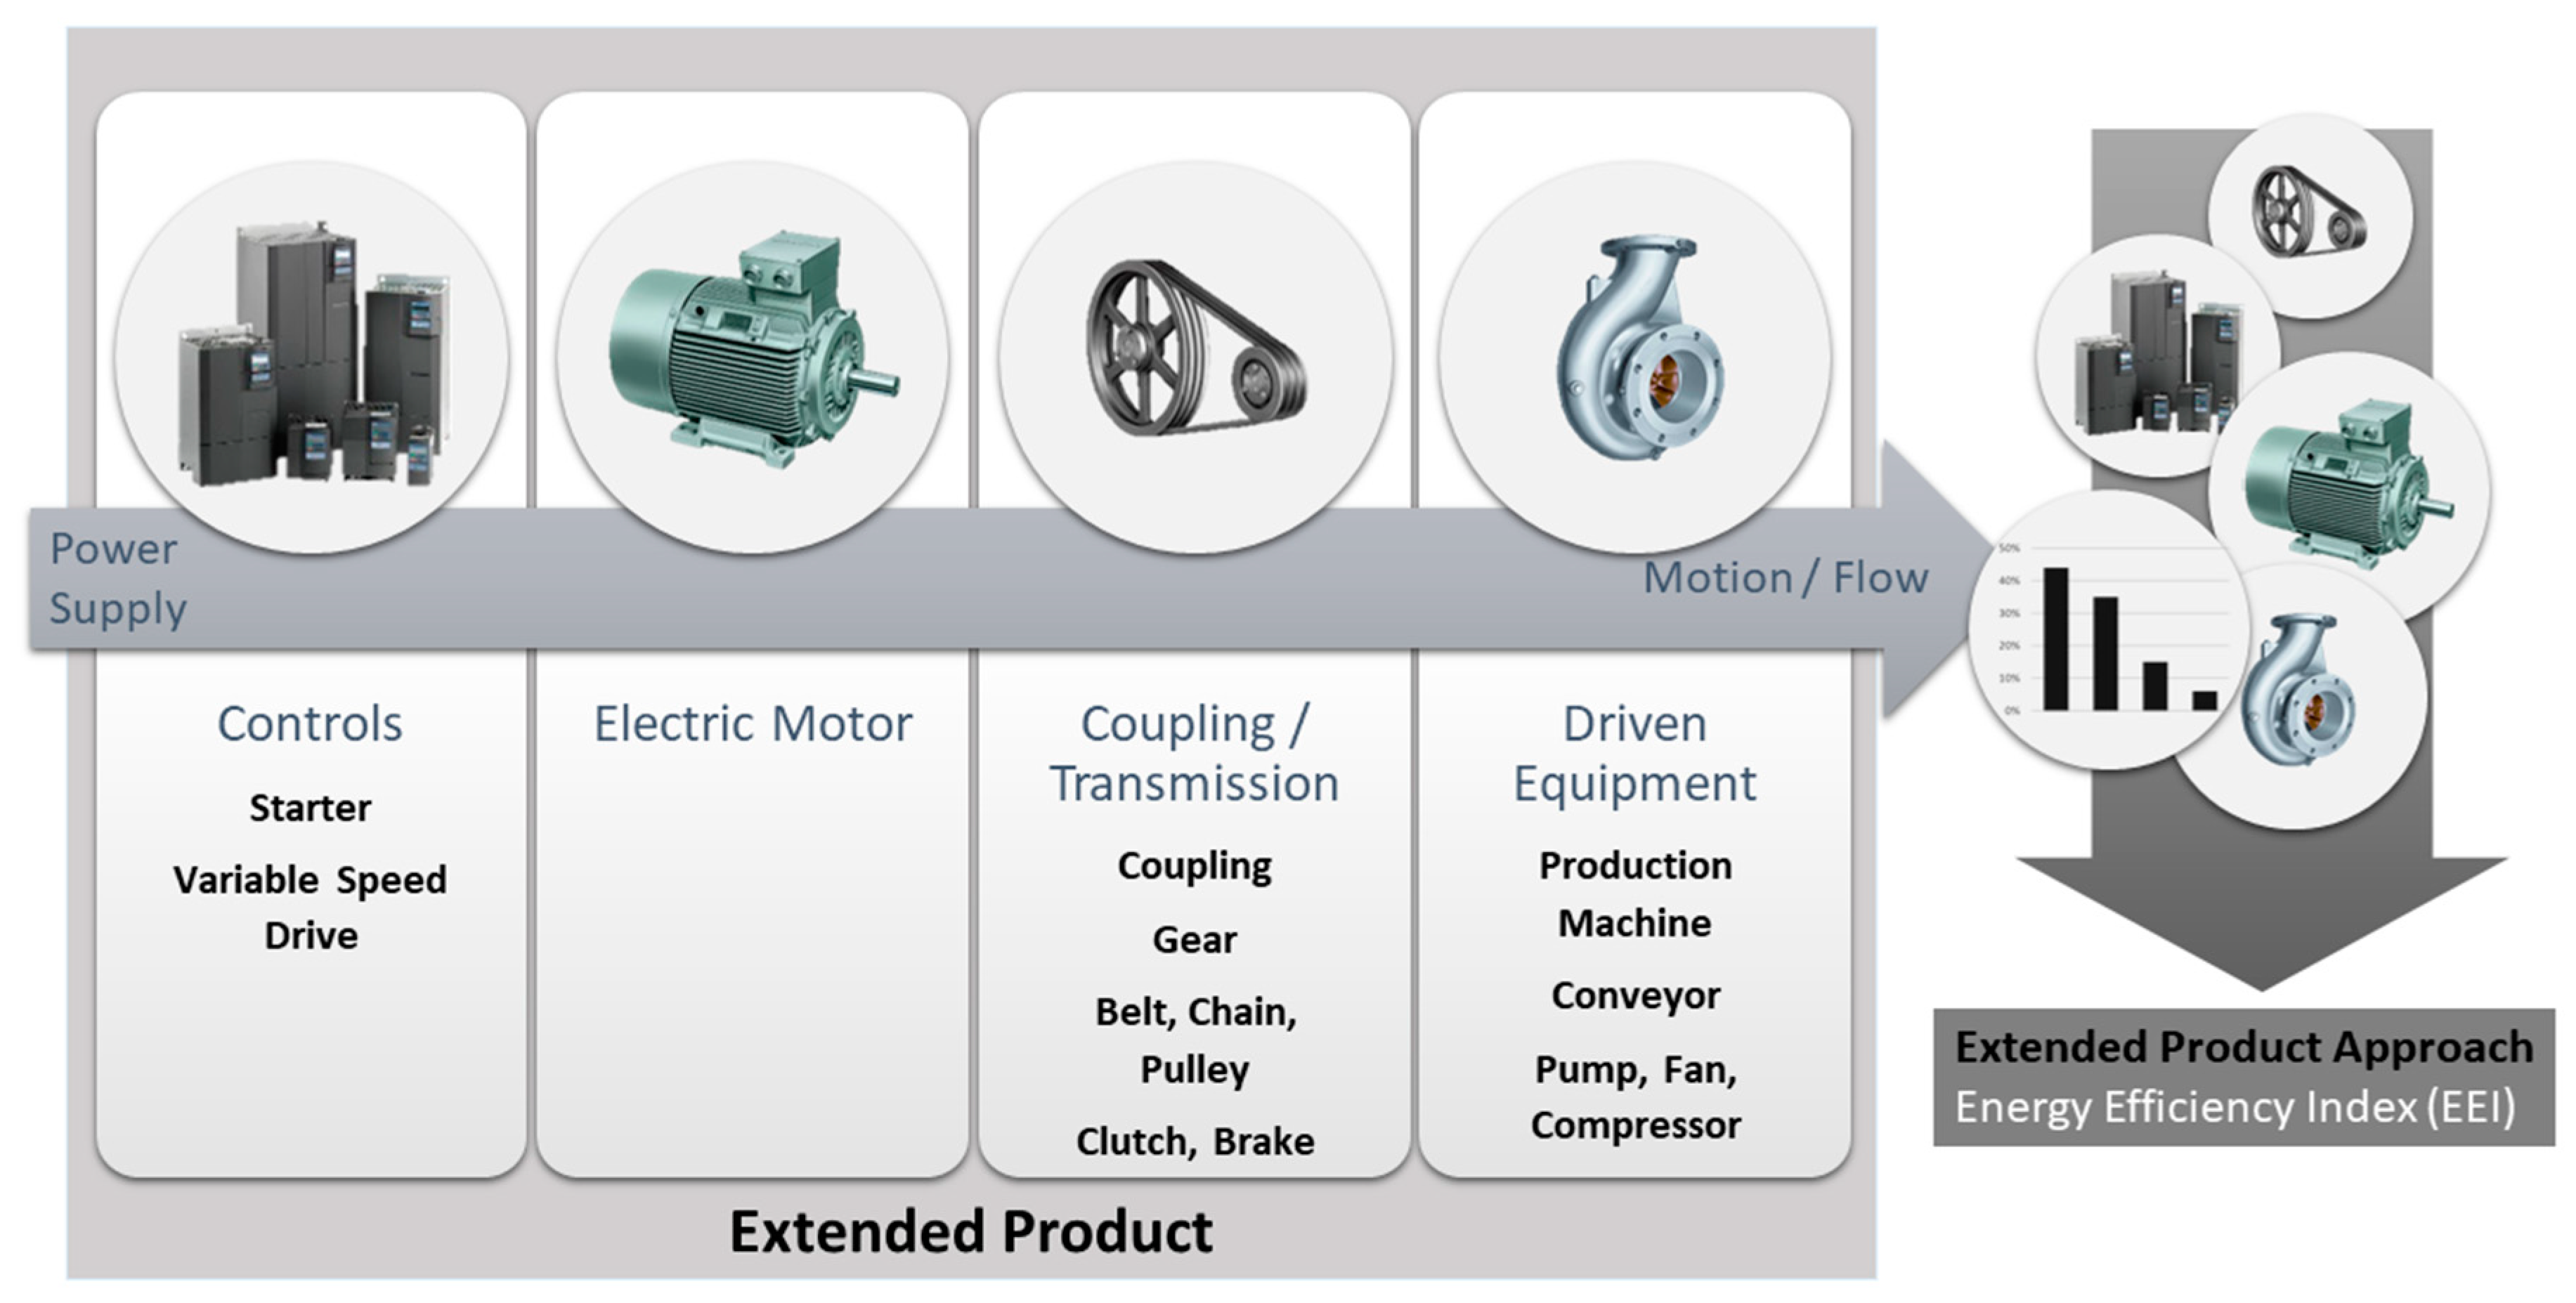
3.1. The Extended Product Approach
The current practice, with the exception of certain clean water pumps in the USA and water circulators in other countries, is to regulate the efficiency of individual motor system components, disregarding their interaction and best combination. However, the best approach is to determine and classify the efficiency of the EPR [
13], considering the complete integration and interaction of the PDS, mechanical transmission (e.g., gear, belts, or direct coupling) and driven end-use equipment (e.g., pump, fan, or conveyor), as shown in
Figure 5.
Some small products (e.g., circulator pumps, exhaust fans, and cooling compressors) include the motor, the VSD, and the end-use equipment (pump, fan, compressor, etc.) into one integrated package manufactured by one producer. This facilitates efficiency testing since direct input-output method can be easily applied, with the EPR efficiency equal to the mechanical power output divided by the electrical power input (in %). However, most of the times, motor systems are only assembled at the end-user site, most of the times impossible to physically test them. On-site tests are sometimes possible but are never as precise as tests carried out in laboratories in a controlled environment and repeatable conditions.
For this reason, a model for the determination of the losses of a motor system or a driven equipment is specified in IEC 61800-9, called a semi-analytical model (SAM). This IEC standard only covers electrical/electromechanical components (i.e., motor, VSD, motor starter), disregarding the mechanical components (i.e., mechanical transmission and load machine) that are dealt with by the International Organization for Standardization (ISO).
IEC 61800-9-1 specifies a generic approach for determining the energy efficiency of an EPR, that can be used to develop energy efficiency determination procedures for other non-electrical components. As such, the extended product approach (EPA,
Figure 5) specified in standard IEC 61800-9 can only be used to determine the losses of the electrical/electromechanical components of the motor system. The losses of the mechanical components need to be obtained from other sources such as the related ISO standards or product manufacturers.
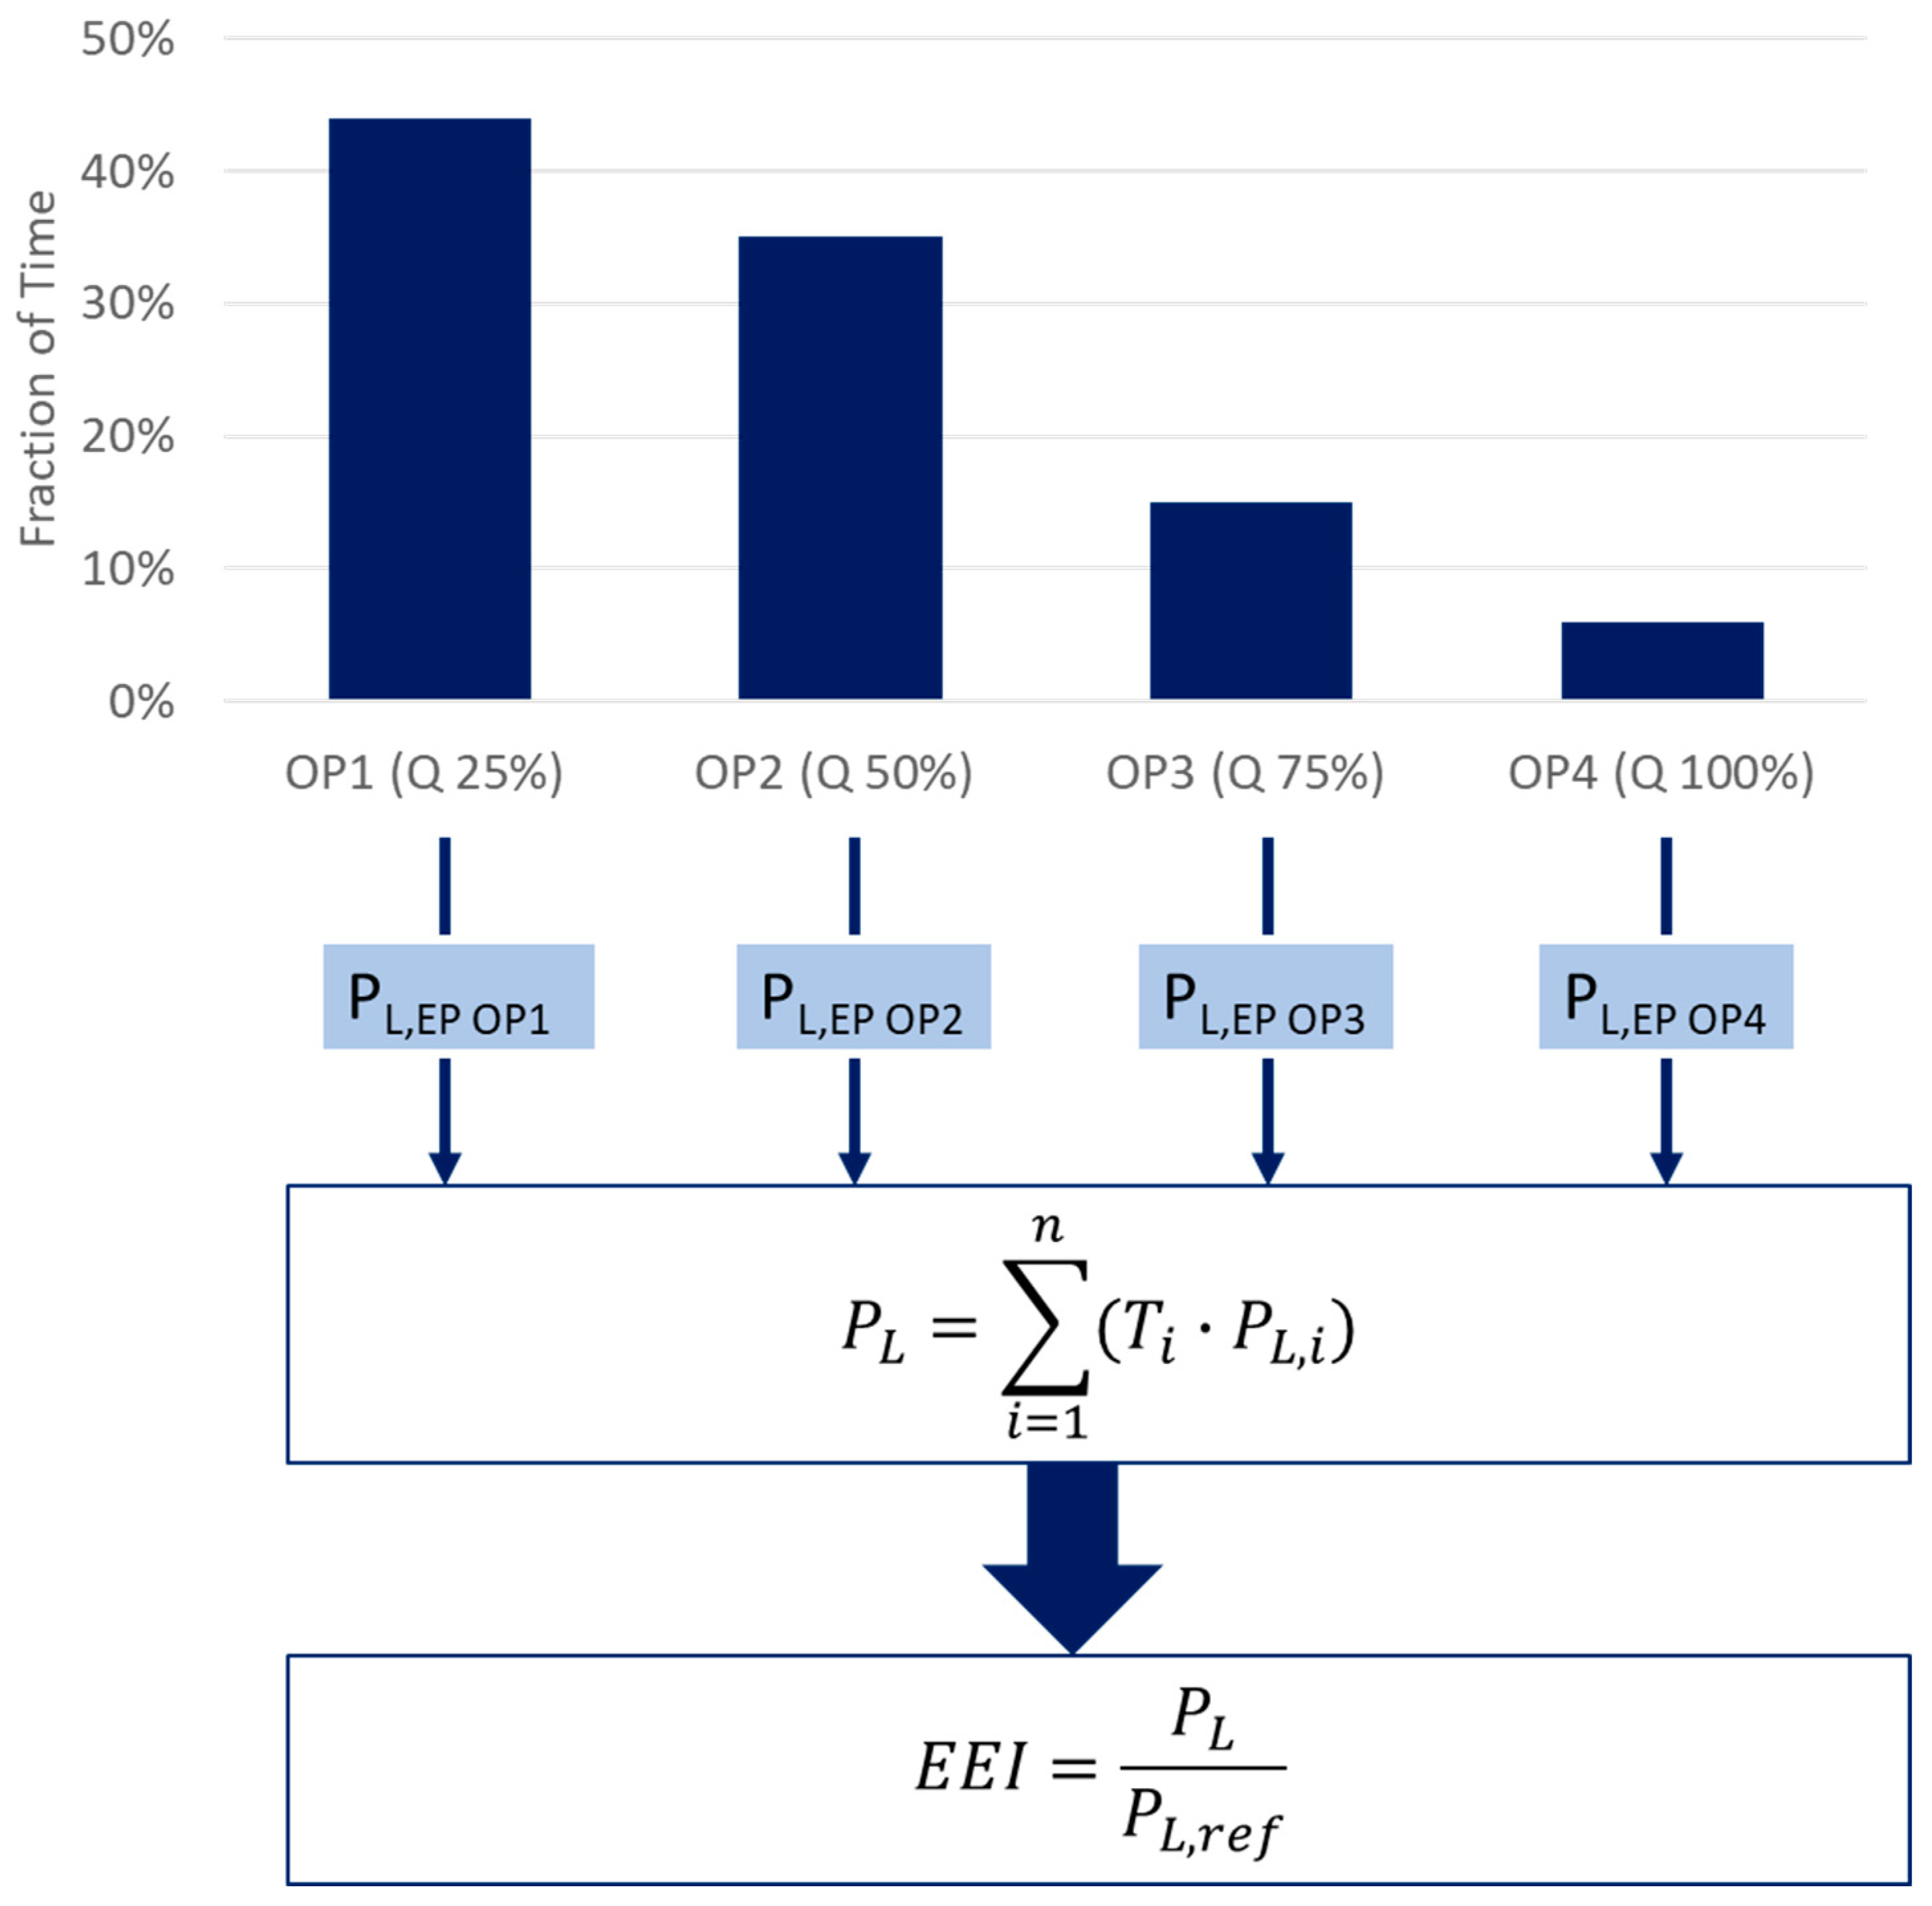
The method can be used to determine the energy efficiency of the motor system for a particular application, taking into account the time spent at the different operating points (speed-torque). To calculate the EEI, the following inputs need to be known:
Characteristics of the application load, namely, the torque or power as a function of shaft rotational speed, and the working time or fraction of time of each operating point (duty cycle), including standby mode.
Power losses of components (Motor, CDM, end-use equipment, auxiliaries) at the operating points required by the application. Power losses are used instead of efficiency because they take into account particular conditions such as standby consumption (no-load condition, in which the efficiency is zero).
With this information and using the methodology specified in the standard, the user will be able to estimate power losses (PL) of the motor system and EPR at standardized operating points (OP) or the actual load points of a given application, as well as to calculate the Energy Efficiency Index (EEI) of the EPR for the given application.
Figure 6 illustrates the procedure considering a typical load profile of pumps used in heating, ventilation and air conditioning (HVAC) systems. The EEI allows the user to compare the efficiency of different combinations of components for a given application. Furthermore, the EEI will allow for the setting of energy efficiency labels and MEPS for EPRs as is the case for pumps in the US.
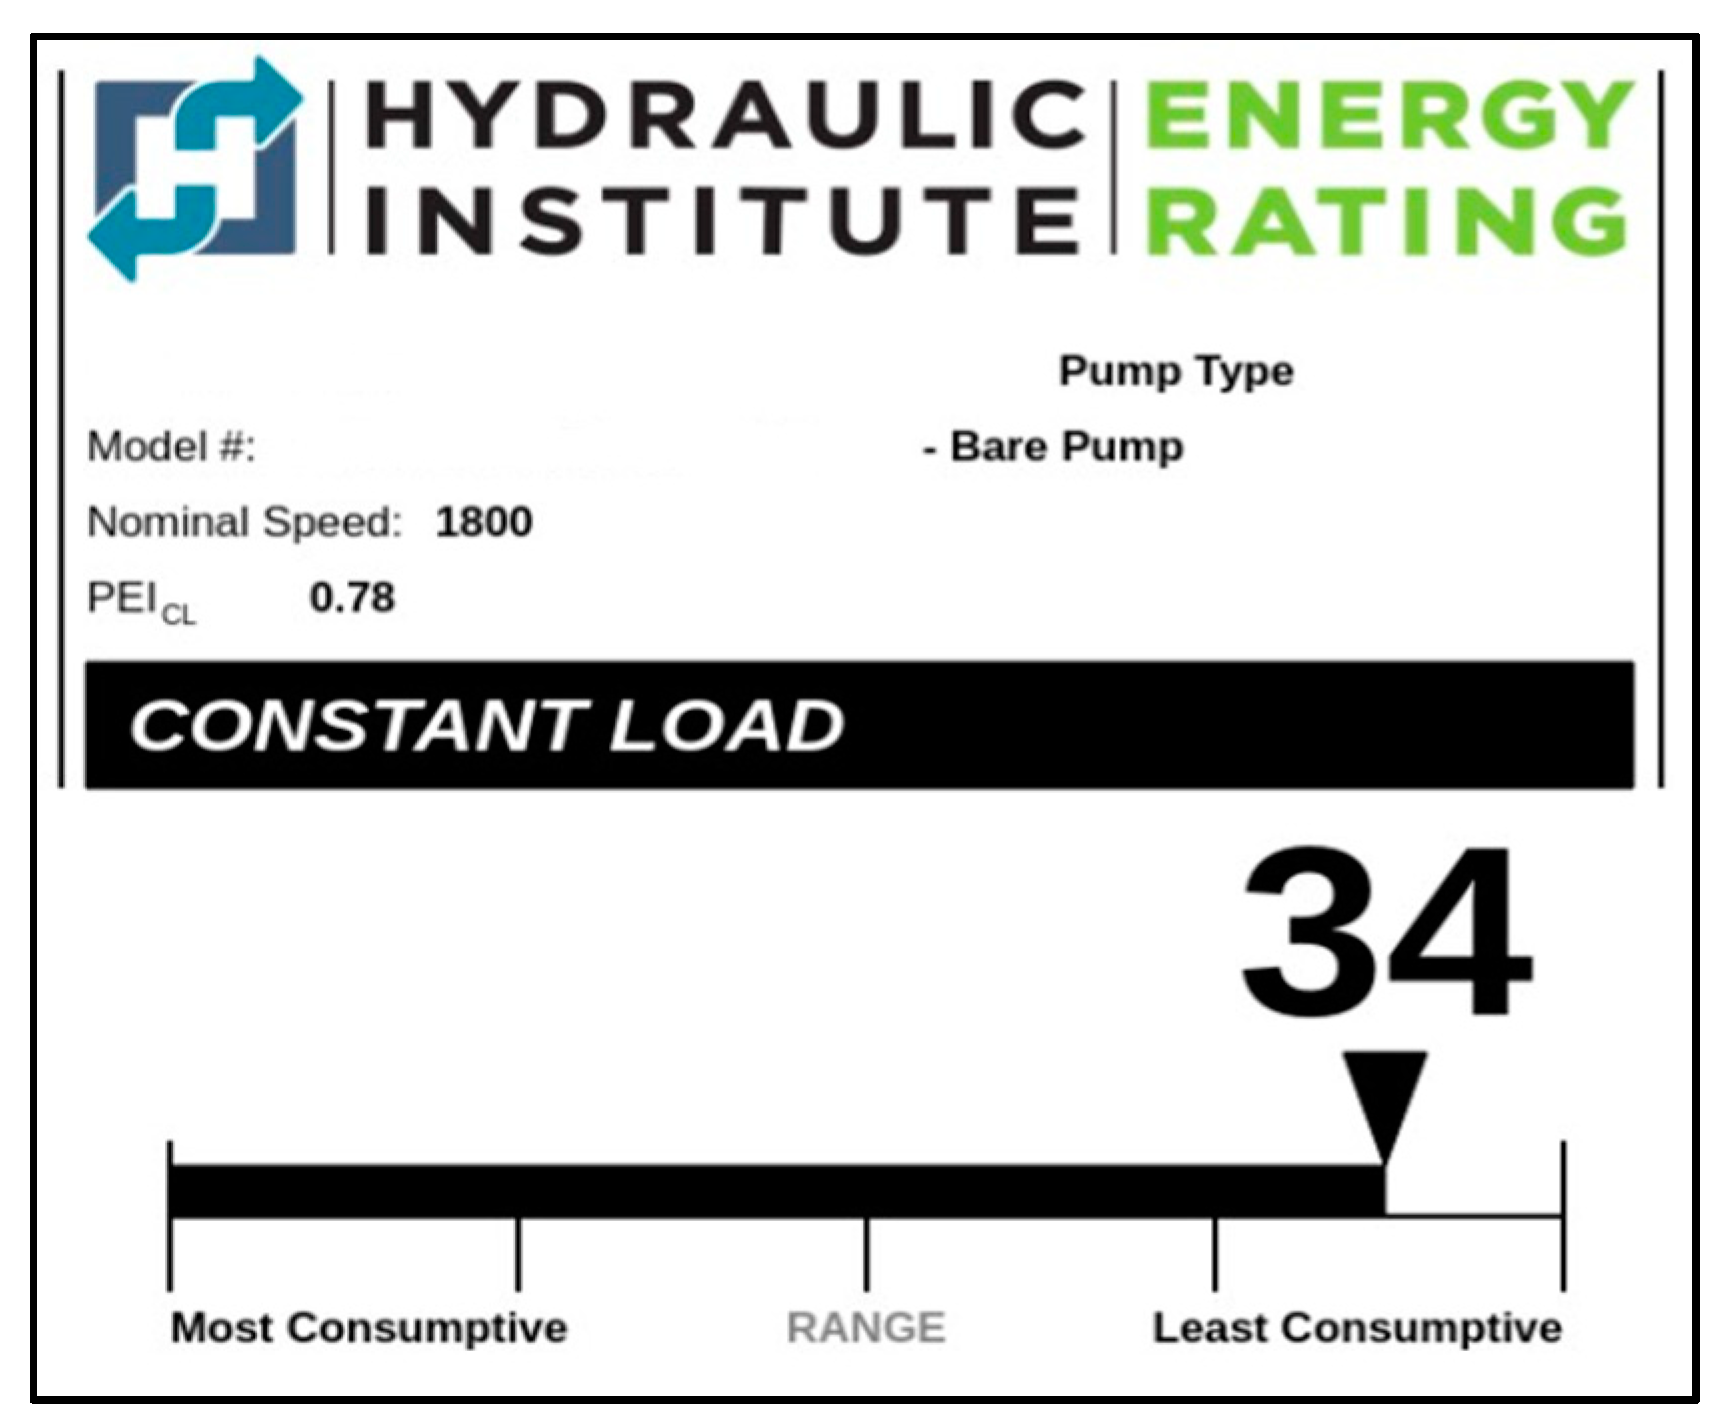
Beginning January 27, 2020, clean water pumps sold in the USA must have a Pump Energy Index (PEI) rating of not more than 1.00 as outlined in the Energy Conservation Standards for Pumps established by the USA [
14]. The PEI must be displayed on the pump rating plate. The same approach is being undertaken to establish similar regulations for the minimum efficiency of other motor products, namely fans [
15]. For the measurement of pump energy consumption and the calculation of PEI, a methodology was defined in cooperation with pump manufacturers and the Hydraulic Institute (HI). Building on this methodology, the HI has gone one step further and developed an energy efficiency labelling program (HI Energy Rating Program) [
16].
The label, as shown in
Figure 7, also provides an Energy Rating (ER), which can be used to quantify energy savings potential. Multiplying the ER, in percentage, by the motor rated power (kW) results in power savings compared to the baseline.
3.2. System Standards and New Motor Technologies
Growing awareness of the importance of energy-efficiency of motor systems has led to the market introduction of motors exceeding IE4 and IE5 efficiency levels, using technologies such as permanent magnet synchronous motors (PMSM), synchronous reluctance motors (SynRM), and copper rotor induction motors. SynRMs and PMSMs require the use of an electronic controller (VSD) to operate and, therefore, are not capable of competing with direct-on-line (DOL) squirrel-cage induction motors (SCIMs) in constant speed applications [
17].
However, in applications where speed variation is necessary, PMSMs and SynRMs can present themselves as a viable alternative to induction motors, rivaling in reliability and excelling in efficiency. These motors operate at synchronous speed, eliminating almost entirely the losses in the rotor and are, therefore, capable of achieving very high efficiency levels, even exceeding IE5.
Because of their improved characteristics, these technologies allow for a significant reduction of the motor size and weight, when compared to induction motors of similar efficiency. Additionally, these new motor technologies can be engineered to present improved operating characteristics in part-load operating regions.
The development of standards that accommodate variable speed and torque operation presents itself as an opportunity for end-users to achieve both improved performance and lower electricity consumption. Because of the large savings potential, there is a need to include these motor technologies into future regulations which, until now, have been limited to induction motors. Advanced motor technologies are produced around the world, by a variety of manufacturers.
4. Experimental Power Drive System (PDS) Performance Comparison Using Different Motor Technologies
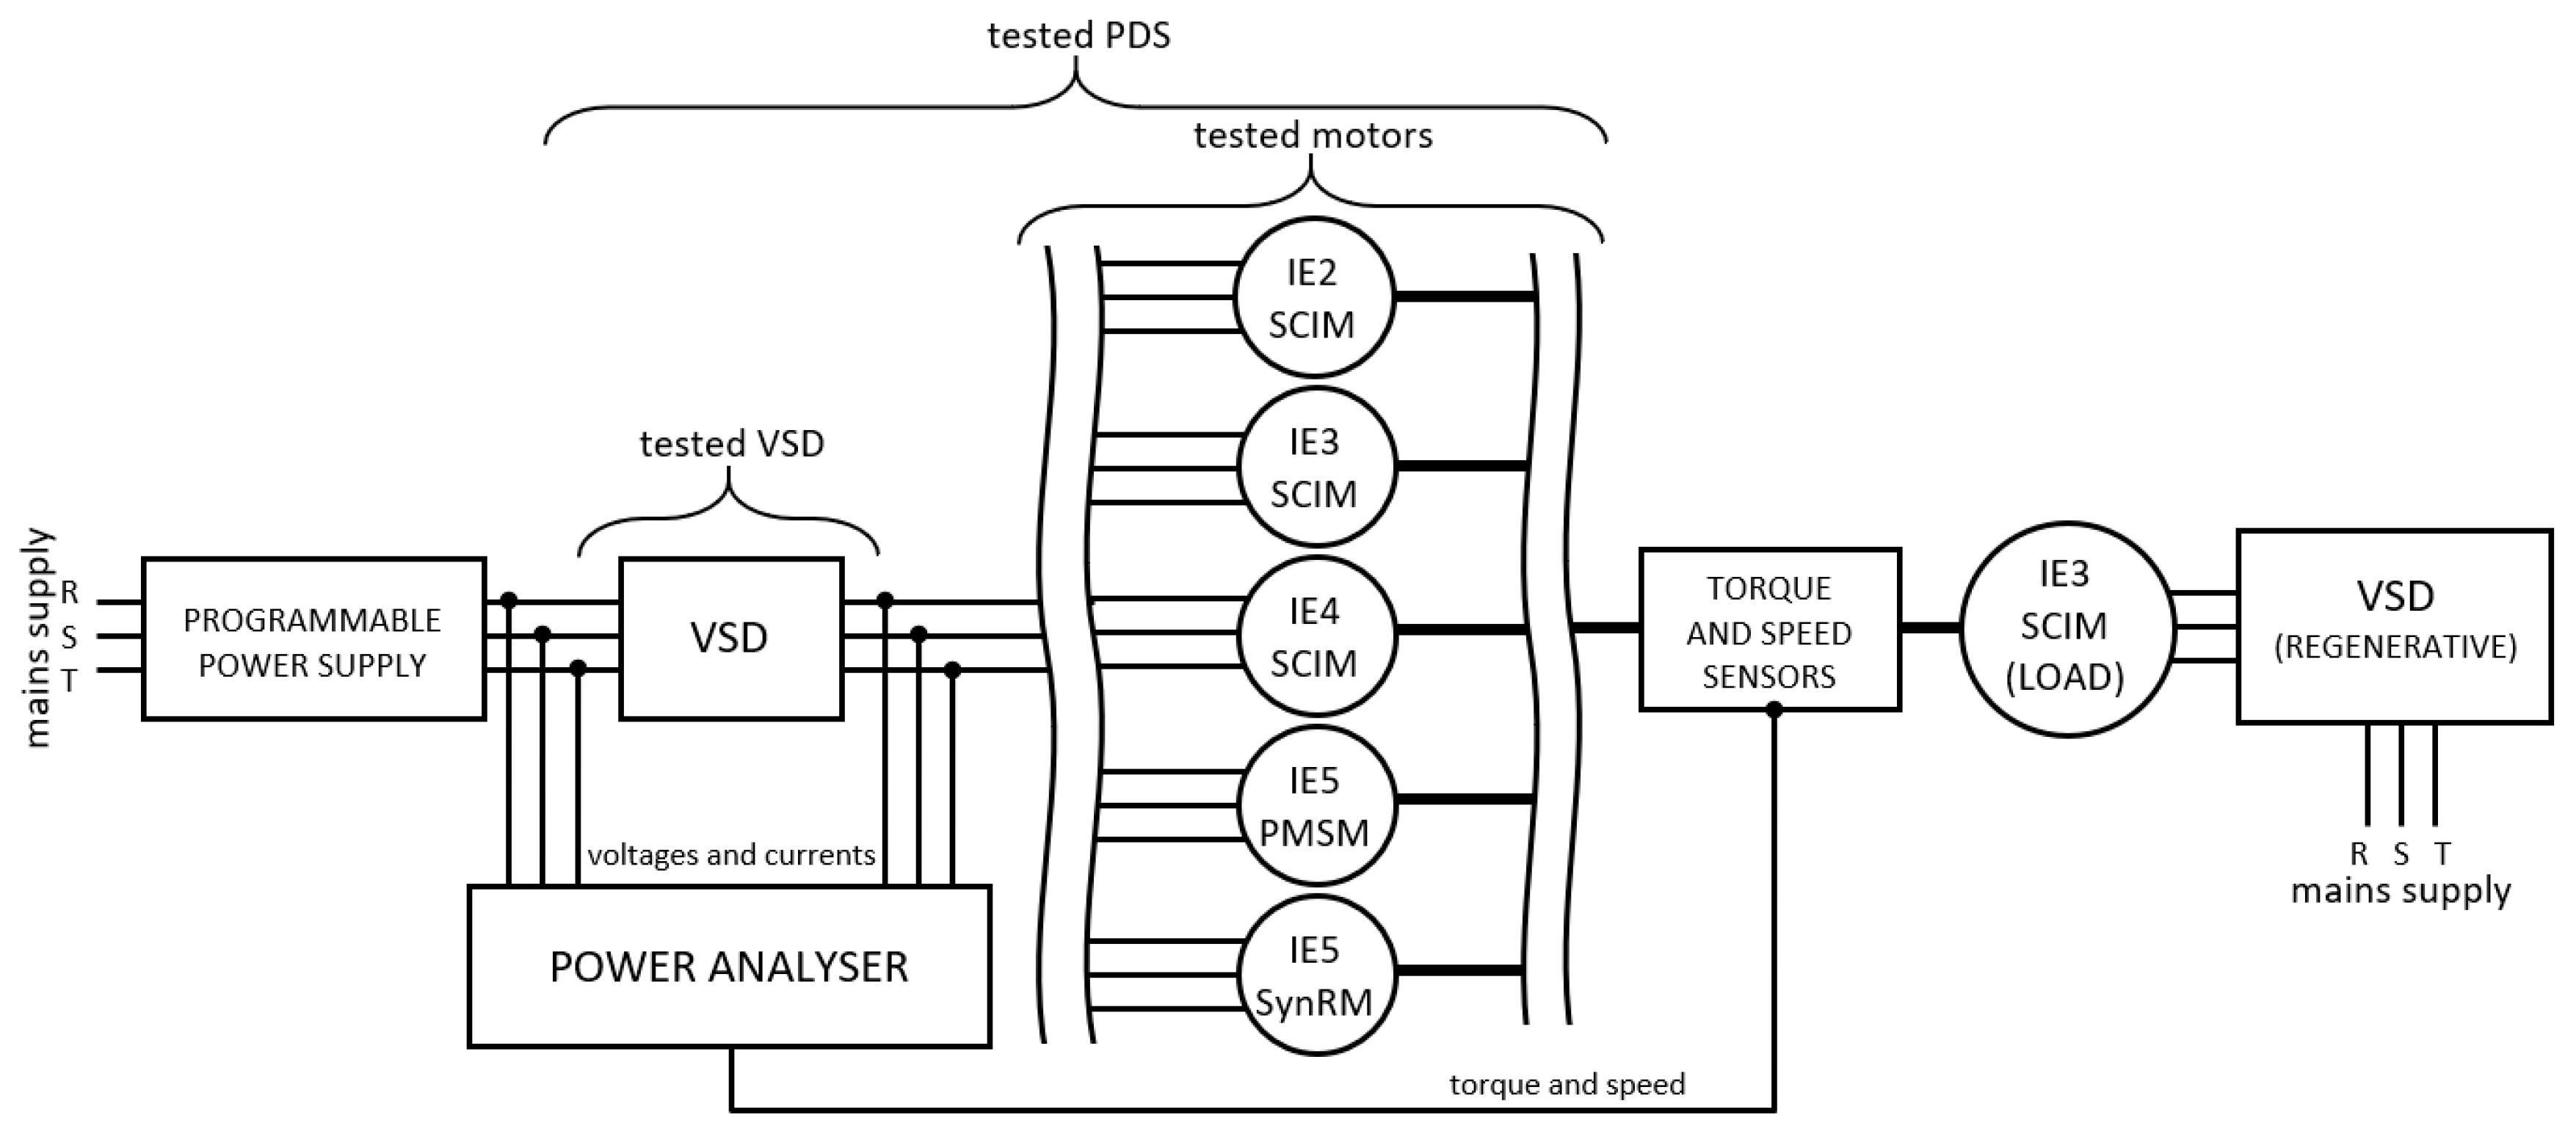
To understand how the standards described above can be used to compare the energy and economic performance of motors of different energy efficiency classes and using different technologies, four different 7.5-kW, three-phase motors were tested using the same variable-speed drive (VSD). The losses of the different power drive systems were determined for the eight standardized load points. The method described in the standard is then used to estimate and compare the energy use of the tested motor systems for two different pumping applications with different load profiles.
4.1. Tested Motors and Test Setup
In
Table 1, the main characteristics of the tested motors, are presented. All the motors were tested using the same high efficiency VSD (Danfoss VLT Automation Drive FC 302), and the same control strategy (torque/vector control).
The VSD “Automatic Energy Optimization” option was enabled for all tested motors. In this mode, the VSD continuously monitors the load of the motor and adjusts the output voltage accordingly to maximize the motor efficiency. For low load levels, the VSD output voltage is reduced until the motor current is minimized. Enabling this option, the motor benefits from increased efficiency, reduced heating, and quieter operation.
The test setup is represented in
Figure 8. The reference line-to-line voltage at the VSD input was set to 390 V. The electrical measurements were made with a precision power analyzer (YOKOGAWA WT1030M) at both input and output sides of VSD, which allowed direct determination of the motor, VSD, and PDS losses and efficiency for all load points.
The losses of the PDS, PL,PDS, are determined by subtracting the measured output mechanical power, Pout, to the measured input electrical power, Pin (Equation (1)):
4.2. Experimental Results
According to Section 7.7.3.5 of the standard IEC 61800-9-2, loss determination of the PDS can be made using the input-output method, which was the applied procedure. The power losses and the efficiency of the PDS was measured at the eight standardized load points defined in the same standard. Taking the graph represented in
Figure 2 (right) as reference, the required order of the measurements is from right-top (point 1) to left-down (point 8), meaning (% of rated speed, % of rated torque): 100, 100); (50, 100); (0, 100); (100, 50); (50, 50); (0, 50); (50, 25); (0, 25).
First, the PDS was run at motor rated speed and torque (point 1) until the motor reached a stable temperature-rise (defined as the external motor temperature measured directly at the motor housing/frame surface minus the ambient air temperature), meaning that the temperature variation was less than 2 K per hour. Due to the shorter time constant, it was assumed that the VSD had also achieved thermal stability at that time. When thermal stability is achieved, the supply voltage, input current, input power, input power factor, shaft torque, and shaft speed were measured and recorded with a precision power analyzer. All other operating points were measured in successive order immediately. The operating points at 50% (point 2) and at 20% (point 3) of rated speed were measured with unchanged torque settings. The motor torque was then reduced to 50% of its rated value, and measurements were taken at 100% (point 4), 50% (point 5) and 20% (point 6) of rated speed. Finally, motor torque was reduced to 25% of its rated value for the measurement at 50% (point 7) and 20% (point 8) of rated speed.
As electric motors exhibit an uneven current distribution and therefore uneven heating in their coils when the supply frequency is zero or very close to zero, the standard allows for the PDS losses to be measured at a speed corresponding to up to 12 Hz stator frequency instead of zero speed (300 r/min for the SCIMs and SynRM and 200 and 600 rpm for the PMSM). These losses were used without further extrapolation as the losses at the load points (3), (6), and (8), as shown in
Table 2.
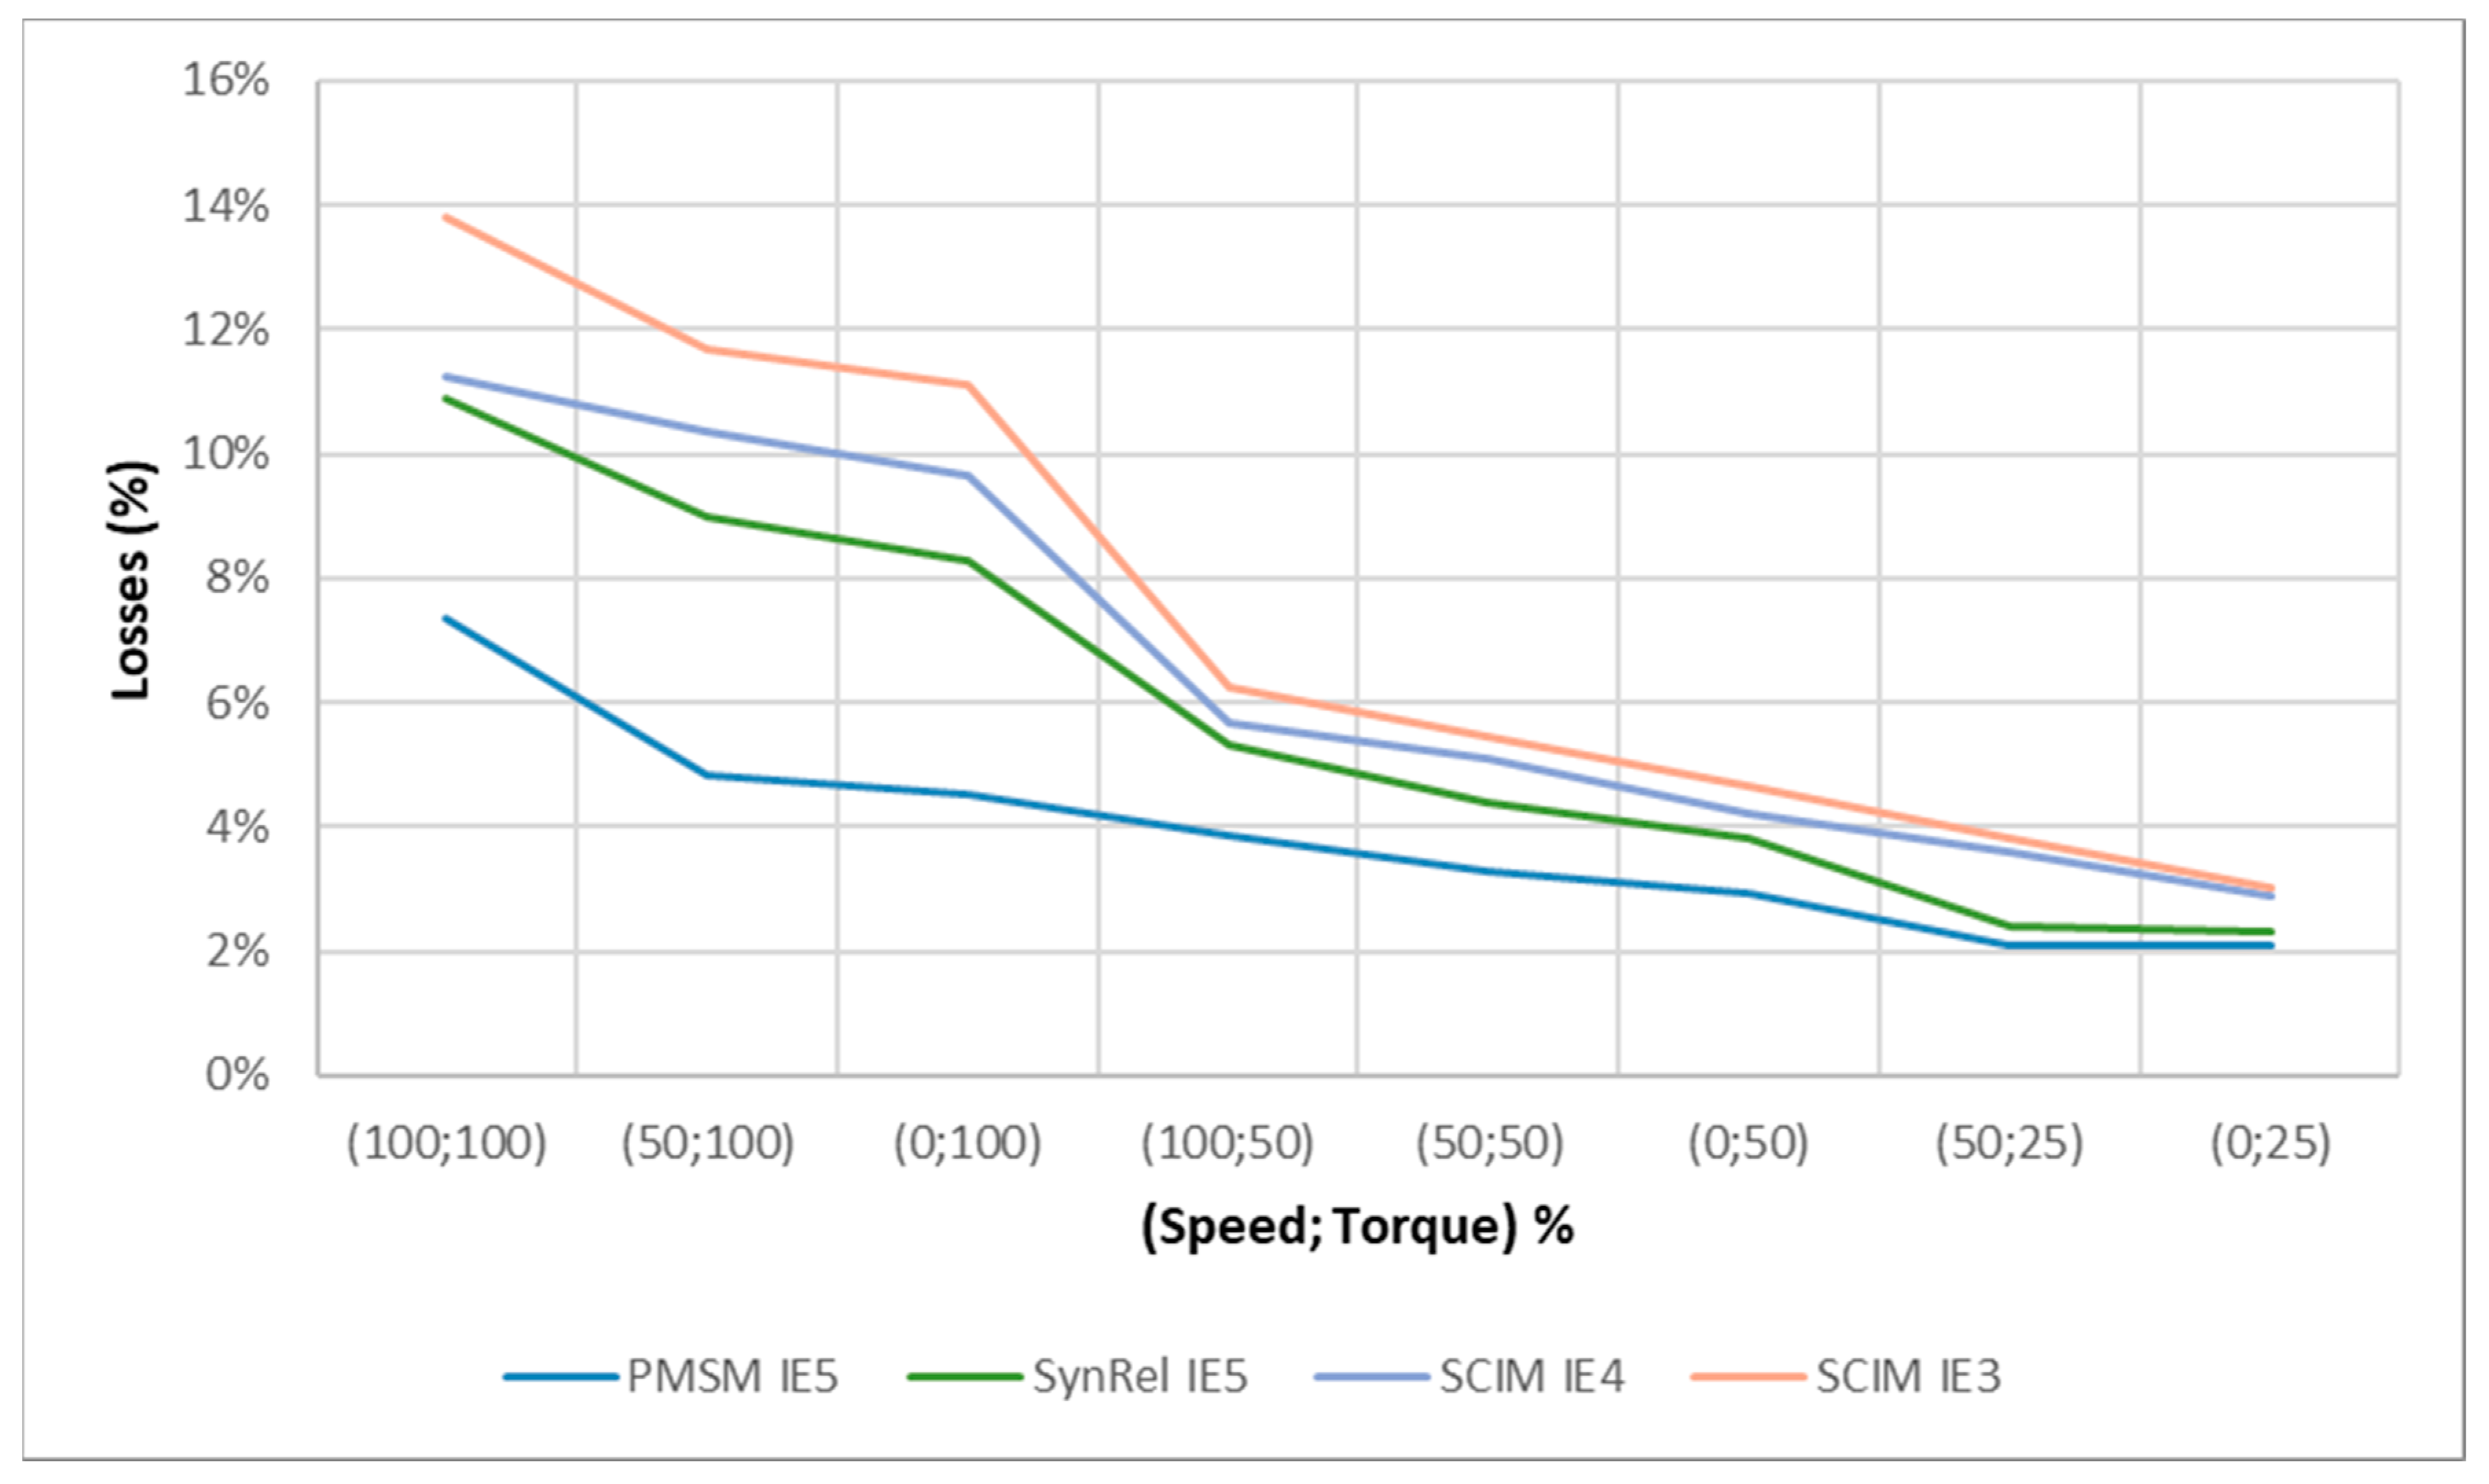
In
Figure 9, the measured losses of the PDS as a percentage of the output rated power are presented for the four tested motors.
In terms of efficiency, the best system is that with PMSM IE5 for all the eight operating points, as expected.
4.3. Estimation of the PDS Lifetime Energy Performance for Particular Applications
As discussed in
Section 3.2., knowing the values of the PDS losses in the eight operating points defined in standard IEC61800-9 allows users to evaluate the performance (both energy- and economic-wise) of any application for which typical operating points are known. In this paper, two pumping applications with different load profiles shown in
Table 3 are examined. The first load profile (LP1) corresponds to a typical HVAC application, while the second (LP2) is the typical load profile for a clean water pumping application, defined on the basis of the results of the European Ecodesign Directive Pump study [
18,
19].
The losses at these percent flow rate points are known from the tests for load points (100, 100) and (50, 25), and need to be estimated, for points (75, 50) and (25, 12.5). The estimation is done by interpolation using the method defined in standard IEC61800-9-2. Hence, the power losses for the operating point (75, 50) can be calculated using Equation (2):
In a similar manner, the power losses for the operating point (25, 12.5) can be calculated using Equation (3):
Combining the test results with the estimated values gives the PDS losses for all operating points (
Table 4).
Knowing the losses at these load points and the time spent at each load point for the defined application (see
Table 3) allows users to estimate the energy use of their application and compare the energy performance of different technical solutions as well as their economics. For the economic evaluation of the four different technologies, the assumptions presented in
Table 5 were made.
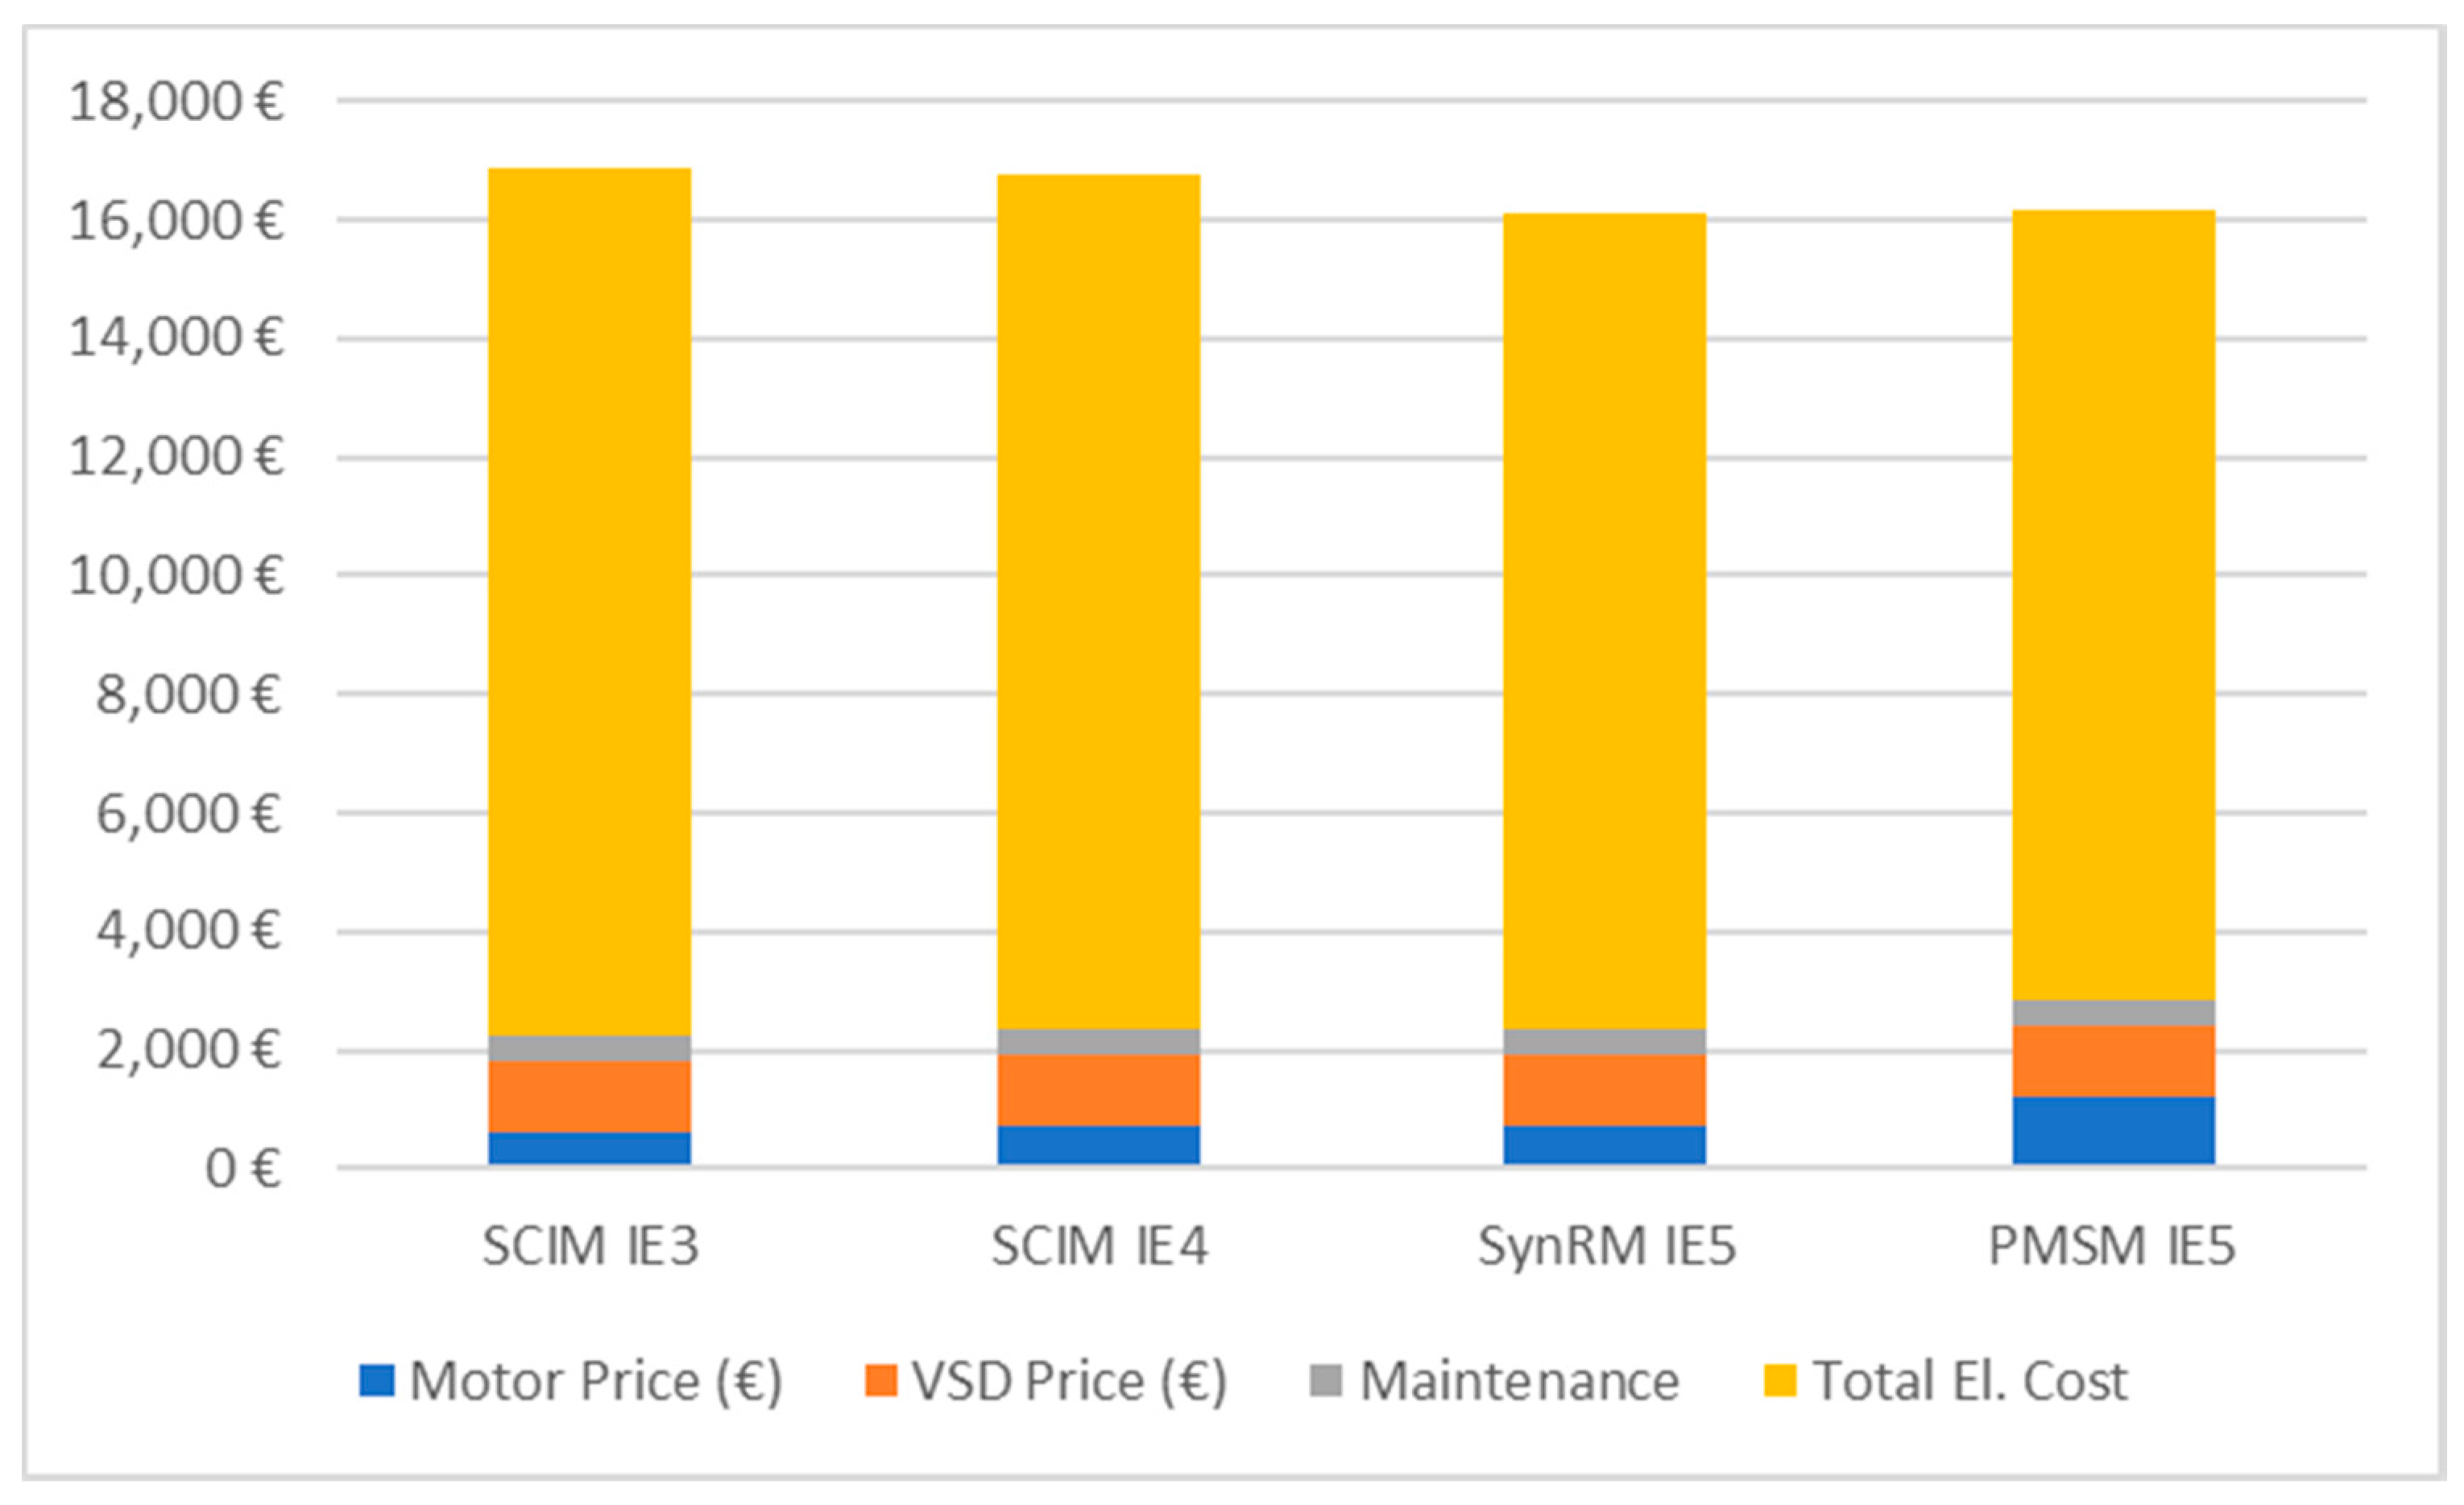
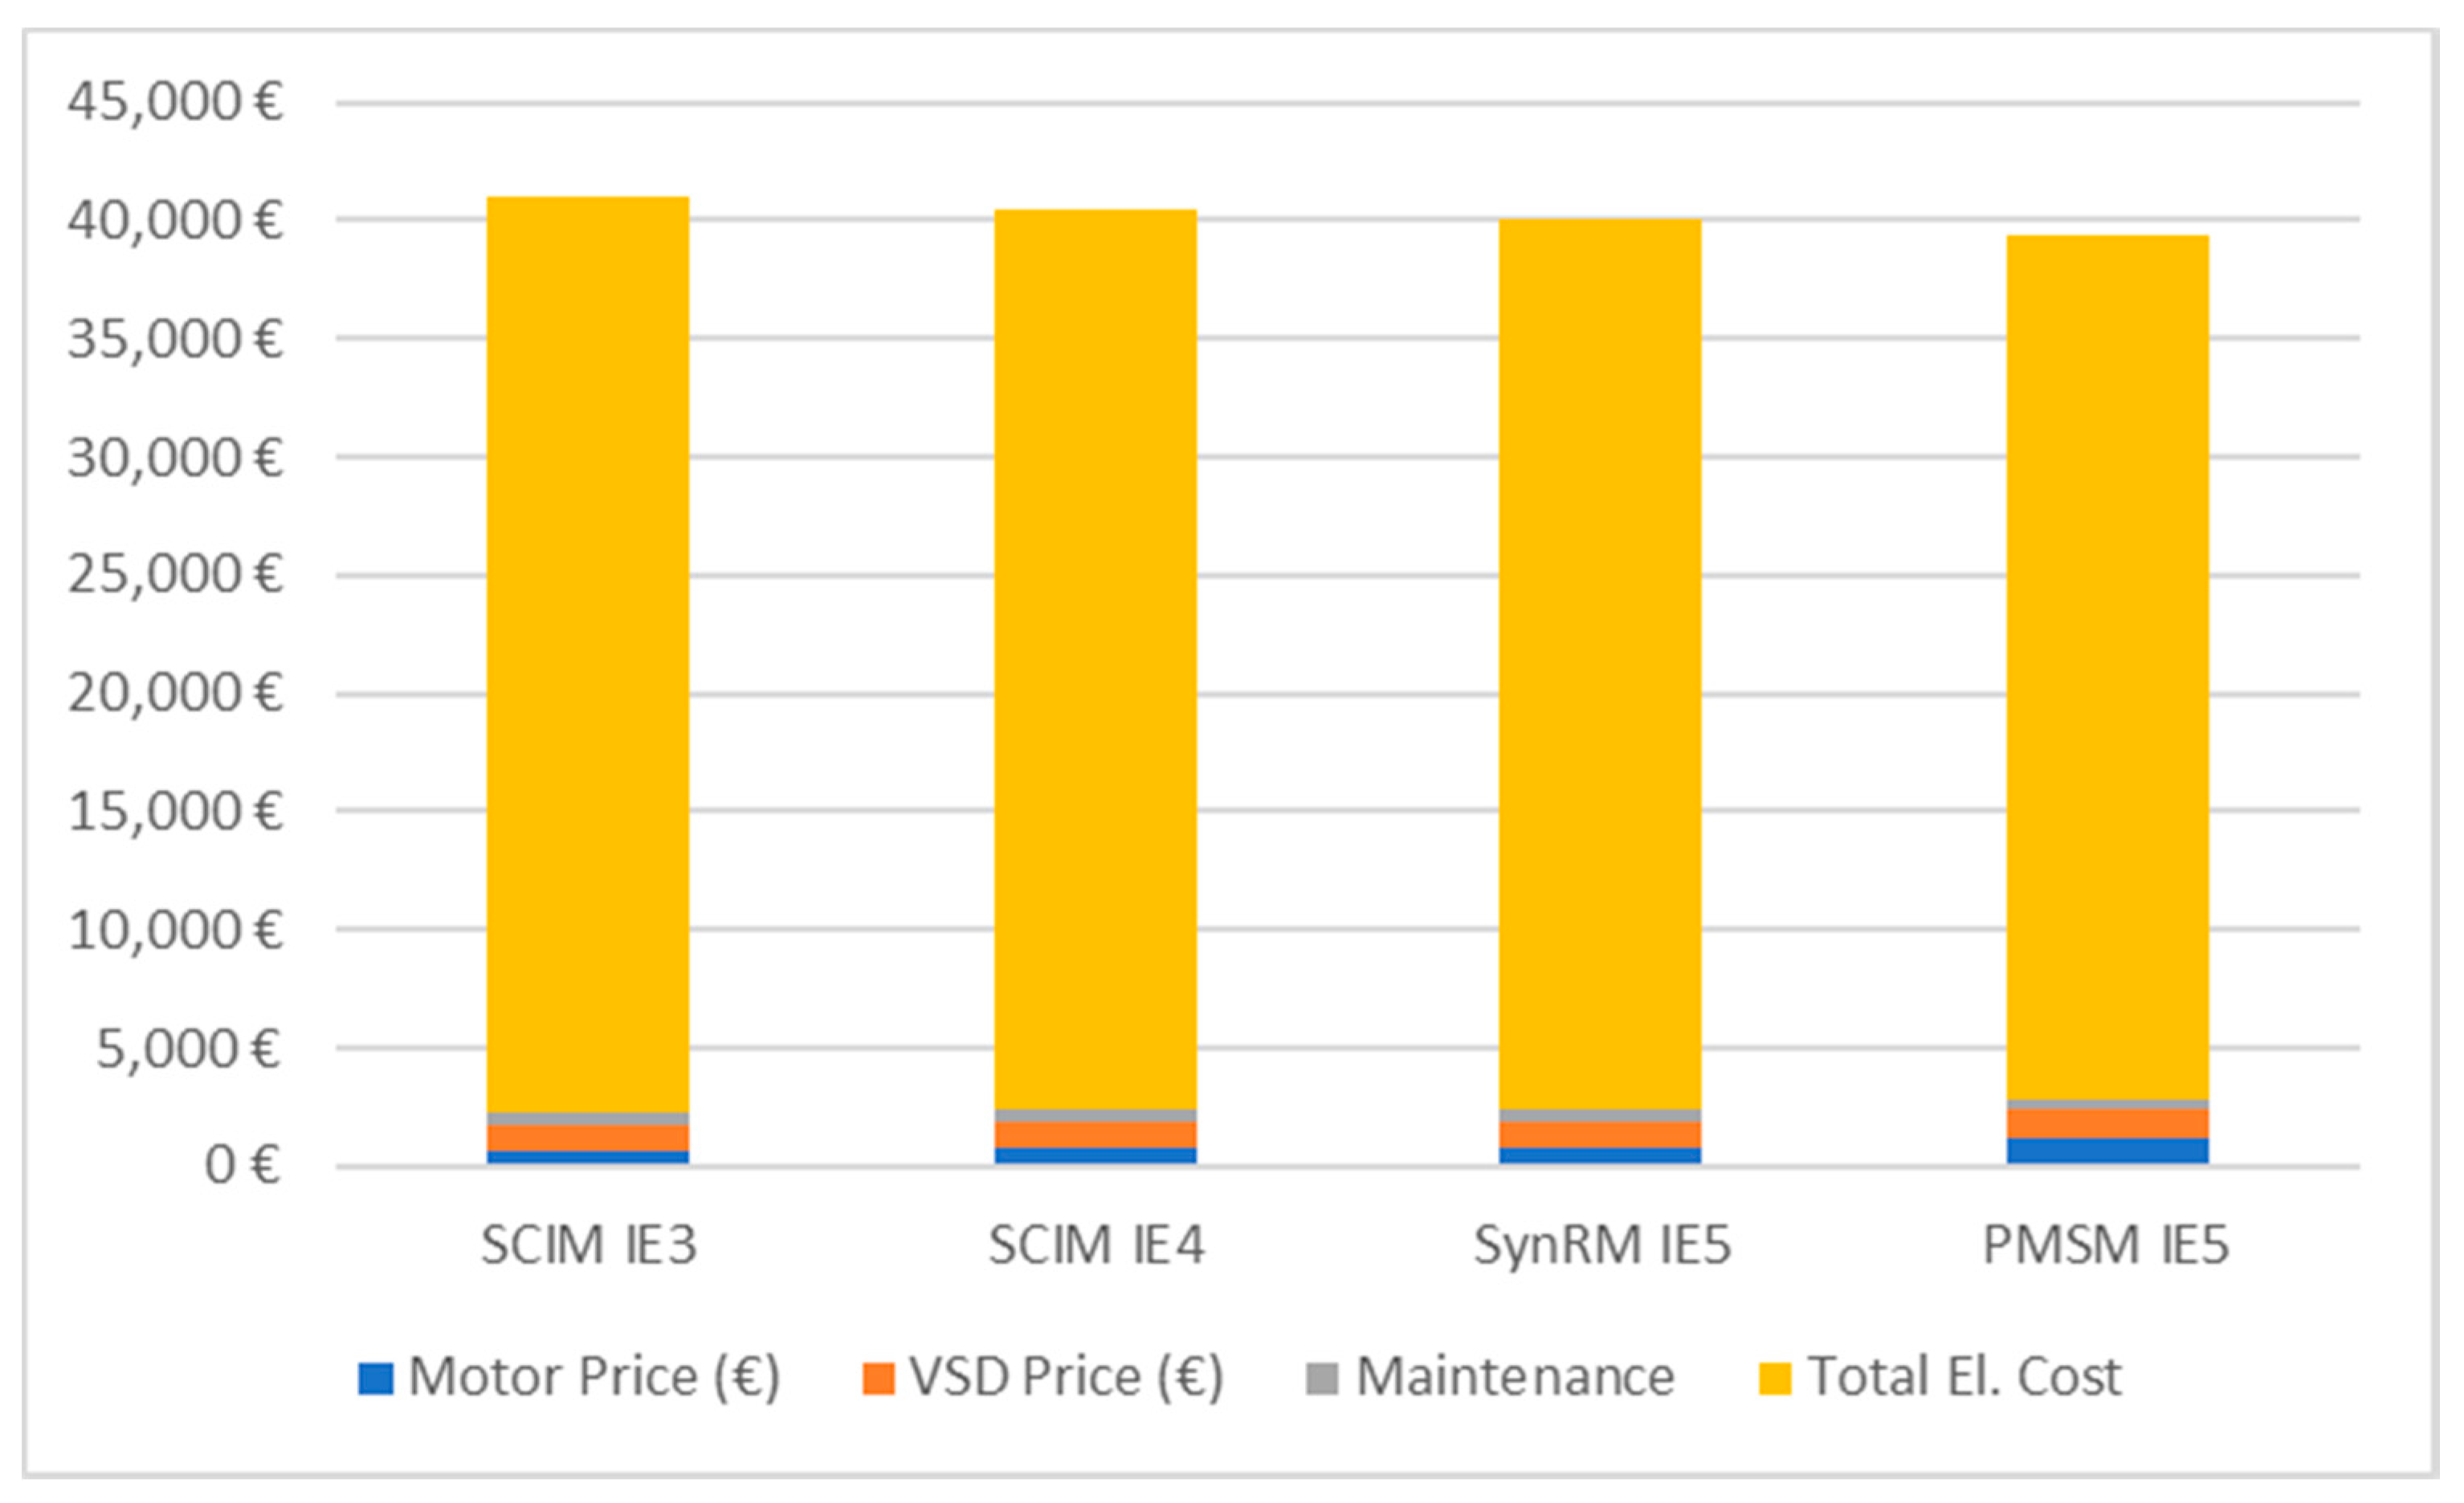
A comparison of the estimated total cost of ownership (TCO) for the two different load profiles considered is shown in
Figure 10 and
Figure 11, considering the motor is running for 4000 h/year.
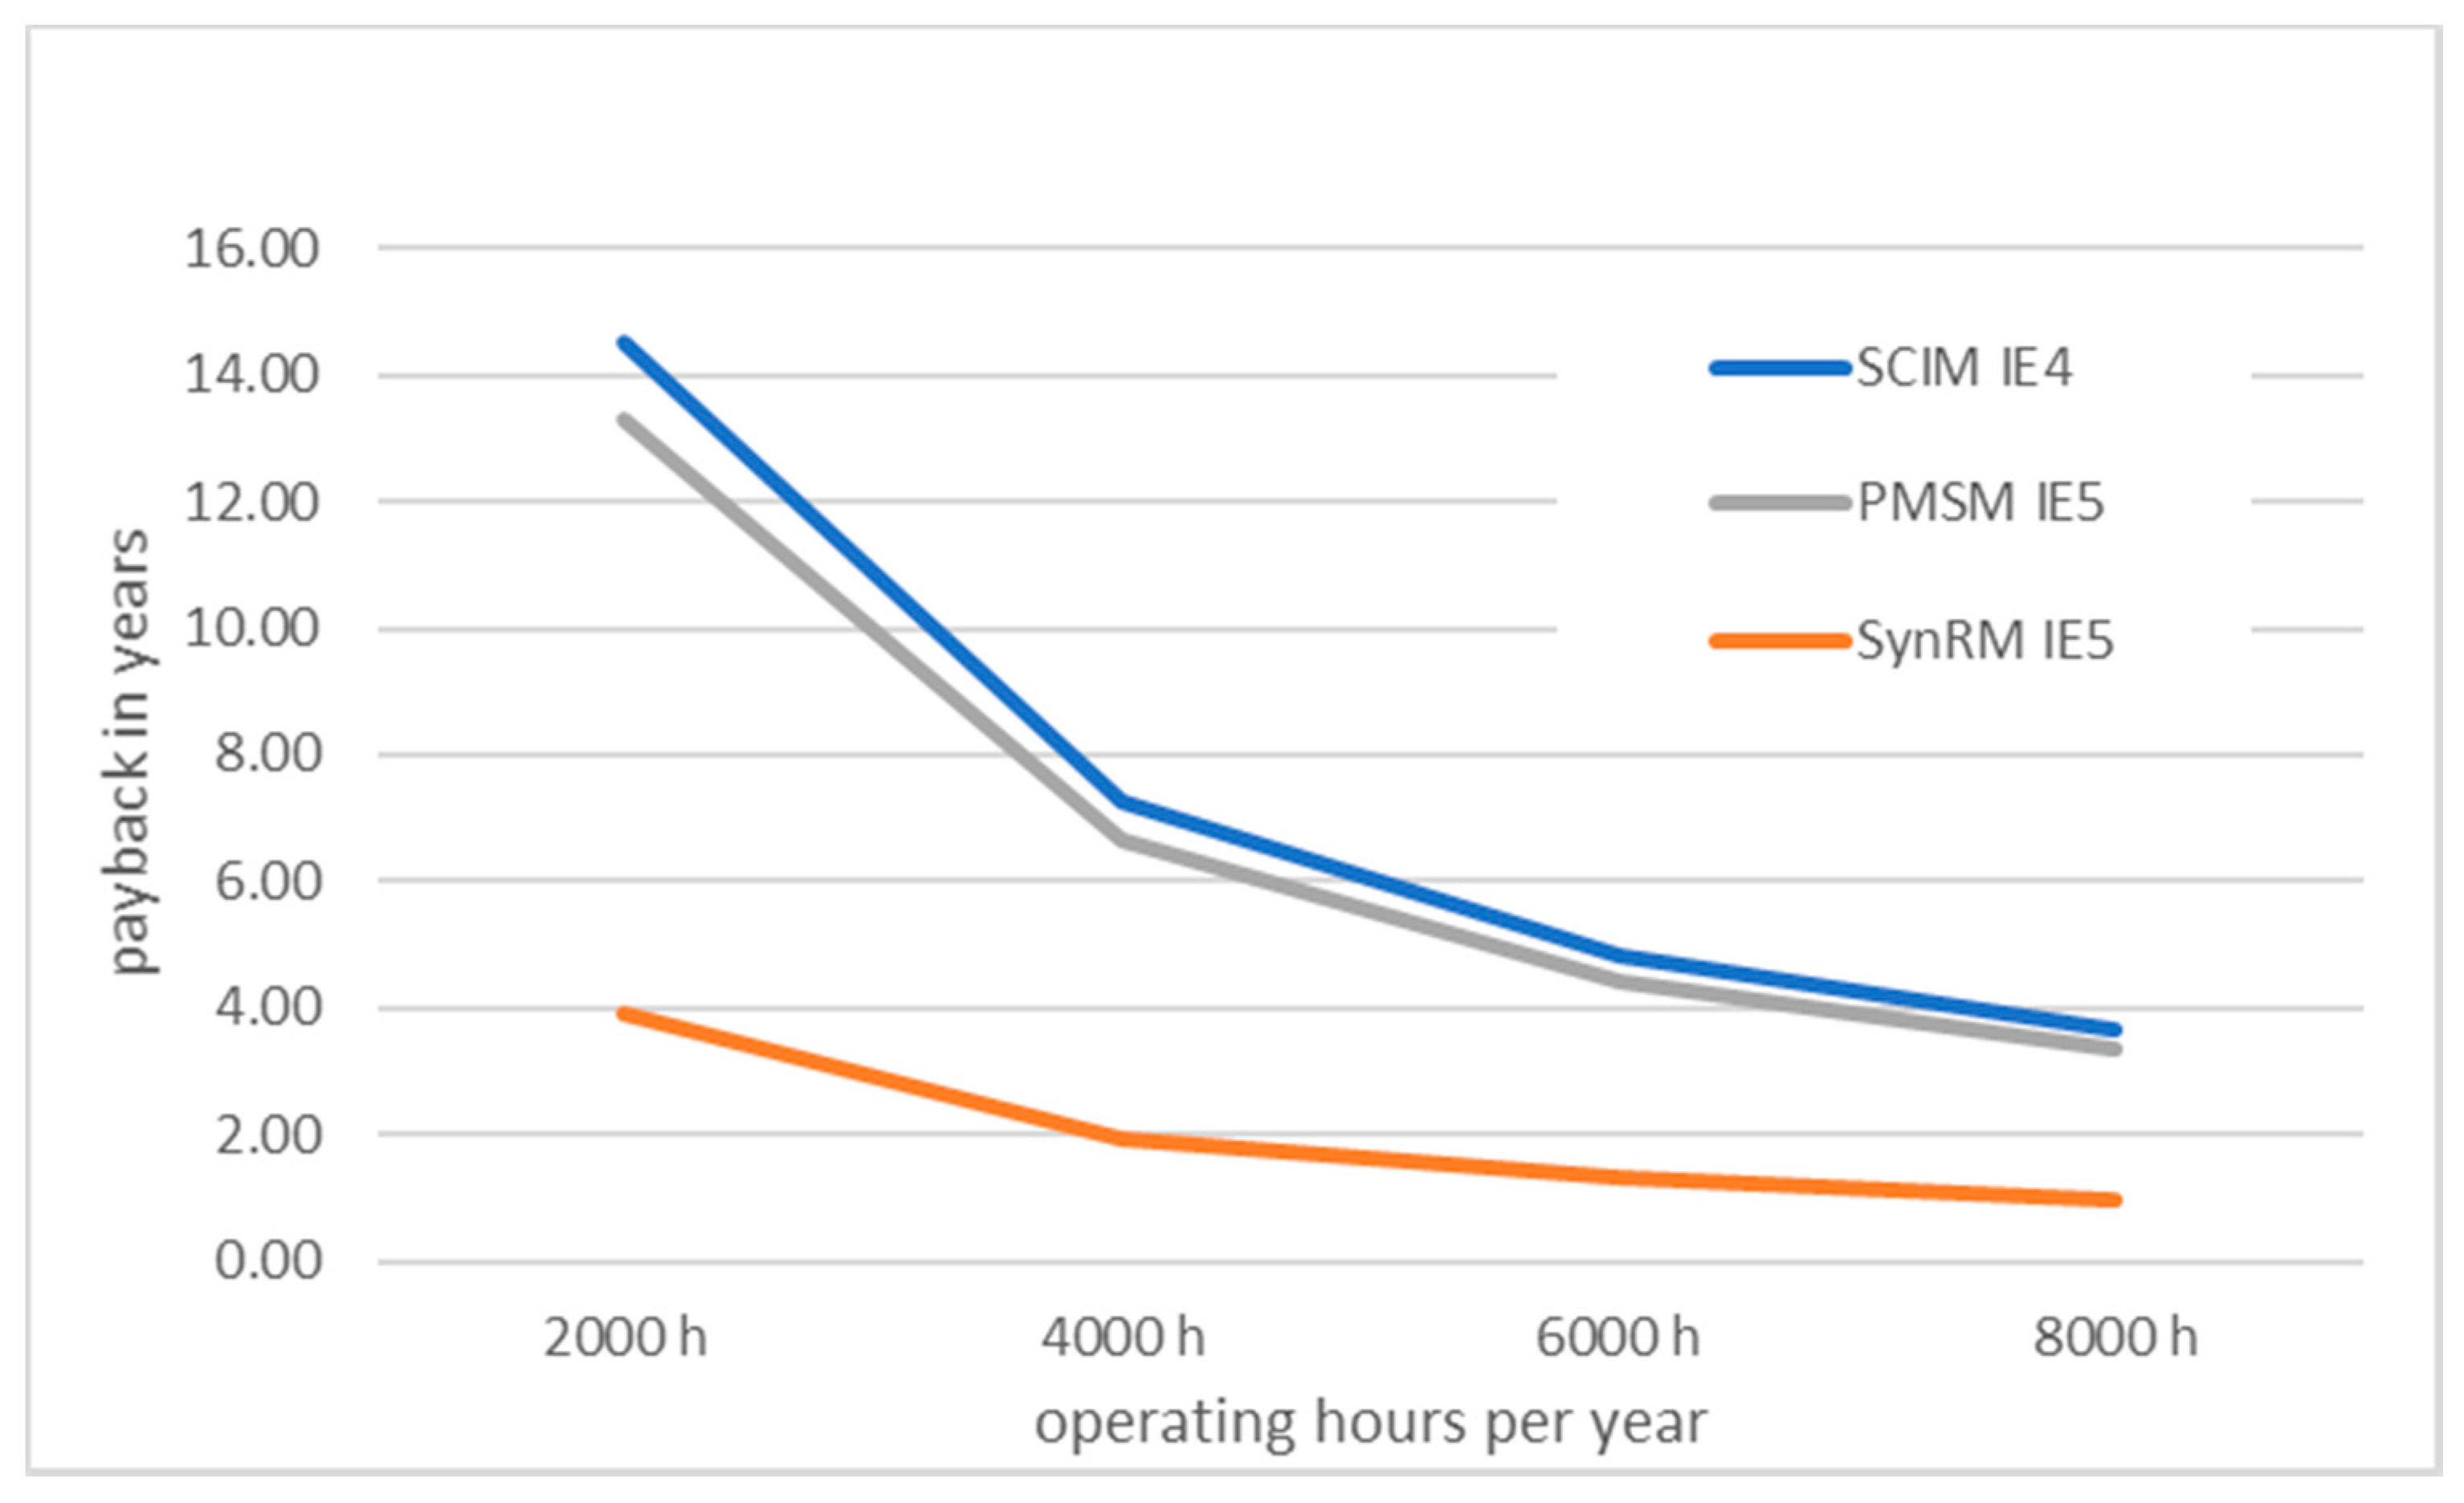
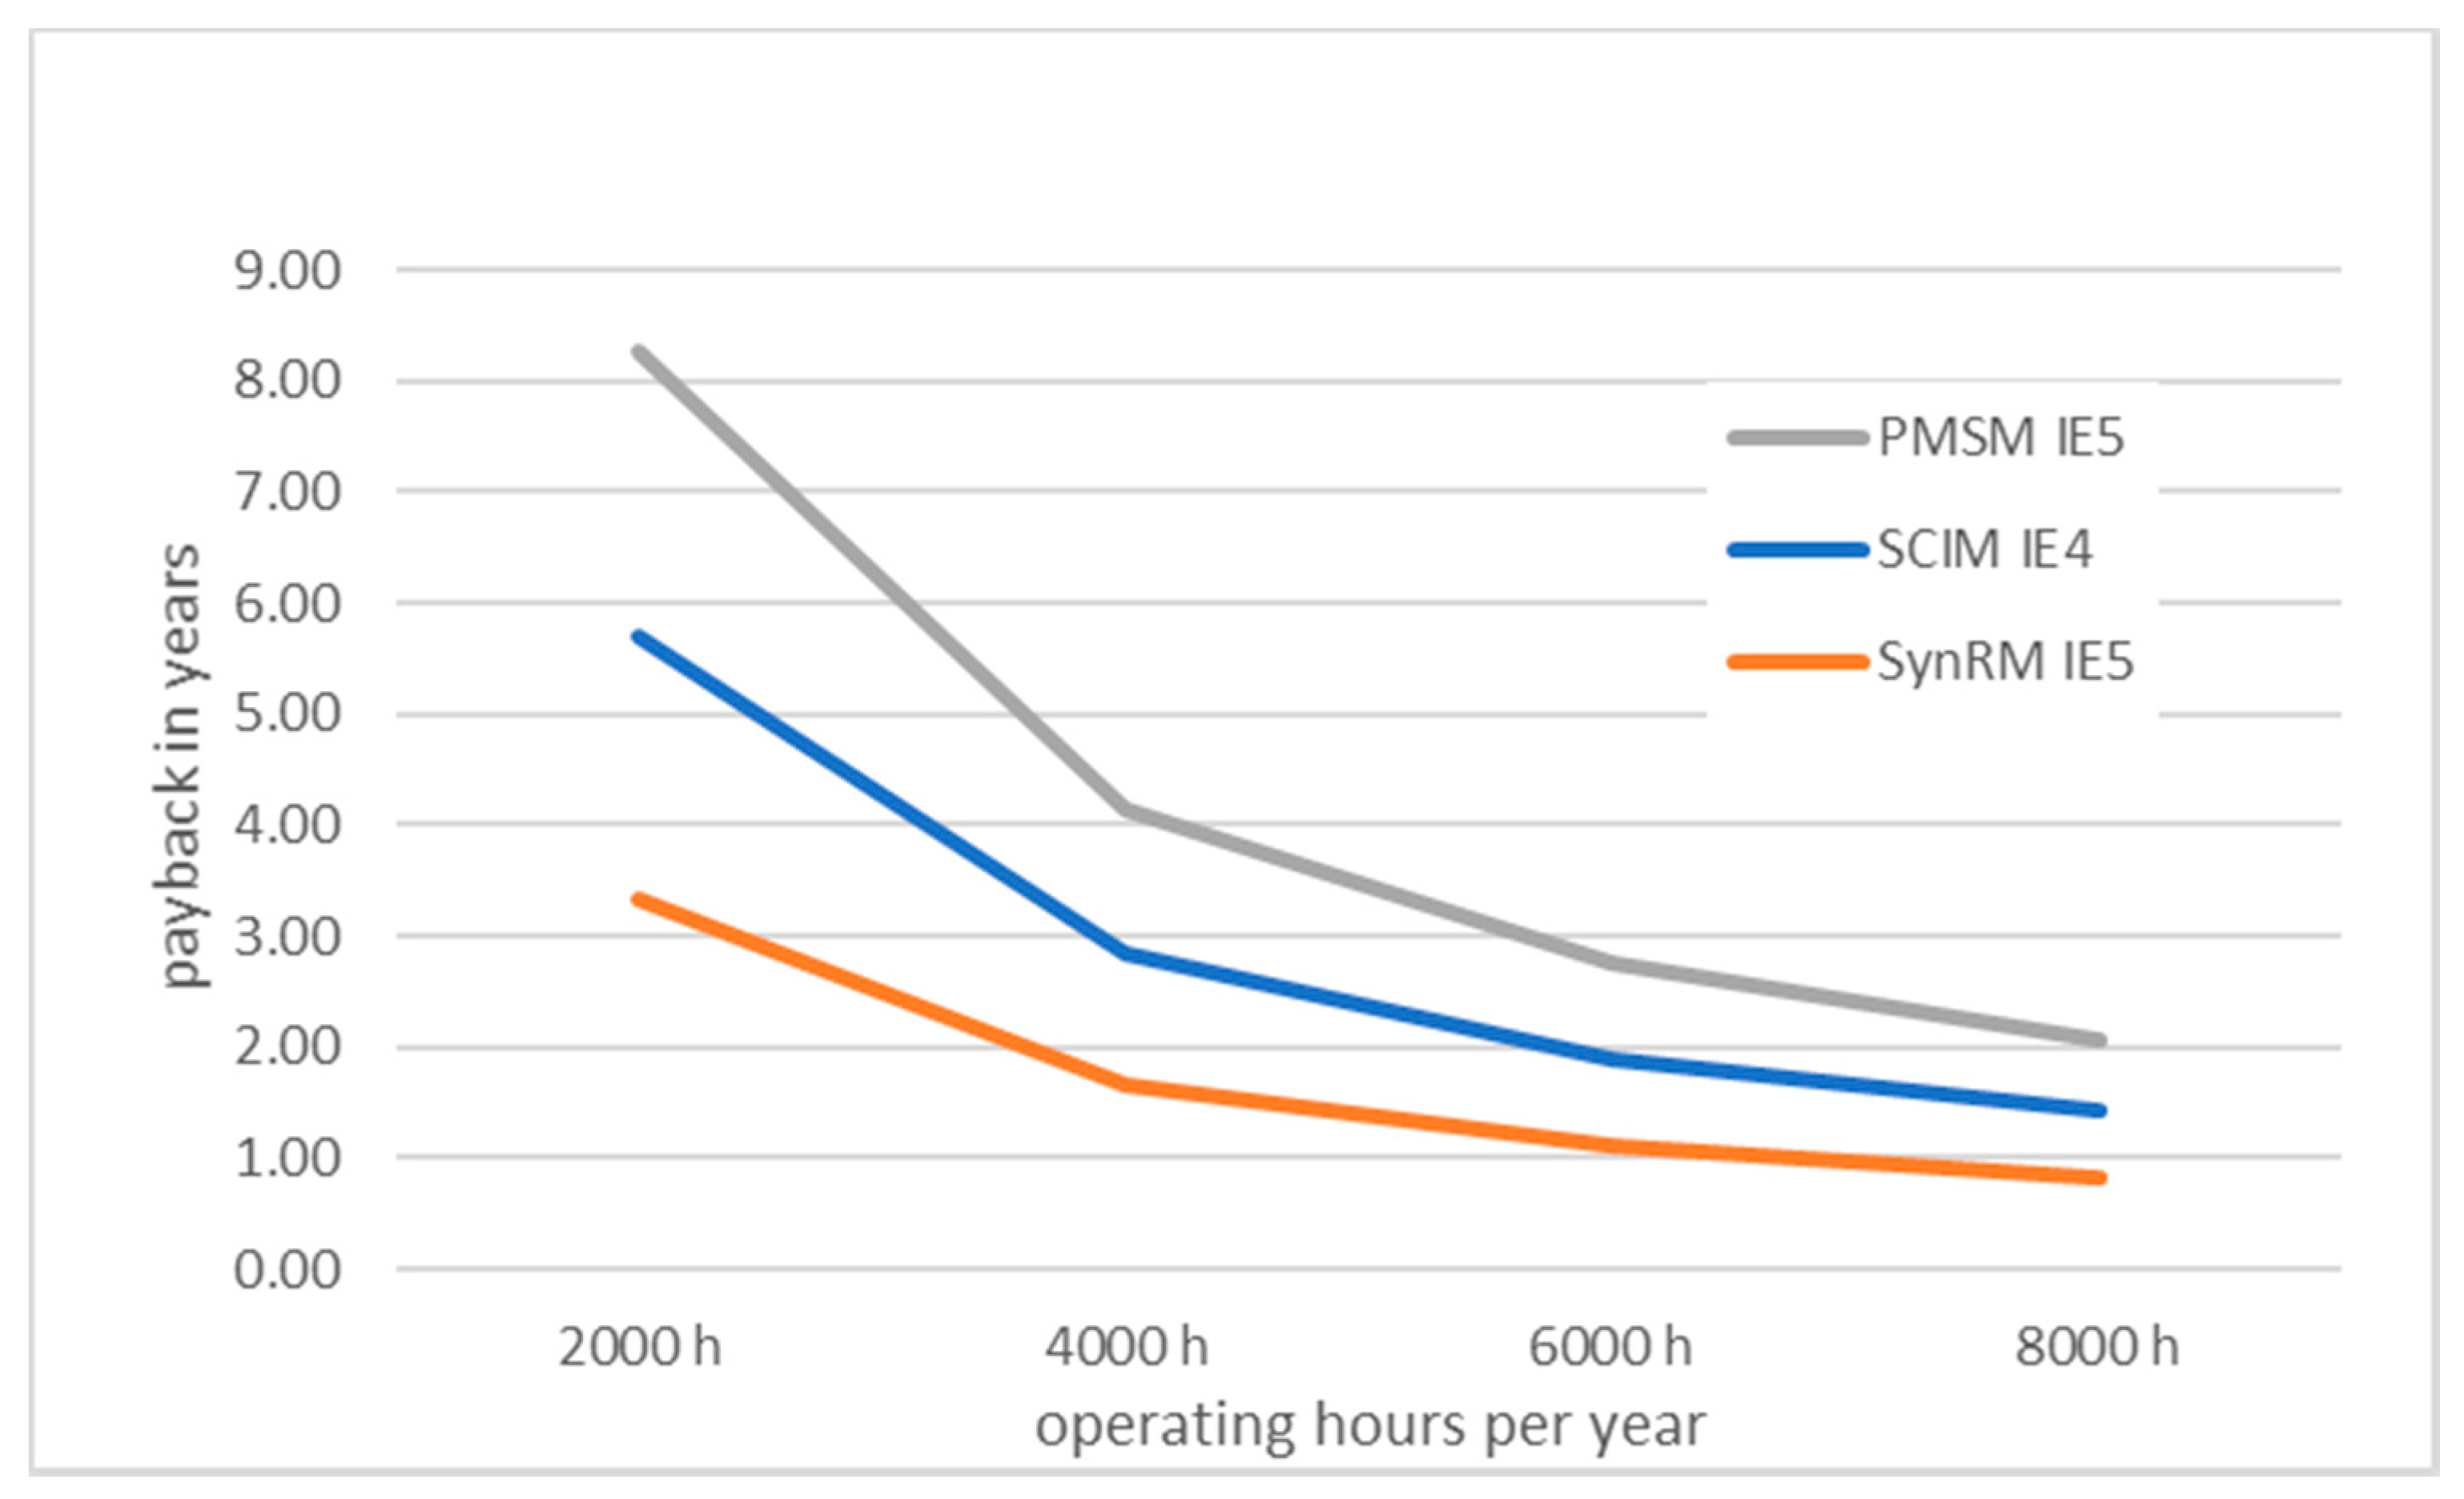
Figure 12 and
Figure 13 show the results of the calculation of simple payback considering a different number of operating hours per year. As would be expected payback improves with growing number of yearly operating hours. Likewise, the investment gets more favorable faster in load profile 2 where the energy consumption is more important due to the motor working more time at higher load points.
The results show that the load profile of the application has a great influence on its energy consumption, as would be expected. Therefore, the influence of the load profile on the investment economics is also large. In applications where the motor is running at low loads for a significant amount of time, as is the case for typical HVAC uses (LP 1), the loss reduction or efficiency gain when moving from the SCIM IE3 to SCIM IE4 or PMSM IE5 may not be enough to justify the additional initial investment. On the other hand, for load profiles in which the PDS is running at higher loads for larger periods of time, such as LP2, the investment in higher efficiency technologies becomes more attractive. If the number of operating hours is longer than 6000 h/year, the investment in the tested IE4-IE5 motor technologies leads to a payback time lower than three years for LP2. Because of their efficiency and comparatively lower costs in relation of other IE4 and IE5 technologies, synchronous reluctance motors lead to the most cost-effective solutions in variable load pumping applications.
As can be seen by these results, the standardized methodology described in the IEC 61800-9 standard series can be an important instrument for end-users to compare the different solutions available on the motor systems component market. Such a tool was, until now, unavailable. The publication of losses data for the eight standardized load points in manufacturers catalogues will hopefully become widespread and a valuable aid in energy efficient equipment selection, triggering energy savings and corresponding CO2eq emissions reduction in a cost-effective manner.


