
Investigating Slit-Collimator-Produced Carbon Ion Minibeams with High-Resolution CMOS Sensors


 ,
, 
Abstract
:1. Introduction
2. Methods
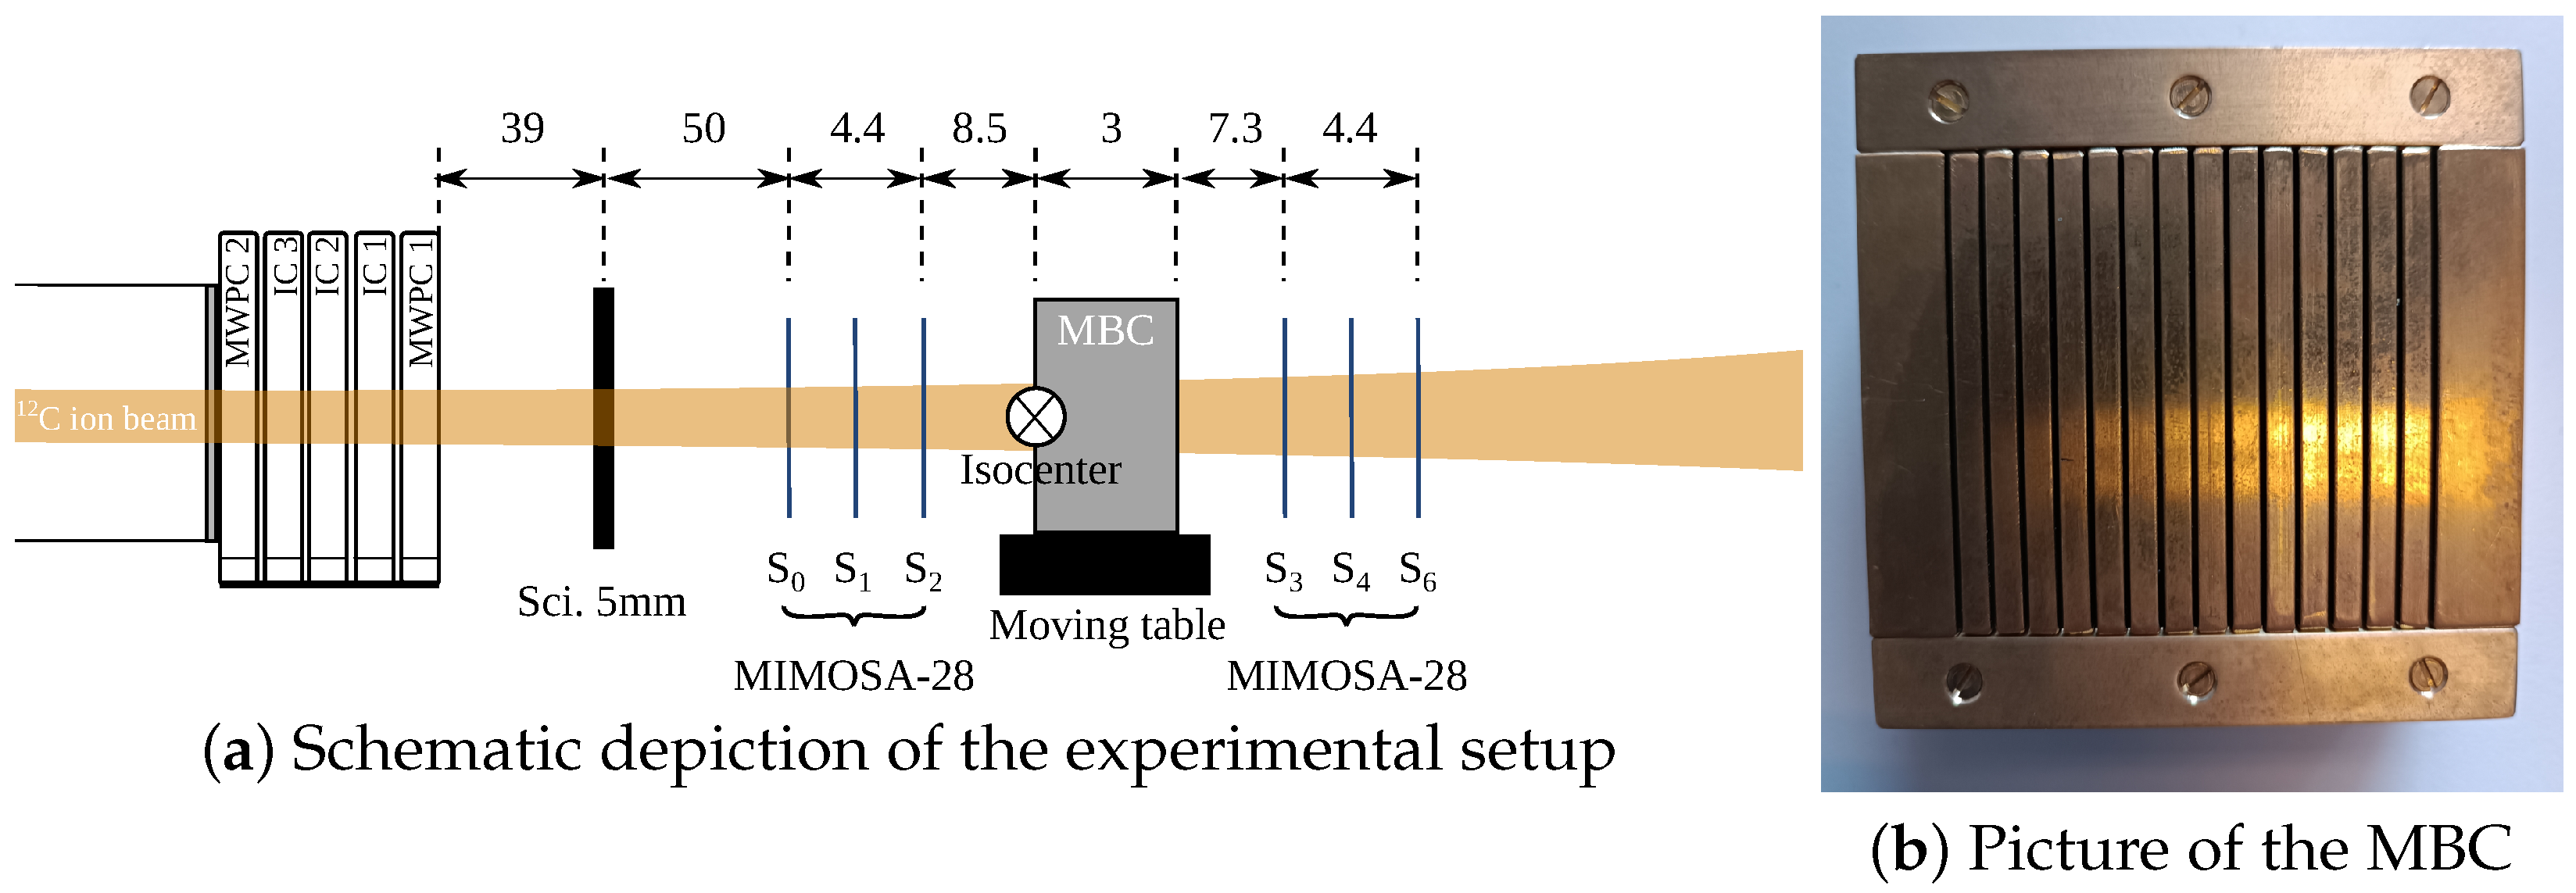
2.1. Experimental Setup
2.1.1. CMOS Sensors
2.2. Monte Carlo Simulations
2.2.1. Experiment Setup
2.2.2. Expanded Setup
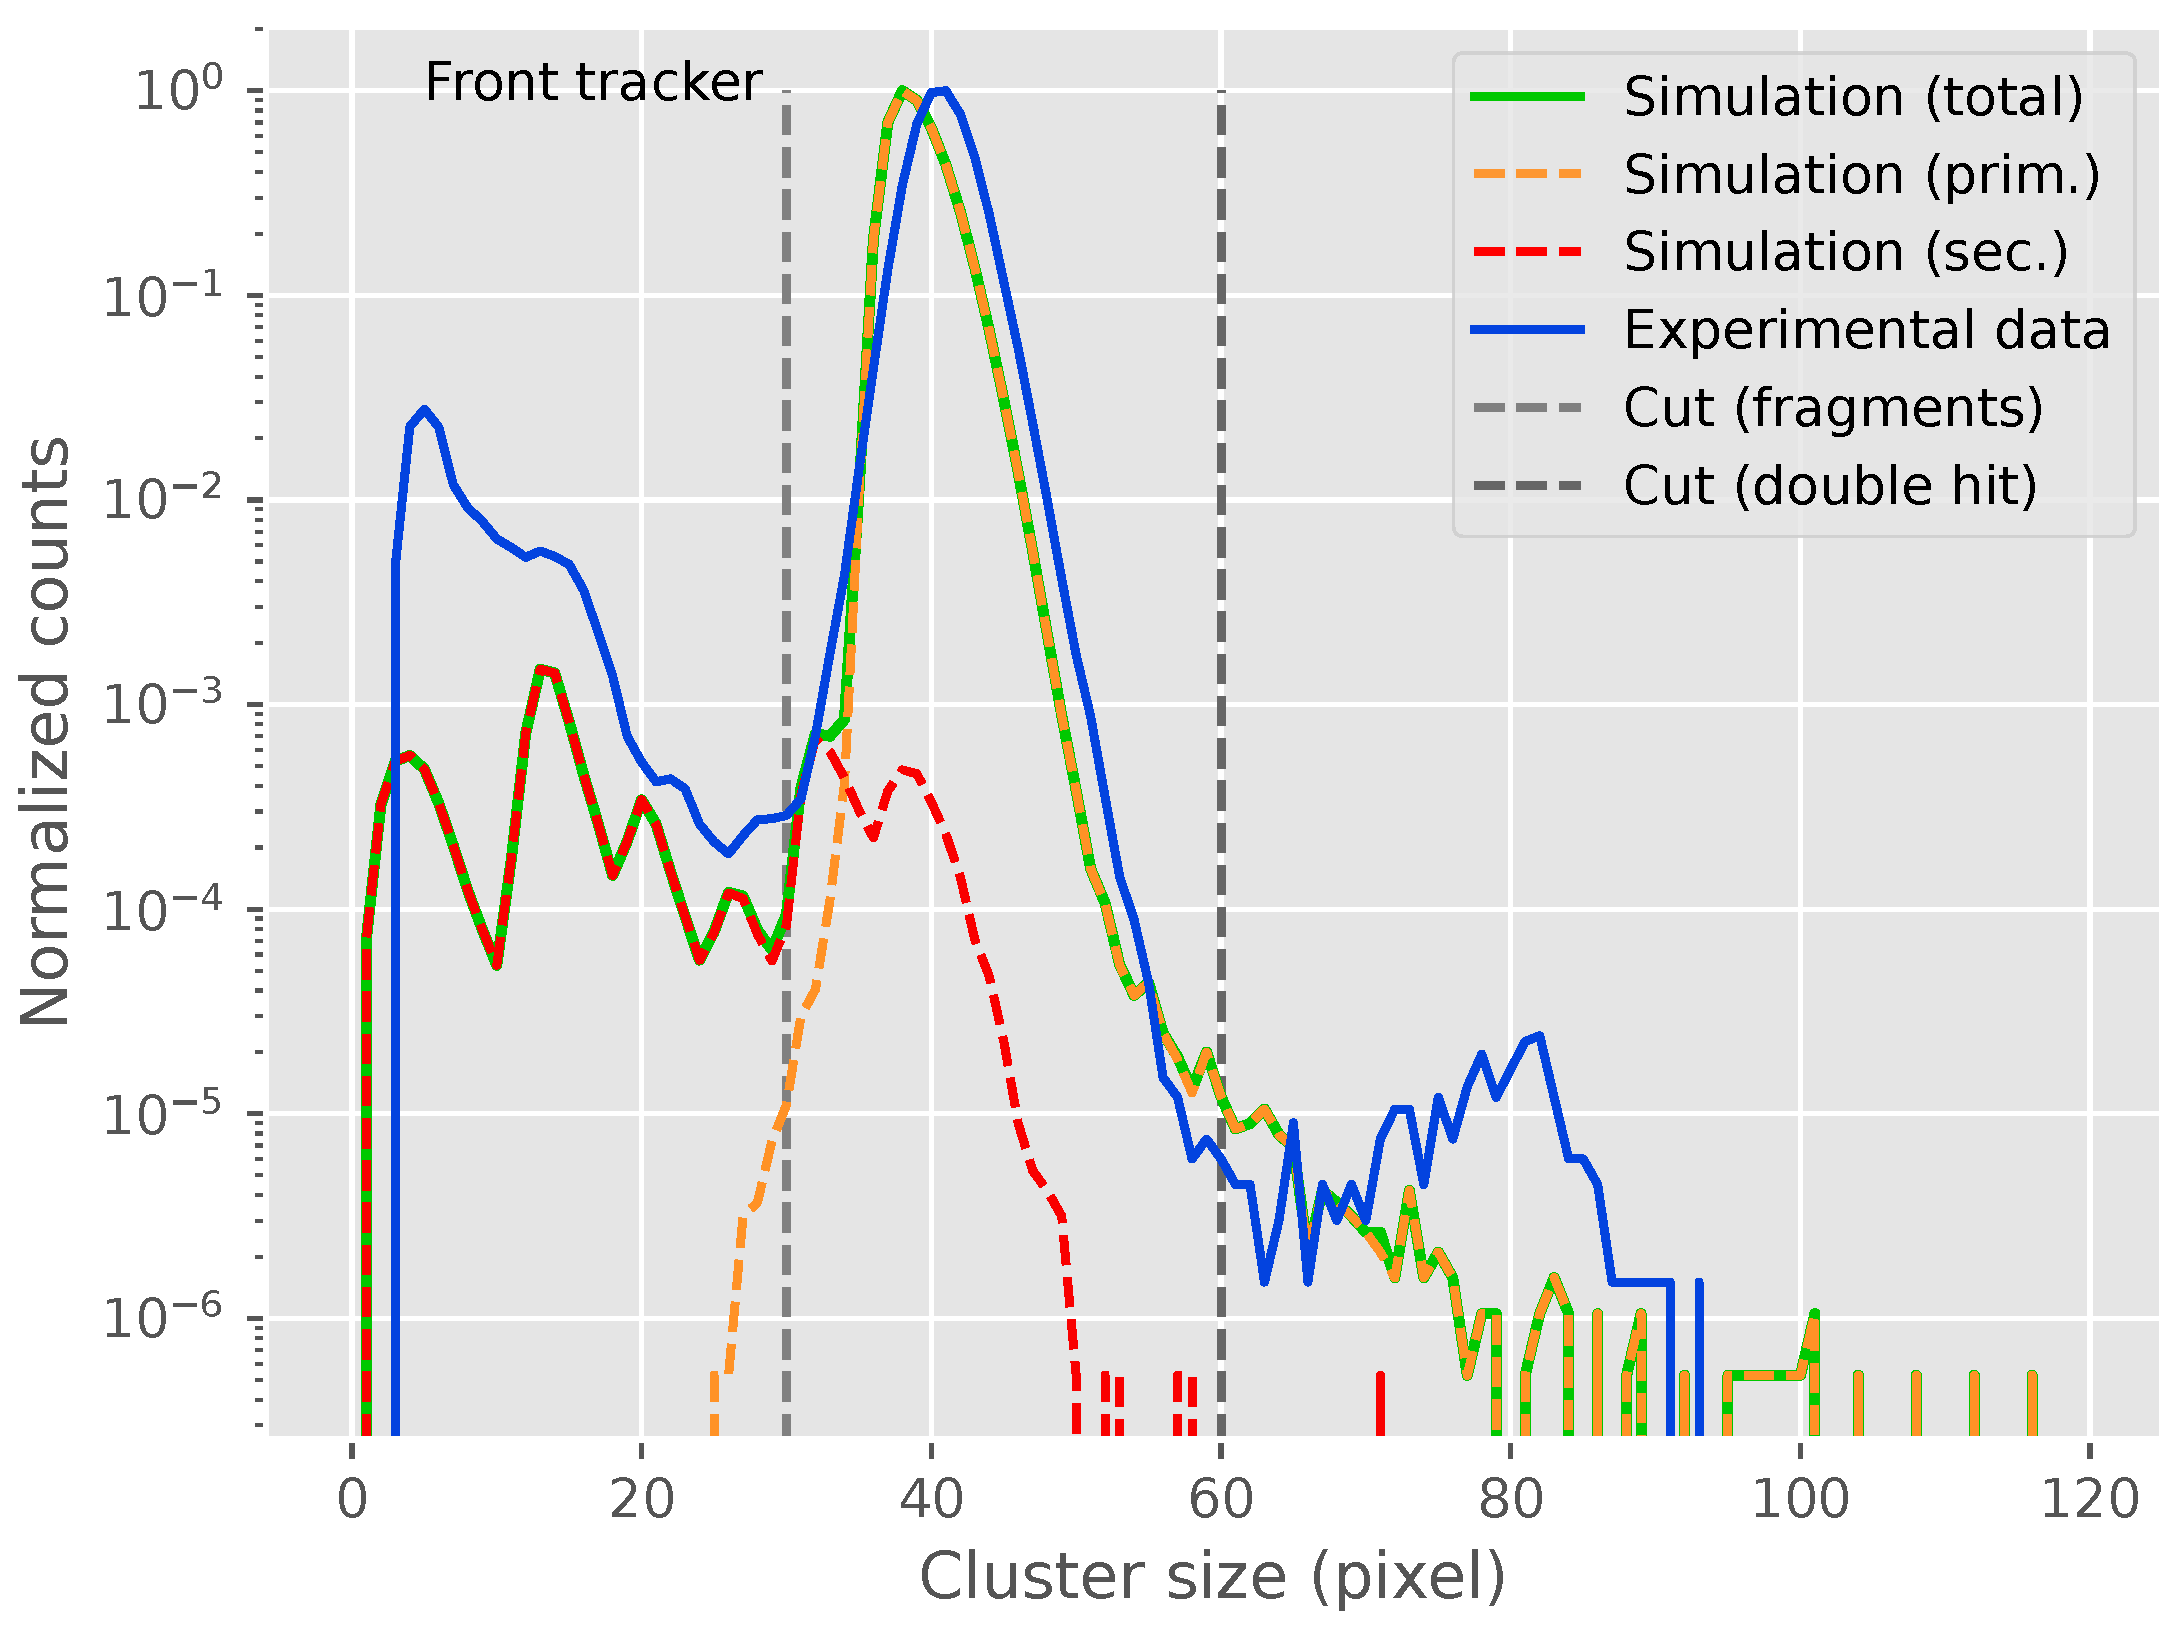
2.3. Particle Identification
3. Results
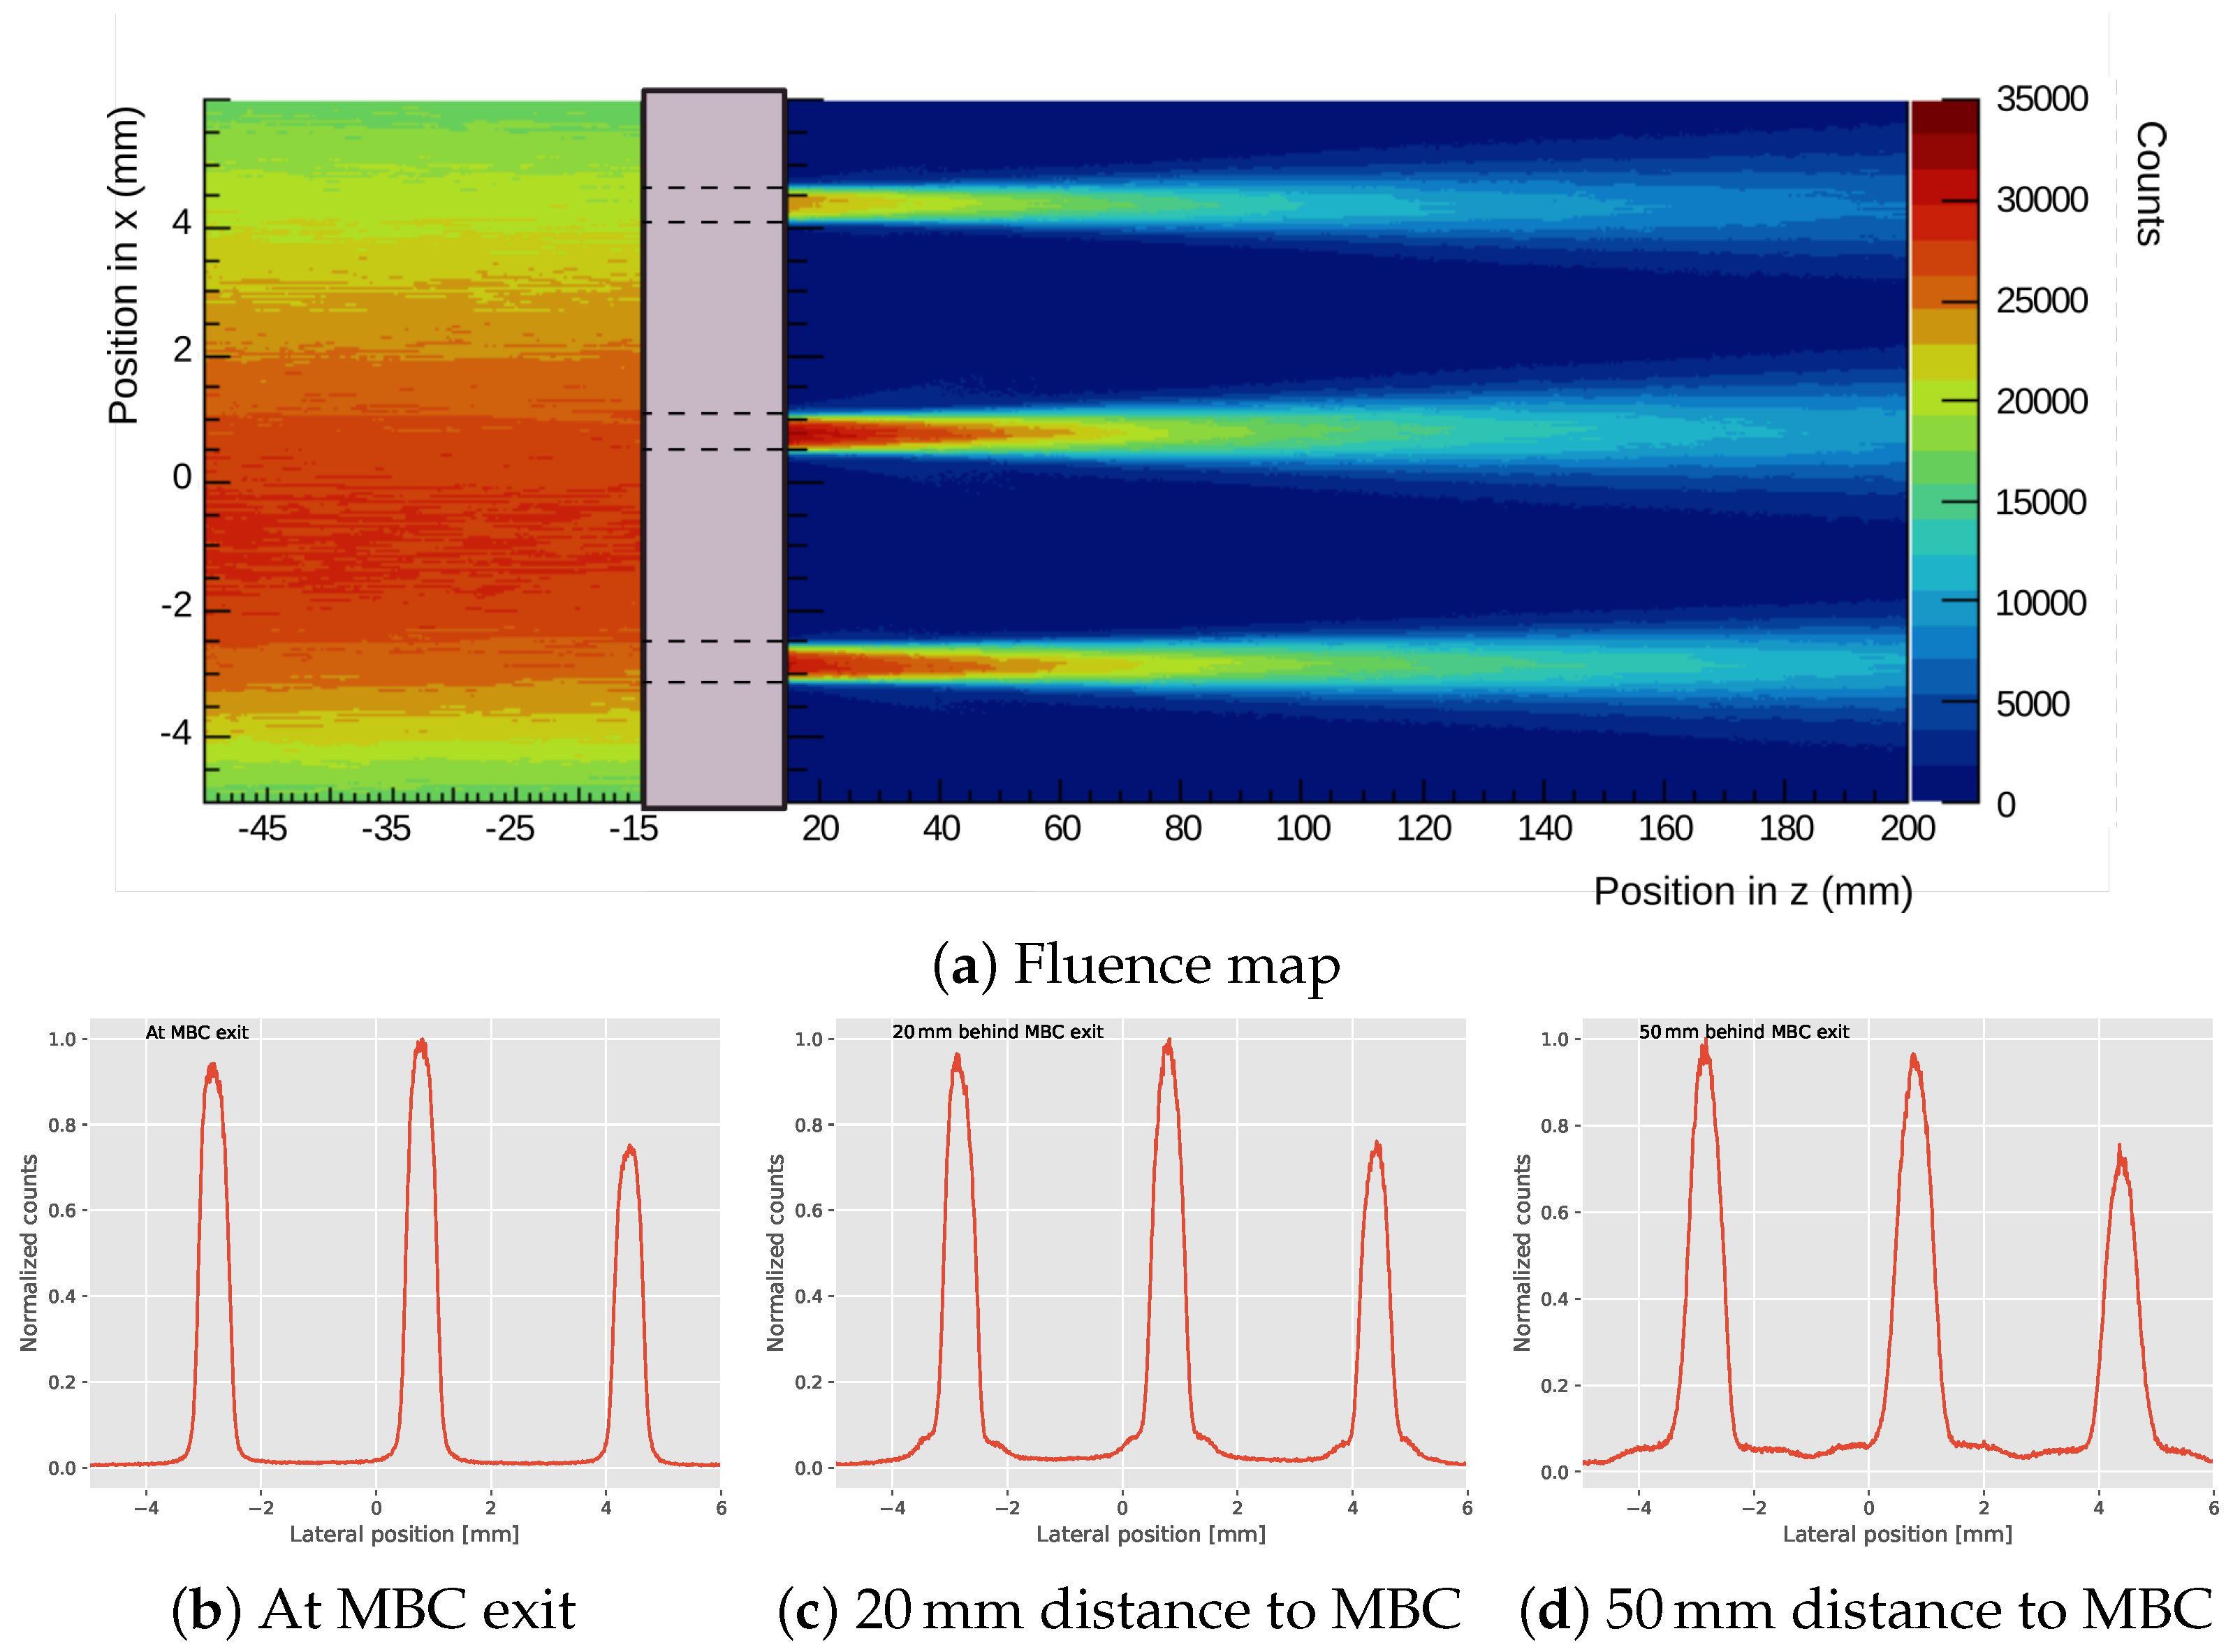
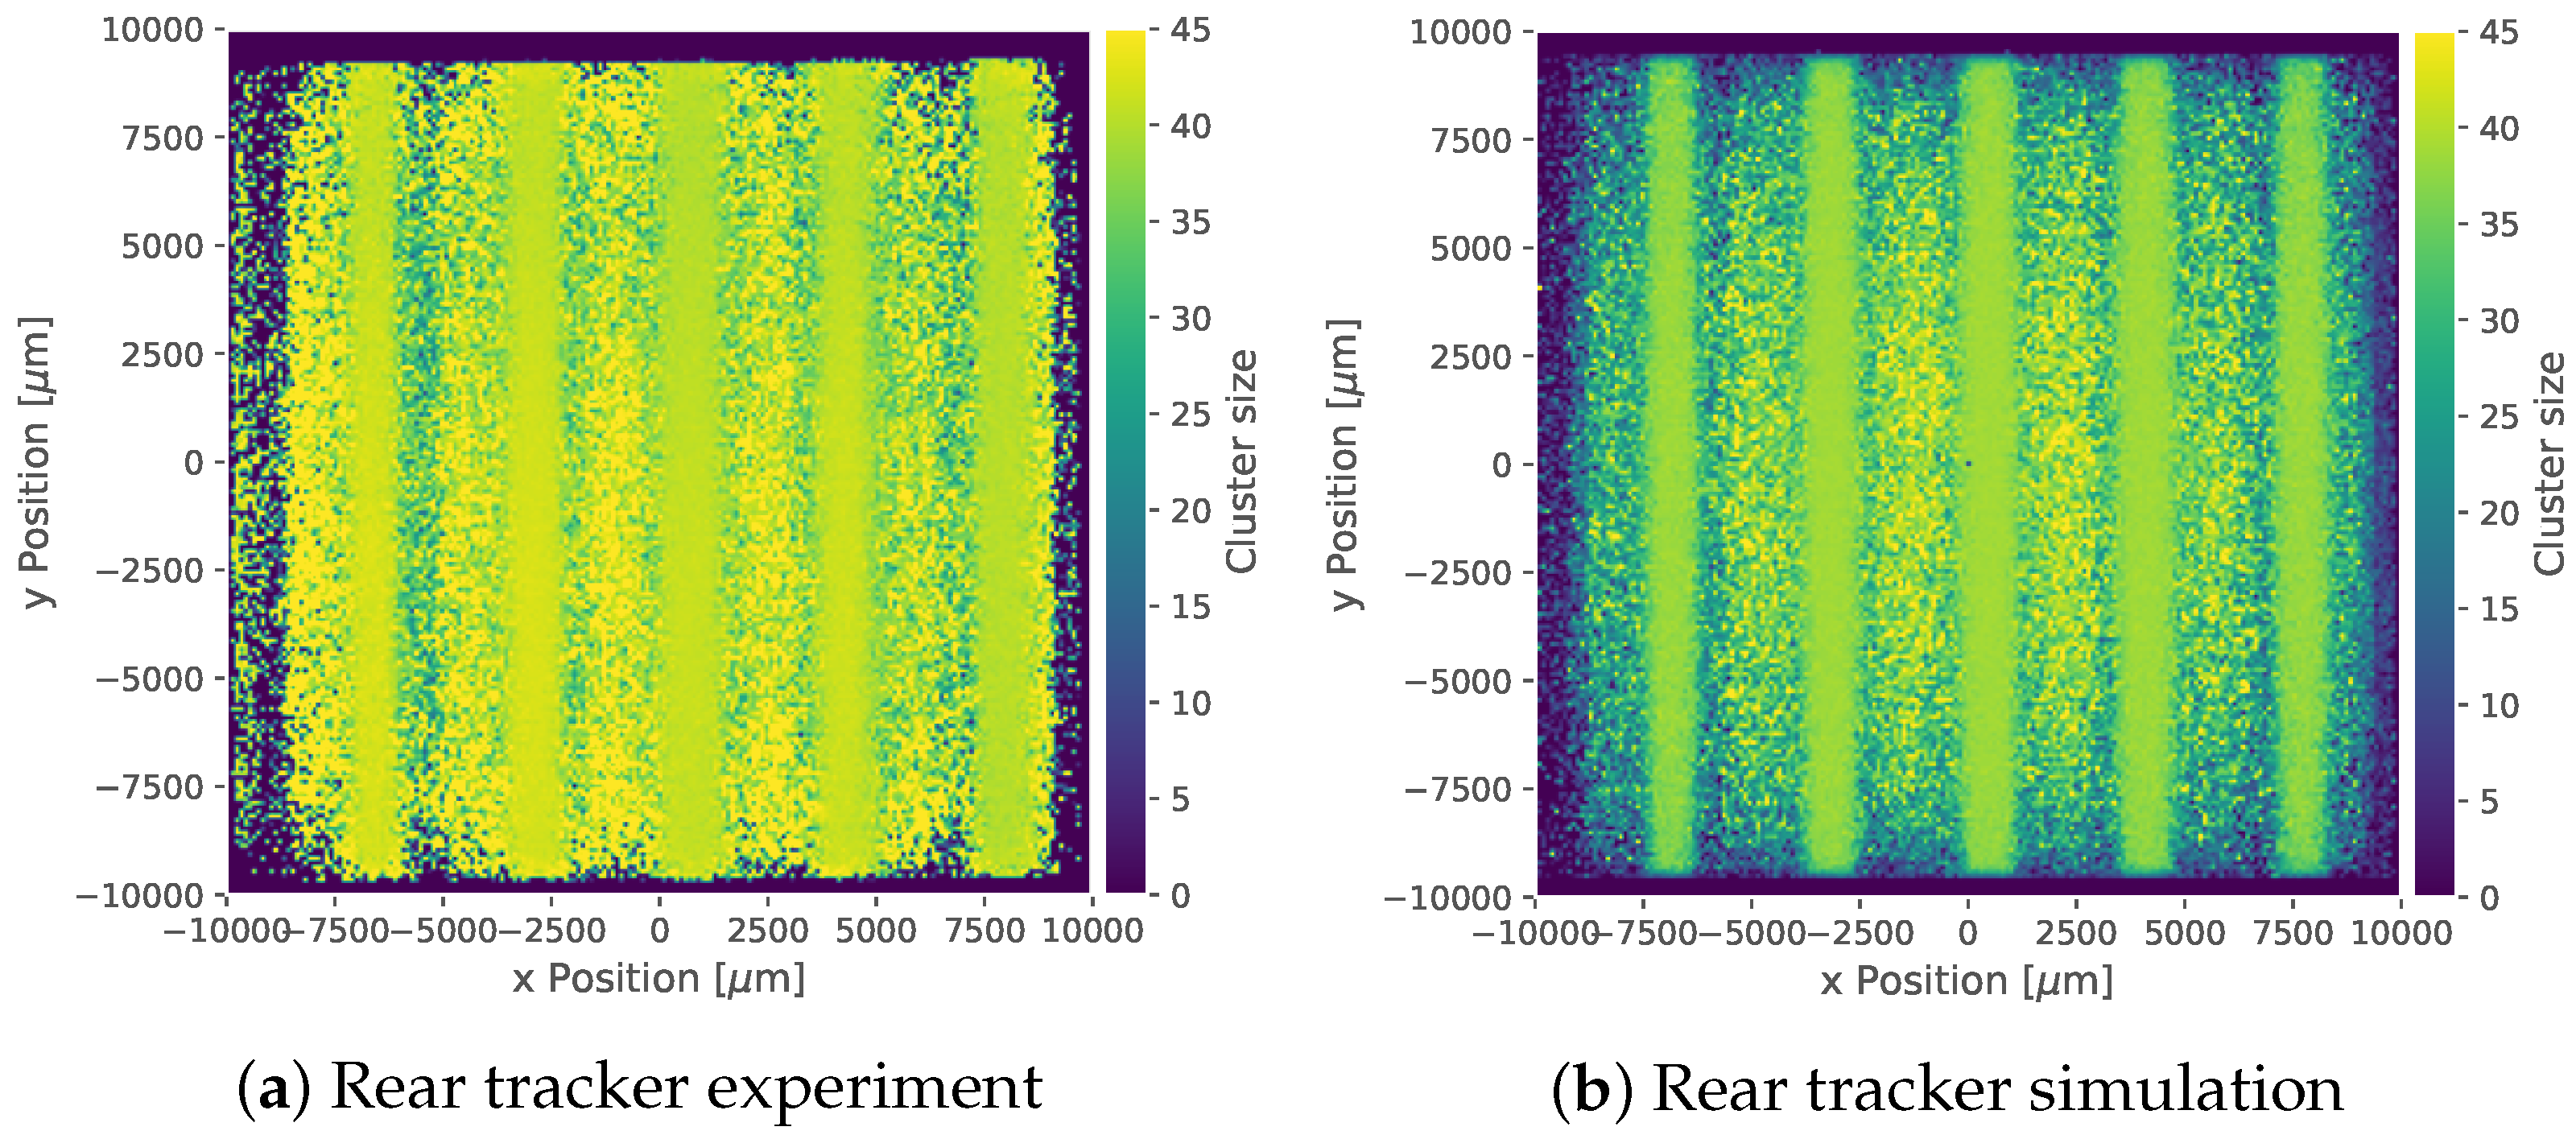
3.1. Measurements
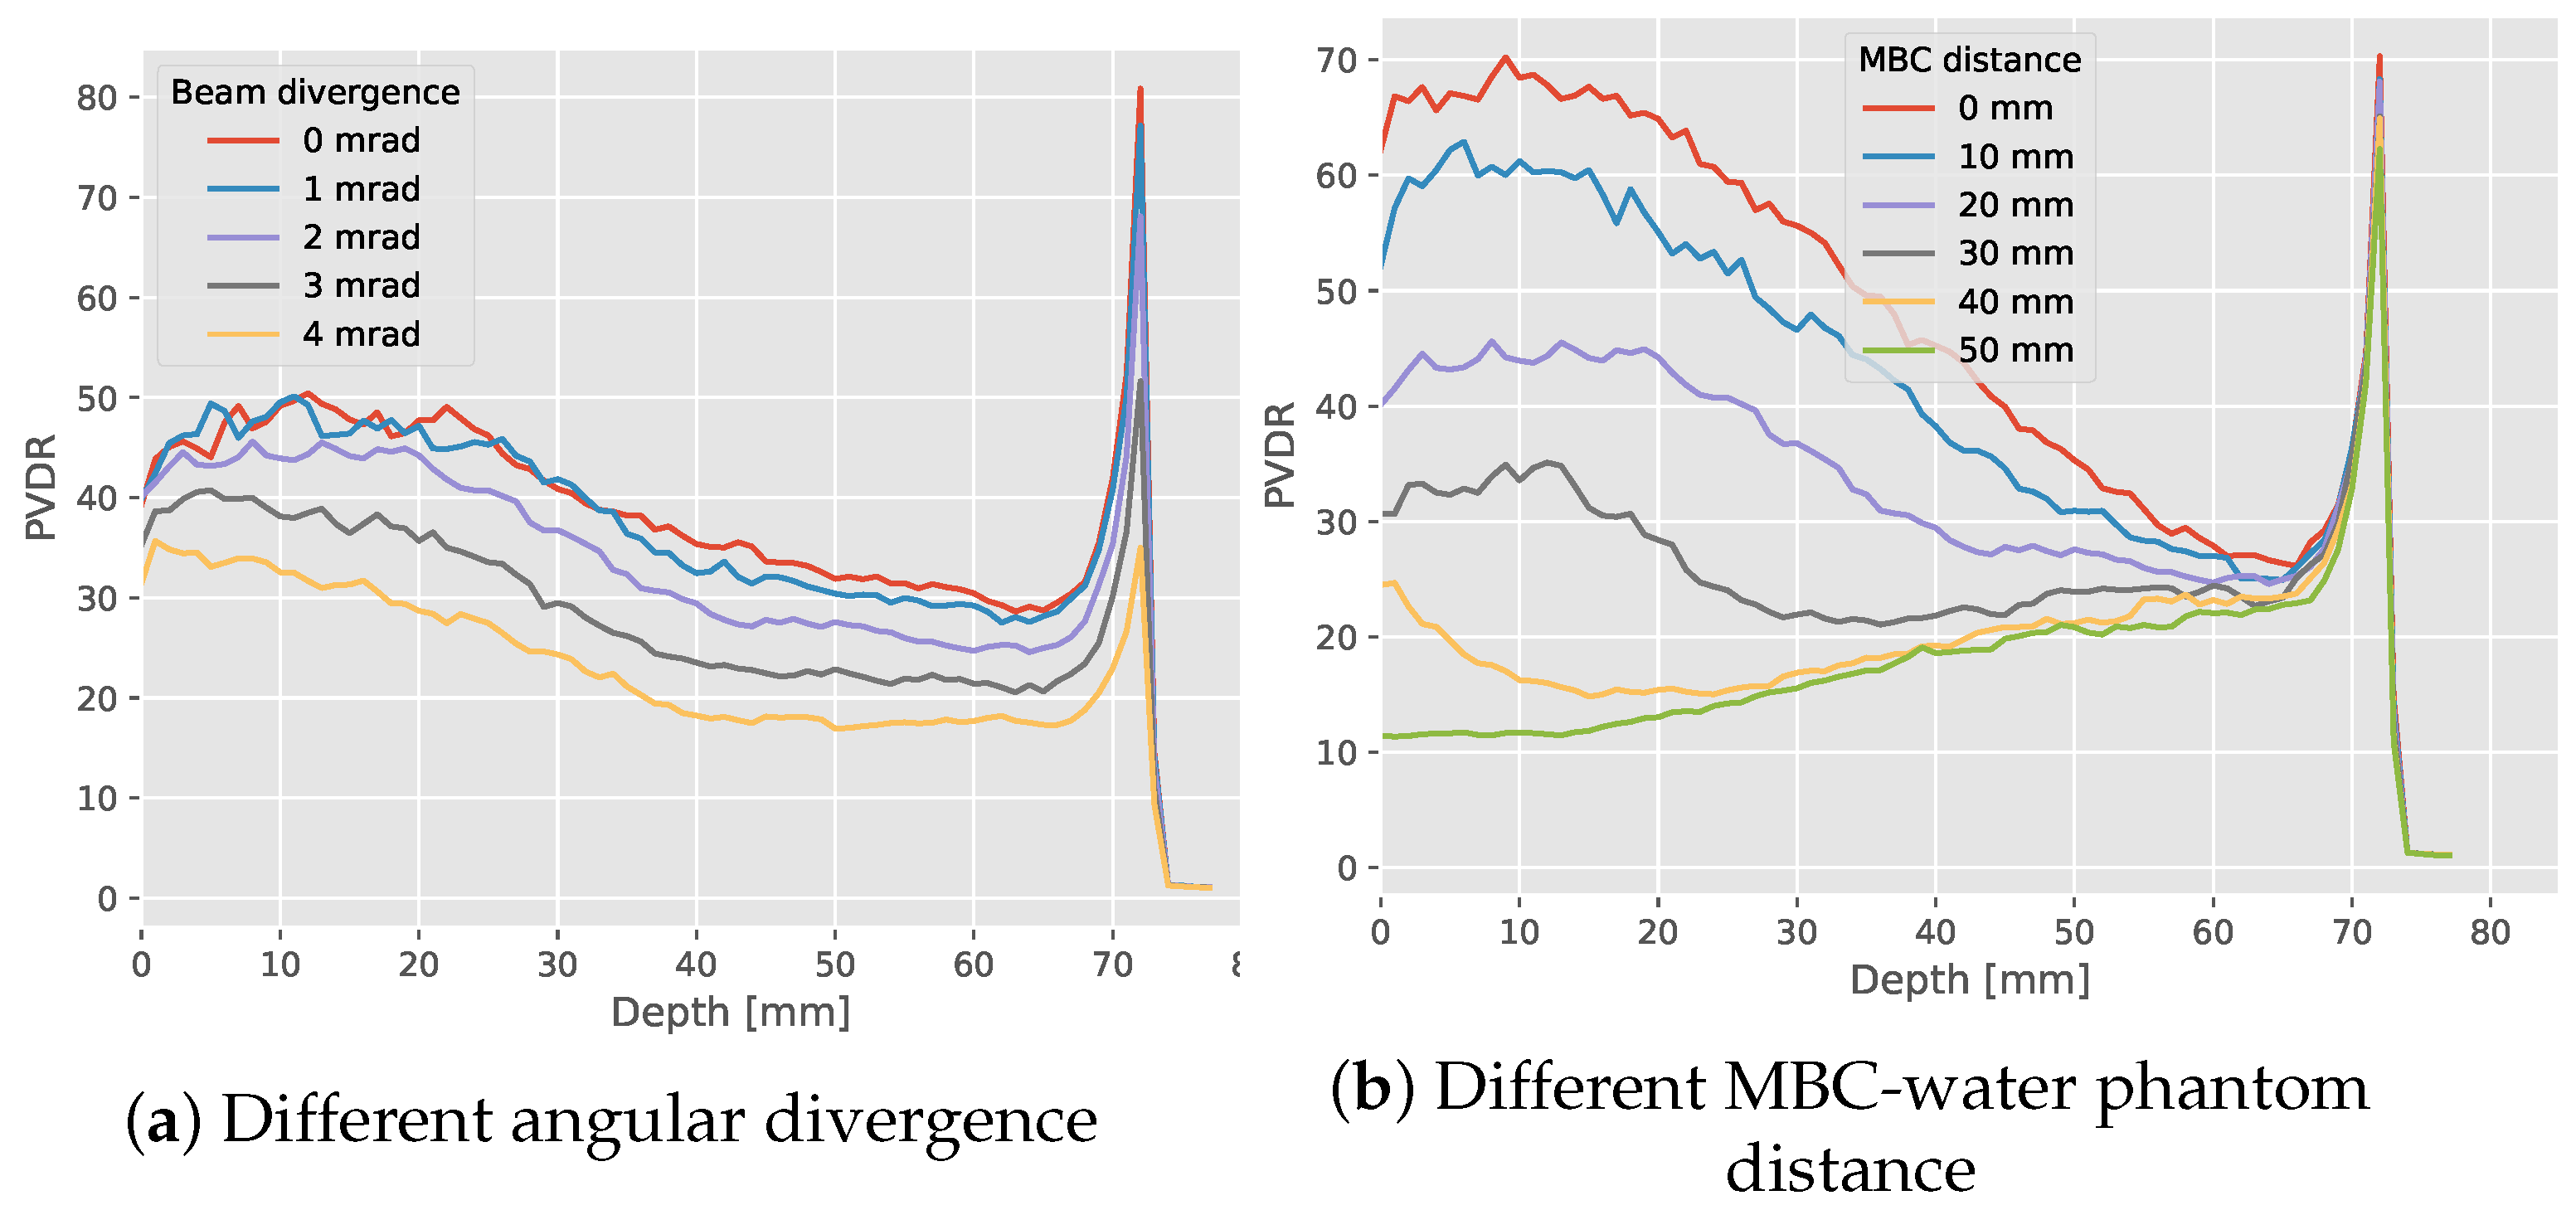
3.2. Expanded Parameter Analysis
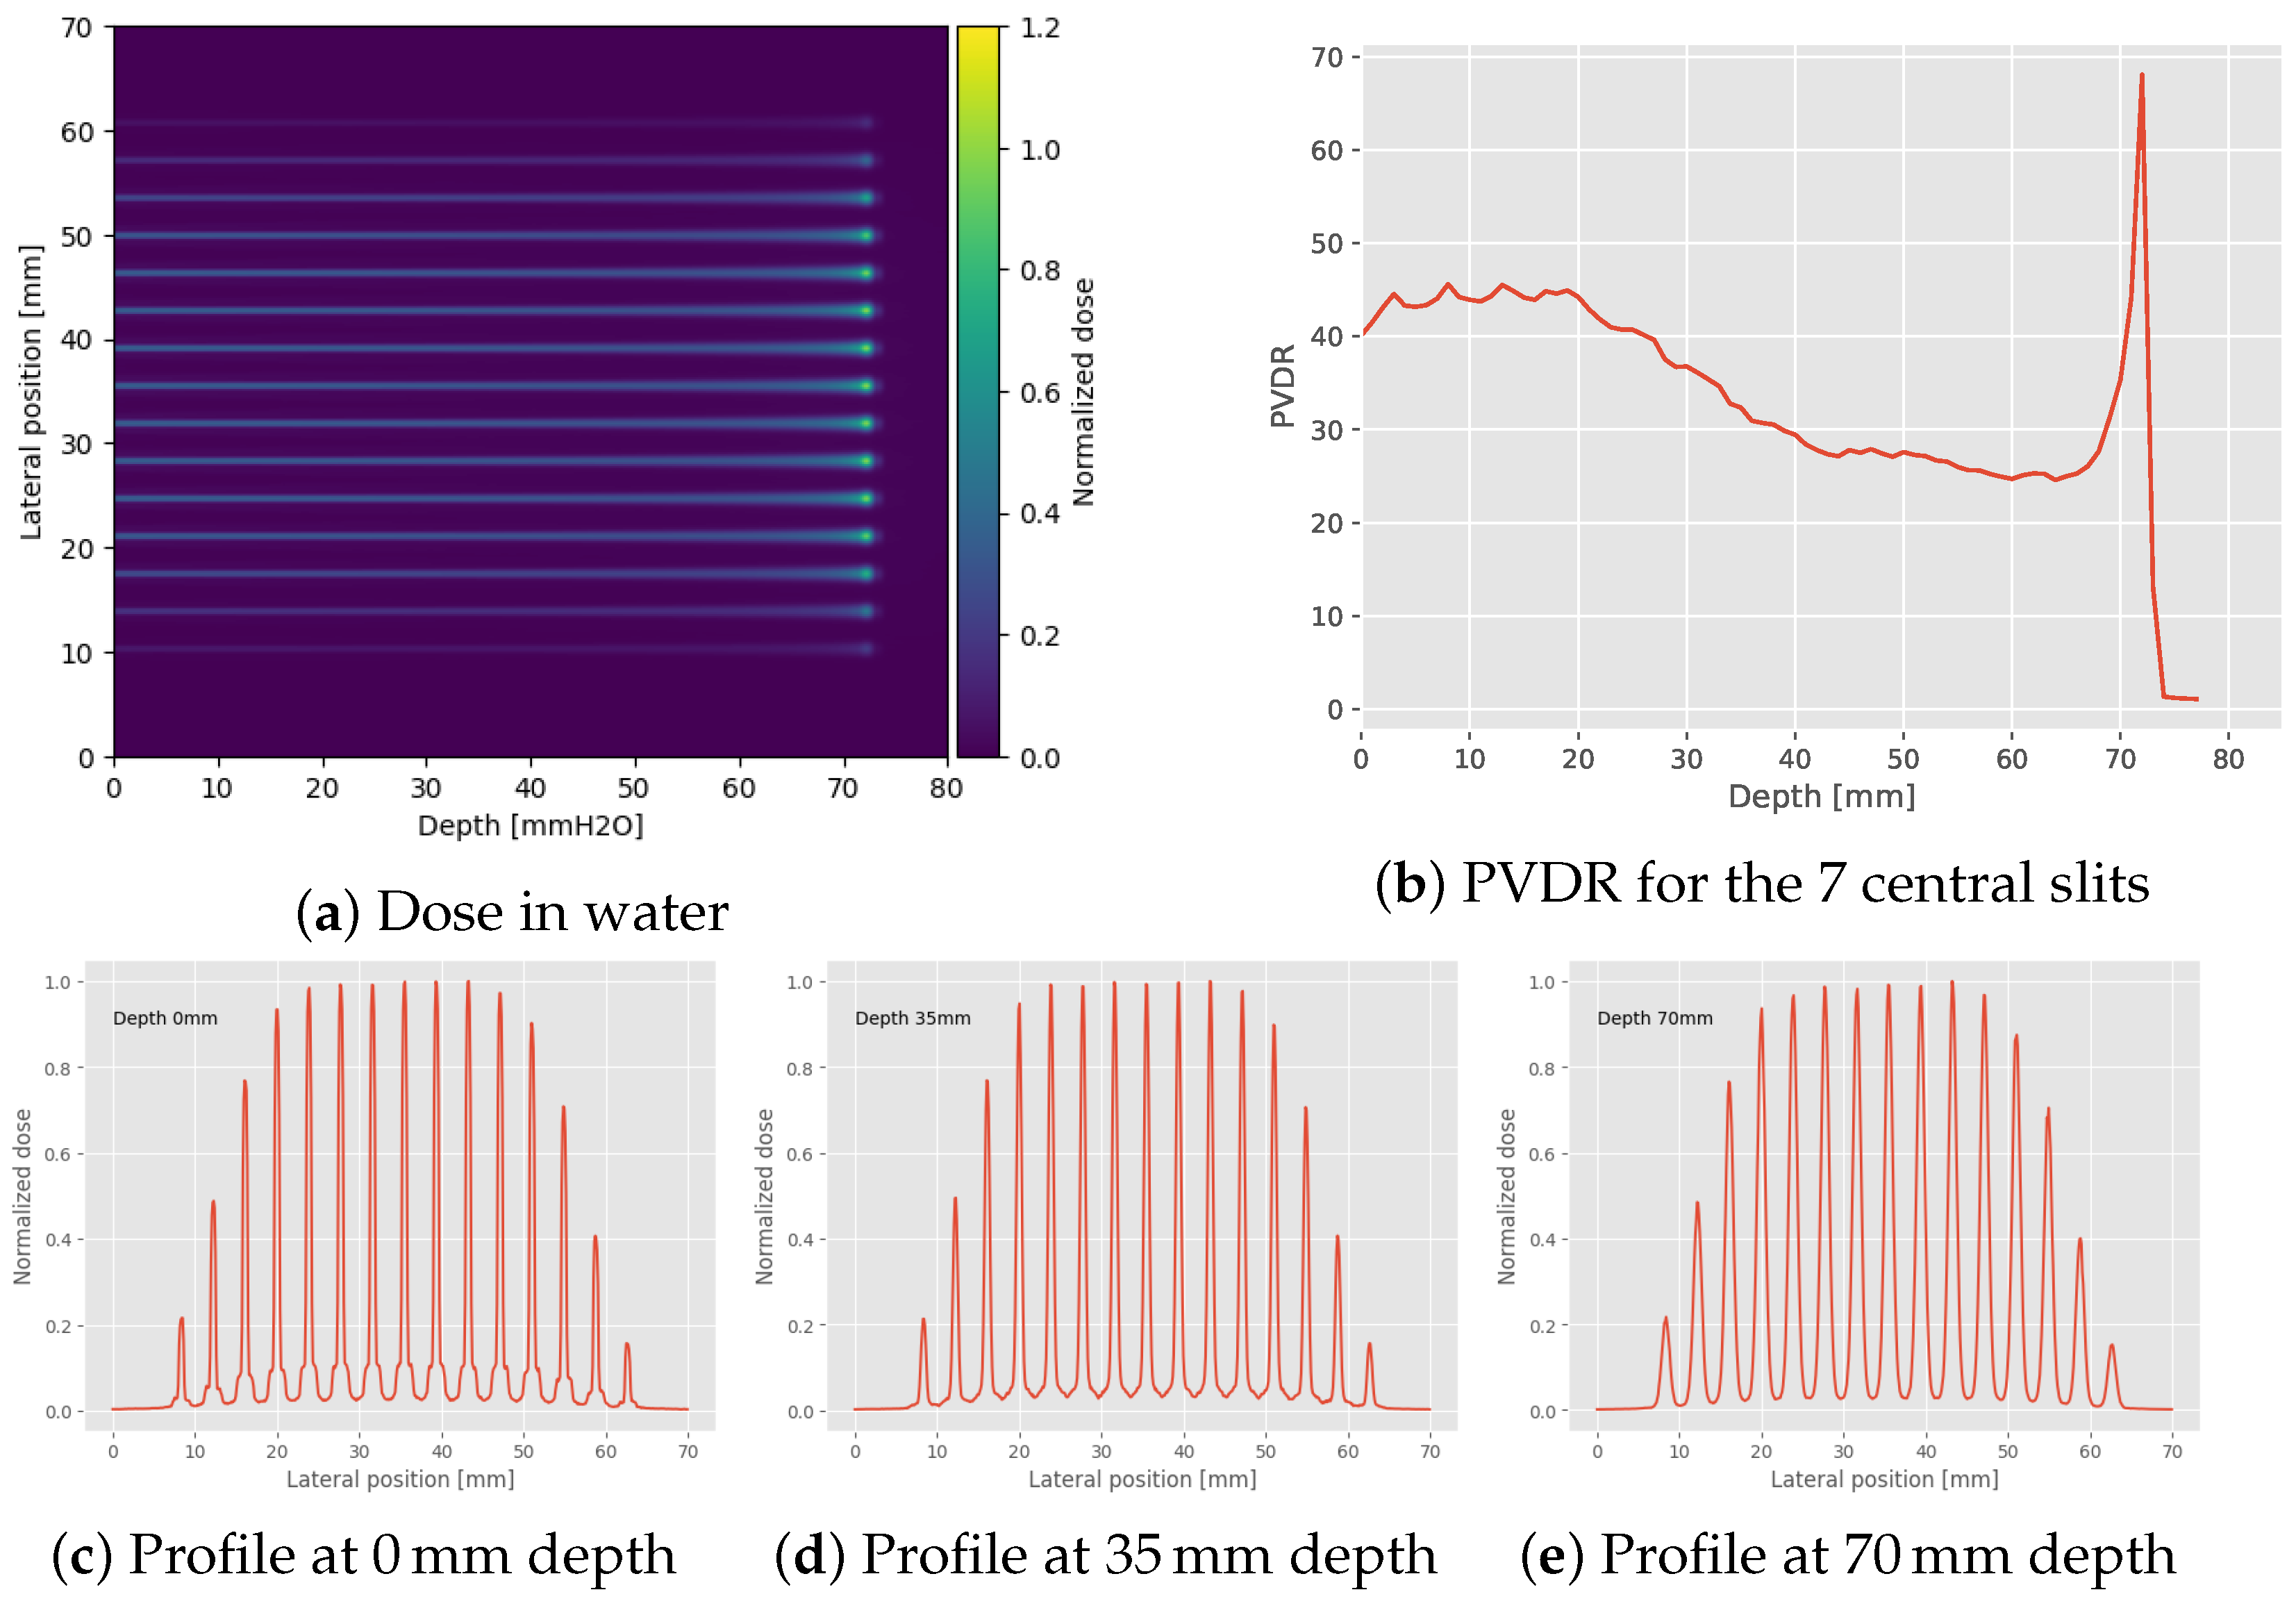
Dose to Water
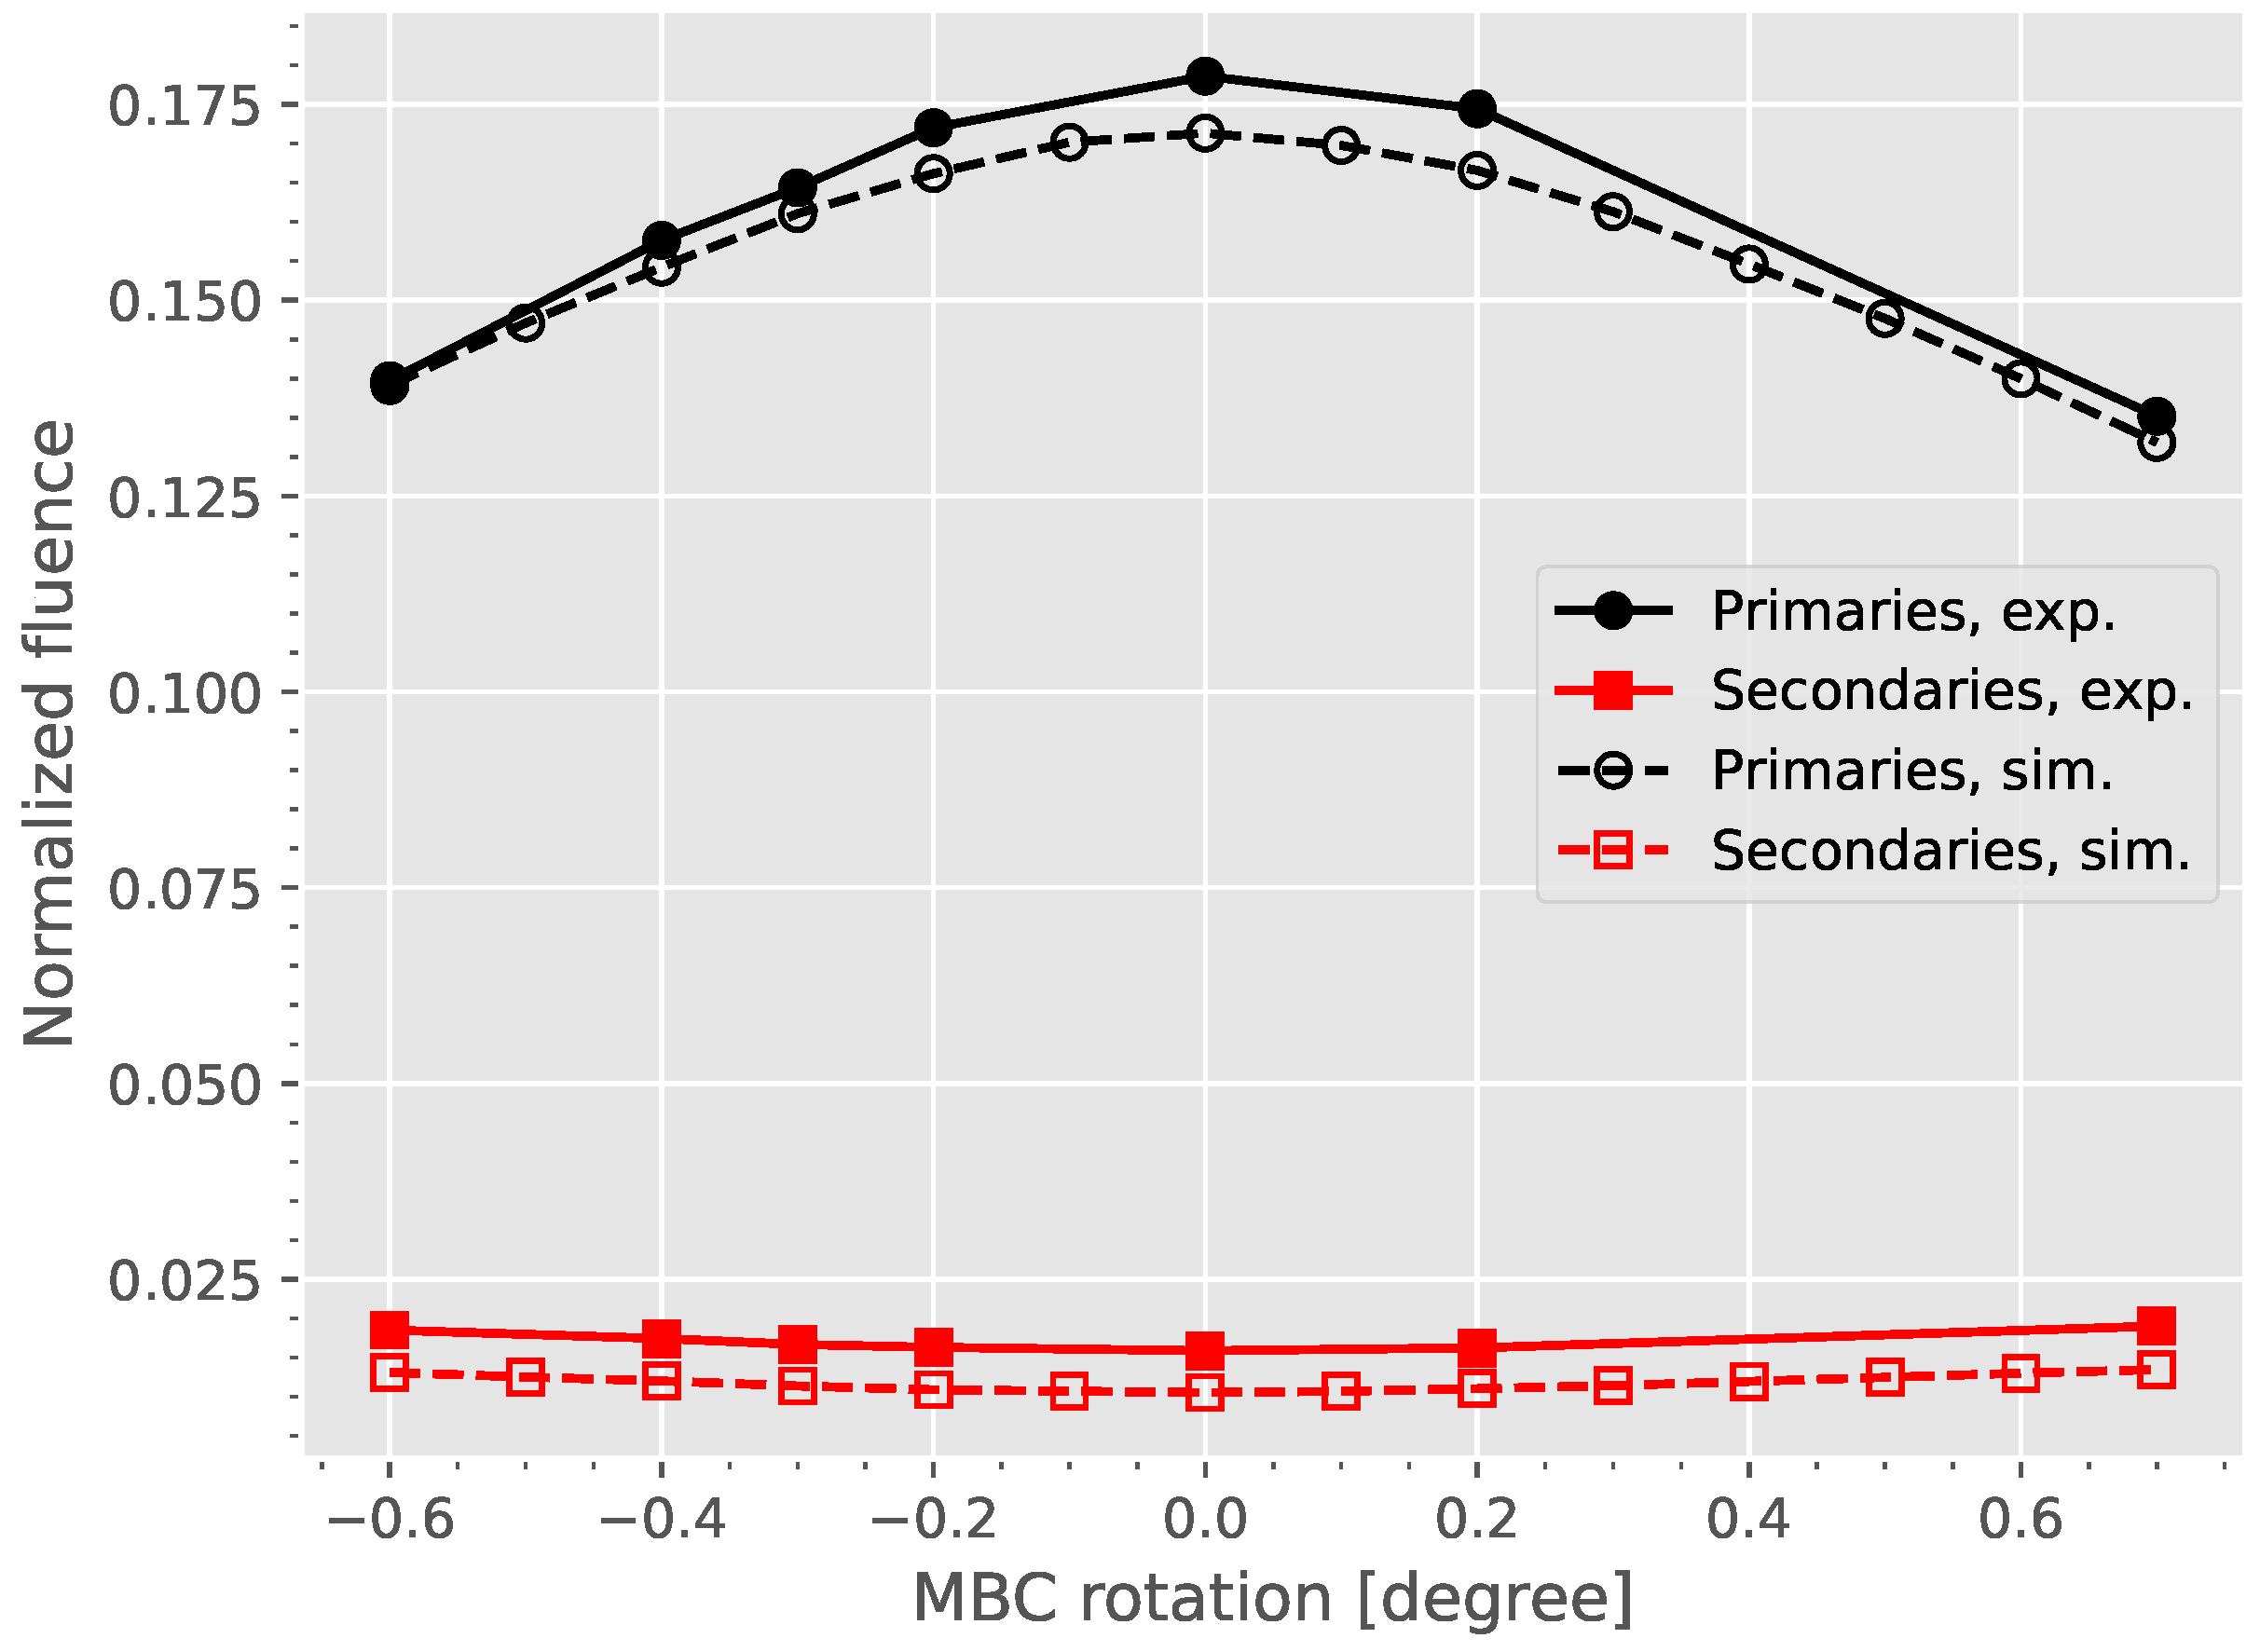
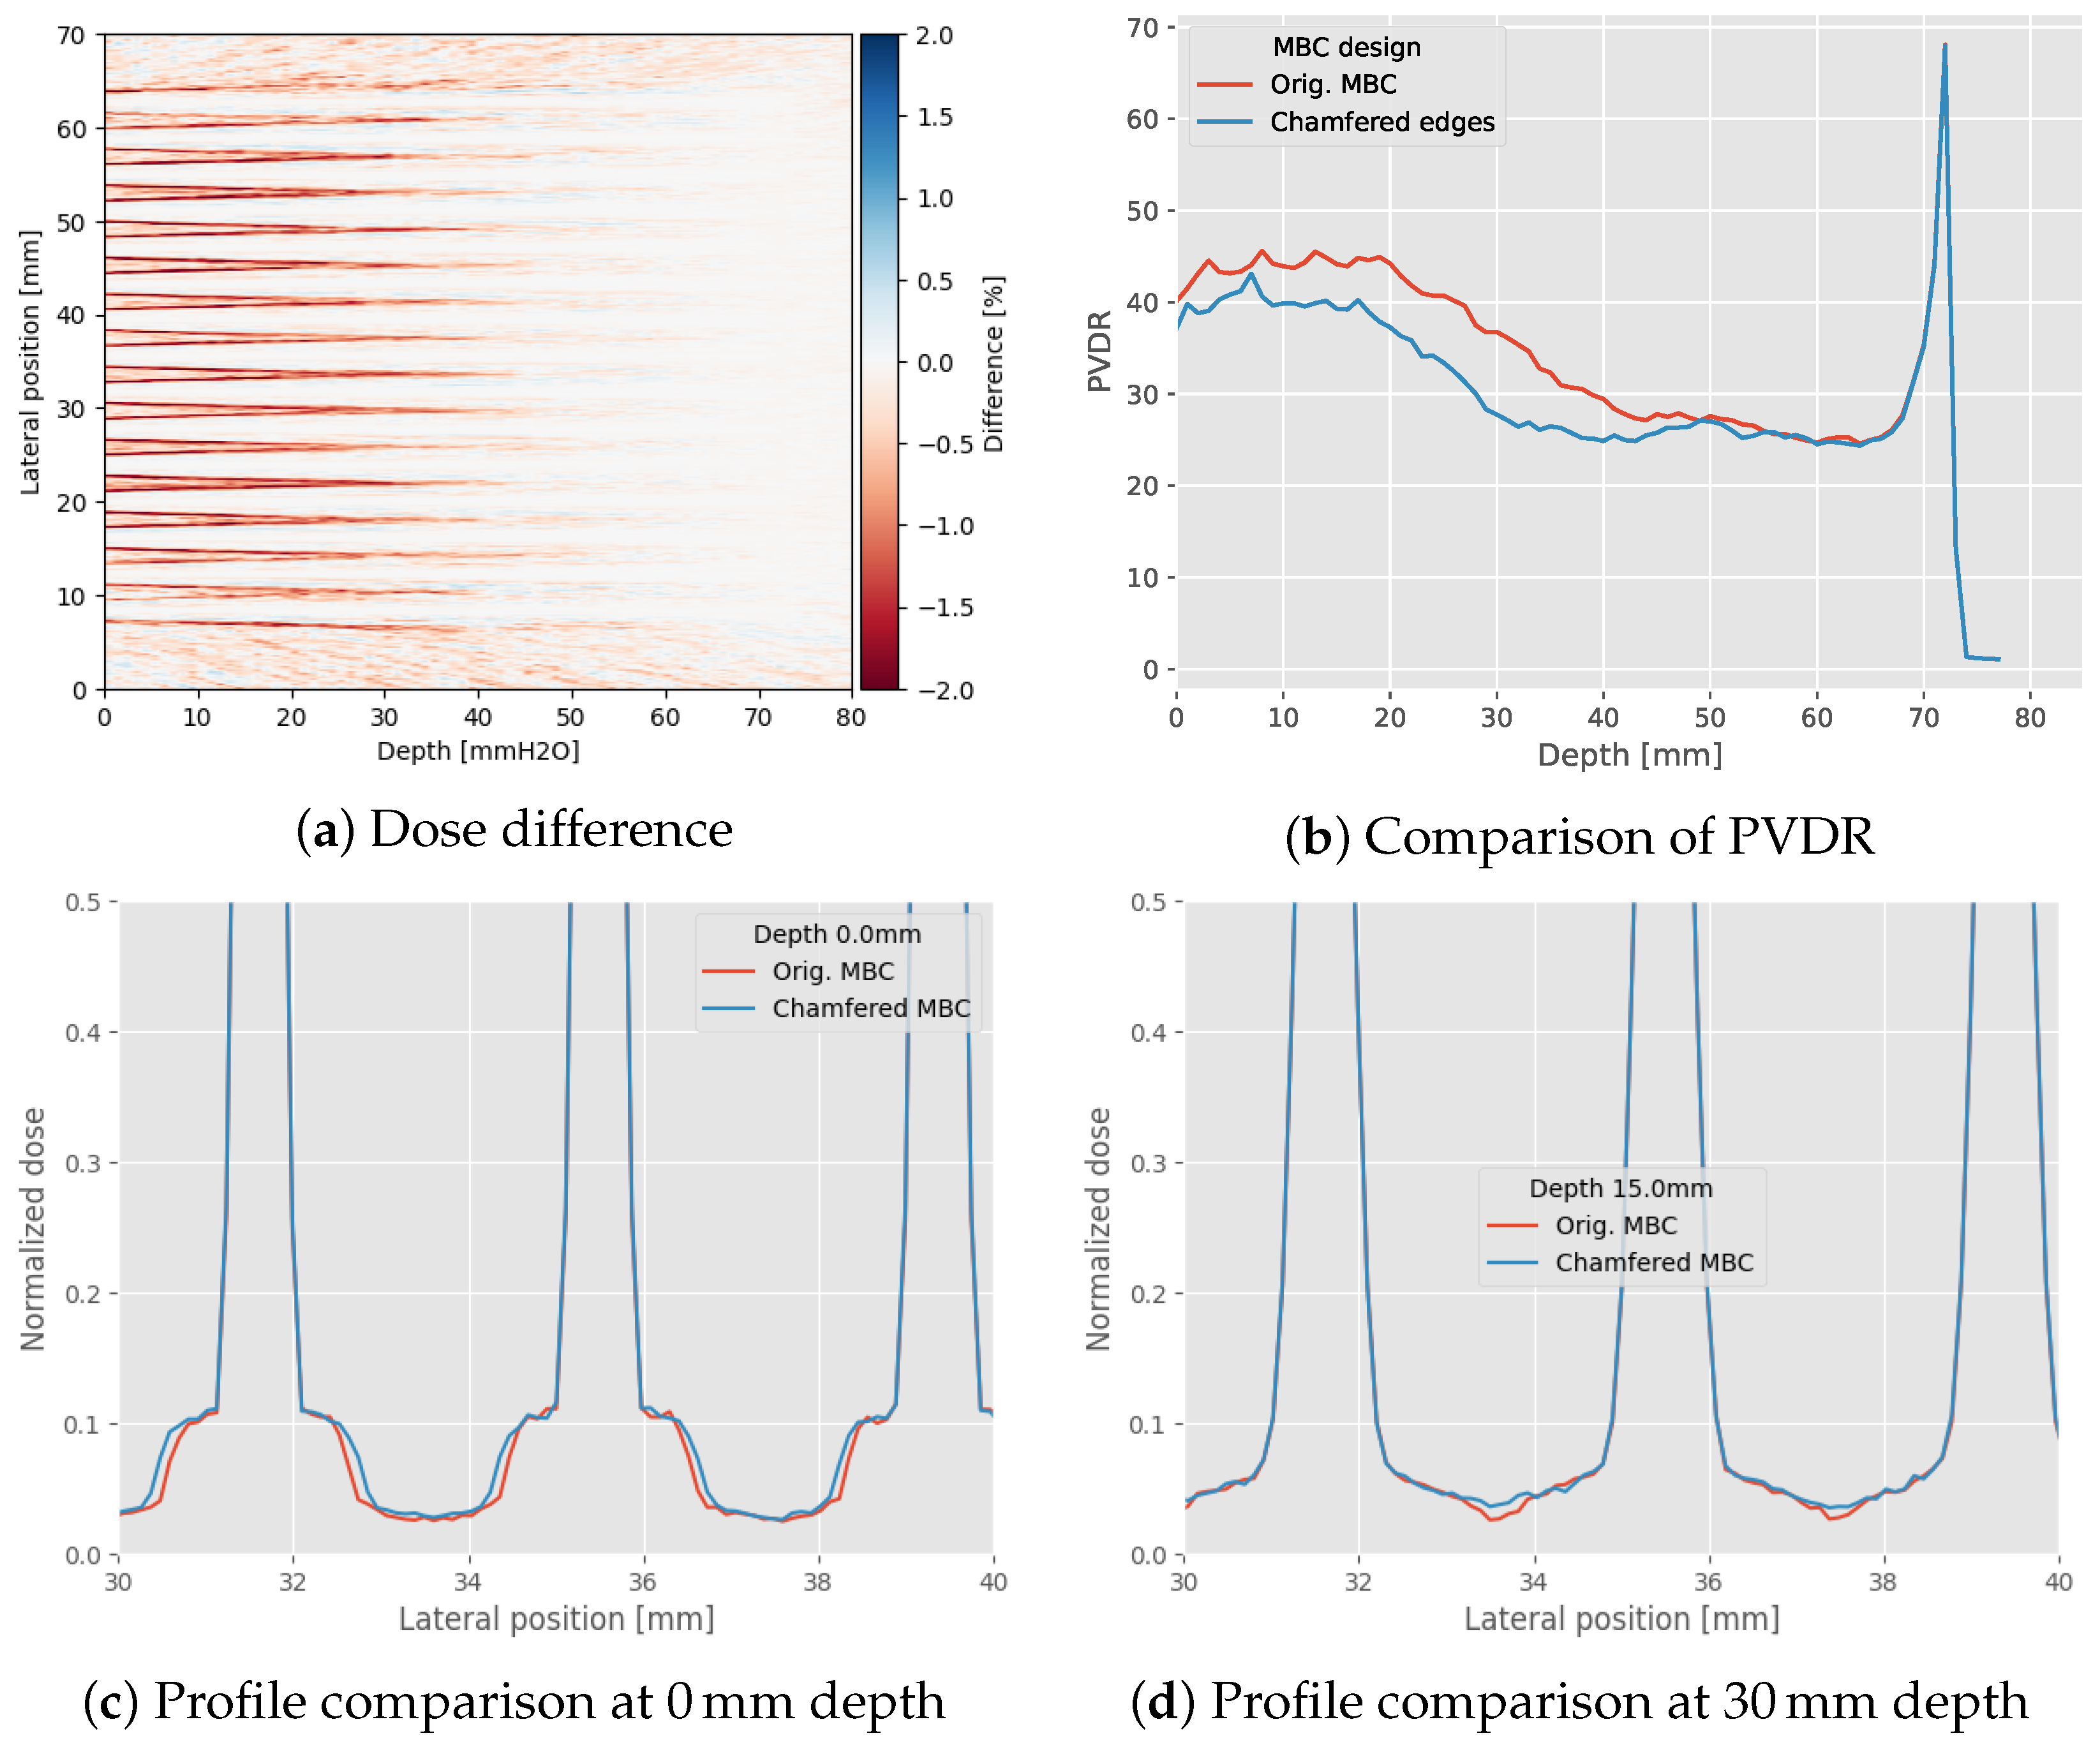
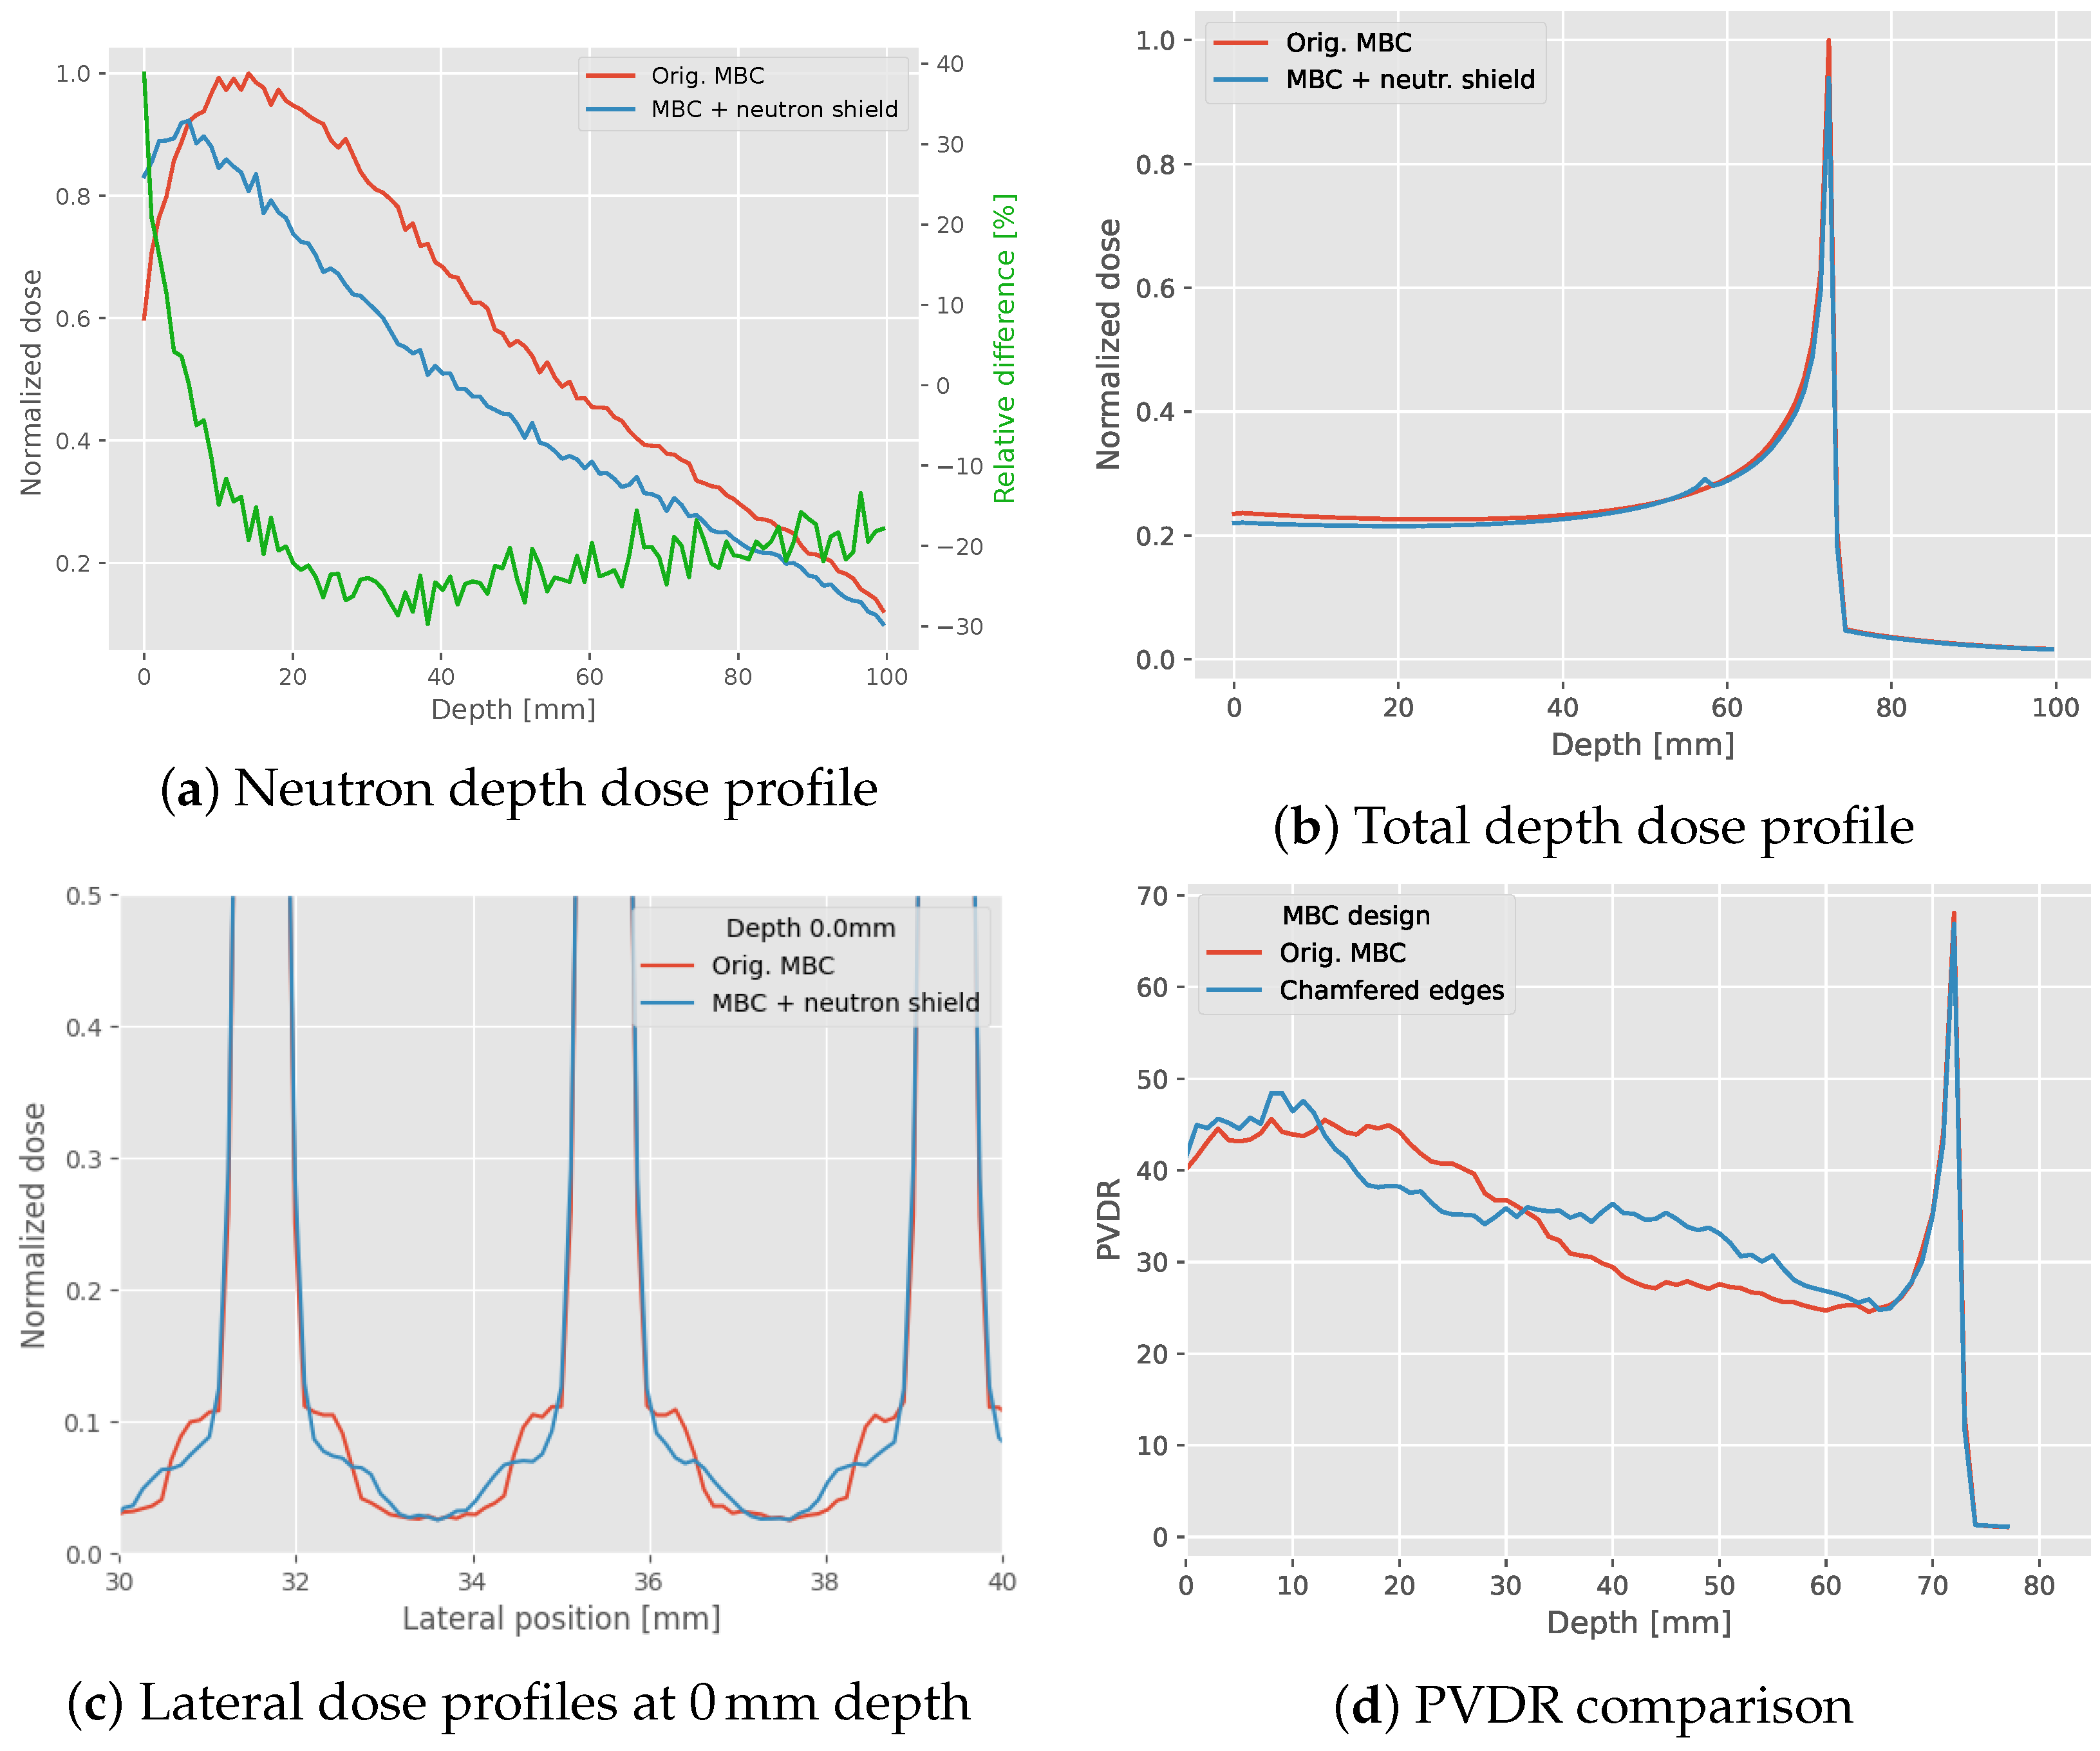
3.3. MBC Modifications
4. Discussion
5. Conclusions
Author Contributions
Funding
Data Availability Statement
Acknowledgments
Conflicts of Interest
Appendix A
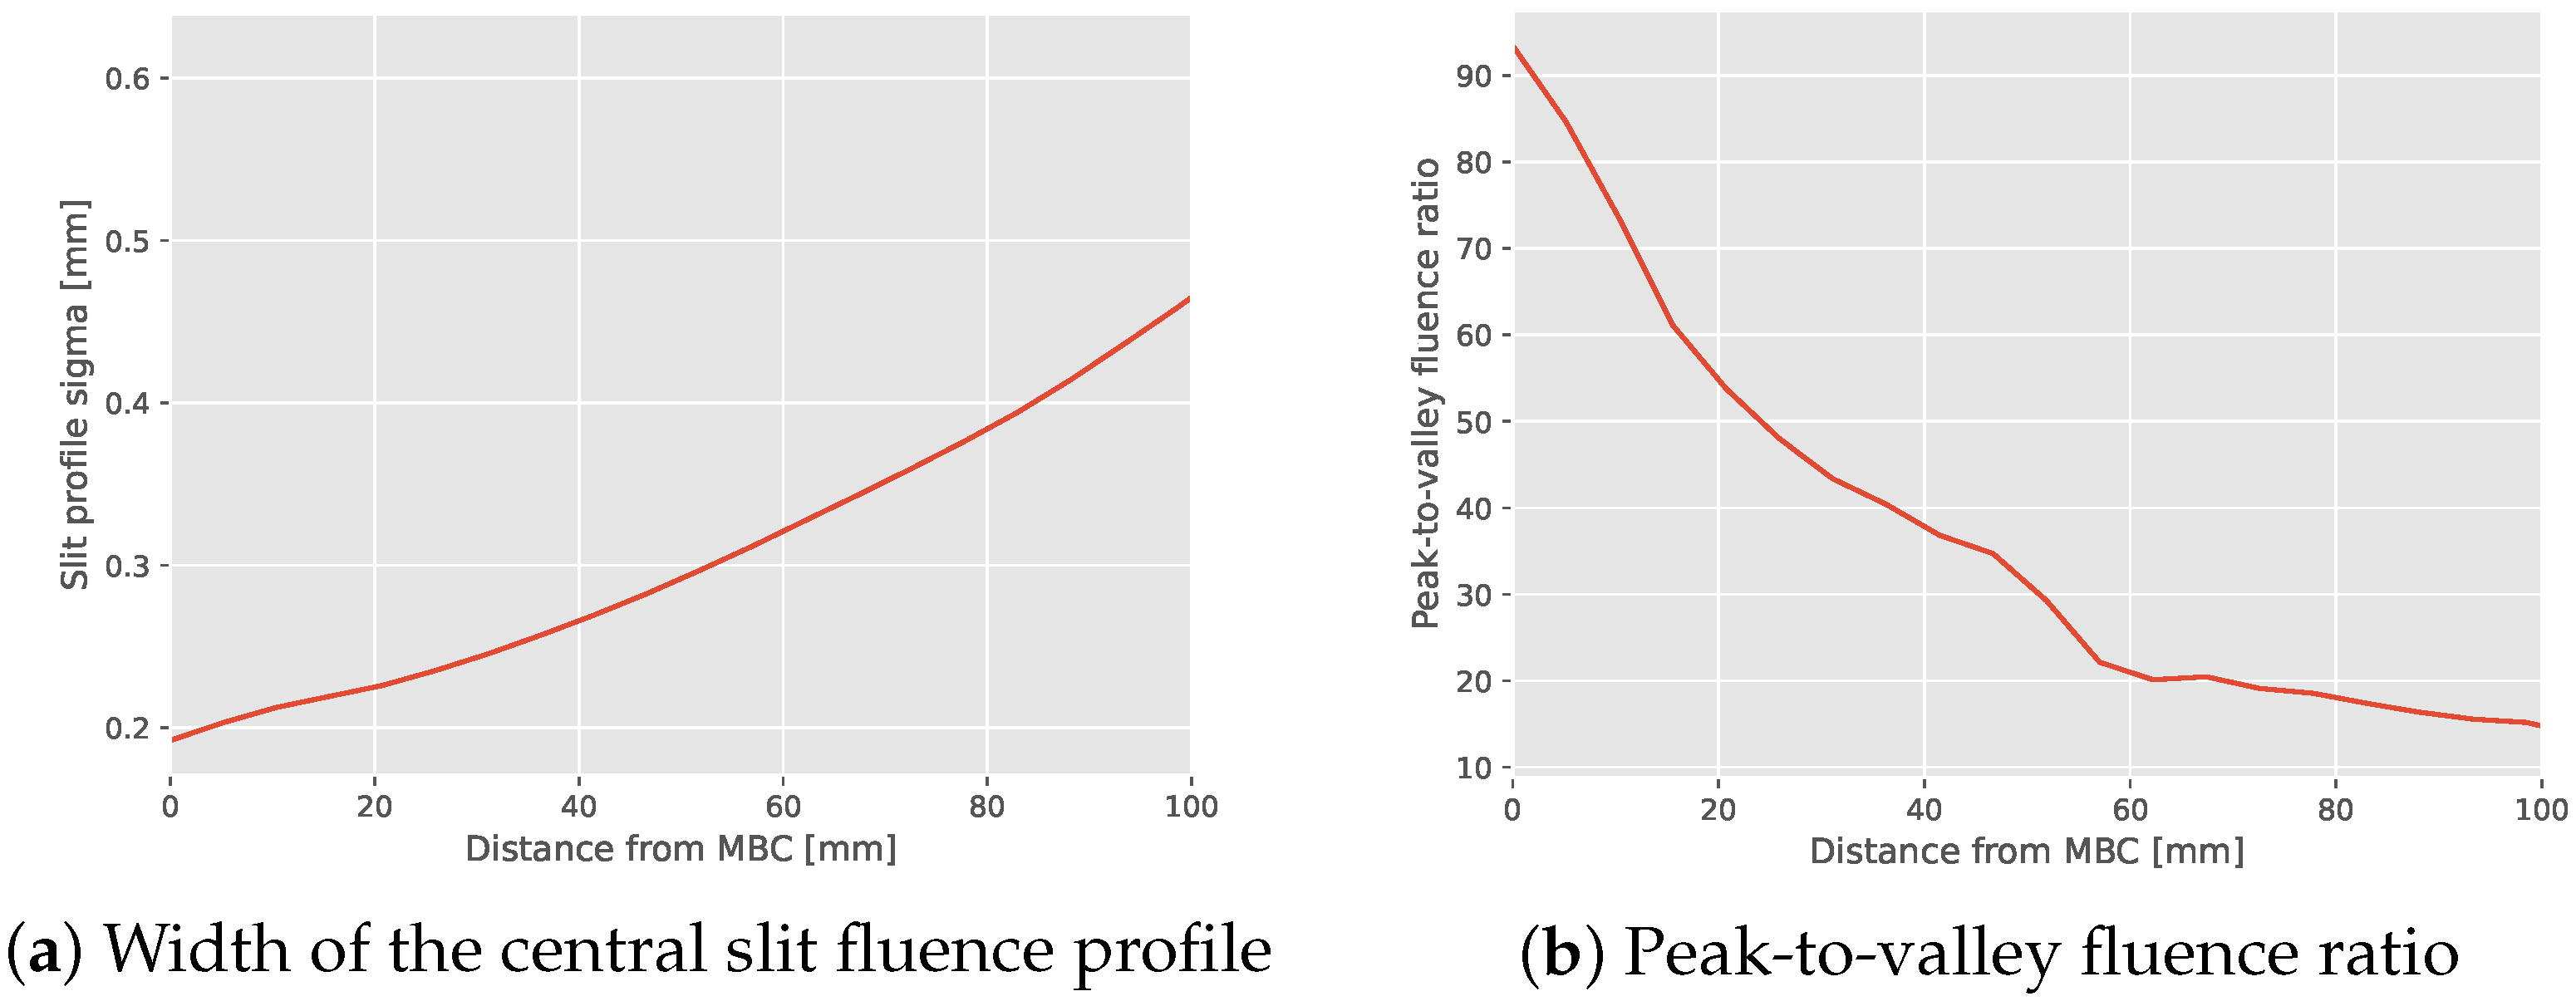
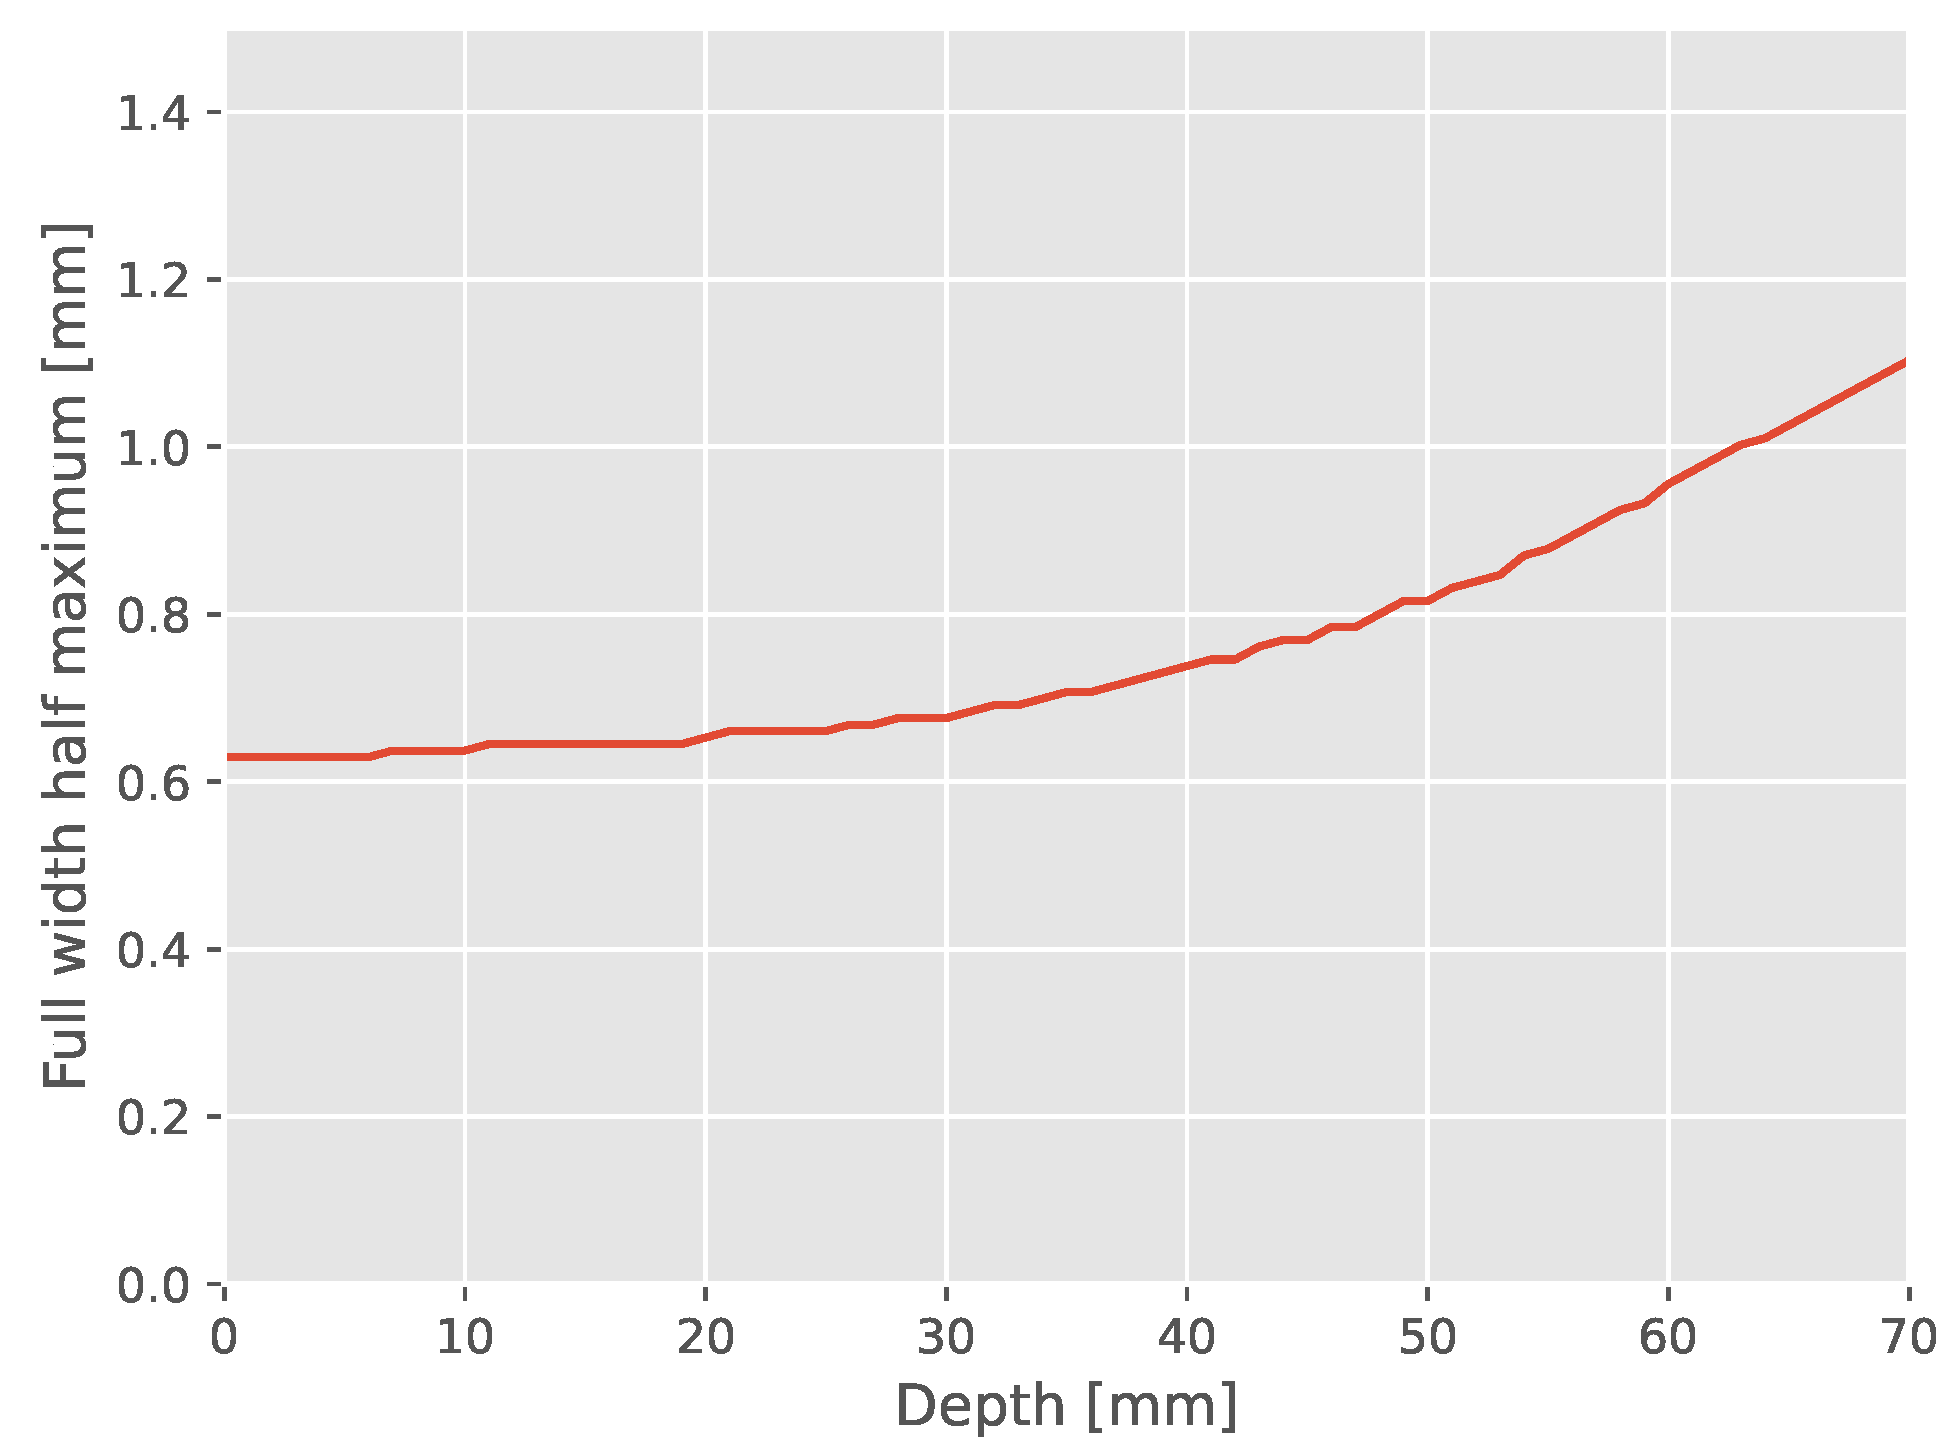
Appendix A.1. Single Slit Dose Profile Broadening

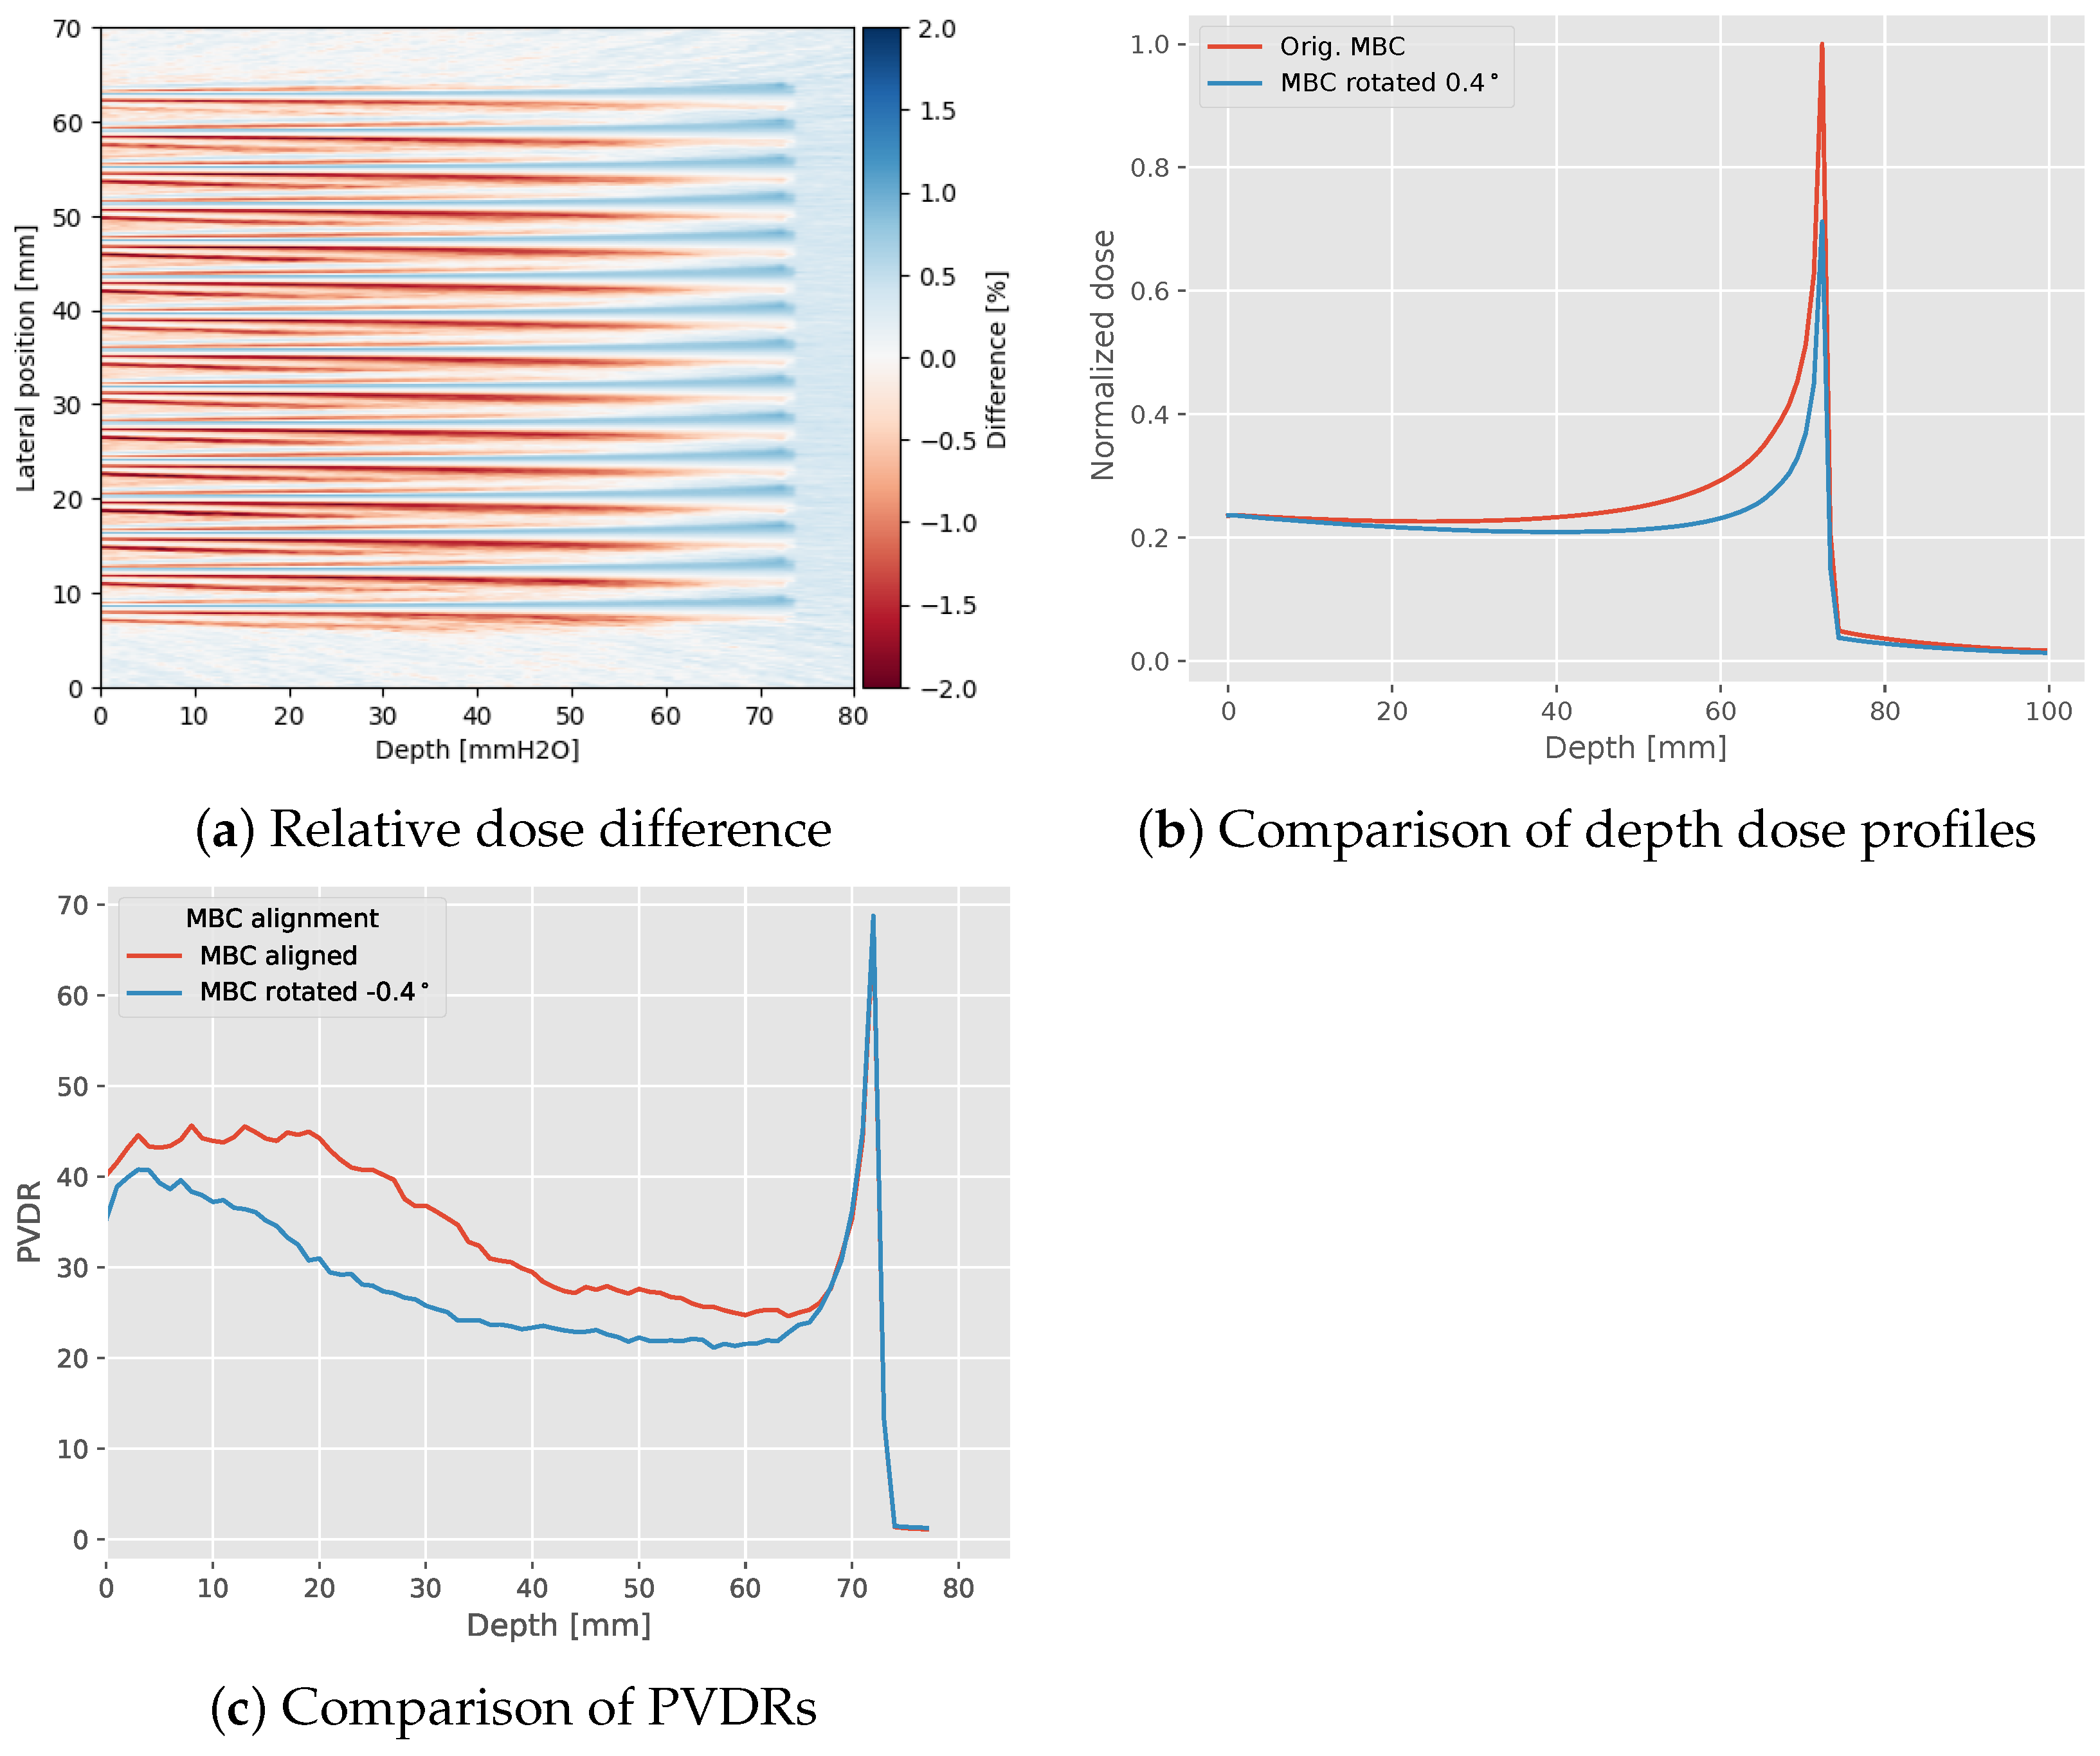
Appendix A.2. Dose Difference between Aligned and Rotated MBC

References
- Prezado, Y.; Fois, G. Proton-minibeam radiation therapy: A proof of concept. Med. Phys. 2013, 40, 031712. [Google Scholar] [CrossRef]
- Zlobinskaya, O.; Girst, S.; Greubel, C.; Hable, V.; Siebenwirth, C.; Walsh, D.W.M.; Multhoff, G.; Wilkens, J.J.; Schmid, T.E.; Dollinger, G. Reduced side effects by proton microchannel radiotherapy: Study in a human skin model. Radiat. Environ. Biophys. 2013, 52, 123–133. [Google Scholar] [CrossRef]
- Bertho, A.; Ortiz, R.; Juchaux, M.; Gilbert, C.; Lamirault, C.; Pouzoulet, F.; Polledo, L.; Liens, A.; Warfving, N.; Sebrie, C.; et al. First Evaluation of Temporal and Spatial Fractionation in Proton Minibeam Radiation Therapy of Glioma-Bearing Rats. Cancers 2021, 13, 4865. [Google Scholar] [CrossRef]
- Sammer, M.; Zahnbrecher, E.; Dobiasch, S.; Girst, S.; Greubel, C.; Ilicic, K.; Reindl, J.; Schwarz, B.; Siebenwirth, C.; Walsh, D.; et al. Proton pencil minibeam irradiation of an in-vivo mouse ear model spares healthy tissue dependent on beam size. PLoS ONE 2019, 14, e0224873. [Google Scholar] [CrossRef] [PubMed] [Green Version]
- Girst, S.; Greubel, C.; Reindl, J.; Siebenwirth, C.; Zlobinskaya, O.; Walsh, D.; Ilicic, K.; Aichler, M.; Walch, A.; Wilkens, J.; et al. Proton Minibeam Radiation Therapy Reduces Side Effects in an In-Vivo Mouse Ear Model. Int. J. Radiat. Oncol. Biol. Phys. 2016, 95, 234–241. [Google Scholar] [CrossRef] [Green Version]
- Bertho, A.; Iturri, L.; Brisebard, E.; Juchaux, M.; Gilbert, C.; Ortiz, R.; Sebrie, C.; Jourdain, L.; Lamirault, C.; Ramasamy, G.; et al. Evaluation of the role of the immune system response following minibeam radiation therapy. Int. J. Radiat. Oncol. Biol. Phys. 2022, 115, 426–439. Available online: https://www.sciencedirect.com/science/article/pii/S0360301622031066 (accessed on 8 May 2023).
- Lamirault, C.; Doyère, V.; Juchaux, M.; Pouzoulet, F.; Labiod, D.; Dendale, R.; Patriarca, A.; Nauraye, C.; Le Dudal, M.; Jouvion, G.; et al. Short and long-term evaluation of the impact of proton minibeam radiation therapy on motor, emotional and cognitive functions. Sci. Rep. 2020, 10, 13511. [Google Scholar] [CrossRef]
- Martínez-Rovira, I.; González, W.; Brons, S.; Prezado, Y. Carbon and oxygen minibeam radiation therapy: An experimental dosimetric evaluation. Med. Phys. 2017, 44, 4223–4229. [Google Scholar] [CrossRef]
- Schneider, T.; Patriarca, A.; Prezado, Y. Improving the dose distributions in minibeam radiation therapy: Helium ions vs. protons. Med Phys. 2019, 46, 3640–3648. [Google Scholar] [CrossRef]
- Tinganelli, W.; Durante, M. Carbon Ion Radiobiology. Cancers 2020, 12, 3022. [Google Scholar] [CrossRef]
- Dilmanian, F.A.; Eley, J.G.; Rusek, A.; Krishnan, S. Charged Particle Therapy with Mini-Segmented Beams. Front. Oncol. 2015, 5, 269. [Google Scholar] [CrossRef] [PubMed] [Green Version]
- Prezado, Y.; Hirayama, R.; Matsufuji, N.; Inaniwa, T.; Martínez-Rovira, I.; Seksek, O.; Bertho, A.; Koike, S.; Labiod, D.; Pouzoulet, F.; et al. A Potential Renewed Use of Very Heavy Ions for Therapy: Neon Minibeam Radiation Therapy. Cancers 2021, 13, 1356. [Google Scholar] [CrossRef] [PubMed]
- Mayerhofer, M.; Bencini, V.; Sammer, M.; Dollinger, G. A carbon minibeam irradiation facility concept. In Proceedings of the 13th International Particle Accelerator Conference (IPAC 2022), Bangkok, Thailand, 12–17 June 2022; pp. 2947–2950. [Google Scholar] [CrossRef]
- Ortiz, R.; De Marzi, L.; Prezado, Y. Preclinical dosimetry in proton minibeam radiation therapy: Robustness analysis and guidelines. Med. Phys. 2022, 49, 5551–5561. [Google Scholar] [CrossRef]
- González, W.; Peucelle, C.; Prezado, Y. Theoretical dosimetric evaluation of carbon and oxygen minibeam radiation therapy. Med. Phys. 2017, 44, 1921–1929. [Google Scholar] [CrossRef]
- Lis, M.; Newhauser, W.; Donetti, M.; Durante, M.; Weber, U.; Zipfel, B.; Hartmann-Sauter, C.; Wolf, M.; Graeff, C. A facility for the research, development, and translation of advanced technologies for ion-beam therapies. J. Instrum. 2021, 16, T03004. [Google Scholar] [CrossRef]
- Valin, I.; Hu-Guo, C.; Baudot, J.; Bertolone, G.; Besson, A.; Colledani, C.; Claus, G.; Dorokhov, A.; Dozière, G.; Dulinski, W.; et al. A reticle size CMOS pixel sensor dedicated to the STAR HFT. J. Instrum. 2012, 7, C01102. [Google Scholar] [CrossRef]
- Flynn, S.; Price, T.; Allport, P.P.; Silvestre Patallo, I.; Thomas, R.; Subiel, A.; Bartzsch, S.; Treibel, F.; Ahmed, M.; Jacobs-Headspith, J.; et al. Evaluation of a pixelated large format CMOS sensor for x-ray microbeam radiotherapy. Med. Phys. 2020, 47, 1305–1316. [Google Scholar] [CrossRef] [Green Version]
- Flynn, S.; Allport, P.; Marzi, L.D.; Green, S.; Homer, M.; Lee, N.; Ortiz, R.; Patriarca, A.; Prezado, Y.; Thomas, R.; et al. Development of CMOS dosimetry in proton minibeams for enhanced QA and primary standard absorbed dose calorimetry. J. Instrum. 2023, 18, P03014. [Google Scholar] [CrossRef]
- Reidel, C.A.; Schuy, C.; Finck, C.; Horst, F.; Boscolo, D.; Baudot, J.; Spiriti, E.; Friedrich, T.; Vanstalle, M.; Durante, M.; et al. Response of the Mimosa-28 pixel sensor to a wide range of ion species and energies. Nucl. Instrum. Methods Phys. Res. Sect. A Accel. Spectrometers Detect. Assoc. Equip. 2021, 1017, 165807. [Google Scholar] [CrossRef]
- Reidel, C.A.; Schuy, C.; Horst, F.; Ecker, S.; Finck, C.; Durante, M.; Weber, U. Fluence perturbation from fiducial markers due to edge-scattering measured with pixel sensors for 12C ion beams. Phys. Med. Biol. 2020, 65, 085005. [Google Scholar] [CrossRef] [PubMed]
- Finck, C.; Karakaya, Y.; Reithinger, V.; Rescigno, R.; Baudot, J.; Constanzo, J.; Juliani, D.; Krimmer, J.; Rinaldi, I.; Rousseau, M.; et al. Study for online range monitoring with the interaction vertex imaging method. Phys. Med. Biol. 2017, 62, 9220. [Google Scholar] [CrossRef] [PubMed] [Green Version]
- Brun, R.; Rademakers, F. ROOT—An Object Oriented Data Analysis Framework. Nucl. Instrum. Methods Phys. Res. Sect. A Accel. Spectrometers Detect. Assoc. Equip. 1997, 389, 81–86. [Google Scholar] [CrossRef]
- Agostinelli, S.; Allison, J.; Amako, K.; Apostolakis, J.; Araujo, H.; Arce, P.; Asai, M.; Axen, D.; Banerjee, S.; Barrand, G.; et al. Geant4—A simulation toolkit. Nucl. Instrum. Methods Phys. Res. Sect. A Accel. Spectrometers Detect. Assoc. Equip. 2003, 506, 250–303. [Google Scholar] [CrossRef] [Green Version]
- Allison, J.; Amako, K.; Apostolakis, J.; Araujo, H.; Dubois, P.A.; Asai, M.; Barrand, G.; Capra, R.; Chauvie, S.; Chytracek, R.; et al. Geant4 developments and applications. IEEE Trans. Nucl. Sci. 2006, 53, 270–278. [Google Scholar] [CrossRef] [Green Version]
- Allison, J.; Amako, K.; Apostolakis, J.; Arce, P.; Asai, M.; Aso, T.; Bagli, E.; Bagulya, A.; Banerjee, S.; Barrand, G.; et al. Recent developments in Geant4. Nucl. Instrum. Methods Phys. Res. Sect. A Accel. Spectrometers Detect. Assoc. Equip. 2016, 835, 186–225. [Google Scholar] [CrossRef]
- Poole, C.M.; Cornelius, I.; Trapp, J.V.; Langton, C.M. A CAD Interface for GEANT4. Australas. Phys. Eng. Sci. Med. 2012, 35, 329–334. [Google Scholar] [CrossRef]
- Weber, U. Volumenkonforme Bestrahlung mit Kohlenstoff-Ionen zur Vorbereitung einer Strahlentherapie. Ph.D. Thesis, Universität Kassel, Kassel, Germany, 1996. [Google Scholar]
- Schardt, D.; Elsässer, T.; Schulz-Ertner, D. Heavy-ion tumor therapy: Physical and radiobiological benefits. Rev. Mod. Phys. 2010, 82, 383–425. [Google Scholar] [CrossRef]
- Dudouet, J.; Cussol, D.; Durand, D.; Labalme, M. Benchmarking geant4 nuclear models for hadron therapy with 95 MeV/nucleon carbon ions. Phys. Rev. C 2014, 89, 054616. [Google Scholar] [CrossRef]
- Toppi, M.; Sarti, A.; Alexandrov, A.; Alpat, B.; Ambrosi, G.; Argirò, S.; Diaz, R.A.; Barbanera, M.; Bartosik, N.; Battistoni, G.; et al. Elemental fragmentation cross sections for a 16O beam of 400 MeV/u kinetic energy interacting with a graphite target using the FOOT ΔE-TOF detectors. Front. Phys. 2022, 10, 979229. [Google Scholar] [CrossRef]
- Martišíková, M.; Jäkel, O. Dosimetric properties of Gafchromic® EBT films in monoenergetic medical ion beams. Phys. Med. Biol. 2010, 55, 3741–3751. [Google Scholar] [CrossRef]
- Sammer, M.; Girst, S.; Dollinger, G. Optimizing proton minibeam radiotherapy by interlacing and heterogeneous tumor dose on the basis of calculated clonogenic cell survival. Sci. Rep. 2021, 11, 3533. [Google Scholar] [CrossRef] [PubMed]
- Sammer, M.; Rousseti, A.; Girst, S.; Reindl, J.; Dollinger, G. Longitudinally Heterogeneous Tumor Dose Optimizes Proton Broadbeam, Interlaced Minibeam, and FLASH Therapy. Cancers 2022, 14, 5162. [Google Scholar] [CrossRef] [PubMed]
- Schneider, T.; De Marzi, L.; Patriarca, A.; Prezado, Y. Advancing proton minibeam radiation therapy: Magnetically focussed proton minibeams at a clinical centre. Sci. Rep. 2020, 10, 1384. [Google Scholar] [CrossRef] [PubMed] [Green Version]
- Pfuhl, T.; Friedrich, T.; Scholz, M. Comprehensive comparison of local effect model IV predictions with the particle irradiation data ensemble. Med Phys. 2022, 49, 714–726. [Google Scholar] [CrossRef] [PubMed]
- Mein, S.; Klein, C.; Kopp, B.; Magro, G.; Harrabi, S.; Karger, C.P.; Haberer, T.; Debus, J.; Abdollahi, A.; Dokic, I.; et al. Assessment of RBE-Weighted Dose Models for Carbon Ion Therapy Toward Modernization of Clinical Practice at HIT: In Vitro, in Vivo, and in Patients. Int. J. Radiat. Oncol. Biol. Phys. 2020, 108, 779–791. [Google Scholar] [CrossRef] [PubMed]


Disclaimer/Publisher’s Note: The statements, opinions and data contained in all publications are solely those of the individual author(s) and contributor(s) and not of MDPI and/or the editor(s). MDPI and/or the editor(s) disclaim responsibility for any injury to people or property resulting from any ideas, methods, instructions or products referred to in the content. |
© 2023 by the authors. Licensee MDPI, Basel, Switzerland. This article is an open access article distributed under the terms and conditions of the Creative Commons Attribution (CC BY) license (https://creativecommons.org/licenses/by/4.0/).
Share and Cite
Volz, L.; Reidel, C.-A.; Durante, M.; Prezado, Y.; Schuy, C.; Weber, U.; Graeff, C. Investigating Slit-Collimator-Produced Carbon Ion Minibeams with High-Resolution CMOS Sensors. Instruments 2023, 7, 18. https://doi.org/10.3390/instruments7020018
Volz L, Reidel C-A, Durante M, Prezado Y, Schuy C, Weber U, Graeff C. Investigating Slit-Collimator-Produced Carbon Ion Minibeams with High-Resolution CMOS Sensors. Instruments. 2023; 7(2):18. https://doi.org/10.3390/instruments7020018
Chicago/Turabian StyleVolz, Lennart, Claire-Anne Reidel, Marco Durante, Yolanda Prezado, Christoph Schuy, Uli Weber, and Christian Graeff. 2023. "Investigating Slit-Collimator-Produced Carbon Ion Minibeams with High-Resolution CMOS Sensors" Instruments 7, no. 2: 18. https://doi.org/10.3390/instruments7020018