
Physicochemical Properties of Ti3+ Self-Doped TiO2 Loaded on Recycled Fly-Ash Based Zeolites for Degradation of Methyl Orange

 ,
,  , , , , , ,
Abstract
:1. Introduction
2. Results
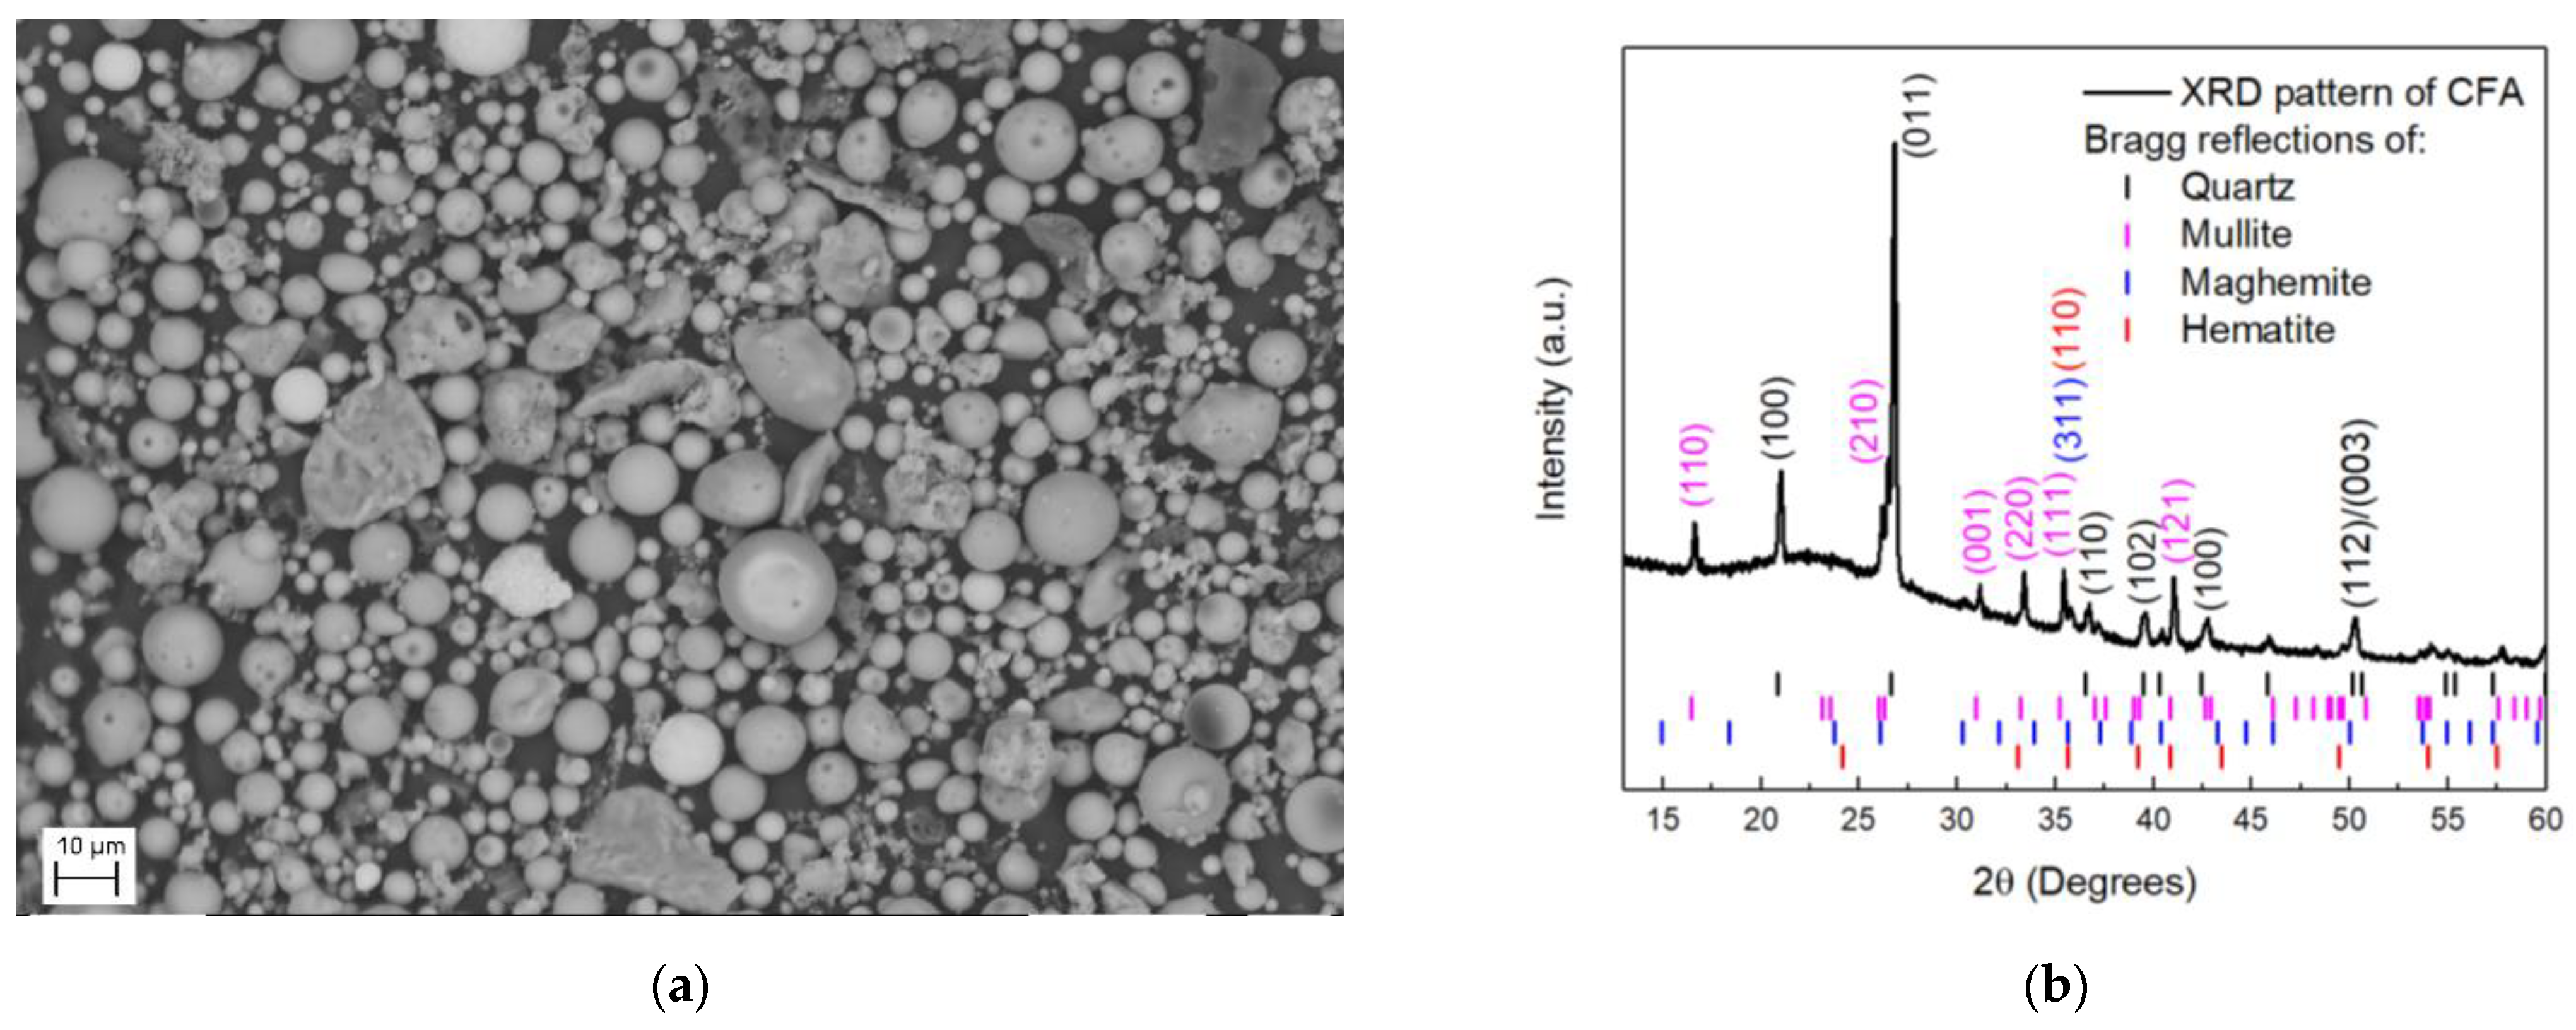
2.1. Properties of CFA
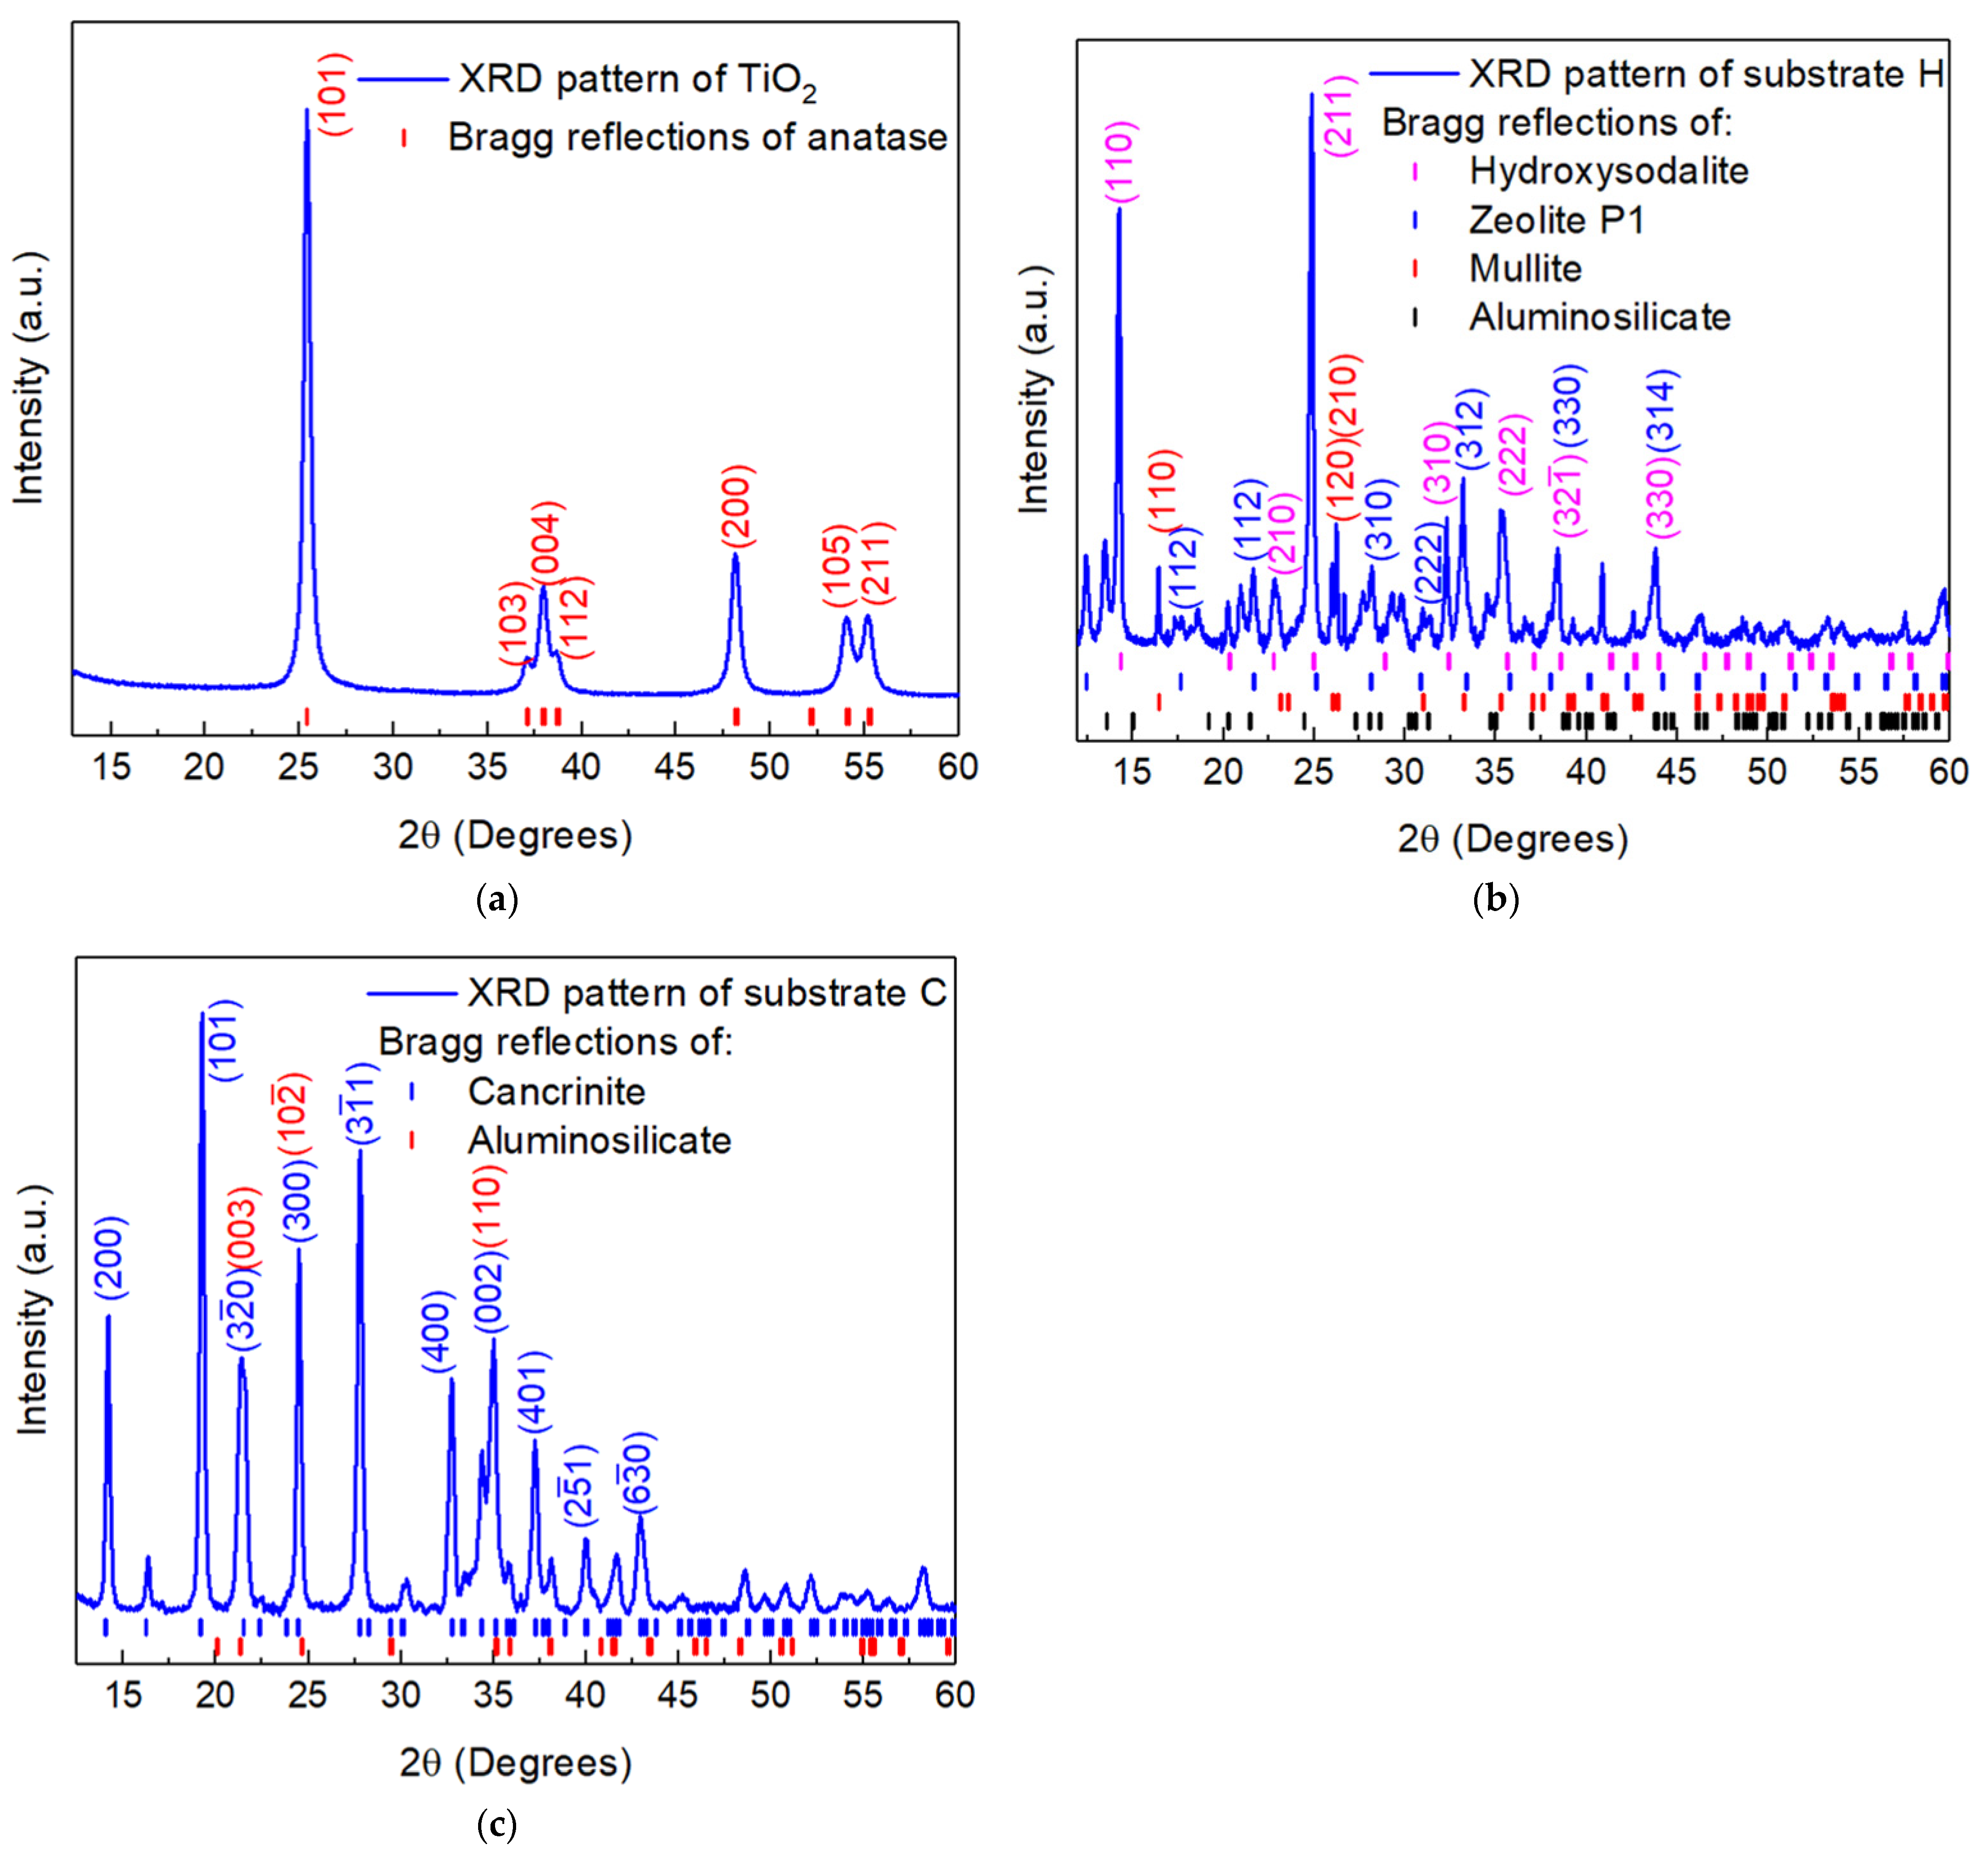
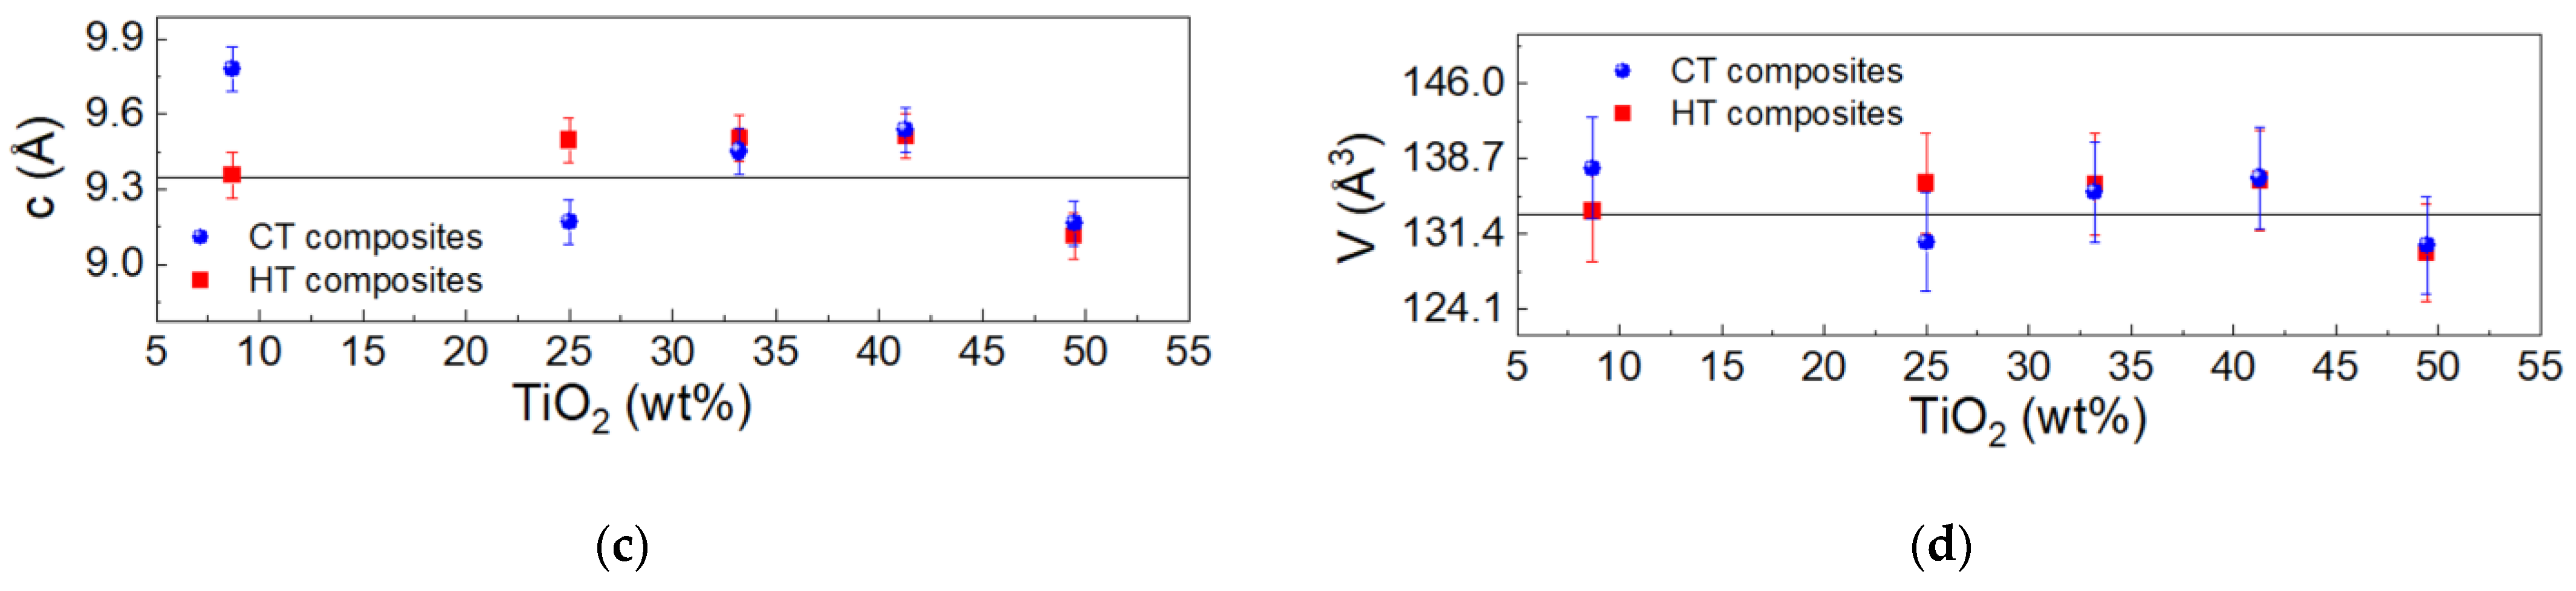
2.2. Structural Properties of Synthesized TiO2 and Substrates
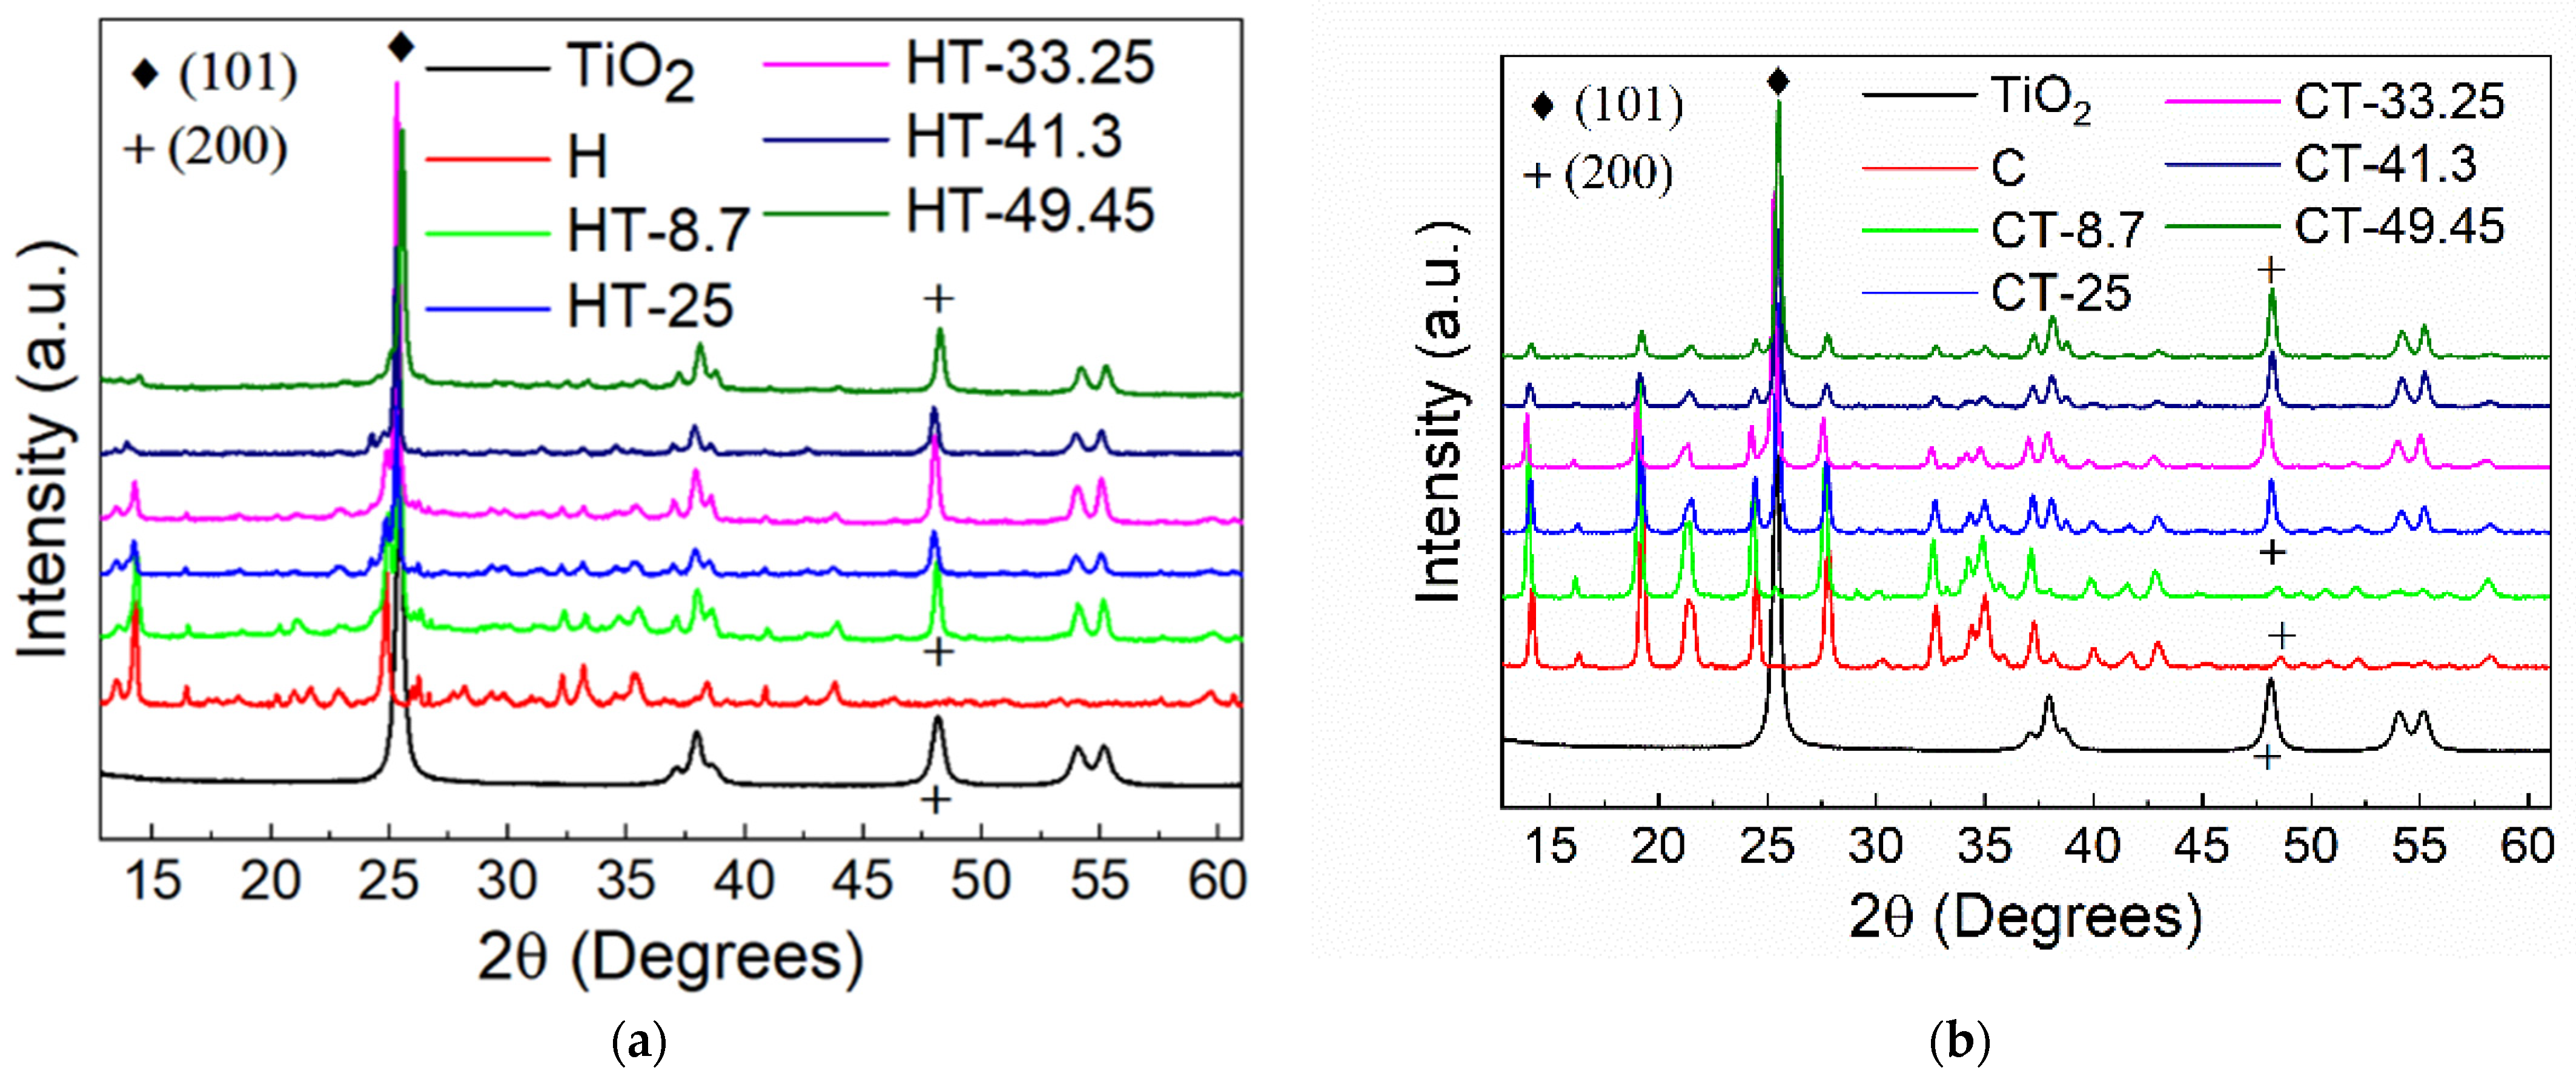
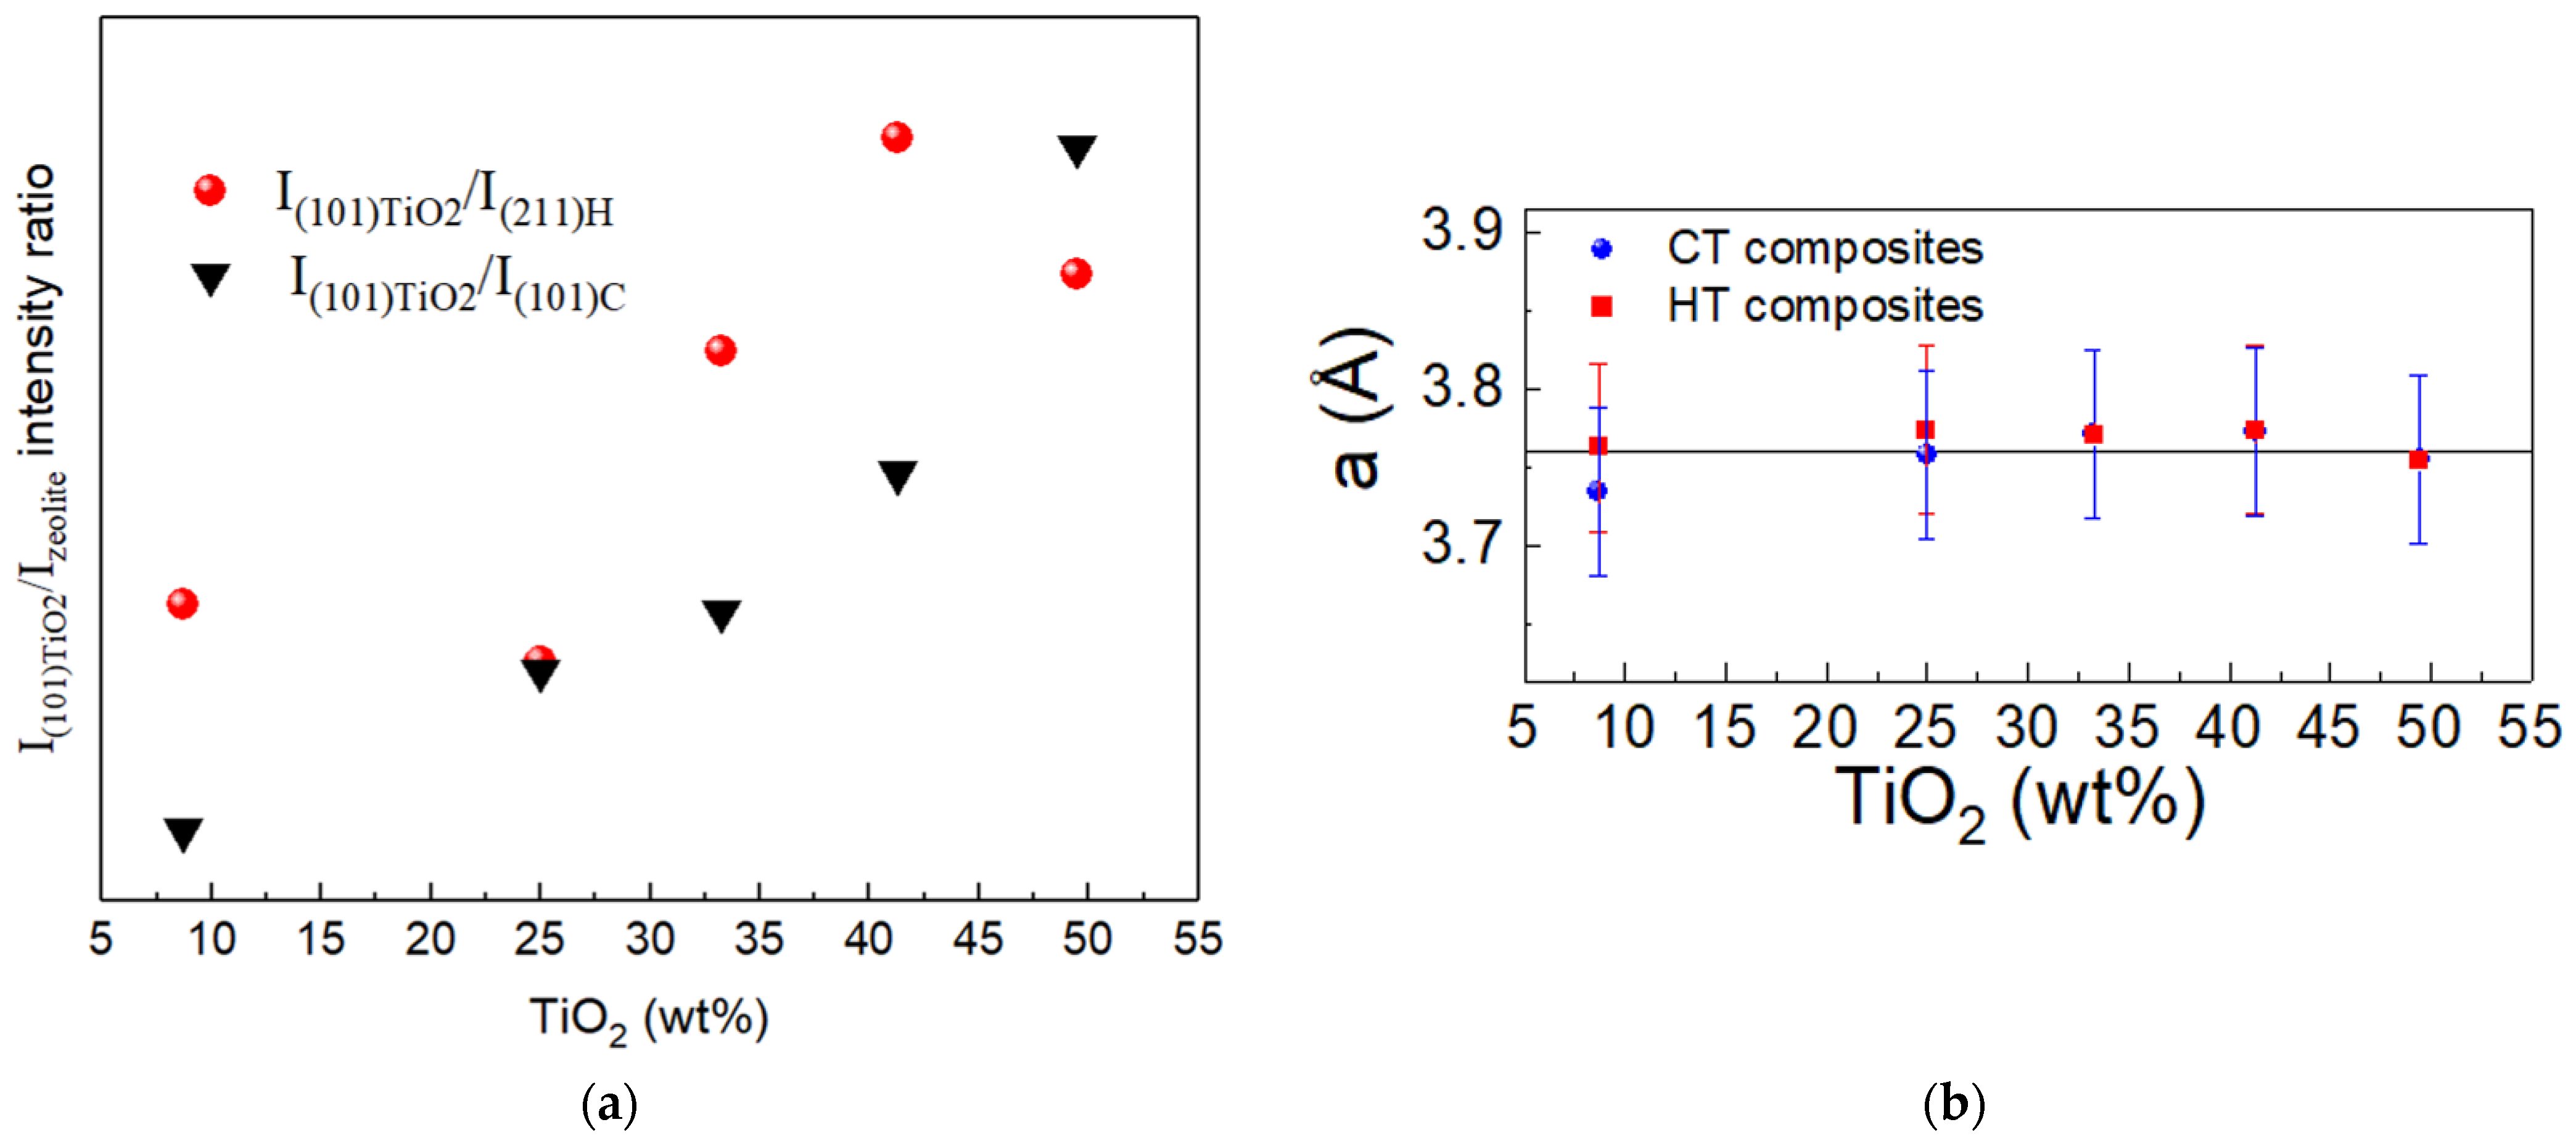
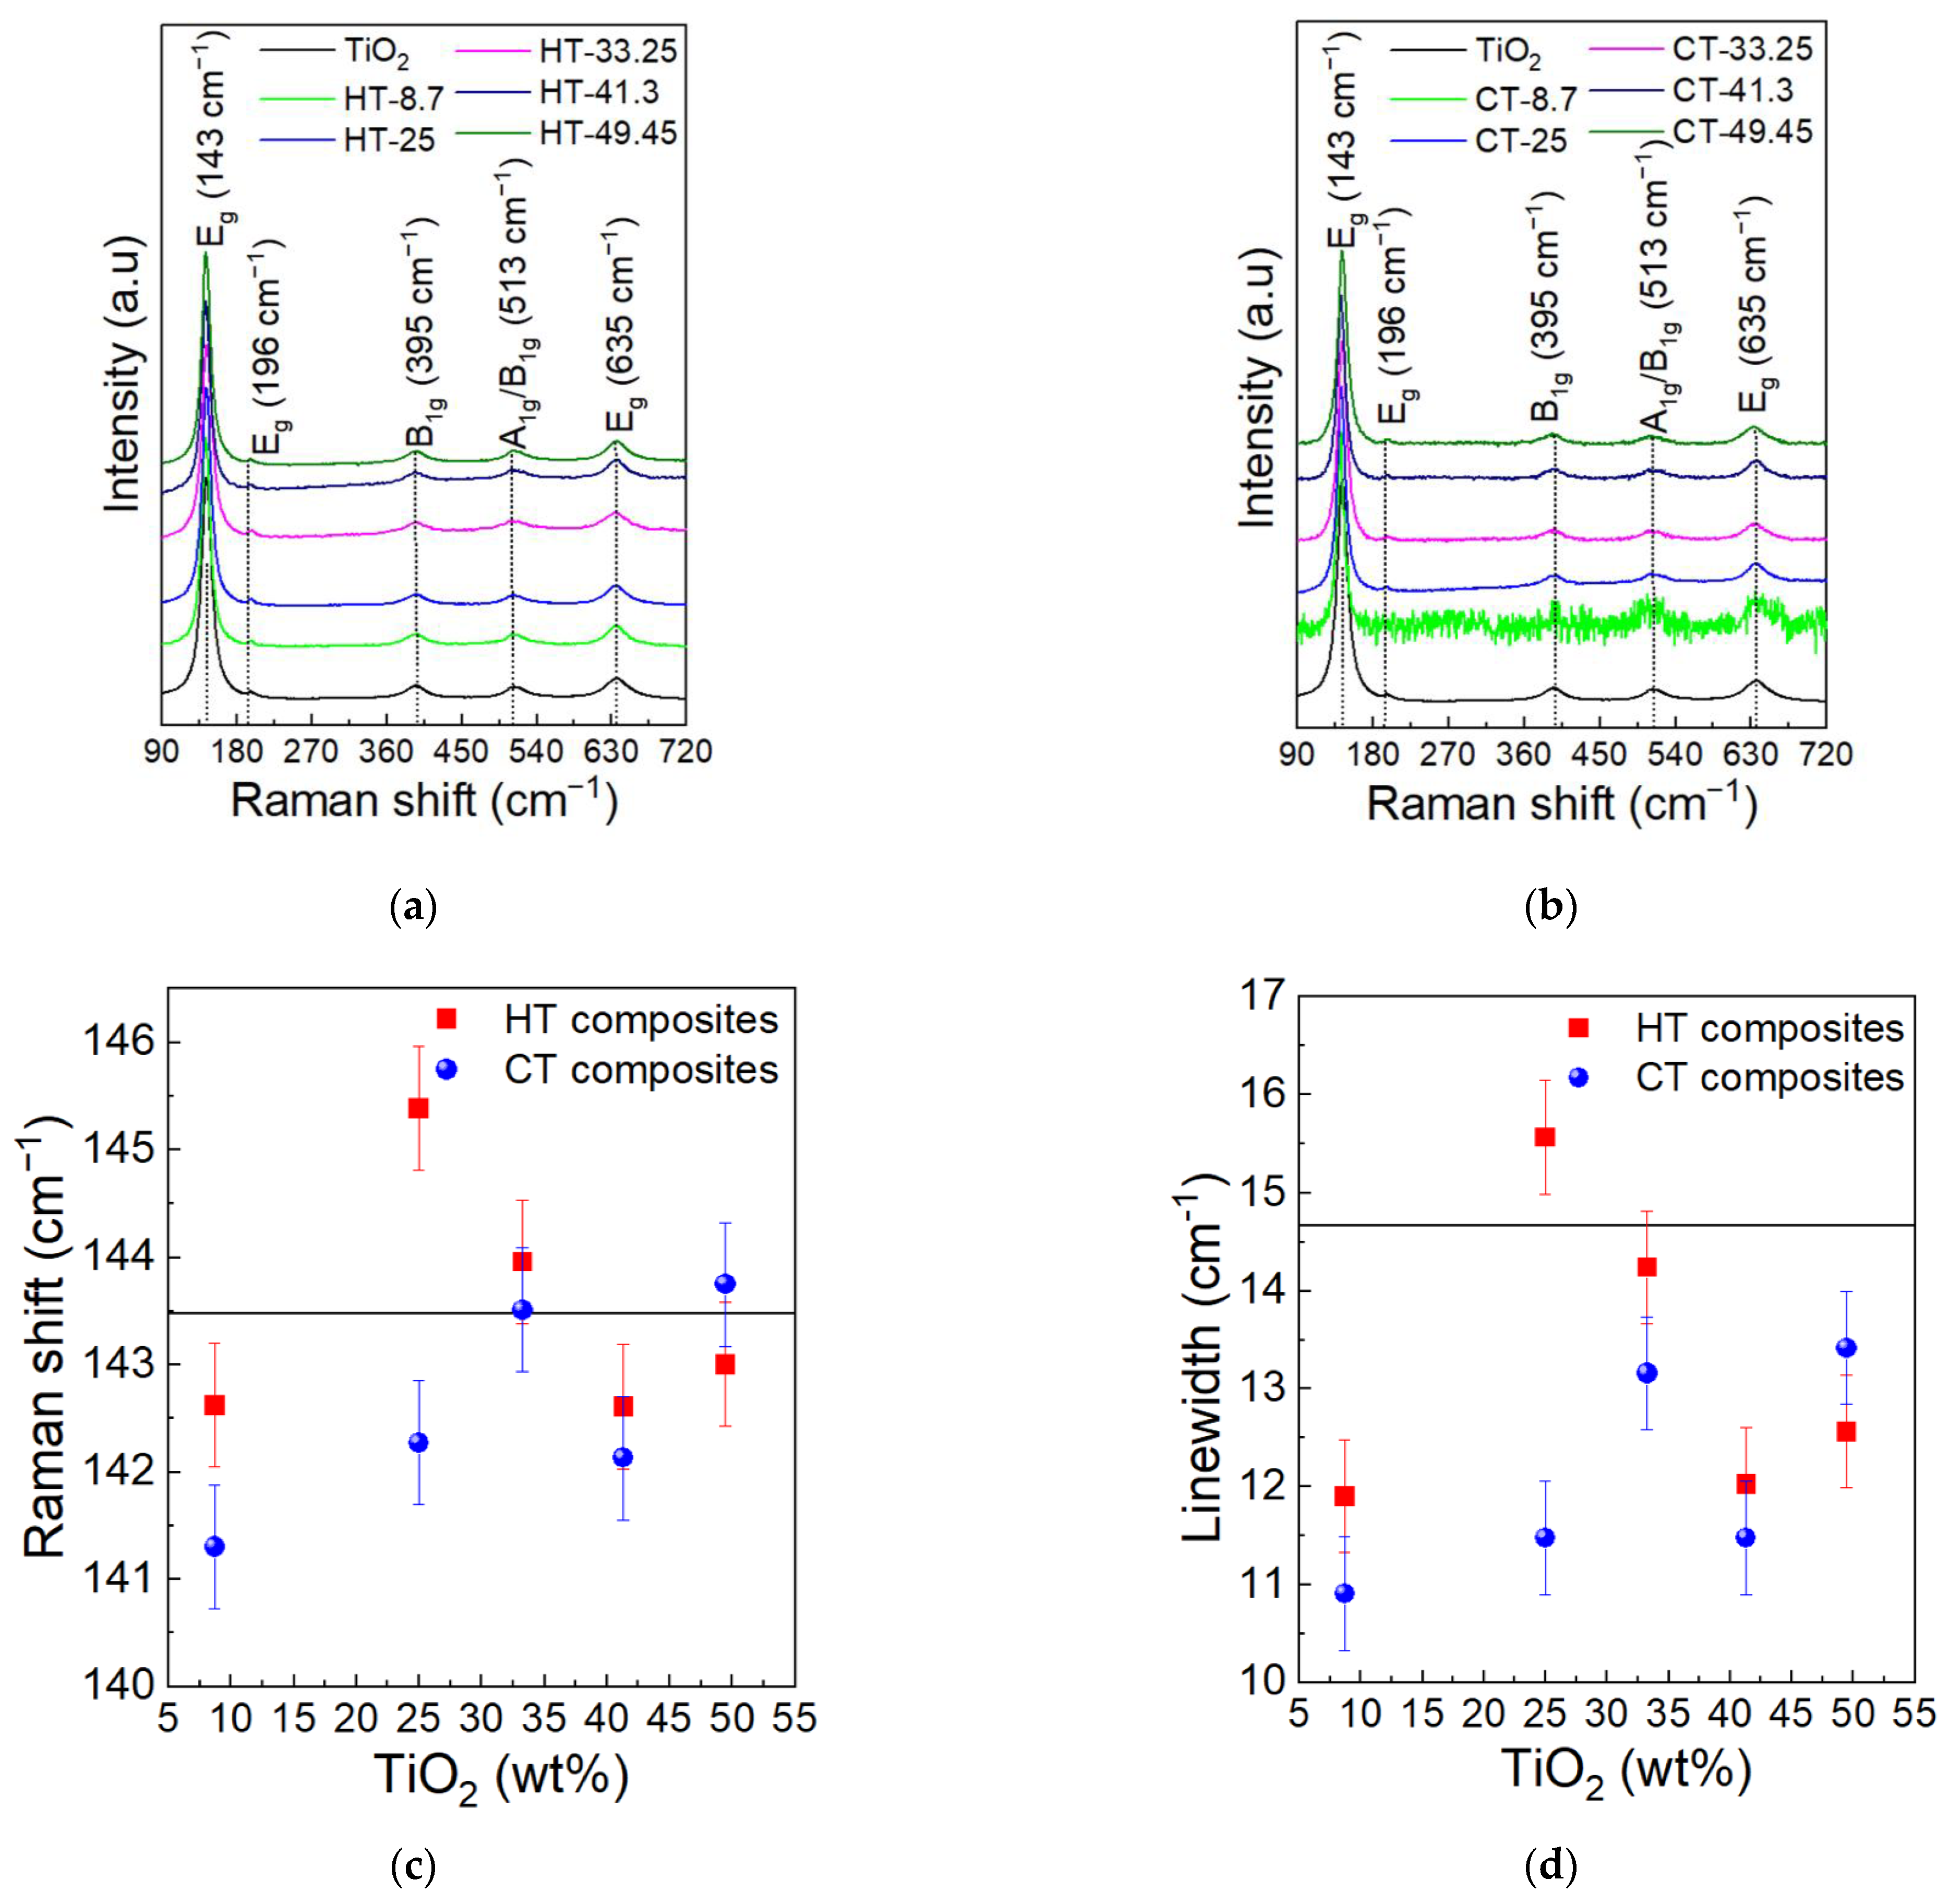
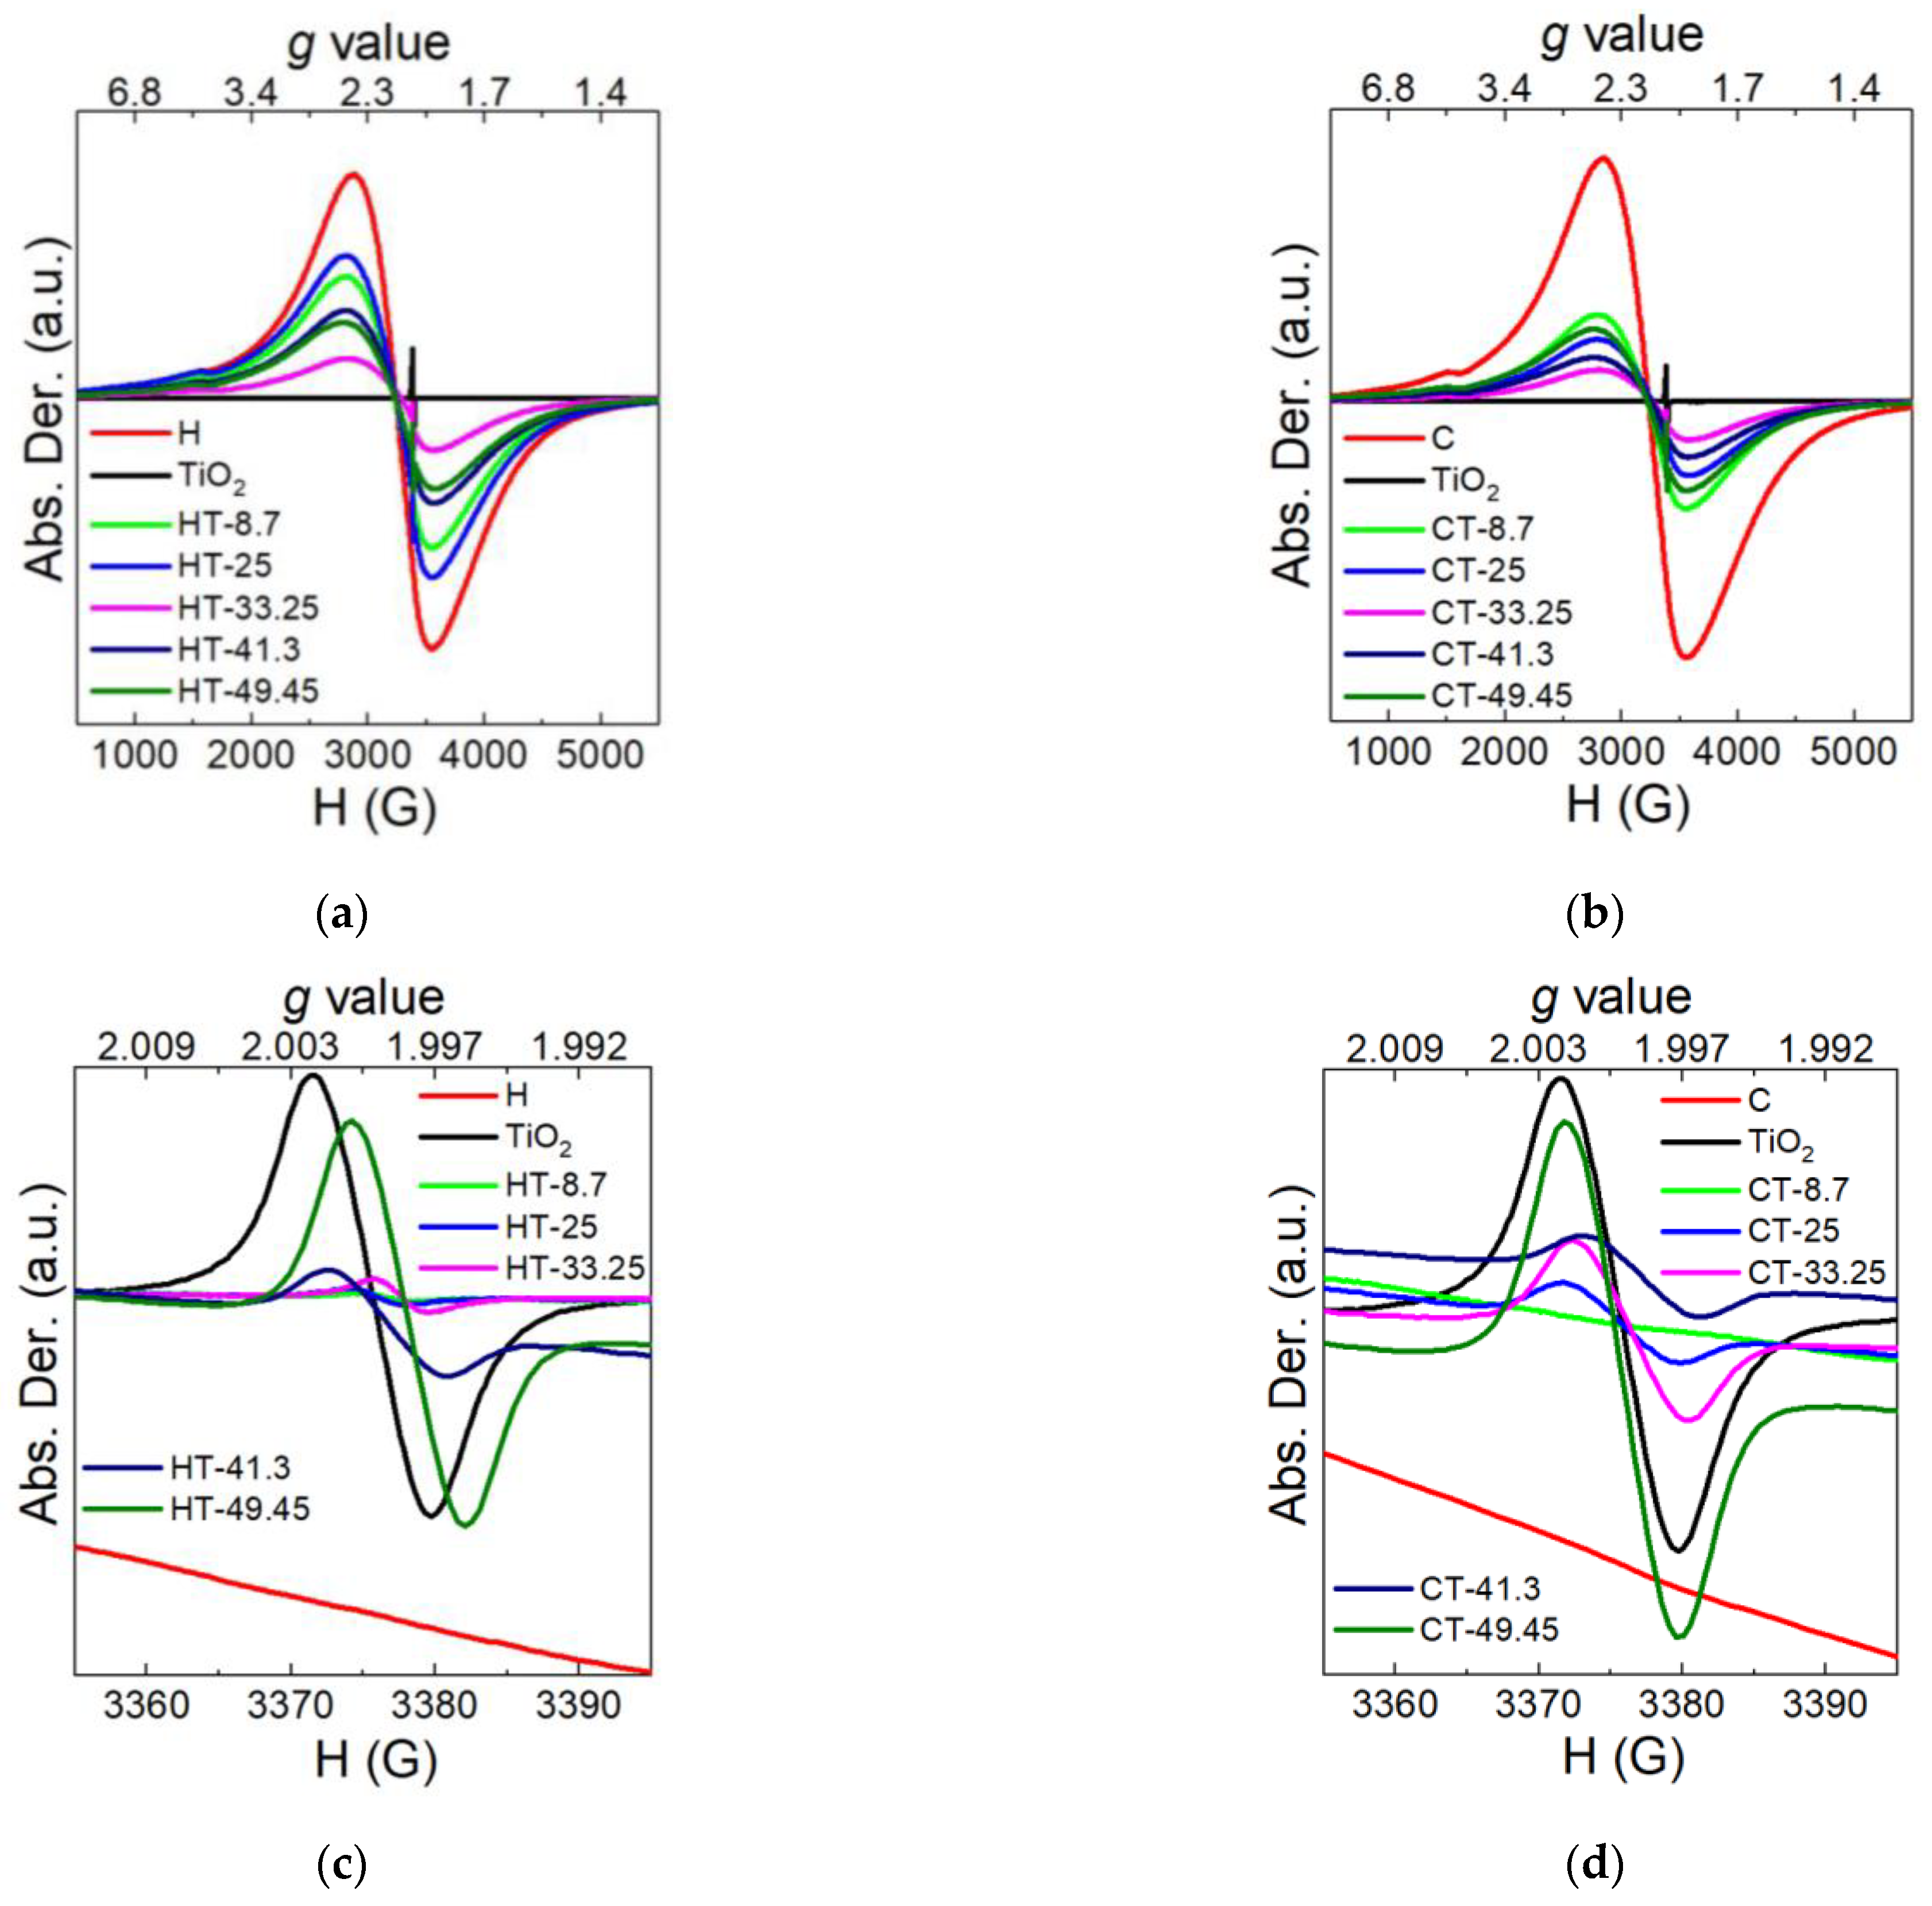
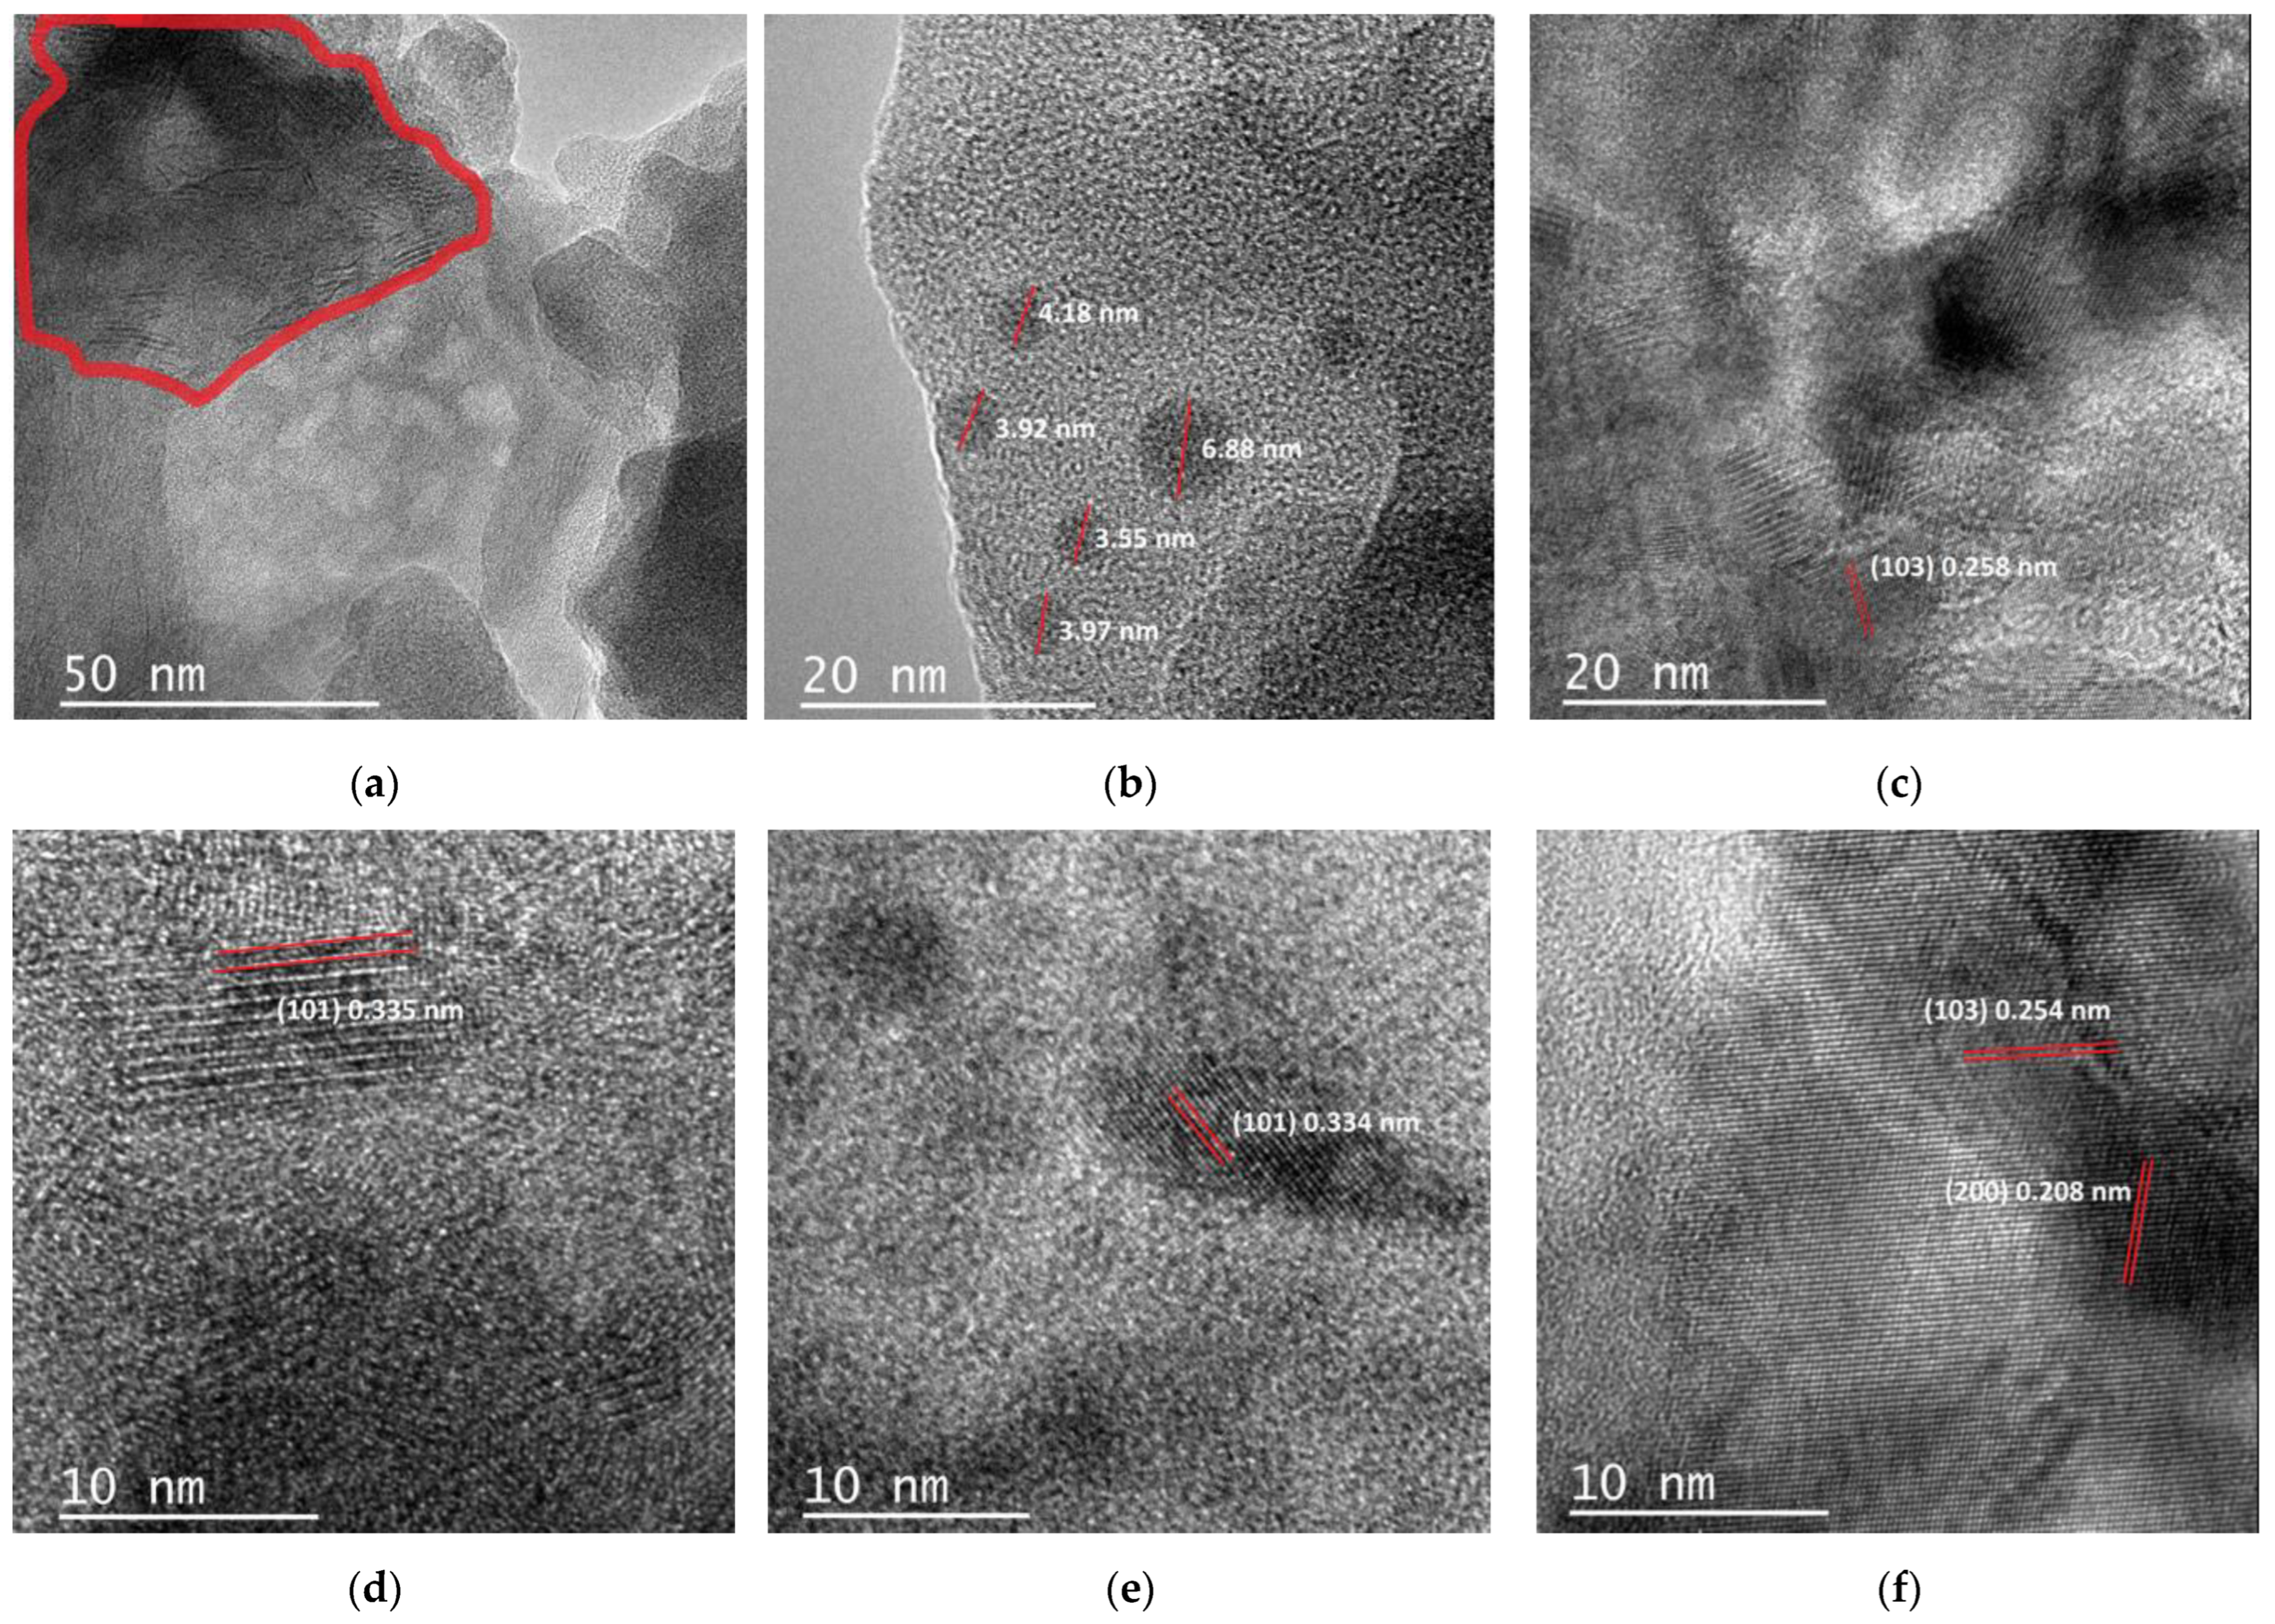
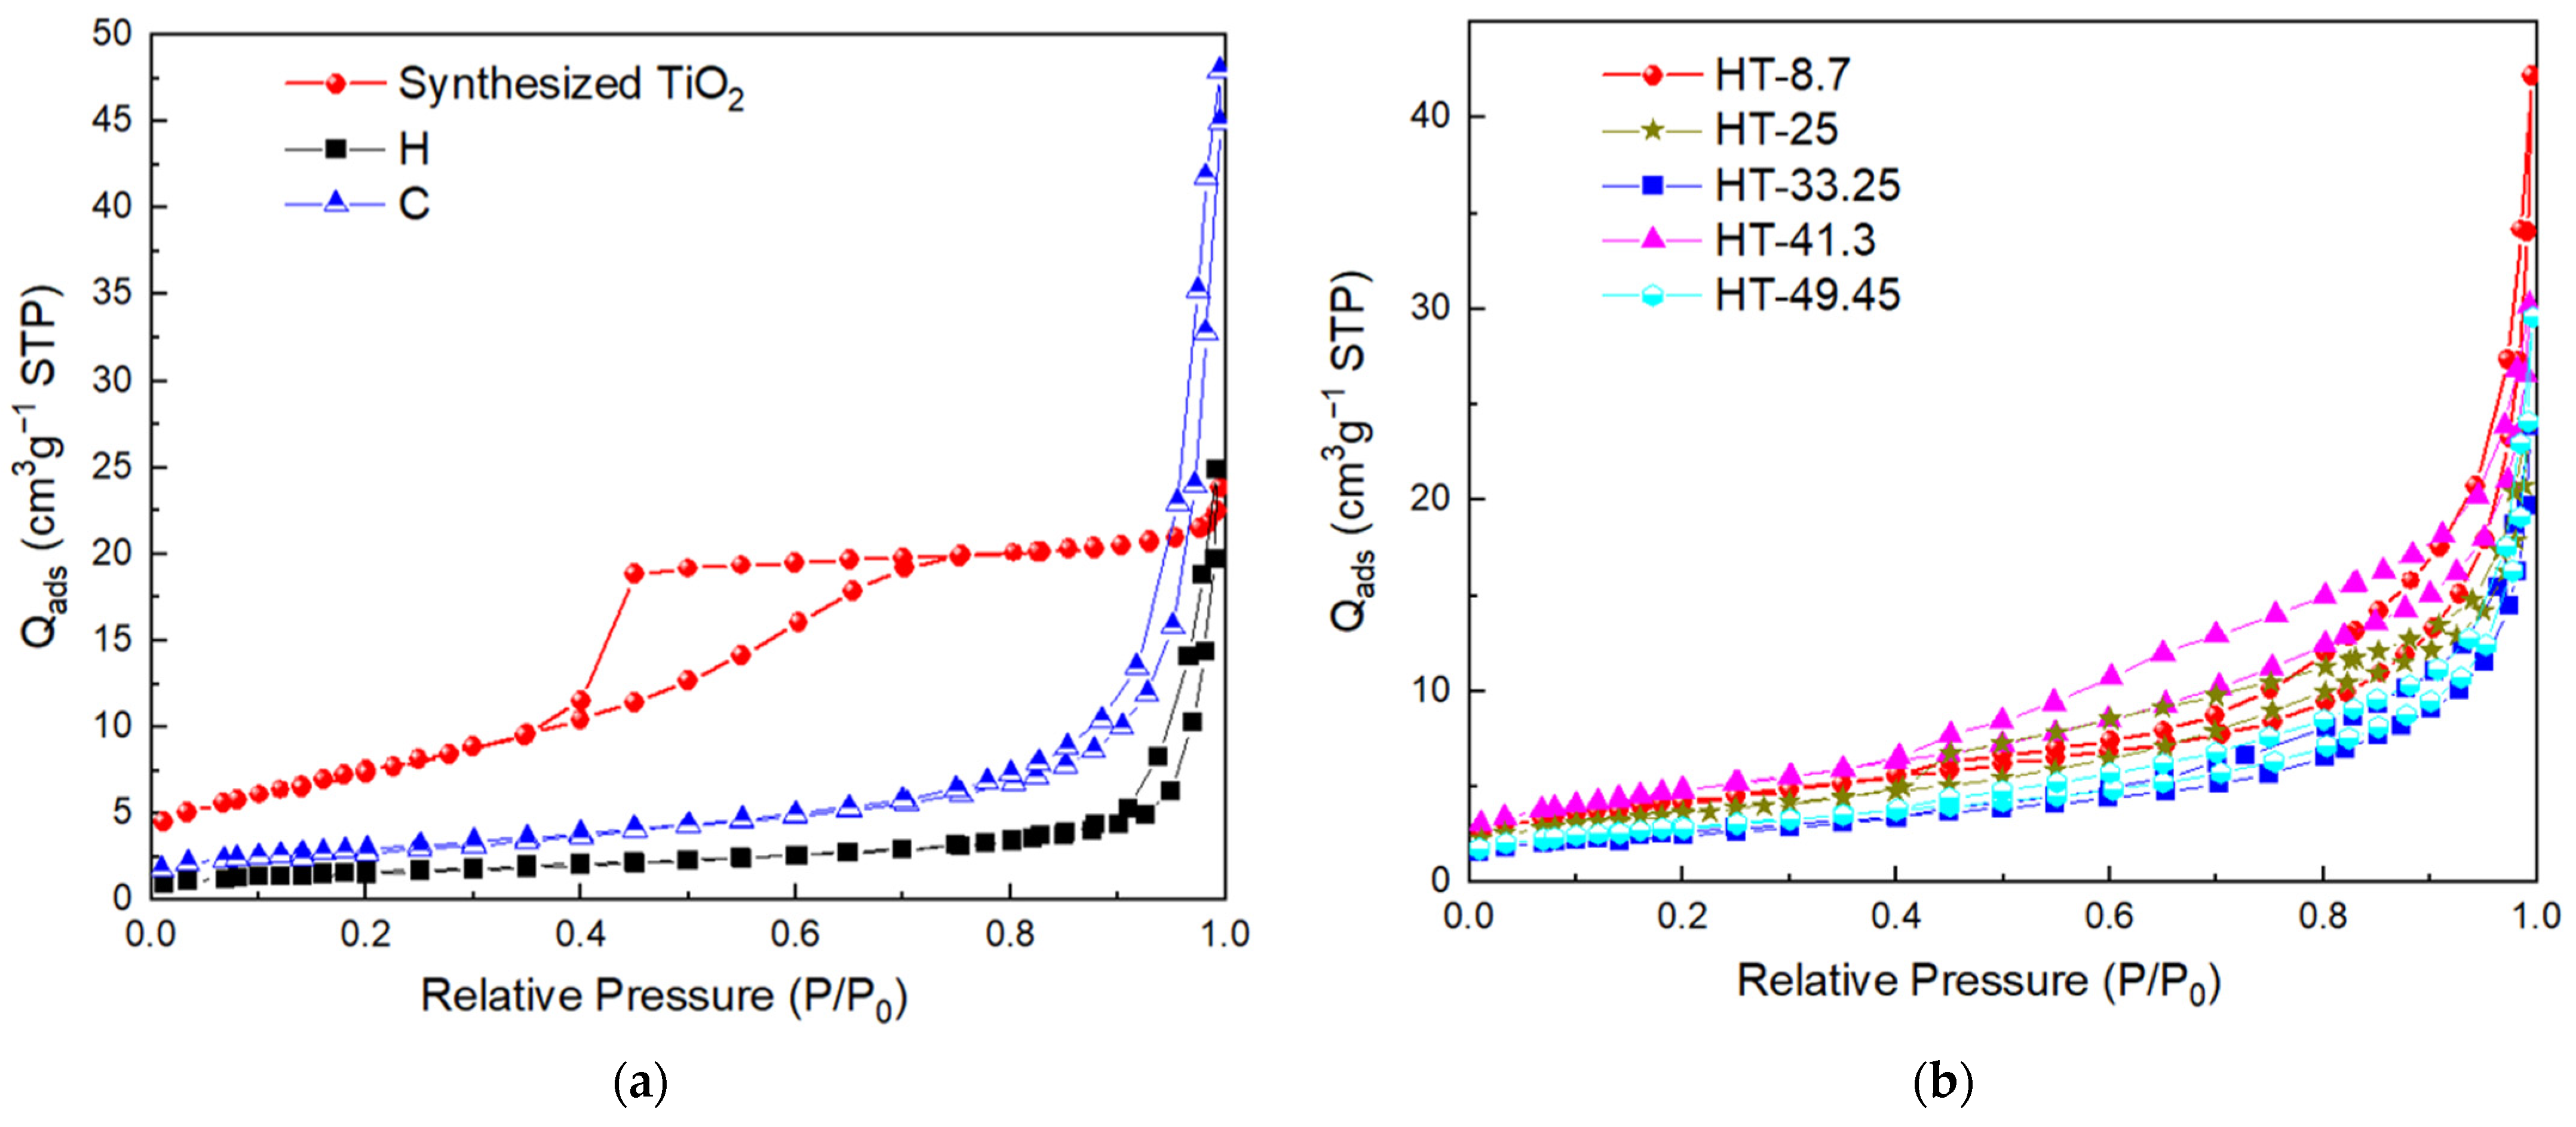
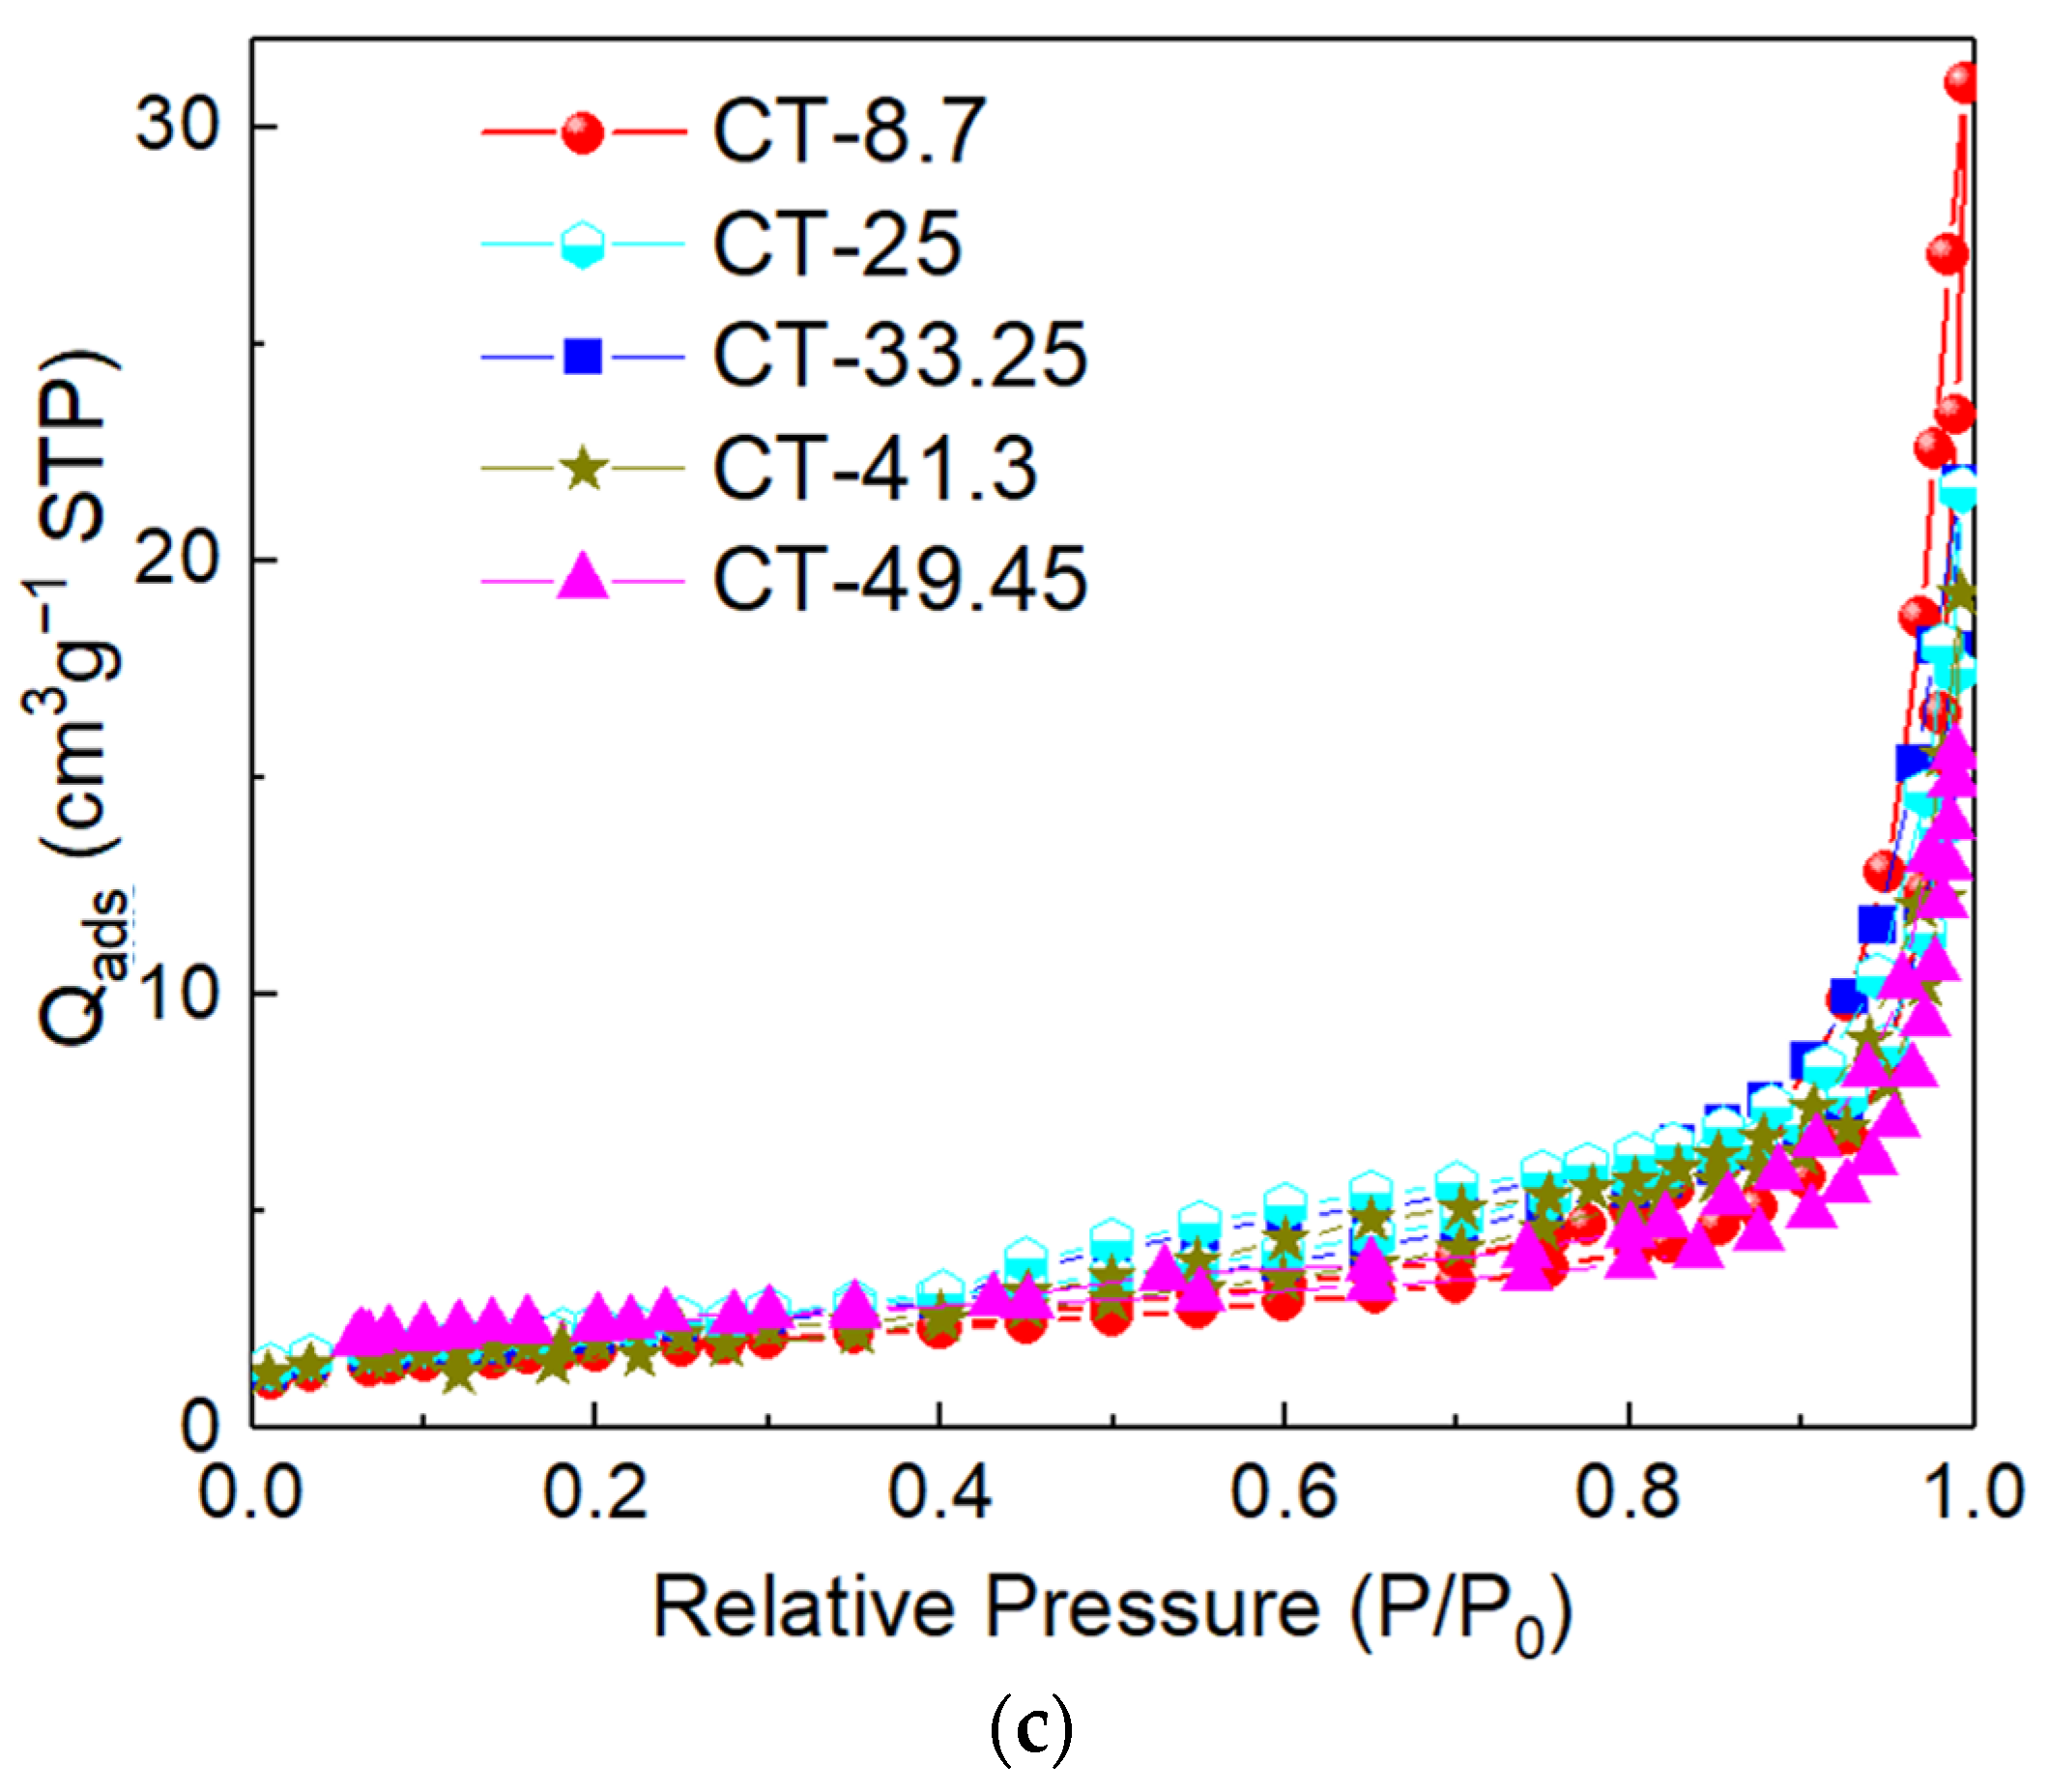
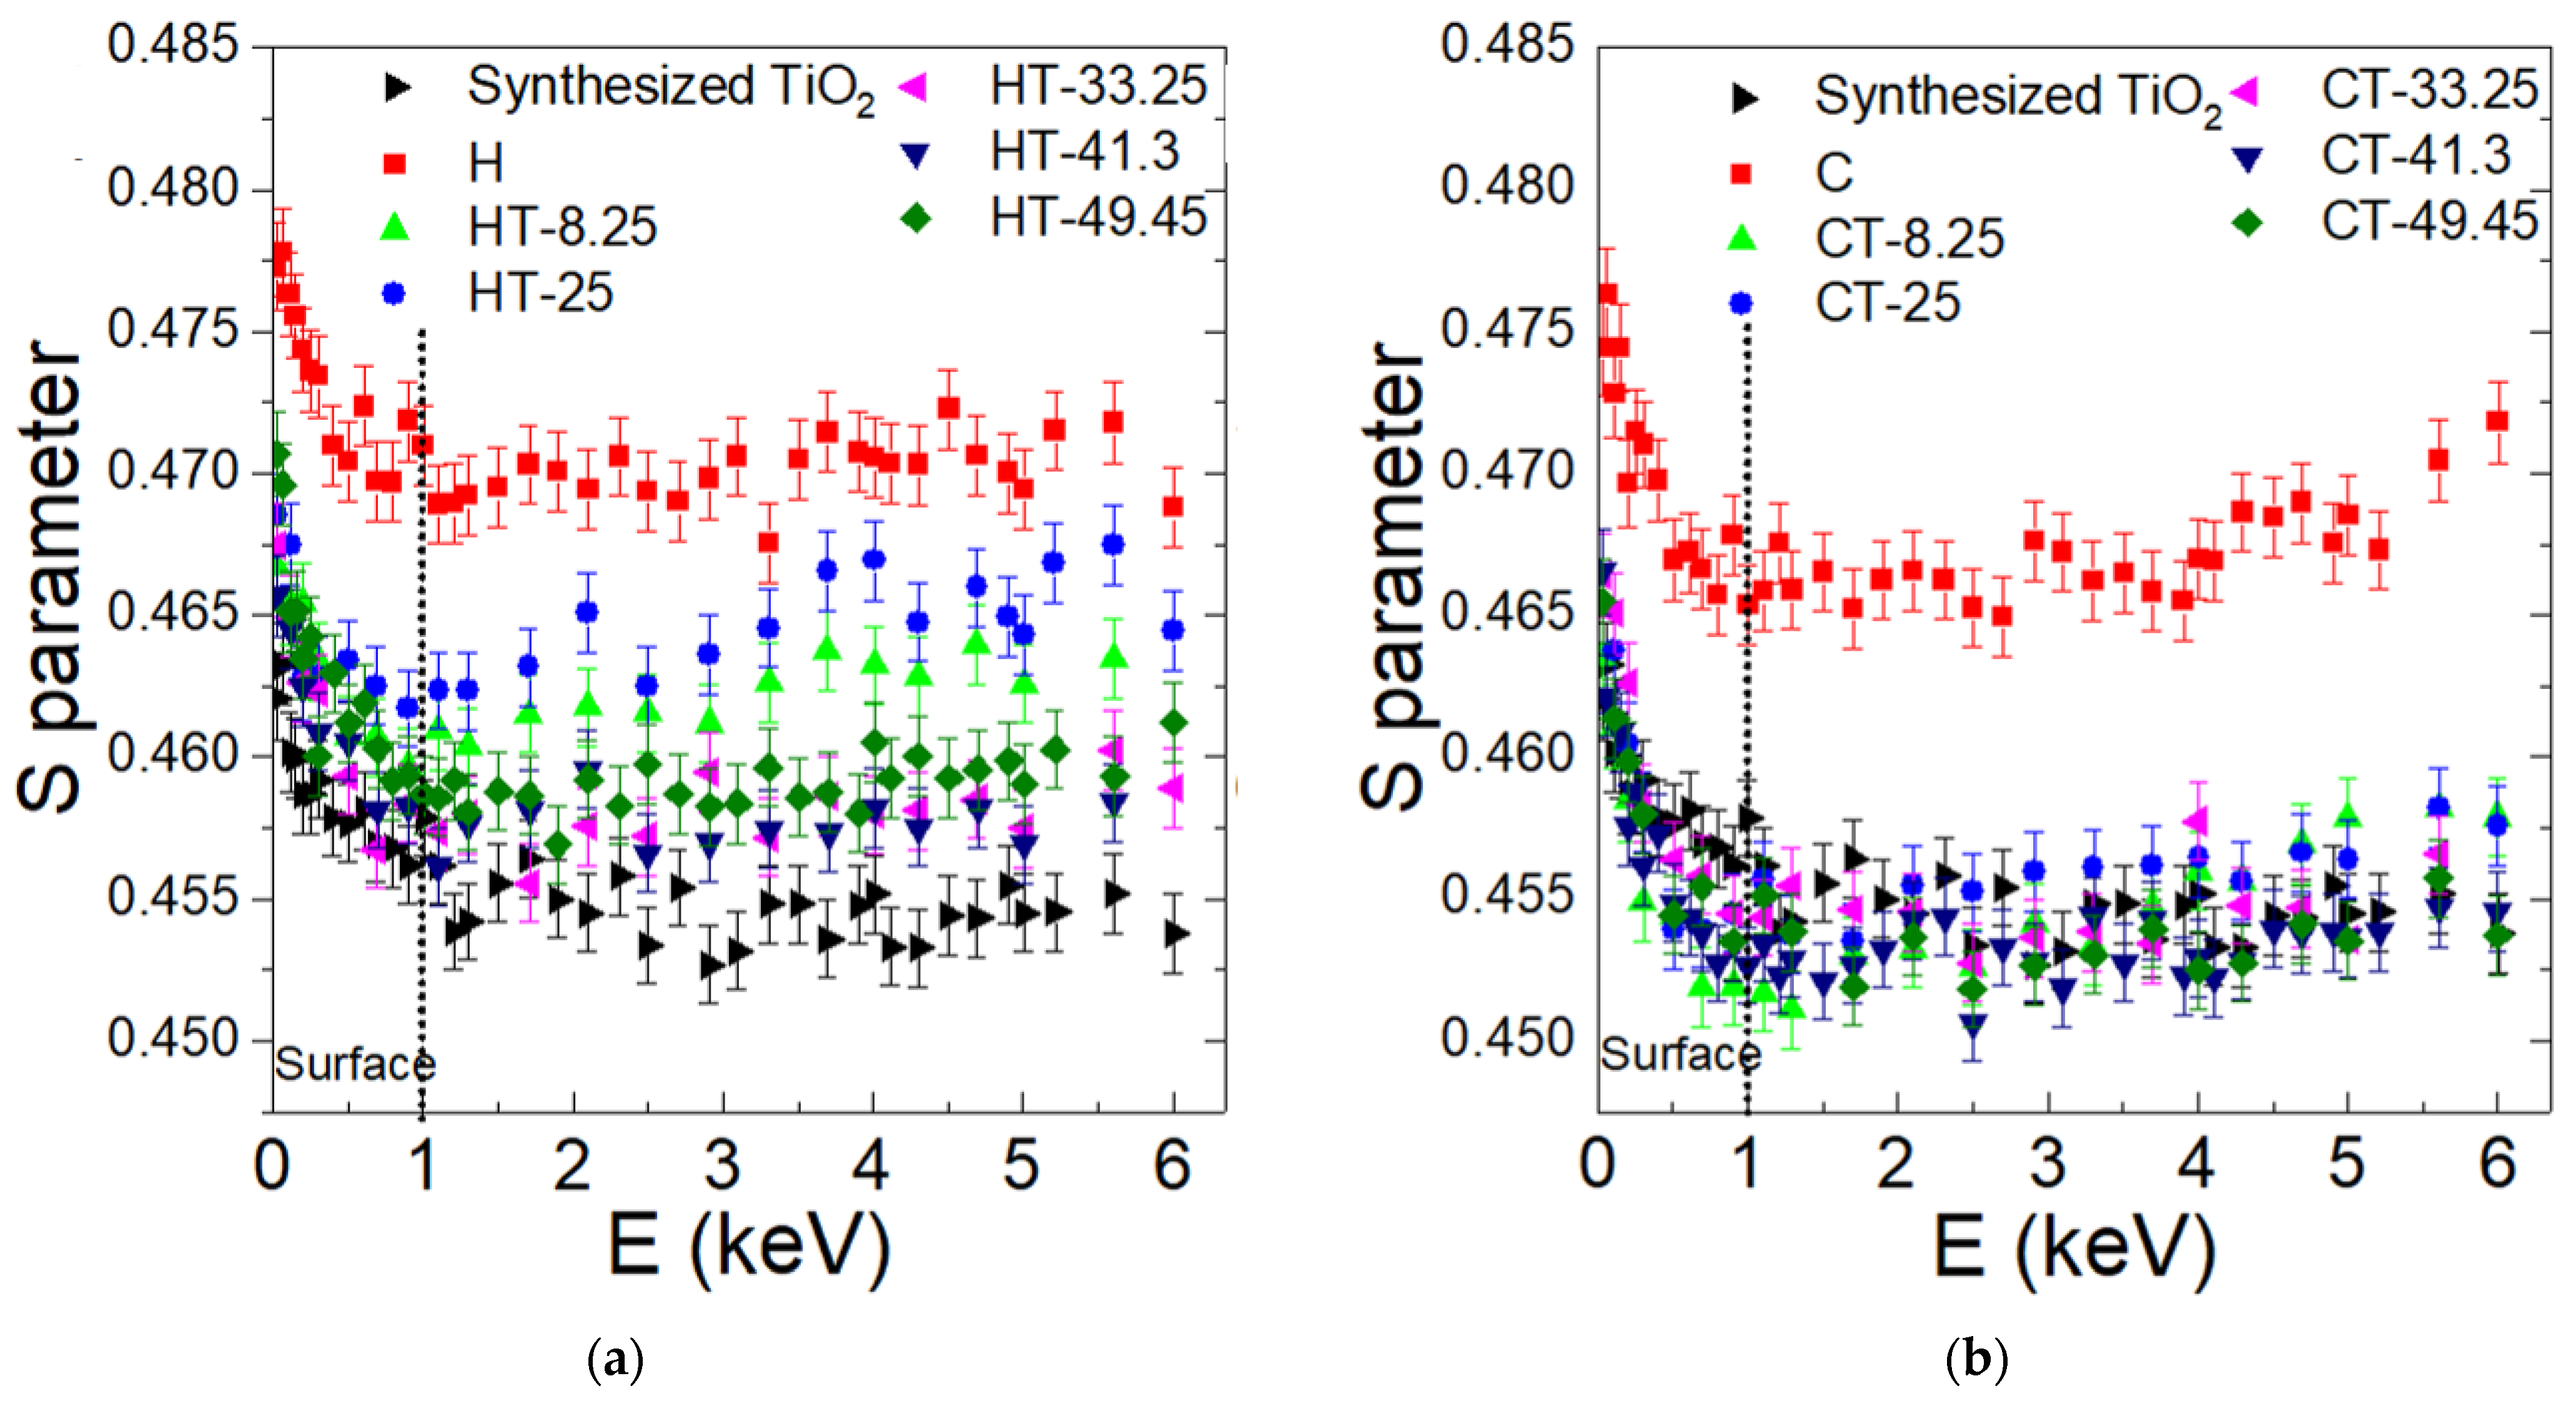
2.3. Properties of TiO2-Zeolite Composites
3. Materials and Methods
3.1. Materials
3.2. Properties of CFA
3.3. Alkaline Activation of CFA by the Hydrothermal Method
- (a)
- 4.2 g of CFA was added in NaOH solution (3 M) at 99.5 °C for 24 h.
- (b)
- 10 g of CFA was added in NaOH solution (4 M) at 95 °C for 24 h.
3.4. Synthesis of TiO2-Zeolite Composites
3.5. Characterization of TiO2-Zeolite Composites
4. Conclusions
Author Contributions
Funding
Institutional Review Board Statement
Informed Consent Statement
Data Availability Statement
Acknowledgments
Conflicts of Interest
References
- Rafiq, A.; Ikram, M.; Ali, S.; Niaz, F.; Khan, M.; Khan, Q.; Maqbool, M. Photocatalytic degradation of dyes using semiconductor photocatalysts to clean industrial water pollution. J. Ind. Eng. Chem. 2021, 97, 111–128. [Google Scholar] [CrossRef]
- Mehta, A.; Mishra, A.; Sharma, M.; Singh, S.; Basu, S. Effect of silica/titania ratio on enhanced photooxidation of industrial hazardous materials by microwave treated mesoporous SBA-15/TiO2 nanocomposites. J. Nanopart. Res. 2016, 18, 209. [Google Scholar] [CrossRef]
- Wajid Shah, M.; Zhu, Y.; Fan, X.; Zhao, J.; Li, Y.; Asim, S.; Chuanyi, W. Facile Synthesis of Defective TiO2−x Nanocrystals with High Surface Area and Tailoring Bandgap for Visible-light Photocatalysis. Sci. Rep. 2015, 5, 15804. [Google Scholar] [CrossRef] [PubMed] [Green Version]
- Zhang, G.; Song, A.; Duan, Y.; Zheng, S. Enhanced photocatalytic activity of TiO2/zeolite composite for abatement of pollutants. Microporous. Mesoporous. Mater. 2018, 255, 61–68. [Google Scholar] [CrossRef]
- Yang, L.; Wang, F.; Hakki, A.; Macphee, D.E.; Liu, P.; Hu, S. The influence of zeolites fly ash bead/TiO2 composite material surface morphologies on their adsorption and photocatalytic performance. Appl. Surf. Sci. 2017, 392, 687–696. [Google Scholar] [CrossRef]
- Chong, M.N.; Tneu, Z.Y.; Poh, P.E.; Jin, B.; Aryal, R. Synthesis, characterization and application of TiO2–zeolite nanocomposites for the advanced treatment of industrial dye wastewater. J. Taiwan Inst. Chem. Eng. 2015, 50, 288–296. [Google Scholar] [CrossRef]
- Setthaya, N.; Chindaprasirt, P.; Yin, S.; Pimraksa, K. TiO2-zeolite photocatalysts made of metakaolin and rice husk ash for removal of methylene blue dye. Powder Technol. 2017, 313, 417–426. [Google Scholar] [CrossRef]
- Alberti, S.; Caratto, V.; Peddis, D.; Belviso, C.; Ferretti, M. Synthesis and characterization of a new photocatalyst based on TiO2 nanoparticles supported on a magnetic zeolite obtained from iron and steel industrial waste. J. Alloy Compd. 2019, 797, 820–825. [Google Scholar] [CrossRef]
- Jansson, I.; Suárez, S.; Garcia-Garcia, F.J.; Sánchez, B. Zeolite–TiO2 hybrid composites for pollutant degradation in gas phase. Appl. Catal B 2015, 178, 100–107. [Google Scholar] [CrossRef]
- Liu, C.; Zhang, R.; Wei, S.; Wang, J.; Liu, Y.; Li, M.; Liu, R. Selective removal of H2S from biogas using a regenerable hybrid TiO2/zeolite composite. Fuel 2015, 157, 183–190. [Google Scholar] [CrossRef]
- Guesh, K.; Mayoral, A.; Marquez-Alvarez, C.; Chebude, Y.; Díaz, I. Enhanced photocatalytic activity of TiO2 supported on zeolites tested in real wastewaters from the textile industry of Ethiopia. Microporous. Mesoporous. Mater. 2016, 225, 88–97. [Google Scholar] [CrossRef]
- Yamaguchi, S.; Fukura, T.; Imai, Y.; Yamauara, H.; Yahiro, H. Photocatalytic activities for partial oxidation of a-methylstyrene over zeolite-supported titanium dioxide and the influence of water addition to reaction solvent. Electrochim. Acta 2010, 55, 7745–7750. [Google Scholar] [CrossRef]
- Xu, Y.; Langford, C.H. Photoactivity of Titanium Dioxide Supported on MCM41, Zeolite X, and Zeolite Y. J. Phys. Chem. B 1997, 101, 3115–3121. [Google Scholar] [CrossRef]
- Mendoza, J.A.; Lee, D.H.; Kang, J.H. Photocatalytic removal of NOx using TiO2-coated zeolite. Environ. Eng. Res. 2016, 3, 291–296. [Google Scholar] [CrossRef]
- Sun, Q.; Hu, X.; Zheng, S.; Sun, Z.; Liu, S.; Li, H. Influence of calcination temperature on the structural, adsorption and photocatalytic properties of TiO2 nanoparticles supported on natural zeolite. Powder Technol. 2015, 274, 88–97. [Google Scholar] [CrossRef]
- Hefni, Y.; El Zaher, Y.A.; Wahab, M.A. Influence of activation of fly ash on the mechanical properties of Concrete. Constr. Build. Mater. 2018, 172, 728–734. [Google Scholar] [CrossRef]
- Supelano, G.I.; Gómez Cuaspud, J.A.; Moreno-Aldana, L.C.; Ortiz, C.; Trujillo, C.A.; Palacio, C.A.; Parra Vargas, C.A.; Mejía Gómez, J.A. Synthesis of magnetic zeolites from recycled fly ash for adsorption of methylene blue. Fuel 2020, 263, 116800. [Google Scholar] [CrossRef]
- Sivalingam, S.; Sen, S. Optimization of synthesis parameters and characterization of coal fly ash derived microporous zeolite X. Appl. Surf. Sci. 2018, 455, 903–910. [Google Scholar] [CrossRef]
- Hafez, H.; Kurda, R.; Cheung, W.M.; Nagaratnam, B. Comparative life cycle assessment between imported and recovered fly ash for blended cement concrete in the UK. J. Clean. Prod. 2020, 244, 118722. [Google Scholar] [CrossRef]
- Gomaa, E.; Gheni, A.A.; Kashosi, C.; El Gawady, A.A. Bond strength of eco-friendly class C fly ash-based thermally cured alkali-activated concrete to portland cement concrete. J. Clean. Prod. 2019, 235, 404–416. [Google Scholar] [CrossRef]
- Lan, T.; Guo, S.; Li, X.; Guo, J.; Bai, T.; Zhao, Q.; Yang, W.; Li, P. Mixed precursor geopolymer synthesis for removal of Pb(II) and Cd(II). Mater. Lett. 2020, 274, 127977. [Google Scholar] [CrossRef]
- Zhao, X.; Liu, C.; Zuo, L.; Wang, L.; Zhu, Q.; Liu, Y.; Zhou, B. Synthesis and characterization of fly ash geopolymer paste for goal backfill: Reuse of soda residue. J. Clean. Prod. 2020, 260, 121045. [Google Scholar] [CrossRef]
- Verrecchia, G.; Cafiero, L.; de Caprariis, B.; Dell’Era, A.; Pettiti, I.; Tuffi, R.; Scarsella, M. Study of the parameters of zeolites synthesis from coal fly ash in order to optimize their CO2 adsorption. Fuel 2020, 276, 118041. [Google Scholar] [CrossRef]
- de Castro Amoni, B.; Lima de Freitas, A.D.; Rodrigues Loiola, A.; Barbosa Soares, J.; de Aguiar Soares, S. A method for NaA zeolite synthesis from coal fly ash and its application in warm mix asphalt. Road Mater. Pavement Des. 2019, 20, S558–S567. [Google Scholar] [CrossRef]
- Derkowski, A.; Franus, W.; Beran, E.; Czímerová, A. Properties and potential applications of zeolitic materials produced from fly ash using simple method of synthesis. Powder Technol. 2006, 166, 47–54. [Google Scholar] [CrossRef]
- Kotova, O.B.; Shabalin, I.N.; Shushkov, D.A.; Kocheva, L.S. Hydrothermal synthesis of zeolites from coal fly ash. Adv. Appl. Ceram. 2016, 115, 152–157. [Google Scholar] [CrossRef] [Green Version]
- Gamero-Vega, K.Y.; Medina-Ramírez, A.; Khamkure, S.; Orozco-Núñez, S.I.; Aguilera-González, E.N.; Gamero-Melo, P. Upscaling of W zeolite direct synthesis from coal fly ash and its water adsorption capacity. J. Chem. Technol. Biotechnol. 2019, 94, 3479–3487. [Google Scholar] [CrossRef]
- Liu, Z.; Liu, Z.; Cui, T.; Dong, L.; Zhang, J.; Han, L.; Li, J.; Liu, C. Photocatalyst from one-dimensional TiO2 nanowires/synthetic zeolite composites. Mater. Express 2014, 4, 465–474. [Google Scholar] [CrossRef]
- Supelano García, I.; Ortíz Otálora, C.A.; Parra Vargas, C.A.; Mejía Gómez, J.A. Assessment of hydrothermal parameters on alkaline activation of fly ashes using a central composite design. J. Met. Mater. Min. 2021, 31, 54–61. [Google Scholar] [CrossRef]
- Irfa, H.; Mohamed, R.K.; Anand, S. Microstructural evaluation of CoAl2O4 nanoparticles by Williamson–Hall andsize–strain plot methods. J. Asian Ceram. Soc. 2018, 6, 54–62. [Google Scholar] [CrossRef]
- Ohsaka, T.; Izumi, F.; Fujiki, Y. Raman Spectrum of Anatase, TiO2. J. Raman. Spectrosc. 1978, 7, 321–324. [Google Scholar] [CrossRef]
- Mazzolini, P.; Russo, V.; Casari, C.S.; Hitosugi, T.; Nakao, S.; Hasegawa, T.; Bassi, A.L. Vibrational–Electrical Properties Relationship in Donor-Doped TiO2 by Raman Spectroscopy. J. Phys. Chem. C 2016, 120, 18878–18886. [Google Scholar] [CrossRef] [Green Version]
- Choi, H.C.; Jung, Y.M.; Kim, S.B. Size effects in the Raman spectra of TiO2 nanoparticles. Vib. Spectrosc. 2005, 37, 33–38. [Google Scholar] [CrossRef]
- Liu, G.; Han, C.; Pelaez, M.; Zhu, D.; Liao, S.; Likodimos, V.; Ioannidis, N.; Kontos, A.G.; Falaras, P.; Dunlop, P.S.M.; et al. Synthesis, characterization and photocatalytic evaluation of visible light activated C-doped TiO2 nanoparticles. Nanotechnology 2012, 23, 294003. [Google Scholar] [CrossRef] [PubMed]
- Leith, I.R.; Leach, H.F. Adsorbate interactions on copper-exchanged X-type zeolite catalysts studied by E.P.R. spectroscopy. Proc. R. Soc. A 1972, 330, 247–263. [Google Scholar]
- Zhao, Y.; Zhao, Y.; Shi, R.; Wang, B.; Waterhouse, G.I.N.; Wu, L.Z.; Tung, C.H.; Zhang, T. Tuning Oxygen Vacancies in Ultrathin TiO2 Nanosheets to Boost Photocatalytic Nitrogen Fixation up to 700 nm. Adv. Mater. 2019, 31, 1806482. [Google Scholar] [CrossRef] [PubMed]
- Xing, M.; Fang, W.; Nasir, M.; Ma, Y.; Zhang, J.; Anpo, M. Self-doped Ti3+-enhanced TiO2 nanoparticles with a high-performance photocatalysis. J. Catal. 2013, 297, 236–243. [Google Scholar] [CrossRef]
- Aronne, A.; Fantauzzi, M.; Imparato, C.; Atzei, D.; De Stefano, L.; D’Errico, G.; Sannino, F.; Rea, I.; Pirozzi, D.; Elsener, B.; et al. Electronic properties of TiO2-based materials characterized by high Ti3+ self-doping and low recombination rate of electron–hole pairs. RSC Adv. 2017, 7, 2373. [Google Scholar] [CrossRef] [Green Version]
- Dong, J.; Han, J.; Liu, Y.; Nakajima, A.; Matsushita, S.; Wei, S.; Gao, W. Defective Black TiO2 Synthesized via Anodization for Visible-Light Photocatalysis. ACS. Appl. Mater. Interfaces 2014, 6, 1385–1388. [Google Scholar] [CrossRef]
- Fang, W.; Zhou, Y.; Dong, C.; Xing, M.; Zhang, J. Enhanced photocatalytic activities of vacuum activated TiO2 catalysts with Ti3+ and N co-doped. Catal. Today 2016, 266, 188–196. [Google Scholar] [CrossRef]
- Su, J.; Zou, X.; Chen, J.S. Self-modification of titanium dioxide materials by Ti3+ and/or oxygen vacancies: New insights into defect chemistry of metal oxides. RSC Adv. 2014, 4, 13979. [Google Scholar] [CrossRef]
- Xiong, L.B.; Li, J.L.; Yang, B.; Yu, Y. Ti3+ in the Surface of Titanium Dioxide: Generation, Properties and Photocatalytic Application. J. Nanomater. 2012, 2012, 831524. [Google Scholar] [CrossRef] [Green Version]
- Saputera, W.H.; Mul, G.; Hamdy, M.S. Ti3+-containing titania: Synthesis tactics and photocatalytic performance. Catal. Today 2015, 246, 60–66. [Google Scholar] [CrossRef]
- Li, W.; Li, D.; Lin, Y.; Wang, P.; Chen, W.; Fu, X.; Shao, Y. Evidence for the Active Species Involved in the Photodegradation Process of Methyl Orange on TiO2. J. Phys. Chem. 2012, 116, 3552–3560. [Google Scholar] [CrossRef]
- Ghafoor, S.; Ata, S.; Mahmood, N.; Arshad, S.N. Photosensitization of TiO2 nanofibers by Ag2S with the synergistic effect of excess surface Ti3+ states for enhanced photocatalytic activity under simulated sunlight. Sci. Rep. 2017, 7, 255. [Google Scholar] [CrossRef] [Green Version]
- Wang, J.; Yang, P.; Huang, B. Self-doped TiO2−x nanowires with enhanced photocatalytic activity: Facile synthesis and effects of the Ti3+. Appl. Surf. Sci. 2015, 356, 391–398. [Google Scholar] [CrossRef]
- Ruirui, L.; Zhijiang, J.; Jing, W.; Jinjun, Z. Mesocrystalline TiO2/sepiolite composites for the effective degradation of methyl orange and methylene blue. Front. Mater. Sci. 2018, 12, 292–303. [Google Scholar]
- Qiu, M.; Tian, Y.; Chen, Z.; Yang, Z.; Li, W.; Wang, K.; Wang, L.; Wang, K.; Zhang, W. Synthesis of Ti3+ self-doped TiO2 nanocrystals based on Le Chatelier’s principle and their application in solar light photocatalysis. RSC Adv. 2016, 6, 74376. [Google Scholar] [CrossRef]
- Khan, H.; Swati, I.K. Fe3+-doped Anatase TiO2 with d−d Transition, Oxygen Vacancies and Ti3+ Centers: Synthesis, Characterization, UV−vis Photocatalytic and Mechanistic Studies. Ind. Eng. Chem. Res. 2016, 55, 6619–6633. [Google Scholar] [CrossRef]


| Substrate | Phase | Chemical Formula | Space Group | ICSD Card No. | Percentage of Phase (%) |
|---|---|---|---|---|---|
| H | Hydroxysodalite | Na8(AlSiO4)6(OH)2 | P -4 3 n | 60840 | 59 (1.30) |
| Zeolite P1 | H24Al6Na6O44Si10 | I -4 | 9550 | 21 (1.87) | |
| Mullite | Al2.272O4.864Si0.728 | Pbam | 100805 | 18 (0.80) | |
| Aluminosilicate | H3.92Al1.92Na2O12Si3.08 | I -42d | 067210 | 2 (0.12) | |
| C | Cancrinite | Na8(AlSiO4)6(CO3)(H2O)2 | P 63 | 20334 | 68 (0.92) |
| Aluminosilicate | NaAlSiO4 | P 32 | 433181 | 32 (0.72) |
| Sample | TiO2 Crystallite Size (nm) * | Eg (eV) ** | G *** | ΔH (G) *** | Relative Number of Spins (×1015) *** | SBET (m2/g) **** | Desorption Average Pore Diameter (nm) **** | Total Pore Volume (cm3/g) (×10−2) **** |
|---|---|---|---|---|---|---|---|---|
| HT-8.7 | 73.8 | 3.31 (2) | 1.999 (4) | 3.2 | 0.22 | 15 | 15 | 4 |
| HT-25 | 64.5 | 3.31 (4) | 2.000 (4) | 3.8 | 1.33 | 10 | 12 | 2 |
| HT-33.25 | 76.6 | 3.84 (2) | 1.998 (7) | 3.9 | 1.06 | 10 | 14 | 3 |
| HT-41.3 | 88.6 | 3.84 (2) | 1.999 (8) | 8.7 | 0.40 | 16 | 8 | 3 |
| HT-49.45 | 42.3 | 2.85 (1) | 1.998 (5) | 7.8 | 1.55 | 13 | 8 | 3 |
| H | -- | -- | -- | -- | -- | 11 | 24 | 4 |
| TiO2 | 46.8 | 2.99 (2) | 2.000 (4) | 8.3 | 2.43 | 28 | 4 | 3 |
| CT-8.7 | 48.1 | 3.50 (3) | -- | -- | -- | 6 | 24 | 2 |
| CT-25 | 53.5 | 3.64 (2) | 1.999 (3) | 8.3 | 0.27 | 8 | 13 | 2 |
| CT-33.25 | 74.1 | 3.92 (7) | 2.000 (6) | 8.3 | 0.26 | 8 | 12 | 2 |
| CT-41.3 | 31.5 | 3.44 (7) | 1.999 (4) | 8.3 | 0.06 | 9 | 15 | 2 |
| CT-49.45 | 33.6 | 3.68 (3) | 1.999 (4) | 7.8 | 0.04 | 7 | 12 | 2 |
| C | -- | -- | -- | -- | -- | 6 | 25 | 2 |
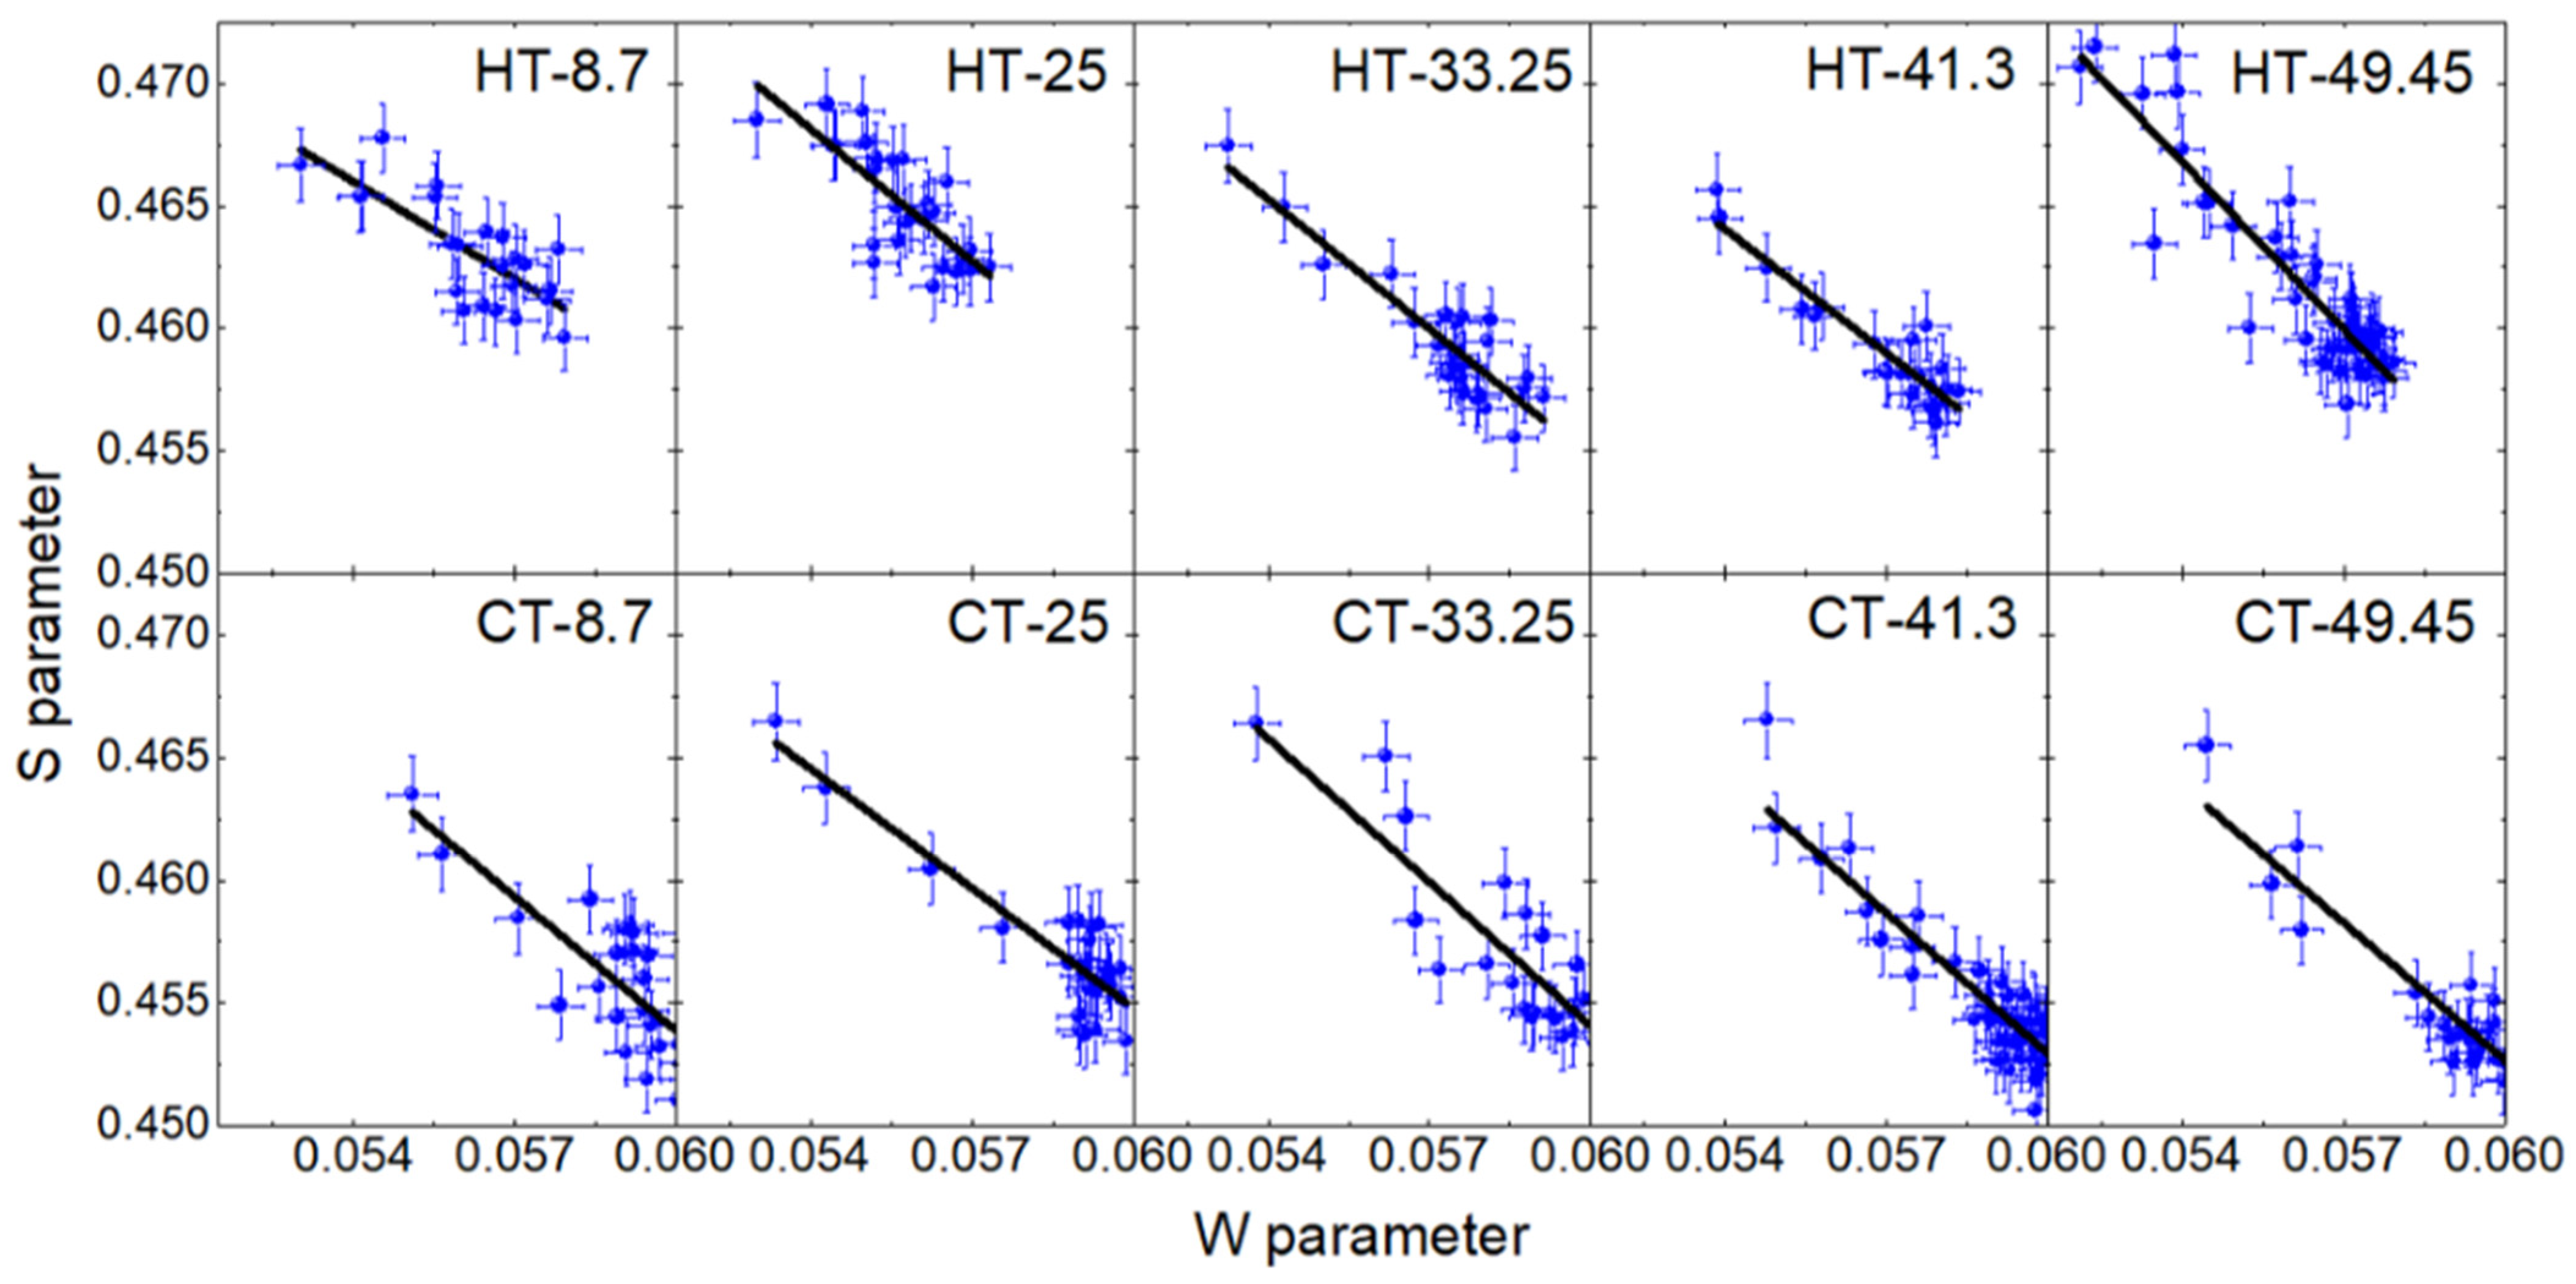
| Sample | Slope | <S> | Sample | Slope | <S> |
|---|---|---|---|---|---|
| HT-8.7 | −1.32 (24) | 0.46219 (140) | CT-8.7 | −1.81 (33) | 0.45419 (137) |
| HT-25 | −1.79 (30) | 0.46434 (137) | CT-25 | −1.62 (18) | 0.45558 (137) |
| HT-33.25 | −1.76 (18) | 0.45775 (138) | CT-33.25 | −1.95 (23) | 0.45445 (136) |
| HT-41.3 | −1.68 (14) | 0.45756 (137) | CT-41.3 | −1.90 (12) | 0.45321 (136) |
| HT-49.45 | −2.27 (14) | 0.45917 (137) | CT-49.45 | −1.86 (16) | 0.45324 (136) |
| H | −1.88 (14) | 0.46975 (138) | C | −2.24 (13) | 0.46679 (139) |
| TiO2 Loaded over H Substrate | TiO2 Loaded over C Substrate | TiO2 (wt%) |
|---|---|---|
| HT-8.7 | CT-8.7 | 8.70 |
| HT-25 | CT-25 | 25.00 |
| HT-33.25 | CT-33.25 | 33.25 |
| HT-41.3 | CT-41.3 | 41.30 |
| HT-49.45 | CT-49.45 | 49.45 |
Publisher’s Note: MDPI stays neutral with regard to jurisdictional claims in published maps and institutional affiliations. |
© 2022 by the authors. Licensee MDPI, Basel, Switzerland. This article is an open access article distributed under the terms and conditions of the Creative Commons Attribution (CC BY) license (https://creativecommons.org/licenses/by/4.0/).
Share and Cite
Supelano García, I.; Palacio Gómez, C.A.; Weber, M.H.; Saavedra Gaona, I.M.; Castañeda Martínez, C.P.; Martínez Zambrano, J.J.; Rojas Sarmiento, H.A.; Munevar Cagigas, J.A.; Avila, M.A.; Rettori, C.; et al. Physicochemical Properties of Ti3+ Self-Doped TiO2 Loaded on Recycled Fly-Ash Based Zeolites for Degradation of Methyl Orange. Condens. Matter 2022, 7, 69. https://doi.org/10.3390/condmat7040069
Supelano García I, Palacio Gómez CA, Weber MH, Saavedra Gaona IM, Castañeda Martínez CP, Martínez Zambrano JJ, Rojas Sarmiento HA, Munevar Cagigas JA, Avila MA, Rettori C, et al. Physicochemical Properties of Ti3+ Self-Doped TiO2 Loaded on Recycled Fly-Ash Based Zeolites for Degradation of Methyl Orange. Condensed Matter. 2022; 7(4):69. https://doi.org/10.3390/condmat7040069
Chicago/Turabian StyleSupelano García, Iván, Carlos Andrés Palacio Gómez, Marc H. Weber, Indry Milena Saavedra Gaona, Claudia Patricia Castañeda Martínez, José Jobanny Martínez Zambrano, Hugo Alfonso Rojas Sarmiento, Julian Andrés Munevar Cagigas, Marcos A. Avila, Carlos Rettori, and et al. 2022. "Physicochemical Properties of Ti3+ Self-Doped TiO2 Loaded on Recycled Fly-Ash Based Zeolites for Degradation of Methyl Orange" Condensed Matter 7, no. 4: 69. https://doi.org/10.3390/condmat7040069