
Important Lessons on Long-Term Stability of Amino Acids in Stored Dried Blood Spots

 , , , and
Abstract
:1. Introduction
2. Materials and Methods
2.1. Study Design
2.2. Ethical Statement
2.3. DBS Amino Acid Analysis
2.4. Statistical Analysis
2.5. CLIR Search Strategy
3. Results
3.1. Validation
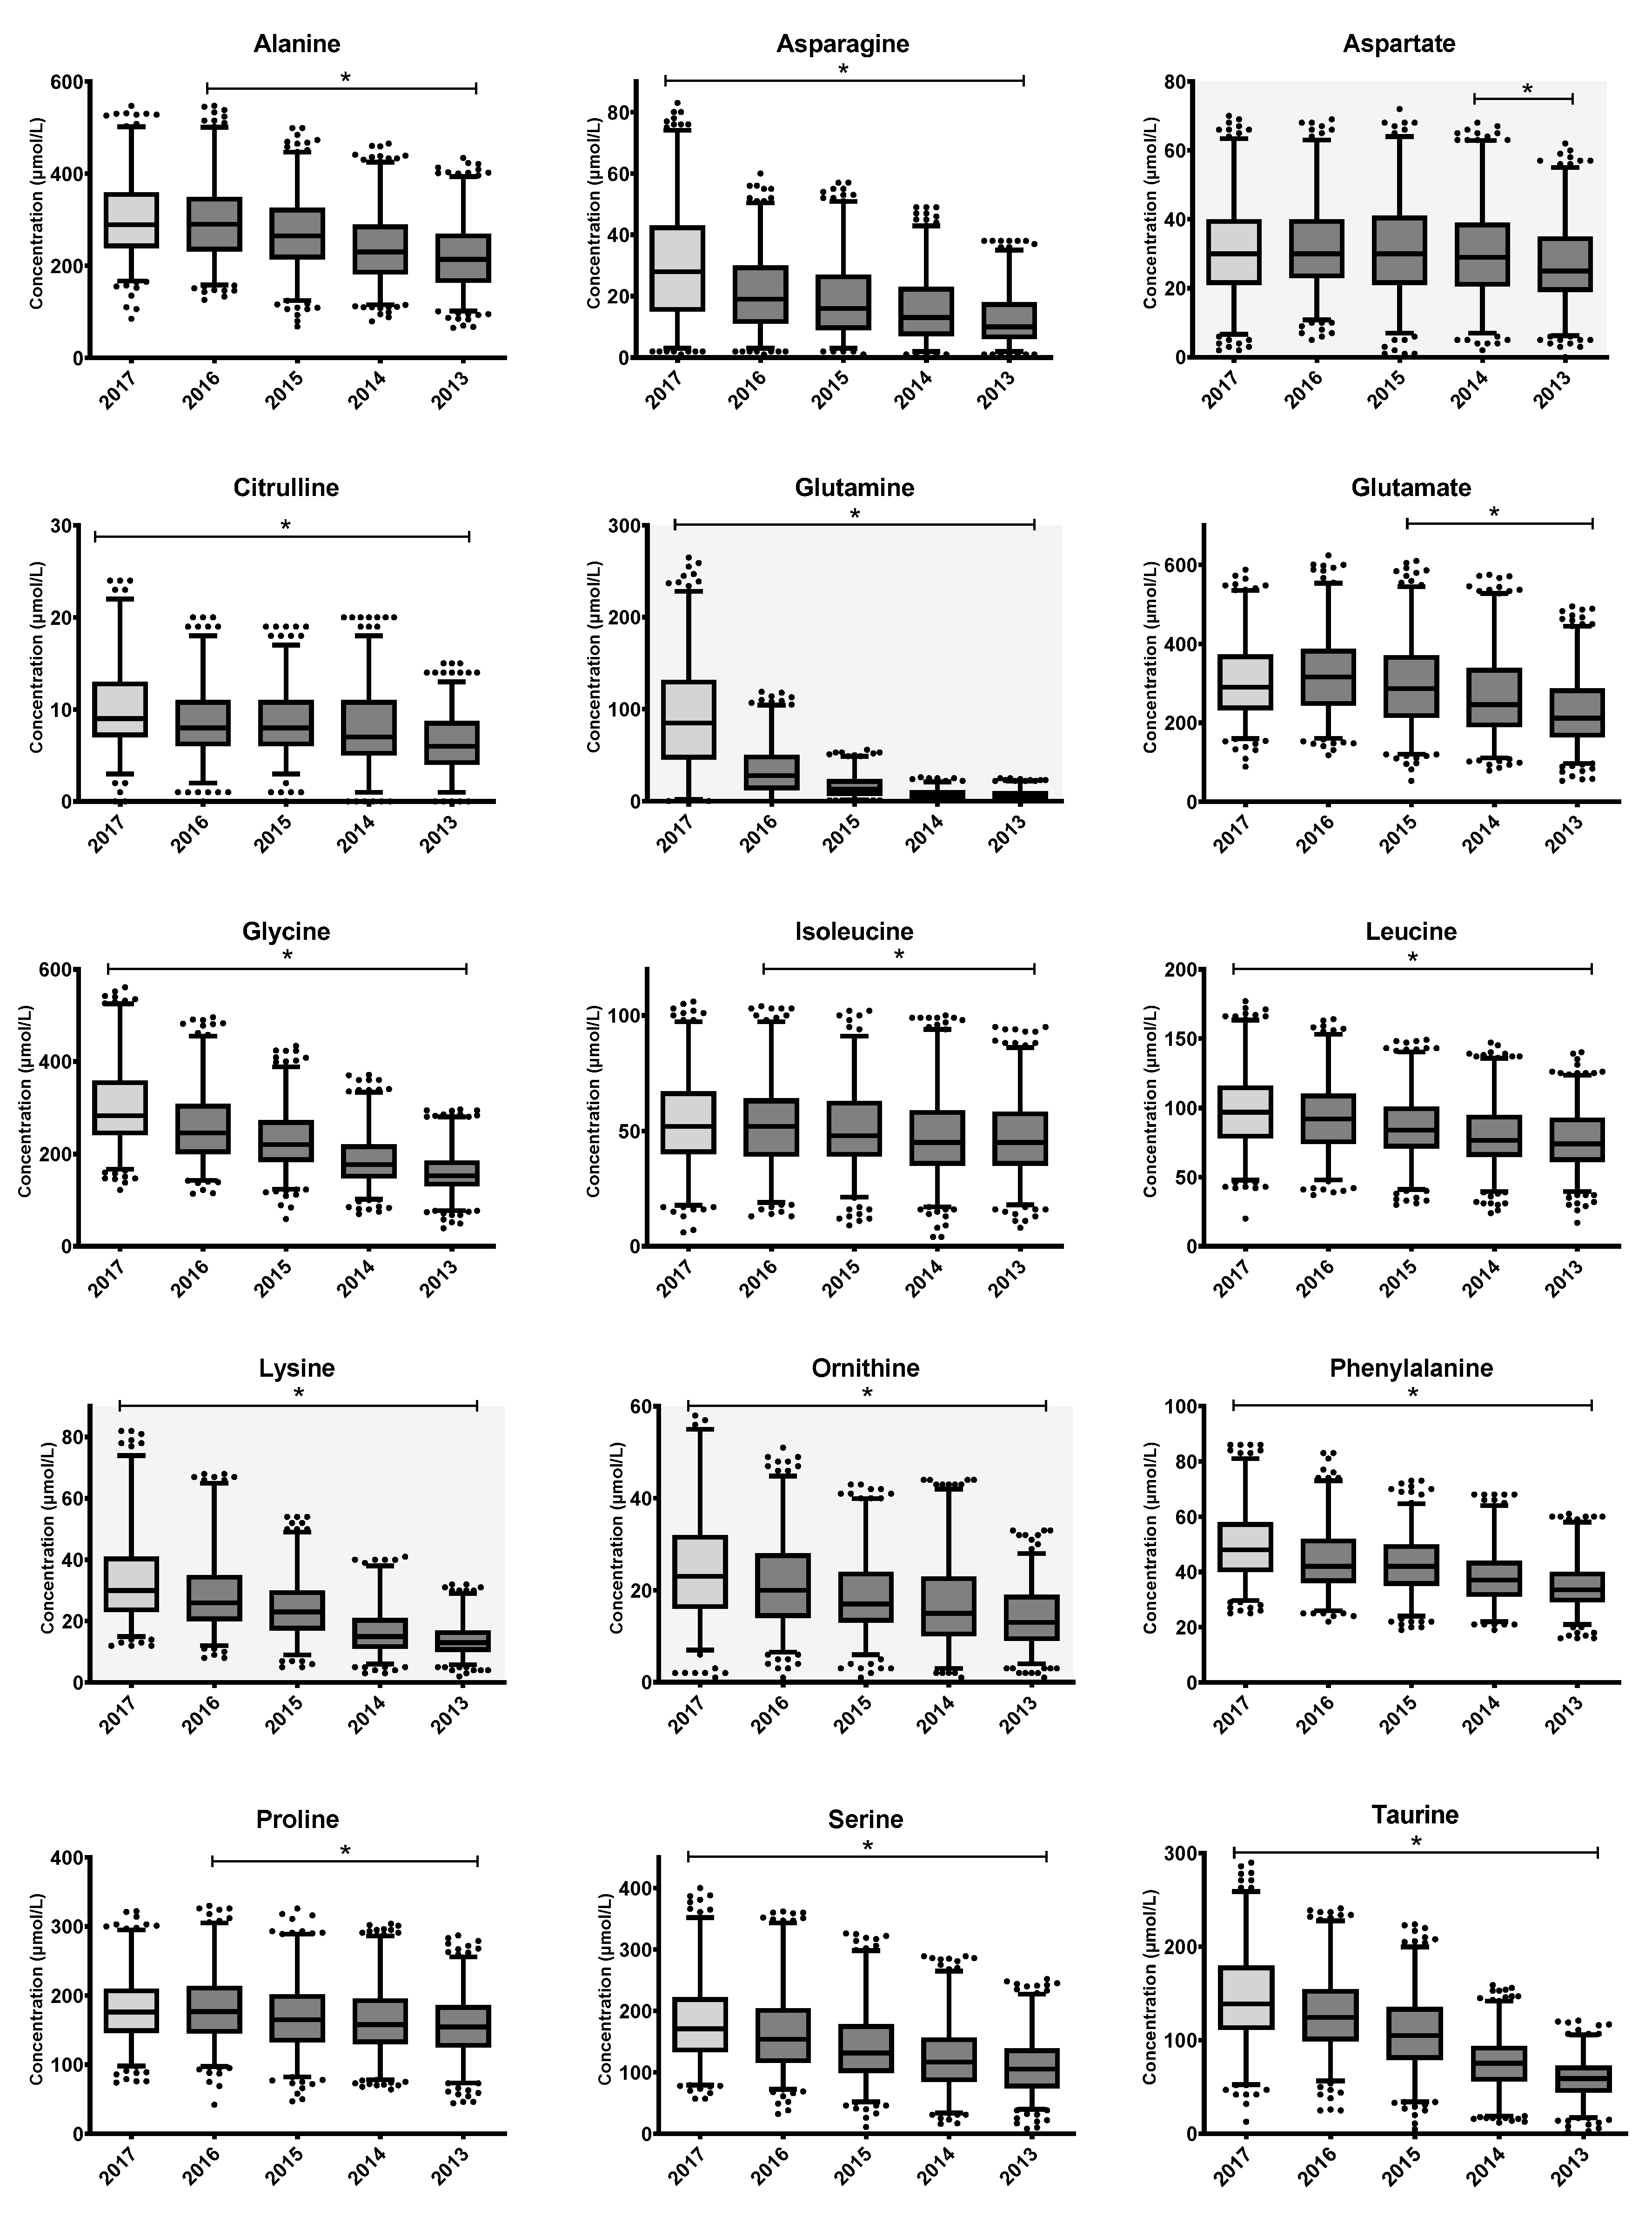
3.2. AA Stability
3.3. AA Ratio Stability
3.4. The Impact of AA Instability on Retrospective Investigations
4. Discussion
5. Conclusions
Supplementary Materials
Author Contributions
Funding
Institutional Review Board Statement
Informed Consent Statement
Data Availability Statement
Acknowledgments
Conflicts of Interest
References
- Demirev, P.A. Dried Blood Spots: Analysis and Applications. Anal. Chem. 2013, 85, 779–789. [Google Scholar] [CrossRef] [PubMed]
- Moat, S.J.; George, R.S.; Carling, R.S. Use of Dried Blood Spot Specimens to Monitor Patients with Inherited Metabolic Disorders. Int. J. Neonatal. Screen 2020, 6, 26. [Google Scholar] [CrossRef] [PubMed] [Green Version]
- McHugh, D.M.S.; Cameron, C.A.; Abdenur, J.E.; Abdulrahman, M.; Adair, O.; Al Nuaimi, S.A.; Åhlman, H.; Allen, J.J.; Antonozzi, I.; Archer, S.; et al. Clinical Validation of Cutoff Target Ranges in Newborn Screening of Metabolic Disorders by Tandem Mass Spectrometry: A Worldwide Collaborative Project. Genet. Med. 2011, 13, 230–254. [Google Scholar] [CrossRef] [PubMed]
- RIVM. Programmacommissie Neonatale Hielprikscreening. Draaiboek Hielprikscreening. Available online: https://draaiboekhielprikscreening.rivm.nl/ (accessed on 17 June 2022).
- Chace, D.H.; Kalas, T.A.; Naylor, E.W. Use of Tandem Mass Spectrometry for Multianalyte Screening of Dried Blood Specimens from Newborns. Clin. Chem. 2003, 49, 1797–1817. [Google Scholar] [CrossRef] [Green Version]
- Eshghi, A.; Pistawka, A.J.; Liu, J.; Chen, M.; Sinclair, N.J.T.; Hardie, D.B.; Elliott, M.; Chen, L.; Newman, R.; Mohammed, Y.; et al. Concentration Determination of >200 Proteins in Dried Blood Spots for Biomarker Discovery and Validation. Mol. Cell. Proteom. 2020, 19, 540–553. [Google Scholar] [CrossRef] [Green Version]
- Rothwell, E.; Johnson, E.; Riches, N.; Botkin, J.R. Secondary Research Uses of Residual Newborn Screening Dried Bloodspots: A Scoping Review. Genet. Med. 2019, 21, 1469–1475. [Google Scholar] [CrossRef] [Green Version]
- Therrell, B.L.; Padilla, C.D.; Loeber, J.G.; Kneisser, I.; Saadallah, A.; Borrajo, G.J.C.; Adams, J. Current Status of Newborn Screening Worldwide: 2015. Semin. Perinatol. 2015, 39, 171–187. [Google Scholar] [CrossRef] [Green Version]
- van Rijt, W.J.; Schielen, P.C.J.I.; Özer, Y.; Bijsterveld, K.; van der Sluijs, F.H.; Derks, T.G.J.; Heiner-Fokkema, M.R. Instability of Acylcarnitines in Stored Dried Blood Spots: The Impact on Retrospective Analysis of Biomarkers for Inborn Errors of Metabolism. Int. J. Neonatal. Screen 2020, 6, 83. [Google Scholar] [CrossRef]
- Golbahar, J.; Altayab, D.D.; Carreon, E. Short-Term Stability of Amino Acids and Acylcarnitines in the Dried Blood Spots Used to Screen Newborns for Metabolic Disorders. J. Med. Screen 2014, 21, 5–9. [Google Scholar] [CrossRef] [Green Version]
- Adam, B.W.; Hall, E.M.; Sternberg, M.; Lim, T.H.; Flores, S.R.; O’Brien, S.; Simms, D.; Li, L.X.; De Jesus, V.R.; Hannon, W.H. The Stability of Markers in Dried-Blood Spots for Recommended Newborn Screening Disorders in the United States. Clin. Biochem. 2011, 44, 1445–1450. [Google Scholar] [CrossRef] [Green Version]
- Takehana, S.; Yoshida, H.; Ozawa, S.; Yamazaki, J.; Shimbo, K.; Nakayama, A.; Mizukoshi, T.; Miyano, H. The Effects of Pre-Analysis Sample Handling on Human Plasma Amino Acid Concentrations. Clin. Chim. Acta 2016, 455, 68–74. [Google Scholar] [CrossRef]
- Pinto, J.; Domingues, M.R.M.; Galhano, E.; Pita, C.; Do Céu Almeida, M.; Carreira, I.M.; Gil, A.M. Human Plasma Stability during Handling and Storage: Impact on NMR Metabolomics. Analyst 2014, 139, 1168–1177. [Google Scholar] [CrossRef]
- Han, J.; Higgins, R.; Lim, M.D.; Lin, K.; Yang, J.; Borchers, C.H. Short-Term Stabilities of 21 Amino Acids in Dried Blood Spots. Clin. Chem. 2018, 64, 400–402. [Google Scholar] [CrossRef] [Green Version]
- Prentice, P.; Turner, C.; Wong, M.C.; Dalton, R.N. Stability of Metabolites in Dried Blood Spots Stored at Different Temperatures over a 2-Year Period. Bioanalysis 2013, 5, 1507–1514. [Google Scholar] [CrossRef]
- Murphy, M.S.Q.; Hawken, S.; Cheng, W.; Wilson, L.A.; Lamoureux, M.; Henderson, M.; Potter, B.; Little, J.; Chakraborty, P.; Wilson, K. Metabolic Profiles Derived from Residual Blood Spot Samples: A Longitudinal Analysis. Gates Open Res. 2018, 2, 28. [Google Scholar] [CrossRef] [Green Version]
- Strnadová, K.A.; Holub, M.; Mühl, A.; Heinze, G.; Ratschmann, R.; Mascher, H.; Stöckler-Ipsiroglu, S.; Waldhauser, F.; Votava, F.; Lebl, J.; et al. Long-Term Stability of Amino Acids and Acylcarnitines in Dried Blood Spots. Clin. Chem. 2007, 53, 717–722. [Google Scholar] [CrossRef] [Green Version]
- Shimada, Y.; Kawano, N.; Goto, M.; Watanabe, H.; Ihara, K. Stability of Amino Acids, Free and Acyl-Carnitine in Stored Dried Blood Spots. Pediatr. Int. 2022, 64, e15072. [Google Scholar] [CrossRef]
- Reed, A.H.; Henry, R.J.; Mason, W.B. Influence of Statistical Method Used on the Resulting Estimate of Normal Range. Clin. Chem. 1971, 17, 275–284. [Google Scholar] [CrossRef]
- Clinical and Laboratory Standards Institute (CLSI). Defining, Establishing, and Verifying Reference Intervals in the Clinical Laboratory; Approved Guideline, 3rd ed.; CLSI document EP28-A3c; Clinical and Laboratory Standards Institute: Wayne, PA, USA, 2008. [Google Scholar]
- Prinsen, H.C.M.T.; Schiebergen-Bronkhorst, B.G.M.; Roeleveld, M.W.; Jans, J.J.M.; de Sain-van der Velden, M.G.M.; Visser, G.; van Hasselt, P.M.; Verhoeven-Duif, N.M. Rapid Quantification of Underivatized Amino Acids in Plasma by Hydrophilic Interaction Liquid Chromatography (HILIC) Coupled with Tandem Mass-Spectrometry. J. Inherit. Metab. Dis. 2016, 39, 651–660. [Google Scholar] [CrossRef] [Green Version]
- Van Vliet, K.; Van Ginkel, W.G.; Van Dam, E.; De Blaauw, P.; Koehorst, M.; Kingma, H.A.; Van Spronsen, F.J.; Heiner-Fokkema, M.R. Dried Blood Spot versus Venous Blood Sampling for Phenylalanine and Tyrosine. Orphanet. J. Rare Dis. 2020, 15, 82. [Google Scholar] [CrossRef]
- Walfish, S. Review of Statistical Outlier Methods. Pharm. Technol. 2006, 30, 82. [Google Scholar]
- Hernandes, V.V.; Barbas, C.; Dudzik, D. A Review of Blood Sample Handling and Pre-Processing for Metabolomics Studies. Electrophoresis 2017, 38, 2232–2241. [Google Scholar] [CrossRef] [PubMed]
- Hannemann, J.; Roskam, T.I.; Eilermann, I.; Siques, P.; Brito, J.; Böger, R. Pre-Analytical and Clinical Validation of a Dried Blood Spot Assay for Asymmetric Dimethylarginine and L-Arginine. J. Clin. Med. 2020, 9, 1072. [Google Scholar] [CrossRef] [PubMed] [Green Version]
- van Eijk, H.M.H.; Dejong, C.H.C.; Deutz, N.E.P.; Soeters, P.B. Influence of Storage Conditions on Normal Plasma Amino-Acid Concentrations. Clin. Nutr. 1994, 13, 374–380. [Google Scholar] [CrossRef] [PubMed]
- Khan, K.; Hardyt, G.; Mcelroy, B.; Elia, M. The Stability of L-Glutamine in Total Parenteral Nutrition Solutions. Clin. Nutr 1991, 10, 193–198. [Google Scholar] [CrossRef]
- Krhin, B.; Bicek, A.; Oblak, A.; Battelino, T.; Groselj, U. Optimizing the Phenylalanine Cut-Off Value in a Newborn Screening Program. Genes 2022, 13, 517. [Google Scholar]
- Michopoulos, F.; Theodoridis, G.; Smith, C.J.; Wilson, I.D. Metabolite Profiles from Dried Blood Spots for Metabonomic Studies Using UPLC Combined with Orthogonal Acceleration ToF-MS: Effects of Different Papers and Sample Storage Stability. Bioanalysis 2011, 3, 2757–2767. [Google Scholar] [CrossRef]
- Chace, D.H.; Diperna, J.C.; Mitchell, B.L.; Sgroi, B.; Hofman, L.F.; Naylor, E.W. Electrospray Tandem Mass Spectrometry for Analysis of Acylcarnitines in Dried Postmortem Blood Specimens Collected at Autopsy from Infants with Unexplained Cause of Death Methylbutyryl-CoA Dehydrogenase Deficiencies (4 Cas-Es), and Long-Chain Hydroxyacyl-CoA Dehydrogenase/Trifunctional Protein Deficiencies (4 Cases). Conclusions: Postmortem Metabolic Screening Can Ex-Plain Deaths in Infants and Children and Provide Esti-Mates of the Number of Infant Deaths Attributable To. Clin. Chem. 2001, 47, 1166–1182. [Google Scholar]
- Johnson, D.W. Stability of Malonylcarnitine and Glutarylcarnitine in Stored Blood Spots. J. Inherit. Metab. Dis. 2004, 27, 789–790. [Google Scholar] [CrossRef]
- Fingerhut, R.; Ensenauer, R.; Röschinger, W.; Arnecke, R.; Olgemöller, B.; Roscher, A.A. Stability of Acylcarnitines and Free Carnitine in Dried Blood Samples: Implications for Retrospective Diagnosis of Inborn Errors of Metabolism and Neonatal Screening for Carnitine Transporter Deficiency. Anal. Chem. 2009, 81, 3571–3575. [Google Scholar] [CrossRef]


| Group | 2013 | 2014 | 2015 | 2016 | 2017 | 2018 | 2019 | 2020 | Storage Times (yrs) | |||
|---|---|---|---|---|---|---|---|---|---|---|---|---|
| 2013 | Collection and storage at +4 °C | Transport to UMCG + storage at −20 °C | AA measurements | 4.75–5.75 | ||||||||
| 2014 | Collection and storage at +4 °C | Storage at room temperature | 3.75–4.75 | |||||||||
| 2015 | Collection and storage at +4 °C | 2.75–3.75 | ||||||||||
| 2016 | Collection and storage at +4 °C | 1.75–2.75 | ||||||||||
| 2017 | Collection and storage at +4 °C | 0.75–1.75 | ||||||||||
| Amino Acid | Model of Decay | Mean Annual Decay | |
|---|---|---|---|
| Absolute decay (µM) | Percentile decay (%) | ||
| Alanine | Stable between 2017–2016. Linear decay from 2016–2013 | 22 (14–30) | 7 (5–10) |
| Arginine | Cannot be interpreted | - | - |
| Asparagine | Linear decay | 4 (2–6) | 13 (7–20) |
| Aspartate | Stable between 2017–2014. Linear decay from 2014–2013 | 1 (0–2) | 3 (0–6) |
| Citrulline | Linear decay | 1 (0.3–1.4) | 8 (3–14) |
| Glutamine | Exponential decay | 2017–2016: 63% 2017–2015: 82% 2017–2014: 91% 2017–2013 92% | |
| Glutamate | Non-significant increase 2017–2016 (5%). Linear decay from 2016–2013 | 30 (20–40) | 9 (6–12) |
| Glycine | Linear decay | 36 (31–41) | 12 (10–13) |
| Histidine | Cannot be interpreted | - | - |
| Isoleucine | Stable between 2017–2016. Linear decay from 2016–2013 | 2 (1.2–2.5) | 4 (2–5) |
| Leucine | Linear decay | 6 (5–7) | 6 (5–7) |
| Lysine | Linear decay | 5 (4–6) | 15 (12–19) |
| Methionine | Cannot be interpreted | - | - |
| Ornithine | Linear decay | 3 (2–3) | 10 (8–13) |
| Phenylalanine | Linear decay | 4 (3–4) | 7 (6–8) |
| Proline | Stable between 2017–2016. Linear decay from 2016–2013 | 7 (3–10) | 4 (2–6) |
| Serine | Linear decay | 18 (15–21) | 10 (8–12) |
| Taurine | Linear decay | 23 (18–27) | 15 (12–19) |
| Threonine | Linear decay | 9 (8–10) | 8 (7–9) |
| Tryptophan | Linear decay | 4 (3–5) | 25 (18–32) |
| Tyrosine | Stable between 2017–2016. Linear decay from 2016–2013 | 4 (2–6) | 6 (3–9) |
| Valine | Linear decay | 7 (5–10) | 5 (3–6) |
| Effect of Individual AA on Retrospective Assessment | Assessment of Parameters/Disorders | Effect of AA Disease Ratios on Retrospective Assessment | |||||
|---|---|---|---|---|---|---|---|
| Parameter * | Disorder | Retrospective Analysis of IMDs | RCVa | Annual Percentile Decay | RCVa Reached | Metabolite Ratio | Retrospective Analysis of IMDs |
| Risk Category | (%) | (%) | (years) | Risk Category | |||
| Arg | ARG | False-negative | 56.5 | - *** | - *** | Arg/Orn, Arg/Phe, Arg/Ala | Cannot be interpreted |
| Cit/Arg (low) | Cannot be interpreted | ||||||
| Cit (low) | OTC/CPS | False-positive | 31.9 | 8 | 4.0 | No informative AA disease ratios | - |
| NAGS, OAT | False-positive | 31.9 | 8 | 4.0 | No informative AA disease ratios | - | |
| Cit | CIT-I | False-negative | 31.9 | 8 | 4.0 | Cit/Phe | none |
| Cit/Arg, Met/Cit (low) | - | ||||||
| (Low): Ala/Cit, Glu/Cit, Orn/Cit | none | ||||||
| Pro/Cit (low) | False-negative | ||||||
| Gln/Cit (low) | False-positive | ||||||
| CIT-II | False-negative | 31.9 | 8 | 4.0 | Cit/Phe | none | |
| Pro/Cit (low) | False-negative | ||||||
| Gln/Cit (low) | False-positive | ||||||
| PC | False-negative | 31.9 | 8 | 4.0 | Cit/Phe | none | |
| Met/Cit (low) | - | ||||||
| (low): Ala/Cit, Glu/Cit, Orn/Cit | none | ||||||
| Pro/Cit (low) | False-negative | ||||||
| ASA | False-negative | 31.9 | 8 | 4.0 | (low): Cit/Phe, Ala/Cit | none | |
| Pro/Cit (low) | False-negative | ||||||
| Orn/Cit (low) | False-positive | ||||||
| Met/Cit (low) | - | ||||||
| Gln (low) | CIT-II | False-positive | 53.7 | Exponential decay (Table 2) | <1 | See CIT – CIT-II | |
| Glu (low) | PC | False-positive | 21.6 | 9 | 2.4 | See CIT-PC | |
| Gly (low) | 3PGDH | False-positive | 23.0 | 12 | 2.2 | Ala/(Ser + Gly) | False-positive |
| Gly | NKHG | False-negative | 23.0 | 12 | 2.2 | No informative AA disease ratios | |
| Xle ** | MSUD | False negative | 19.11 | 6 | 3.2 | Val/Phe, Xle/Phe, Xle/Ala, Xle/Tyr | False-positive |
| Met/Xle (low) | - | ||||||
| (Ile + Leu + Val)/(Phe + Tyr) | False-positive | ||||||
| Gly/(Ile + Leu + Val) | False-negative | ||||||
| Xle (low) | BCKDK | False-positive | 19.11 | 6 | 3.2 | (low): Val/Phe, Xle/Phe, Xle/Ala, (Xle + Val)/(Phe + Tyr) | False-negative |
| Met (low) | RMD | False-positive | 18.6 | - *** | - *** | Met/Phe (low) | Cannot be interpreted |
| Met | HCY | False negative | 18.6 | - *** | - *** | Met/Ala, Met/Xle, Met/Phe, Met/Cit, Met/Val, Met/Gly, Met/Pro | Cannot be interpreted |
| H-MET | 18.6 | - *** | - *** | Met/Ala, Met/Phe, Met/Cit, Met/Val, Met/Gly, Met/Tyr, Met/Pro, Met/Xle | Cannot be interpreted | ||
| Orn (low) | SSADH | False-positive | 55.1 | 10 | >5 | No informative AA disease ratios | |
| Phe | PKU, H-PHE, BIOPT (BS/Reg) | False-negative | 20.8 | 7 | 3.0 | Phe/Tyr, Cit/Phe (low) | none |
| (low): Val/Phe, Xle/Phe, (Ile + Leu + Val)/(Phe + Tyr) (PKU) | False-negative | ||||||
| (low): Met/Phe, Arg/Phe | - | ||||||
| Orn/Phe (low) | False-positive | ||||||
| Pro | H-PRO | False-negative | 15.8 | 4 | 4.0 | Pro/Cit | False-positive |
| Orn/Pro (low) | False-positive | ||||||
| Tyr | TTI, TTII, TTIII | False-negative | 15.8 | 6 | 2.6 | Tyr/Pro (TT2) | False-negative |
| Phe/Tyr, Xle/Tyr (low) | none | ||||||
| Met/Tyr (low) | - | ||||||
| (Ile + Leu + Val)/(Phe + Tyr) (low) | False-negative | ||||||
| Val | MSUD | False-negative | 19.11 | 5 | 3.8 | See Xle | |
| Val (low) | BCKDK | False-positive | 19.11 | 5 | 3.8 | See Xle (low) | |
Disclaimer/Publisher’s Note: The statements, opinions and data contained in all publications are solely those of the individual author(s) and contributor(s) and not of MDPI and/or the editor(s). MDPI and/or the editor(s) disclaim responsibility for any injury to people or property resulting from any ideas, methods, instructions or products referred to in the content. |
© 2023 by the authors. Licensee MDPI, Basel, Switzerland. This article is an open access article distributed under the terms and conditions of the Creative Commons Attribution (CC BY) license (https://creativecommons.org/licenses/by/4.0/).
Share and Cite
Dijkstra, A.M.; de Blaauw, P.; van Rijt, W.J.; Renting, H.; Maatman, R.G.H.J.; van Spronsen, F.J.; Maase, R.E.; Schielen, P.C.J.I.; Derks, T.G.J.; Heiner-Fokkema, M.R. Important Lessons on Long-Term Stability of Amino Acids in Stored Dried Blood Spots. Int. J. Neonatal Screen. 2023, 9, 34. https://doi.org/10.3390/ijns9030034
Dijkstra AM, de Blaauw P, van Rijt WJ, Renting H, Maatman RGHJ, van Spronsen FJ, Maase RE, Schielen PCJI, Derks TGJ, Heiner-Fokkema MR. Important Lessons on Long-Term Stability of Amino Acids in Stored Dried Blood Spots. International Journal of Neonatal Screening. 2023; 9(3):34. https://doi.org/10.3390/ijns9030034
Chicago/Turabian StyleDijkstra, Allysa M., Pim de Blaauw, Willemijn J. van Rijt, Hanneke Renting, Ronald G. H. J. Maatman, Francjan J. van Spronsen, Rose E. Maase, Peter C. J. I. Schielen, Terry G. J. Derks, and M. Rebecca Heiner-Fokkema. 2023. "Important Lessons on Long-Term Stability of Amino Acids in Stored Dried Blood Spots" International Journal of Neonatal Screening 9, no. 3: 34. https://doi.org/10.3390/ijns9030034