Review

A Review of Computer-Aided Breast Cancer Diagnosis Using Sequential Mammograms

by
Kosmia Loizidou
1,*,
Galateia Skouroumouni
2,
Christos Nikolaou
3 and
Costas Pitris
1
1
KIOS Research and Innovation Center of Excellence, Department of Electrical and Computer Engineering, University of Cyprus, Nicosia 2109, Cyprus
2
Radiology Department, German Oncology Center, Limassol 4108, Cyprus
3
Radiology Department, Limassol General Hospital, Limassol 3304, Cyprus
*
Author to whom correspondence should be addressed.
Tomography 2022, 8(6), 2874-2892; https://doi.org/10.3390/tomography8060241
Submission received: 1 November 2022 / Revised: 18 November 2022 / Accepted: 2 December 2022 / Published: 6 December 2022
(This article belongs to the Special Issue Artificial Intelligence in Breast Cancer Screening)

Abstract

:
Radiologists assess the results of mammography, the key screening tool for the detection of breast cancer, to determine the presence of malignancy. They, routinely, compare recent and prior mammographic views to identify changes between the screenings. In case a new lesion appears in a mammogram, or a region is changing rapidly, it is more likely to be suspicious, compared to a lesion that remains unchanged and it is usually benign. However, visual evaluation of mammograms is challenging even for expert radiologists. For this reason, various Computer-Aided Diagnosis (CAD) algorithms are being developed to assist in the diagnosis of abnormal breast findings using mammograms. Most of the current CAD systems do so using only the most recent mammogram. This paper provides a review of the development of methods to emulate the radiological approach and perform automatic segmentation and/or classification of breast abnormalities using sequential mammogram pairs. It begins with demonstrating the importance of utilizing prior views in mammography, through the review of studies where the performance of expert and less-trained radiologists was compared. Following, image registration techniques and their application to mammography are presented. Subsequently, studies that implemented temporal analysis or subtraction of temporally sequential mammograms are summarized. Finally, a description of the open access mammography datasets is provided. This comprehensive review can serve as a thorough introduction to the use of prior information in breast cancer CAD systems but also provides indicative directions to guide future applications.

1. Introduction

Cancer, even after decades of research, remains a significant cause of morbidity and mortality worldwide. According to the World Health Organization (WHO) and the International Agency for Research on Cancer, there will be approximately 25 million new cancer cases and 13 million new cancer deaths by 2030. Breast cancer accounts for 11% of those cases (∼1 in 10 of all new cancer cases worldwide) and 24% of all female cancers. While the incidence rate of breast cancer is constantly increasing by 0.5% every year, the mortality has dropped by approximately 40% since the 1980s, due to the introduction of mammographic screening [1].
Mammography, performed using low-energy X-rays, is currently the state-of-the-art method for breast cancer screening [2]. Two standard views of the breast are taken during mammography: the cranio-caudal (CC) view, taken from the top down; and the medio-lateral oblique (MLO) view, taken from the side and at an angle [3]. After the mammograms are acquired, the breast density is determined by measuring the ratio of non-dense (radiolucent) to dense (radiopaque) tissue. According to the Breast Imaging Reporting and Data System (BI-RADS) there are four density levels: (a) almost entirely fatty; (b) scattered areas of fibroglandular density; (c) heterogeneously dense, which may obscure small masses; and (d) extremely dense (Figure 1). The sensitivity of mammography decreases by increasing BI-RADS breast density. Thus, the denser the breast, the harder it is to assess the images, resulting in an increased risk of breast cancer remaining undetected [4].
Various abnormalities can be identified in a mammogram, including asymmetries between the breasts, distortion of the normal architecture, and appearance of micro-calcifications (MCs) and masses [4]. These abnormalities can be divided into two major categories depending on their severity, i.e., benign or malignant. Benign lesions are usually harmless and do not require follow-up with biopsy. However, under circumstances not well understood, they can spread to the surrounding tissues or harm nearby vital structures. Conversely, malignant abnormalities are dangerous, unstable, and require immediate follow-up, since they are associated with a very high probability of breast cancer [5]. MCs, which are small calcium deposits, are a common mammographic finding, and they typically appear as bright spots due to the high X-ray attenuation coefficient of calcium [6]. Most MCs are benign and do not require further assessment. Benign MCs are usually larger in size, with rounder and homogeneous shapes, and fewer in number. However, micro-calcification clusters (MCCs) are associated with precancerous cells or early breast cancer. Other characteristics of malignant MCCs include irregular shapes and sizes. A breast mass can be a localized swelling, protuberance, or lump, appearing as a dense region in the mammogram. Masses can be radiologically classified as benign or suspicious, depending on various parameters such as size, shape, and texture [7,8]. Benign masses are rounder, with well-defined boundaries compared to suspicious masses which have spiculated, rough and blurry boundaries [6]. When a suspicious mass is identified, its severity is confirmed by biopsy [9].
After the mammographic images are collected, two expert radiologists, along with a third if consensus is not reached, assess the images to determine whether there are any indications of malignancy. Radiologists assign one of seven assessment categories to each mammographic study: 0, needs additional imaging evaluation and/or prior mammograms for comparison; 1, negative; 2, benign; 3, probably benign; 4, suspicious for malignancy (4A, low; 4B, moderate; and 4C, high suspicion for malignancy); 5, highly suggestive of malignancy; and 6, known biopsy-proven malignancy [10]. However, since the clinicians identify signs of malignancy by visually inspecting the mammograms, misclassifications and false-positive diagnoses are inevitable. Normal breast perturbations or benign lesions, can be falsely identified as breast cancer since they can, occasionally, mimic malignant abnormalities [11]. In addition, breast masses exhibit wide variations in size, shape, and contrast and they are usually surrounded and/or enclosed by other structures, such as muscle, blood vessels, and normal breast tissue [8]. Moreover, malignant abnormalities can be missed by the radiologists due to subtle features that are difficult to perceive or due to the high density of the normal breast tissue, which reduces the visibility of the mass [12]. Studies in the literature show that the error rate in the detection of malignant masses by radiologists is approximately 10% to 30% [2].
To overcome some of the challenges in the assessment of mammography, computer-aided diagnosis (CAD) systems are being developed for the automated detection of breast abnormalities [7]. The goal of these systems is the automatic identification of subtle anomalies that might otherwise be missed by radiologists [13]. However, this task is very challenging since some abnormalities can be small (0.1–1 mm) and have various shapes and distributions, as well as low contrast, compared to normal breast tissue. Another critical challenge is the classification of breast abnormalities as benign or malignant, which often leads to a significant number of false positives (FPs) and limits the clinical applicability of CAD systems [14].
Automated diagnosis of breast cancer, based on only the most recent mammogram of a patient, usually follows three basic steps: pre-processing (using various filtering techniques); detection of the abnormality (including accurate segmentation); and classification of the detected region as normal, benign, suspicious, or malignant, depending on the study. The highest accuracy in the detection of masses with feature-based machine learning (ML) was 99.5%, achieved by Mohanty et al. who used 1500 digitized images to prove the effectiveness of their algorithm [15]. With deep learning (DL), Al-masni et al. reached 99.7% accuracy, using 600 digitized images and a convolutional neural network (CNN), but cross-validating their results only per image and not per patient [16]. Al-antari et al. achieved 97.5% accuracy in the classification of benign and malignant breast masses, using 600 digitized images, and cross-validation per patient, which is more applicable to real-world applications [17]. Despite their high accuracy, these systems are still far from clinical application. There are many reasons that can explain this paradox. These studies have been performed on different datasets, using different processing, machine learning, and validation schemes. This makes it particularly challenging to compare the studies but also to combine their results to obtain a universally applicable clinical system. Most of the open-access datasets contain outdated images, limited ground-truth annotations (i.e., bounding boxes), or they are not completely open access, requiring approval to access. Thus, various fragmented datasets with different properties and imbalanced classes are used. Furthermore, the unexplainable results of most ML models deters most clinicians from actively including such systems in their practice.
To improve their effectiveness, radiologists routinely compare the recent and prior mammograms of a patient to more effectively identify changes between screenings. Newly developed abnormalities, or regions rapidly changing between screenings, are more likely to be suspicious, compared to regions that remain unchanged and they are usually benign [18]. Prior information, when available, can provide useful insights to the clinicians, which allows them to identify possible signs of malignancy earlier and with more confidence [19]. Thus, it is reasonable to assume that the next generation of CAD systems, which can consider both the prior and recent mammograms of a patient, would lead to more accurate diagnoses.
This paper reviews the literature on the automated segmentation and/or classification of breast abnormalities from sequential mammograms, using feature-based ML and DL techniques. The first part is devoted to the importance of including prior views in the interpretation of mammography, with studies that compare the performance of radiologists with and without the use of prior mammographic images. Following, image registration techniques, which are of critical importance in the comparison of sequential mammograms, are summarized. The following section is devoted to temporal analysis of sequential mammograms for the diagnosis of breast MCs and masses. Subsequently, the implementation of detection and classification of breast abnormalities using the subtraction of temporally sequential mammograms is described. Finally, a description of the open access mammography datasets is provided. This review concludes with an overall discussion.

2. Review Methodology

The bibliographic literature was thoroughly searched to identify all the relevant studies. This search was limited to articles published between 2000 and 2022, written in English. Articles that included sequential data from screening methods other than mammography were excluded. Articles were also excluded if any important information regarding the algorithm’s performance was missing, making the study nonreproducible. Several review articles related to the diagnosis of breast cancer using mammograms appear in the literature [2,6,7,20,21,22,23]. However, unlike this review, none of these articles is devoted to the analysis of sequential mammograms for the detection and classification of breast cancer.
After the selection process was completed, the articles were split into two major groups, based on the approach that was used to exploit the sequential information: (a) temporal analysis, which uses both the current and prior images to extract relevant features and, then, combines them, and (b) temporal subtraction, where the prior image is subtracted from the recent one before further analysis. Subsequently, the articles in each group were further divided into two subcategories based on the breast abnormality under investigation: (a) MCs or (b) masses. Finally, each subcategory was further divided according to the classification approach: (a) not employing ML, (b) feature-based ML, or (c) DL.
Overall, there is no straightforward way to directly compare all the studies or to definitely conclude which is the most successful algorithm. The main reason is that each study is using different datasets, processing techniques, validation methods, evaluation metrics, etc. Thus, all their methodological differences must be considered when comparing results. In this review, the area under the receiver operating characteristic curve (AUC) is often used as a metric of performance to compare the various algorithms. The AUC shows the efficacy of the classification model in separating the classes; thus, the higher the AUC, the more successful the model.

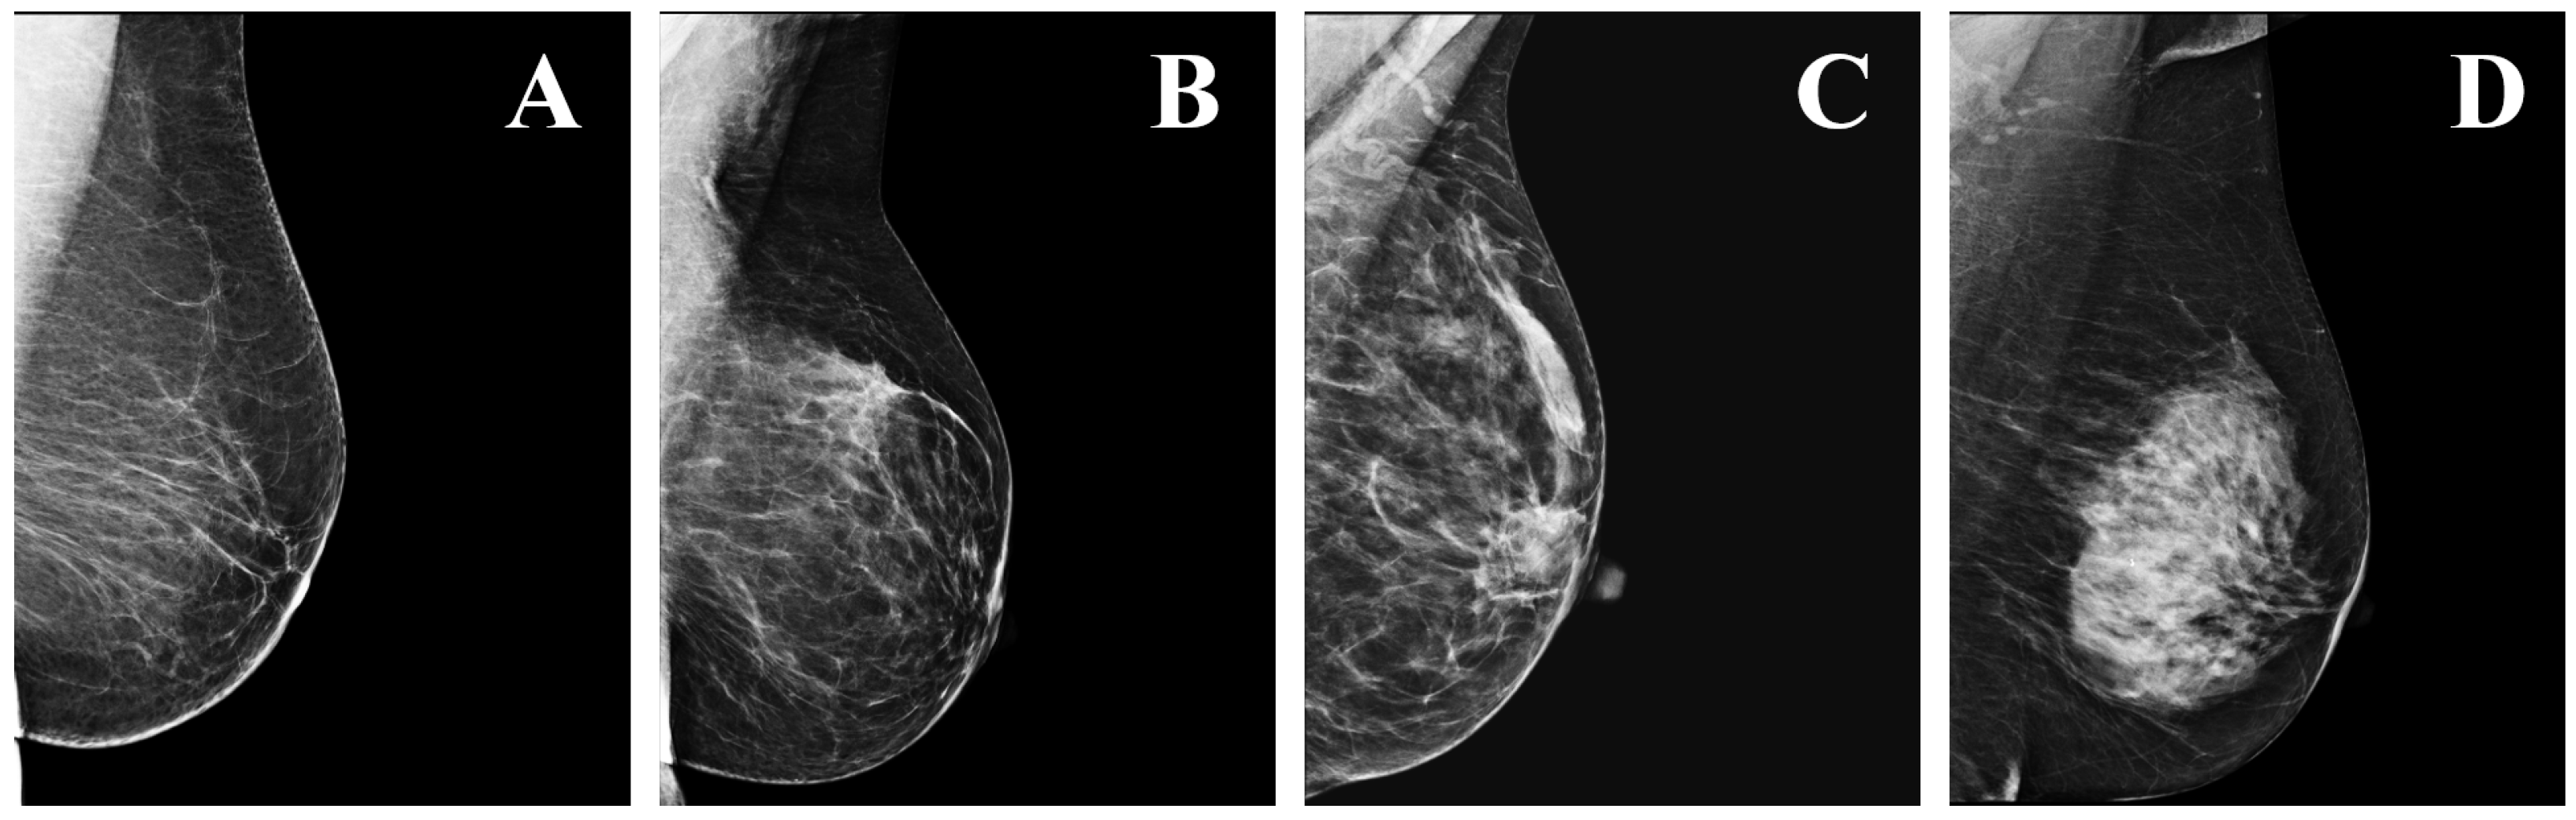
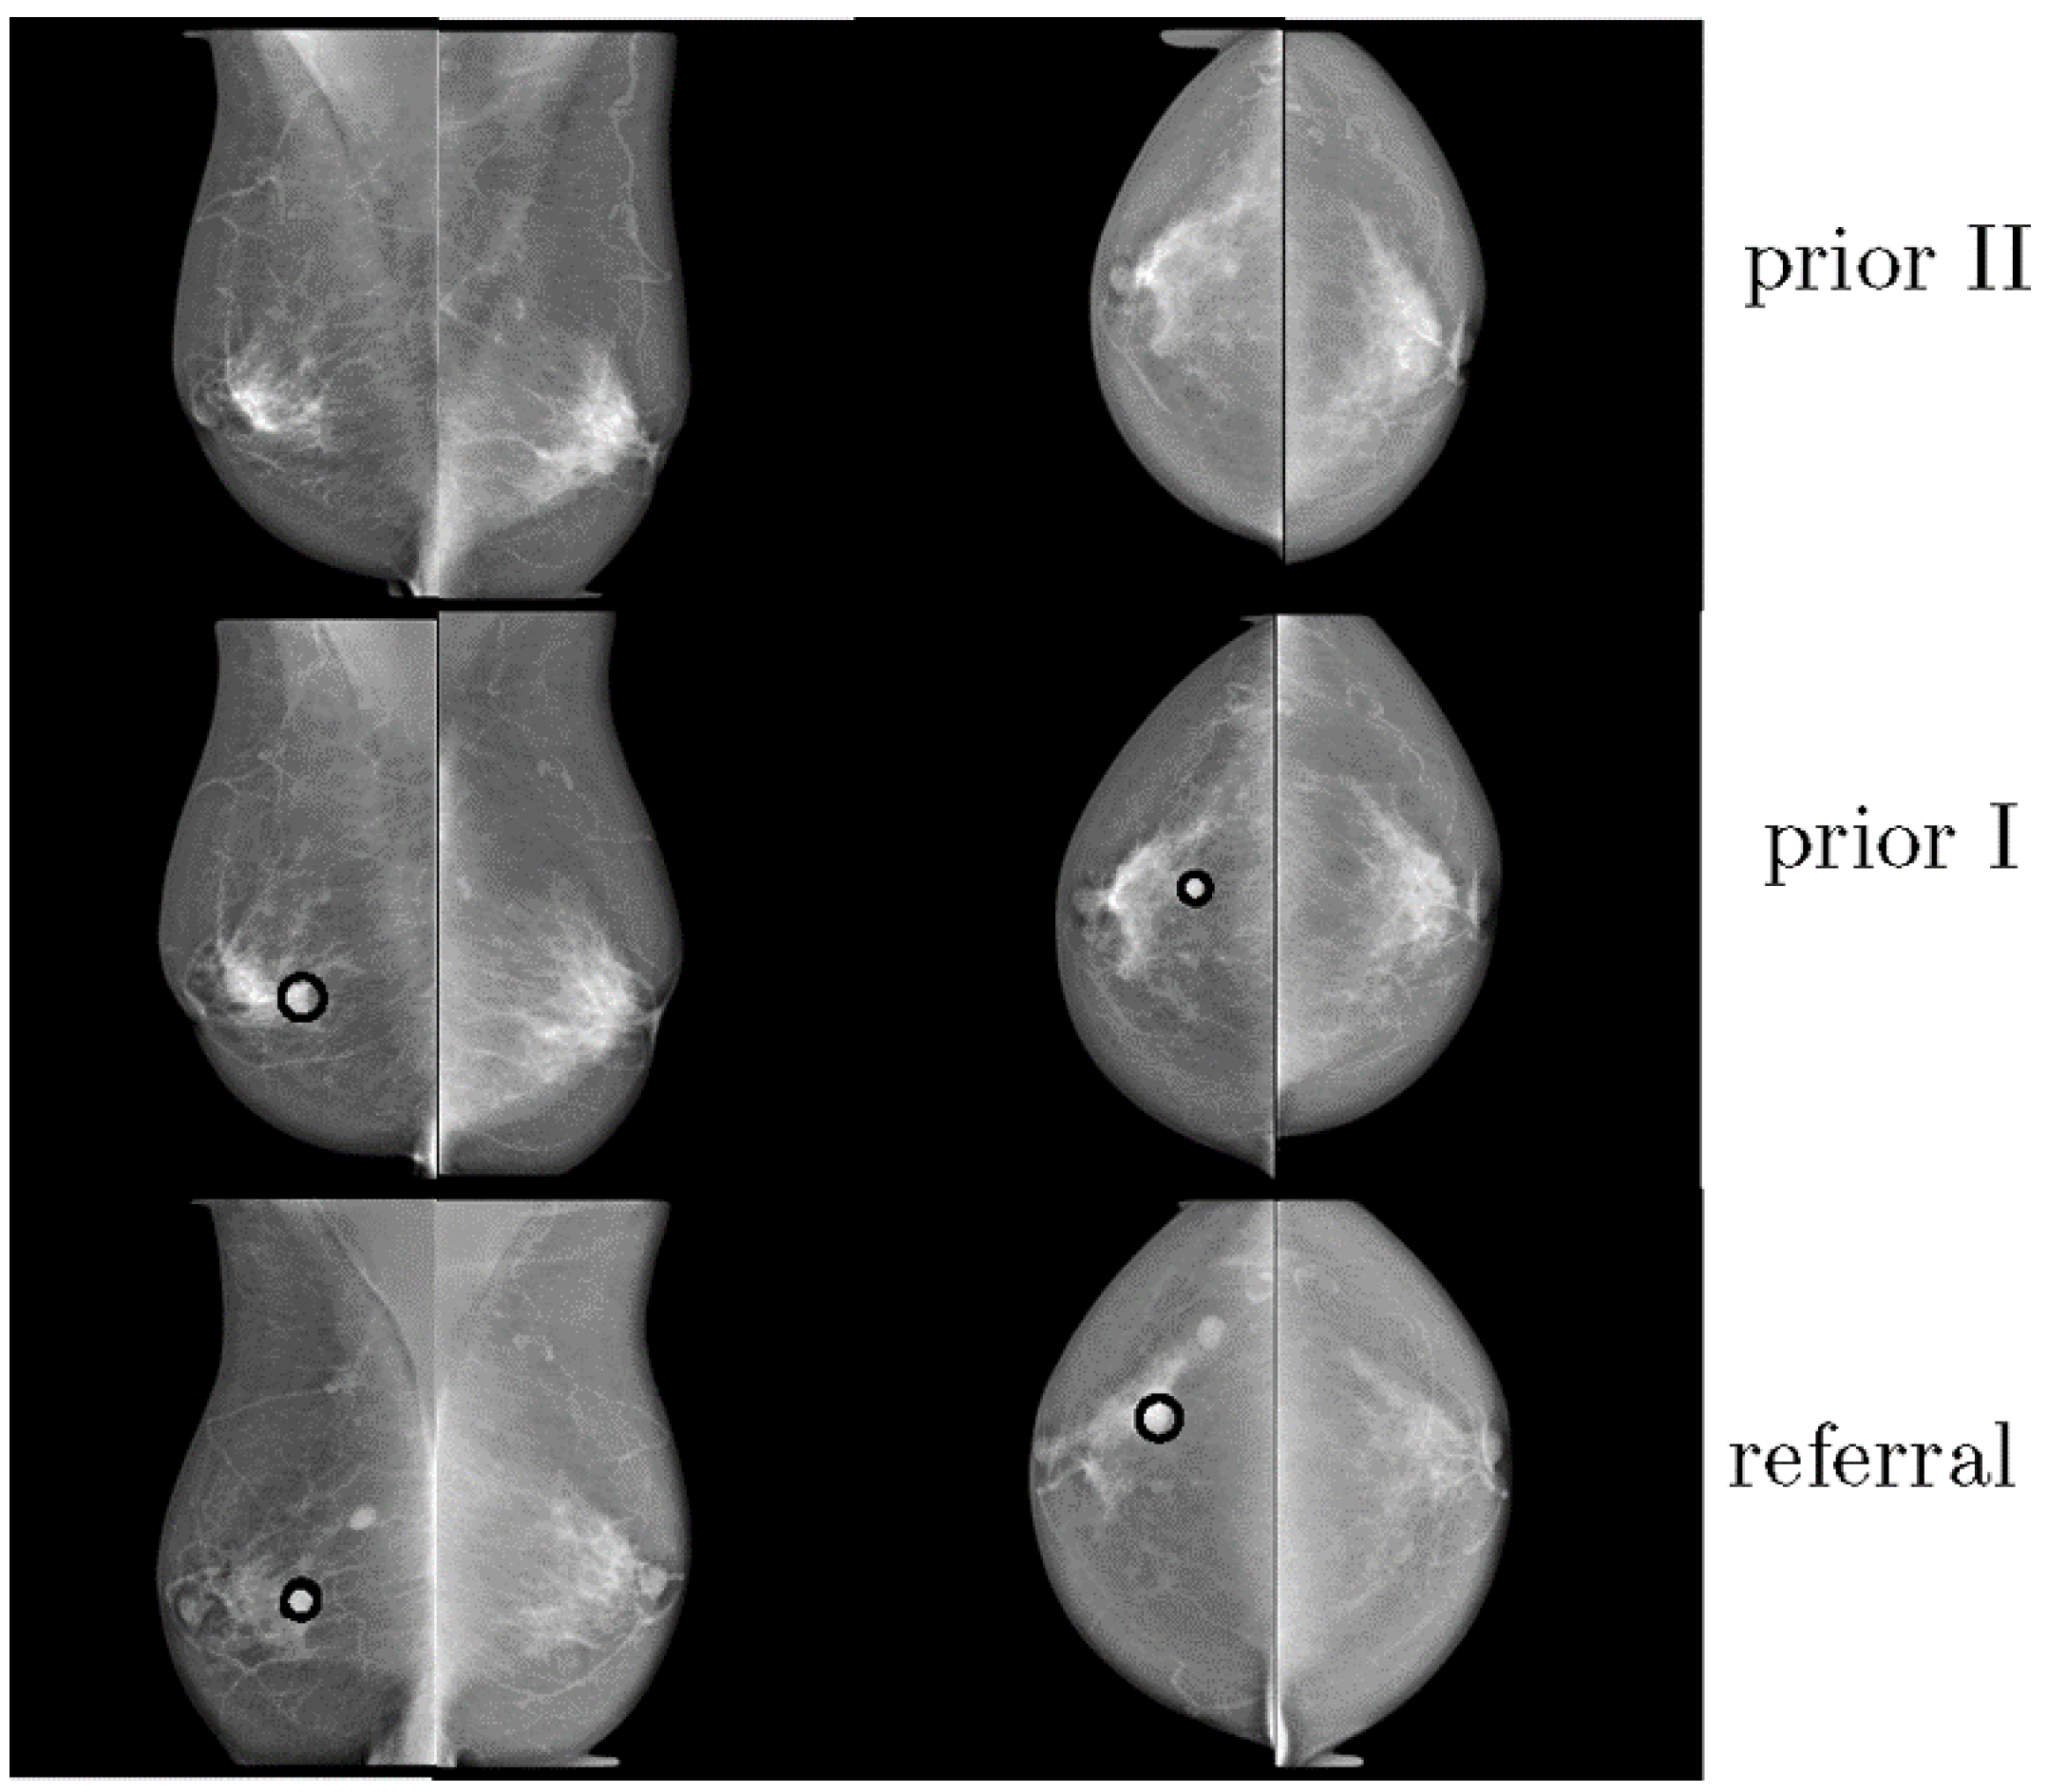
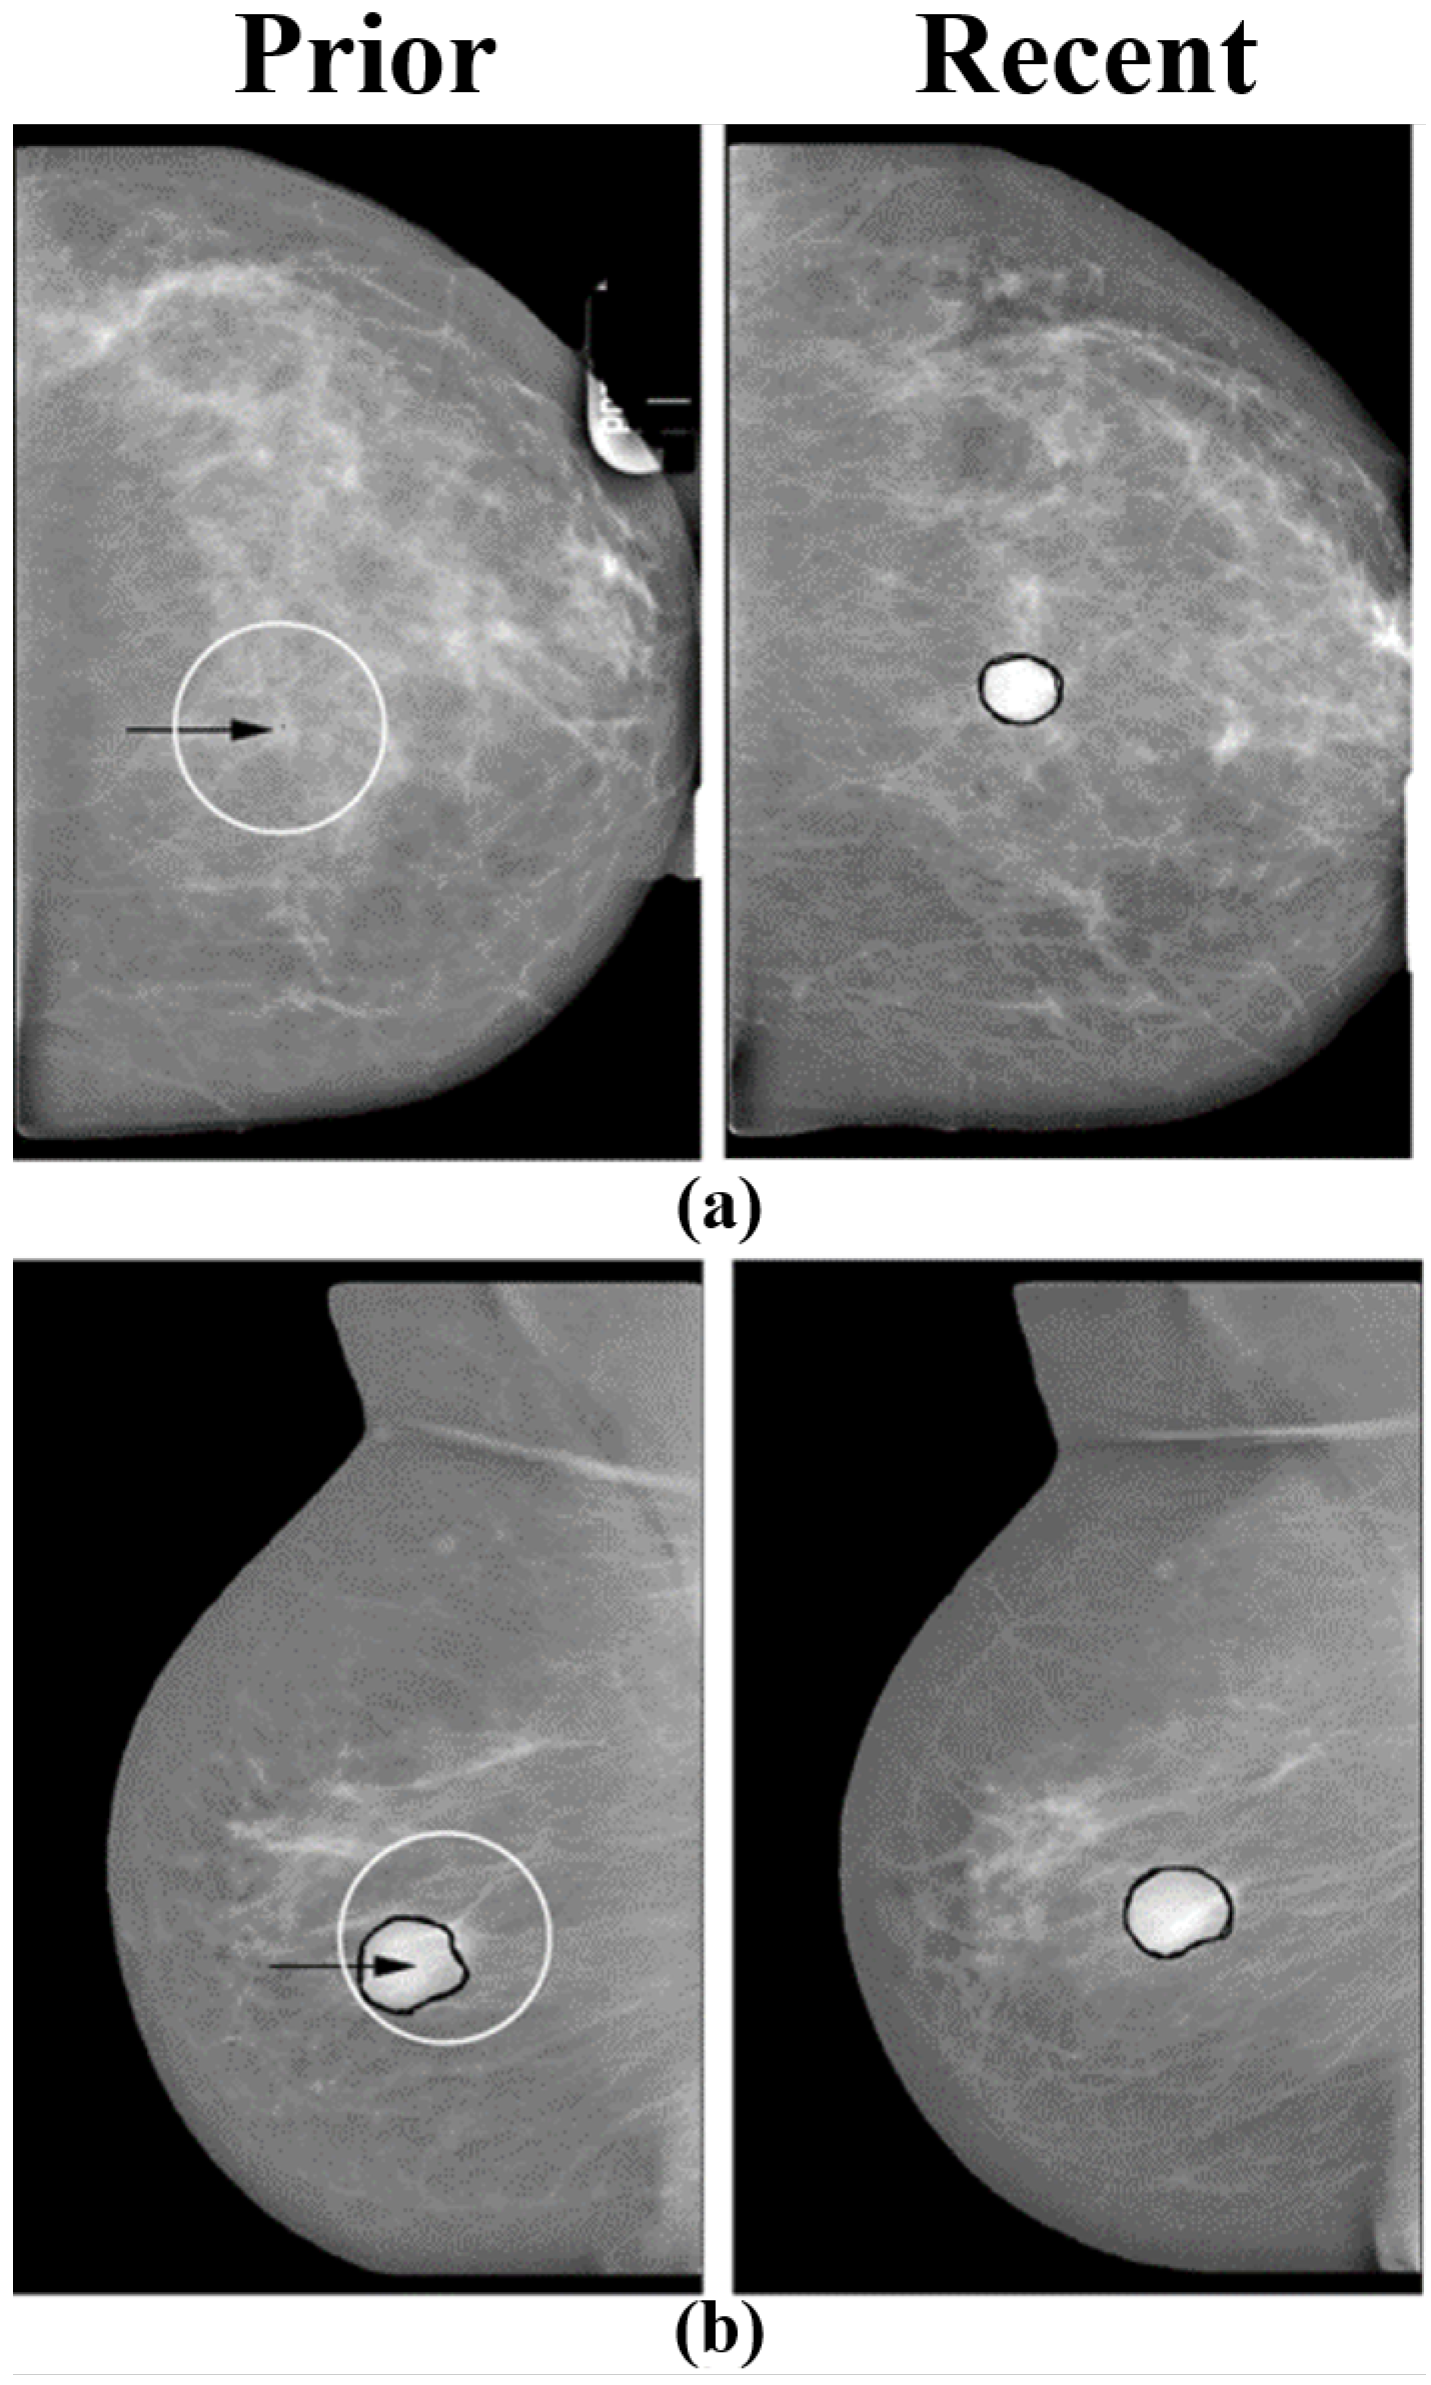
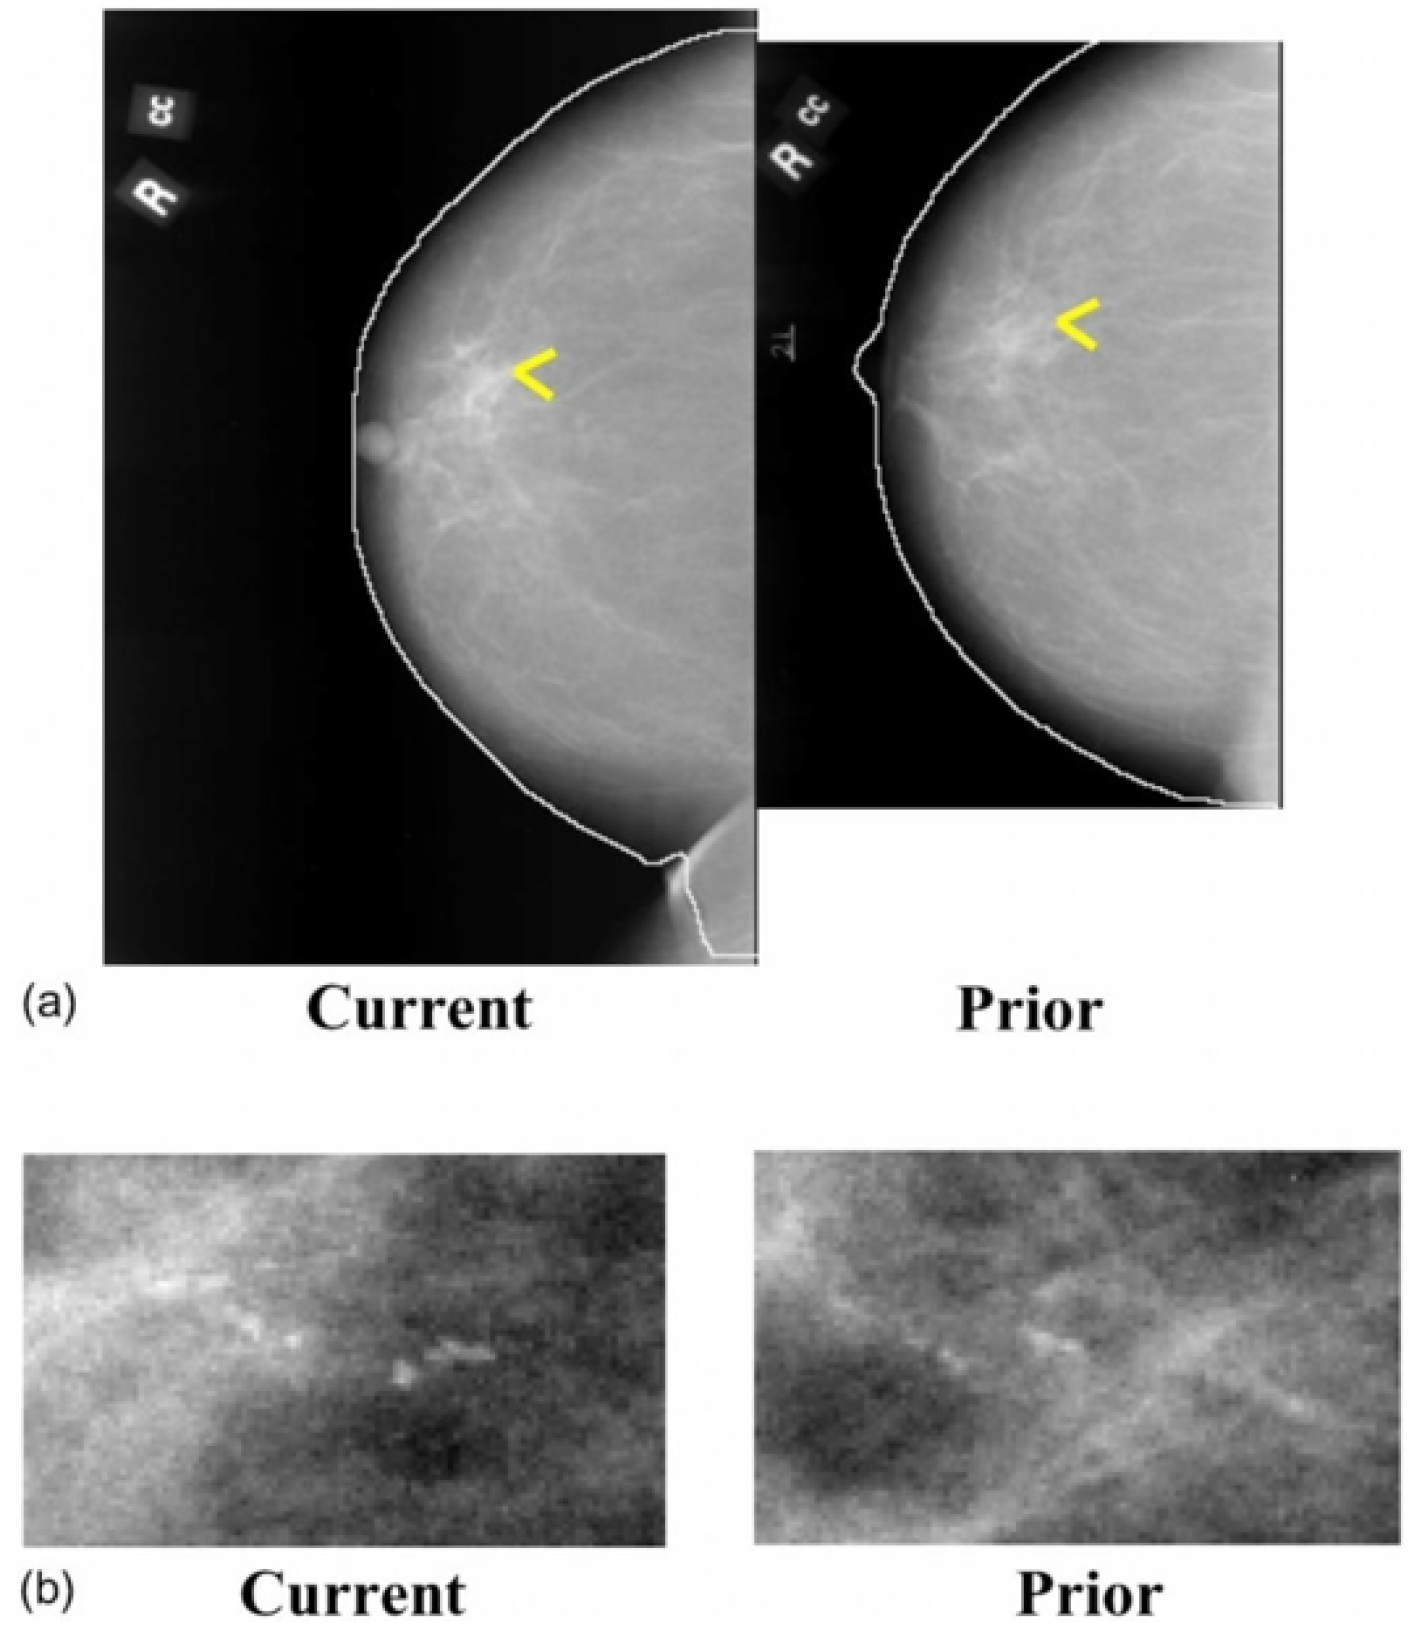
3. Importance of Prior Views
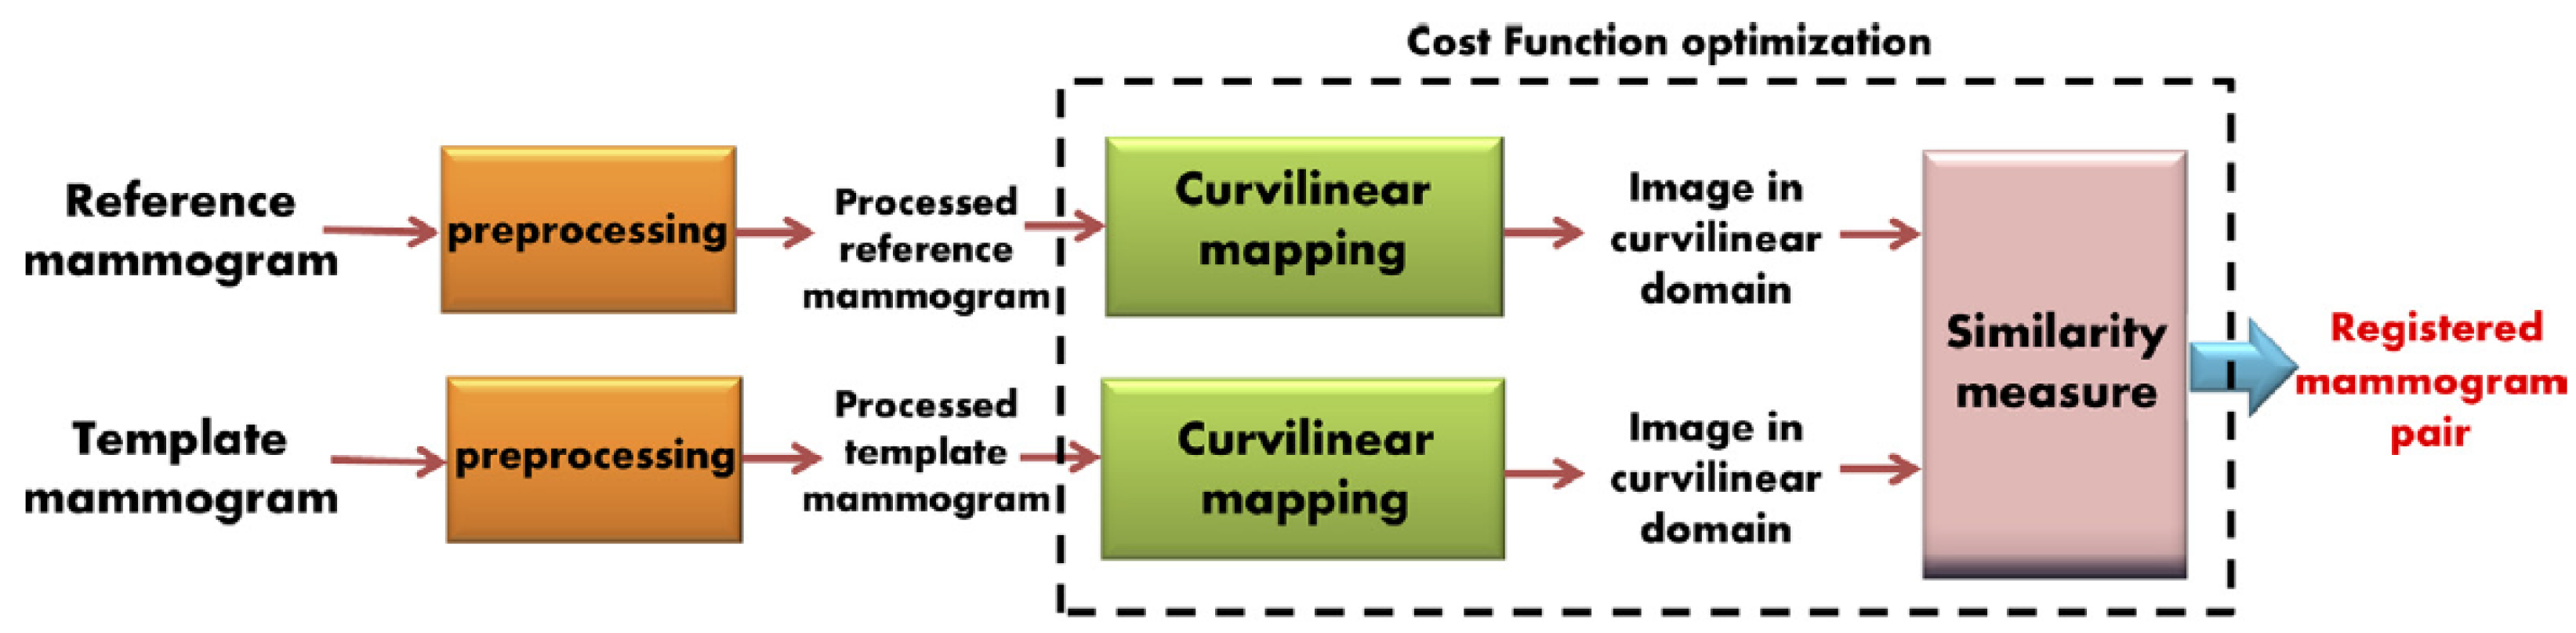
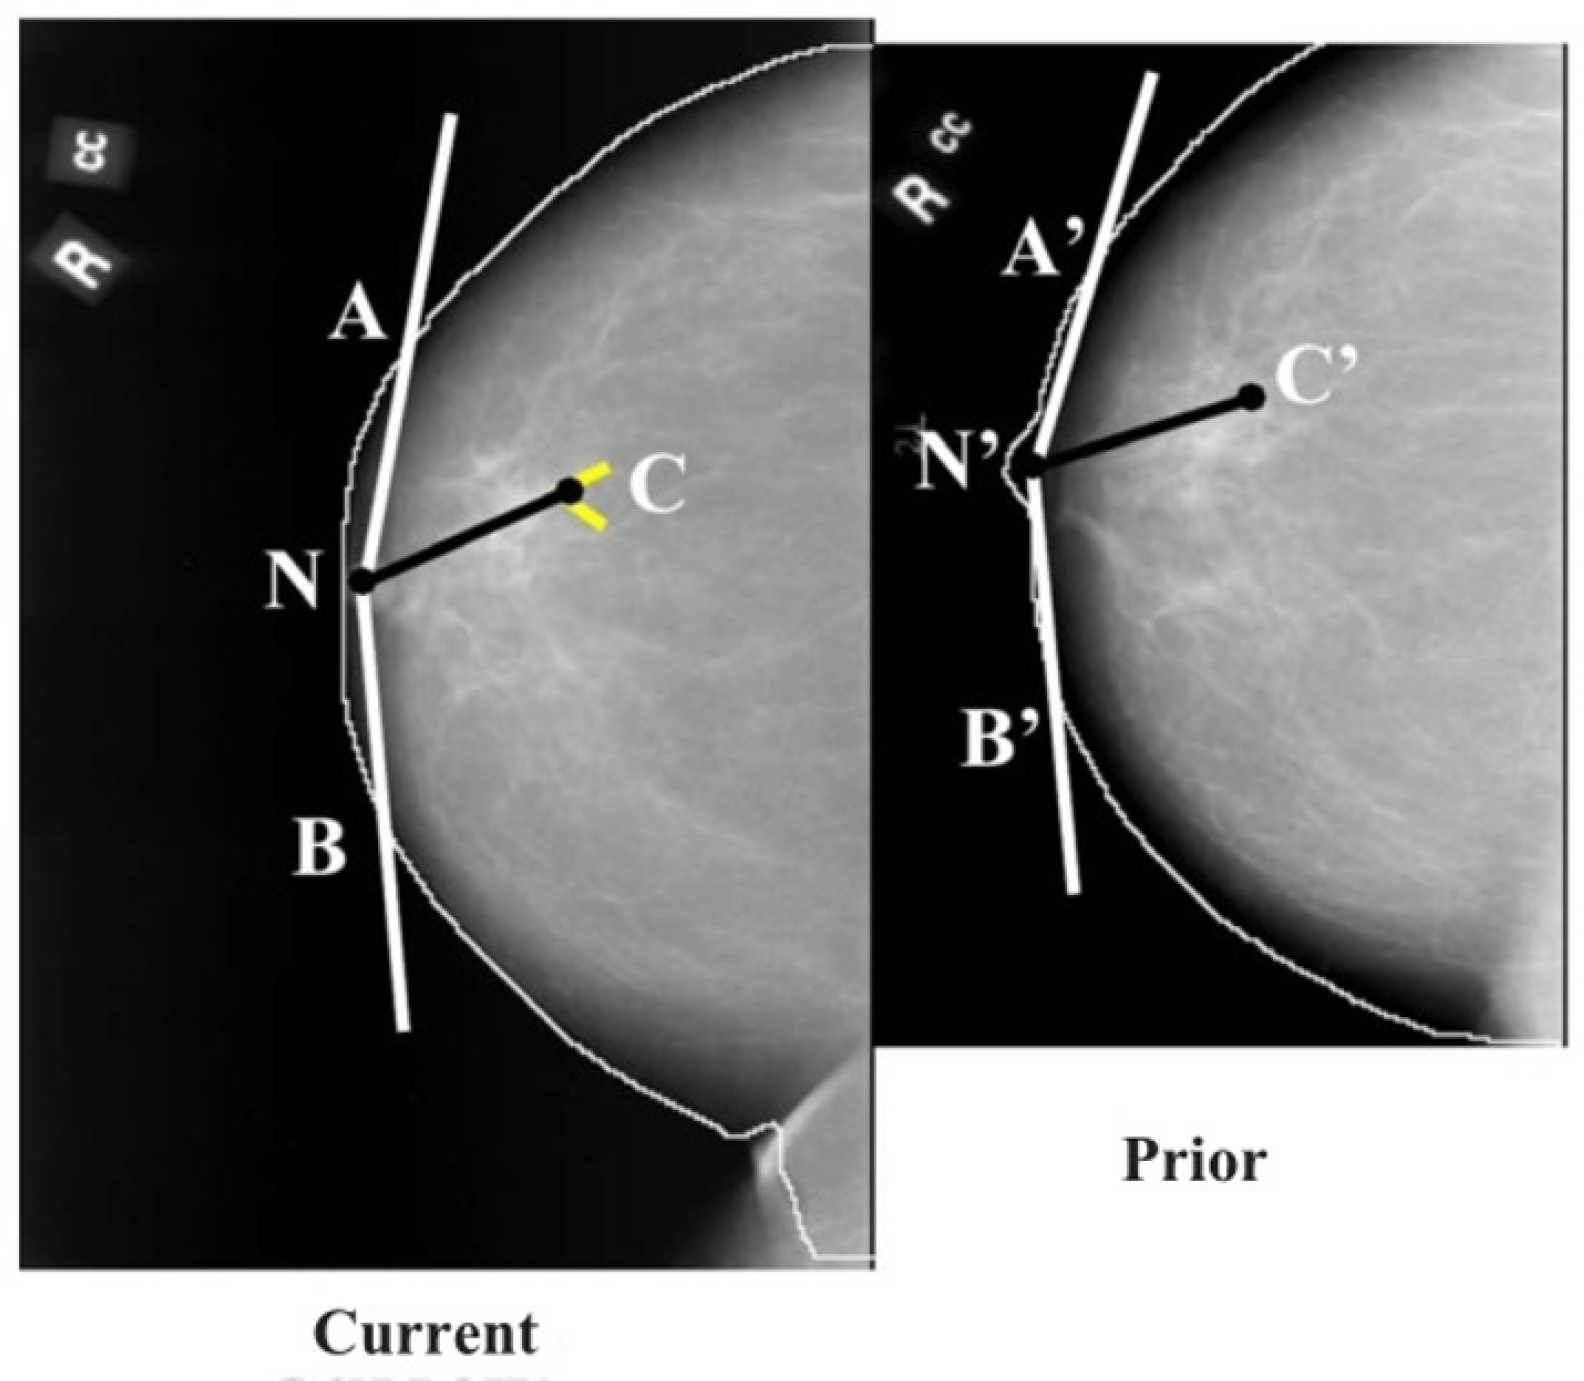
Comparison between recent and prior mammographic views is a practice that has been employed by radiologists since the establishment of mammography as the standard screening procedure for breast cancer. During the visual inspection of images, the evolution of disease can be better assessed using sequential information, which makes any change easier to visualize. Comparisons between the images increase the effectiveness of the diagnosis and reduce the recall rates (20–50% of women recalled are found to have a malignancy [24]).
Gelig et al. evaluated the effect of the availability of prior mammograms on the performance of the radiologists during mammographic screening [25]. Three experienced radiologists assessed 150 sets of sequential mammograms twice: once without seeing the prior view (using only the most recent mammogram) and once using both the recent and prior mammographic views. The radiologists detected an average of 40 cancers with 87% specificity using only the most recent mammograms, as opposed to 37 cancers with 96% specificity when using both sequential mammograms. The increase in specificity was statistically significant, proving that the addition of the prior views reduced the recall rate. Five years later, Varela et al. also verified the importance of including prior mammograms for the classification of benign and malignant breast masses [26]. In that study, five senior and one resident radiologist evaluated 198 sequential mammograms. The mammograms were evaluated twice: once without and once with the prior images. The use of prior views increased the classification performance from 0.76 to 0.8 AUC, which was statistically significant.
Hadjiiski et al. compared the performance of eight accredited radiologists and two breast imaging fellows, with and without the use of a, so-called, interval change CAD system [27]. The software used information from prior and recent mammograms to estimate a malignancy rating. A total of 90 pairs of sequential mammograms were gathered, with 47 malignant and 43 benign masses. The introduction of the interval change analysis CAD algorithm increased the AUC from 0.83 to 0.87, proving that the analysis of prior mammograms could significantly improve the performance of the radiological assessment. Timp et al. compared the effect of a single independent reading, with a CAD system with independent double readings, for the diagnosis of breast abnormalities on 198 cases of sequential mammograms (Figure 2) [24]. Six radiologists participated in the study and three reading scenarios were considered: single reading, single reading with CAD, and independent double readings. The CAD algorithms, which included temporal information, statistically improved the diagnostic performance (0.83 vs. 0.81 AUC).

4. Registration

For the development of algorithms that can effectively compare sequential mammogram pairs, accurate matching between the prior and recent images, with image registration, is of critical importance. Image registration can be defined as the process of aligning two images, where one image is the reference and remains fixed and the other is the registered or moving image. The main objective is to find the optimal transformation that aligns the points of interest in the moving image to better match the fixed image. However, registration cannot be easily applied to mammograms due to the significant variations of the breast tissue between screenings, variations in breast compression, and operating factors at the time of imaging [28]. Several algorithms have been developed to address the challenges of image registration, with some approaches specifically formulated for medical images [29,30,31] and mammograms [32].
Overall, registration algorithms can be divided into “global” or “local” based on the extent of the image information used. An algorithm is classified as global if all the pixels presented in an image are used. Rigid and Affine transformations (translation, rotation, shearing) are considered global registration techniques, whereas all pixels undergo the same transformation [29]. On the other hand, an algorithm is classified as local if only some of the pixels included in a region of interest (ROI) are used at a time. Local methods, also known as deformable methods, operate on local similarities and positions and include B-spline free-form deformations [33], polyrigid transformation [34] and the Demons algorithm [35]. Registration techniques also vary with regard to the features used. Techniques based on pixel intensity are called “intensity-based”, whereas the geometrical structures of the images are known as “feature-based”. Usually, intensity-based methods are global, and feature-based methods are local. Although these methods are often applied independently, combining two or more approaches can improve the performance in terms of accuracy and robustness [31]. The combination of global and local registration algorithms, for example, can recover the main (global) scale differences but will also account for the localized nonlinear deformations (local) [32].
Various image registration techniques have been specifically applied to mammograms (Table 1). van Engeland et al. compared four different methodologies for the registration of temporally sequential mammograms. Overall, the use of mutual information provided the best performance for global mammogram registration [36]. Vujovic and Brzakovic and Marti et al. developed local registration algorithms that identified and used control points or common structures between prior and recent images, in order to establish a correspondence between those points [37,38]. Sanjay-Gopal et al., Hadjiiski et al., and Filev et al. designed computerized methods for interval change analysis, using a regional registration technique to identify corresponding lesions on temporal pairs of mammograms [19,39,40]. In a relatively recent study, Ma et al. introduced a method that incorporates fuzzy sets, based on spatial relationships, along with graph matching [41]. Hybrid registration techniques for mammogram matching have also been proposed by Wirth et al., Timp and Karssemeijer, and Li et al. [42,43,44]. A temporal mammogram registration methodology, based on the curvilinear coordinates, was proposed by Abdel-Nasser et al. (Figure 3). This method combined global and local deformations in the breast area in order to improve the registration performance [45]. Recently, Sharma et al. proposed a technique for the segmentation of breast regions using a combination of data-driven clustering and deformable image registration. This approach combines traditional segmentation approaches with ML techniques and clustering, for improved registration results [46]. Furthermore, Mendel et al. exploited B-splines and multi-resolution registration to evaluate architecture changes for cancer risk assessment [47].

5. Temporal Analysis

The first attempt to exploit sequential mammographic images was the application of temporal analysis. In temporal analysis, the breast abnormality is localized in the most recent mammographic view and, using image registration, the location corresponding to the abnormality is also identified in the prior mammogram. Features are extracted from both, and a new feature vector is created by subtracting the features of the prior image from those of the recent image. Several studies in the literature have assessed the effectiveness of temporal analysis for the detection and classification of breast masses and MCs.

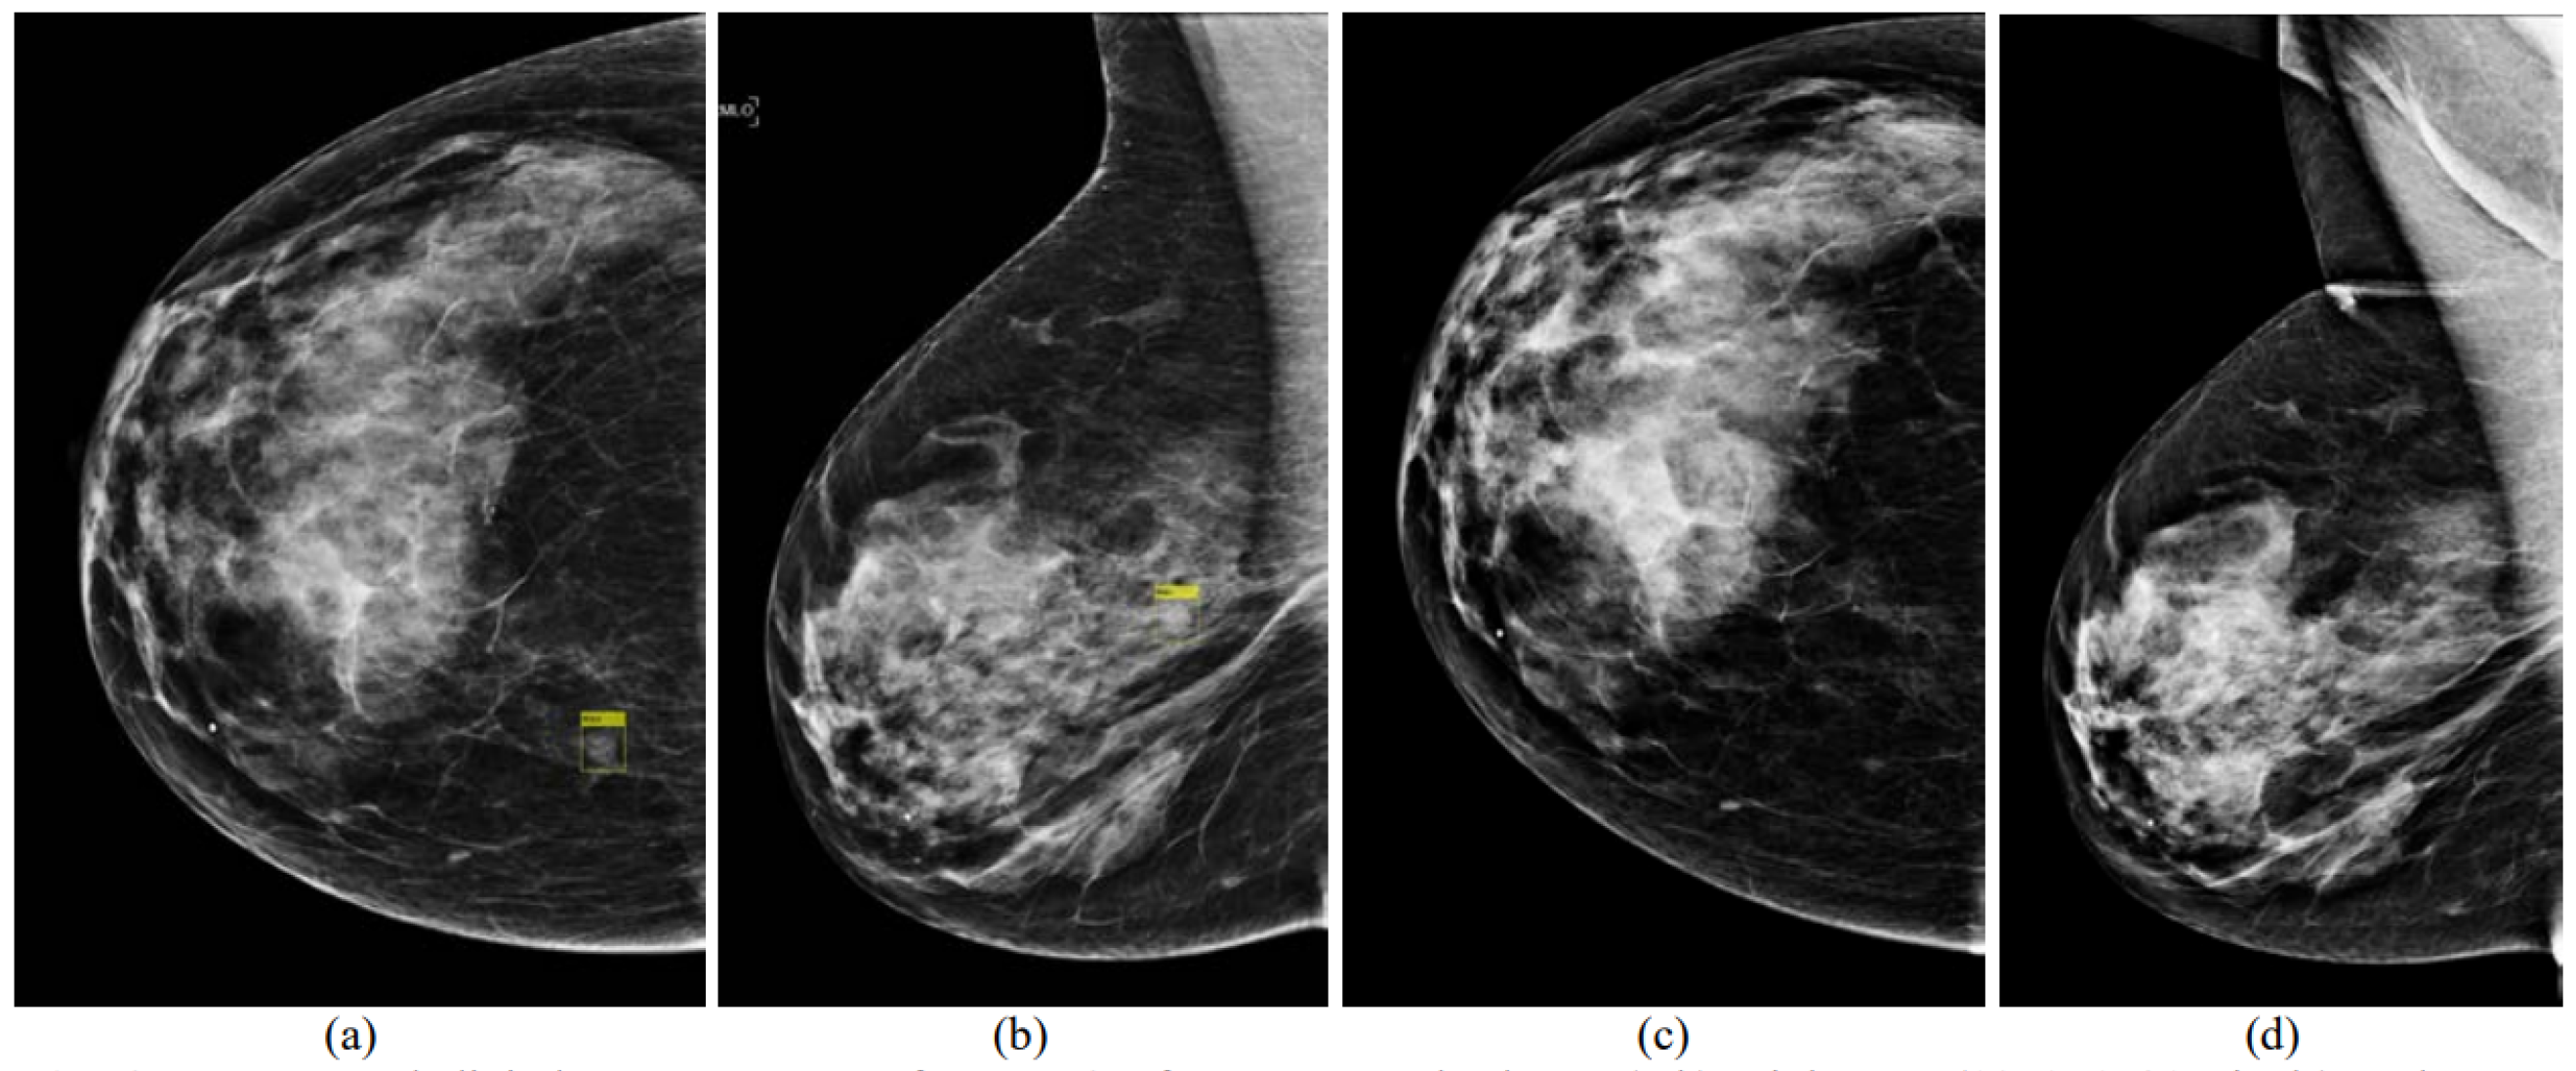
5.1. Detection of Breast Masses

The algorithms for the detection of breast masses using temporal analysis can be divided into three broad categories based on the detection approach: (a) without ML, (b) with feature-based ML, and (c) with DL. The detection of breast masses using temporal analysis is indeed possible without using ML, as demonstrated by Ma et al., and Shanmugavadivu et al. [18,49]. With the addition of temporal analysis, the accuracy of the detection of masses increased, illustrating the importance of adding temporal information. The true detection rate was 80%, with 1.02 false detections per image when using just the most recent mammogram, as opposed to 0.96 false detections per image with temporal analysis [18].
Using traditional feature-based ML techniques, Zheng et al. evaluated different CAD systems, optimized for the diagnosis of breast masses, with the addition of information from prior mammograms. They observed that the performance of those systems improved (0.89 vs. 0.65 AUC) [50]. Similarly, Ma et al. incorporated a temporal registration algorithm, which verified the effectiveness of temporal analysis (0.9 vs. 0.88 AUC) [51]. Timp and Karssemeijer designed an algorithm that detected interval changes between sequential mammograms but achieved only a marginal improvement with the addition of temporal features (0.72 vs 0.71 AUC) [43]. The state-of-the-art algorithms for the detection of breast masses using temporal analysis with feature-based ML are provided in Table 2.
Deep learning has attracted significant attention since 2018. Kooi and Karssemeijer and Zheng et al. proposed DL algorithms for the detection of breast masses using temporal analysis (Figure 4) [52,53]. Both studies exploited deep CNNs. Their results proved that temporal analysis can improve the detection of breast masses (0.88 vs. 0.87 AUC [53]). The state-of-the-art techniques for the detection of masses in mammograms using temporal analysis with DL are provided in Table 3.

5.2. Classification of Breast Masses

After the detection of a breast abnormality, classification usually ensues to mark the detected lesion as benign or malignant. Unfortunately, few studies have been dedicated to the classification of breast masses using sequential mammograms. One of the first groups, to use feature-based ML and temporal analysis for the classification of breast masses as benign or malignant, was Hadjiiski et al. [19]. The performance of the classification significantly improved with the addition of temporal analysis (0.88 vs. 0.82 AUC). Timp et al. and Bozek et al. also assessed the use of temporal comparison of breast abnormalities using feature-based classification [54,55]. Overall, the AUC increased significantly in both studies (0.77 vs. 0.74 [54] and 0.90 vs. 0.77 [55]) with the addition of temporal features (Figure 5). The state-of-the-art techniques for the classification of masses in mammograms using temporal analysis with feature-based ML are provided in Table 4.

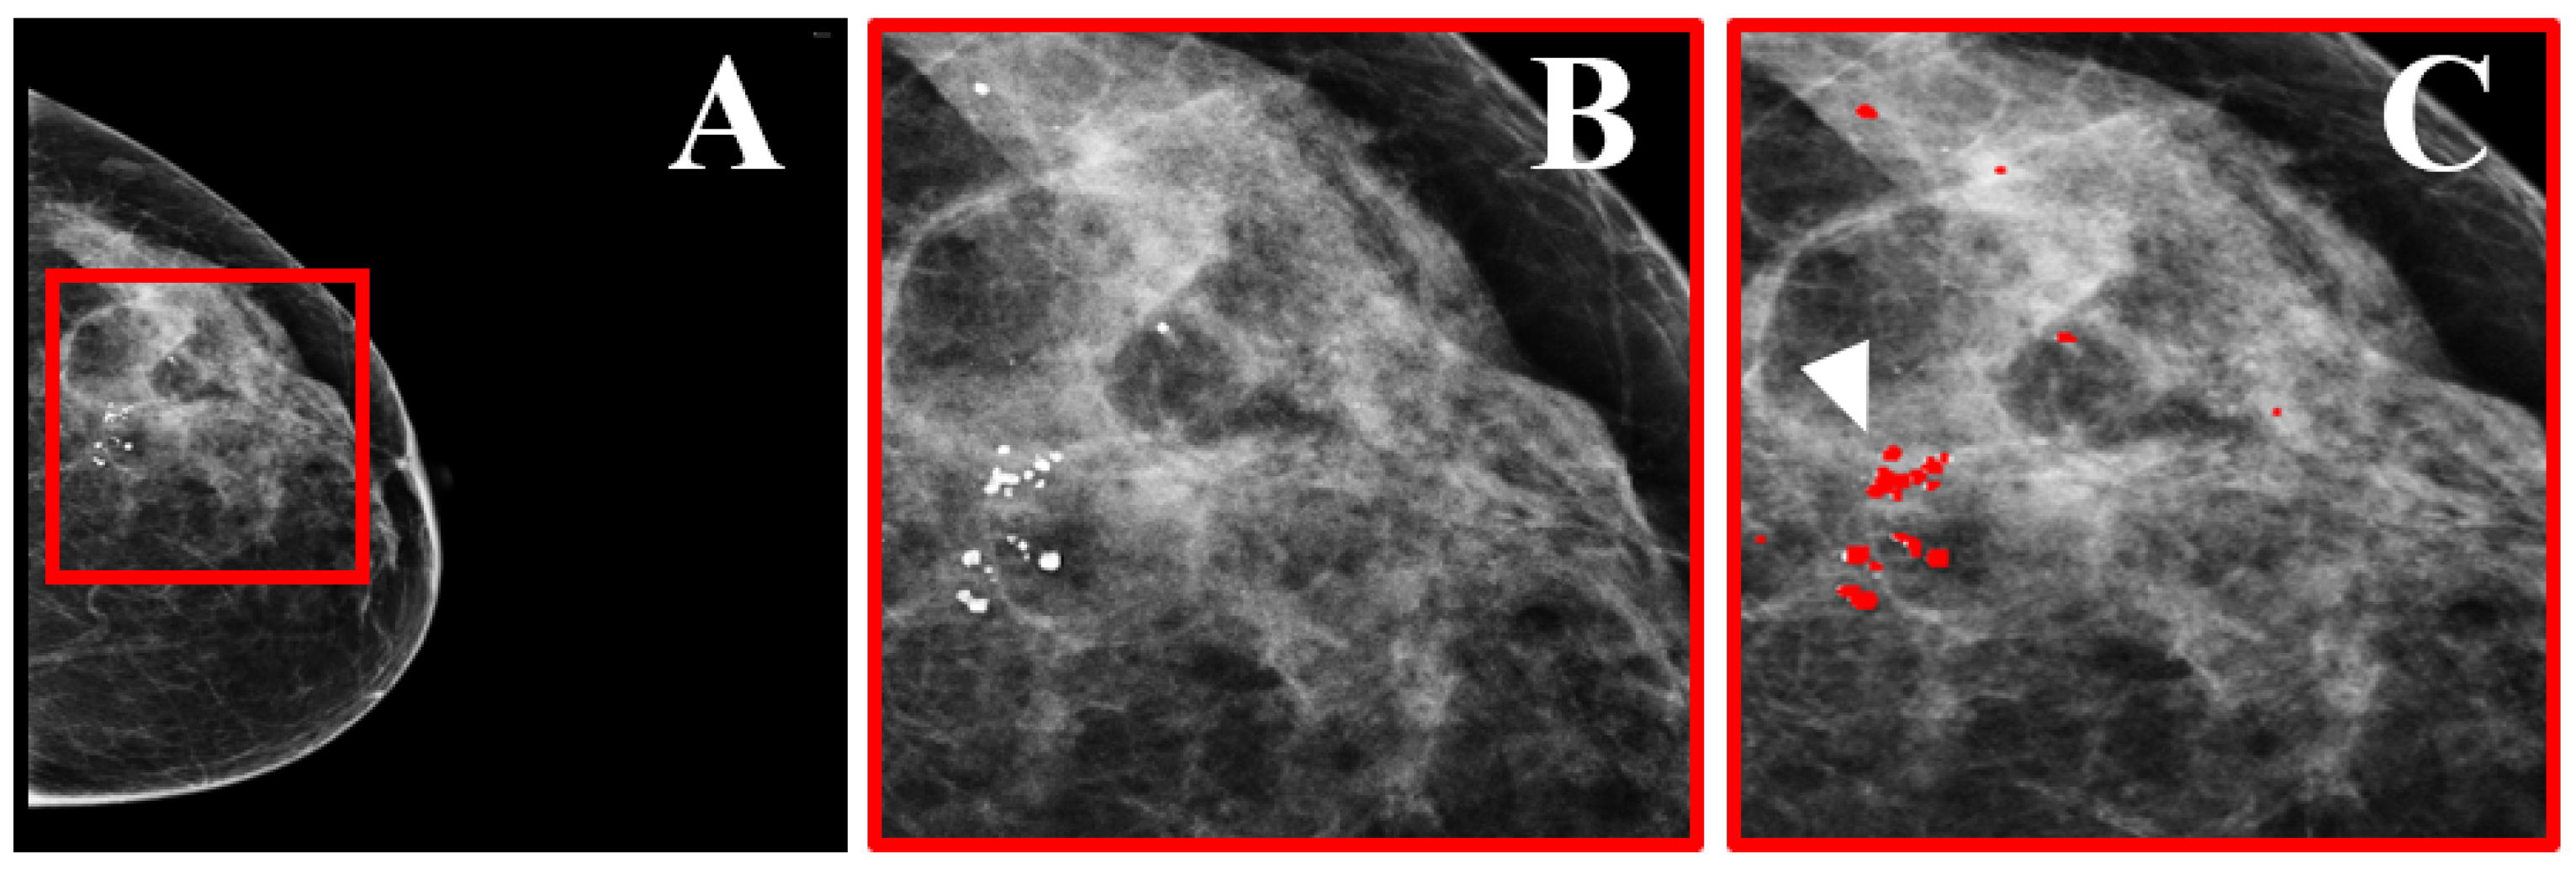
5.3. Detection of Micro-Calcifications (MCs)

Several algorithms have been proposed for the detection of MCs using the most recent mammogram of a patient [21,46]. However, only Filev et al. exploited temporal analysis for this task (Figure 6) [40]. For that study, a new dataset was collected consisting of 261 pairs of digitized mammograms. First, a regional registration technique was applied to identify the area in the prior mammogram that may have corresponded to the abnormality identified in the recent mammogram. Subsequently, classification using linear discriminant analysis (LDA) and leave-one-out validation per patient, resulted in 91.2% accuracy and 0.4 FP detections per image.

5.4. Classification of Micro-Calcifications (MCs)

Classification of breast MCs, using the most recent mammographic view, still remains an active research topic. However, only a few studies took advantage of temporal analysis for this task. Hadjiiski et al. developed an interval change analysis algorithm for the classification of mammographic MCCs as benign or malignant [56]. Sixty-five digitized mammogram pairs were collected, and various features were extracted from each MCC. For the classification, LDA was applied with leave-one-out validation per patient. The performance significantly increased with the addition of temporal analysis (0.87 vs. 0.81 AUC). Filev et al. also showed that the performance of MC classification improved (0.81 vs. 0.72 AUC) with temporal analysis [40]. They collected 261 pairs of digitized mammograms and used regional registration, LDA, and leave-one-out validation per patient (Figure 7). The state-of-the-art techniques for the detection and classification of MCs in mammograms using temporal analysis with feature-based ML are provided in Table 5.
Despite the initial promising results, temporal analysis offers no benefit when the abnormality is new, with no traces in the prior screening examination. In addition, when small, barely discernible changes occur between screenings, they may not be apparent in the temporal feature vector and could be rejected as FPs.

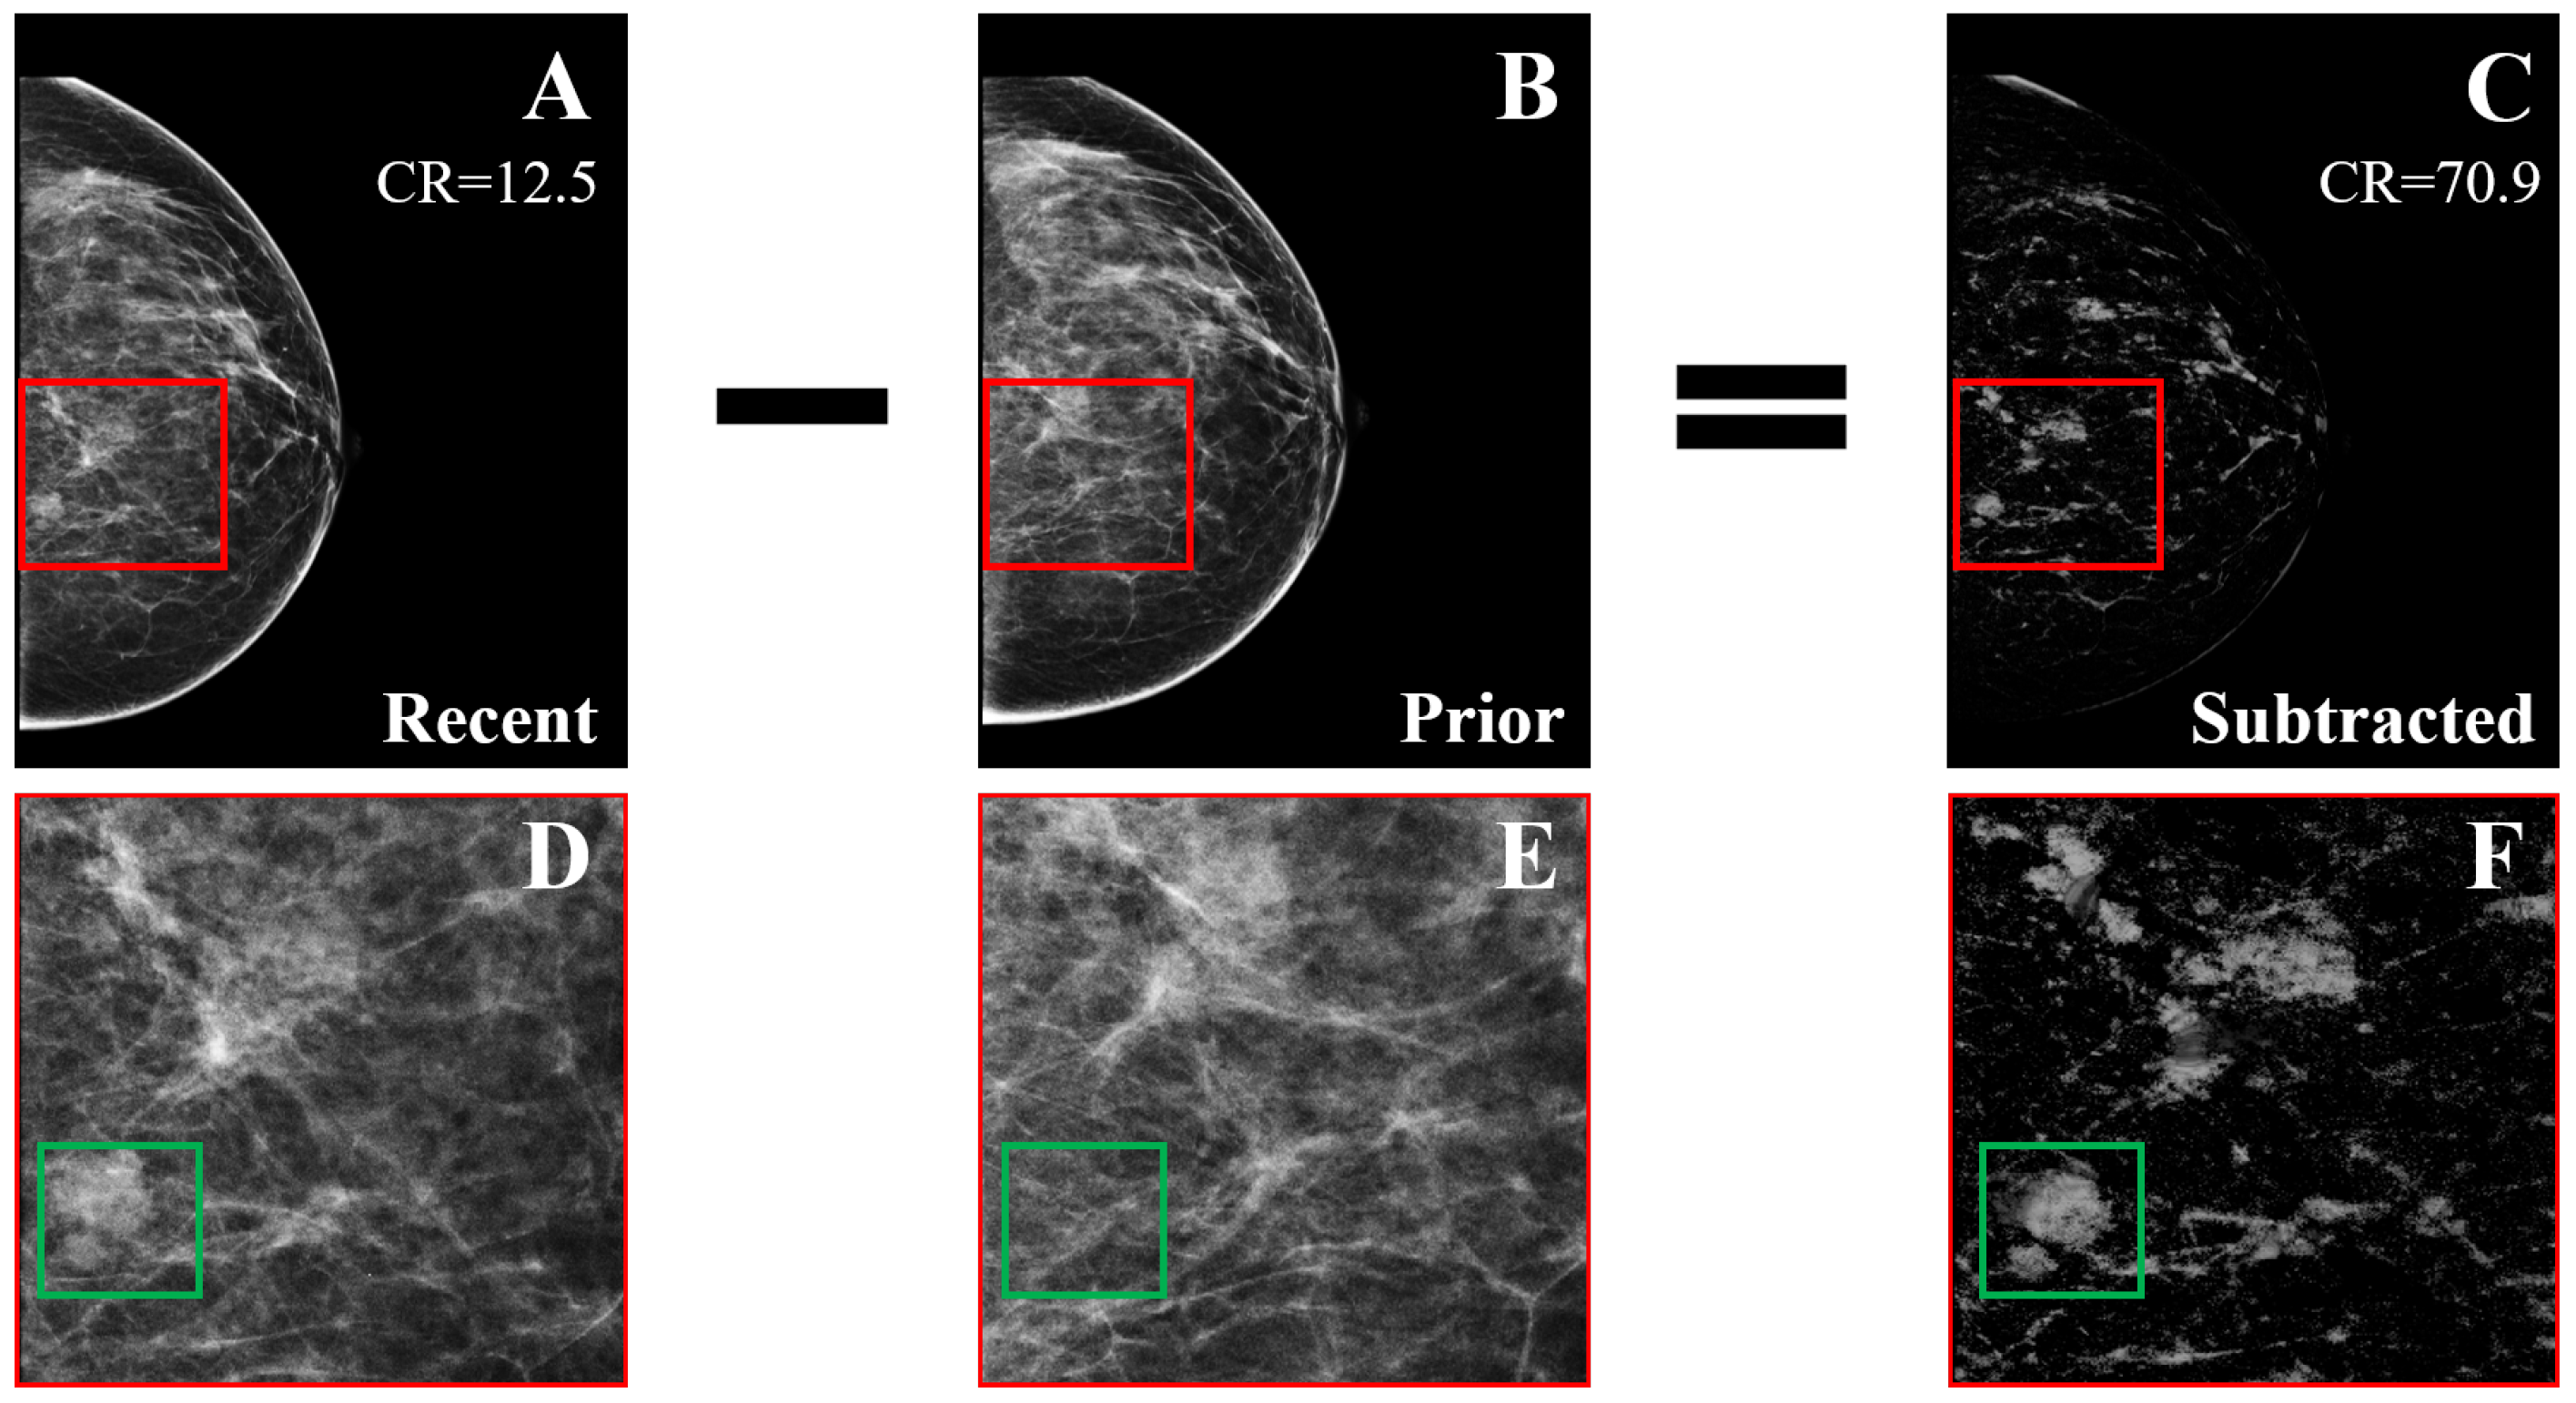
6. Temporal Subtraction

To address some of the limitations of temporal analysis, temporal subtraction was developed by Loizidou et al. for the detection and classification of breast abnormalities [57]. The key difference between temporal analysis and temporal subtraction, is that the later exploits the entire prior image by subtracting its registered version from the entire recent image. Direct subtraction of the mammograms effectively removes the regions that have remained unchanged between screenings and enhances the contrast of new changes.
Temporal subtraction was first applied for the detection and classification of breast MCs [58]. For that purpose, 100 pairs of digital mammograms were collected with precise annotation of each individual MC (benign and suspicious), as assessed by two expert radiologists (Figure 8). That dataset is now available online with open access [59]. Pre-processing, registration, subtraction, and segmentation effectively detected all ROIs that could be MCs. Machine learning was then used to reject falsely detected regions using several shape, texture, and intensity features extracted from all the ROIs. Subsequently, the correctly detected MCs were classified as BI-RADS benign or suspicious, using leave-one-patient-out cross-validation. The classification performance increased by approximately 7% in terms of accuracy (90.3% vs. 82.7%) when using temporal subtraction, as compared to using temporal analysis on the same dataset (Table 6).
Temporal subtraction was also applied to the detection and classification of breast masses. A new dataset was collected by Loizidou et al., consisting of 80 pairs of digital temporally sequential mammograms [60]. This dataset is also available online with open access [61]. The algorithm consists of three steps: (a) detection of the masses, which includes pre-processing, image registration, subtraction, and segmentation (Figure 9); (b) FP elimination, where falsely detected ROIs are rejected using feature extraction and ML; and (c) classification, where the detected breast masses are classified as benign or suspicious. The classifiers were trained using leave-one-patient-out cross-validation, per patient. The classification performance reached 98% accuracy when using temporal subtraction, as opposed to 92.7% when using temporal analysis on the same dataset (Table 7).

7. Open-Access Mammography Datasets

Various open-access mammography datasets are available online, enabling the development of reproducible algorithms and promoting the repeatability of results. However, the most commonly used datasets are relatively outdated, with scanned film mammograms, and limited ground-truth annotations or biopsy confirmations. In addition, some are not completely open access, requiring approval to use. Each dataset has its own advantages and limitations, and the choice depends solely on the needs of each particular study. Table 8 summarizes the most commonly used open-access mammography datasets, as well as their basic characteristics, such as the number of cases, the resolution (bits/pixel), the annotations available, and more. However, only two of those datasets provide sequential mammograms [59,61].

8. Discussion

This review summarizes the recent advances in the automated detection and/or classification of breast abnormalities using temporally sequential mammograms. Unfortunately, comparing all the existing techniques is very challenging. Although the main steps of these algorithms are similar, there are several possible approaches to implement each step and, further, to analyze the images. Another important parameter that makes the comparison between the studies difficult, is the datasets used. Open-access mammographic databases do not include sequential mammograms; thus, each research group has independently resorted to collecting sequential data. Unfortunately, only two datasets are available with open access [59,61]. Furthermore, even if the same dataset and classifier are exploited, other parameters can significantly vary. One such example is the validation method, which can significantly affect the outcome. The majority of the studies used k-fold cross-validation, with the number of k varying depending on the number of subjects. However, the construction of the training and test sets is crucial. Introducing information from the same patient in both sets, by performing cross-validation per image, or per ROI, instead of per patient, artificially increases the performance of the algorithm. All the ROIs or images of the same patient should be included either in the training or in the validation set, to avoid such bias. Unfortunately, that practise is not always adhered to, resulting in approaches that fail in real-world applications.
Despite its limitations, temporal analysis, clearly, offers an advantage in the detection and/or classification of breast masses and MCs, with a significant increase in the performance (0.77 vs. 0.90 AUC for the classification of masses [55] or 0.87 vs. 0.81 AUC for the classification of MCs [56]). However, temporal analysis offers no benefit when a newly developed abnormality appears, with few traces in the prior mammogram. To address some of the limitations, subtraction of temporally sequential mammograms exploits the whole prior screening, by subtracting the registered version of the prior images from recent ones. With direct subtraction of the mammogram pairs, ROIs that remained unchanged between screenings are effectively removed, which improves the detection and classification performance (90.3% accuracy and 0.87 AUC for the classification of MCs [58] or 98% accuracy and 0.98 AUC for the classification of masses [60]).

9. Conclusions

This review summarized the current trends in the analysis of sequential mammograms, exploring various concepts and methodologies. The incorporation of information from prior mammograms shows great promise for the detection of breast abnormalities. However, the lack of large-population studies limits the degree to which these results can be generalized. Furthermore, as with other CAD systems, slow clinical acceptance will probably, initially, limit temporal subtraction to a second reader role. Although, there is still a long way ahead for the translation of sequential mammogram analysis to clinical practice, the initial results, presented in this review, should encourage future research.

Author Contributions

Conceptualization, K.L. and C.P.; formal analysis, K.L.; investigation, K.L.; resources, K.L.; writing—original draft preparation, K.L. and C.P.; writing—review and editing, K.L., G.S., C.N., and C.P.; visualization, K.L., G.S., C.N., and C.P.; supervision, C.P. All authors have read and agreed to the published version of the manuscript.

Funding

The publication of this paper is supported by the European Union’s Horizon 2020 research and innovation programme under grant agreement No 739551 (KIOS CoE) and the Government of the Republic of Cyprus through the Cyprus Deputy Ministry of Research, Innovation and Digital Policy.

Institutional Review Board Statement

Not applicable.

Informed Consent Statement

Not applicable.

Data Availability Statement

Not applicable.

Conflicts of Interest

The authors declare no conflict of interest.

References

  1. Siegel, R.L.; Miller, K.D.; Fuchs, H.E.; Jemal, A. Cancer statistics, 2022. CA Cancer J. Clin. 2022, 72, 7–33. [Google Scholar] [CrossRef] [PubMed]
  2. Ganesan, K.; Acharya, U.R.; Chua, C.K.; Min, L.C.; Abraham, K.T.; Ng, K.H. Computer-aided breast cancer detection using mammograms: A review. IEEE Rev. Biomed. Eng. 2013, 6, 77–98. [Google Scholar] [CrossRef] [PubMed]
  3. Beura, S. Development of Features and Feature Reduction Techniques for Mammogram Classification. Ph.D. Thesis, Department of Computer Science and Engineering National Institute of Technology Rourkela, Odisha, India, 2016. [Google Scholar]
  4. Spak, D.A.; Plaxco, J.; Santiago, L.; Dryden, M.; Dogan, B. BI-RADS® fifth edition: A summary of changes. Diagn. Interv. Imaging 2017, 98, 179–190. [Google Scholar] [CrossRef] [PubMed]
  5. Breast Anatomy and How Cancer Starts. About Breast Cancer. Available online: https://nbcf.org.au/about-national-breast-cancer-foundation/about-breast-cancer/what-you-need-to-know/breast-anatomy-cancer-starts/ (accessed on 20 September 2020).
  6. Rangayyan, R.M.; Ayres, F.J.; Desautels, J.L. A review of computer-aided diagnosis of breast cancer: Toward the detection of subtle signs. J. Frankl. Inst. 2007, 344, 312–348. [Google Scholar] [CrossRef]
  7. Oliver, A.; Freixenet, J.; Marti, J.; Perez, E.; Pont, J.; Denton, E.R.; Zwiggelaar, R. A review of automatic mass detection and segmentation in mammographic images. Med. Image Anal. 2010, 14, 87–110. [Google Scholar] [CrossRef]
  8. Liu, X.; Zeng, Z. A new automatic mass detection method for breast cancer with false positive reduction. Neurocomputing 2015, 152, 388–402. [Google Scholar] [CrossRef]
  9. Xie, W.; Li, Y.; Ma, Y. Breast mass classification in digital mammography based on extreme learning machine. Neurocomputing 2016, 173, 930–941. [Google Scholar] [CrossRef]
  10. Zonderland, H.; Smithuis, R. BI-RADS for mammography and ultrasound 2013 updated version. Radiol. Assist. 2014. Available online: https://radiologyassistant.nl/breast/bi-rads/bi-rads-for-mammography-and-ultrasound-2013 (accessed on 1 December 2022).
  11. Castells, X.; Torá-Rocamora, I.; Posso, M.; Román, M.; Vernet-Tomas, M.; Rodríguez-Arana, A.; Domingo, L.; Vidal, C.; Baré, M.; Ferrer, J.; et al. Risk of breast cancer in women with false-positive results according to mammographic features. Radiology 2016, 280, 379–386. [Google Scholar] [CrossRef]
  12. Banik, S.; Rangayyan, R.M.; Desautels, J.L. Detection of architectural distortion in prior mammograms. IEEE Trans. Med. Imaging 2010, 30, 279–294. [Google Scholar] [CrossRef]
  13. Lehman, C.D.; Wellman, R.D.; Buist, D.S.; Kerlikowske, K.; Tosteson, A.N.; Miglioretti, D.L. Diagnostic accuracy of digital screening mammography with and without computer-aided detection. JAMA Intern. Med. 2015, 175, 1828–1837. [Google Scholar] [CrossRef]
  14. Nishikawa, R.M.; Kallergi, M.; Orton, C.G. Computer-aided detection, in its present form, is not an effective aid for screening mammography. Med. Phys. 2006, 33, 811–814. [Google Scholar] [CrossRef]
  15. Mohanty, F.; Rup, S.; Dash, B.; Majhi, B.; Swamy, M. A computer-aided diagnosis system using Tchebichef features and improved grey wolf optimized extreme learning machine. Appl. Intell. 2019, 49, 983–1001. [Google Scholar] [CrossRef]
  16. Al-Masni, M.A.; Al-Antari, M.A.; Park, J.M.; Gi, G.; Kim, T.Y.; Rivera, P.; Valarezo, E.; Choi, M.T.; Han, S.M.; Kim, T.S. Simultaneous detection and classification of breast masses in digital mammograms via a deep learning YOLO-based CAD system. Comput. Methods Programs Biomed. 2018, 157, 85–94. [Google Scholar] [CrossRef]
  17. Al-Antari, M.A.; Han, S.M.; Kim, T.S. Evaluation of deep learning detection and classification towards computer-aided diagnosis of breast lesions in digital X-ray mammograms. Comput. Methods Programs Biomed. 2020, 196, 105584. [Google Scholar] [CrossRef]
  18. Ma, F.; Bajger, M.; Williams, S.; Bottema, M.J. Improved detection of cancer in screening mammograms by temporal comparison. In Proceedings of the International Workshop on Digital Mammography; Springer: Girona, Catalonia, Spain, 2010; pp. 752–759. [Google Scholar]
  19. Hadjiiski, L.; Sahiner, B.; Chan, H.P.; Petrick, N.; Helvie, M.A.; Gurcan, M. Analysis of temporal changes of mammographic features: Computer-aided classification of malignant and benign breast masses. Med. Phys. 2001, 28, 2309–2317. [Google Scholar] [CrossRef]
  20. Doi, K. Computer-aided diagnosis in medical imaging: Historical review, current status and future potential. Comput. Med. Imaging Graph. 2007, 31, 198–211. [Google Scholar] [CrossRef] [Green Version]
  21. Cheng, H.D.; Cai, X.; Chen, X.; Hu, L.; Lou, X. Computer-aided detection and classification of microcalcifications in mammograms: A survey. Pattern Recognit. 2003, 36, 2967–2991. [Google Scholar] [CrossRef]
  22. Litjens, G.; Kooi, T.; Bejnordi, B.E.; Setio, A.A.A.; Ciompi, F.; Ghafoorian, M.; Van Der Laak, J.A.; Van Ginneken, B.; Sánchez, C.I. A survey on deep learning in medical image analysis. Med. Image Anal. 2017, 42, 60–88. [Google Scholar] [CrossRef] [Green Version]
  23. Abdelrahman, L.; Al Ghamdi, M.; Collado-Mesa, F.; Abdel-Mottaleb, M. Convolutional neural networks for breast cancer detection in mammography: A survey. Comput. Biol. Med. 2021, 131, 104248. [Google Scholar] [CrossRef]
  24. Timp, S.; Varela, C.; Karssemeijer, N. Computer-aided diagnosis with temporal analysis to improve radiologists’ interpretation of mammographic mass lesions. IEEE Trans. Inf. Technol. Biomed. 2010, 14, 803–808. [Google Scholar] [CrossRef]
  25. Gelig Thurfjell, M.; Vitak, B.; Azavedo, E.; Svane, G.; Thurfjell, E. Effect on sensitivity and specificity of mammography screening with or without comparison of old mammograms. Acta Radiol. 2000, 41, 52–56. [Google Scholar] [CrossRef]
  26. Varela, C.; Karssemeijer, N.; Hendriks, J.H.; Holland, R. Use of prior mammograms in the classification of benign and malignant masses. Eur. J. Radiol. 2005, 56, 248–255. [Google Scholar] [CrossRef] [PubMed]
  27. Hadjiiski, L.; Sahiner, B.; Helvie, M.A.; Chan, H.P.; Roubidoux, M.A.; Paramagul, C.; Blane, C.; Petrick, N.; Bailey, J.; Klein, K.; et al. Breast masses: Computer-aided diagnosis with serial mammograms. Radiology 2006, 240, 343–356. [Google Scholar] [CrossRef] [PubMed]
  28. Marias, K.; Behrenbruch, C.; Parbhoo, S.; Seifalian, A.; Brady, M. A registration framework for the comparison of mammogram sequences. IEEE Trans. Med. Imaging 2005, 24, 782–790. [Google Scholar] [CrossRef] [PubMed]
  29. Zitova, B.; Flusser, J. Image registration methods: A survey. Image Vis. Comput. 2003, 21, 977–1000. [Google Scholar] [CrossRef] [Green Version]
  30. Guo, Y.; Sivaramakrishna, R.; Lu, C.C.; Suri, J.S.; Laxminarayan, S. Breast image registration techniques: A survey. Med. Biol. Eng. Comput. 2006, 44, 15–26. [Google Scholar] [CrossRef]
  31. Oliveira, F.P.; Tavares, J.M.R. Medical image registration: A review. Comput. Methods Biomech. Biomed. Eng. 2014, 17, 73–93. [Google Scholar] [CrossRef]
  32. Díez, Y.; Oliver, A.; Lladó, X.; Martí, R. Comparison of registration methods using mamographic images. In Proceedings of the 2010 IEEE International Conference on Image Processing, Hong Kong, China, 26–29 September 2010; pp. 4421–4424. [Google Scholar]
  33. Rueckert, D.; Sonoda, L.I.; Hayes, C.; Hill, D.L.; Leach, M.O.; Hawkes, D.J. Nonrigid registration using free-form deformations: Application to breast MR images. IEEE Trans. Med. Imaging 1999, 18, 712–721. [Google Scholar] [CrossRef]
  34. Arsigny, V.; Pennec, X.; Ayache, N. Polyrigid and polyaffine transformations: A novel geometrical tool to deal with non-rigid deformations–application to the registration of histological slices. Med. Image Anal. 2005, 9, 507–523. [Google Scholar] [CrossRef]
  35. Thirion, J.P. Image matching as a diffusion process: An analogy with Maxwell’s demons. Med. Image Anal. 1998, 2, 243–260. [Google Scholar] [CrossRef]
  36. van Engeland, S.; Snoeren, P.; Hendriks, J.; Karssemeijer, N. A comparison of methods for mammogram registration. IEEE Trans. Med. Imaging 2003, 22, 1436–1444. [Google Scholar] [CrossRef]
  37. Vujovic, N.; Brzakovic, D. Establishing the correspondence between control points in pairs of mammographic images. IEEE Trans. Image Process. 1997, 6, 1388–1399. [Google Scholar] [CrossRef] [Green Version]
  38. Marti, R.; Zwiggelaar, R.; Rubin, C. Automatic mammographic registration: Towards the detection of abnormalities. In Proceedings of the S T1U Conference on Medical Image Understanding and Analysis, Birmingham, UK, 16–17 July 2001; pp. 149–152. [Google Scholar]
  39. Sanjay-Gopal, S.; Chan, H.P.; Wilson, T.; Helvie, M.; Petrick, N.; Sahiner, B. A regional registration technique for automated interval change analysis of breast lesions on mammograms. Med. Phys. 1999, 26, 2669–2679. [Google Scholar] [CrossRef]
  40. Filev, P.; Hadjiiski, L.; Chan, H.P.; Sahiner, B.; Ge, J.; Helvie, M.A.; Roubidoux, M.; Zhou, C. Automated regional registration and characterization of corresponding microcalcification clusters on temporal pairs of mammograms for interval change analysis. Med. Phys. 2008, 35, 5340–5350. [Google Scholar] [CrossRef] [Green Version]
  41. Ma, F.; Yu, L.; Bajger, M.; Bottema, M.J. Incorporation of fuzzy spatial relation in temporal mammogram registration. Fuzzy Sets Syst. 2015, 279, 87–100. [Google Scholar] [CrossRef]
  42. Wirth, M.A.; Narhan, J.; Gray, D.W. Nonrigid mammogram registration using mutual information. In Proceedings of the Medical Imaging 2002: Image Processing, San Diego, CA, USA, 24–28 February 2002; International Society for Optics and Photonics: Bellingham, WA, USA, 2002; Volume 4684, pp. 562–573. [Google Scholar]
  43. Timp, S.; Karssemeijer, N. Interval change analysis to improve computer aided detection in mammography. Med. Image Anal. 2006, 10, 82–95. [Google Scholar] [CrossRef]
  44. Li, C.; Chen, Z.; Zhang, H. Multi-Individual Mammographic Image Registration Based on Global-Local Integrated Transformations. In Proceedings of the 2018 IEEE 9th International Conference on Software Engineering and Service Science (ICSESS), Beijing, China, 23–25 November 2018; pp. 983–986. [Google Scholar]
  45. Abdel-Nasser, M.; Moreno, A.; Puig, D. Temporal mammogram image registration using optimized curvilinear coordinates. Comput. Methods Programs Biomed. 2016, 127, 1–14. [Google Scholar] [CrossRef]
  46. M.N. Kumar, A.; M.N. Kumar, A.; S. Sheshadri, H. Computer Aided Detection of Clustered Microcalcification: A Survey. Curr. Med. Imaging 2019, 15, 132–149. [Google Scholar] [CrossRef]
  47. Mendel, K.; Li, H.; Tayob, N.; El-Zein, R.; Bedrosian, I.; Giger, M. Temporal mammographic registration for evaluation of architecture changes in cancer risk assessment. In Proceedings of the Medical Imaging 2019: Computer-Aided Diagnosis. International Society for Optics and Photonics, San Diego, CA, USA, 17–20 February 2019; Volume 10950, p. 1095041. [Google Scholar]
  48. Sharma, M.K.; Jas, M.; Karale, V.; Sadhu, A.; Mukhopadhyay, S. Mammogram Segmentation using Multi-atlas Deformable Registration. Comput. Biol. Med. 2019, 110, 244–253. [Google Scholar] [CrossRef]
  49. Shanmugavadivu, P.; Sivakumar, V.; Sudhir, R. Fractal dimension-bound spatio-temporal analysis of digital mammograms. Eur. Phys. J. Spec. Top. 2016, 225, 137–146. [Google Scholar] [CrossRef]
  50. Zheng, B.; Good, W.F.; Armfield, D.R.; Cohen, C.; Hertzberg, T.; Sumkin, J.H.; Gur, D. Performance change of mammographic CAD schemes optimized with most-recent and prior image databases. Acad. Radiol. 2003, 10, 283–288. [Google Scholar] [CrossRef] [PubMed]
  51. Ma, F.; Yu, L.; Liu, G.; Niu, Q. Computer Aided Mass Detection in Mammography with temporal change analysis. Comput. Sci. Inf. Syst. 2015, 12, 1255–1272. [Google Scholar] [CrossRef]
  52. Zheng, Y.; Yang, C.; Merkulov, A. Breast cancer screening using convolutional neural network and follow-up digital mammography. In Proceedings of the Computational Imaging III, International Society for Optics and Photonics, Orlando, FL, USA; 2018; Volume 10669, p. 1066905. [Google Scholar]
  53. Kooi, T.; Karssemeijer, N. Classifying symmetrical differences and temporal change for the detection of malignant masses in mammography using deep neural networks. J. Med. Imaging 2017, 4, 044501. [Google Scholar] [CrossRef] [PubMed]
  54. Timp, S.; Varela, C.; Karssemeijer, N. Temporal change analysis for characterization of mass lesions in mammography. IEEE Trans. Med. Imaging 2007, 26, 945–953. [Google Scholar] [CrossRef] [PubMed]
  55. Bozek, J.; Kallenberg, M.; Grgic, M.; Karssemeijer, N. Use of volumetric features for temporal comparison of mass lesions in full field digital mammograms. Med. Phys. 2014, 41, 021902. [Google Scholar] [CrossRef]
  56. Hadjiiski, L.M.; Chan, H.P.; Sahiner, B.; Petrick, N.; Helvie, M.A.; Roubidoux, M.A.; Gurcan, M.N. Computer-aided characterization of malignant and benign microcalcification clusters based on the analysis of temporal change of mammographic features. In Proceedings of the Medical Imaging 2002: Image Processing SPIE, San Diego, CA, USA, 24–28 February 2002; Volume 4684, pp. 749–753. [Google Scholar]
  57. Loizidou, K.; Skouroumouni, G.; Nikolaou, C.; Pitris, C. An automated breast micro-calcification detection and classification technique using temporal subtraction of mammograms. IEEE Access 2020, 8, 52785–52795. [Google Scholar] [CrossRef]
  58. Loizidou, K.; Skouroumouni, G.; Pitris, C.; Nikolaou, C. Digital subtraction of temporally sequential mammograms for improved detection and classification of microcalcifications. Eur. Radiol. Exp. 2021, 5, 1–12. [Google Scholar] [CrossRef]
  59. Breast Micro-Calcifications Dataset with Precisely Annotated Sequential Mammograms|Zenodo, 2021. Available online: https://doi.org/10.5281/zenodo.5036062 (accessed on 20 September 2022).
  60. Loizidou, K.; Skouroumouni, G.; Nikolaou, C.; Pitris, C. Automatic Breast Mass Segmentation and Classification Using Subtraction of Temporally Sequential Digital Mammograms. IEEE J. Transl. Eng. Health Med. 2022, 10, 1–11. [Google Scholar] [CrossRef]
  61. Breast Masses Dataset with Precisely Annotated Sequential Mammograms|Zenodo, 2022. Available online: https://doi.org/10.5281/zenodo.7179856 (accessed on 13 October 2022).
  62. Loizidou, K.; Skouroumouni, G.; Savvidou, G.; Constantinidou, A.; Nikolaou, C.; Pitris, C. Identification and Classification of Benign and Malignant Masses based on Subtraction of Temporally Sequential Digital Mammograms. In Proceedings of the 2022 44th Annual International Conference of the IEEE Engineering in Medicine & Biology Society (EMBC), Glasgow, UK, 11–15 July 2022; pp. 1667–1670. [Google Scholar]
  63. PUB, M.H.; Bowyer, K.; Kopans, D.; Moore, R.; Kegelmeyer, P. The digital database for screening mammography. In Proceedings of the Third International Workshop on Digital Mammography, Chicago, IL, USA, 9–12 June 1996; Volume 58, p. 27. [Google Scholar]
  64. Suckling J, P. The mammographic image analysis society digital mammogram database. Digit. Mammo 1994, 375–386. [Google Scholar]
  65. Moreira, I.C.; Amaral, I.; Domingues, I.; Cardoso, A.; Cardoso, M.J.; Cardoso, J.S. Inbreast: Toward a full-field digital mammographic database. Acad. Radiol. 2012, 19, 236–248. [Google Scholar] [CrossRef] [Green Version]
  66. Lopez, M.G.; Posada, N.; Moura, D.C.; Pollán, R.R.; Valiente, J.M.F.; Ortega, C.S.; Solar, M.; Diaz-Herrero, G.; Ramos, I.; Loureiro, J.; et al. BCDR: A breast cancer digital repository. In Proceedings of the 15th International Conference on Experimental Mechanics, Porto, Portugal, 22–27 July 2012; Volume 1215. [Google Scholar]
  67. CBIS-DDSM—The Cancer Imaging Archive (TCIA) Public Access—Cancer Imaging Archive Wiki. 2021. Available online: https://wiki.cancerimagingarchive.net/display/Public/CBIS-DDSM (accessed on 27 January 2022).
  68. DoD BCRP Spiculated Mass Detection Evaluation Data. Available online: http://www.eng.usf.edu/cvprg/mammography/DDSM/BCRP/bcrp_mass_01.html (accessed on 27 January 2022).
  69. Halling-Brown, M.D.; Warren, L.M.; Ward, D.; Lewis, E.; Mackenzie, A.; Wallis, M.G.; Wilkinson, L.S.; Given-Wilson, R.M.; McAvinchey, R.; Young, K.C. OPTIMAM mammography image database: A large-scale resource of mammography images and clinical data. Radiol. Artif. Intell. 2020, 3, e200103. [Google Scholar] [CrossRef] [PubMed]
Figure 1. Examples of the four levels of density in mammograms, as defined by the BI-RADS: (A) a—almost entirely fatty; (B) b—scattered areas of fibroglandular density; (C) c—heterogeneously dense; (D) d—extremely dense.
Tomography 08 00241 g001
Figure 2. Example of three consecutive mammograms of the same woman. The last mammogram was from the time of referral. The other mammograms were obtained at previous screening rounds (reprint with permission from [24]).
Tomography 08 00241 g002
Figure 3. Proposed mammogram registration framework using optimized curvilinear coordinates (reprint with permission from [45]).
Tomography 08 00241 g003
Figure 4. Digital mammogram pairs. (a,b) Right CC (1051 × 1521 pixels) and MLO (1069 × 1746 pixels) views of the recent mammogram with a mass present and marked by a yellow rectangle. (c,d) Right CC and MLO from a prior exam 1 year earlier (not aligned yet), which was normal (reprint with permission from [52]).
Tomography 08 00241 g004
Figure 5. Pairs of temporally sequential mammograms. Right and left images correspond to current and prior views respectively. In each prior view, the arrow indicates the location selected by the regional registration program. (a) A case of a malignant mass that was not visible in the prior view. The registration program selected the most probable location in the prior view. (b) A case of a benign mass that was similar in the prior and current views. The registration program selected a region in the prior view that was similar to the current region (reprint with permission from [54]).
Tomography 08 00241 g005
Figure 6. Temporally sequential mammograms containing MC clusters. (a) Current and prior mammograms with automatically detected breast boundaries, (b) A close-up of the current and prior views of the MC cluster (reprint with permission from [40]).
Tomography 08 00241 g006
Figure 7. Initial estimation of the cluster centroid position in the prior mammogram based on the nipple-cluster distance and the angle between the nipple-cluster axis and breast periphery in the current mammogram (reprint with permission from [40]).
Tomography 08 00241 g007
Figure 8. Dataset example. (A) Mammographic view of a woman with benign and suspicious MCs. (B) Zoomed region marked by the red square in (A), showing the MCs. (C) The region in (B) with precise marking of the MC locations (indicated by the white arrow), as annotated by two expert radiologists (reprint with permission from [58]).
Tomography 08 00241 g008
Figure 9. Example of temporal subtraction (BI-RADS breast density category c) with a malignant mass. (A) Most recent mammogram. (B) Prior mammogram. (C) The result of subtracting the registered version of (B) from (A). (DF) Zoomed regions marked by the red squares in (AC), respectively. The green squares enclose a new malignant mass that was not subtracted (reprint with permission from [62]).
Tomography 08 00241 g009
Table 1. The state-of-the-art techniques for the registration of mammograms.
Registration
Category
ReferenceDetails
Globalvan Engeland et al. (2003) [36]joint probability intensity distribution
LocalVujovic and Brzakovic (1997) [37]
Sanjay-Gopal et al. (1999) [39]
Marti et al. (2001) [38]
Hadjiiski et al. (2001) [19]
Filev et al. (2008) [40]
Ma et al. (2015) [41]
modified monotony operator and accumulator matrix
associated information between regions
correspondence between linear structures
affine transformation and nonlinear optimization
corresponding local search
spatial relationships and graph matching
HybridWirth et al. (2002) [42]
Timp and Karssemeijer (2006) [43]
Abdel-Nasser et al. (2016) [45]
Li et al. (2018) [44]
Sharma et al. (2019) [48]
Mendel et al. (2019) [47]
similarity and point-based spatial transformation
center of mass alignment and feature space mapping
curvilinear coordinates; global/local deformations
global coarse and local fine registration
data-driven clustering and deformable registration
B-splines and multi-resolution registration
Table 2. Comparison of algorithms for the detection of masses in sequential mammograms using temporal analysis and feature-based machine learning.
ReferenceDatabaseType of
Images
DatasetClassifierValidation MethodResult: ACC (%)Result:
SEN/SPEC (%)
Result: AUCResult: Other
Zheng et al. (2003) [50]RestrictedDigitized134 pairsANN75–25%
(per image)
--0.89 temporal
0.68 single
-
Timp and Karssemeijer (2006) [43]RestrictedDigitized2873 pairsANN10-fold CV
(per patient)
--0.72 temporal
0.71 single
-
Ma et al. (2015) [51]RestrictedDigitized95 pairsSMV
LDA
5-fold CV
(per ???)
--0.9 temporal
0.88 single
-
Table 3. Comparison of algorithms for the detection of masses in sequential mammograms using temporal analysis and deep learning.
ReferenceDatabaseType of
Images
DatasetData AugmentationClassifierValidation MethodResult: ACC (%)Result:
SEN/SPEC (%)
Result: AUCResult: Other
Kooi and Karssemeijer
(2017) [53]
RestrictedDigital18366 pairsYESCNN
(shallow gradient
boosted tree)
16-fold CV
(per patient)
--0.88 temporal
0.87 single
-
Zheng et al. (2018) [52]RestrictedDigital96 pairsNOCNN
(VGG-19)
10 × 75–25%
(per image)
-92.8/99.1-0.004 FPi
Table 4. Comparison of algorithms for the classification of masses in sequential mammograms using temporal analysis and feature-based machine learning.
ReferenceDatabaseType of
Images
DatasetClassifierValidation MethodResult: ACC (%)Result:
SEN/SPEC (%)
Result: AUCResult: Other
Hadjiiski et al. (2001) [19]RestrictedDigitized140 pairsLDAleave-one-out
(per patient)
--0.88 temporal
0.82 single
-
Timp et al. (2007) [54]RestrictedDigitized465 pairsSVM20-fold CV
(per ???)
--0.77 temporal
0.74 single
-
Bozek et al. (2014) [55]RestrictedDigital60 pairsLDAleave-one-out
CV (per ???)
--0.90 temporal
0.77 single
-
Table 5. Comparison of algorithms for the diagnosis of MCs in sequential mammograms using temporal analysis and feature-based machine learning.
ReferenceDatabaseType of
Images
DatasetClassifierValidation MethodResult: ACC (%)Result:
SEN/SPEC (%)
Result: AUCResult: Other
Detection
Filev et al. (2008) [40]RestrictedDigitized261 pairsLDAleave-one-out
(per patient)
91.2--0.72 FPs per image
Classification
Hadjiiski et al. (2002) [56]RestrictedDigitized65 pairsLDAleave-one-out
(per patient)
--0.87 temporal
0.81 single
-
Filev et al. (2008) [40]RestrictedDigitized261 pairsLDAleave-one-out
(per patient)
--0.81 temporal
0.72 single
-
Table 6. Comparison of algorithms for the diagnosis of MCs in sequential mammograms using temporal subtraction and feature-based machine learning.
ReferenceDatabaseType of
Images
DatasetClassifierValidation MethodResult: ACC (%)Result:
SEN/SPEC (%)
Result: AUCResult: Other
Detection
Loizidou et al. (2021) [58]Open accessDigital100 pairsVotingleave-one-out
(per patient)
94.181.4/95.50.88-
Classification
Loizidou et al. (2021) [58]Open accessDigital100 pairsANNleave-one-out
(per patient)
90.381.6/92.20.87-
Table 7. Comparison of algorithms for the diagnosis of masses in sequential mammograms using temporal subtraction and feature-based machine learning.
ReferenceDatabaseType of
Images
DatasetClassifierValidation MethodResult: ACC (%)Result:
SEN/SPEC (%)
Result: AUCResult: Other
Detection
Loizidou et al. (2022) [60]Open accessDigital80 pairsANNleave-one-out
(per patient)
99.996.6/99.90.98-
Classification
Loizidou et al. (2022) [60]Open accessDigital80 pairsANNleave-one-out
(per patient)
9899/96.10.98-
Table 8. Comparison of the most commonly used open-access mammography datasets.
NameOriginYearFile
Access
Number
of Cases
Number
of Images
Resolution
(bits/pixel)
Image
Mode
Type of
Abnormality
Image
Categories
Annotation
DDSM [63]USA1999Open2620104808 or 16DigitizedALLNormal
Benign
Malignant
Contour points
of the ROI
MIAS [64]UK2003Open1613228DigitizedALLNormal
Benign
Malignant
Center and radius
of a circle around ROI
INbreast [65]Portugal2011Approval
from authors
11541014DigitalMasses
Calcifications
Distortions
Asymmetries
Normal
Benign
Malignant
Contour points
of the ROI
BCDR-FM [66]Portugal2012Open (requires
registration)
112537038DigitizedALLNormal
Cancer
Precise lesion
locations and mass
coordinates, detailed
segmentation outlines
BCDR-DM [66]Portugal2012Open (requires
registration)
1042361214DigitalALLNormal
Cancer
Precise lesion
locations and mass
coordinates, detailed
segmentation outlines
CBIS-DDSM [67]USA2017Open1566102398 or 16DigitizedMass
Calcifications
Benign
Malignant
ROI segmentation
and bounding boxes
DDSM-BCRP [68]USA2000Open17971612DigitizedMasses
Calcifications
Benign
Malignant
Contour points
of the ROI
OPTIMAM [69]UK2020Approval
from authors
-288931212 or 16DigitalALLNormal
Benign
Malignant
Rectangular around
the boundaries of the ROI
SDM-MCs [59]Cyprus2021Open10040012DigitalCalcificationsNormal
Benign
Suspicious
Precise annotation of each micro-calcification
SDM-Masses [61]Cyprus2022Open8032012DigitalMassesNormal
Benign
Malignant
Precise annotation
of each mass
Publisher’s Note: MDPI stays neutral with regard to jurisdictional claims in published maps and institutional affiliations.

