
Development of Self-Assembled Biomimetic Nanoscale Collagen-like Peptide-Based Scaffolds for Tissue Engineering: An In Silico and Laboratory Study


Abstract
:1. Introduction
2. Materials and Methods
2.1. Computational Methods
2.1.1. I-Tasser
2.1.2. Replica Exchange Molecular Dynamics of (PAH)10
2.1.3. Replica Exchange Molecular Dynamics of Composite Scaffold
2.2. Laboratory Studies
2.2.1. Materials
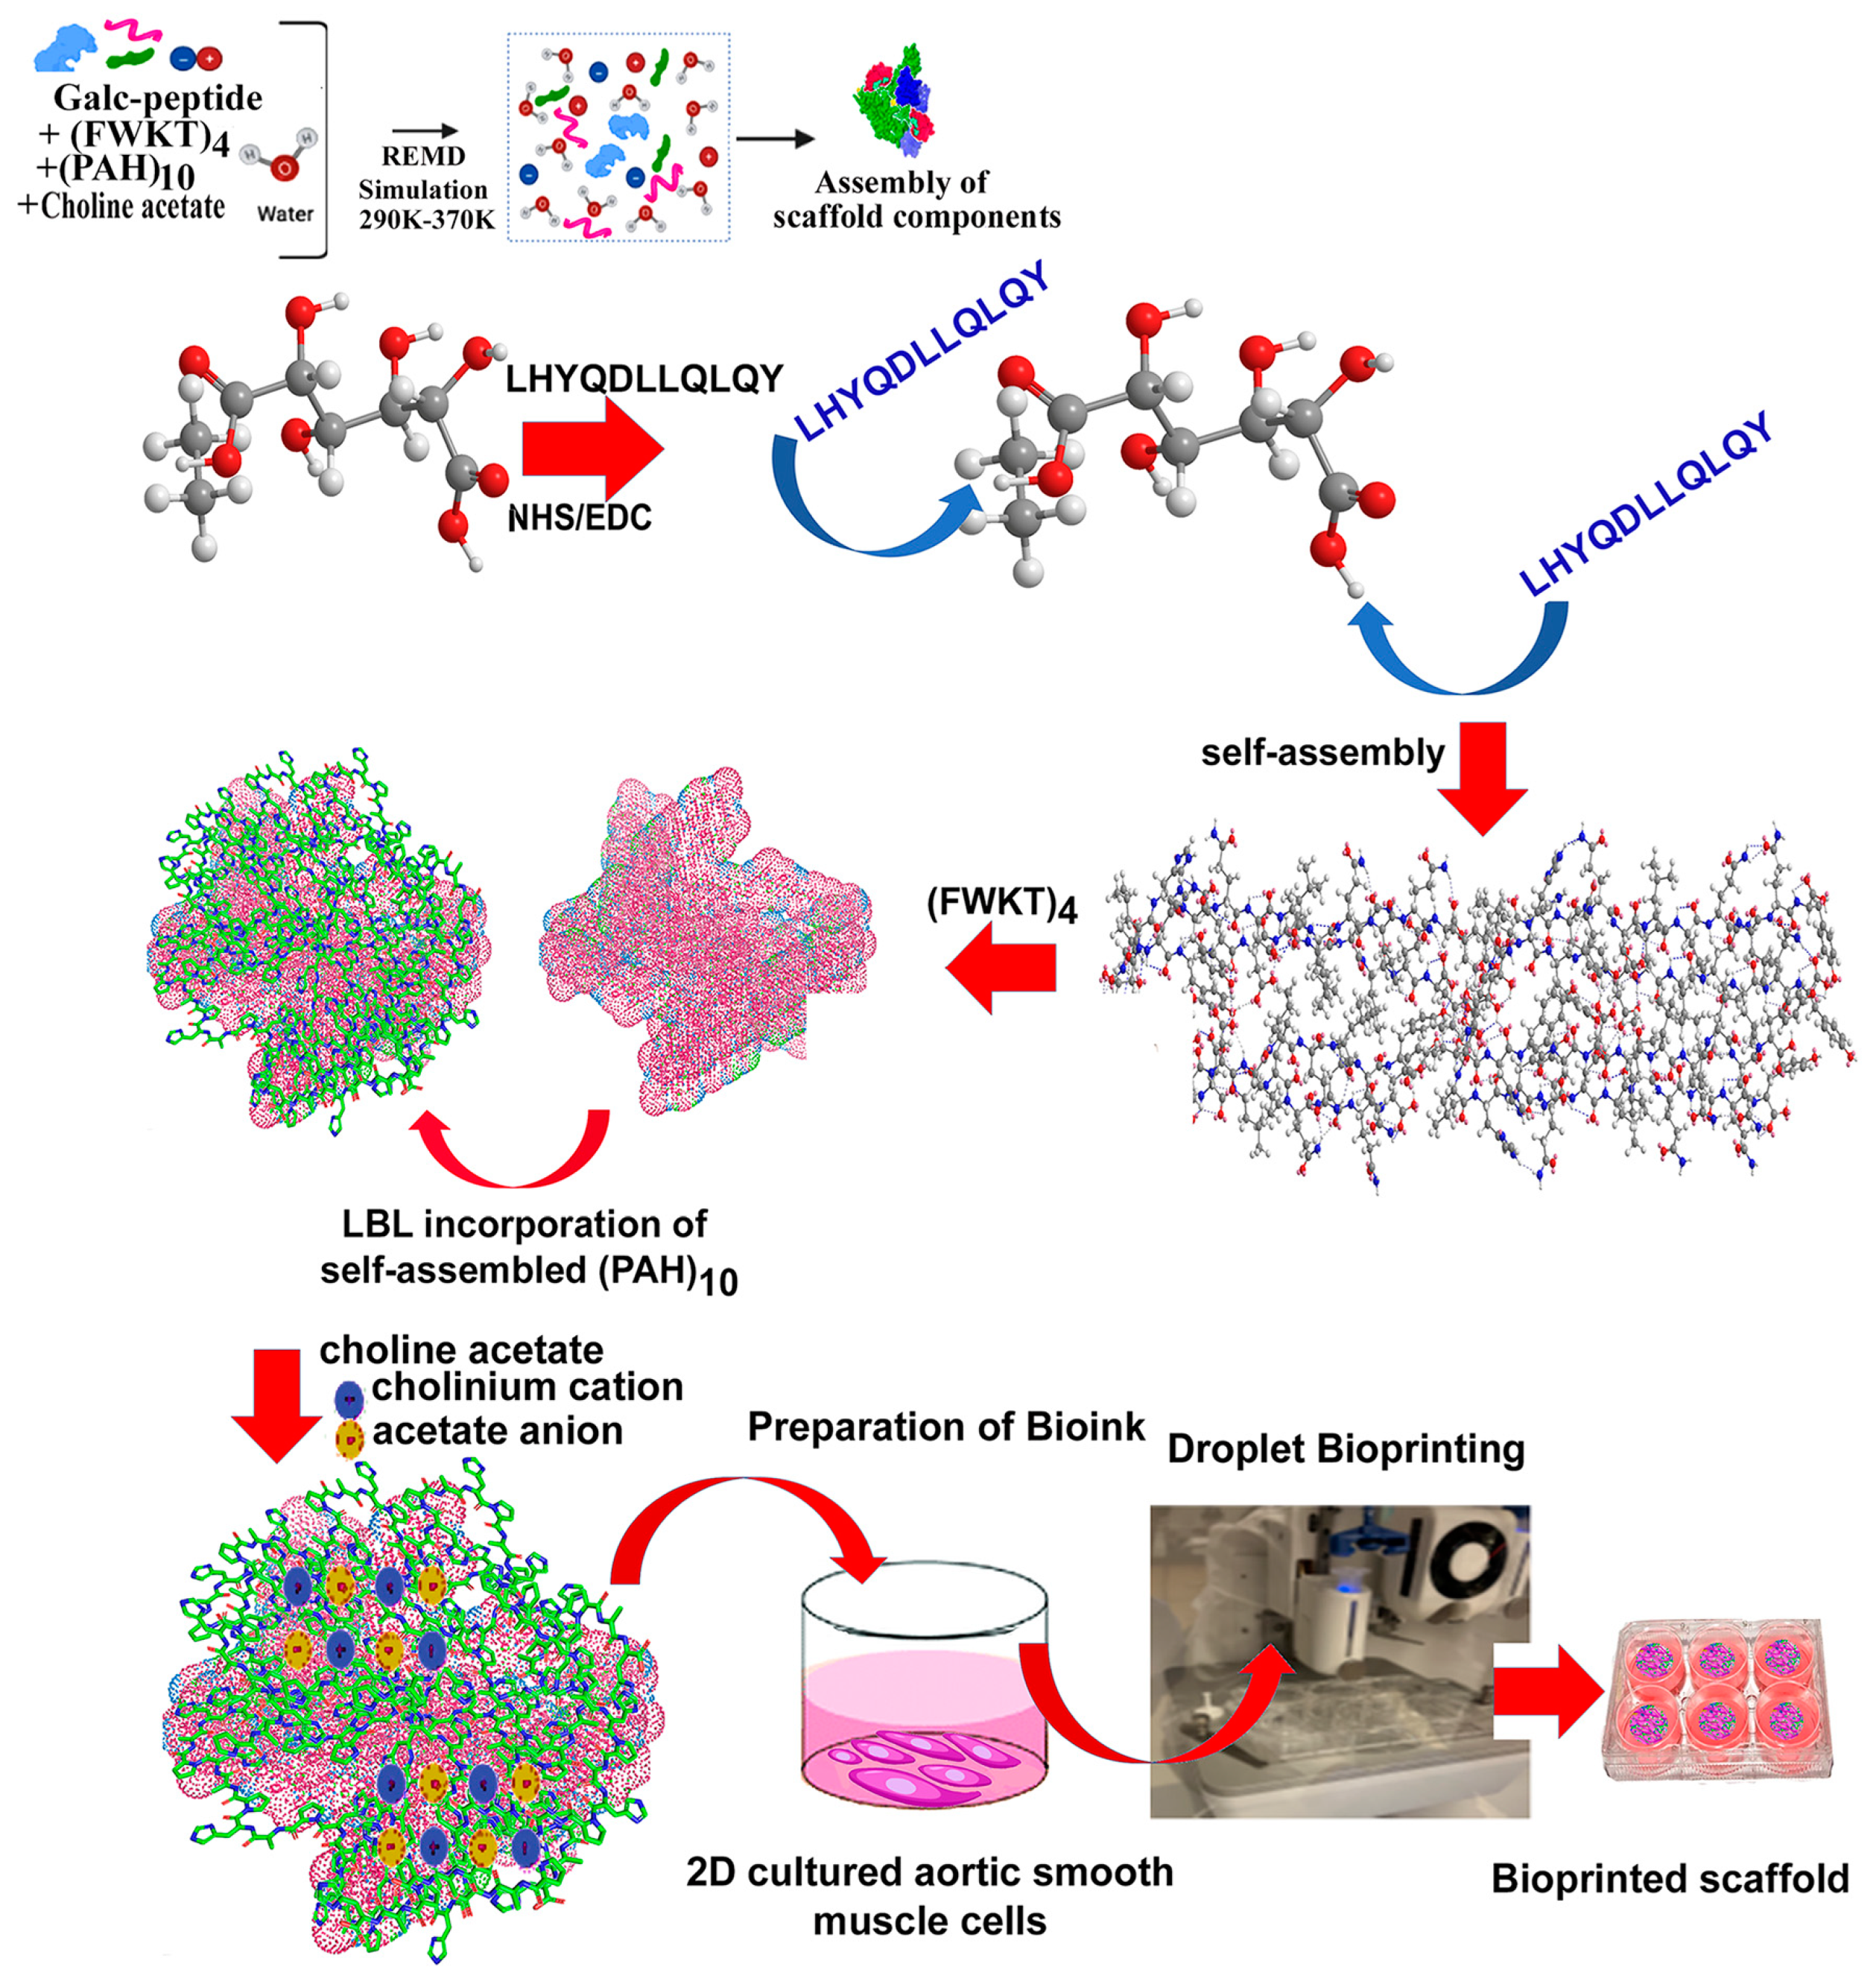
2.2.2. Preparation of Polysaccharide-Peptide Conjugate
2.2.3. Self-Assembly of Polysaccharide-Peptide Conjugate and Conjugation with (FWKT)4
2.2.4. Incorporation of (PAH)10 and Choline Acetate by Layer-by-Layer Assembly
2.3. Characterization
2.3.1. Circular Dichroism (CD) Spectroscopy
2.3.2. Differential Scanning Calorimetry (DSC)
2.3.3. Rheology
2.3.4. Scanning Electron Microscopy (SEM)
2.3.5. Atomic Force Microscope (AFM)
2.3.6. Fourier Transform Infrared (FTIR) Spectroscopy
2.3.7. Dynamic Light Scattering (DLS)
2.3.8. Fluorescence Microscopy
2.4. Cell Studies
2.4.1. D Cell Culture
2.4.2. Cytotoxicity Studies
2.4.3. DNA Quantification Assay
2.4.4. Bioprinting
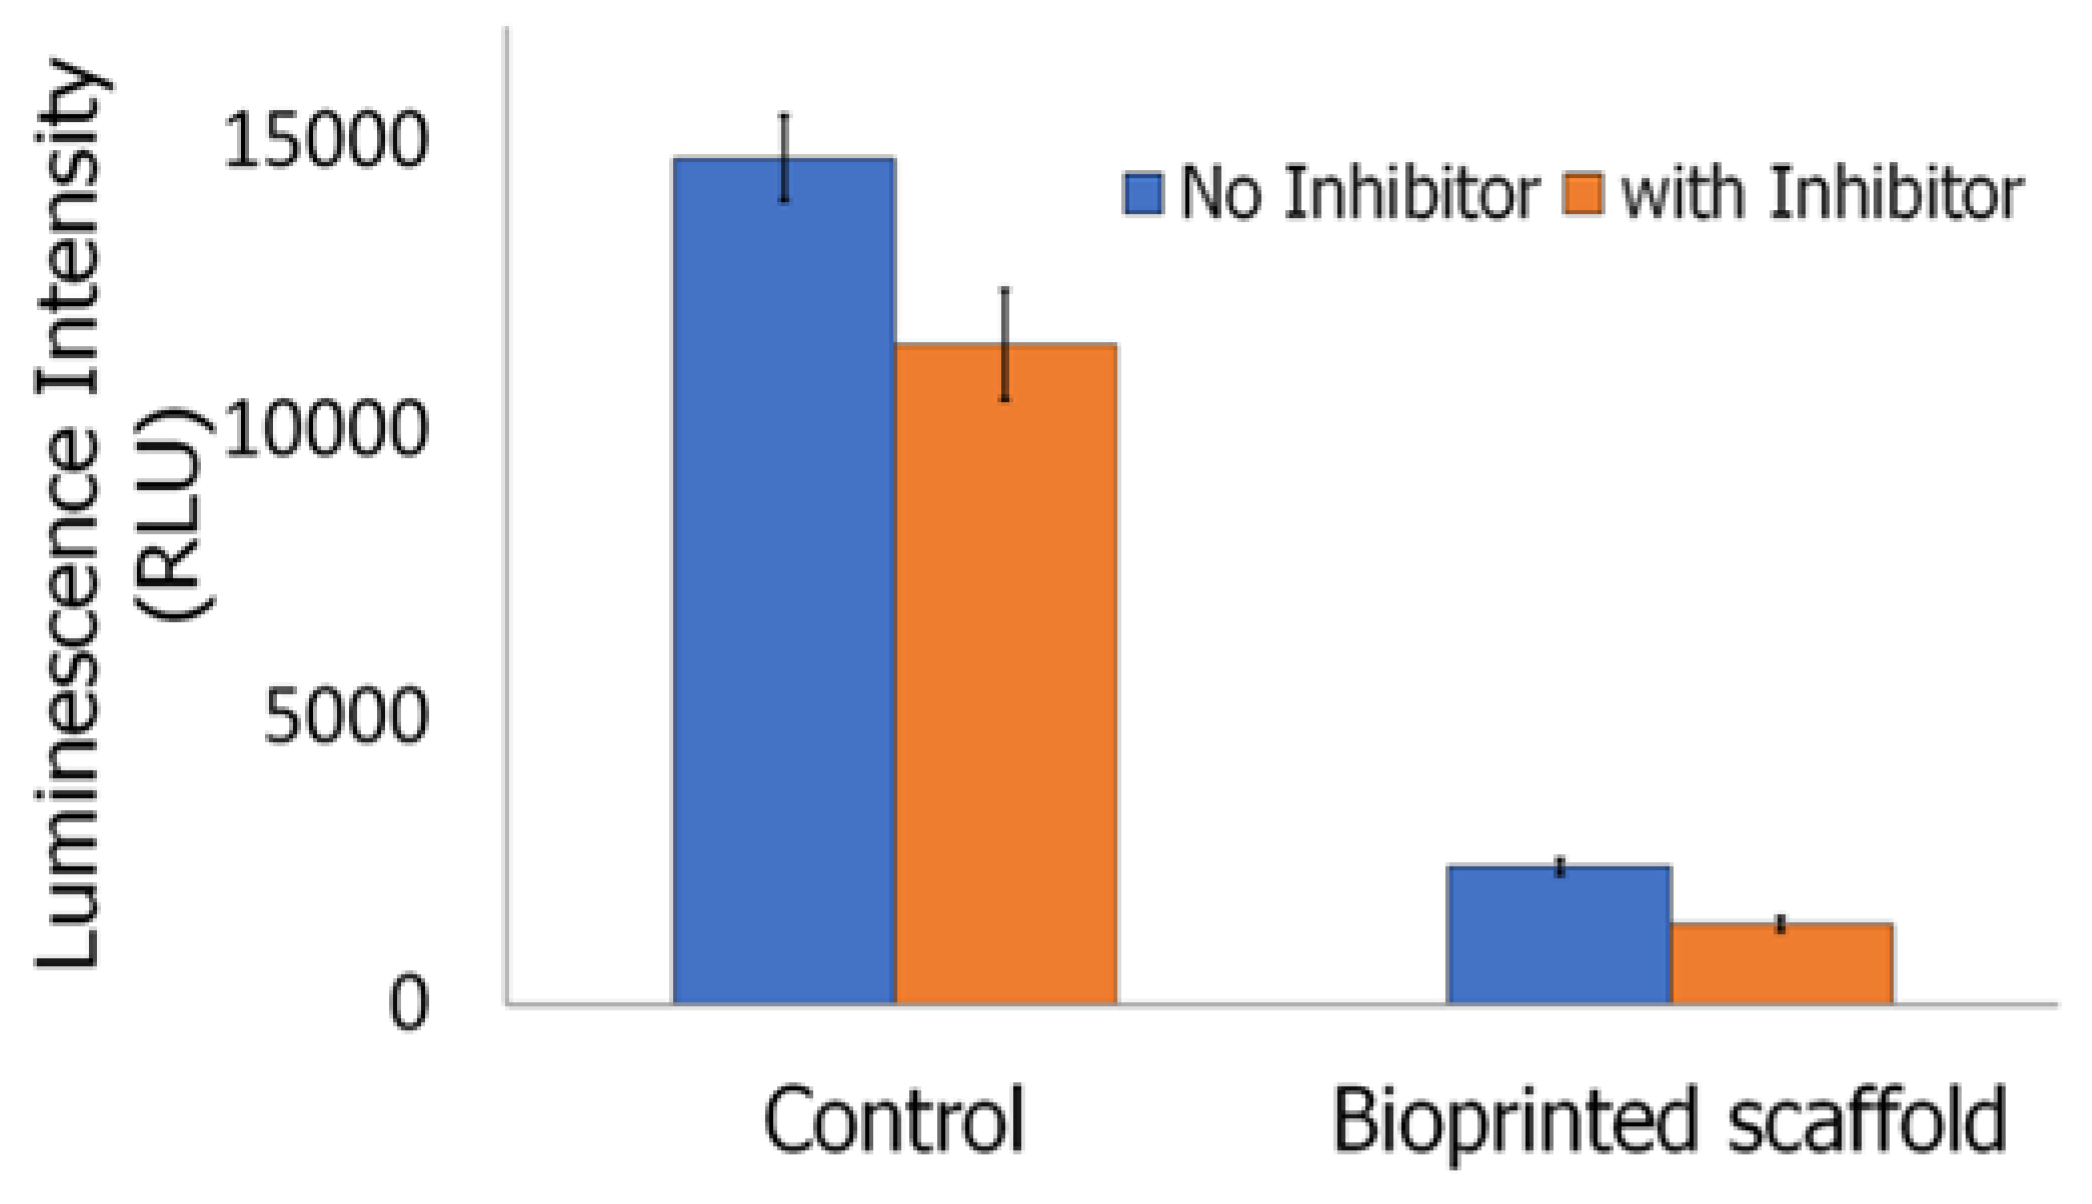
2.4.5. Inflammasome Assay
2.4.6. Cytoskeletal Studies
2.5. Statistical Analysis
3. Results and Discussion
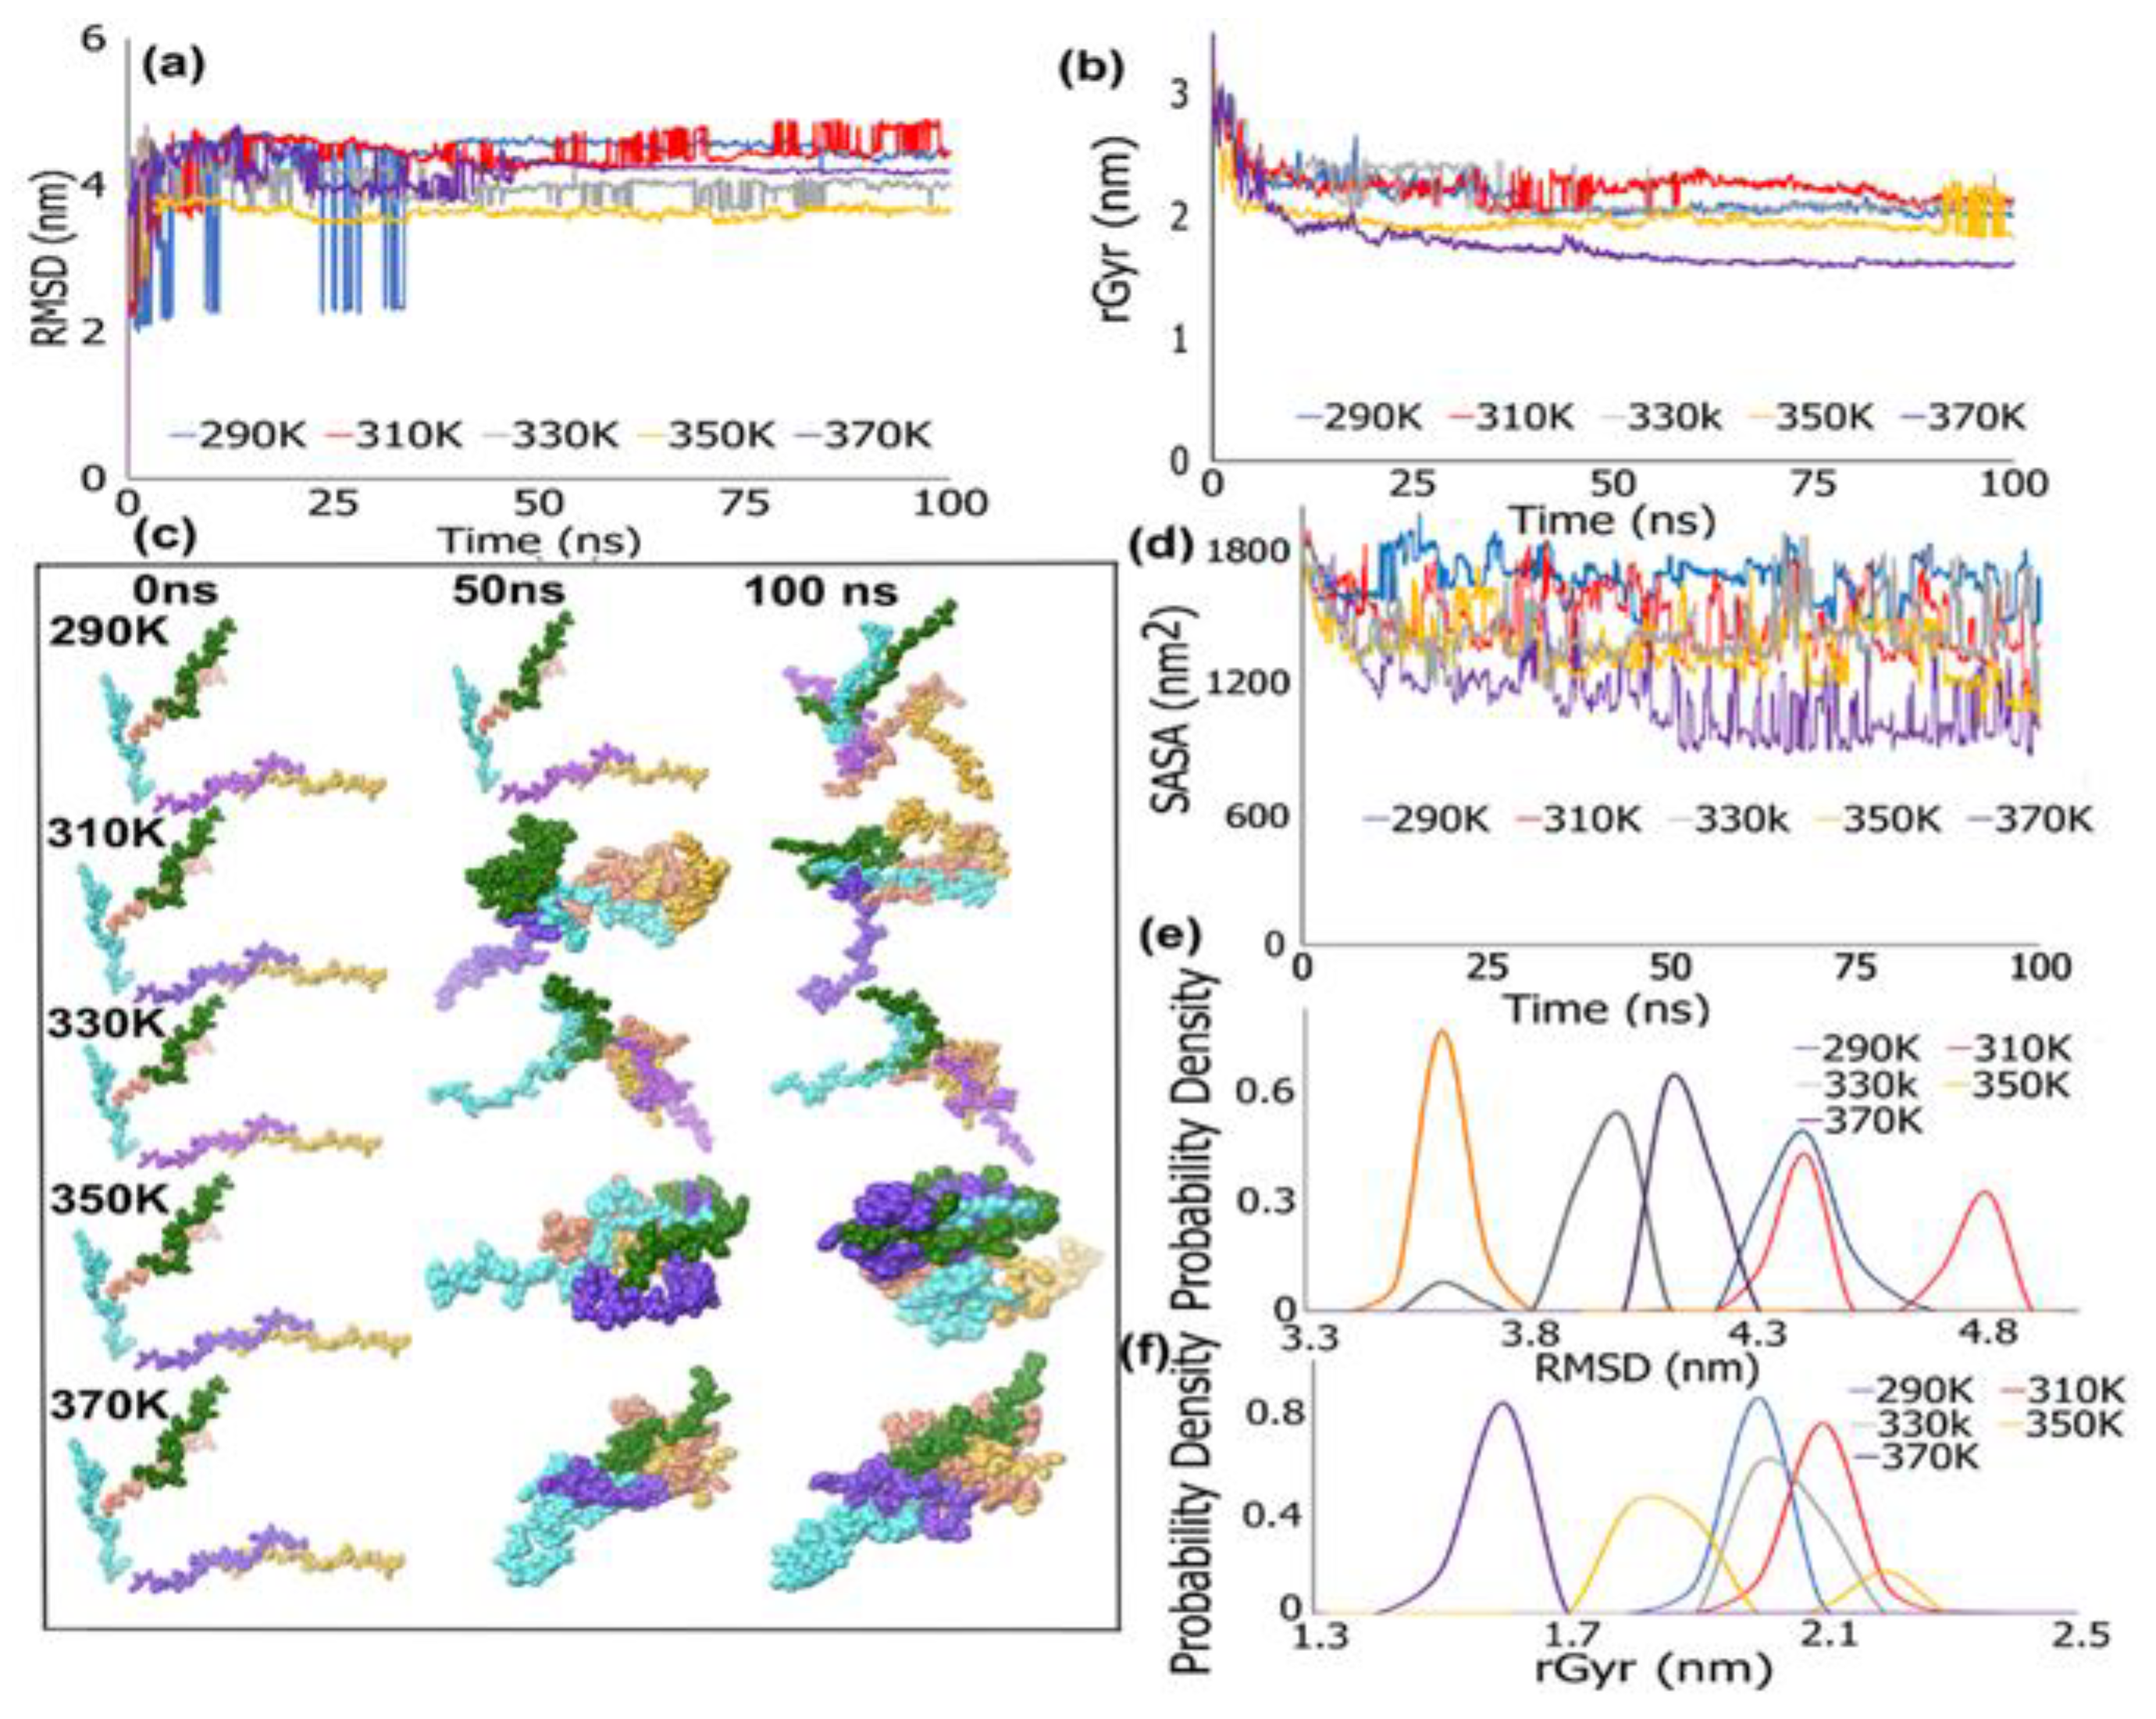
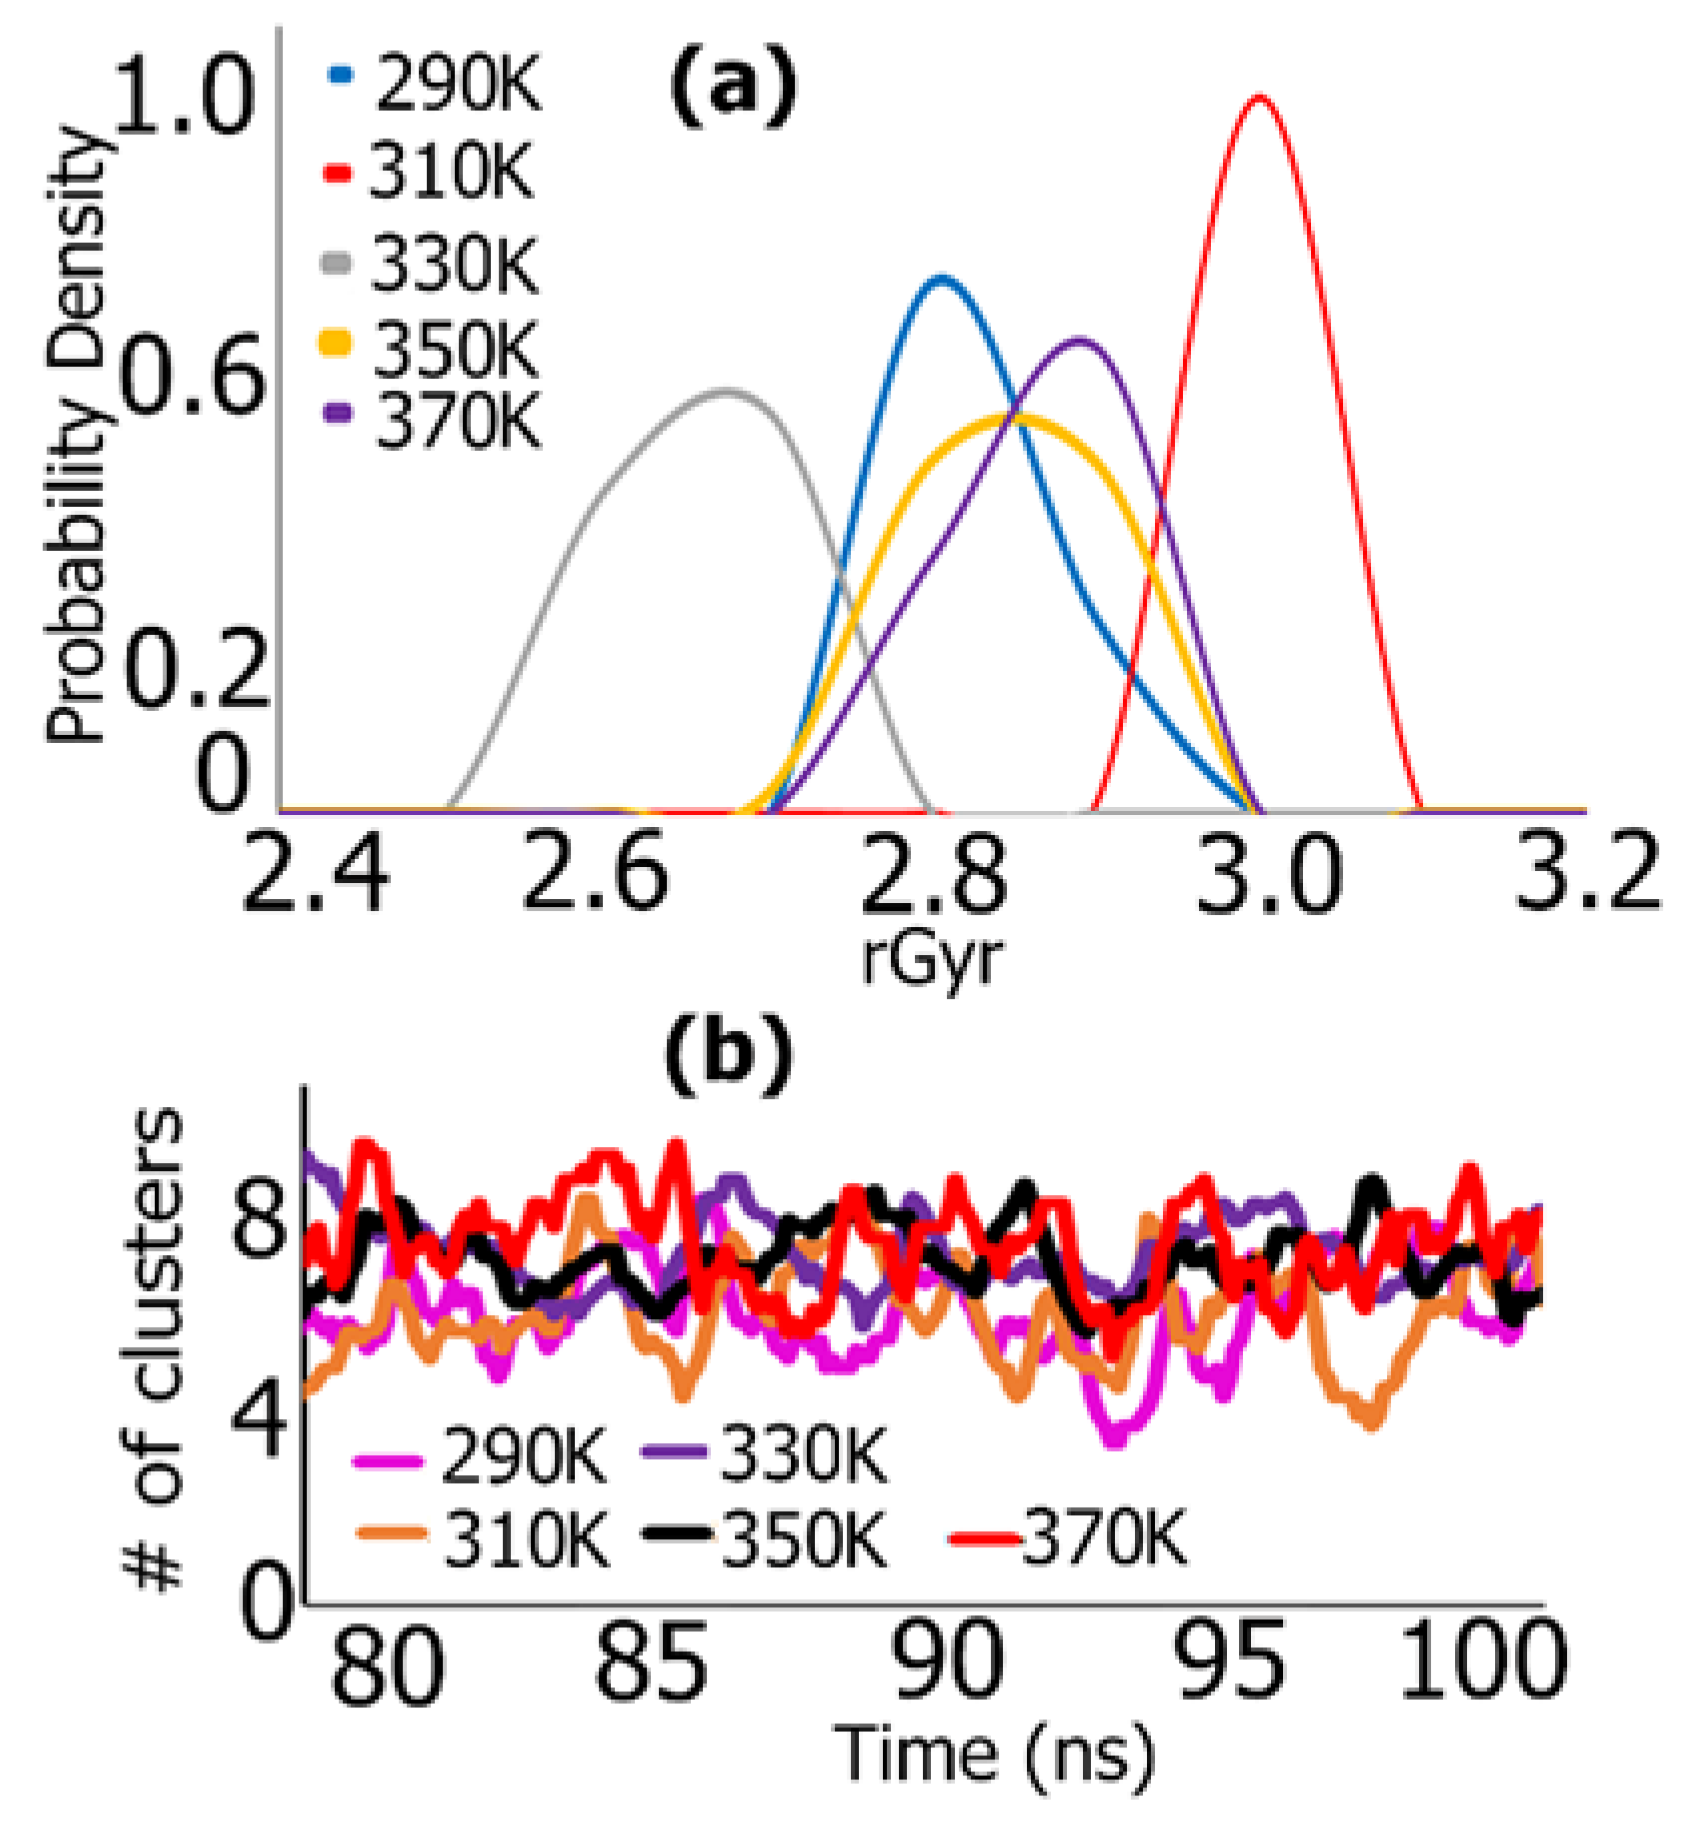
3.1. REMD Simulations for Self-Assembly (Pro-Ala-His)10
3.2. I-Tasser
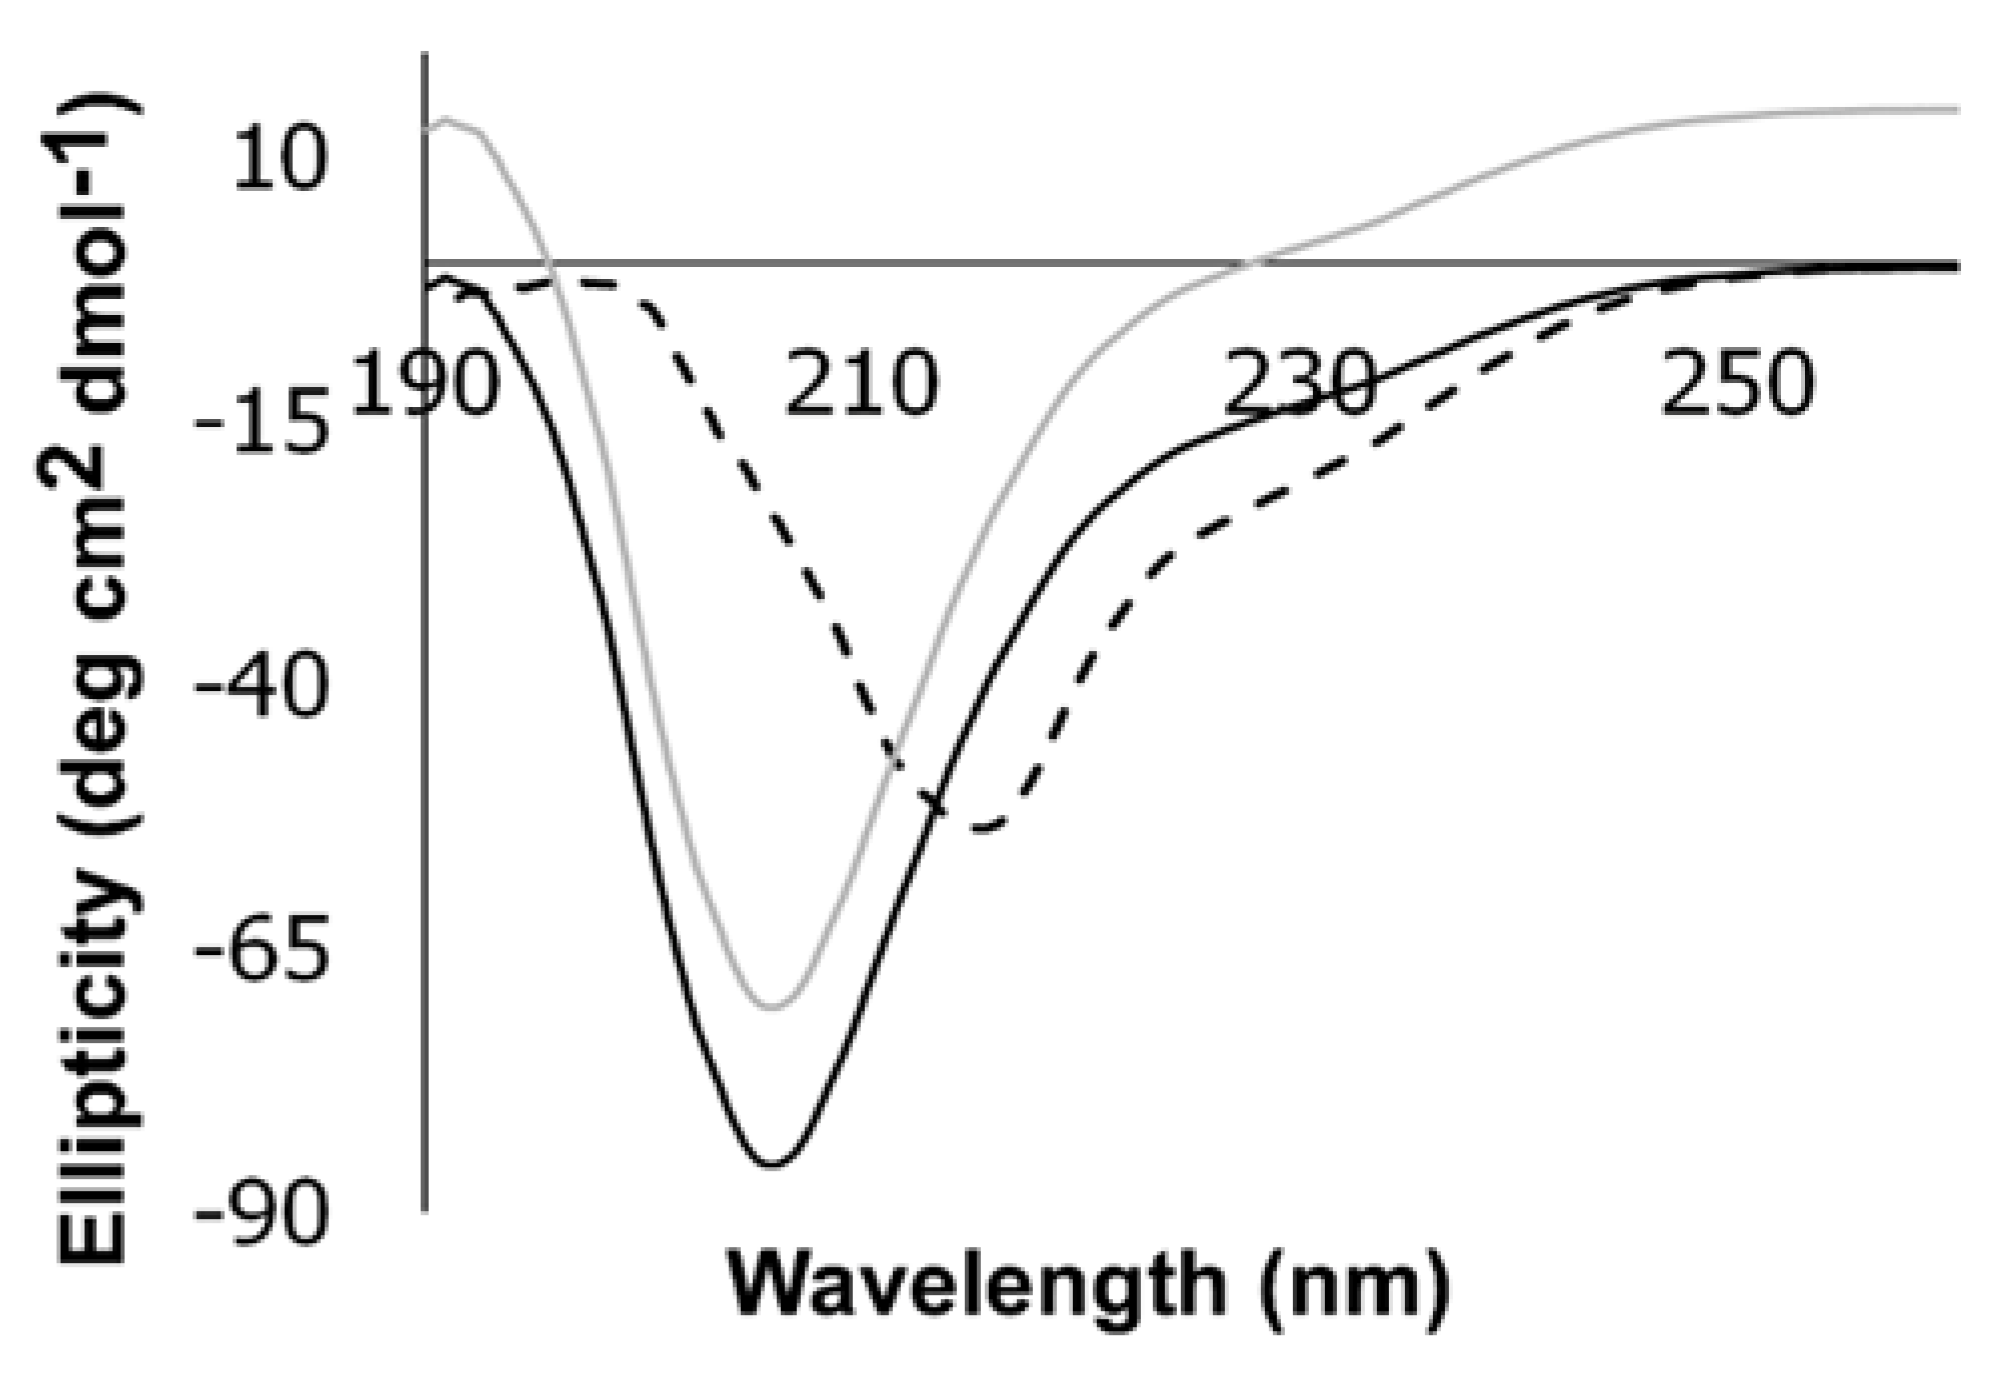
3.3. CD Studies
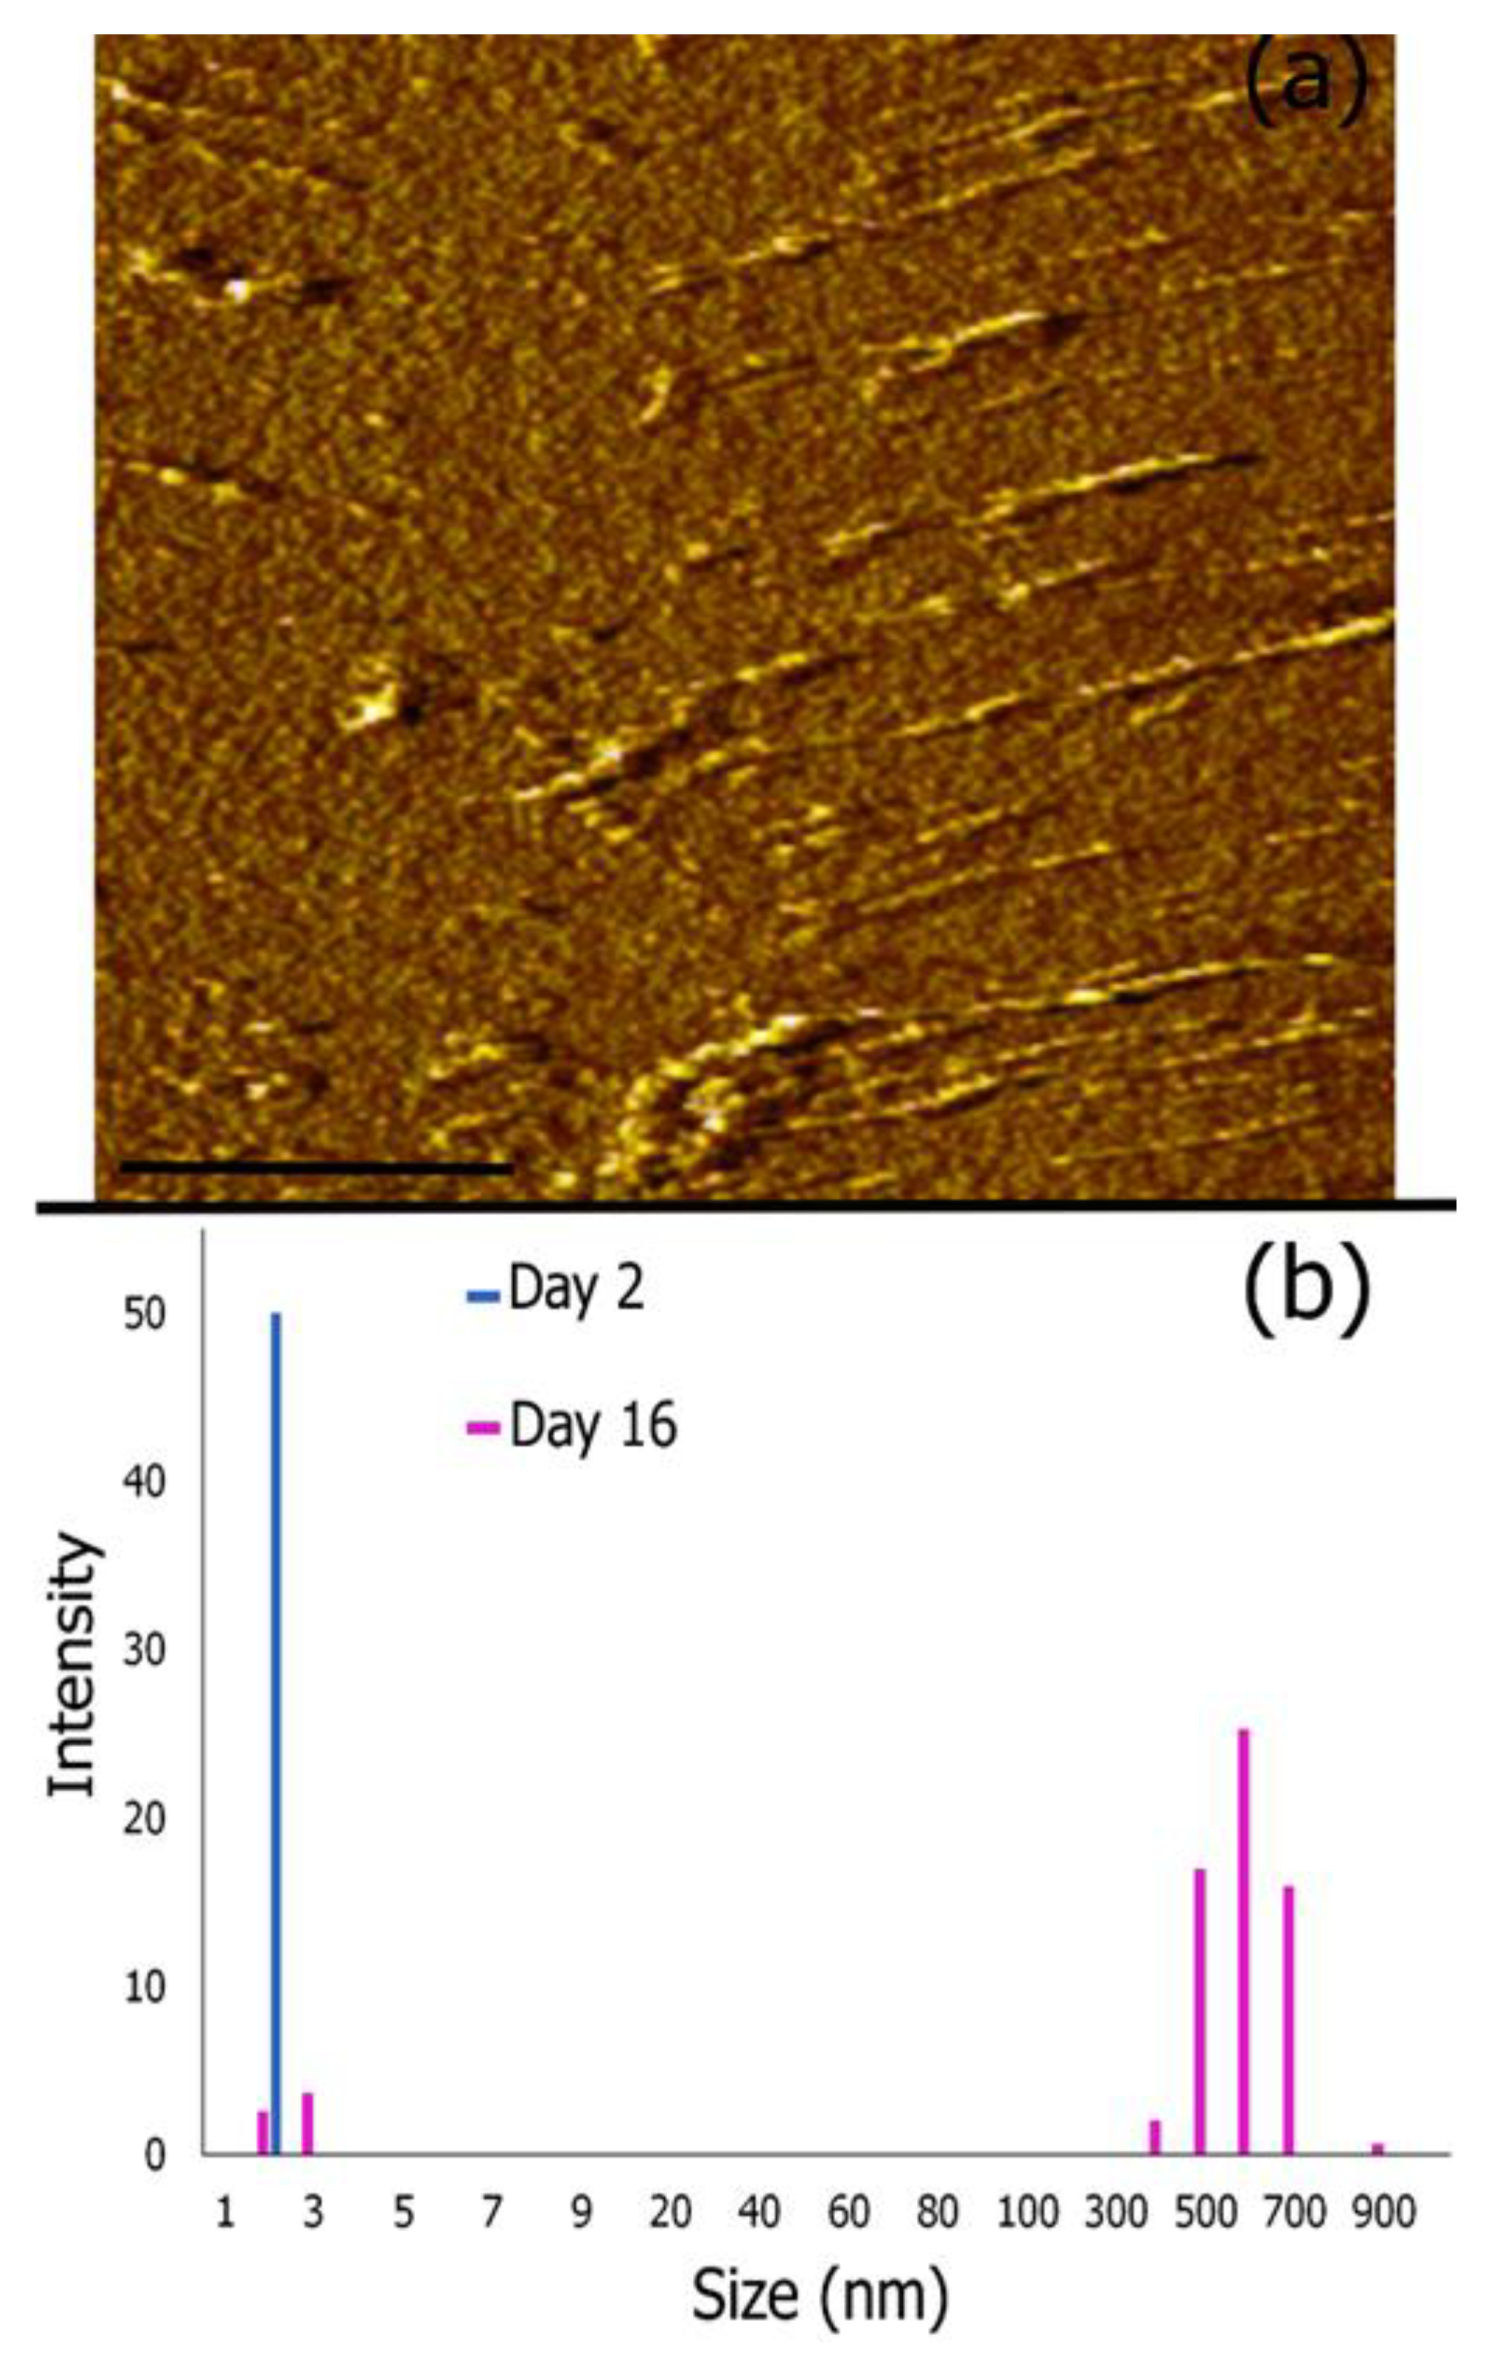
3.4. AFM Imaging and Dynamic Light Scattering Analysis
3.5. Formation of Multi-Layered Biomimetic Scaffold
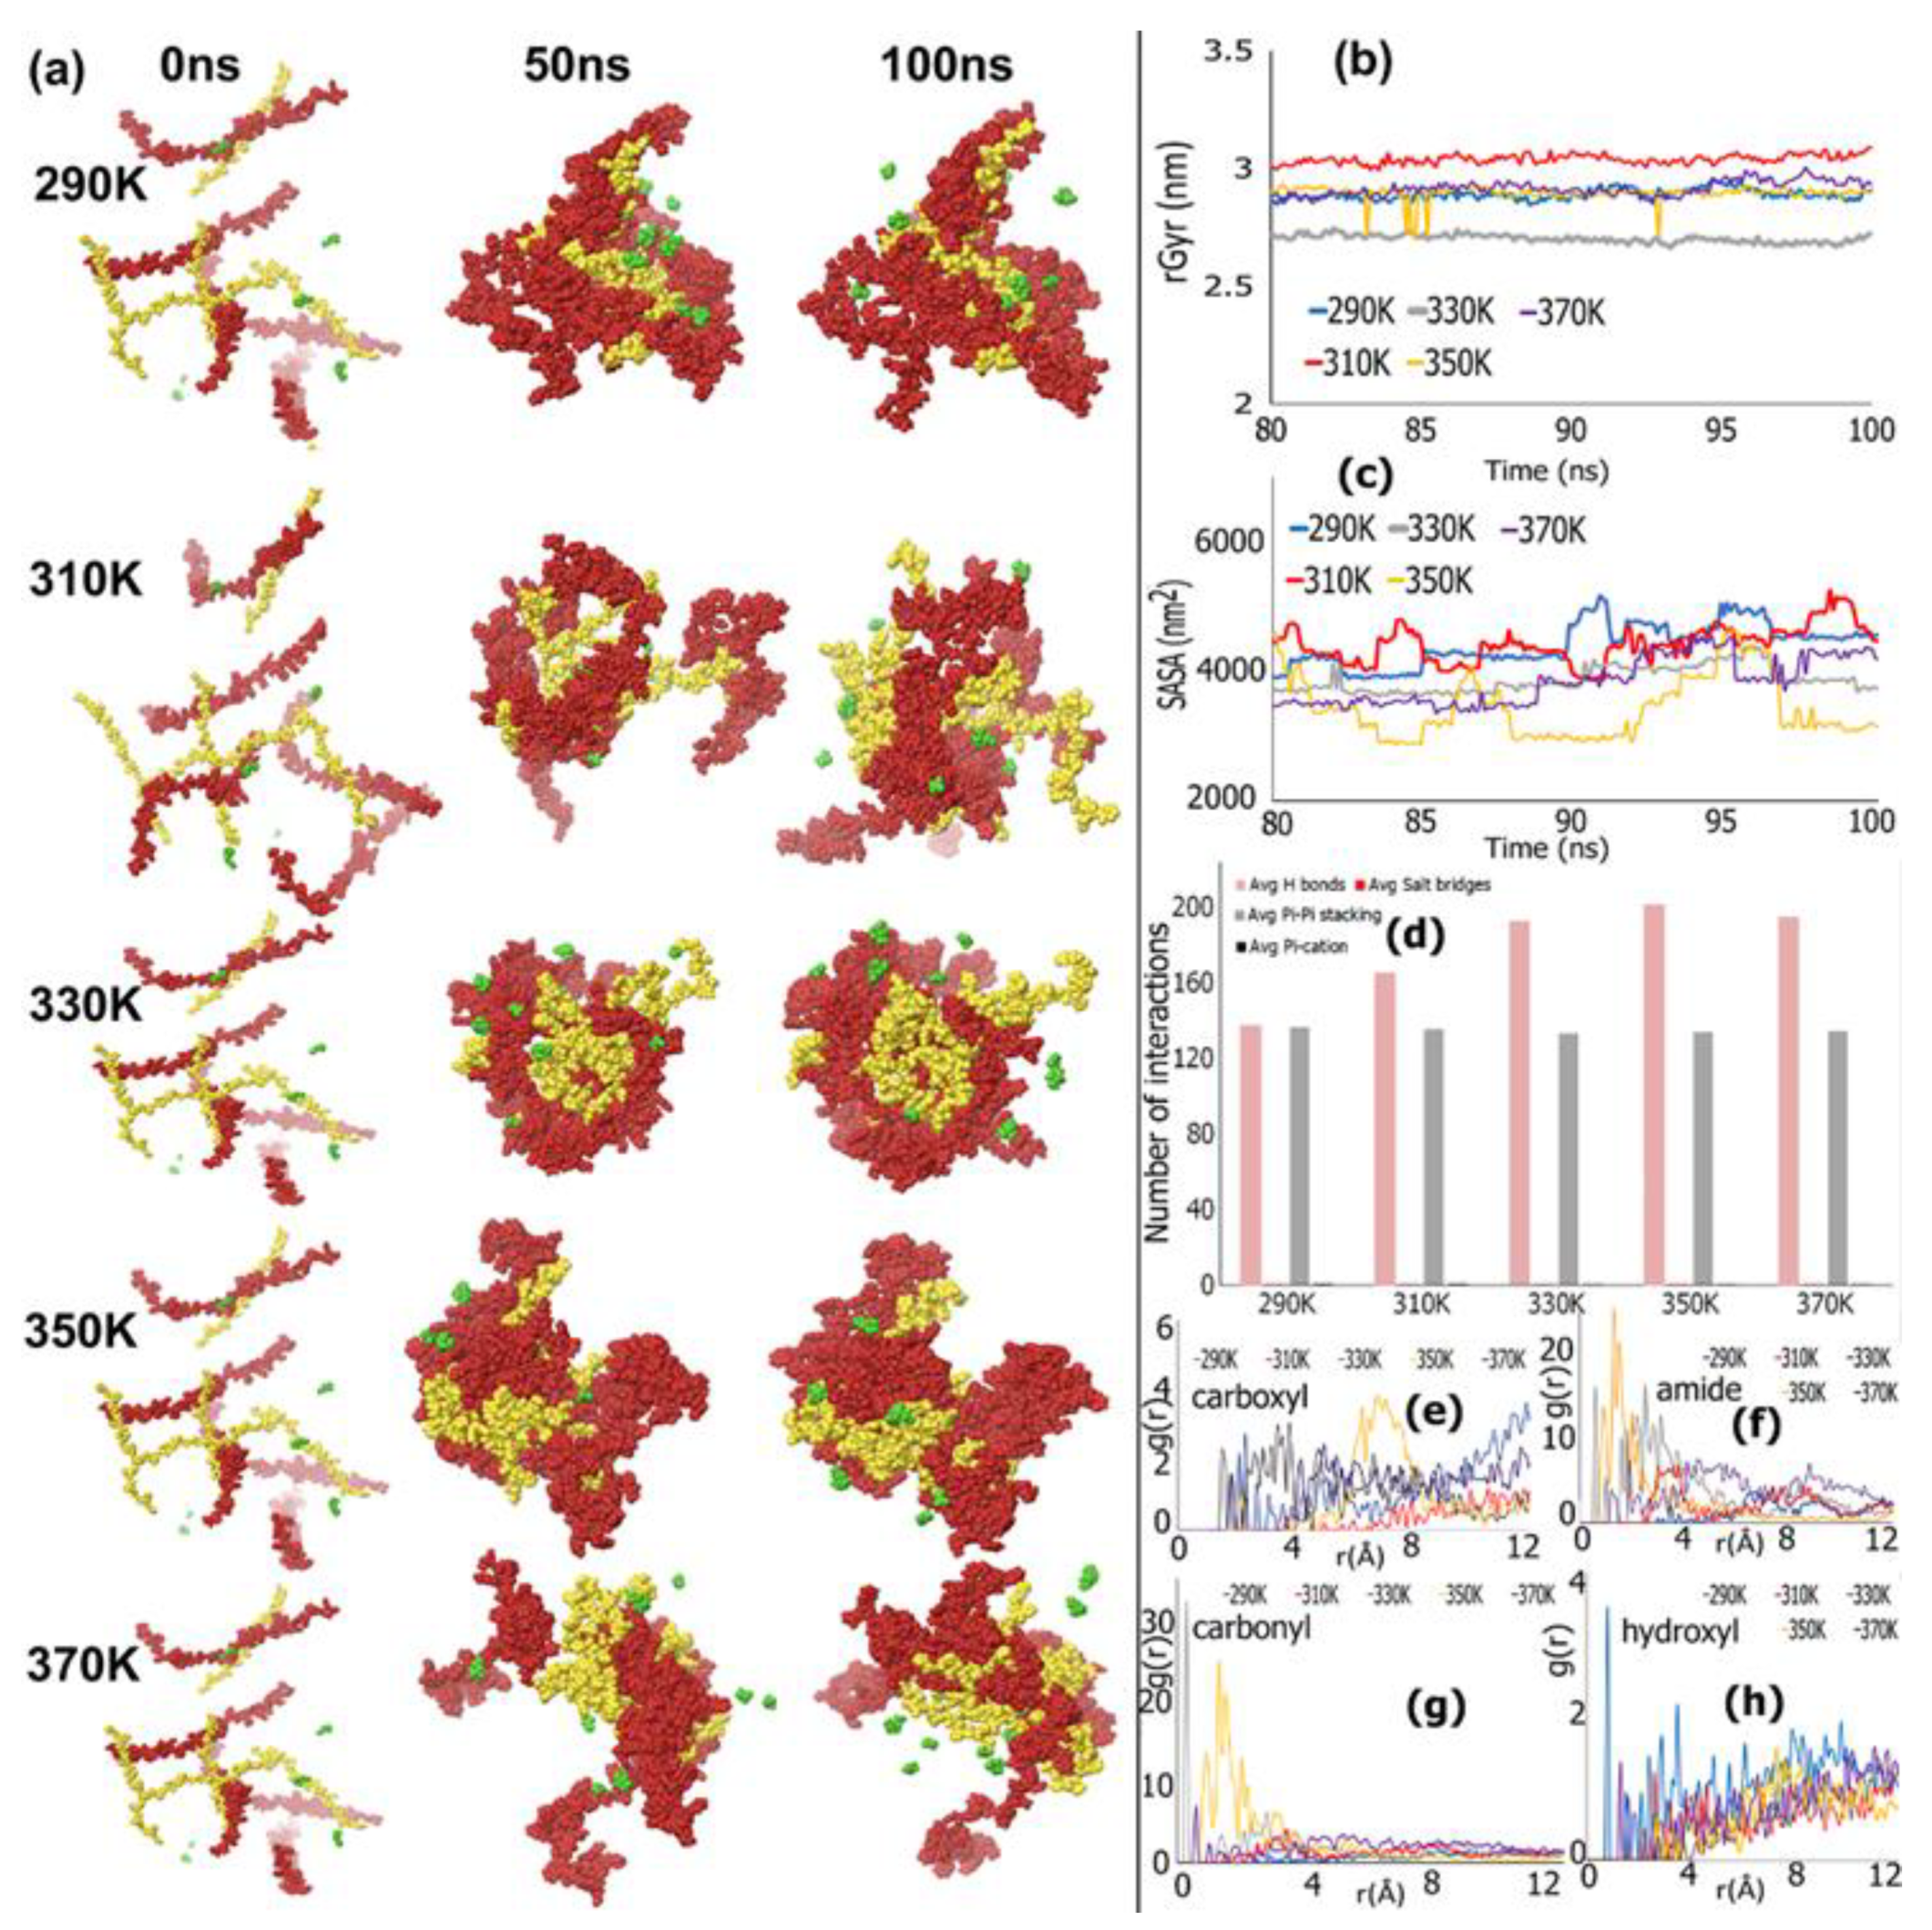
REMD Simulations of Biomimetic Scaffold
3.6. Synthesis and Assembly of Biomimetic Scaffold
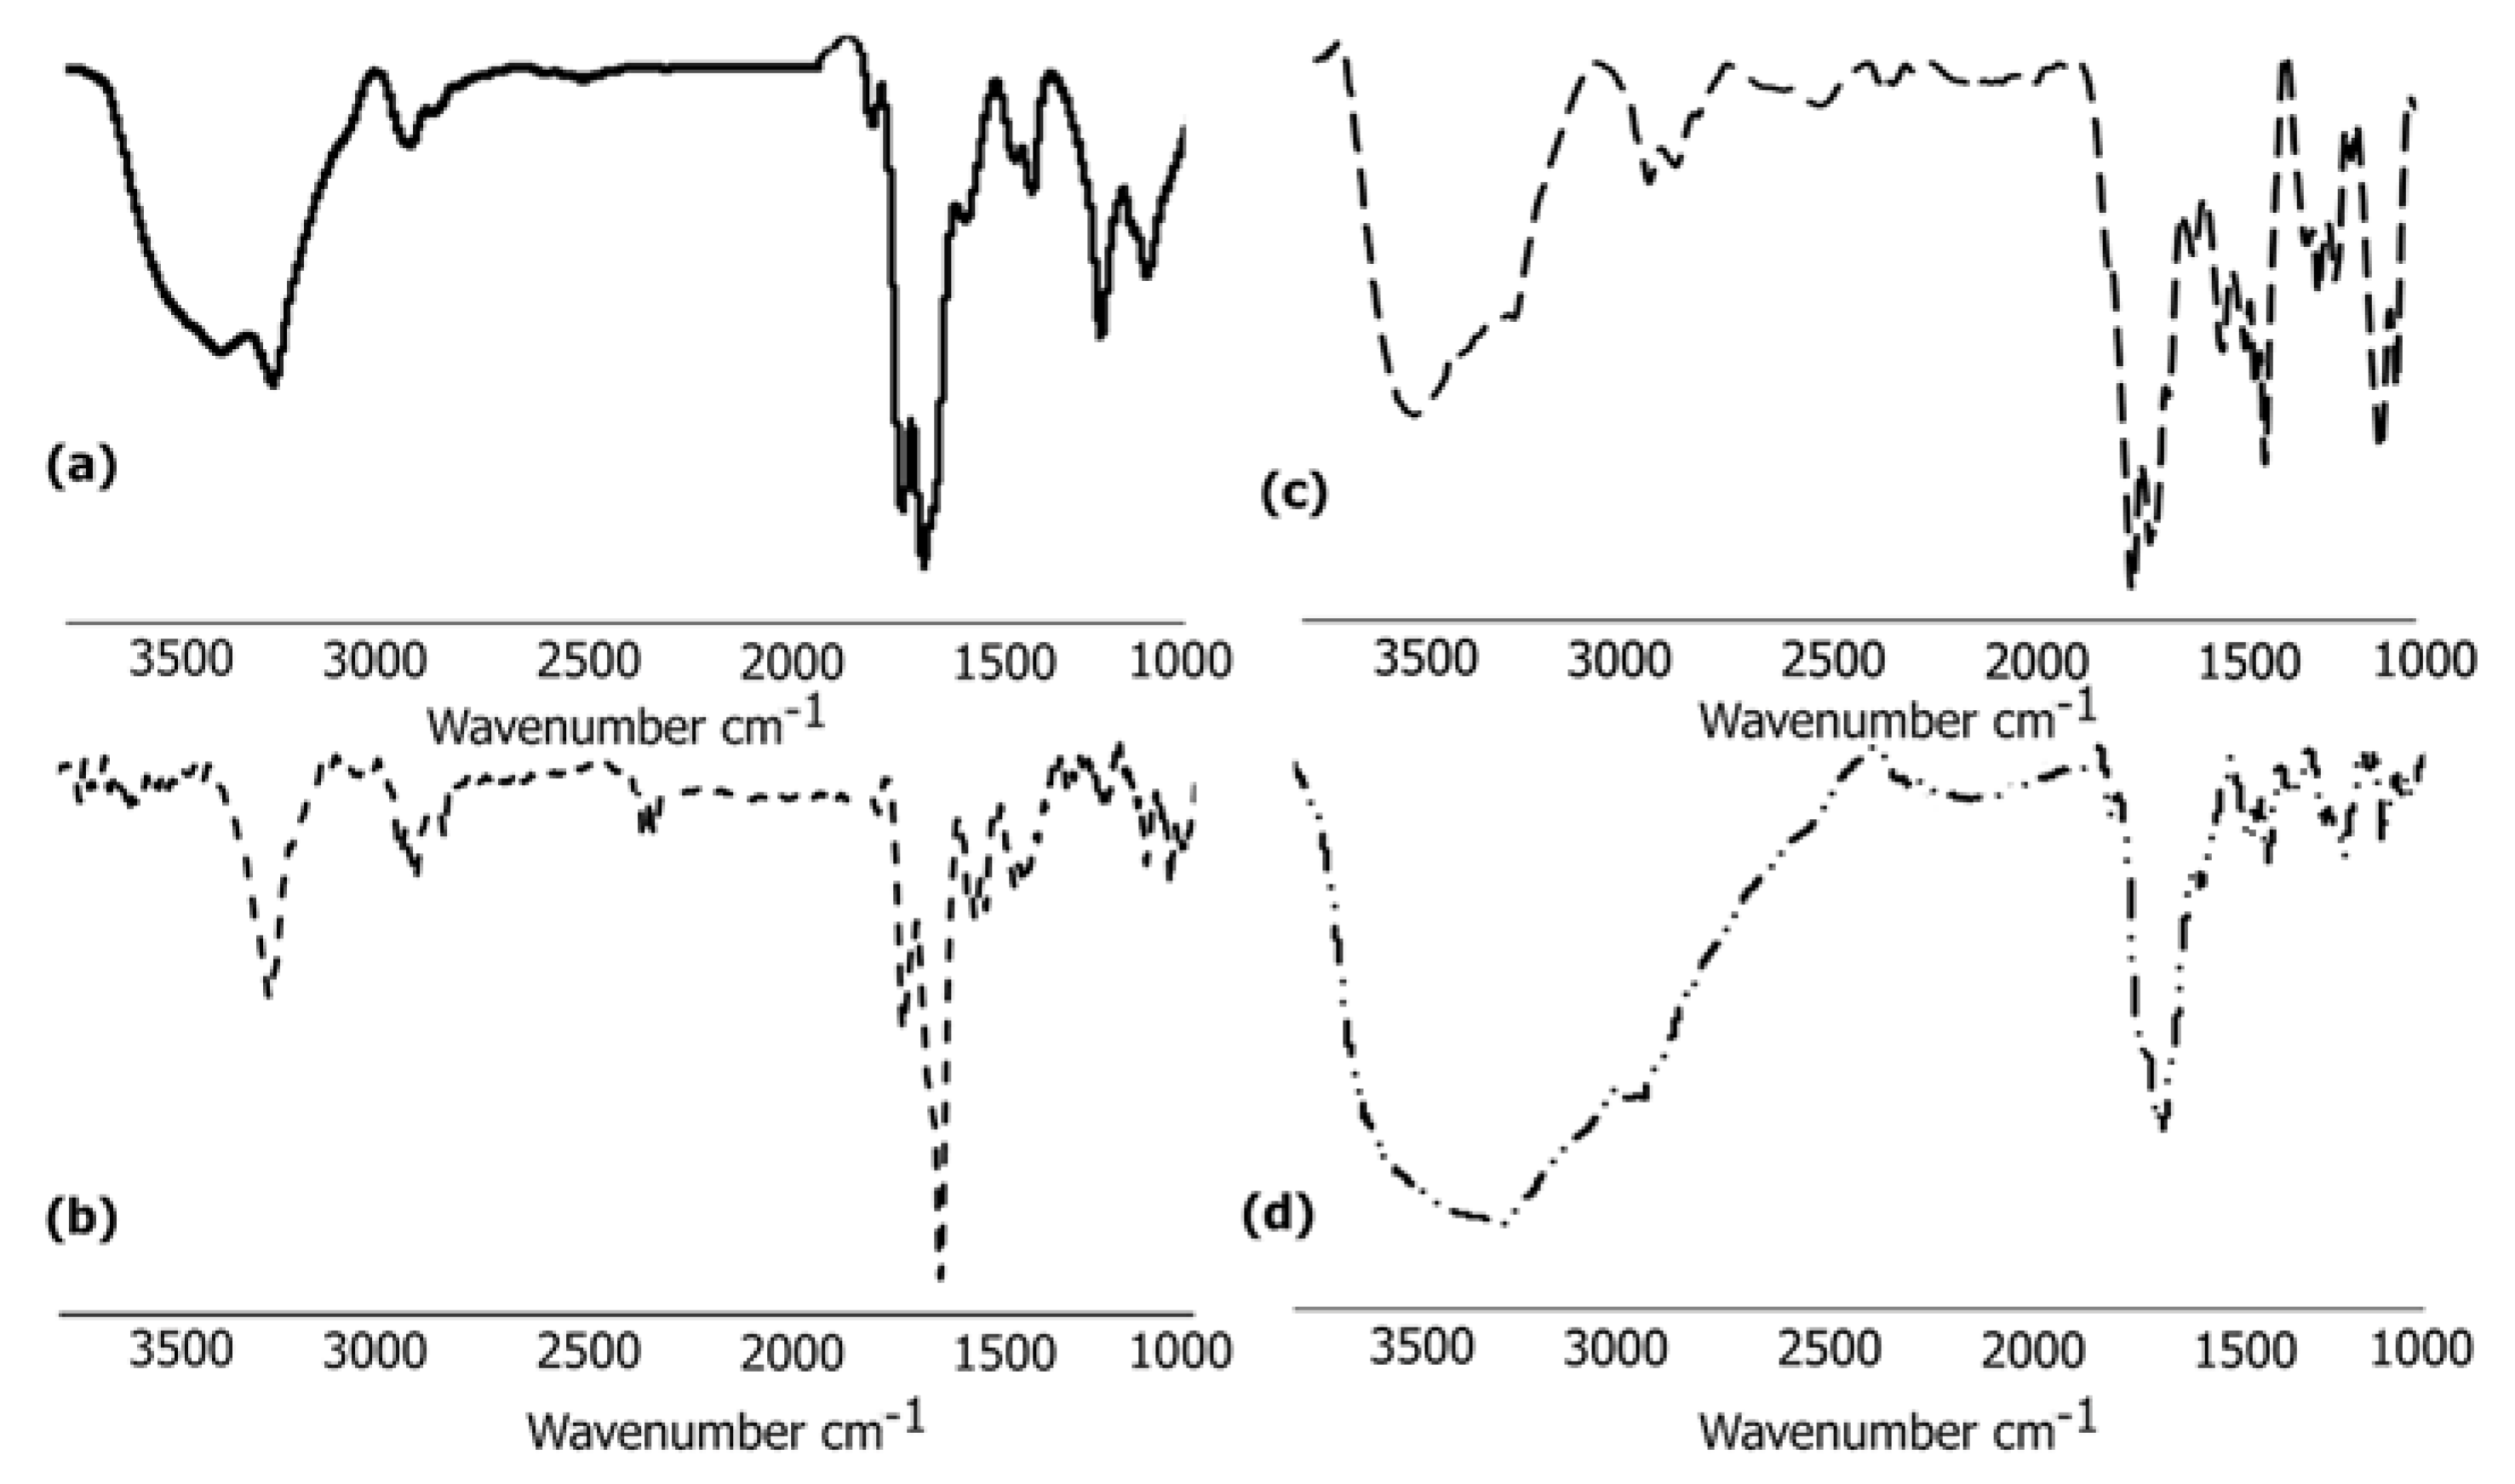
3.6.1. FTIR Analysis
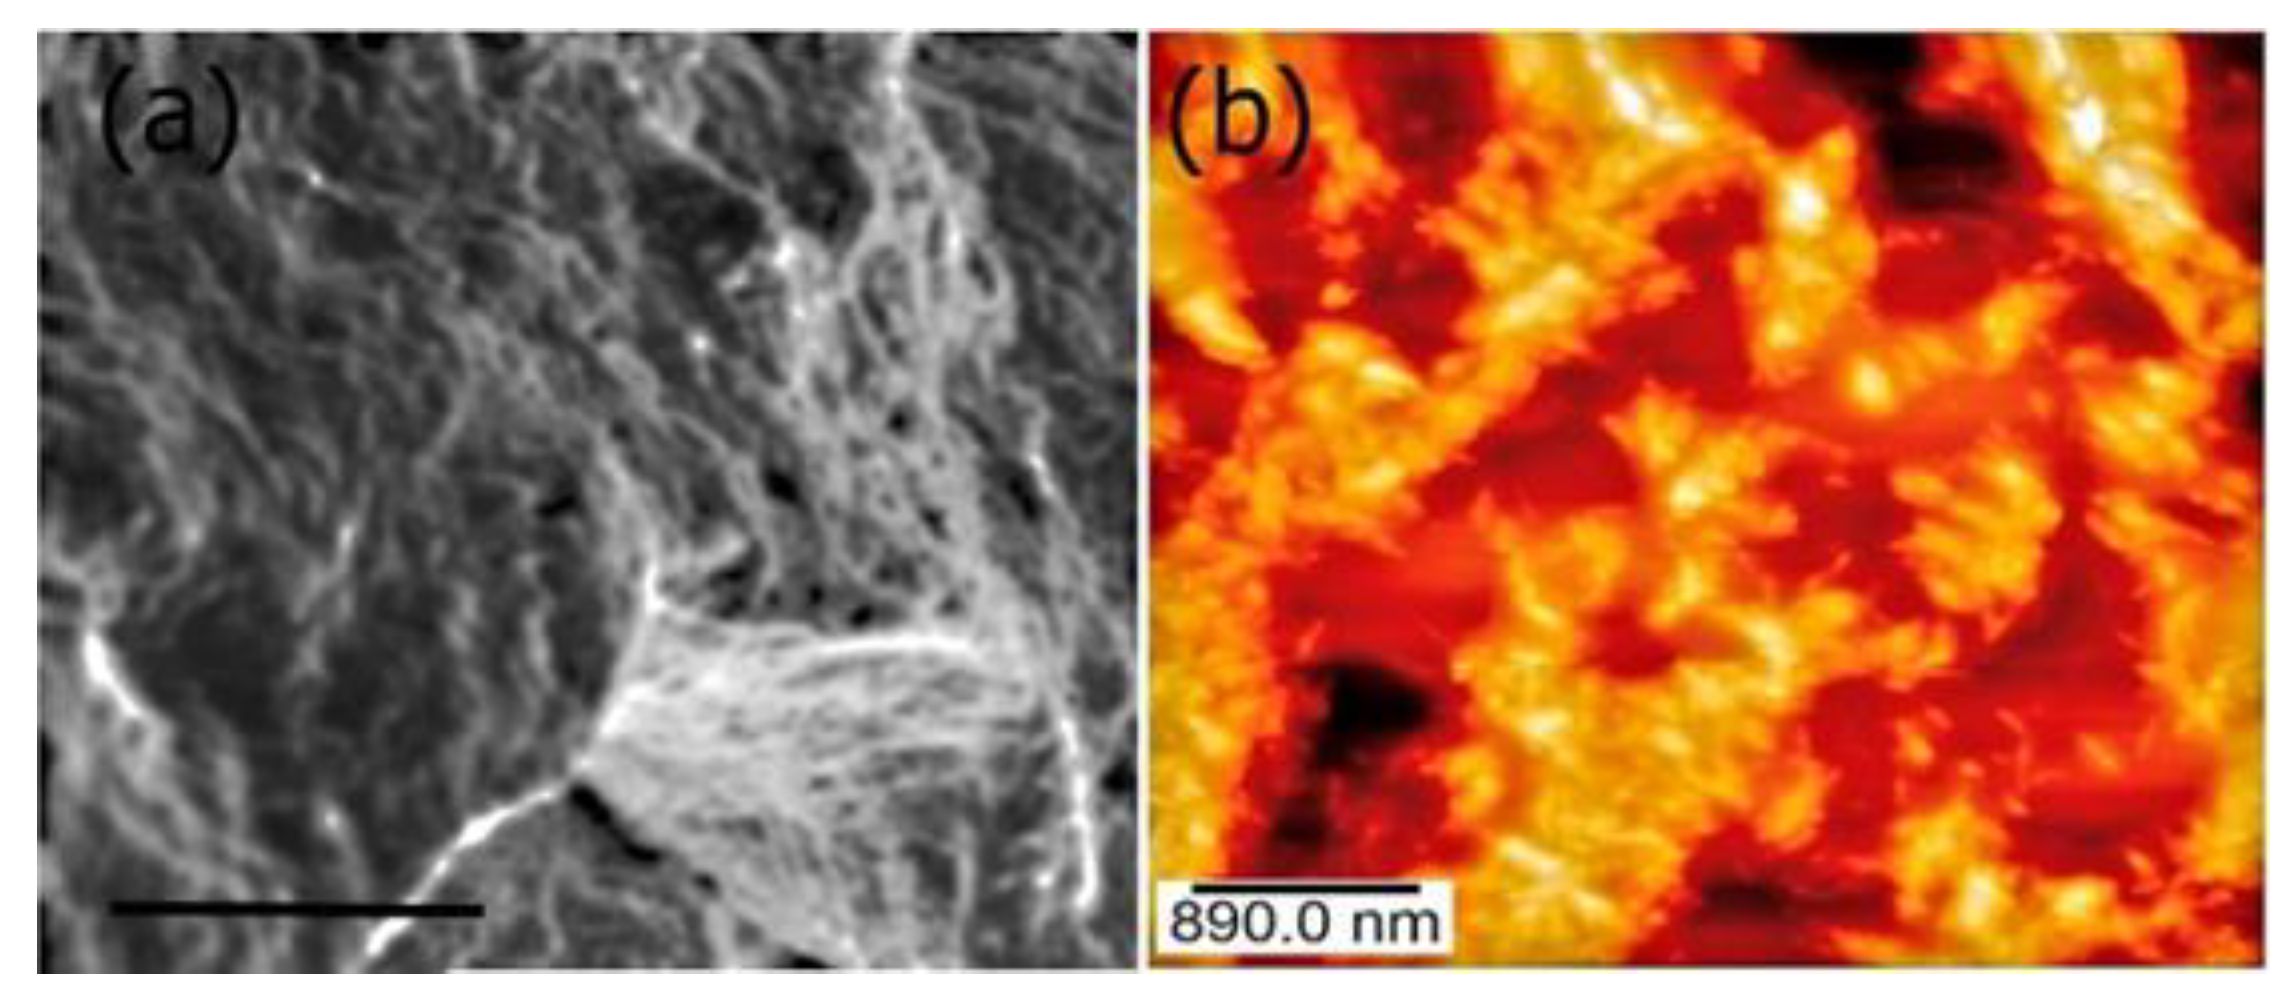
3.6.2. Morphological Analysis of Biocomposite Scaffold
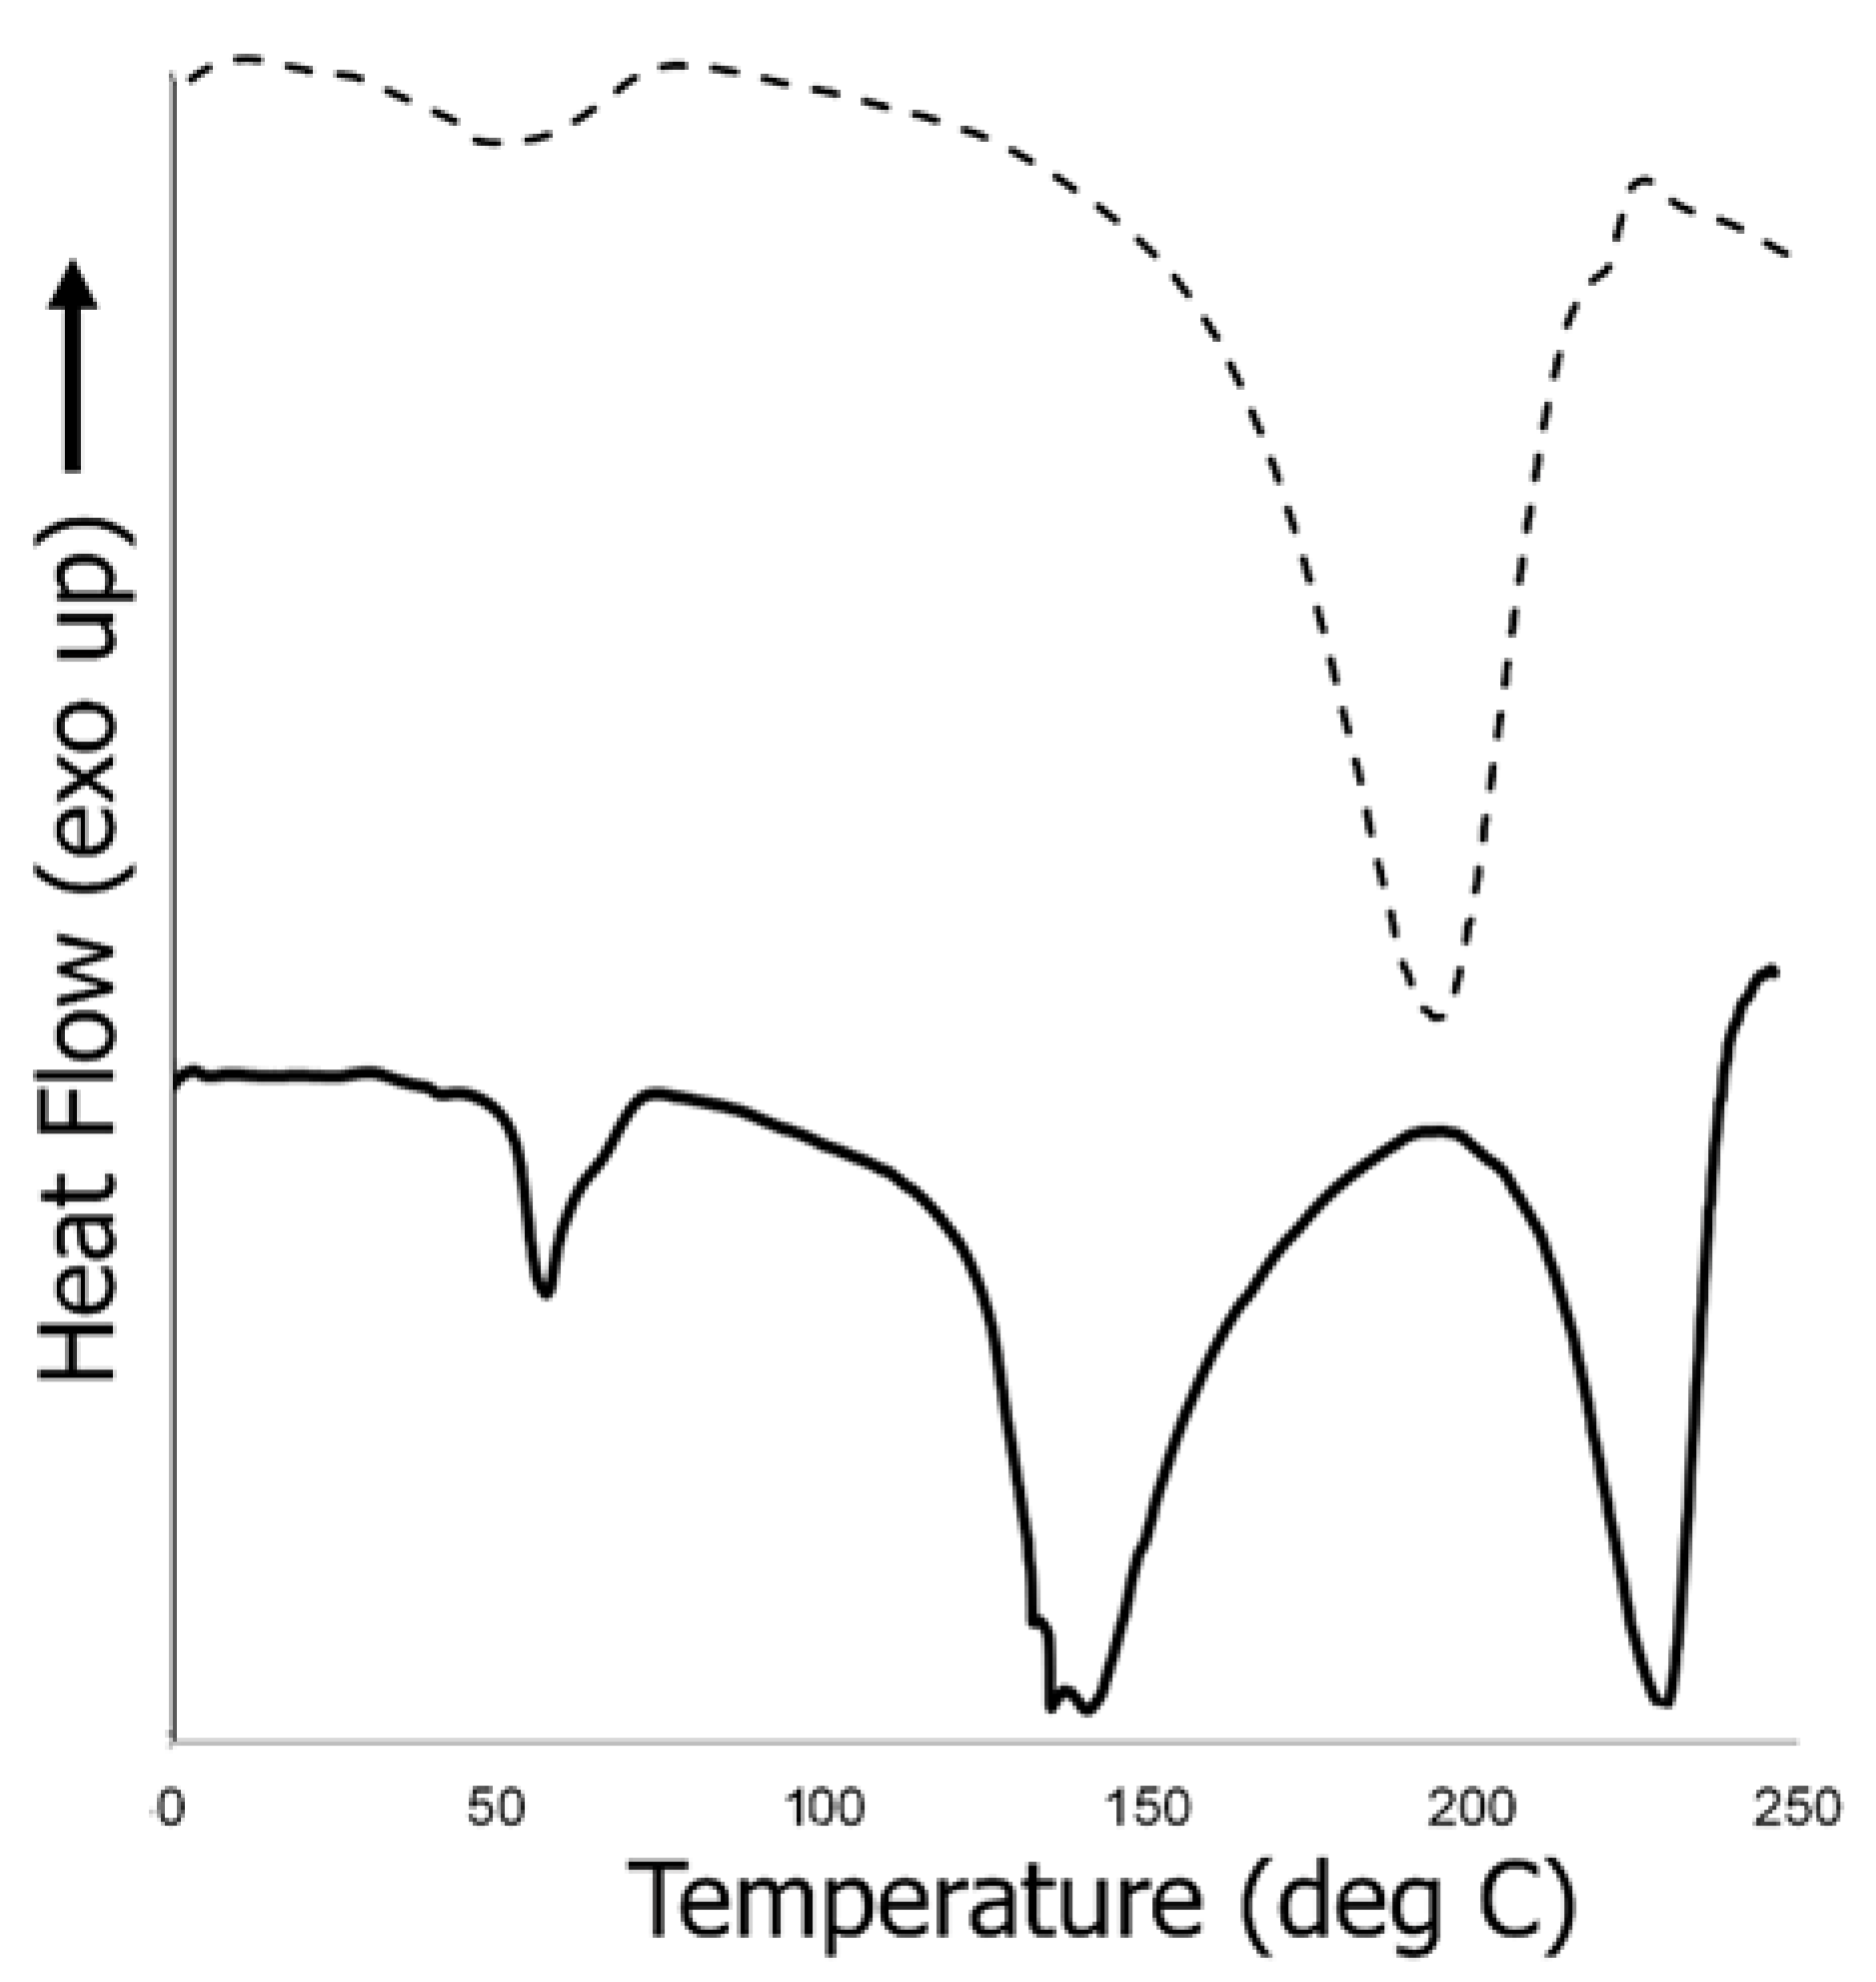
3.6.3. Thermal Analysis of Biocomposite Scaffold
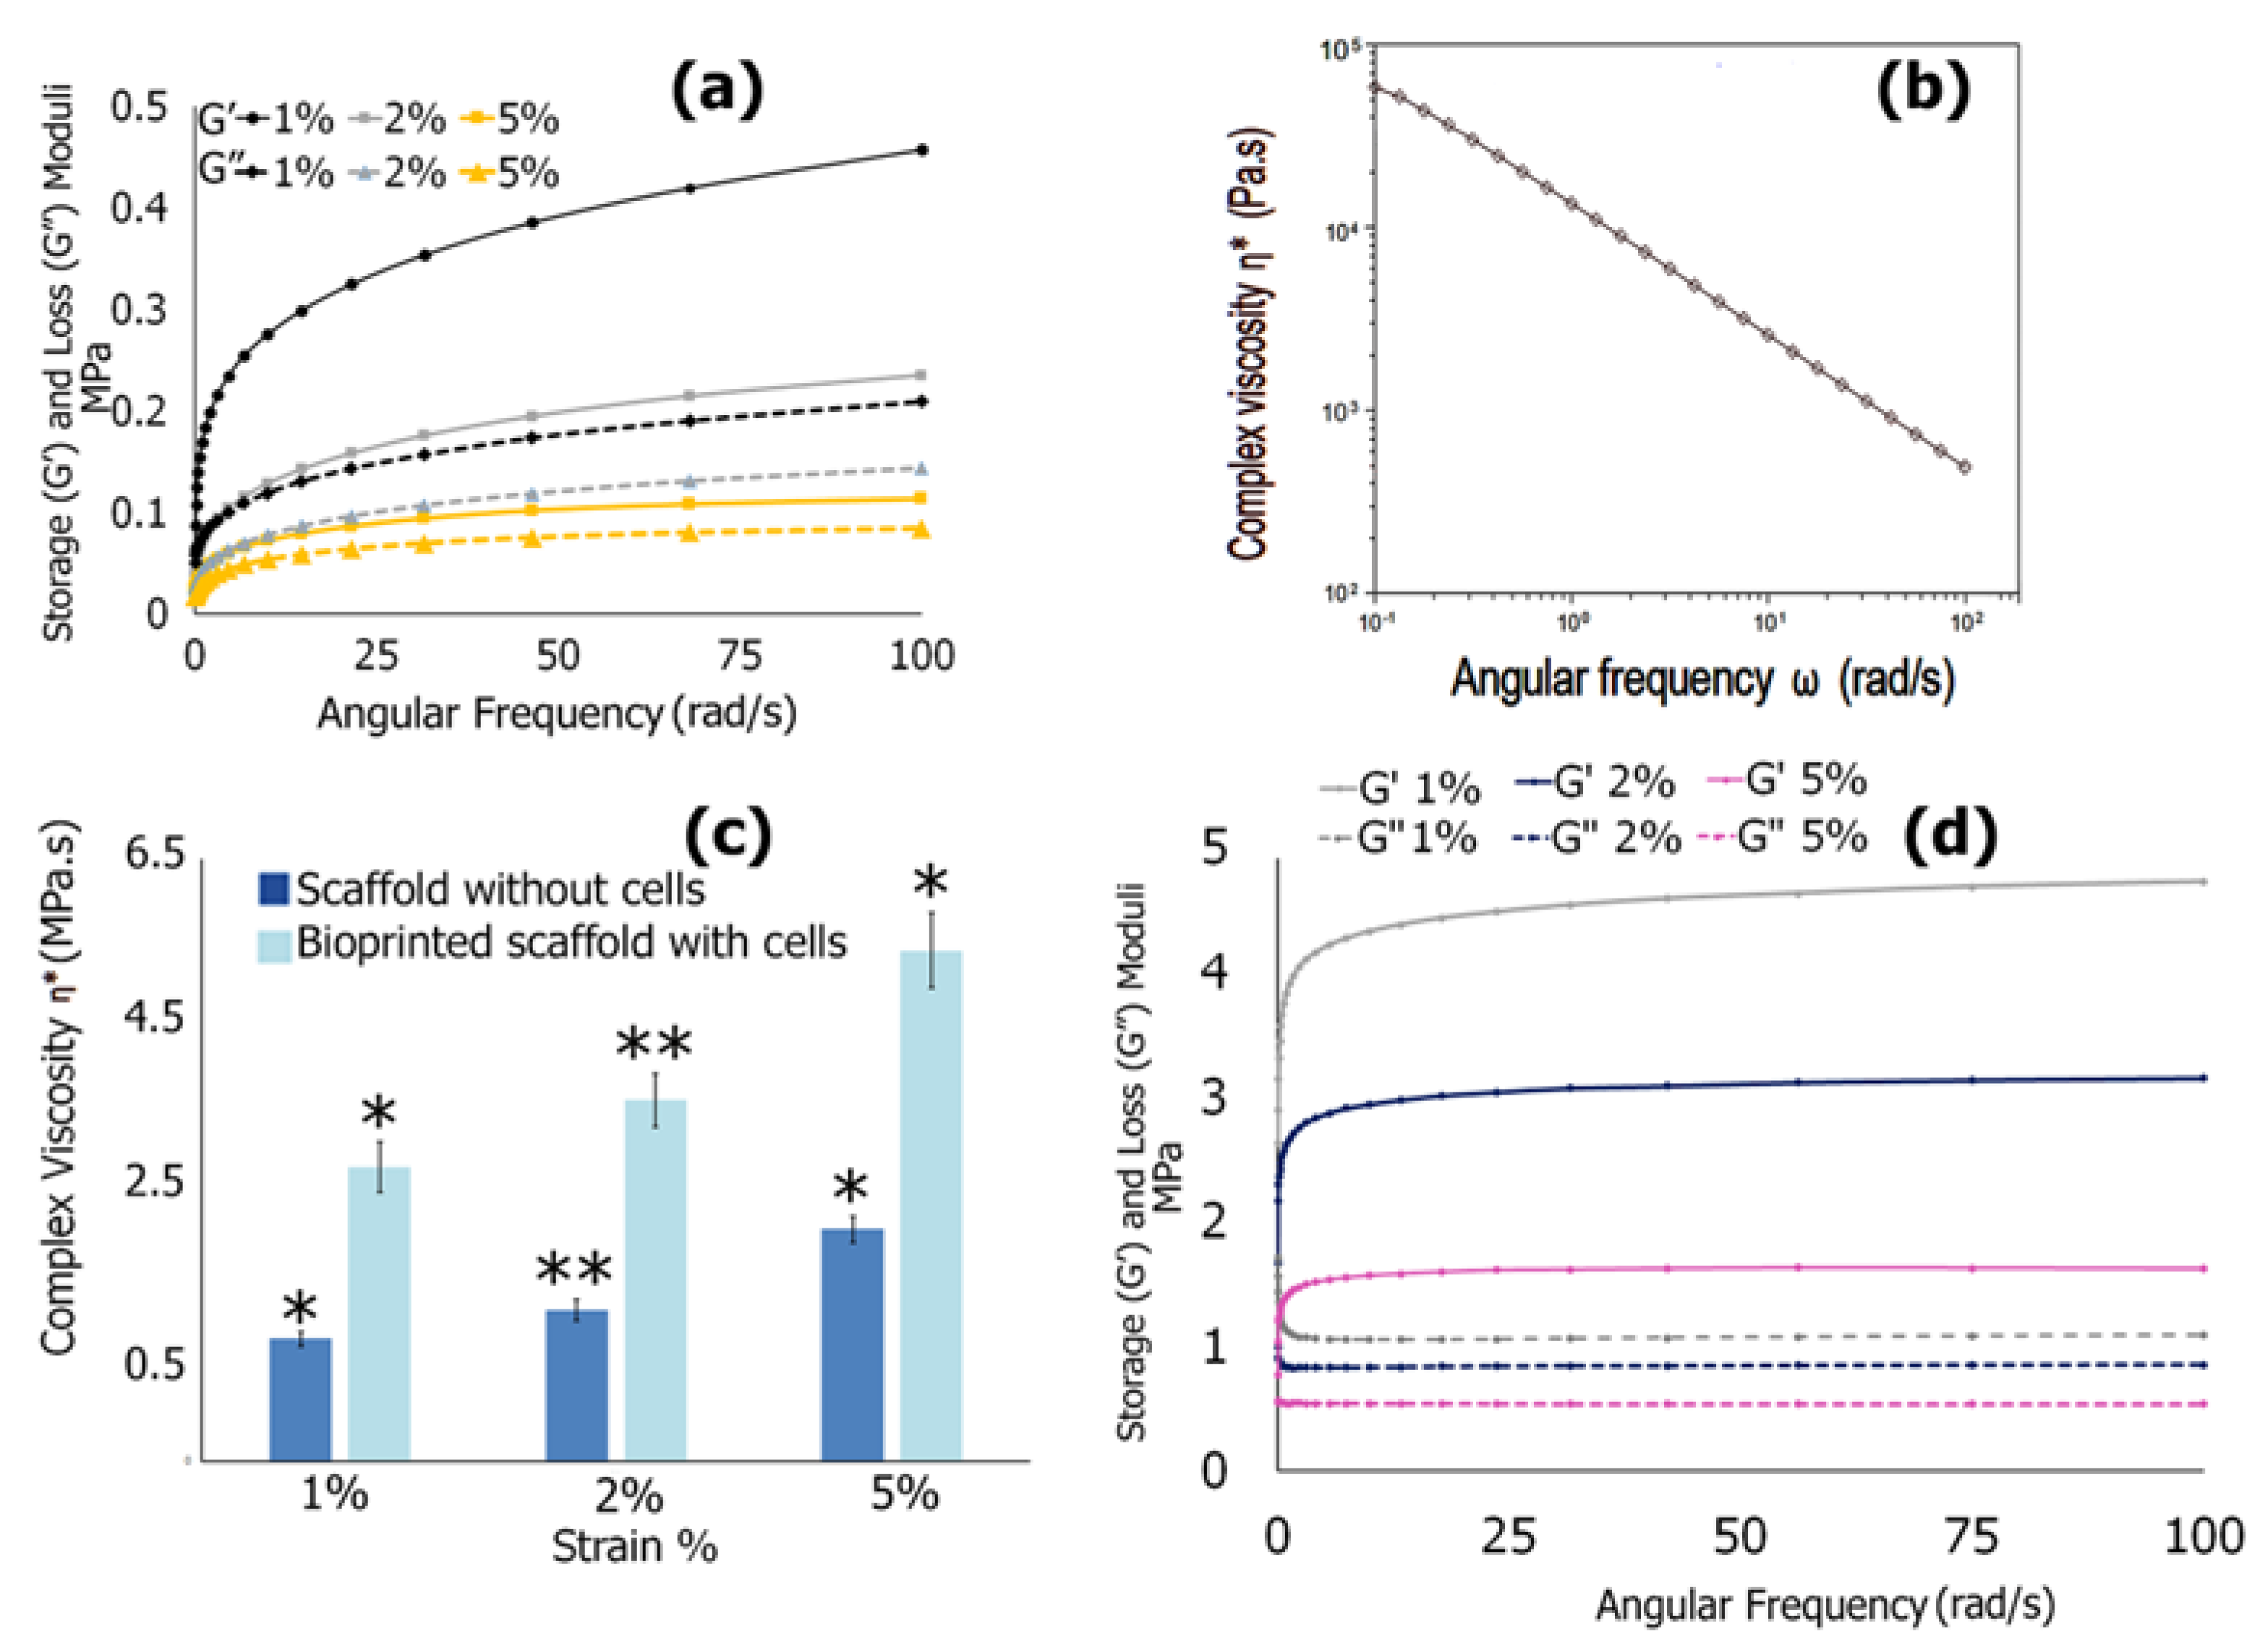
3.6.4. Mechanical Properties
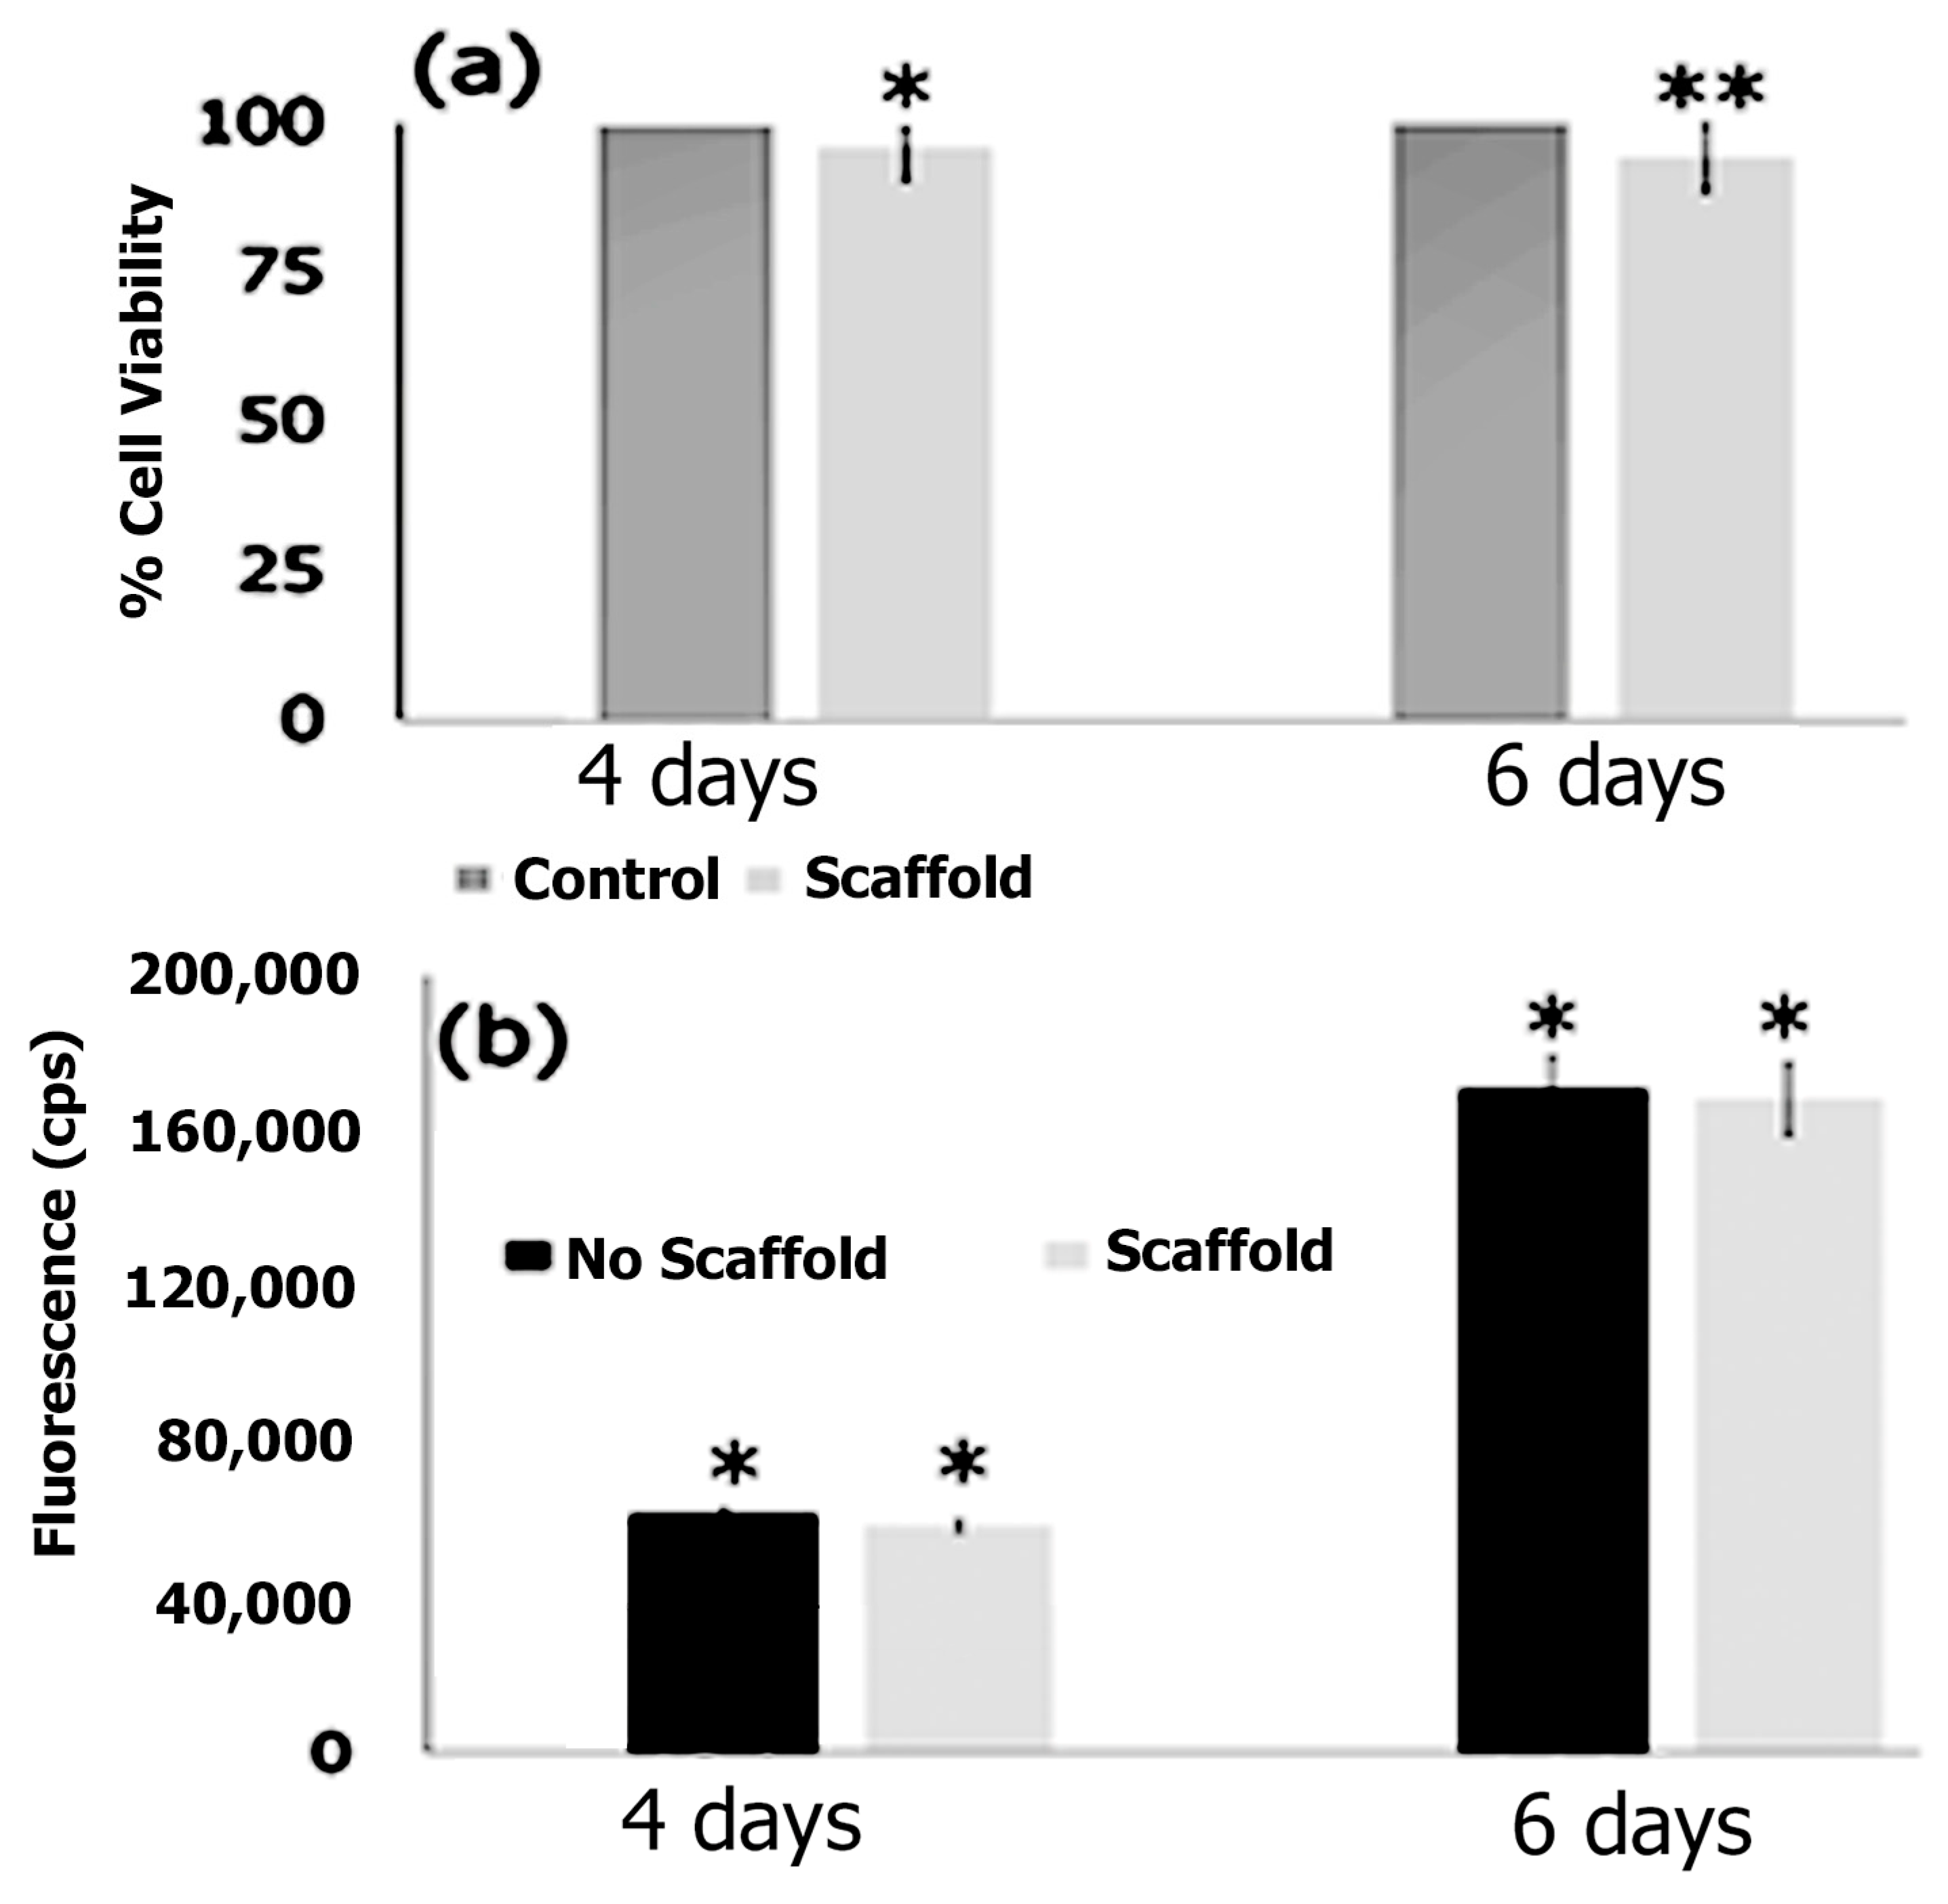
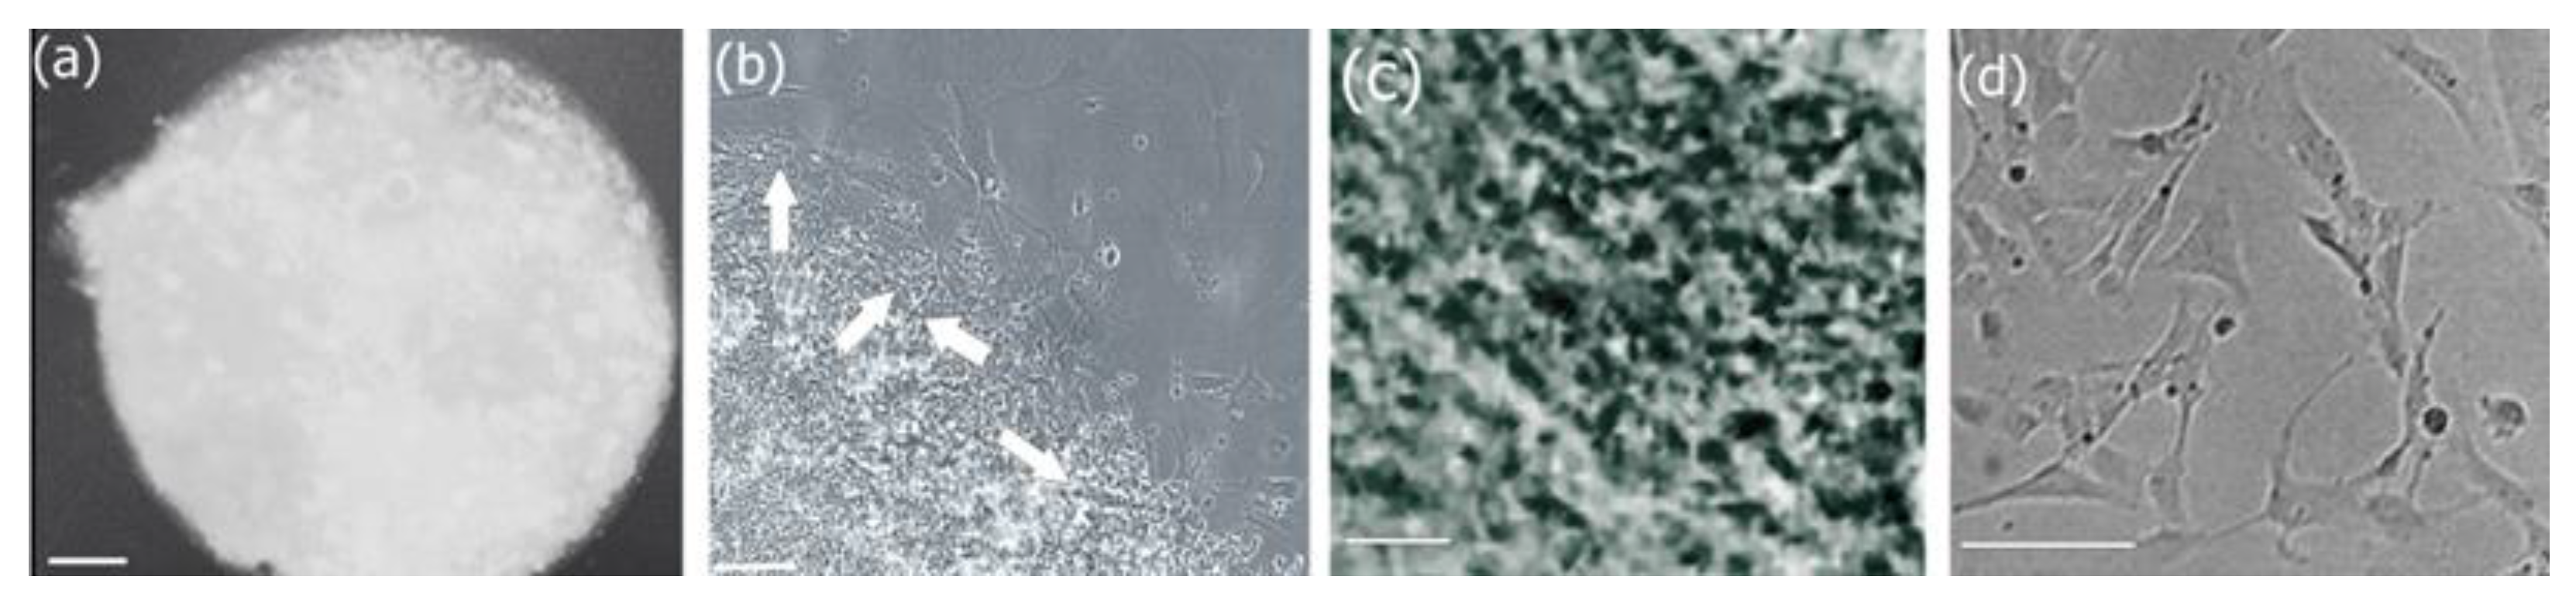
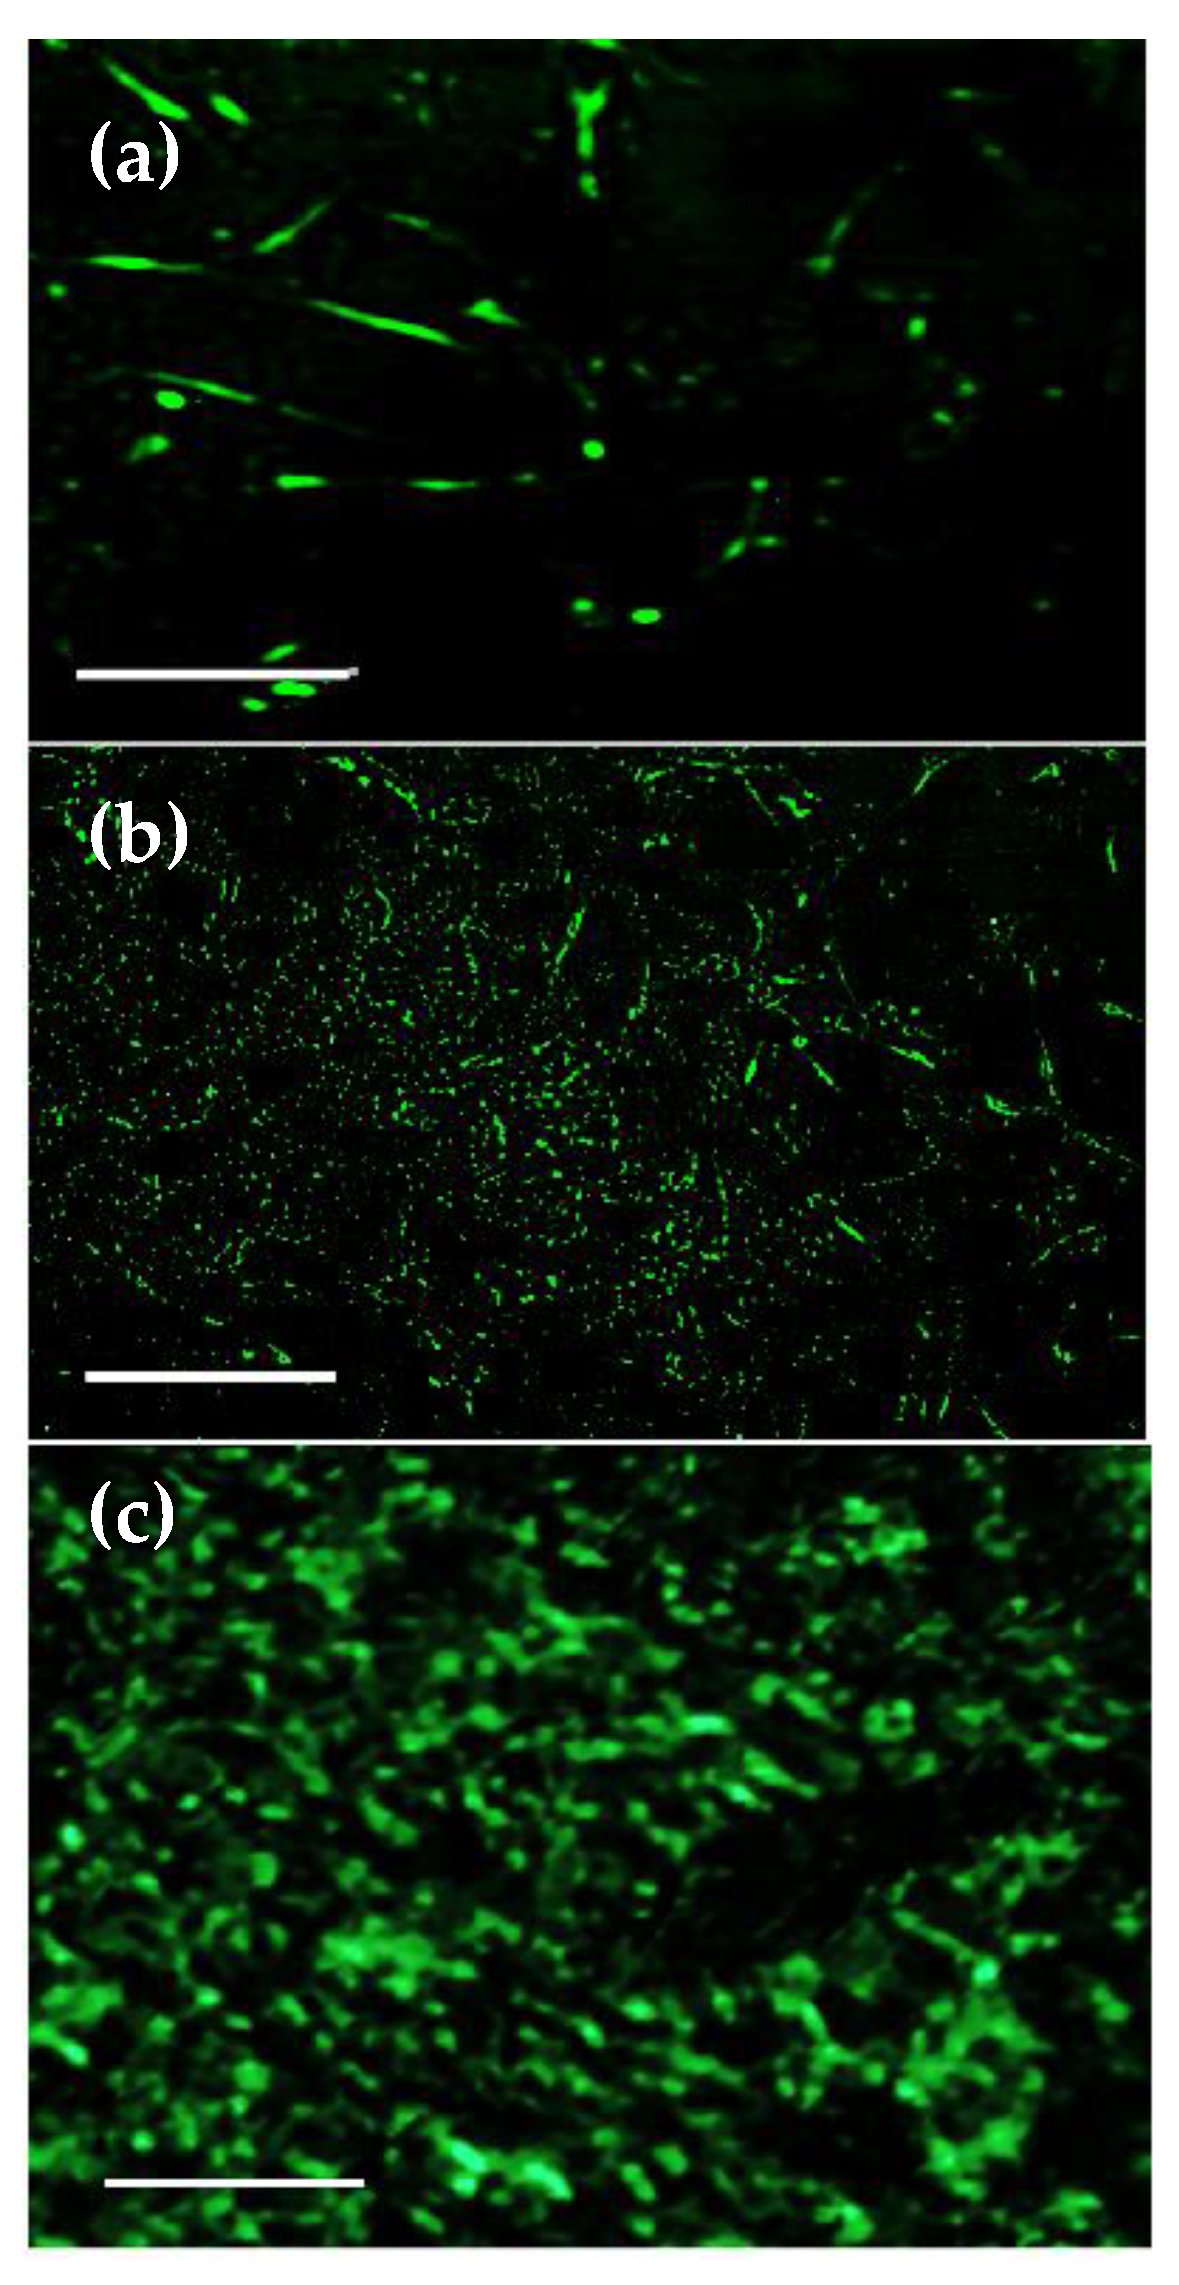
3.7. Cell Adhesion, Proliferation and Formation of Cell Scaffold Matrices
4. Conclusions
5. Future Goals
Supplementary Materials
Author Contributions
Funding
Data Availability Statement
Acknowledgments
Conflicts of Interest
References
- Balasubramanian, P.; Prabhakaran, M.P.; Sireesha, M.; Ramakrisha, S. In Collagen in Human Tissues: Structure, Function and Biomedical Applications from a Tissue Engineering Perspective. In Polymer Composites—Polyolefin-Fractionation-Polymeric Peptidomimetics—Collagens; Advances in Polymer Science; Abe, A., Kausch, H.H., Moller, M., Paschi, H., Eds.; Springer: Berlin/Heidelberg, Germany, 2013; Volume 251, pp. 173–206. [Google Scholar]
- Wittig, C.; Sulcek, R. Extracellular matrix protein rations in the human heart and vessels: How to distinguish pathological from physiological changes. Front. Physiol. 2021, 12, 708656. [Google Scholar] [CrossRef]
- Dong, C.; Lv, Y. Application of collagen scaffold in tissue engineering: Recent advances and new perspectives. Polymers 2016, 8, 42. [Google Scholar] [CrossRef] [PubMed]
- Shoulders, M.; Raines, R. Collagen structure and stability. Annu. Rev. Biochem. 2009, 78, 929–958. [Google Scholar] [CrossRef]
- Silvipriya, K.S.; Kumar, K.; Bhat, A.R.; Kumar, B.D.; John, A.; Lakshmanan, P. Collagen: Animal sources and biomedical application. J. Appl. Pharm. Sci. 2015, 5, 123–127. [Google Scholar] [CrossRef]
- Wang, W.; Qin, S.; He, P.; Mao, W.; Chen, L.; Hua, X.; Zhang, J.; Xiong, X.; Liu, Z.; Wang, P.; et al. Type II collagen sponges facilitate tendon stem/progenitor cells to adopt more chondrogenic phenotypes and promote the regeneration of fibrocartilage-like tissues in a rabbit partial patellectomy model. Front. Cell Dev. Biol. 2021, 9, 682719. [Google Scholar] [CrossRef] [PubMed]
- Wang, Q.; He, X.; Wang, B.; Pan, J.; Shi, C.; Li, J.; Wang, L.; Zhao, Y.; Dai, J.; Wang, D. Injectable collagen scaffold promotes swine myocardial infaraction recovery by long-term location retention of transplanted human umbilical cord mesenchymal stem cells. Sci. China Life Sci. 2021, 64, 269–281. [Google Scholar] [CrossRef] [PubMed]
- Liu, H.; Yang, R.; Zhao, S.; Zhou, F.; Liu, Y.; Zhou, Z.; Chen, L.; Xie, J. Collagen scaffolds derived from bovine skin loaded with MSC optimized macrophages remodeling and chronic diabetic wounds healing. Bioeng. Transl. Med. 2023, 8, e10467. [Google Scholar] [CrossRef]
- Leon-Lopez, A.; Morales-Penazola, V.M.; Martinez, J.; Vargas-Torres, A.; Zeugolis, D.; Alvarez, A. Hydrolyzed collagen-Sources and applications. Molecules 2019, 24, 22. [Google Scholar] [CrossRef]
- Barber, G.; Bouchard, A.; Cole, C.W.; McPhail, N.; Waddell, W.; Wellington, J.; Gervais, F.; Shuster, J.; Roy, P.; LaRoche, G.; et al. Immunologic response to collagen-impregnated vascular grafts: A randomized prospective study. J. Vasc. Surg. 1990, 12, 741–746. [Google Scholar]
- Takayama, E.; Ikeda, M.; Tsuru, S.; Ogura, M.; Kitahara, S.; Inouye, T.; Healy, G.B. Is injectable collagen truly safe? J. Laryngol. Otol. 1992, 106, 704–708. [Google Scholar] [CrossRef]
- Negrini, N.C.; Toffoletto, N.; Fare, S.; Altomare, L. Plant tissues as 3D natural scaffolds for adipose, bone and tendon tissue regeneration. Front. Bioeng. Biotechnol. 2020, 8, 723. [Google Scholar]
- Hoque, M.E.; Hutmacher, D.W.; Feng, W.; Li, S.; Huang, M.H.; Vert, M.; Wong, Y.S. Fabrication using a rapid prototyping system and in vitro characterization of PEG-PCL-PLA scaffolds for tissue engineering. J. Biomater. Sci. Polym. Ed. 2005, 16, 1595–1610. [Google Scholar] [CrossRef] [PubMed]
- Parmar, P.A.; Chow, L.; St-Pierre, J.-P.; Horejs, C.-M.; Peng, Y.Y.; Werkmeister, J.A.; Ramshaw, J.; Stevens, M. Collagen-mimetic peptide -modifiable hydrogels for articular cartilage regeneration. Biomaterials 2015, 54, 213–225. [Google Scholar] [CrossRef] [PubMed]
- Valot, L.; Maumus, M.; Brunel, L.; Martinez, J.; Amblard, M.; Noel, D.; Mehdi, A.; Subra, G. A collagen-mimetic organic-inorganic hydrogel for cartilage engineering. Gels 2021, 7, 73. [Google Scholar] [CrossRef]
- Rele, S.; Song, Y.H.; Apkarian, R.P.; Qu, Z.; Conticello, V.P.; Chaikof, E.L. D-Periodic collagen-mimetic microfibers. J. Am. Chem. Soc. 2007, 129, 14780–14787. [Google Scholar] [CrossRef]
- Luo, T.; Kiick, K. Collagen-like peptides and peptide-polymer conjugates in the design of assembled materials. Eur. Polym. J. 2013, 49, 2998–3009. [Google Scholar] [CrossRef]
- Fallas, J.A.; Gauba, V.; Hartgerink, J.D. Solution structure of an ABC collagen heterotrimer reveals a single-register helix stabilized by electrostatic interactions. J. Biol. Chem. 2009, 284, 26851–26859. [Google Scholar] [CrossRef]
- Stahl, P.J.; Romano, N.H.; Wirtz, D.; Yu, S.M. PEG-based hydrogels with collagen mimetic peptide mediated and tubable phsical cross-links. Biomacromolecules 2010, 11, 2336–2344. [Google Scholar] [CrossRef]
- Khew, S.T.; Yang, Q.J.; Tong, Y.W. Enzymatically crosslinked collagen-mimetic dendrimers that promote integrin targeted cell adhesion. Biomaterials 2008, 29, 3034–3045. [Google Scholar] [CrossRef]
- Gottlieb, D.; Morin, S.A.; Jin, S.; Raines, R.T. Self-assembled collagen-like peptide fibers as templates for metallic nanowires. J. Mater. Chem. 2008, 18, 3865–3870. [Google Scholar] [CrossRef]
- Kasznel, A.J.; Harris, T.; Porter, N.J.; Zhang, Y.; Chenoweth, D.M. Aza-proline effectively mimics L-proline stereochemistry in triple helical collagen. Chem. Sci. 2019, 10, 6979–6983. [Google Scholar] [CrossRef] [PubMed]
- Heise, R.M.; Banerjee, I.A. Design of short peptides and peptide amphiphiles as collagen mimics and an investigation of their interactions with collagen using molecular dynamics simulations and dociking studies. J. Mol. Model. 2023, 29, 19. [Google Scholar] [CrossRef] [PubMed]
- Rohl, C.A.; Fiori, W.; Baldwin, R.L. Alanine is helix-stabilizing in both template-nucleated and standard peptide helices. Proc. Natl. Acad. Sci. USA 1999, 96, 3682–3687. [Google Scholar] [CrossRef] [PubMed]
- Capasso, D.; Gaetano, S.D.; Celentano, V.; Dontaella, D.; Festa, L.; Di Stasi, R.; De Rosa, L.; Fattorusso, R.; D’Andrea, L.D. Unveiling a VEGF-mimetic peptide sequence in the IQGAP1 protein. Mol. BioSystems 2017, 13, 1619–1629. [Google Scholar] [CrossRef]
- Shamsi, B.H.; Chatoo, M.; Xu, X.K.; Xu, X.; Chen, X. Versatile functions of somatostatin and somatostatin receptors in the gastrointestinal system. Front. Endocrin. 2021, 12, 652363. [Google Scholar] [CrossRef]
- Pittaluga, A.; Roggeri, A.; Vallarino, G.; Olivero, G. Somatostatin, a presynaptic modulator of glutamatergic singal in the central nervous system. Int. J. Mol. Sci. 2021, 22, 5864. [Google Scholar] [CrossRef]
- Abel-Magid-A, F. Targeting pain with somatostatin receptor subtype 4 agonists. ACS Med. Chem. Lett. 2015, 6, 110. [Google Scholar] [CrossRef]
- Helyes, Z.; Pinter, E.; Nemeth, J.; Keri, G.; Than, M.; Oroszi, G.; Horvath, A.; Szolcsanyi, J. Anti-inflammatory effect of synthetic somatostatin analogues in the rat. Br. J. Pharmacol. 2001, 134, 1571–1579. [Google Scholar] [CrossRef]
- Lauritano, D.; Avantaggiato, A.; Candotto, V.; Cura, F.; Gaudio, R.M.; Scapoli, L.; Palmieri, A. Insulin activity on dental pulm stem cell differentiation: An in vitro study. J. Biol. Regul. Homeostas. Agents 2015, 29 (Suppl. 1), 48–53. [Google Scholar]
- Gonzalez-Rey, E.; Varela, N.; Sheibanie, A.F.; Chorny, A.; Ganea, D.; Delgado, M. Cortistatin, an antiinflmmatory peptide with therapeutic action in inflammatory bowel disease. Proc. Natl. Acad. Sci. USA 2006, 103, 4228. [Google Scholar] [CrossRef]
- Zhao, Y.; Li, Y.; Qu, R.; Chen, X.; Wang, W.; Qiu, C.; Liu, B.; Pan, X.; Liu, L.; Vasilev, K.; et al. Cortistatin binds to TNF-α receptors and protects against osteoarthritis. EBioMedicine 2019, 41, 556–570. [Google Scholar] [CrossRef] [PubMed]
- Lopes, J.M.; Paninho, A.B.; Nunes, A.V.; Rocha, A.; Lourenco, N.M.T.; Najdanovic-Visak, V. Biocompatible choline based ionic salts: Solubility in short-chain alcohols. J. Chem. Thermodyn. 2013, 67, 99–105. [Google Scholar] [CrossRef]
- Daso, R.E.; Osborn, L.; Thomas, M.F.; Banerjee, I.A. Development of nanoscale hybrids from ionic liquid-peptide amphiphile assemblies as new functional materials. ACS Omega 2020, 5, 14543–14554. [Google Scholar] [CrossRef] [PubMed]
- Roy, A.; Kucukural, A.; Zhang, Y. I-TASSER: A unified platform for automated protein structure and function prediction. Nat. Protoc. 2010, 5, 725–738. [Google Scholar] [CrossRef]
- Schrödinger, L.; DeLano, W. PyMOL 2.1.1; Schrödinger, LLC.: New York, NY, USA, 2020. [Google Scholar]
- Afzal, M.A.F.; Sanders, J.; Goldberg, A.; Browning, A.R.; Halls, M.D. Using molecular simulation with high-temperature composite resins. In Proceedings of the SAMPE 2019, Charlotte, NC, USA, 20–23 May 2019. [Google Scholar] [CrossRef]
- Talley, L.D.; Pickard, G.L.; Emery, W.J.; Swift, J.H. (Eds.) Chapter 6: Data Analysis Concepts and Observational Methods. In Descriptive Physical Oceanography, 6th ed.; Academic Press: Cambridge, MA, USA, 2011; pp. 147–186. [Google Scholar]
- Esteban-Martin, S.; Salgado, J. Self-assembling of peptide/ membrane complexes by atomistic molecular dynamics simulations. Biophys. J. 2007, 92, 903–912. [Google Scholar] [CrossRef]
- Terban, M.W.; Billinge, S.J.L. Structural analysis of molecular materials using the pair distribution function. Chem. Rev. 2022, 122, 1208–1272. [Google Scholar] [CrossRef] [PubMed]
- Madison, S.A.; Carnali, J.O. pH optimization of amidation via carbodiimides. Ind. Eng. Chem. Res. 2013, 52, 13547–13555. [Google Scholar] [CrossRef]
- Dupont, K.M.; Sharma, K.; Stevens, H.Y.; Boerckel, J.D.; García, A.J.; Guldberg, R.E. Human stem cell delivery for treatment of large segmental bone defects. Proc. Natl. Acad. Sci. USA 2010, 107, 3305–3310. [Google Scholar] [CrossRef]
- Gudapati, H.; Dey, M.; Ozbolat, I. A comprehensive review on droplet-based bioprinting: Past, present and future. Biomaterials 2016, 102, 20–42. [Google Scholar] [CrossRef]
- O’Brien, M.; Moehring, D.; Muñoz-Planillo, R.; Núñez, G.; Callaway, J.; Ting, J.; Scurria, M.; Ugo, T.; Bernad, L.; Cali, J.; et al. A bioluminescent caspase-1 activity assay rapidly monitors inflammasome activation in cells. J. Immunol. Methods 2017, 447, 1–13. [Google Scholar] [CrossRef]
- Guo, N.; Peng, Z. MG132, a proteasome inhibitor, induces apoptosis in tumor cells. Asia Pac. J. Clin. Oncol. 2013, 9, 6–11. [Google Scholar] [CrossRef] [PubMed]
- Molla, M.D.; Akalu, Y.; Geto, Z.; Dagnew, B.; Ayelign, B.; Shibabaw, T. Role of caspase-I in the pathogenesis of inflammatory-associated chronic noncommunicable diseases. J. Inflamm. Res. 2020, 13, 749–764. [Google Scholar] [CrossRef] [PubMed]
- Boost, K.A.; Hoegl, S.; Hofstetter, C.; Flondor, M.; Stegewerth, K.; Platacis, I.; Pfeilschifter, J.; Muhl, H.; Zwissler, B. Targeting caspase-1 by inhalation-therapy: Effects of Ac-YVAD-CHO on IL-1β, IL-18 and downstream proinflammatory parameters as detected in rat endotoxaemia. Intensive Care Med. 2007, 33, 863–871. [Google Scholar] [CrossRef] [PubMed]
- Chazotte, B. Labeling cytoskeletal F-actin with rhodamine phalloidin or fluorescein phalloidin for imaging. Cold Spring Harb. Protoc. 2010, 2010, pdb.prot4947. [Google Scholar] [CrossRef] [PubMed]
- Khezri, Z.; Karimi, A.; Yazdian, F.; Jokar, M.; Mofradnia, S.R.; Rashedi, H.; Tavakoli, Z. Molecular dynamic of curcumin/chitosan interaction using a computational molecular approach: Emphasis on biofilm reduction. Int. J. Biol. Macromol. 2018, 114, 972–978. [Google Scholar] [CrossRef]
- Tanner, J.J. Empirical power laws for the radii of gyration of protein oligomers. Acta Crystallogr. D Struct. Biol. 2016, 72, 1119–1129. [Google Scholar] [CrossRef]
- Zhu, Q.; Tree, D.R. Simulations of morphology control of self-assembled amphiphilic surfactants. J. Polym. Sci. 2023, 61, 1214–1240. [Google Scholar] [CrossRef]
- Crook, E.H.; Trebbi, G.F.; Fordyce, D.B. Thermodynamic properties of solutions of homogeneous p,t-octylphenoxyethoxyethanols. J. Phys. Chem. 1964, 68, 3592–7065. [Google Scholar] [CrossRef]
- Kroll, P.; Benke, J.; Enders, S.; Brandenbusch, C.; Sadowski, G. Influence of temperature and concentration on the self-assembly of nonionic CiEj surfactants: A light scattering study. ACS Omega 2022, 7, 7057–7065. [Google Scholar] [CrossRef]
- Ozkan, A.D.; Tekinay, A.B.; Guler, M.O.; Tekin, E.D. Effects of temperature, pH and counterions on the stability of peptide amphiphile nanofiber structures. RSC Adv. 2016, 6, 104201. [Google Scholar] [CrossRef]
- Tantakitti, F.; Boekhoven, J.; Wang, X.; Kazantsev, R.; Yu, T.; Li, J.; Zhuang, E.; Zandi, R.; Ortony, J.; Newcomb, C.; et al. Energy landscapes and functions of supramolecular systems. Nat. Mater. 2016, 15, 469–476. [Google Scholar] [CrossRef] [PubMed]
- Karima, O.; Riazi, G.; Khodadadi, S.; Yousefi, R.; Mahnam, K.; Mokhtari, F.; Cheraghi, T.; Moosavi-Movahedi, A.A. An in vitro study of the role of β-boswellic acid in the microtubule assembly dynamics. FEBS Lett. 2012, 586, 4132–4138. [Google Scholar] [CrossRef]
- Xu, J.; Zhang, Y. How significant is a protein structure similarity with TM-score = 0.5? Bioinformatics 2010, 26, 889–895. [Google Scholar] [CrossRef]
- Woody, R.J. Circular dichroism spectrum of peptides in the poly(Pro)II conformation. J. Am. Chem. Soc. 2009, 131, 8234–8245. [Google Scholar] [CrossRef] [PubMed]
- Li, S.-C.; Goto, N.K.; Williams, K.; Deber, C.M. Alpha-helical, but not beta-sheet, propensity of proline is determined by peptide environment. Proc. Natl. Acad. Sci. USA 1996, 93, 6676–6681. [Google Scholar] [CrossRef] [PubMed]
- Liao, S.-M.; Du, Q.-S.; Meng, J.-Z.; Pang, Z.-W.; Huang, R.-B. The multiple roles of histidine in protein interactions. Chem. Central J. 2013, 7, 44. [Google Scholar] [CrossRef]
- Santos, A.F.L.; Notario, R.; da Silva, M.A.V. Thermodynamic and conformational study of proline stereoisomers. J. Phys. Chem. B 2014, 118, 10130–10141. [Google Scholar] [CrossRef]
- Yoshizumi, A.; Fletcher, J.; Yu, Z.; Persikov, A.V.; Bartlett, G.J.; Boyle, A.L.; Vincent, T.L.; Woolfson, D.N.; Brodsky, B. Designed coiled coils promote folding of a recombinant bacterial collagen. J. Biol. Chem. 2011, 286, 17512–17520. [Google Scholar] [CrossRef]
- Pal, V.K.; Jain, R.; Roy, S. Tuning the supramolecular structure and function of collagen mimetic ionic complementary peptides via electrostatic interactions. Langmuir 2020, 36, 1003–1013. [Google Scholar] [CrossRef]
- Qi, R.; Wei, G.; Ma, B.; Nussinov, R. Replica exchange molecular dynamics: A practical application protocol with solutions to common problems and a peptide aggregation and self-assembly example. Methods Mol Biol. 2018, 1777, 101–119. [Google Scholar] [CrossRef]
- Zhou, R. Replica exchange molecular dynamics method for protein folding simulation. Methods Mol. Biol. 2007, 350, 205–223. [Google Scholar] [PubMed]
- Siebenmorgen, T.; Engelhard, M.; Zacharias, M. Prediction of protein-protein complexes using replica exchange with repulsive scaling. J. Comput. Chem. 2020, 41, 1436–1447. [Google Scholar] [CrossRef] [PubMed]
- Vivo, M.D.; Masetti, M.; Bottegoni, G.; Cavalli, A. Role of molecular dynamics and related methods in drug discovery. J. Med. Chem. 2016, 59, 4035–4061. [Google Scholar] [CrossRef] [PubMed]
- Huang, Q.; Rodgers, J.M.; Hemley, R.J.; Ichiye, T. Effects of pressure and temperature on the atomic fluctuations of dihydrofolate reductase from a psychropiezophile and a mesophile. Int. J. Mol. Sci. 2019, 20, 1452. [Google Scholar] [CrossRef]
- Ali, S.A.; Hassan, M.I.; Islam, A.; Ahmad, F. A review of methods available to estimate solvent-accessible surface areas of soluble proteins in the folded and unfolded states. Curr. Protein Pept. Sci. 2014, 15, 456–476. [Google Scholar] [CrossRef]
- Ntarakas, N.; Ermilova, I.; Lyubartsev, A.P. Effect of lipid saturation on amyloid-beta peptide partitioning and aggregation in neuronal membranes: Molecular dynamics simulations. Eur. Biophys. J. 2019, 48, 813–824. [Google Scholar] [CrossRef]
- Wen, B.; Sun, C.; Bai, B.; Gatapova, E.; Kabov, O. Ionic hydration-induced evolution of decane-water interfacial tension. Phys. Chem. Chem. Phys. 2017, 19, 14606–14614. [Google Scholar] [CrossRef]
- Zhang, Q.; Wang, J.; Tang, S.; Wang, Y.; Li, J.; Zhou, W.; Wang, Z. Molecular dynamics investigation of the local structure in iron melts and its role in crystal nucleation during rapid solidification. Phys. Chem. Chem. Phys. 2018, 21, 4122–4135. [Google Scholar] [CrossRef]
- Li, H.; Luo, Y.; Derreumaux, P.; Wei, G. Carbon nanotube inhibits formation of β-sheet-rich oligomers of the Alzheimer’s amyloid-β(16-22) peptide. Biophys. J. 2011, 101, 2267. [Google Scholar] [CrossRef]
- Abdideh, M.; Ameri, A. Cluster analysis of petrophysical and geological parameters for separating the electrofacies of a gas carbonate reservoir sequence. Nat. Resour. Res. 2019, 29, 1843–1856. [Google Scholar] [CrossRef]
- Periole, X.; Mark, A.E. Convergence and sampling efficiency in replica exchange simulations of peptide folding in explicit solvent. J. Chem. Phys. 2007, 126, 014903. [Google Scholar] [CrossRef] [PubMed]
- Costa, E.; Lloyd, M.M.; Chopko, C.; Aguiar-Ricardo, A.; Hammond, P.T. Tuning smart microgel swelling and responsive behavior through strong and weak polyelectrolyte. Langmuir 2012, 28, 10082–10090. [Google Scholar] [CrossRef] [PubMed]
- Abdy, M.J.; Murdoch, A.; Martinez-Felipe, A. New insights into the rolve of hydrogen bonding on the liquid crystal behavior of 4-alkoxybenzoic acids: A detailed IR spectroscopy study. Liq. Cryst. 2016, 43, 2191–2207. [Google Scholar] [CrossRef]
- Kumar, S.; Mukherjee, A.; Das, A. Structure of indole—Imidazole heterodimer in a supersonic jet: A gas phase study on the interaction between the aromatic side chains of tryptophan and histidine residues in proteins. J. Phys. Chem. A 2012, 116, 11573–11580. [Google Scholar] [CrossRef]
- Xue, L.; Zhao, Y.; Yu, L.; Sun, Y.; Yan, K.; Li, Y.; Huang, X.; Qu, Y. Choline acetate enhanced the catalytic performance of Candida rogusa lipase in AOT reverse micelles. Colloids Surf. B Biointerfaces 2013, 105, 81–86. [Google Scholar] [CrossRef]
- Bozec, L.; Odlyha, M. Thermal denaturation studies of collagen by microthermal analysis and atomic force microscopy. Biophys. J. 2011, 101, 228–236. [Google Scholar] [CrossRef]
- Schwab, A.; Levato, R.; D’Este, M.; Piluso, S.; Eglin, D.; Malda, J. Printability and shape fidelity of bioinks in 3D Bioprinting. Chem. Rev. 2020, 120, 11028–11055. [Google Scholar] [CrossRef]
- Maturavongsadit, P.; Narayanan, L.K.; Chansoria, P.; Shirwaiker, R.; Benhabbour, S.R. Cell-laden nanocellulose/chitosan-based bioinks for 3D bioprinting and enhanced osteogenic cell differentiation. ACS Appl. Biomater. 2021, 4, 2342–2353. [Google Scholar] [CrossRef]
- Cassagnau, P. Payne effect and shear elasticity of silica-filled polymers in concentrated solutions and in molten state. Polymer 2003, 44, 2455–2462. [Google Scholar] [CrossRef]
- Dabbaghi, M.; Namjoshi, S.; Panchal, B.; Grice, J.E.; Prakash, S.; Roberts, M.S.; Mohammed, Y. Viscoelastic and deformation characteristics of structurally different commercial topical systems. Pharmaceutics 2021, 13, 1351. [Google Scholar] [CrossRef]
- Rombouts, K.B.; van Merrienboer, T.; Ket, J.C.F.; Bogunovic, J.; van der Velden, J.; Yeung, K.K. The role of vascular smooth muscle cells in the development of aortic aneurysms and dissections. Eur. J. Clin. Investig. 2022, 52, e13697. [Google Scholar] [CrossRef] [PubMed]
- Wu, L.; Lin, L.; Qin, Y.X. Enhancement of cell ingrowth, proliferation, and early differentiation in a three-dimensional silicon carbide scaffold using low-intensity pulsed ultrasound. Tissue Eng. Part A 2015, 21, 53–61. [Google Scholar] [CrossRef] [PubMed]
- Gunst, S.J.; Zhang, W. Actin cytoskeletal dynamics in smooth muscle: A new paradigm for the regulation of smooth muscle contraction. Am. J. Physiol. Cell Physiol. 2008, 295, C576–C587. [Google Scholar] [CrossRef]
- Thakar, R.G.; Cheng, Q.; Patel, S.; Chu, J.; Nasir, M.; Liepmann, D.; Komvopoulos, K.; Li, S. Cell-shape regulation of smooth muscle cell proliferation. Biophys. J. 2009, 96, 3423–3432. [Google Scholar] [CrossRef] [PubMed]
- Anson, F.; Thayumanavan, S.; Hardy, J.A. Exogenous introduction of initiator and executioner caspases results in different apoptotic outcomes. J. Am. Chem. Soc. 2021, 1, 1240–1256. [Google Scholar] [CrossRef]
- Sun, Q.; Scott, M.J. Caspase-1 as a multifunctional inflammatory mediator: Noncytokine maturation roles. J. Leukoc. Biol. 2016, 100, 961–967. [Google Scholar] [CrossRef]
- Parrish, A.B.; Freel, C.D.; Kornbluth, S. Cellular mechanisms controlling caspase activation and function. Cold Spring Harb. Perspect. Biol. 2013, 5, a008672. [Google Scholar] [CrossRef]


| Temperature (K) | Average RMSD (nm) |
|---|---|
| 290 | 6.28 |
| 310 | 6.59 |
| 330 | 5.71 |
| 350 | 6.29 |
| 370 | 6.41 |
Disclaimer/Publisher’s Note: The statements, opinions and data contained in all publications are solely those of the individual author(s) and contributor(s) and not of MDPI and/or the editor(s). MDPI and/or the editor(s) disclaim responsibility for any injury to people or property resulting from any ideas, methods, instructions or products referred to in the content. |
© 2023 by the authors. Licensee MDPI, Basel, Switzerland. This article is an open access article distributed under the terms and conditions of the Creative Commons Attribution (CC BY) license (https://creativecommons.org/licenses/by/4.0/).
Share and Cite
Goncalves, B.G.; Heise, R.M.; Banerjee, I.A. Development of Self-Assembled Biomimetic Nanoscale Collagen-like Peptide-Based Scaffolds for Tissue Engineering: An In Silico and Laboratory Study. Biomimetics 2023, 8, 548. https://doi.org/10.3390/biomimetics8070548
Goncalves BG, Heise RM, Banerjee IA. Development of Self-Assembled Biomimetic Nanoscale Collagen-like Peptide-Based Scaffolds for Tissue Engineering: An In Silico and Laboratory Study. Biomimetics. 2023; 8(7):548. https://doi.org/10.3390/biomimetics8070548
Chicago/Turabian StyleGoncalves, Beatriz G., Ryan M. Heise, and Ipsita A. Banerjee. 2023. "Development of Self-Assembled Biomimetic Nanoscale Collagen-like Peptide-Based Scaffolds for Tissue Engineering: An In Silico and Laboratory Study" Biomimetics 8, no. 7: 548. https://doi.org/10.3390/biomimetics8070548