Article

Methodology for Risk Assessment of SARS-CoV-2 Virus Transmission in Hospital Buildings

by
Thaysa V. da Cunha
1,
Laryssa F. C. Willcox
2,
Bruno B. F. da Costa
1,*,
Mohammad Najjar
1,
Carlos A. P. Soares
2 and
Assed N. Haddad
1,*
1
Programa de Engenharia Ambiental, Universidade Federal do Rio de Janeiro, Rio de Janeiro 21941-909, Brazil
2
Programa de Engenharia Civil, Universidade Federal Fluminense, Niterói 24210-240, Brazil
*
Authors to whom correspondence should be addressed.
Safety 2023, 9(4), 78; https://doi.org/10.3390/safety9040078
Submission received: 30 August 2023 / Revised: 30 October 2023 / Accepted: 31 October 2023 / Published: 4 November 2023
(This article belongs to the Special Issue Environmental Risk Assessment—Health and Safety)

Abstract

:
Considering the impact of COVID-19 on hospital facilities and the relevance of risk management and occupational health and safety within this context, this study introduces a method to assess the SARS-CoV-2 virus transmission risk in a toilet. The proposed method is based on a risk tripod involving environmental, human, and transmission factors. For this, risk assessment methodologies were applied, such as Failure Modes and Effects Analysis (FMEA), Ergonomic Work Analysis (EWA), which allowed the identification of risk indicators, and Fault Tree Analysis (FTA), which allowed the identification of transmission routes of COVID-19 in toilets. Subsequently, the Analytic Hierarchy Process (AHP) was used to find each transmission route weighting for calculating the Risk Score. The results indicated that the design of sanitary equipment, with an emphasis on washbasins and toilets, especially in health or large circulation establishments, is of paramount importance in the dissemination of pathogens. Safe habits and the use of protective gear must be continuously encouraged, but greater attention must be paid to technical and engineering issues. Furthermore, the developed method proved to be an applicable tool to identify the main sources of risk and prioritize the implementation of control measures.

1. Introduction

In December 2019, in the city of Wuhan, China, there was human transmission of a new coronavirus, SARS-CoV-2. A few months later, the World Health Organization (WHO) declared the COVID-19 pandemic, which lasted more than three years with more than 700 million confirmed cases, including more than 6 million deaths, according to data available on the WHO Coronavirus Dashboard [1]. Despite the WHO officially having declared the end of the COVID-19 pandemic health emergency in May 2023, the virus continues circulating, as happened with the influenza virus. The emergence of new pathogens that cause epidemics and pandemics is recurrent in humanity. In this way, experts suggest that the world should be better prepared to face a new pandemic in the future.
In this context, hospital units deserve great attention due to the pressure exerted on them during pandemic events, as occurred in the case of COVID-19. In order to contain disease spread in these units, numerous internal protocols were created—the use of Personal Protective Equipment (PPE), physical barriers, case mapping, quarantine, and return to work protocols, among others. However, the implementation of these measures was not able to prevent the collapse of the health system in many countries, pointing to a gap.
The rationale behind the present study is represented by the COVID-19 pandemic and its impact on the environmental safety of hospital facilities. The development of new risk assessment tools allowing the prioritization of specific actions is essential for allowing hospital units to cope effectively with pandemic requirements, assuming both the proper care of patients and the health and safety of patients, teams, and surrounding communities.
The main objective of this study is to propose a practical and objective method for assessing the risks of spreading SARS-CoV-2 pathogens in a hospital environment. At this point, it is emphasized that, due to the complexity of the hospital environment, it was necessary to delimit the study area of this research. Thus, a toilet located inside a hospital unit was selected, given its unhealthy and opportunistic aspect for pathogen spread, and because it is a restricted internal space and, in general, poorly ventilated and with a high circulation of people.
The proposed methodology was based on the selection of specific indicators for the studied environment, a toilet, and for the pathogen in question, SARS-CoV-2. Known risk assessment techniques were applied, such as Failure Modes and Effects Analysis (FMEA), Fault Tree Analysis (FTA), Ergonomic Work Analysis (EWA), and Analytic Hierarchy Process (AHP).

2. Literature Review

2.1. About COVID-19 Transmission

Individuals release respiratory fluids during the simple acts of breathing, talking, singing, exercising, coughing, and sneezing. These fluids are released in the form of droplets in a spectrum of sizes [2]. The size of these particles depends on the characteristics of the fluid, the force and pressure at the time of emission, and environmental conditions such as temperature, relative humidity, and ventilation [3].
The term “airborne transmission” is related to disease spread by droplet aerosols and droplet nuclei, while “droplet transmission” is related to infection by large droplet aerosols [4]. The limit for airborne transmission was defined as 5 μm [5]. Exposure to the SARS-CoV-2 virus that causes COVID-19 occurs in three main ways [2]:
  • Inhalation of air containing very small droplets and aerosol particles that contain infectious viruses;
  • Deposition of virus carried in droplets and exhaled particles on exposed mucous membranes;
  • Touching mucous membranes with hands soiled by exhaled respiratory fluids containing viruses or touching inanimate surfaces contaminated with viruses.
Direct respiratory transmission from person to person appears to be the main route of transmission of SARS-CoV-2 [6]. Regarding airborne transmission, factors that increase the risk of SARS-CoV-2 infection under these circumstances include enclosed spaces with inadequate ventilation and/or air handling, considering that inhalable particles can remain in the air for a long time and reach greater distances [2]. However, the overall rates of disease transmission suggest that airborne transmission is not a primary mode [7].
On the other hand, the transmission risk through indirect contact—for example, through handling contaminated items—is not well established and is probably very low [8]. However, a recent systematic review and meta-analysis suggest that SARS-CoV-2 transmission through fomites exists and may have been under-appreciated due to methodologic shortcomings in many early studies during the pandemic, especially studies that included patients with high CT values that lacked infectiousness or that were sampled at a late stage in the infection, which meant that replication-competent viruses were not detected in environmental samples, underestimating the true nature of positive fomite samples and leading to erroneous conclusions [9].
SARS-CoV-2 has also been detected in non-respiratory specimens, including feces, blood, eye secretions, and semen, but the role of these vectors in transmission is unclear [8]. Despite the numerous studies in the literature pointing to the potential fecal–oral transmission of the virus, transmission through this route does not seem to be a significant factor in the spread of the infection [10].

Decisive Environmental Factors in the Spread of SARS-CoV-2

One of the decisive environmental factors in the spread of SARS-CoV-2 is sunlight incidence. Low-dose far UVC light is a promising, safe, and inexpensive tool for use in indoor public places to reduce the spread of airborne microbial disease. It can efficiently inactivate sensitive and resistant bacteria, as well as different virus strains [11]. The virus that causes COVID-19 can be rapidly inactivated by sunlight on surfaces, suggesting that the persistence and risk of subsequent exposure can vary significantly between indoor and outdoor environments. Thus, sunlight can also be considered a mitigation strategy to minimize the potential for aerosol transmission [12].
Another factor that should be mentioned is the heating, ventilating, and air conditioning (HVAC) system. Maintaining environmental conditions involving adequate ventilation, temperature, and humidity control is important not only for comfort but also for preventing the proliferation and transmission of microorganisms [13]. Ideally, an HVAC system should work in conjunction with exhaust and pressurization to isolate or contain contaminants in certain areas [14].
Temperature and humidity are other environmental factors that impact SARS-CoV-2 stability and the response of the host’s immune system [15]. Regarding the literature recommendations, the American Institute of Architects (AIA) states that, in areas that require a greater degree of comfort for the patient, a temperature of 24 °C is adequate [16]. Regarding humidity, the Occupational Safety and Health Administration (OSHA) and ASHRAE advise keeping relative humidity between 40 and 60% [17,18]. Furthermore, low humidity increases the survival rate of pathogens and decreases the effectiveness of hand hygiene and surface cleaning due to surface recontamination or disinfectants drying too quickly.
Authors have studied the influence of temperature and humidity on several COVID-19 cases on a global scale. Some results show that cities with wide temperature variations showed a negative correlation between temperature and COVID-19 transmission [19,20]. However, regarding relative humidity, a strong correlation was not established [19].
Rubin et al. [21] collected data from 46 states in the United States and concluded that the viral reproduction number of SARS-CoV-2 decreased when the temperature was in the range from 0 °C to 11 °C, and greater than 20 °C, having increased when the temperature was between 11 °C and 20 °C, reinforcing Krishnan et al. [22]’s results indicating that all human pathogens are mesophiles and experience best growth at a moderate temperature.
Regarding relative humidity, Casanova et al. [23] showed that at above 80% or less than 20%, most coronaviruses are still active after 2 days at a constant temperature of 20 °C. Also, according to the authors, at a constant temperature and relative humidity of 50%, less than 1% of the viruses survived after 2 days. The same study recommends that, to contain the spread of the COVID-19 virus, the ambient temperature should be established in the range from 25 °C to 27 °C, and the relative humidity between 50% and 70%.
Finally, the surface materials are another important factor related to SARS-CoV-2 spread. Van Doremalen et al. [24]’s research consisted of ten experiments involving coronaviruses and demonstrated that SARS-CoV-2 was more stable on plastic and stainless steel than on copper—the estimated mean half-life was approximately 5.6 h on stainless steel, 6.8 h on plastic, and 1 h on copper. A viable virus was detected up to 72 h after application on these surfaces. Aboubakr et al. [25] concluded that the persistence of SARS-CoV-1 and SARS-CoV-2 is significantly low on copper, latex, and less porous fabrics compared to surfaces such as metals (stainless steel and zinc), glass, and more porous fabrics.
Wei et al. [26] state that a drop in temperature and humidity strengthens the stability of the virus in stainless steel, corroborating with the results of Chan et al. [27] that a high temperature combined with a high relative humidity has a synergistic effect in inactivating the viability of SARS-CoV. Moreover, Riddell et al. [28] state that, at 20 °C and 50% relative humidity, the inoculated SARS-CoV-2 was still detectable after 28 days for all non-porous surfaces tested—glass, polymer banknotes, stainless steel, vinyl, and paper banknotes. At 30 °C, the virus was detected for 7 days on stainless steel, polymer grades, and glass, and for 3 days on vinyl and cotton fabric. Finally, at 40 °C, there was a significant reduction compared to the 20 °C and 30 °C experiments, with SARS-CoV-2 not being detected after 24 h for cotton fabric and 48 h for the other surfaces tested.

2.2. The Case of Toilets and Restrooms

The literature presents a lot of evidence about air contamination in restrooms. Previous studies have shown that aerosolized bacteria and viruses from toilet flushing can remain airborne long enough to establish themselves on surfaces throughout the bathroom [29]. For example, a recent systematic review assessed the degree of SARS-CoV-2 air contamination in hospitals and concluded that 24% of bathroom air samples tested positive, with mean viral RNA concentrations per cubic meter of air higher than for any other area sampled [30].
Amoah et al. [31] concluded that 53–63% of bathroom surfaces were contaminated with SARS-CoV-2. The highest concentration of the virus was found on the toilet seat and on the cistern discharge handle [31]. The SARS-CoV-2 virus has been also recovered from toilet seats, bathroom door handles, and sinks in SARS-CoV-2 infected patient’s restrooms [32].
People infected with enteric viruses can shed 1010–1012 viruses per gram of stool. Infectious viruses such as those that cause encephalitis, smallpox, adenovirus, and SARS-CoV-2 have been detected in urine. Significant amounts of pathogens can be released into the urine, considering that people excrete 700 to 2000 mL of urine per day [33].

2.2.1. Toilet Flushing Problem

There is strong evidence in the literature that contamination in restrooms is related to toilet flushing, which releases aerosols into the environment. According to Ali et al. [34], existing scientific research has shown that the activity of flushing a toilet can cause the release of up to 80,000 bioaerosols into the indoor air of a bathroom, which can reach around one meter in height. Li et al. [35] observed that an average of 40% to 60% of the aerosols generated during unloading were found at a height of 106.5 cm above the floor. Bacteria and viruses seeded in the toilet before flushing were ejected from the toilet during flushing and settled on surfaces throughout the bathroom for up to two hours, with surface contamination being highest in areas closest to the toilet [36,37,38].
Abney et al. [33] present a list of factors that influence the degree of aerosolization. They are water volume in the basin used for flushing, water pressure, type of waste, biofilm, the existence of chlorine, automatic cleaning of the basin, and position of the lid—lowered or raised. Furthermore, Gormley et al. [39] indicated that the reduction in the number of emitted particles is directly proportional to the reduction in the discharge volume.
Another issue is related to wastewater drainage systems in buildings. Gormley et al. [39] point out that these systems can be a potential reservoir of bacteria and viruses, especially when there are deficiencies in maintenance. The study also estimated that the number of particles emitted by the plumbing system as a result of a toilet flush is equivalent to a person talking loudly for about six and a half minutes.

2.2.2. The Washbasins Problem

Another possible source of contamination in restrooms is the washbasins. Dancer et al. [40] pointed out that, if washbasins are contaminated by nasal mucus, saliva, and/or sputum, these residues can be aerosolized when the tap water jet collides with the basin’s bottom.
Hota et al. [41] discussed the reasons for an outbreak of infection by Pseudomonas aeruginosa in patients admitted to the intensive care unit of a tertiary hospital, pointing to the formation of biofilm in sink drains as the main cause. Tests using a commercial fluorescent marker have shown that when the sink was used for hand washing, the contents of the drain splashed out at least 1 m from the sink, especially in washbasins with relatively shallow depths, between 140 mm and 150 mm [42].

3. Materials and Methods

This research adopts a mixed methodological approach, consisting of a qualitative study regarding the identification of environmental, human, and transmission factors related to the spread of SARS-CoV-2. It is also characterized as quantitative because in addition to being identified, these factors are quantified, allowing the creation of the proposed Risk Score. Finally, the research can be classified as diagnostic since a building is analyzed, so that the methodology obtained can be applied in a case study, aiming for validation.
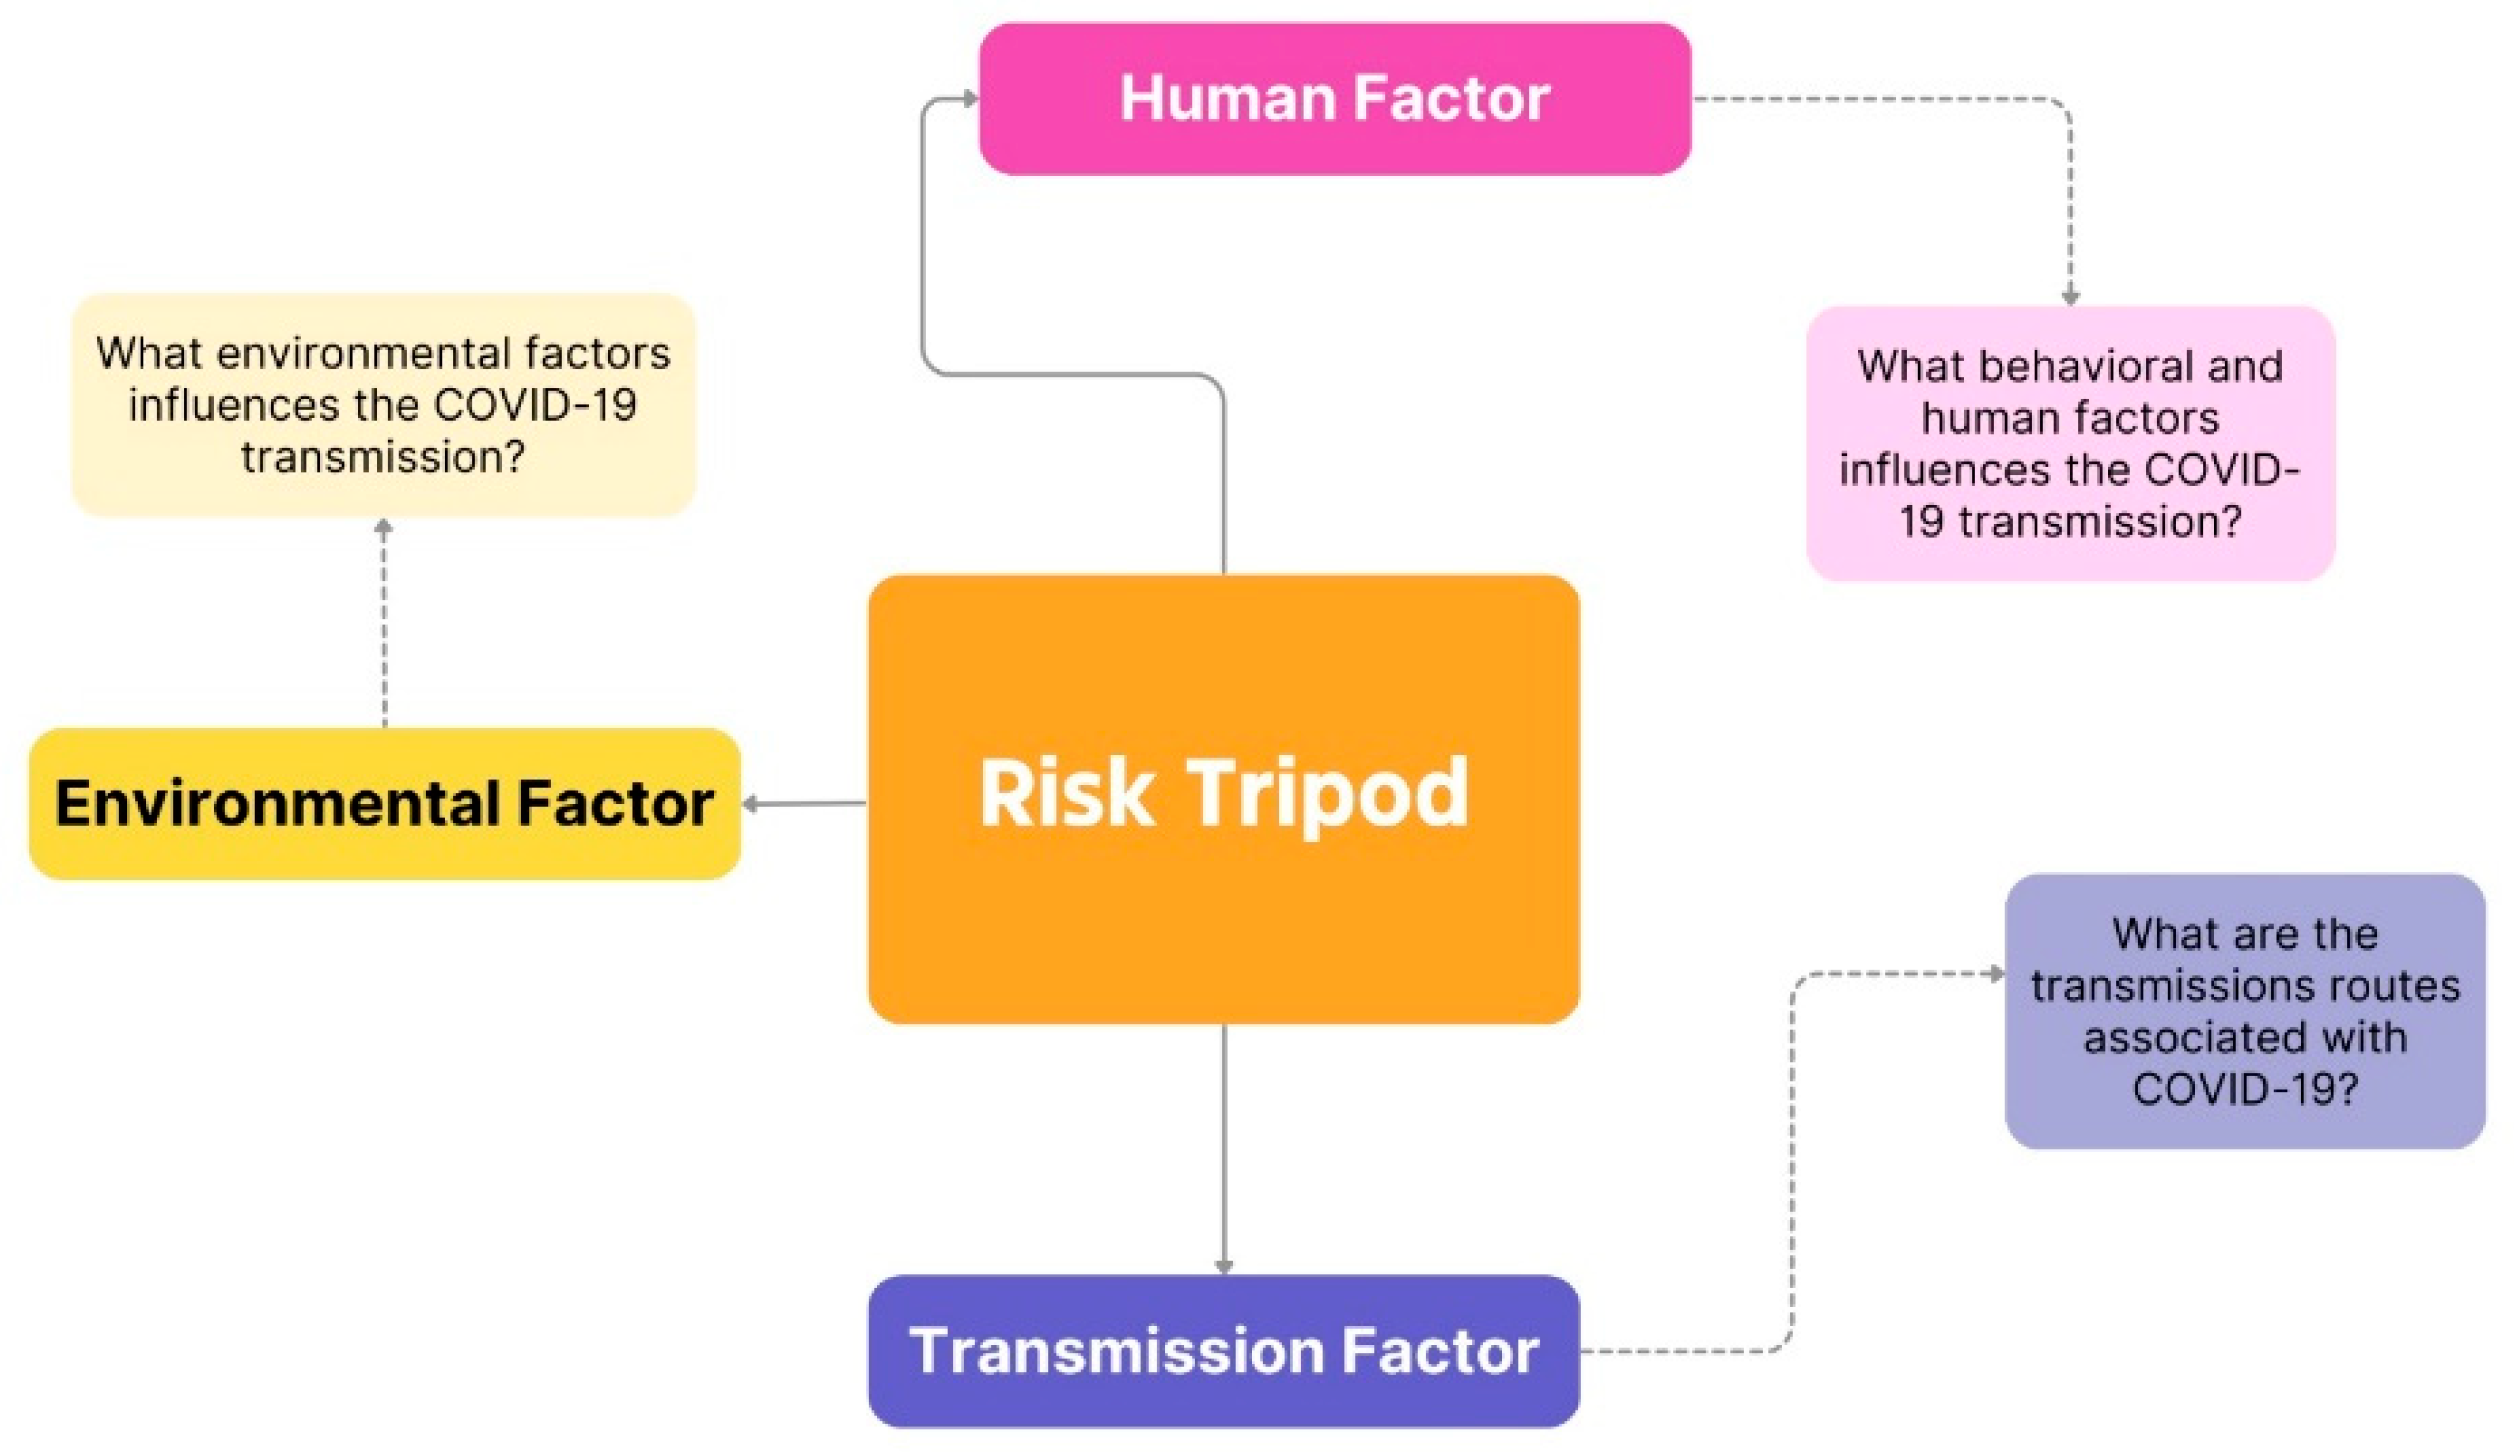
The literature review on SARS-CoV-2 transmission culminated in the identification of the three main influencing factors in the risk analysis, whose interaction can result in the main event of transmission. They are environmental, human, and transmission factors. This association of factors was named the Risk Tripod, as shown in Figure 1.
Thus, to unravel each of the tripod components, a widely known technique in the health and safety area was selected, as follows:
  • Environmental factor: Failure Modes and Effects Analysis (FMEA);
  • Human factor: Ergonomic Work Analysis (EWA);
  • Transmission factor: Fault Tree Analysis (FTA).
The subsequent sections present the theoretical basis of these techniques and their application in the present study, conducted from September 2022 through to May 2023, for each of the indicated tripod components.

3.1. Environmental Factor: FMEA

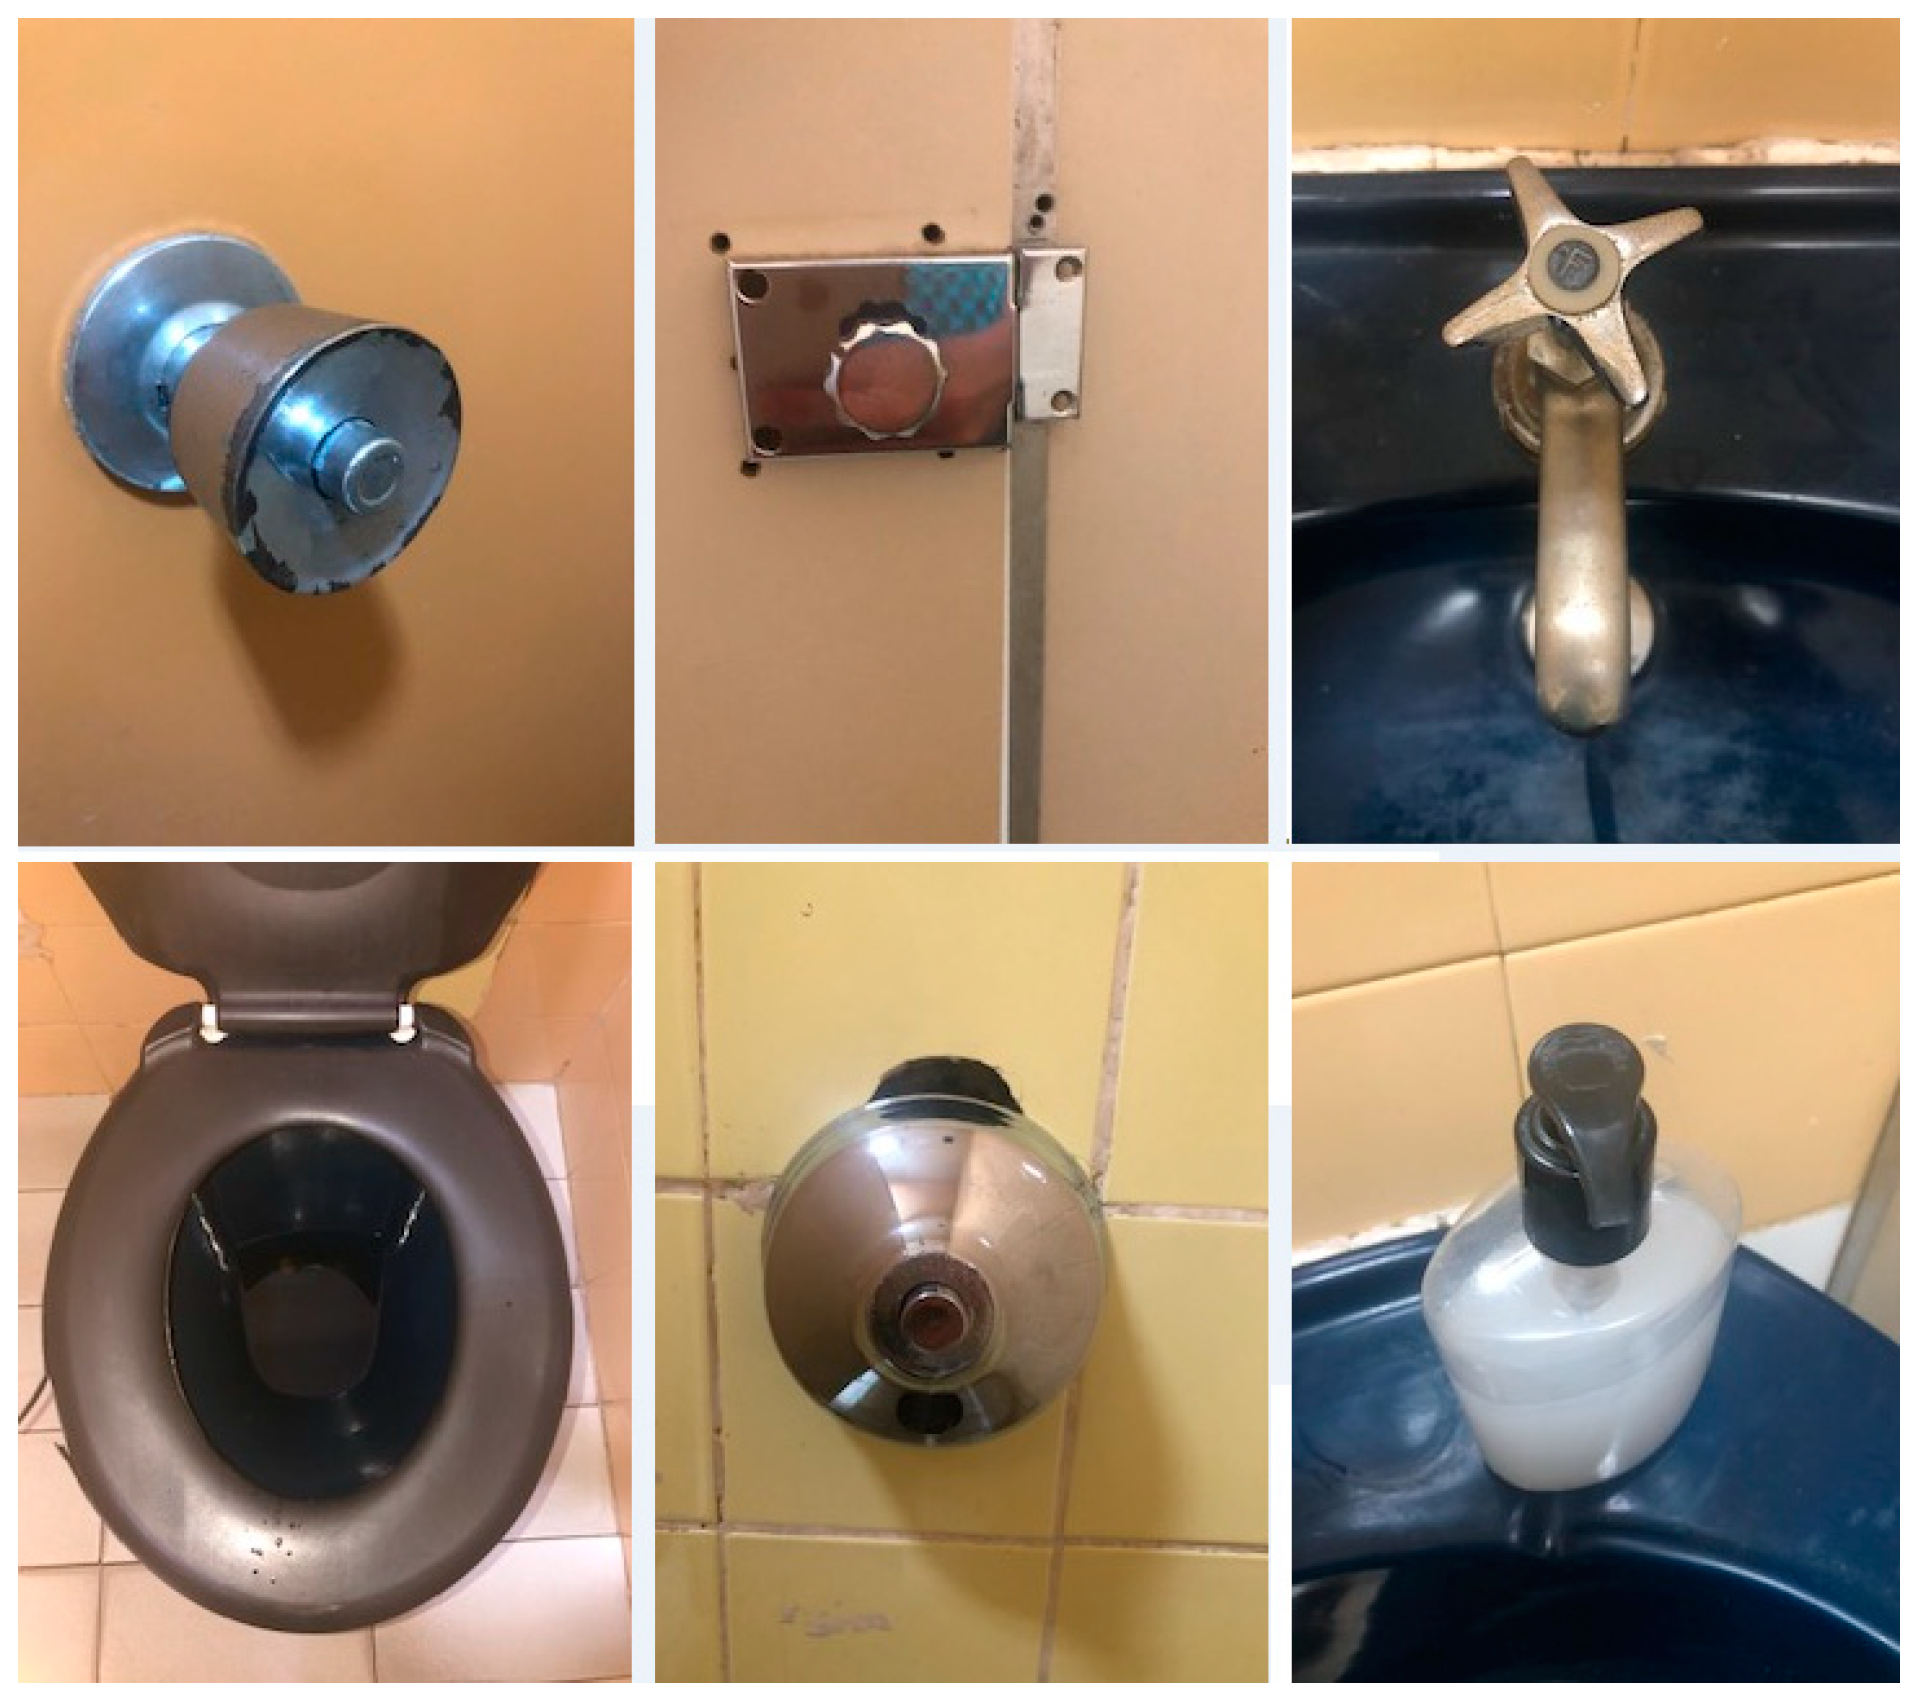
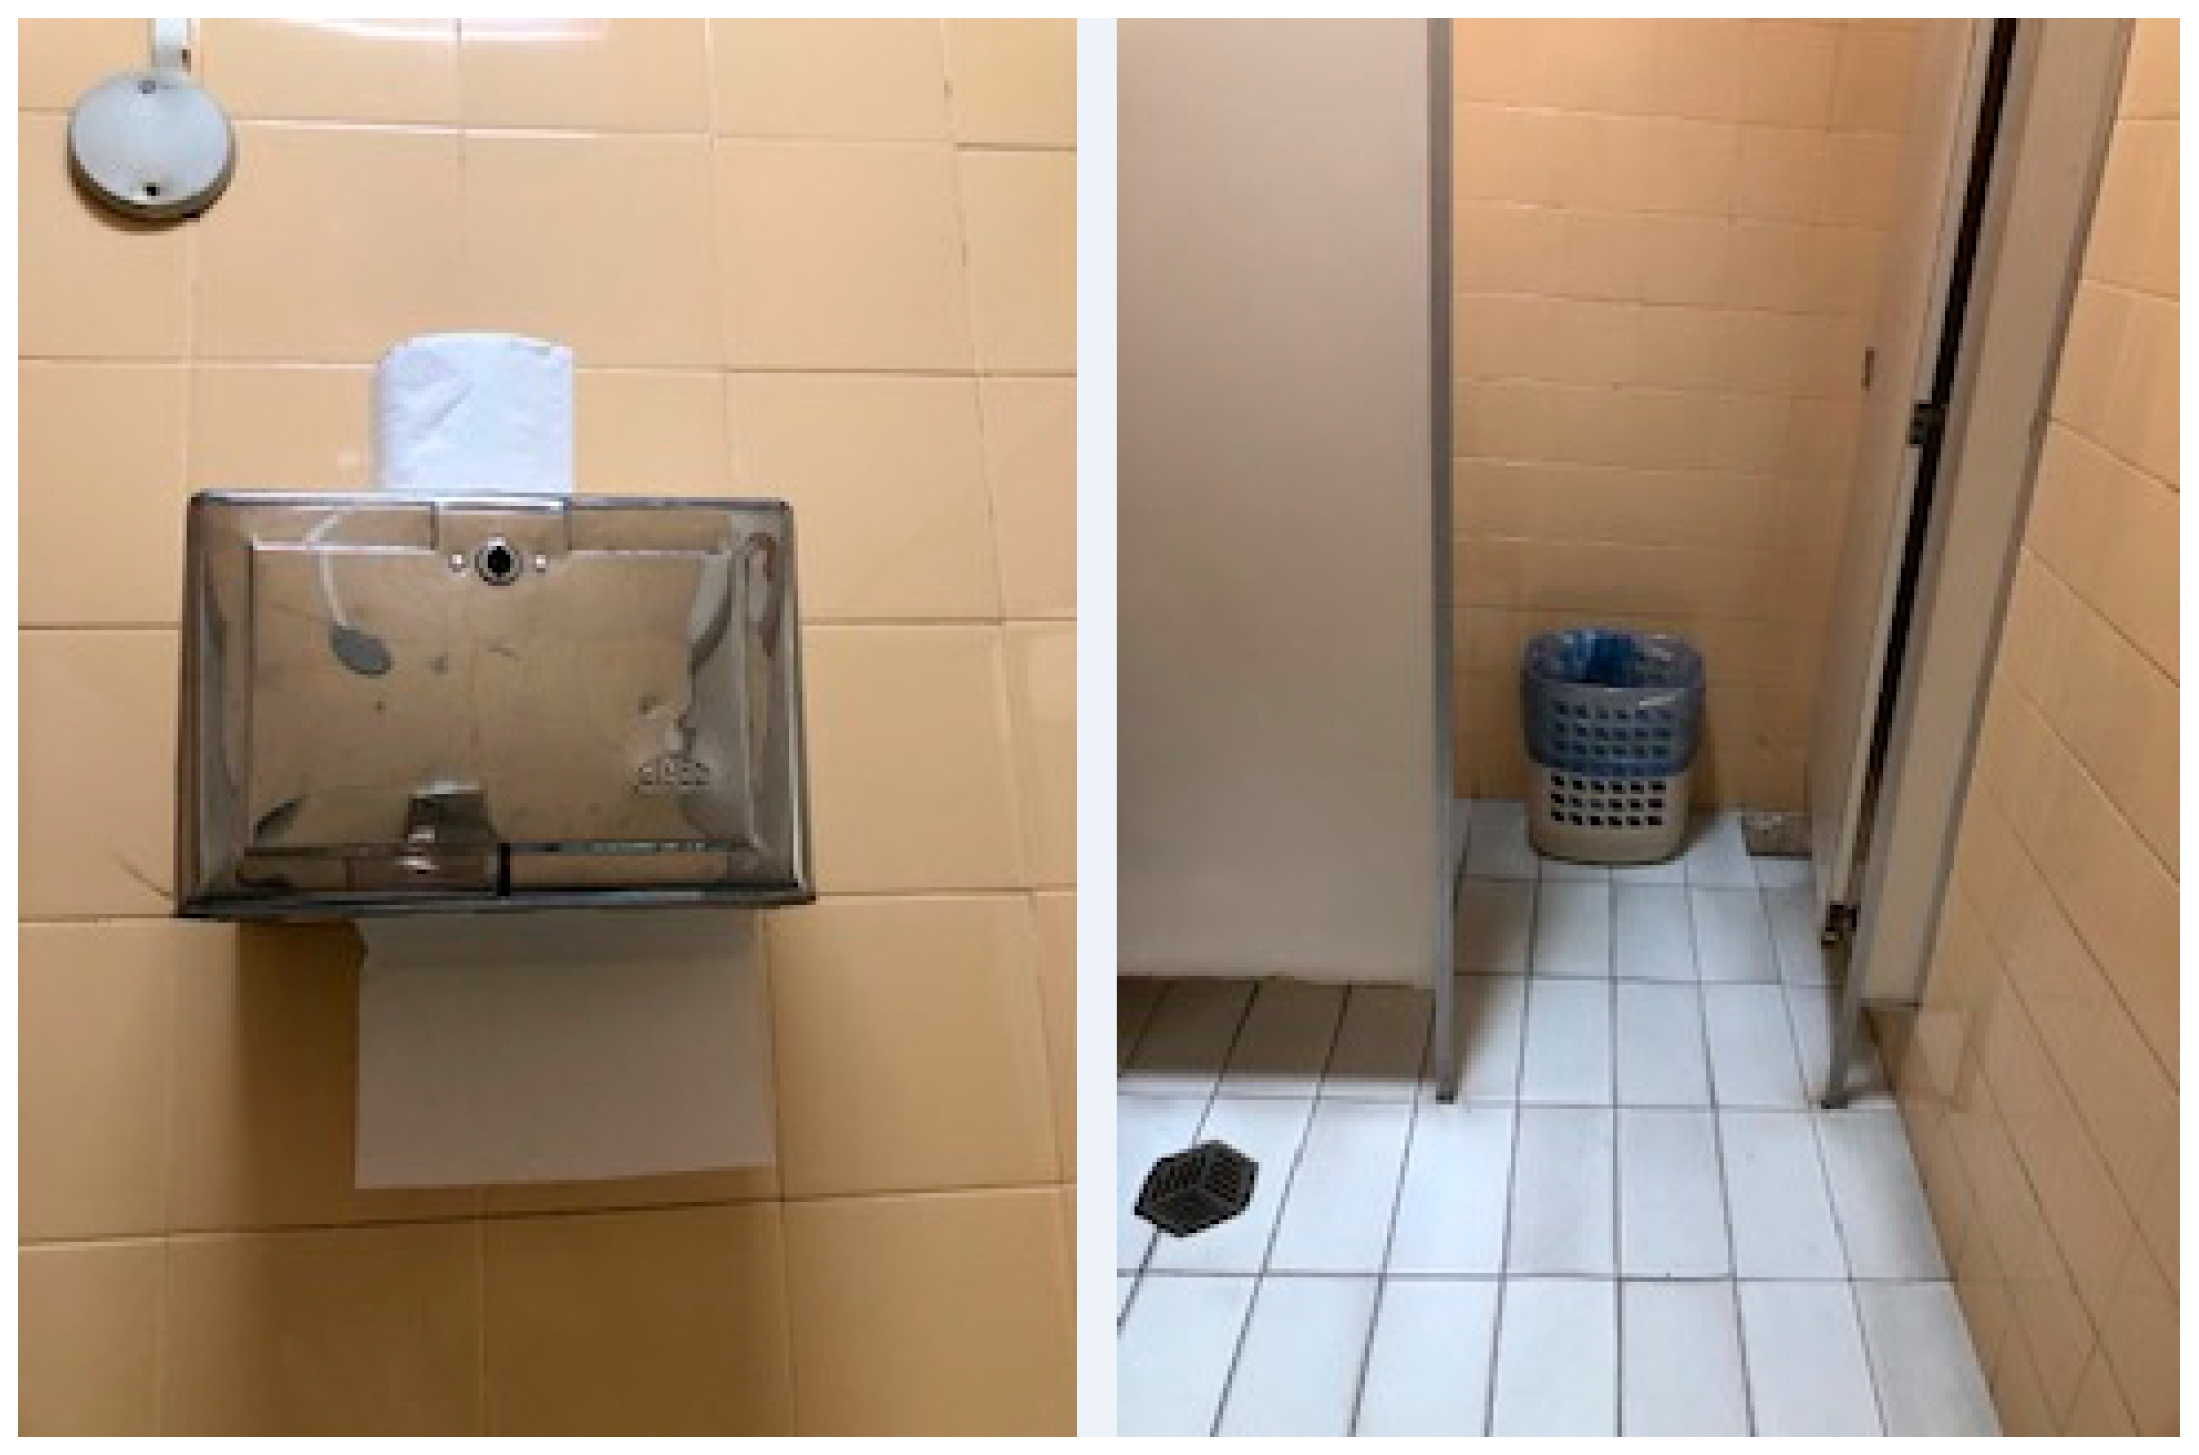
For this study, as it is a robust methodology, a simplified FMEA application was chosen, extracting from it only what was considered relevant for the present research, that is, the failure modes related to the environmental factor of the risk tripod and its causes, concerning a hypothetical single toilet located in a hospital facility. The results of the developed FMEA can be explored in Appendix A. Based on these results, it was possible to identify the risk factors related to the environmental component of the risk tripod. These factors will be classified and each of them will be assigned a score from 1 (one) to 3 (three), from the lowest to the highest risk, respectively, to calculate the risk score.

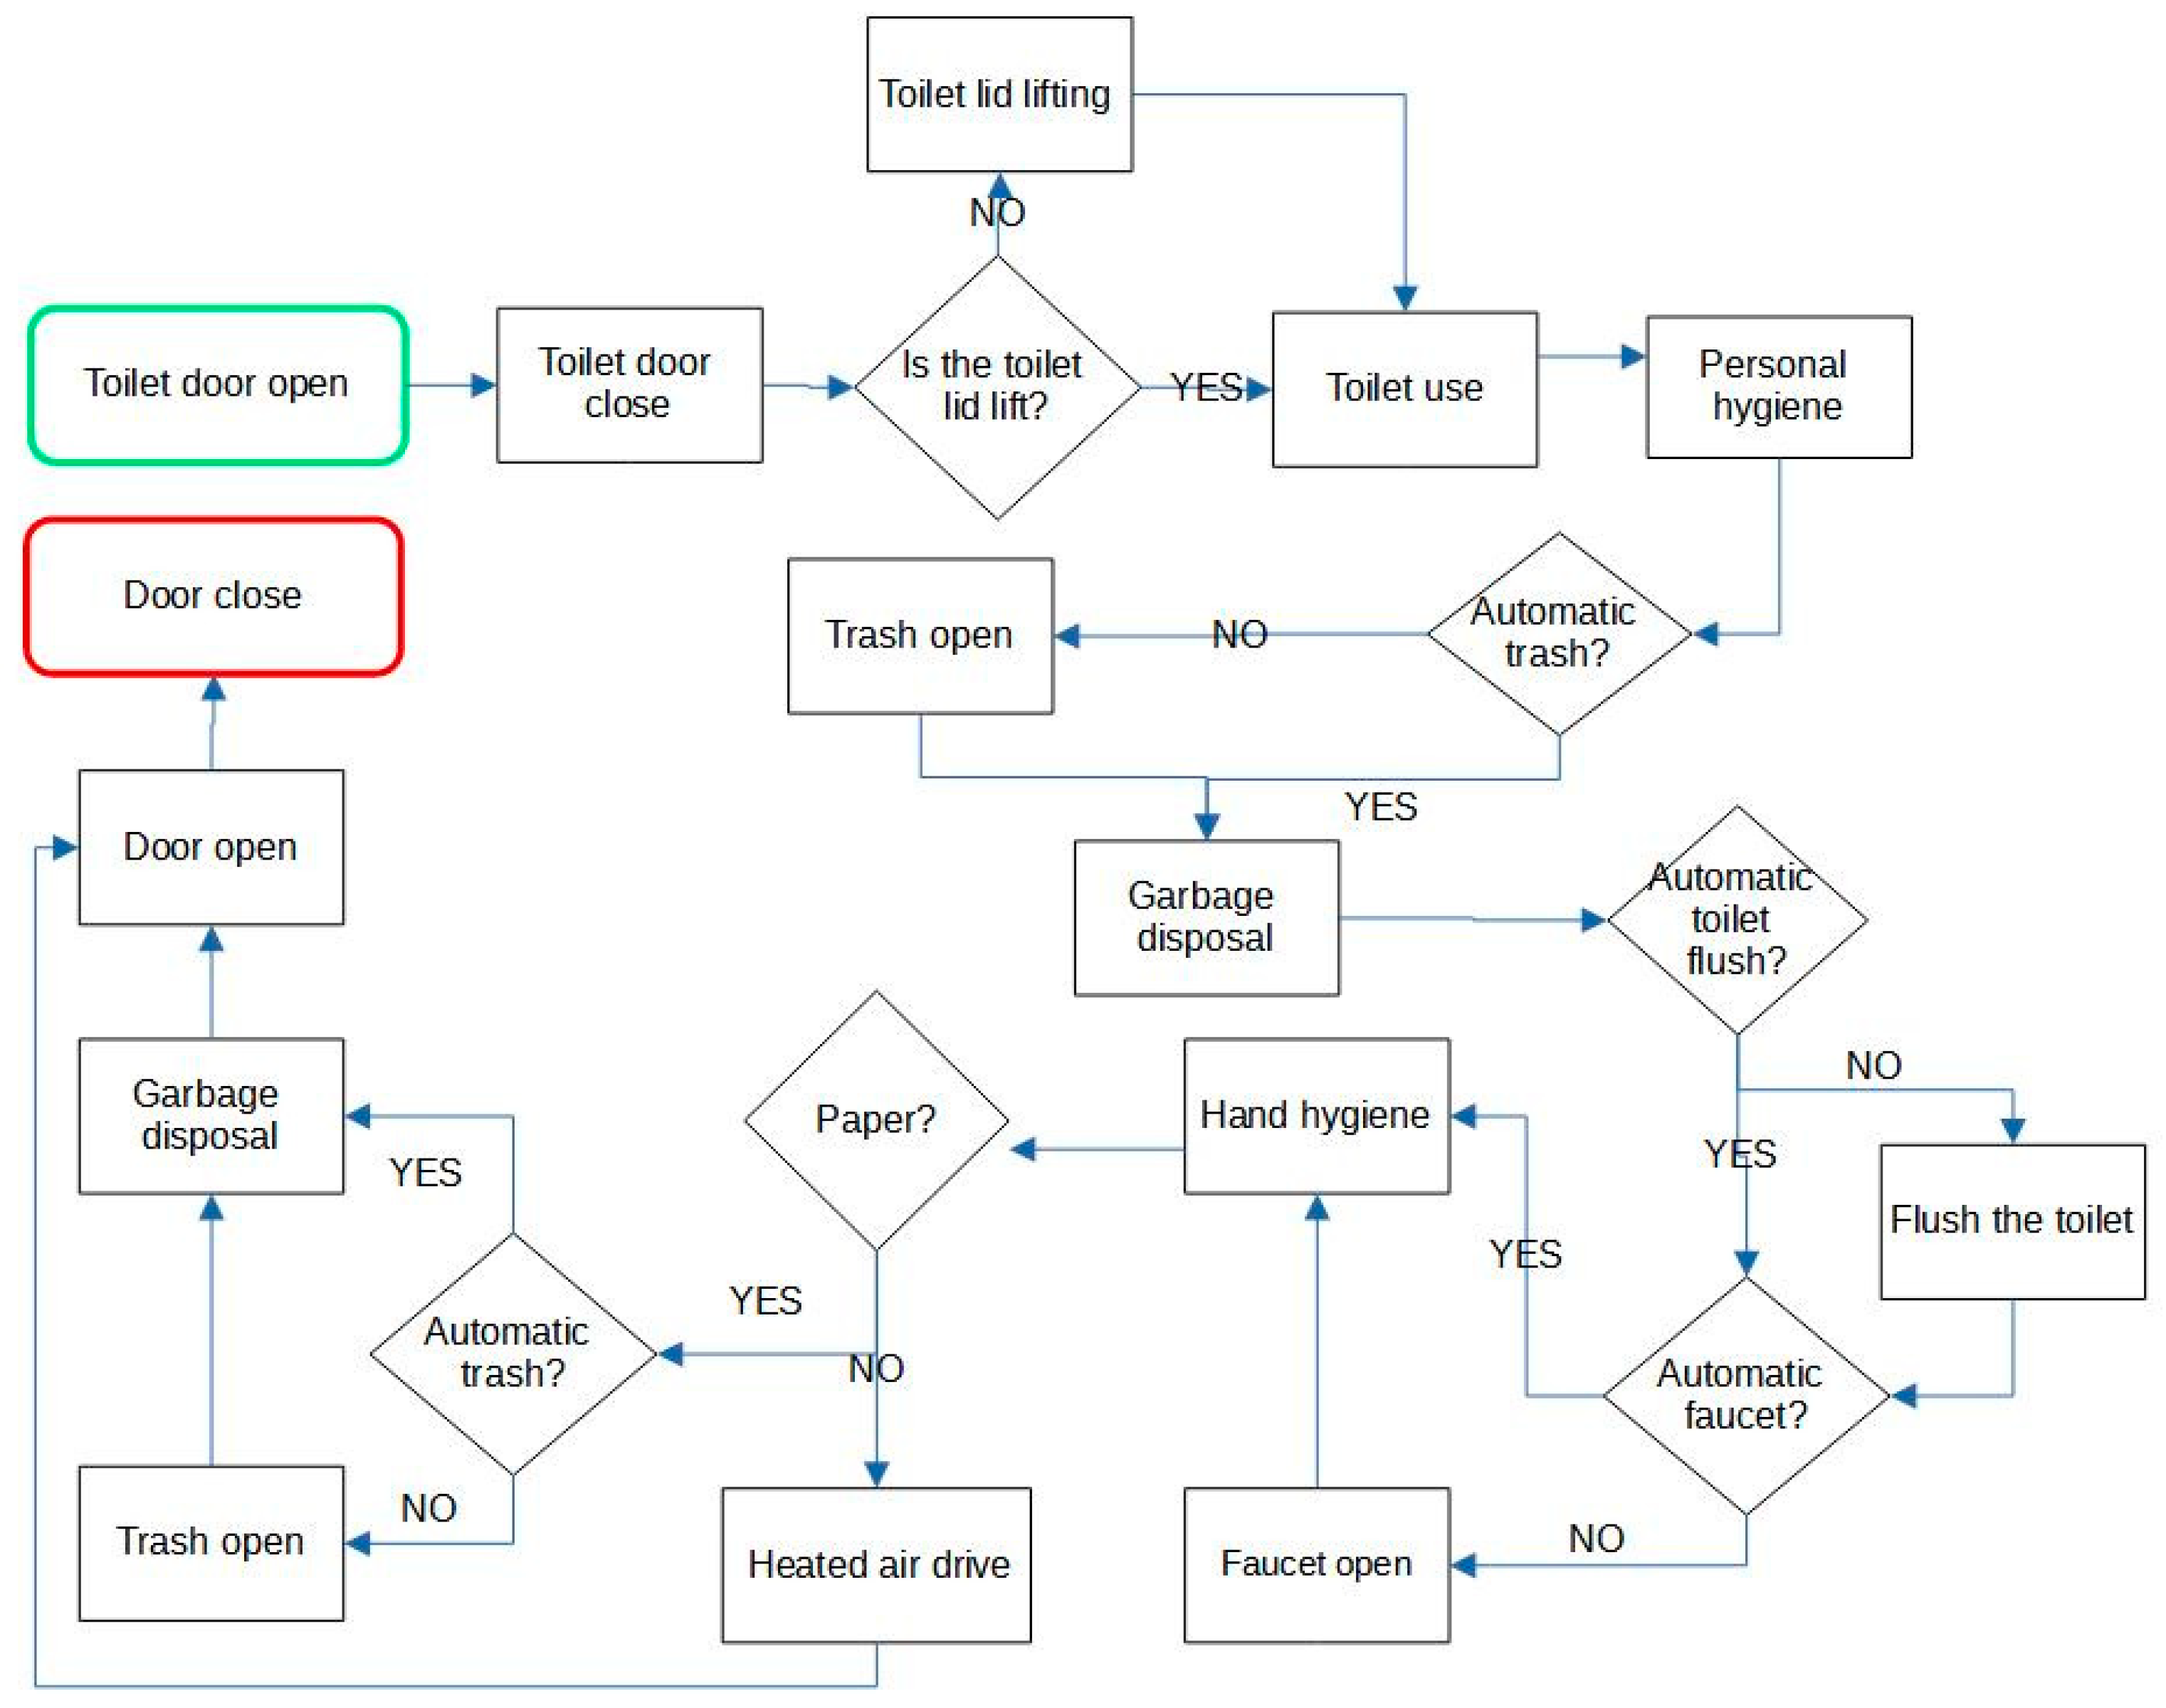
3.2. Human Factor: EWA

The first step for the EWA application in this study was to map the process of using the toilet, as seen in Figure 2. To assess the human factor, in turn, it was decided to develop a questionnaire with which it was possible to identify risk factors related to human behavior. The questionnaire was prepared based on the process steps previously mapped, and can be accessed in Appendix B. It is recommended to apply the instrument to different user groups involved in the analyzed environment. Finally, regarding the evaluation of the environment, for the most part, this evaluation was based on the application of the FMEA methodology, as previously seen. However, the EWA application allowed the identification of new environmental indicators that will be considered in the evaluation.

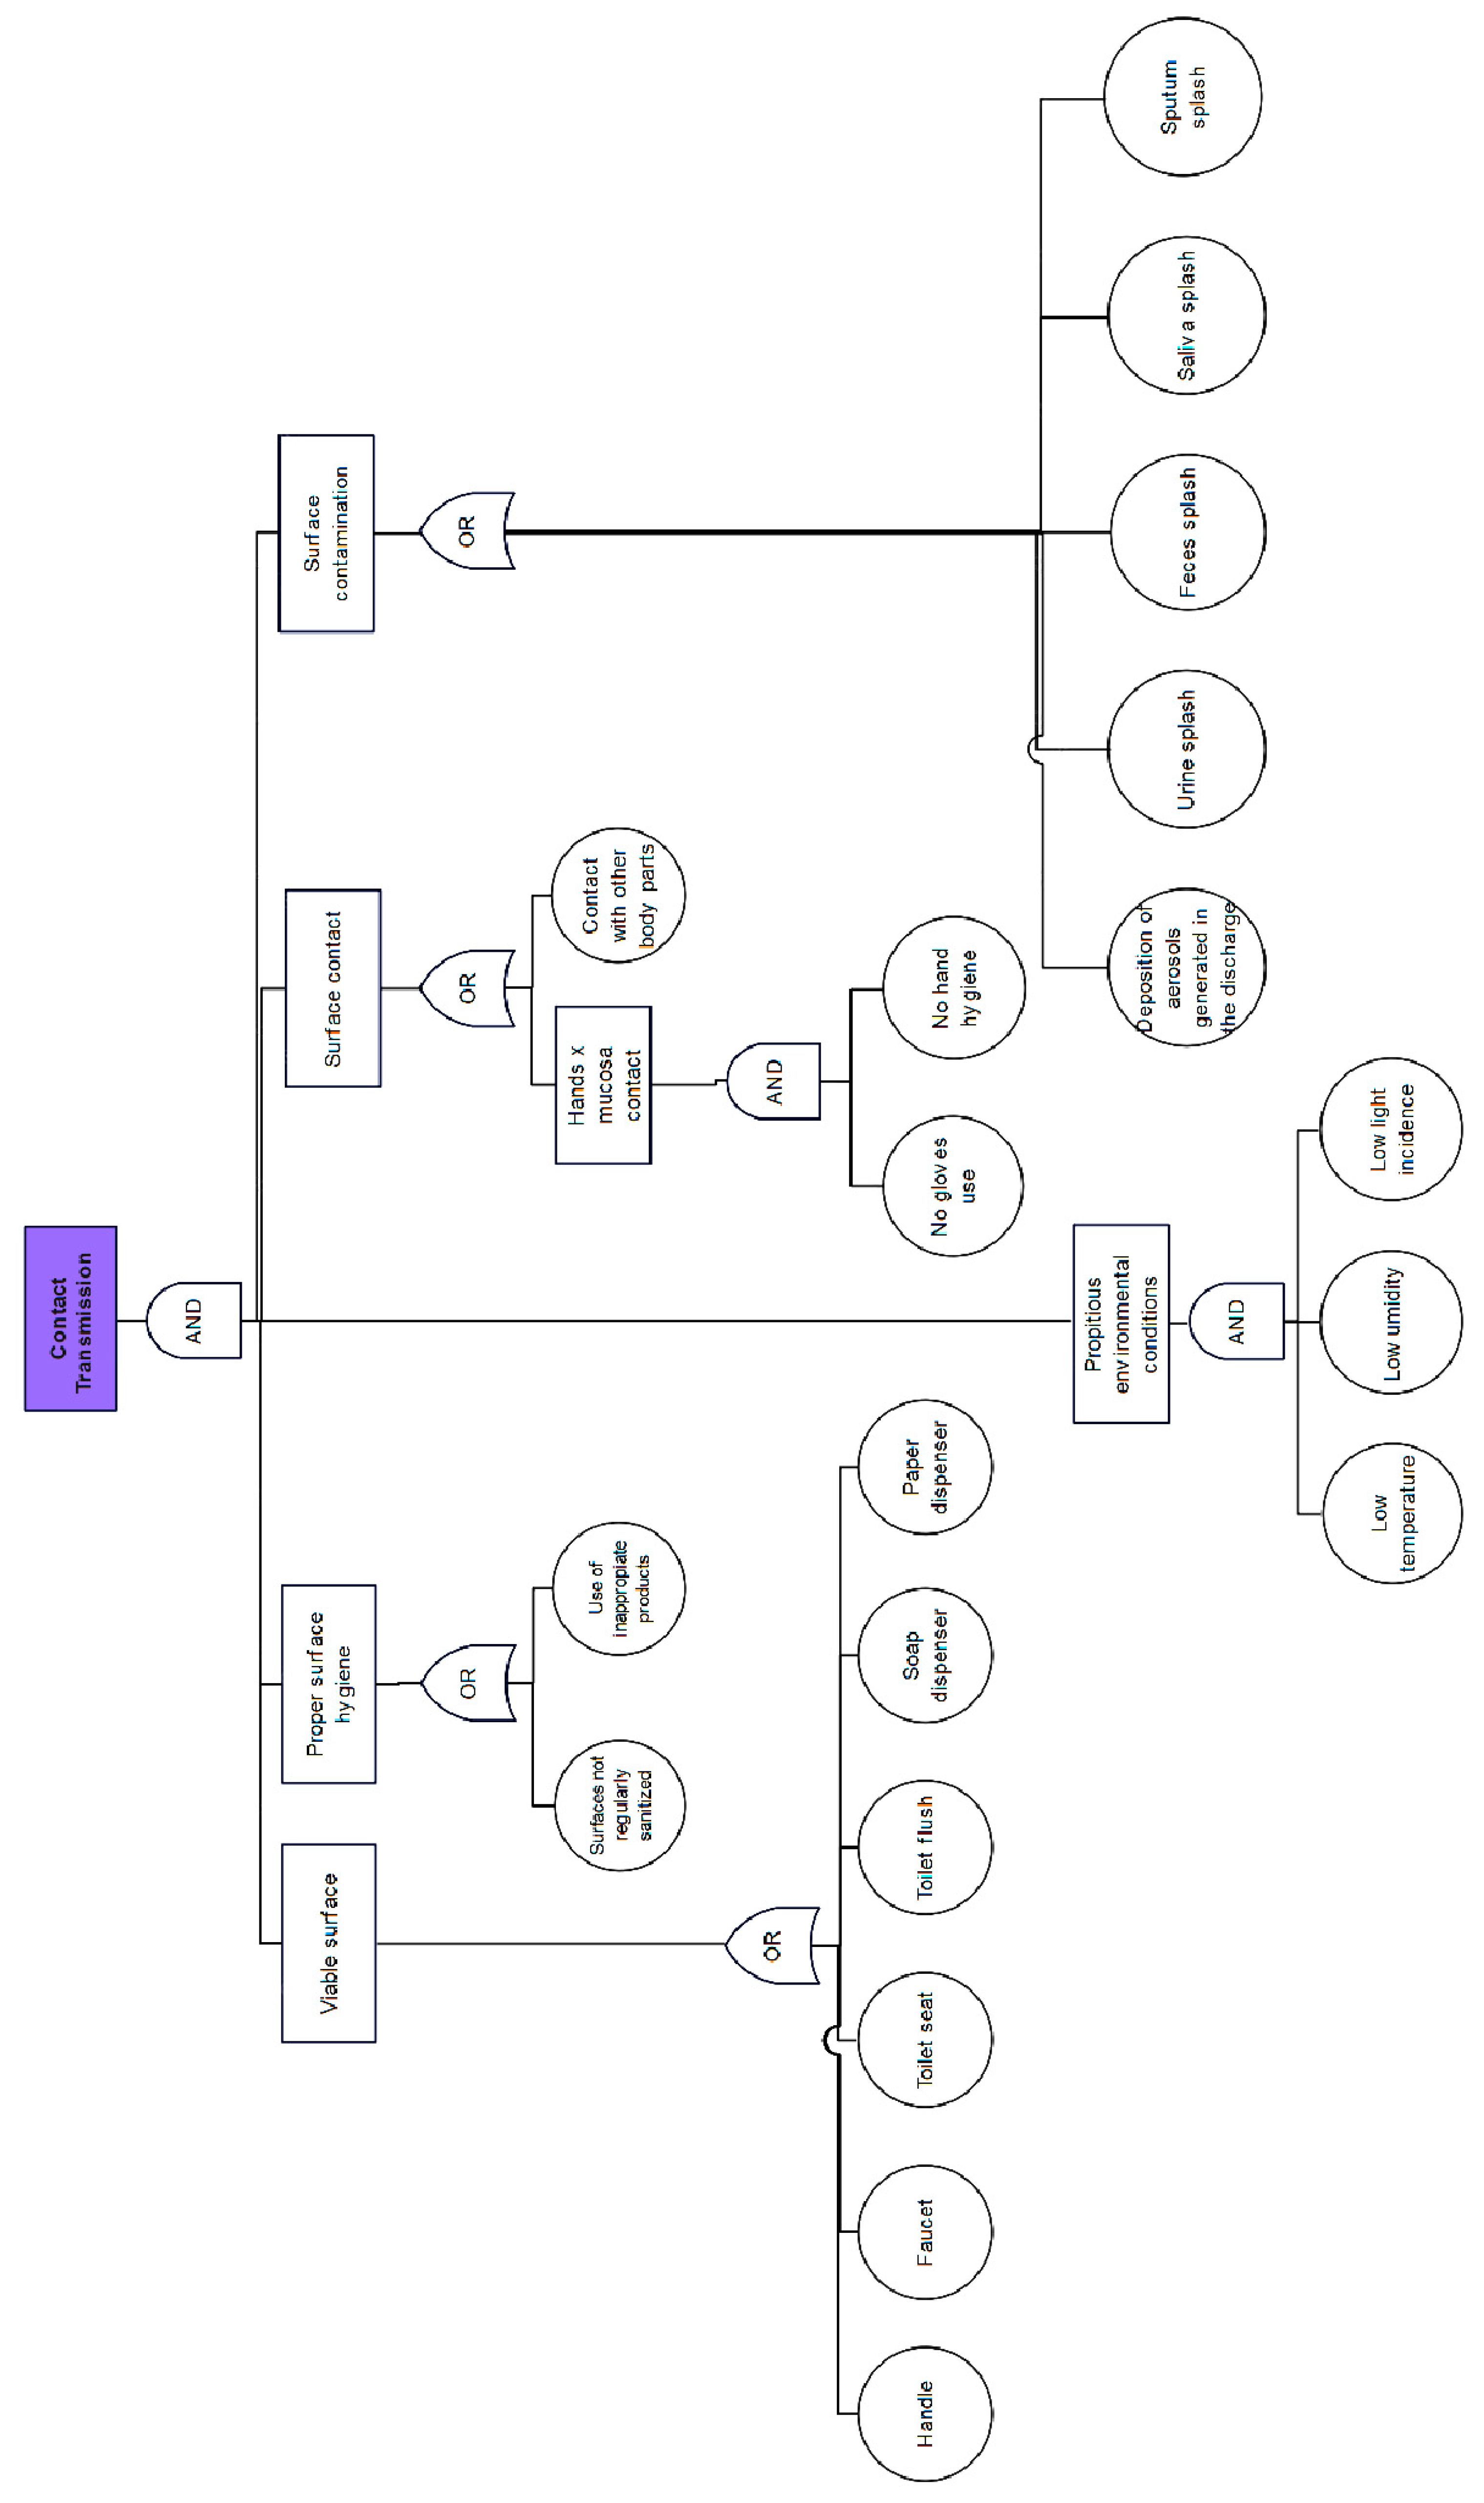
3.3. Transmission Factor: FTA

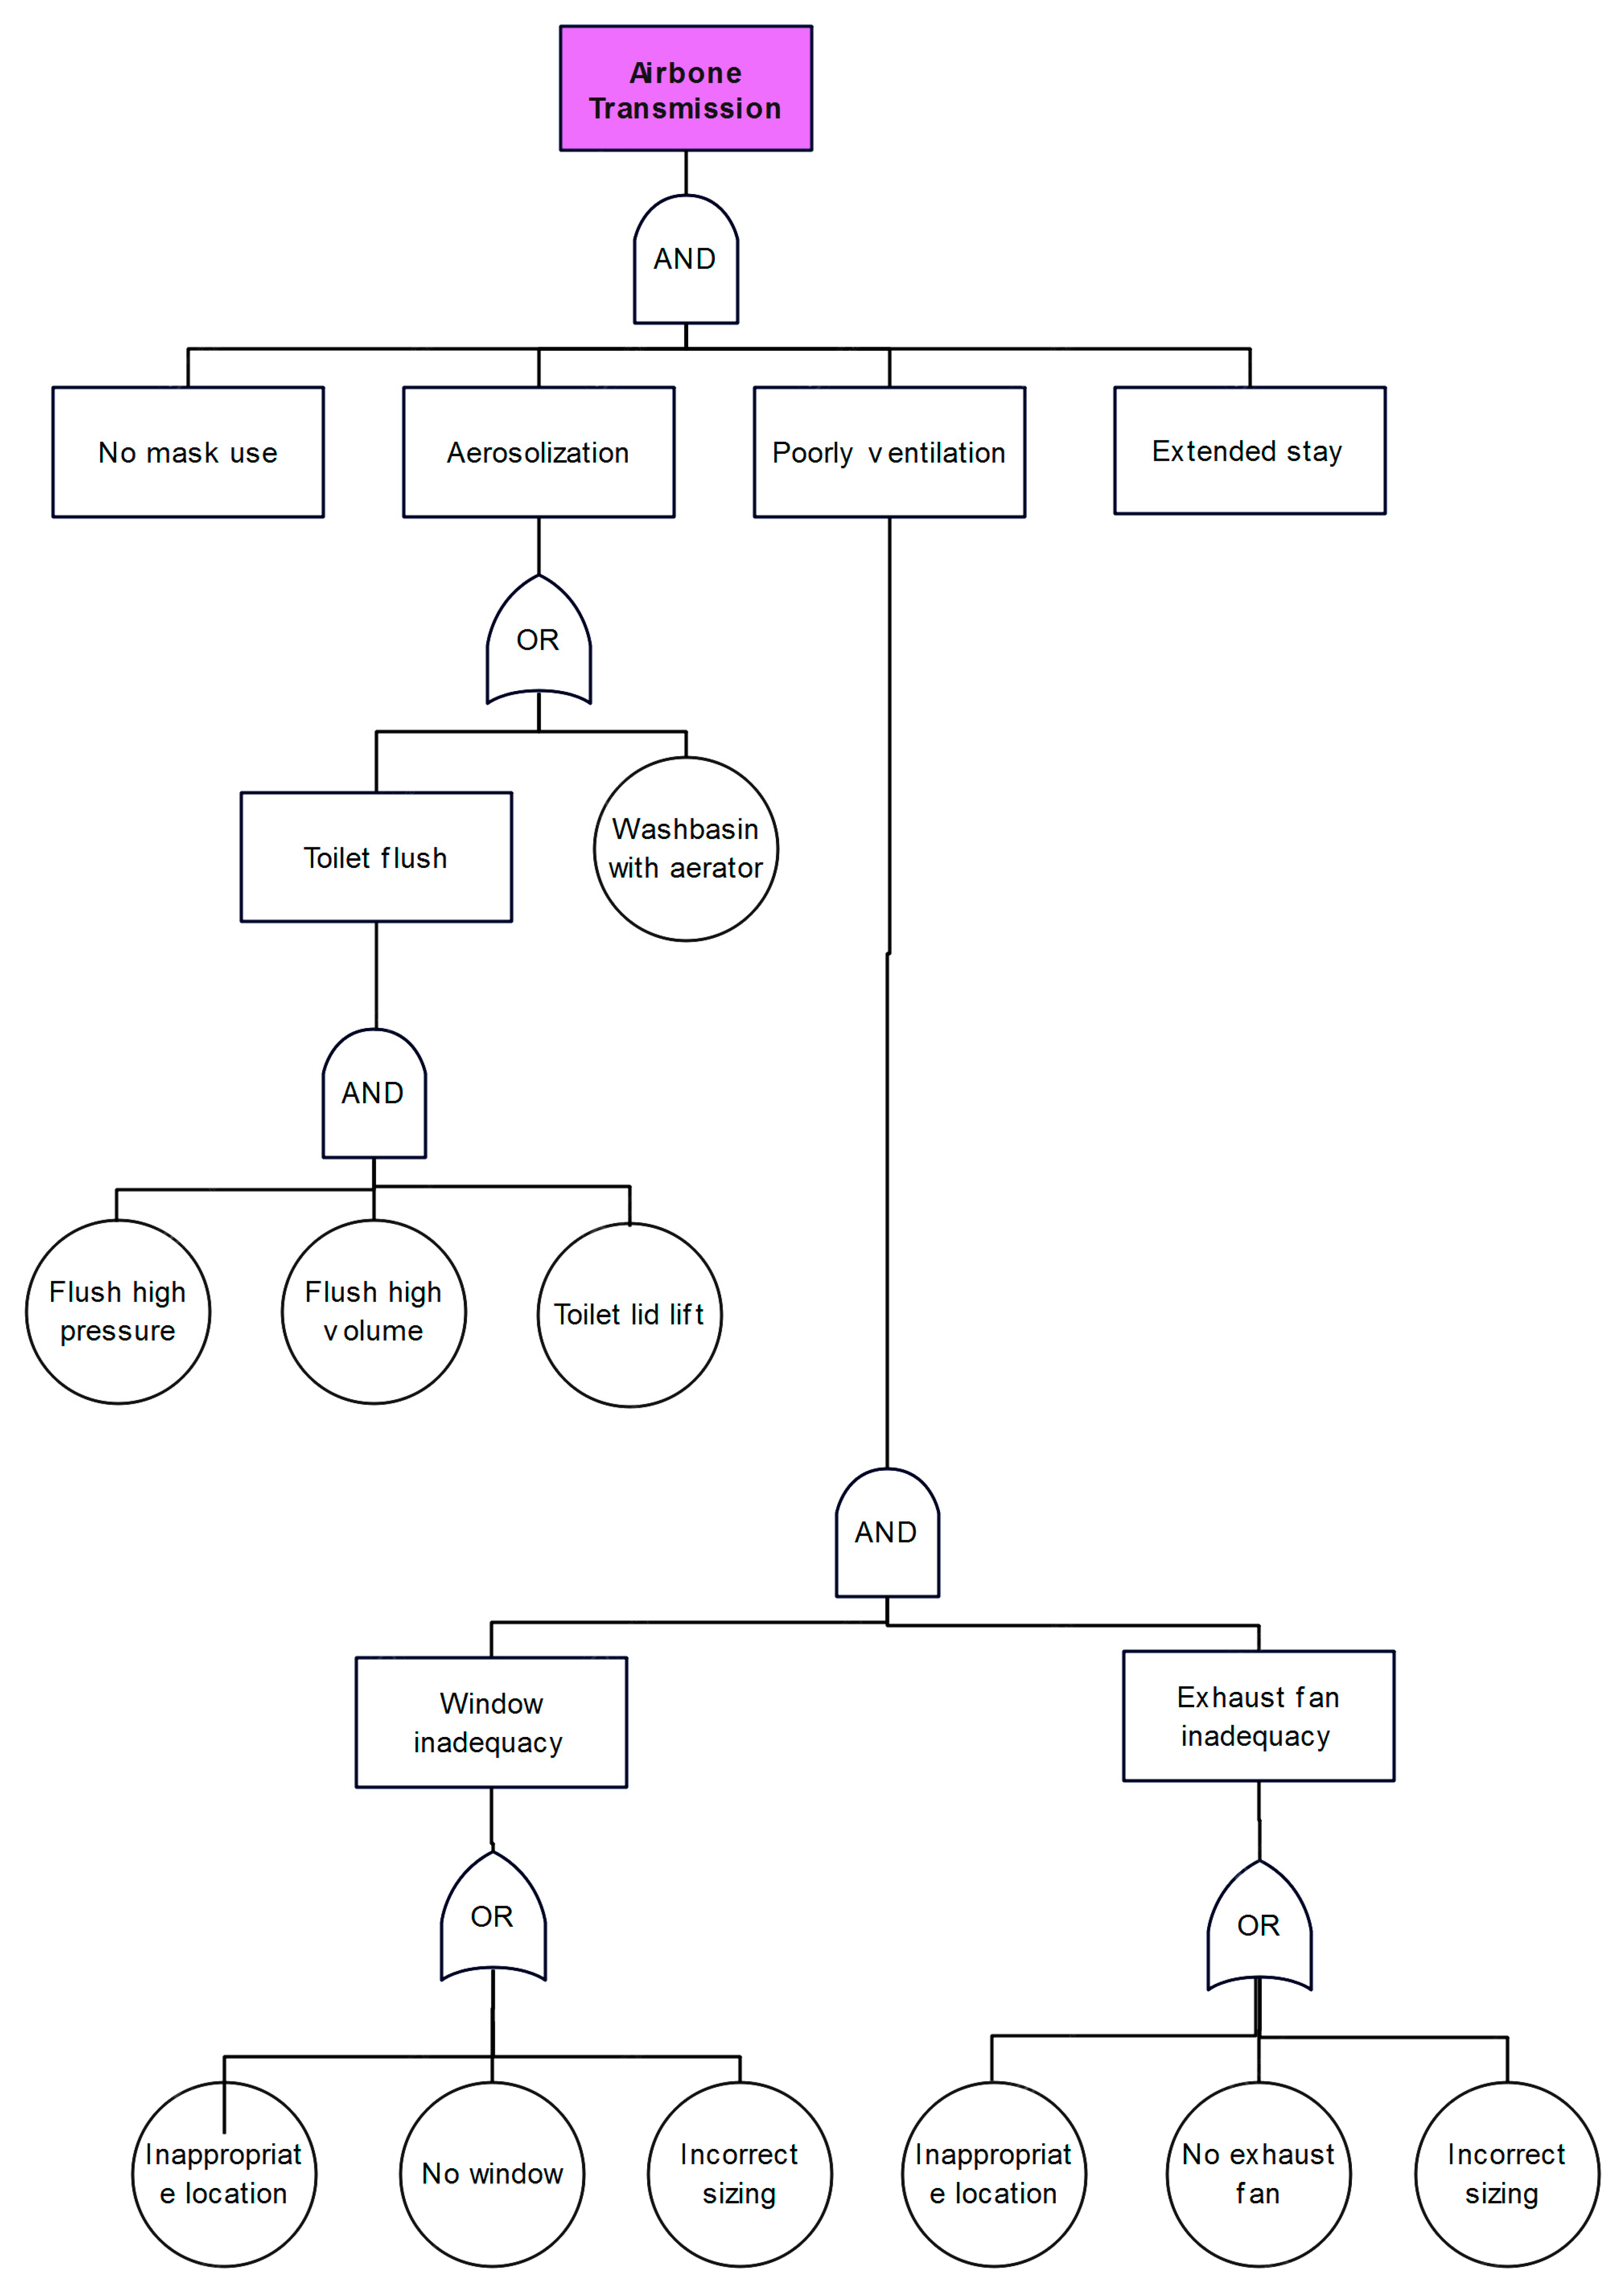
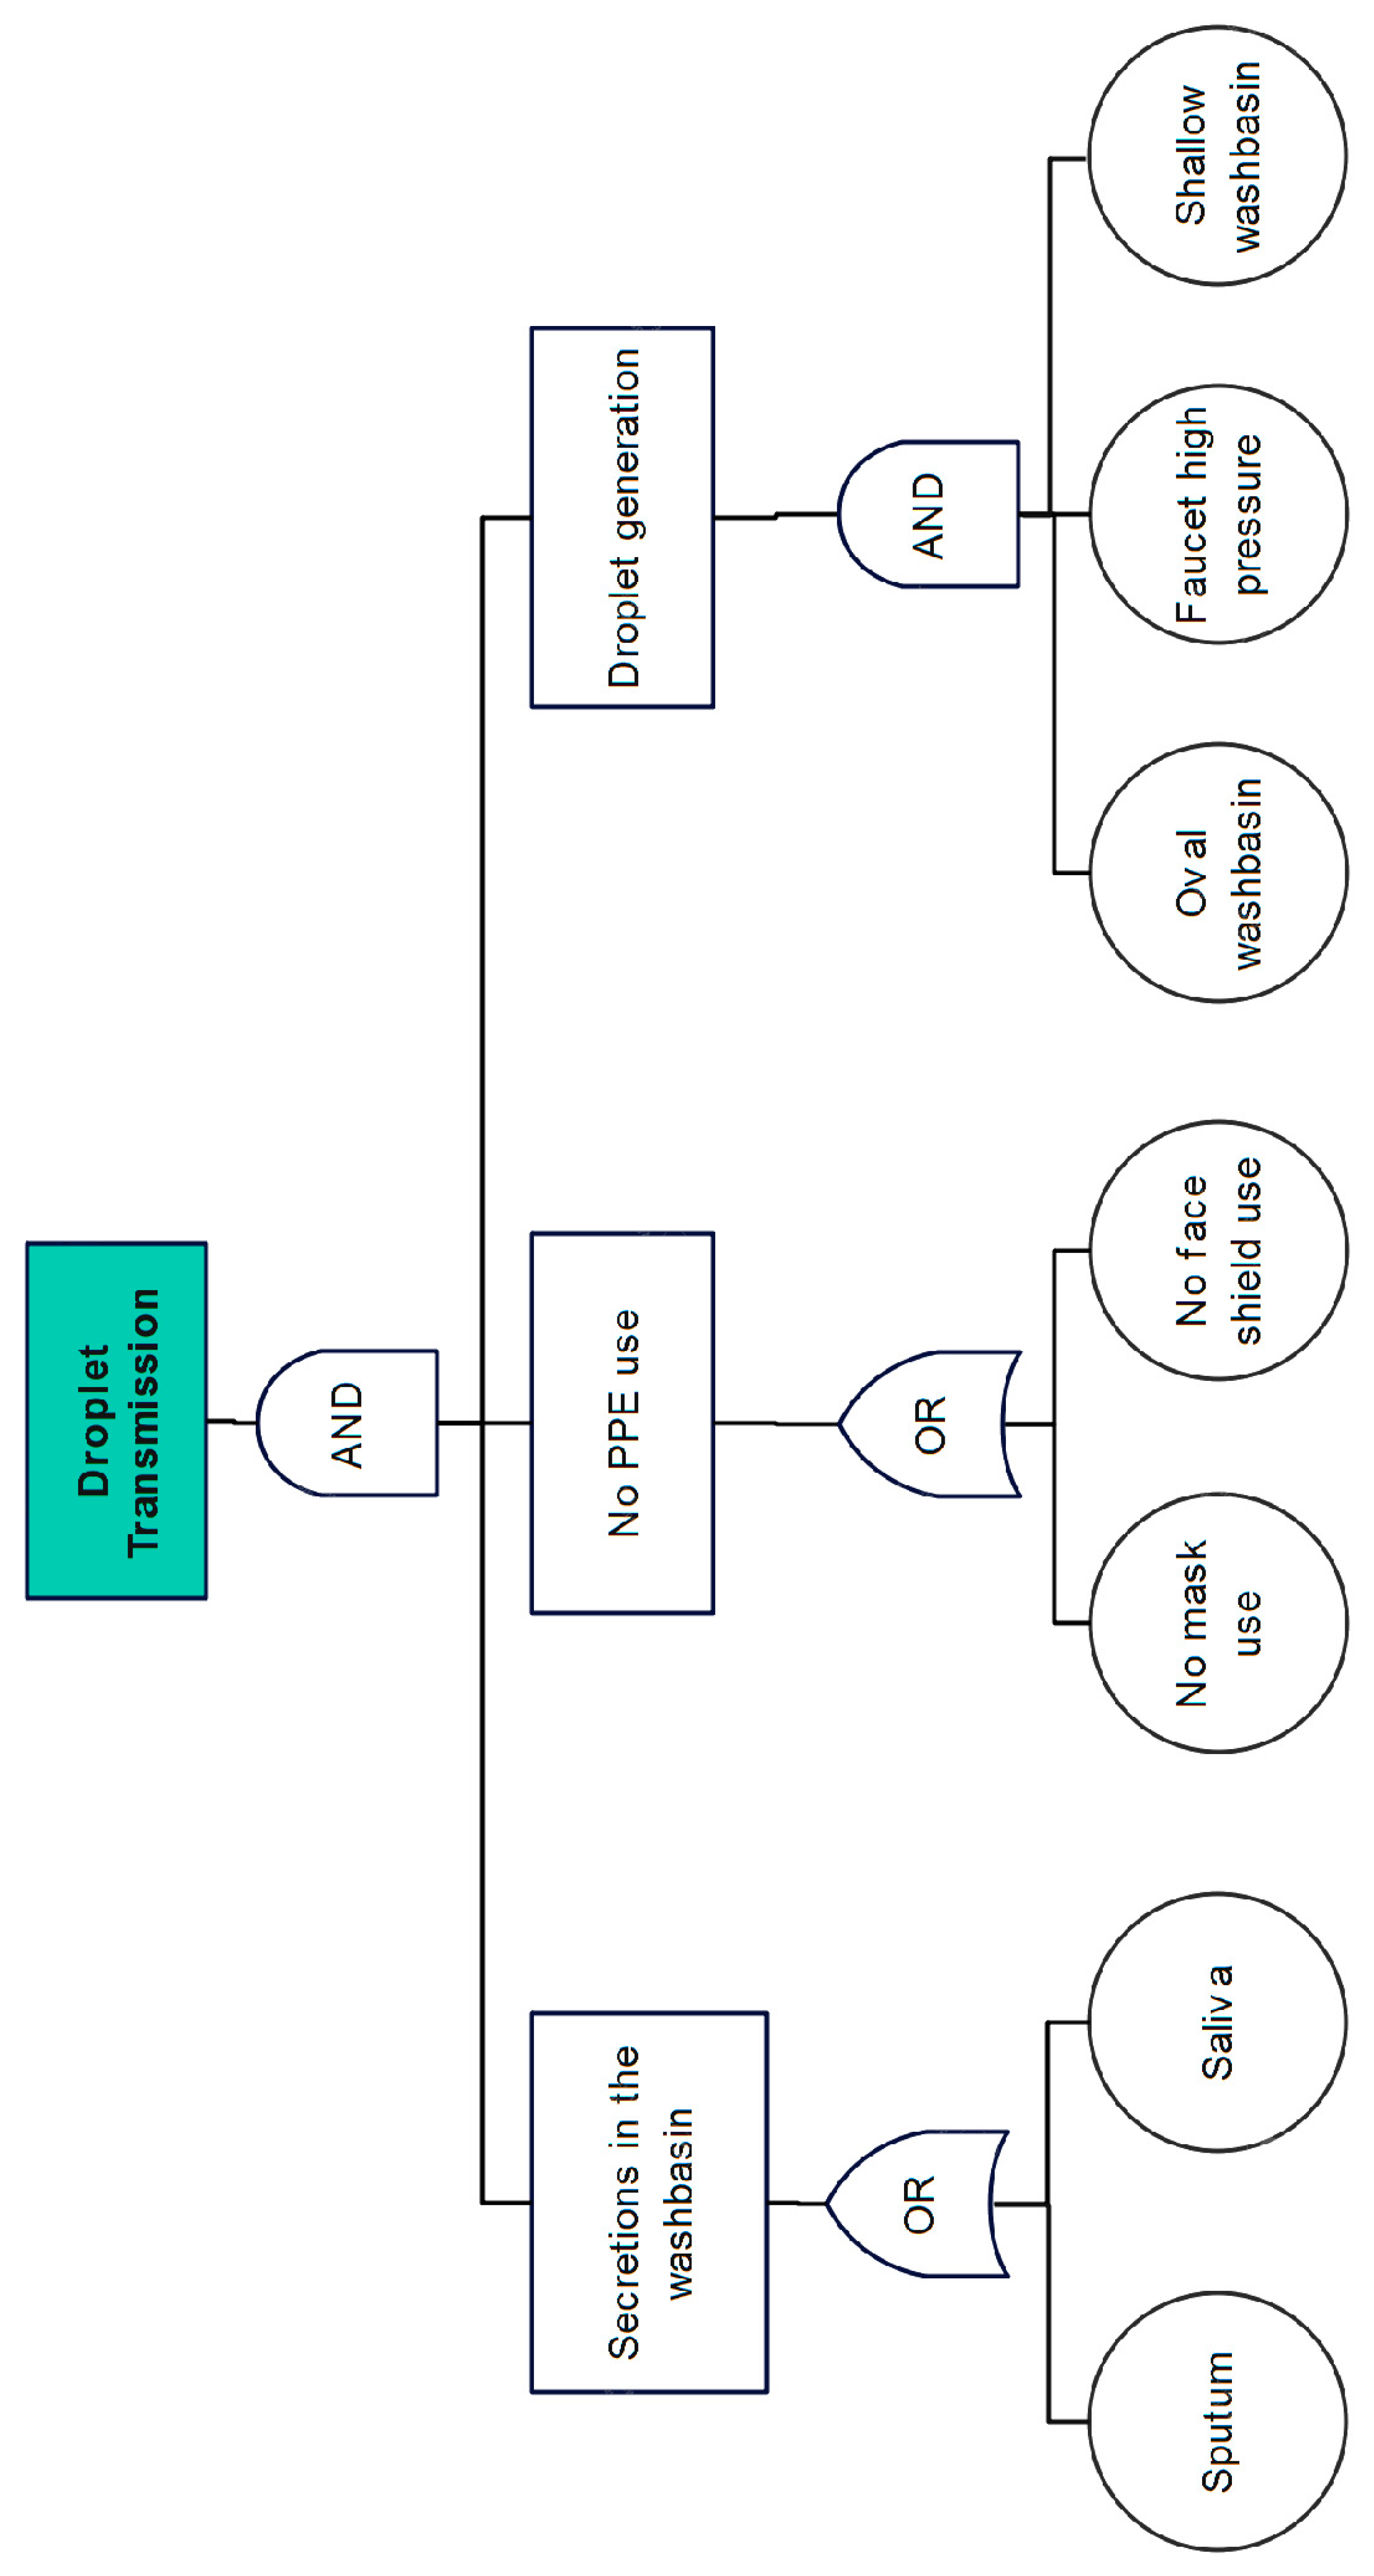
As previously mentioned, the FTA was applied to the “transmission routes” component of the risk tripod that underlines the methodology of the present study. The bibliographic review on SARS-CoV-2 allowed the identification of the main transmission routes related to the environment of a toilet. In this way, an FTA contemplating all these transmission routes was elaborated, as can be seen in Appendix C. From the FTA results and fluid dynamics computational simulations, the study concluded that the direct transmission route is the main route of transmission of the virus.

3.4. Indicators for Assessing the Risk of SARS-CoV-2 Transmission in a Toilet

The methodologies used to assess the environmental, human, and transmission factors that constitute the Risk Tripod suggested by the present study provided the identification of relevant indicators for assessing the risk of transmission of SARS-CoV-2 in an individual toilet for common use located in a health unit by FMEA and EWA application, and the main routes acting on these indicators by FTA application.
Table 1 presents all the identified indicators, as well as their possible gradations and the risk score attributed to each gradation. The environmental indicators must be classified through site inspections, while the classification of human indicators must occur through observations and the application of the developed questionnaire. In addition, the transmission routes associated with each indicator are Airborne Transmission (AT); Contact Transmission (CT); Droplet or Airborne Transmission (DAT); Droplet Transmission (DT); Contact or Airborne Transmission (CAT); and Transmission by Droplets, Air, and Contact (DACT), as obtained in the FTA.
Analyzing Table 1, the number of indicators per transmission route is observed as follows:
  • AT: 6 environmental and 2 human indicators;
  • CT: 12 environmental and 4 human indicators;
  • DAT: 7 environmental and no human indicators;
  • CAT: 4 environmental and no human indicators;
  • DACT: 2 human indicators and no environmental indicators.
A weighted average should be calculated, according to Equation (1). The calculated value will define the risk score.
R i s k S c o r e = i = 1 n p i x i i = 1 n p i
where:
xi = score assigned to indicator i, which can be 1, 2, or 3;
pi = weight of indicator i related to the transmission route.
Finally, the Risk Score (RS) found should be classified as follows:
  • If RS < 1.5 → low risk;
  • If 1.5 ≤ RS < 2.5 → medium risk;
  • If RS ≥ 2.5 → high risk.

3.5. Analytic Hierarchy Process (AHP) for Prioritizing Transmission Routes

In order to be able to assess the risks, it was necessary to choose a methodology that would allow the weight of indicator i to be obtained related to the transmission route (pi) in Equation (1). Thus, the AHP method was adopted, a very widespread multicriteria analysis technique that has a range of applications.
AHP introduces a scale of numbers that indicates how many times more important or dominant an element is over another element, concerning the criterion or property for which they are compared—The Fundamental Judgment Scale [43], as seen in Table 2.
To evaluate consistency in a pairwise comparison matrix, Equation (2) is applied [43]:
C I = λ m a x n n 1
where:
CI is the matrix consistency index;
n is the array order;
λmax is the largest eigenvalue of the matrix or Eigen principal number.
Using Equation (3), it is possible evaluate the inconsistency according to the order of the matrix of judgments [43], called the Consistency Ratio (CR). Judgments are considered consistent when CR ≤ 0.1.
C R = C I R I
where:
CI is the matrix consistency index;
RI is the consistency index for a reciprocal matrix, obtained from Table 3 [43]:

AHP Application for Prioritizing COVID-19 Transmission Routes in Toilets

As previously mentioned, there are six COVID-19 transmission routes associated with the indicators identified in Table 1, obtained in the FTA. Thus, the AHP will be derived from a 6 × 6 pairwise comparison matrix. This matrix should be completed using the indices of the Fundamental Scale of Judgments, as seen in Table 2. Therefore, some considerations were necessary. First, based on the bibliographical review, it was considered that the main SARS-CoV-2 transmission route was DT, followed by AT, and CT was the least relevant one. Thus, it was assumed that DT is 3 times more important than AT which, in turn, is 3 times more important than CT. So, by simple algebra, DT is nine times more important than CT. The relationships between the other matrix attributes were developed in the same way. The DAT is mutually associated with the DT and AT components:
DAT = DT + AT
Replacing Equation (4) with the previously established relations, it can be found that DAT is 4 times and 12 times more important than AT and CT, respectively. Concerning DT, after necessary replacements, it can be established that DAT is 1.33 times more important than DT. As this value does not exist in the Fundamental Judgments Scale, as seen in Table 2, the value was rounded to 2, i.e., DAT was considered to be 2 times more important than DT. Likewise, in the DAT case, CAT is mutually associated with the CT and AT components; that is:
CAT = CT + AT
Then, replacing Equation (5) with the previously established relations, it can be found that CAT is 1.33 times more important than AT. However, as in the previous case, the value was rounded to 2. Then, as CAT was considered 2 times more important than AT and AT was 3 times more important than CT, so, by replacement, CAT can be considered 6 times more important than CT. Regarding DT, it is known that DT is 9 times more important than CT. So, after necessary replacements, it can be established that CAT is equal to half of DT. Likewise, the DACT is mutually associated with the DT, AT, and CT components; that is:
DACT = DT + AT + CT
It is known that DT is 3 times more important than AT, and AT is 3 times more important than CT. So, after necessary replacements, it can be established that DACT is 4.33 times more important than AT, 1.66 times more important than DT, and 18 times more important than CT. As these values do not exist in the Fundamental Judgments Scale, as seen in Table 2, they were rounded to 5, 2, and 9, respectively, i.e., DACT was considered 5 times more important than AT, 2 times more important than DT, and 9 times more important than CT. Finally, it is necessary to establish the relations between the attributes of the matrix that involve two or more routes. As DAT is 4 times more important than AT, and CAT is 2 times more important than AT, so, by replacement, it can be established that DAT is 2 times more important than CAT.
On the other hand, as DACT is 5 times more important than AT, it was considered that DACT is 1.25 more important than DAT and 2.5 more important than CAT, which was rounded to 2 and 3, respectively. Thus, Table 4 presents the completed judgments matrix.
Then, we proceeded with the normalization of the original matrix and obtained the eigenvectors of the normalized matrix, also called criteria weights, obtained by calculating the arithmetic mean of each row. Next, the components of the original non-normalized matrix were multiplied by the column’s respective criteria weight, obtaining the result shown in Table 5.
The quotient of dividing the sum of each row in Table 5 by the respective prioritization index was then calculated. The average of the values obtained was equal to 6.1155 and is equivalent to the highest eigenvalue of the matrix (λmax). Thus, for a 6 × 6 order matrix, applying Equation (2), CI = 0.0231.
Finally, considering that RI is equal to 1.24 for a 6 × 6 order matrix, according to Table 3, to evaluate the inconsistency of the matrix, Equation (3) was applied and a CR equal to 0.0186 was obtained; that is, CR ≤ 0.1. Therefore, the judgments assumed for the transmission routes were considered consistent. In this way, the prioritization indexes obtained can be applied to the case of COVID-19 and are listed in Table 6.
Therefore, calculating the sum of the products of the criteria weights and the number of associated indicators as presented in Table 1, 2.9279 was obtained for the Environmental Indicators and 0.93 for the Human Indicators, totaling 3.8579, which will be the divisor of Equation (3).

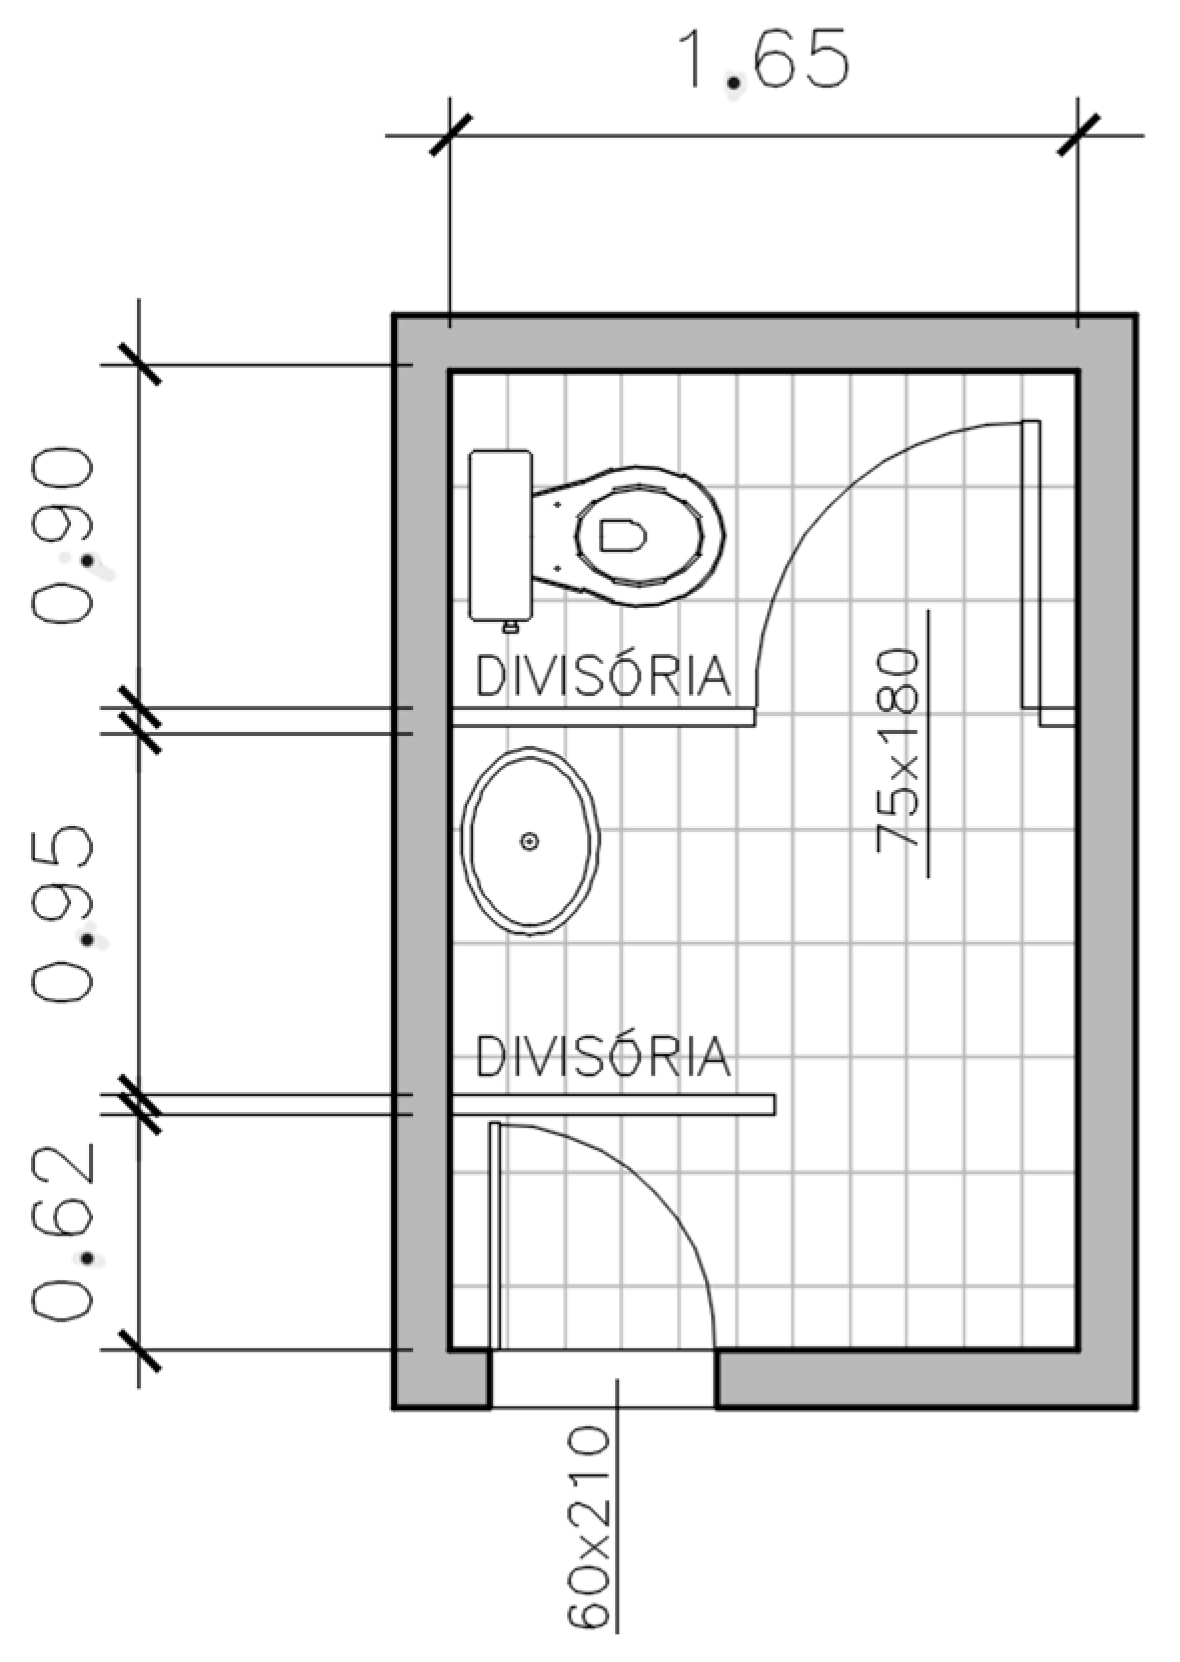
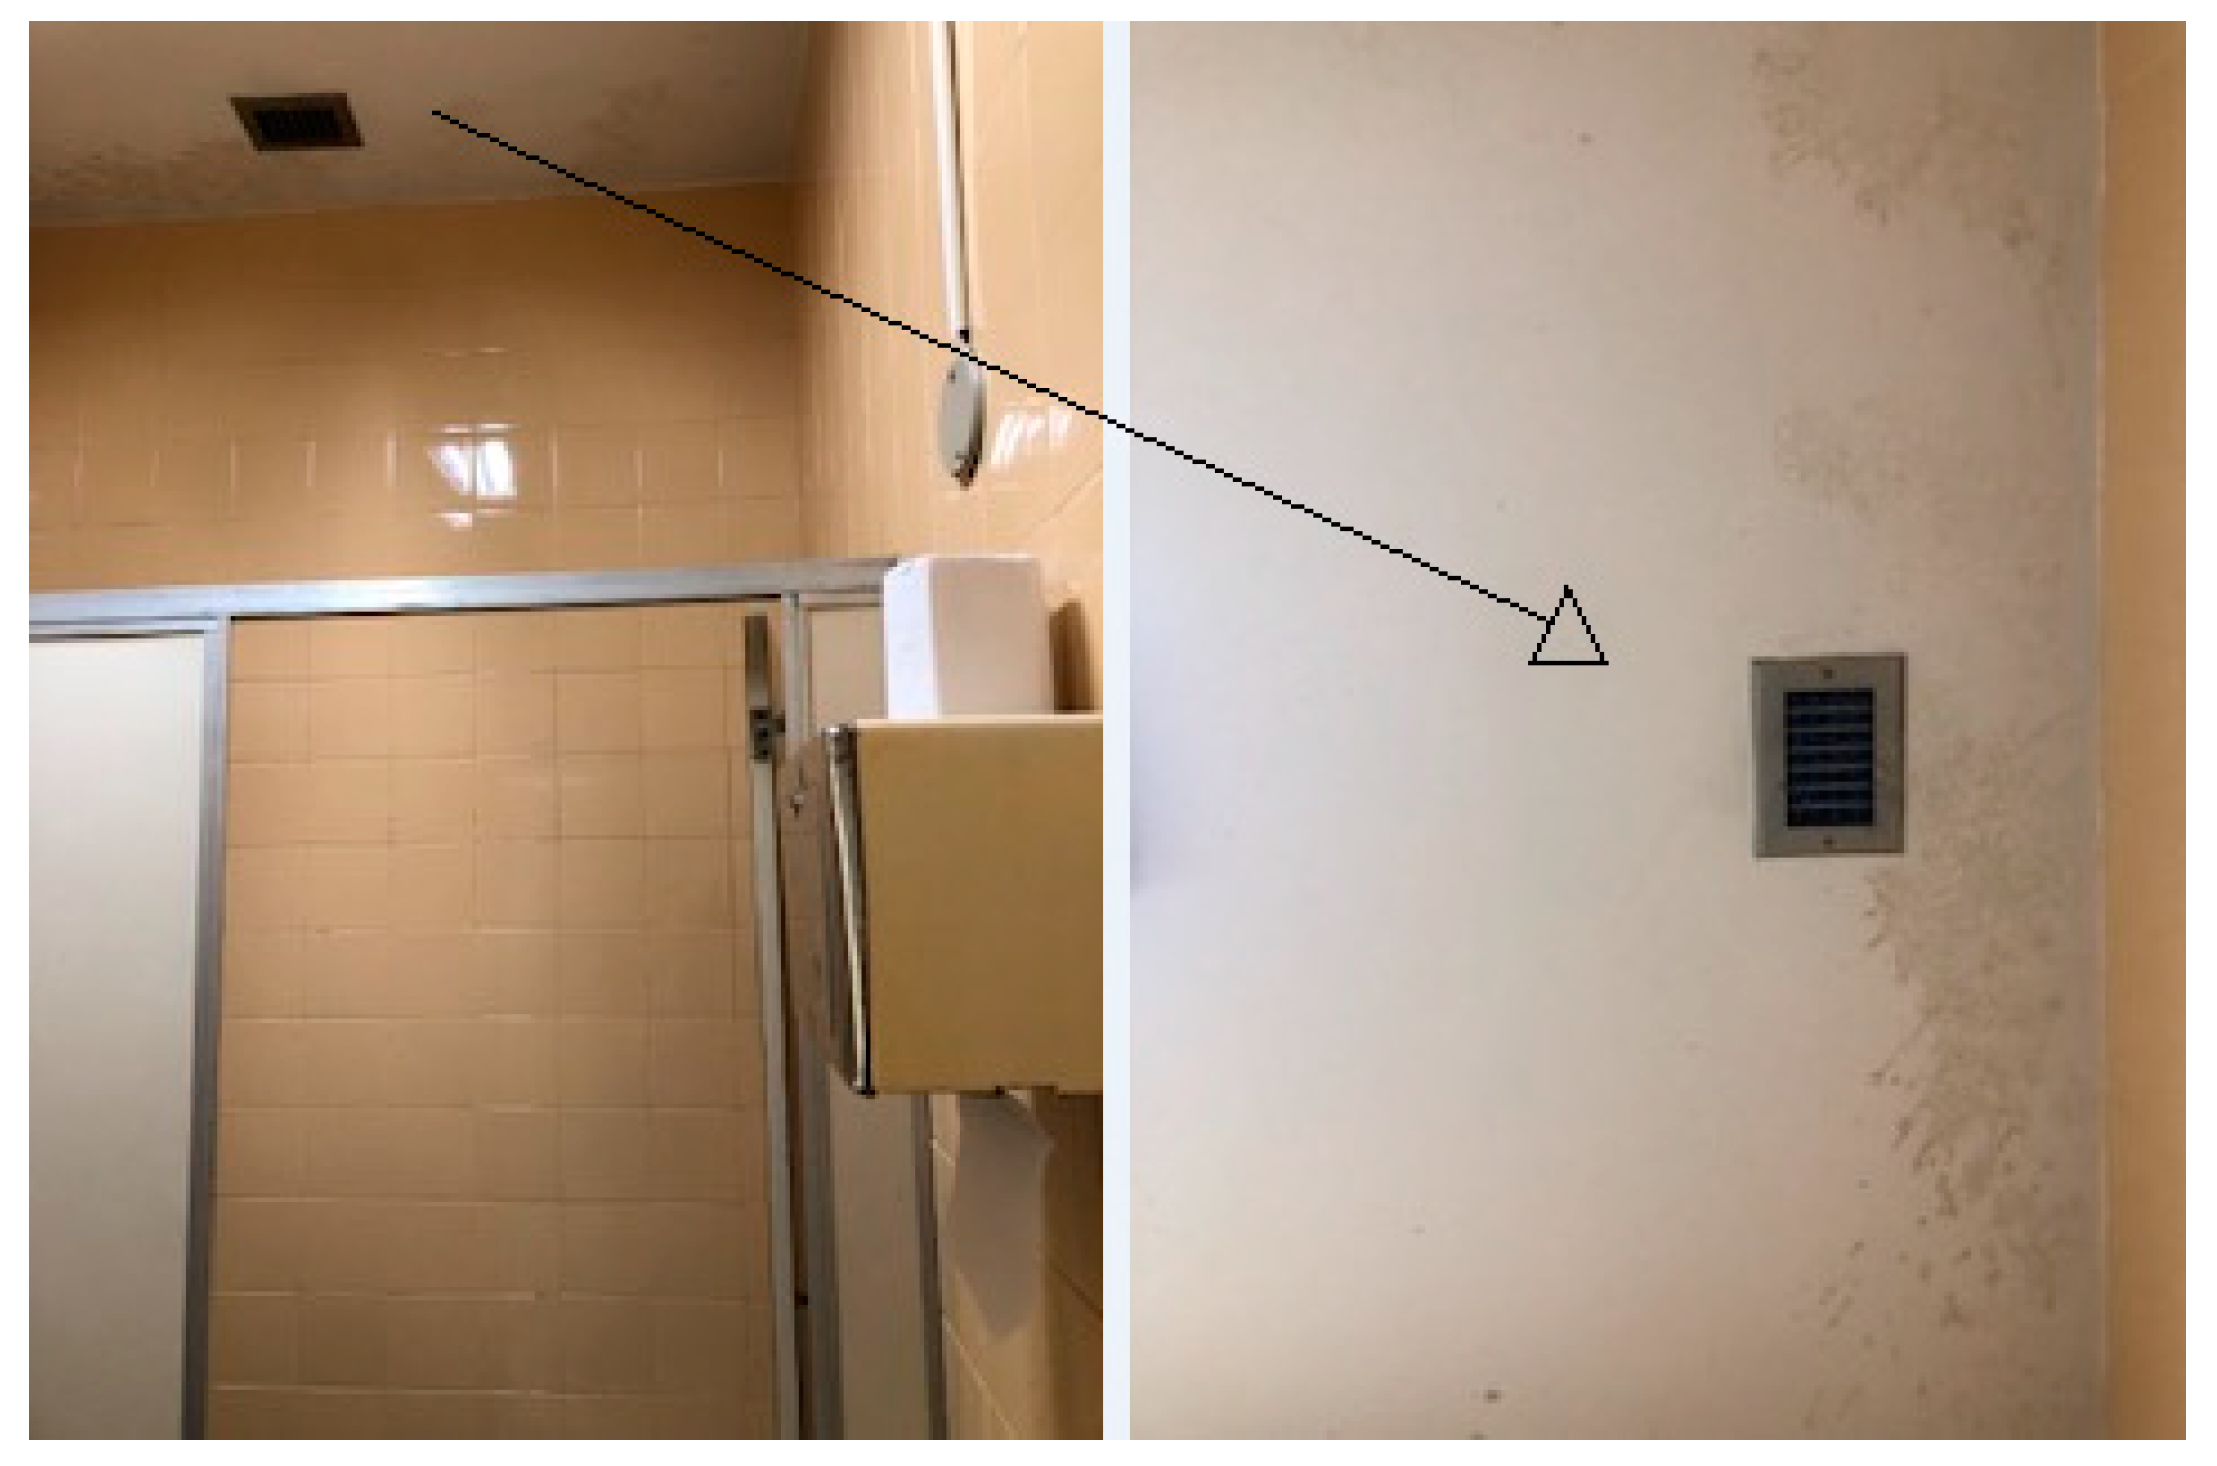
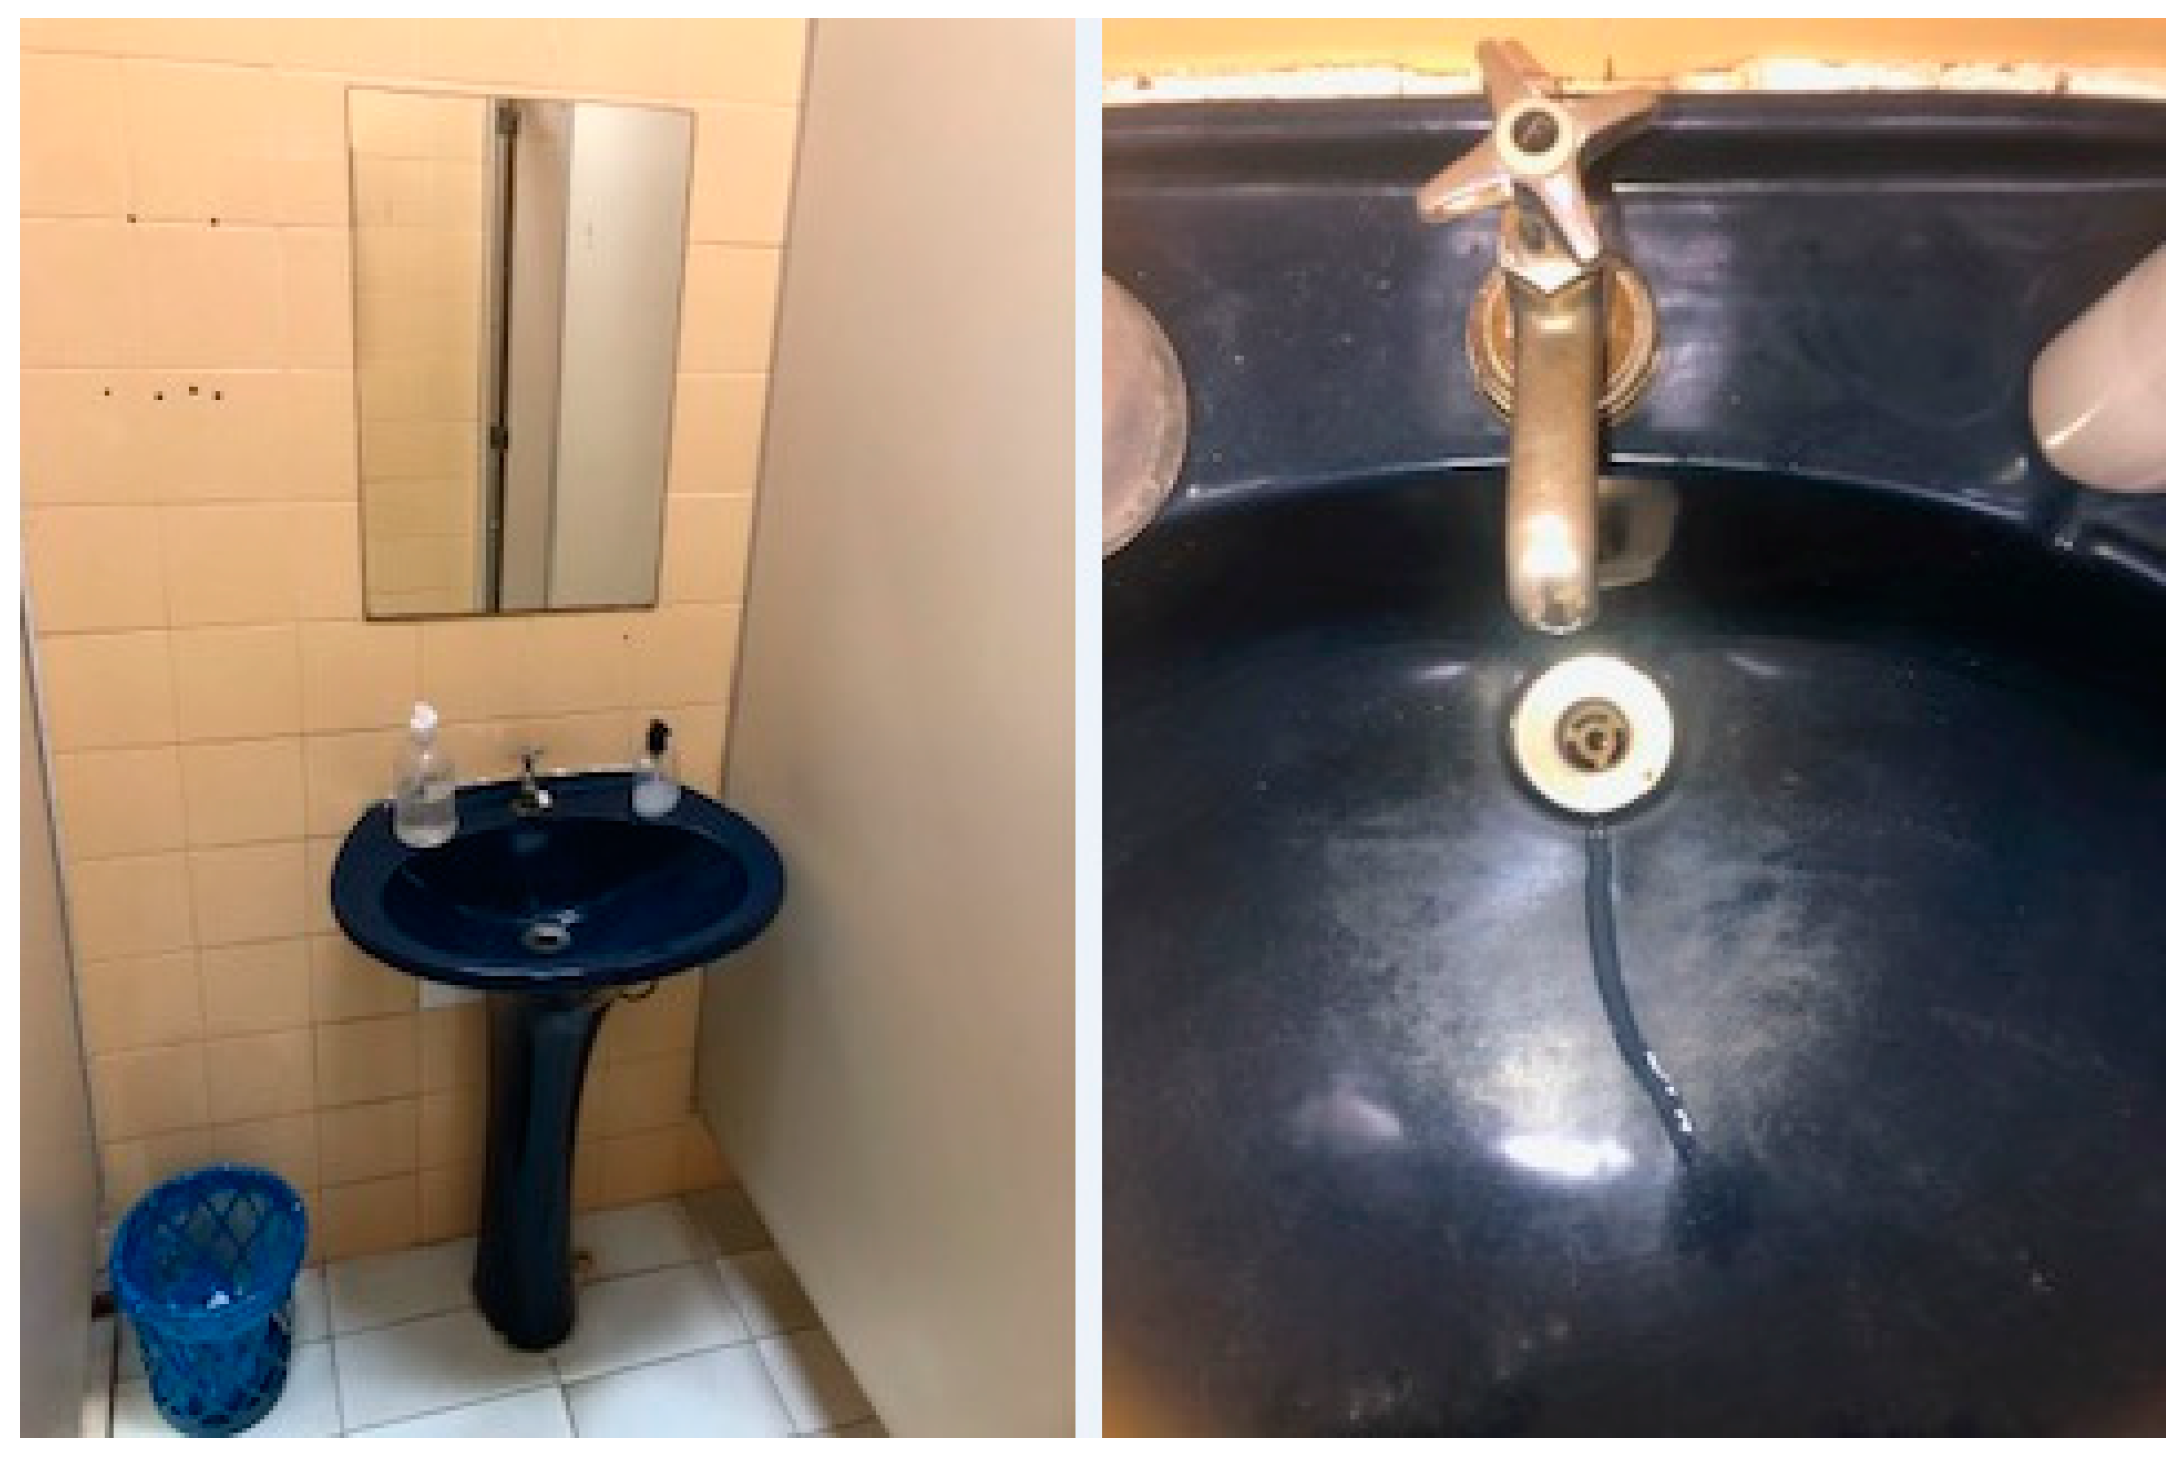
3.6. Risk Assessment: Case Study in a University Hospital

Finally, the indicators presented in Table 1 will be evaluated for a 4.1 m2 individual compartmentalized toilet, located in a university hospital and equipped with a washbasin and toilet, as can be seen in the sketch shown in Figure 3. The results are presented in the next section.

4. Results

4.1. Environmental Indicators

An analysis of the environmental indicators contained in Table 1 and their classification in one of the risk scores was performed. Regarding natural light intensity, it was considered low because the bathroom does not have a window or any other light entry, as can be seen in Appendix D (Figure A4). The air exhaust, despite existing and being installed on the ceiling—height considered ideal—was not operating. Thus, as there is no window and the exhaust fan was inoperative, the other related indicators—window area and window and exhaust fan locations—were assigned the highest risk score.
Regarding the washbasin (Appendix DFigure A5), it has a 17 cm depth round basin, which was considered shallow. On the inspection date, there was no accumulation of water or the presence of secretions in the tub, as shown in (Appendix DFigure A5. It is important to note that the dark color of the tub can compromise the effectiveness of cleaning, allowing the accumulation of invisible dirt. The faucet, in turn, did not have an aerator and did not drip. The water pressure in the faucet was considered low.
Regarding the sanitary part materials, the door handle, the faucet, and the discharge are made of metallic material. The toilet, in turn, is made of porcelain but has a plastic seat, and the soap dispenser was full, as can be seen in Appendix D (Figure A6). As in the case of the washbasin, the dark blue color of the toilet makes it difficult to perceive dirt, which can compromise the hygiene of the place. However, no visible dirt was found.
Specifically concerning the toilet, both the flow rate and the discharge pressure were considered low. There were no excreta inside the toilet and the water level in it was considered medium. Regarding the mechanisms for activating the sanitary parts, flushing the toilet requires only one touch to be activated, which can be performed with a finger or the palm, as in the case of the soap dispenser. Turning on the faucet and turning the door handle, in turn, require both hands, as they are a rotary type.
Other details worth noting are the trash can without a lid, allowing the propagation of vectors in the environment, the central position of the drain, considered inadequate, and the presence of a paper dispenser, not using a hand drying mechanism using heated air, as shown in Appendix D (Figure A7). Finally, the general cleanliness conditions in the environment were considered reasonable.
Thus, based on the on-site inspection results, Table 7 presents the risk category assigned to each environmental indicator and their weighting based on the prioritization index obtained for the transmission route related to each one of them.
The risk category number of each indicator was then multiplied by the transmission route criteria weight associated with it—see Table 6. Then, the risk score was calculated using a simple weighted average; that is, by dividing the sum of these values by the sum of the criteria weights.
Then, applying Equation (1):
E n v i r o n m e n t a l R i s k S c o r e = 4.6385 2.9279 = 1.5842

4.2. Human Indicators

Regarding human indicators, it was decided to simulate the results according to the observation of human behavior. Thus, it was assumed that most individuals go to the bathroom 3 or 4 times during a workday, remaining in that environment for 5 to 7 min each time. When using the bathroom, they make about 7 to 10 touches to the sanitary surfaces. It was also assumed that most individuals do not use the toilet seat and are not in the habit of lowering the lid before flushing. Concerning PPE, it was admitted that the use of a mask and gloves when using the bathroom was not frequent. Finally, regarding hand hygiene, it was admitted that it is performed in about 10 s, without major concerns about the protocol.
Table 8 shows the indicator classification results according to their risk score and weighting based on the prioritization index obtained for the transmission route related to each one of them.
Then, applying Equation (1):
H u m a n R i s k S c o r e = 2.0167 0.93 = 2.1685

4.3. Risk Score Calculation for Case Study

The risk score of the analyzed toilet concerning its potential for spreading the SARS-CoV-2 virus among users can be obtained by the quotient of the sum of all weighted indicators by the sum of the prioritization indices applied in the weighting. Thus, Table 9 shows the obtained results.

4.4. Control Measures Simulation

In this section, a new simulation of the risk score is proposed, assuming the adoption of some corrective measures and aiming to verify the impact of their adoption on the result of the risk assessment. To this end, it was decided to select corrective measures related to the environmental factor of the risk tripod that could be implemented quickly and at a lower cost. They were:
  • Replacement of the washbasin with a deeper one;
  • Replacement of the faucet and soap dispenser with another that has an automatic sensor;
  • Improvement to the general cleanliness of the environment.
Finally, Table 10 shows the results of the new classification of the indicators listed above, with the reduction in their respective risk scores. The other indicators in Table 1 continue with the same risk categories.
Then, applying Equation (1):
E n v i r o n m e n t a l R i s k S c o r e = 4.0391 2.9279 = 1.3795
Finally, Table 11 presents the obtained results.

5. Discussion

The objective of this research was to develop a risk assessment methodology for SARS-CoV-2 virus dissemination in toilets. To this end, this study applied widely employed safety engineering techniques—FMEA, FTA, and EWA. The application of these techniques made it possible to identify environmental, human, and transmission routes indicators related to the disease—the three main aspects of the study, which were called the “Risk Tripod”. Subsequently, the AHP methodology was applied to obtain the transmission route prioritization indexes identified for a toilet environment.
The risk score found for the restroom was classified as medium. Analyzing the used indicators, this result was consistent, considering that the studied environment had some deficiencies, as diagnosed in the inspection performed. Analyzing Table 9, it is noted that the environmental indicators made a greater contribution to the final result, considering that the sum of the indicator scores in this group was 130% higher than the sum of the human indicator scores; that is, greater than twice. This is because 29 environmental indicators were evaluated, to the detriment of only 8 human indicators.
However, when looking at the obtained results separately for the environmental and human risk scores, it is noted that the latter resulted in a higher risk score—1.5842 versus 2.1685. This occurred because of the eight human-analyzed indicators, only one had a minimum risk score. In the case of environmental indicators, in turn, 12 of the 29 indicators had a minimum risk score, that is, 41%, which led to a result of lower risk related to these indicators.
The most important indicators in the study were those related to the DAT, CAT, and DACT routes, which had the highest Prioritization Index. Thus, it can be concluded that the project, design, and maintenance of sanitary parts have greater relevance in controlling the spread of pathogens in a sanitary environment. However, indicators such as materials and mechanisms for activating sanitary parts, associated with transmission by contact, as well as hand hygiene and the use of gloves, could be overrated regarding the transmission of the SARS-CoV-2 virus.
The risk score recalculation after simulating the implementation of corrective measures indicated a 9.9% drop in the risk score compared to the first simulation with real toilet conditions. However, despite this reduction, the risk continued to be classified as medium. Therefore, it was concluded that the selected measures—related to the mechanism for activating the faucet and the soap dispenser, the depth of the sink, and the general cleaning conditions—were not sufficient for a considerable risk reduction. This result suggests the need to implement more structural measures such as the installation of an exhaust fan, for example—it was seen that, in the case of the analyzed environment, despite the existence of an exhaust fan, it was inoperative. Regarding the sanitary part materials, there are currently no options on the market that offer less stability to pathogens, so the materials that constitute the sanitary parts of the studied environment are those commonly found in toilets and bathrooms—the adoption of futuristic surfaces such as copper and silver is still far from being a reality for the market.
It is important to highlight that the study stood out for its unprecedented method, considering that the literature review pointed out that most risk assessment tools focus on clinical practices rather than focusing on design in the area of architecture and civil construction. A study developed in Southern Switzerland, for example, conducted a prospective, SARS-CoV-2 seroprevalence study in healthcare workers. Participants were hospital personnel with varying COVID-19 exposure risk depending on job function and working site. They provided personal information (including age, sex, occupation, and medical history) and self-reported COVID-19 symptoms. The odds ratio (OR) of seropositivity to IgG antibodies was estimated by univariate and multivariate logistic regressions [44]. Another study conducted in India introduced an innovative Risk Assessment Tool which goes beyond symptom detection and patient tracking. It includes four factors in assessment of risk: Health, Behavior, Exposure and Social Policy. Behavior covered subfactors like the use of masks, handwashing, sanitizing before touching the face, social distancing, and others [45]. A cross-sectional online survey based on the World Health Organization (WHO) COVID-19 risk assessment tool involving physicians, pharmacists, and nurses was conducted from Pakistan to evaluate their knowledge, attitudes, and practices (KAP) and the ability to assess the risks associated with the outbreak [46]. Finally, in a cross-sectional study that investigated the level of exposure to and risk of COVID-19 virus infection among healthcare workers in COVID-19 treatment centers in Ghana, adherence to infection prevention and control (IPC) measures were used to categorized them as at low or high risk of COVID-19 virus infection. The WHO COVID-19 risk assessment tool was also used to collect quantitative data from the study participants. The study measures were demographic characteristics, community and occupational exposure, and compliance with IPC measures [47]. However, in all studies cited there were no subfactors related to environmental or project variables.
Regarding the limitations of the present study, it is important to discuss, firstly, the selected environment and the pathogen type. The indicators determined were specific to the environment of a toilet and the identified transmission routes were limited to the case of COVID-19. Second, three risk assessment methodologies were selected—FMEA, FTA, and EWA. These techniques were applied without multidisciplinary team participation. Thus, the identification of indicators and transmission routes was limited to the author’s knowledge and perceptions, requiring a deeper analysis. The evaluation of the human factor, for example, included a limited number of indicators and took place through observation and assumptions, without the direct application of the questionnaire.
Another limitation concerns the AHP application, which involved some assumptions that overestimated the contribution of some transmission modes. At this point, it is important to highlight the CT, for which was assumed, by simple algebra, an approximate importance of 11% DT (DT/9), although the Centers for Disease Control and Prevention (CDC) estimate the probability of contact transmission as less than 1 in 10,000 [2]. However, it can be stated that the estimate of the real-life transmission potential of SARS-CoV-2 via fomites is still uncertain as some studies, as mentioned, found extensive virus contamination on surfaces, while others did not [48].
For future work, a methodology application to other types of toilets or bathrooms (collective, male with urinals, equipped with a hygienic shower, shower, etc.) is recommended, encouraging the inclusion of new indicators and the identification of new transmission routes. It is even proposed to apply the methodology to non-sanitary environments, expanding the scope of the techniques used, thus enabling the identification of new risk assessment indicators that meet the specificities of other environments. It is also suggested to study other viral and bacterial infections and their transmission routes, with the application of the FTA and, subsequently, the AHP, to weigh them according to their importance in the disease spread. This will enable a more complete and robust risk assessment, covering other types of infections.
Finally, it is recommended to advance research on the design of the sanitary parts of bathrooms, with an emphasis on washbasins and flush toilets. Inspections and preventive maintenance are also essential. The adoption of safe habits and the use of PPE must be continuously encouraged, but greater attention is needed for technical and engineering issues.

6. Conclusions

The methodology developed in the present study proved to be an applicable tool for the defined scope, proving to be relevant for prioritizing preventive and mitigation measures concerning the SARS-CoV-2 spread in toilets.
It is important to highlight that this study focuses on the engineering and architecture areas, and is not a study focused on the clinical area. However, it is essential that this application is carried out by a multidisciplinary team, considering that the analysis of transmission routes and the identification of environmental factors that favor infection is an essential part of the work.

Author Contributions

Conceptualization, T.V.d.C. and A.N.H.; methodology, T.V.d.C., L.F.C.W., B.B.F.d.C. and A.N.H.; software, T.V.d.C., L.F.C.W., B.B.F.d.C., M.N. and C.A.P.S.; validation, T.V.d.C., L.F.C.W., B.B.F.d.C., M.N., C.A.P.S. and A.N.H.; formal analysis, T.V.d.C., L.F.C.W., B.B.F.d.C., M.N., C.A.P.S. and A.N.H.; investigation, T.V.d.C., L.F.C.W. and B.B.F.d.C.; resources, T.V.d.C. and A.N.H.; data curation, T.V.d.C.; writing—original draft preparation, T.V.d.C., L.F.C.W. and B.B.F.d.C.; writing—review and editing, T.V.d.C., L.F.C.W., B.B.F.d.C., M.N., C.A.P.S. and A.N.H.; visualization, T.V.d.C., L.F.C.W. and B.B.F.d.C.; supervision, B.B.F.d.C. and A.N.H.; project administration, A.N.H. All authors have read and agreed to the published version of the manuscript.

Funding

This research received no external funding.

Institutional Review Board Statement

Not applicable.

Informed Consent Statement

Not applicable.

Data Availability Statement

Data may be obtained upon reasonable request.

Acknowledgments

Assed N. Haddad would like to acknowledge Conselho Nacional de Desenvolvimento Científico e Tecnológico (CNPq) and Fundação Carlos Chagas Filho de Amparo à Pesquisa do Estado do Rio de Janeiro (FAPERJ), which helped in the development of this work. Bruno B. F. da Costa would like to acknowledge Prefeitura Municipal de Macaé, which helped in the development of this work.

Conflicts of Interest

The authors declare no conflict of interest.

Appendix A

Table A1. Failure modes and effects analysis (FMEA).
Failure ModeCauseEffectControls
There is not an exhaust fan or it is irregular or inoperativeIncorrect sizing of the exhaust systemPossibly contaminated air is not directed to the outside environmentCompliance with current regulations
The exhaust system has been installed at a not-recommended height
Motor problemsPeriodic inspection
Accumulation of dirt on the propeller or gratesIncreased humidity in the bathroom, allowing bacteria proliferationHygrometer installation
Duct clogging
The windows are closed or there are no windowsWindows do not openAir circulation is insufficient to maintain indoor air qualityPeriodic inspection
Design constraints prevented the installation of windowsCompliance with current regulations
Temperature is above or below idealAir conditioning system failurePathogens spread in the environmentThermometer installation
Humidity is above idealConstruction materials used favor increased humidityPathogens spread in the environment, especially bacteriaHygrometer installation
The environment is poorly ventilatedPeriodic inspection
Water vapor emission
The environment receives little natural light
Accumulation of water due to leaks in the faucet or toiletCompliance with current regulations
Toilet flush is triggered, irregular, or inoperativeLeaksAccumulation of waste in the basinPeriodic inspection
Valve is damaged
Valve has incrustations or rustBad smell
Bad adjustmentVector proliferation
Waste aerosolization
Damaged sealing elementsPossible contamination from contact with contaminated surface
Low water flow inside the toilet or there is no flow
The toilet has excreta inside itDamaged valveWaste aerosolizationPeriodic inspection
Poor discharge regulationBad smell
CloggingVector proliferationLocal hygiene record book
Possible contamination from contact with contaminated surface
The water level in the toilet bowl is above idealDamaged valveContact of the urogenital mucosa with wastePeriodic inspection
CloggingDroplet generation
Poor discharge regulationContamination of surfaces
The soap dispenser does not release productObstructionImpossibility of proper hand hygienePeriodic inspection
Sensor problemPossible contact with contaminated surfaceGel alcohol dispenser installation
The reservoir is empty
Faucet is leakingBad closingIncreased water level in the washbasinAlarm
Attrition on the sealing rubberPeriodic inspection
Damaged faucetDroplet generation
EncrustationsPossible contact of the droplets generated with the mucous membranes
The washbasin is collecting waterCloggingDroplet generationCompliance with current regulations
Water high pressureDroplet generationPeriodic inspection
Waste accumulation
Improper designPossible contact of the droplets generated with the mucous membranes
High water pressure in the faucetPressure valve problemsDroplet generationManometer
The faucet is deadRecord closedImpossibility of proper hand hygienePeriodic inspection
Air bubbles in the tube
Aerator clogging
Pressure valve problemsAccumulation of waste in the washbasinGel alcohol dispenser installation
Water shortage
Low water level in the water tankPossible contact with contaminated surface
The washbasin has secretions inside itThere was no cleaningPossible contamination by contaminated droplets generatedLocal hygiene record book
Low water pressure in the faucet
Improper designPeriodic inspection

Appendix B

Table A2. Ergonomic Work Analysis (EWA) questionnaire.
QuestionsResponses
1. Identification[      ] Doctor
[      ] Nurse
[      ] Administrative
[      ] Student
[      ] Patient
[      ] Other
2. Age[      ] years
3. Sex[      ] Female
[      ] Male
[      ] I prefer not to answer
4. How many times a day do you use the toilet?[      ] Up to 2 times a day
[      ] 3 or 4 times a day
[      ] More than 4 times a day
5. How long on average do you take to use the toilet?[      ] Less than 5 min
[      ] Between 5 and 7 min
[      ] More than 7 min
6. What kind of toilet do you normally use?[      ] Private toilet with free access
[      ] Toilet with several free-access cabins
[      ] Private toilet located in a restricted access area
[      ] Toilet with several cabins located in restricted access area
7. Do you consider that the toilet cleaning conditions are adequate? [      ] Yes, most of the time the toilet is clean
[      ] About half the time the toilet is clean
[      ] No, most of the time the toilet is dirty
8. Check conditions below that you commonly see in the toilet[      ] Garbage on the toilet floor
[      ] Toilet with dirty seat and/or containing excreta and/or clogged
[      ] Sink containing apparent secretions and/or clogged
[      ] Wet and/or dirty toilet floor
[      ] It is rare to encounter any of the above conditions.
9. Is the toilet usually stocked with soap and/or alcohol gel? [      ] Yes, most of the time
[      ] Sometimes
[      ] No, most of the time
10. Regarding the sanitary parts (door handle, flushing, washbasin, soap dispenser, bin), how are they activated?[      ] The sanitary parts are modern and automatic, being activated without the need to touch.
[      ] Sanitary parts are semi-automatic, being activated with just one finger.
[      ] The sanitary parts are old and the actuation occurs in a conventional way, causing the contact of the hands
11. How often do you estimate that you come into contact with the surfaces mentioned in the question above? To answer correctly, think about all the actions you usually perform when using the toilet, from going in to going out.[      ] Less than 7 times or not applicable because I use gloves
[      ] Between 7 and 10 times
[      ] More than 10 times
12. Do you often sit on the toilet seat? [      ] Yes, without any protection
[      ] Yes, but I clean it first with 70° alcohol or cover it with disposable sani-tary protection
[      ] No, anyway
13. Do you usually lower the toilet lid before flushing?[      ] Yes
[      ] No
14. What Personal Protective Equipment (PPE) do you usually use inside the toilet?[      ] I use a mask and gloves
[      ] I only use a mask
[      ] I only use gloves
[      ] I don’t use any PPE
15. How do you perform hand hygiene?[      ] I soap only the palms of my hands, taking about 10 s
[      ] I soap palms, backs of hands and between fingers, taking about 20 s
[      ] I soap the palms, back of the hands, between the fingers and wrists, taking about 30 s

Appendix C

Figure A1. Contact transmission Fault Tree Analysis (FTA).
Safety 09 00078 g0a1
Figure A2. Airborne transmission Fault Tree Analysis (FTA).
Safety 09 00078 g0a2
Figure A3. Droplets transmission Fault Tree Analysis (FTA).
Safety 09 00078 g0a3

Appendix D

Figure A4. Toilet without window and with an inoperative exhaust fan.
Safety 09 00078 g0a4
Figure A5. The washbasin.
Safety 09 00078 g0a5
Figure A6. Sanitary parts’ design and materials.
Safety 09 00078 g0a6
Figure A7. Sanitary parts’ design and materials.
Safety 09 00078 g0a7

References

  1. World Health Organization—WHO. WHO Coronavirus (COVID-19) Dashboard. Available online: https://covid19.who.int/ (accessed on 22 October 2023).
  2. Centers for Disease Control and Prevention—CDC. Scientific Brief: SARS-CoV-2 Transmission. Available online: https://www.cdc.gov/coronavirus/2019-ncov/science/science-briefs/SARS-CoV-2-transmission.html (accessed on 12 July 2022).
  3. Ferioli, M.; Cisternino, C.; Leo, V.; Pisani, L.; Palange, P.; Nava, S. Protecting healthcare workers from SARS-CoV-2 infection: Practical indications. Eur. Respir. Rev. 2020, 29, 200068. [Google Scholar] [CrossRef]
  4. Judson, S.D.; Munster, V.J. Nosocomial transmission of emerging viruses via aerosol-generating medical procedures. Viruses 2019, 11, 940. [Google Scholar] [CrossRef] [PubMed]
  5. Siegel, J.D.; Rhinehart, E.; Jackson, M.; Chiarello, L. Healthcare Infection Control Practices Advisory Committee (HICPAC). In Guideline for Isolation Precautions: Preventing Transmission of Infectious Agents in Healthcare Settings; CDC: Atlanta, GA, USA, 2022. Available online: https://www.cdc.gov/infectioncontrol/pdf/guidelines/isolation-guidelines-H.pdf (accessed on 12 July 2022).
  6. Meyerowitz, E.A.; Richterman, A.; Gandhi, R.T.; Sax, P.E. Transmission of SARS-CoV-2: A review of viral, host, and environmental factors. Ann. Intern. Med. 2021, 174, 69–79. [Google Scholar] [CrossRef]
  7. Chagla, Z.; Hota, S.; Khan, S.; Mertz, D.; International Hospital and Community Epidemiology Group. It is time to address airborne transmission of COVID-19. Clin. Infect. Dis. 2021, 73, e3981–e3982. [Google Scholar] [CrossRef]
  8. McIntosh, K. COVID-19: Epidemiology, Virology, and Prevention. Available online: https://www.uptodate.com/contents/covid-19-epidemiology-virology-and-prevention (accessed on 20 June 2022).
  9. Onakpoya, I.J.; Heneghan, C.J.; Spencer, E.A.; Brassey, J.; Rosca, E.C.; Maltoni, S.; Plüddemann, A.; Evans, D.H.; Conly, J.M.; Jefferson, T. Viral cultures for assessing fomite transmission of SARS-CoV-2: A systematic review and meta-analysis. J. Hosp. Infect. 2022, 130, 63–94. [Google Scholar] [CrossRef]
  10. World Health Organization—WHO. Report of the WHO-China Joint Mission on Coronavirus Disease 2019 (COVID-19); WHO: Geneva, Switzerland, 2019. Available online: https://www.who.int/docs/default-source/coronaviruse/who-china-joint-mission-on-COVID-19-final-report.pdf (accessed on 30 March 2022).
  11. Budowsky, E.I.; Bresler, S.E.; Friedman, E.A.; Zheleznova, N.V. Principles of selective inactivation of viral genome. I. UV-induced inactivation of influenza virus. Arch. Virol. 1981, 68, 239–247. [Google Scholar] [CrossRef] [PubMed]
  12. Azuma, K.; Yanagi, U.; Kagi, N.; Kim, H.; Ogata, M.; Hayashi, M. Environmental factors involved in SARS-CoV-2 transmission: Effect and role of indoor environmental quality in the strategy for COVID-19 infection control. Environ. Health Prev. Med. 2020, 25, 66. [Google Scholar] [CrossRef] [PubMed]
  13. Everett, W.D.; Kipp, H. Epidemiologic observations of operating room infections resulting from variations in ventilation and temperature. Am. J. Infect. Control. 1991, 19, 277–282. [Google Scholar] [CrossRef] [PubMed]
  14. Standard 170-2017; Ventilation of Health Care Facilities. ANSI/ASHRAE/ASHE: Atlanta, GA, USA, 2017.
  15. Pica, N.; Bouvier, N.M. Environmental factors affecting the transmission of respiratory viruses. Curr. Opin. Virol. 2012, 2, 90–95. [Google Scholar] [CrossRef] [PubMed]
  16. The American Institute of Architects. Guidelines for Design and Construction of Hospital and Health Care Facilities, 1st ed.; AIA: Washington, DC, USA, 2001; Available online: https://www.brikbase.org/sites/default/files/2001guidelines.pdf (accessed on 22 September 2022).
  17. OSHA. COVID-19 Guidance on Ventilation in the Workplace. Washington, DC, USA, 2020. Available online: https://www.osha.gov/sites/default/files/publications/OSHA4103.pdf (accessed on 16 January 2022).
  18. ASHRAE: Shaping the Tomorrow’s Built Environment Today. Available online: https://www.ashrae.org/technical-resources/healthcare (accessed on 22 September 2022).
  19. Mozumder, M.S.I.; Amin, M.S.A.; Uddin, M.R.; Talukder, M.J. Coronavirus COVID-19 outbreak and control: Effect of temperature, relative humidity, and lockdown implementation. Arch. Pediatr. 2021, 28, 111–116. [Google Scholar] [CrossRef]
  20. Xu, R.; Rahmandad, H.; Gupta, M.; DiGennaro, C.; Ghaffarzadegan, N.; Amini, H.; Jalali, M.S. Weather, air pollution, and SARS-CoV-2 transmission: A global analyses. Lancet Planet. Health 2021, 5, E671–E680. [Google Scholar] [CrossRef]
  21. Rubin, D.; Huang, J.; Fischer, B.T.; Gasparrini, A.; Tam, V.; Song, L.; Wang, X.; Kaufman, J.; Fitzpatrick, K.; Jain, A.; et al. Association of social distancing, population density, and temperature with the instantaneous reproduction number of SARS-CoV-2 in counties across the United States. JAMA Netw Open. 2020, 3, e2016099. [Google Scholar] [CrossRef] [PubMed]
  22. Krishnan, R.; Thiruvengadam, K.; Jayabal, L.; Selvaraju, S.; Watson, B.; Malaisamy, M.; Nagarajan, K.; Tripathy, S.P.; Chinnaiyan, P.; Chandrasekaran, P. An influence of dew point temperature on the occurrence of Mycobacterium tuberculosis disease in Chennai, India. Sci. Rep. 2019, 12, 6147. [Google Scholar] [CrossRef]
  23. Casanova, L.M.; Jeon, S.; Rutala, W.A.; Weber, D.J.; Sobsey, M.D. Effects of air temperature and relative humidity on coronavirus survival on surfaces. Appl. Environ. Microbiol. 2010, 76, 2712–2717. [Google Scholar] [CrossRef]
  24. Van Doremalen, N.; Bushmaker, T.; Morris, D.H.; Holbrook, M.G.; Gamble, A.; Williamson, B.N.; Tamin, A.; Harcourt, J.L.; Thornburg, N.J.; Gerber, S.I.; et al. Aerosol and surface stability of SARS-CoV-2 as compared with SARS-CoV-1. N. Engl. J. Med. 2020, 382, 1564–1567. [Google Scholar] [CrossRef]
  25. Aboubakr, H.A.; Sharafeldin, T.A.; Goyal, S.M. Stability of SARS-CoV-2 and other coronaviruses in the environment and on common touch surfaces and the influence of climatic conditions: A review. Transbound. Emerg. Dis. 2021, 68, 296–312. [Google Scholar] [CrossRef] [PubMed]
  26. Wei, Y.; Dong, Z.; Fan, W.; Xu, K.; Tang, S.; Wang, Y.; Wu, F. A narrative review on the role of temperature and humidity in COVID-19: Transmission, persistence, and epidemiological evidence. Eco-Environ. Health 2022, 1, 73–85. [Google Scholar] [CrossRef]
  27. Chan, K.H.; Peiris, J.S.M.; Lam, S.Y.; Poon, L.L.M.; Yuen, K.Y.; Seto, W.H. The effects of temperature and relative humidity on the viability of the SARS Coronavirus. Adv. Virol. 2011, 2011, 734690. [Google Scholar] [CrossRef]
  28. Riddell, S.; Goldie, S.; Hill, A.; Eagles, D.; Drew, T.W. The effect of temperature on persistence of SARS-CoV-2 on common surfaces. Virol. J. 2020, 17, 145. [Google Scholar] [CrossRef]
  29. Gerhardts, A.; Hammer, T.R.; Balluff, C.; Mucha, H.; Hoefer, D. A model of the transmission of micro-organisms in a public setting and its correlation to pathogen infection risks. J. Appl. Microbiol. 2012, 112, 614–621. [Google Scholar] [CrossRef]
  30. Birgand, G.; Peiffer-Smadja, N.; Fournier, S.; Kerneis, S.; Lescure, F.; Lucet, J. Assessment of air contamination by SARS-CoV-2 in hospital settings. JAMA Netw Open. 2020, 3, e2033232. [Google Scholar] [CrossRef]
  31. Amoah, I.D.; Pillay, L.; Deepnarian, N.; Awolusi, O.; Pillay, K.; Ramlal, P.; Kumari, S.; Bux, F. Detection of SARS-CoV-2 RNA on contact surfaces within shared sanitation facilities. Int. J. Hyg. Environ. Health 2021, 236, 113807. [Google Scholar] [CrossRef]
  32. Ding, Z.; Qian, H.; Xu, B.; Huang, Y.; Miao, T.; Yen, H.; Xiao, S.; Cui, L.; Wu, X.; Shao, W.; et al. Toilets dominate environmental detection of severe acute respiratory syndrome coronavirus 2 in a hospital. Sci. Total Environ. 2021, 753, 141710. [Google Scholar] [CrossRef]
  33. Abney, S.E.; Bright, K.R.; McKinney, J.; Ijaz, M.K.; Gerba, C.P. Toilet hygiene—Review and research needs. J. Appl. Microbiol. 2021, 131, 2705–2714. [Google Scholar] [CrossRef]
  34. Ali, B.H.; Shahin, M.S.; Sangani, M.M.M.; Faghihinezhad, M.; Baghdade, M. Wastewater aerosols produced during flushing toilets, WWTPs, and irrigation with reclaimed municipal wastewater as indirect exposure to SARS-CoV-2. J. Environ. Chem. Eng. 2021, 9, 106201. [Google Scholar] [CrossRef] [PubMed]
  35. Li, Y.; Wang, J.; Chen, X. Can a toilet promote virus transmission? From a fluid dynamics perspective. Phys. Fluids (1994) 2020, 32, 065107. [Google Scholar] [CrossRef]
  36. Gerba, C.P.; Wallis, C.; Melnick, J.L. Microbiological hazards of household toilets: Droplet production and the fate of residual organisms. Appl. Microbiol. 1975, 30, 229–237. [Google Scholar] [CrossRef]
  37. Johnson, D.L.; Lynch, R.A.; Villanella, S.M.; Jones, J.F.; Fang, H.; Mead, K.R.; Hirst, D.V.L. Persistence of bowl water contamination during sequential flushes of contaminated toilets. J. Environ. Health 2017, 80, 34–49. [Google Scholar]
  38. Johnson, D.L.; Mead, K.R.; Lynch, R.A.; Hirst, D.V.L. Lifting the lid on toilet plume aerosol: A literature review with suggestions for future research. Am. J. Infect. Control. 2013, 41, 254–258. [Google Scholar] [CrossRef]
  39. Gormley, M.; Aspray, T.J.; Kelly, D.A. Aerosol and bioaerosol particle size and dynamics from defective sanitary plumbing systems. Indoor Air 2021, 31, 1427–1440. [Google Scholar] [CrossRef]
  40. Dancer, S.J.; Li, Y.; Hart, A.; Tang, J.W.; Jones, D.L. What is the risk of acquiring SARS-CoV-2 from the use of public toilets? Sci. Total Environ. 2021, 792, 148341. [Google Scholar] [CrossRef] [PubMed]
  41. Hota, S.; Hirji, Z.; Stockton, K.; Lemieux, C.; Dedier, H.; Wolfaardt, G.; Gardam, M.A. Outbreak of multidrug-resistant Pseudomonas aeruginosa colonization and infection secondary to imperfect intensive care unit room design. Infect. Control. Hosp. Epidemiol. 2009, 30, 25–33. [Google Scholar] [CrossRef]
  42. Pirzadian, J.; Souhoka, T.; Herweijer, M.; van Heel, L.; van Wamel, W.J.B.; Goossens, R.H.M.; Severin, J.A.; Vos, M.C. Impact of sink design on bacterial transmission from hospital sink drains to the surrounding sink environment tested using a fluorescent marker. J. Hosp. Infect. 2022, 127, 39–43. [Google Scholar] [CrossRef] [PubMed]
  43. Saaty, T.L. Decision making with the analytic hierarchy process. Int. J. Serv. Sci. 2008, 1, 83–98. [Google Scholar] [CrossRef]
  44. Piccoli, L.; Ferrari, P.; Piumatti, G.; Jovic, S.; Rodriguez, B.F.; Mele, F.; Giacchetto-Sasselli, I.; Terrot, T.; Silacci-Fregni, C.; Cameroni, E.; et al. Risk assessment and seroprevalence of SARS-CoV-2 infection in healthcare workers of COVID-19 and non-COVID-19 hospitals in Southern Switzerland. Lancet Reg. Health Eur. 2021, 1, 100013. [Google Scholar] [CrossRef] [PubMed]
  45. Chatterjee, R.; Bajwa, S.; Dwivedi, D.; Kanji, R.; Ahammed, M.; Shaw, R. COVID-19 Risk Assessment Tool: Dual application of risk communication and risk governance. Prog. Disaster Sci. 2020, 7, 100109. [Google Scholar] [CrossRef]
  46. Malik, U.R.; Atif, N.; Hashmi, F.K.; Saleem, F.; Saeed, H.; Islam, M.; Jiang, M.; Zhao, M.; Yang, C.; Fang, Y. Knowledge, Attitude, and Practices of Healthcare Professionals on COVID-19 and Risk Assessment to Prevent the Epidemic Spread: A Multicenter Cross-Sectional Study from Punjab, Pakistan. Int. J. Environ. Res. Public Health. 2020, 17, 6395. [Google Scholar] [CrossRef] [PubMed]
  47. Ashinyo, M.E.; Dubik, S.D.; Duti, V.; Amegah, K.E.; Ashinyo, A.; Larsen-Reindorf, R.; Kaba Akoriyea, S.; Kuma-Aboagye, P. Healthcare Workers Exposure Risk Assessment: A survey among Frontline Worlers in Designated COVID-19 Treatment Centers in Ghana. J. Prim. Care Community Health 2020, 11, 2150132720969483. [Google Scholar] [CrossRef] [PubMed]
  48. Sammartino, J.C.; Colaneri, M.; Bassoli, C.; Ceresini, M.; Piralla, A.; Ferrari, A.; Percivalle, E.; Baldanti, F.; Bruno, R.; Mondelli, M.U. Real-life lack of evidence of viable SARS-CoV-2 transmission via inanimate surfaces: The SURFACE study. J. Infect. Public Health 2023, 16, 736–740. [Google Scholar] [CrossRef]
Figure 1. Risk tripod.
Safety 09 00078 g001
Figure 2. Toilet use process.
Safety 09 00078 g002
Figure 3. A sketch of a toilet located in a university hospital.
Safety 09 00078 g003
Table 1. Identified environmental and human indicators and associated route transmission.
TypeIndicatorRisk CategoryTransmission
321Route
Environmental IndicatorsArea (A)A < 2.0 m22.0 m2 < A < 3.0 m2A > 3.0 m2AT
WindowNo---Yes
Window AreaSmall (40 × 40 cm)Medium (50 × 50 cm)Large (60 × 40 cm)
Window LocationBelow 1.5 m from the floor---Above 1.5 m from the floor
Air ExhaustNo---Yes
Air Exhaust LocationBelow 2.1 m from the floor---Above 2.1 m from the floor
Water pressure on the faucetHighMediumLowDAT
Water level in washbasinHighMediumLow
AeratorYes---No
Washbasin depthLow (140–150 mm)Medium (150–160 mm)High (>160 mm)
Faucet drippingYes---No
Washbasin designFlat---Oval
Visible secretions in the washbasinYes---No
Discharge water flowHighMediumLowCAT
Discharge pressureHighMediumLow
Water level in the toiletHighMediumLow
Presence of excreta in the toiletYes---No
Natural light intensityLowMediumHighCT
Soap dispenserNo---Yes
Dirt on toilet seatYes---No
Door handle materialHigh criticalityMedium criticalityLow criticality
Toilet bowl materialHigh criticalityMedium criticalityLow criticality
Dump valve materialHigh criticalityMedium criticalityLow criticality
Faucet materialHigh criticalityMedium criticalityLow criticality
Soap dispenser materialHigh criticalityMedium criticalityLow criticality
Dump valve activationMore than one fingerOne fingerNo touch
Faucet openingMore than one fingerOne fingerNo touch
Soap dispenser activationMore than one fingerOne fingerNo touch
General cleaning conditionsBadReasonableGood
Human IndicatorsBathroom time (t)t > 7 min5 min < t < 7 mint < 5 minDCAT
Frequency of trips to the toiletMore than 4/day3–4/dayUp to 2/day
Toilet coverDo not lower---LowerAT
Mask wearingNo---Yes
Toilet seat useYes, without protectionYes, with protectionNo useCT
Number of touches on surfacesMore than 10Between 7 and 10Less than 7
Gloves useNo---Yes
Duration of hand hygiene10 s20 s30 s
Table 2. Fundamental judgment scale.
Importance IntensityDefinition
1Equal importance
3Moderate importance
5Strong importance
7Very strong importance
9Extreme importance
2, 4, 6, 8Intermediate values
Table 3. RI value according to matrix order.
Matrix Order23456789
RI Value0.000.580.901.121.241.321.411.45
Table 4. AHP 6×6 matrix with judgments for SARS-CoV-2 transmission routes.
SARS-CoV-2 Transmission AHPATCTDATDTCATDACT
AT131/41/31/21/5
CT1/311/91/91/61/9
DAT491221/2
DT391/2121/2
CAT261/21/211/3
DACT592231
Table 5. Normalized AHP matrix multiplied by the criteria weight.
SARS-CoV-2 Transmission AHPATCTDATDTCATDACT
Criteria Weight0.06550.02570.24830.19030.12210.3481
AT0.06550.07710.06210.06340.06110.0696
CT0.02180.02570.02760.02110.02040.0387
DAT0.26200.23130.24830.38050.24430.1741
DT0.19650.23130.12410.19030.24430.1741
CAT0.13100.15420.12410.09510.12210.1160
DACT0.32750.23130.49660.38050.36640.3481
Table 6. Criteria weights of SARS-CoV-2 routes transmission obtained by AHP.
Transmission RouteCriteria Weight
Contact transmission0.0257
Air transmission0.0655
Contact and air transmission0.1221
Droplet transmission0.1903
Droplet and air transmission0.2483
Droplet, air, and contact transmission0.3481
Table 7. Risk categories assigned to the environmental indicators.
TypeIndicatorRisk CategoryIndicatorRisk Category
Environmental IndicatorsArea (A)1Water level in the toilet2
Window3Presence of excreta in the toilet1
Window area3Natural light intensity3
Window location3Soap dispenser1
Air exhaust3Dirt on toilet seat1
Air exhaust location3Door handle material3
Water pressure on the faucet1Toilet bowl material3
Water level in washbasin1Dump valve material3
Aerator1Faucet material3
Washbasin depth3Soap dispenser material3
Faucet dripping1Dump valve activation2
Washbasin design1Faucet opening3
Visible secretions in the washbasin1Soap dispenser activation2
Discharge water flow1General cleaning conditions2
Discharge pressure1
Table 8. Risk categories assigned to the human indicators.
TypeIndicatorRisk CategoryIndicatorRisk Category
Human IndicatorsBathroom time (t)2Toilet seat use1
Frequency of trips to the toilet2Number of touches on surfaces2
Toilet cover3Glove use3
Mask wearing3Duration of hand hygiene3
Table 9. Risk score calculation.
Risk Score CalculationRisk = 3Risk = 2Risk = 1
Environmental indicators (EI)2.26710.39841.973
EI total sum 4.6385
Environmental Criteria Weights sum (ECW) 2.8279
Human Indicators (HI)0.54721.44380.0257
HI total sum 2.0167
Human Criteria Weights sum (HCW) 0.9300
EI + HI total sum 6.6552
ECW + HCW total sum 3.8579
Risk Score 1.7251 (Medium)
Table 10. New risk categories assigned to the selected environmental indicators.
TypeIndicatorRisk Category
Environmental Indicators ChangedFaucet material1
Soap dispenser material1
General cleaning conditions1
Table 11. New risk score calculation after a simulation of the implementation of corrective measures.
Risk Score CalculationRisk = 3Risk = 2Risk = 1
Environmental indicators (EI)1.44510.29562.2984
EI total sum 4.0391
Environmental Criteria Weights sum (ECW) 2.9279
Human Indicators (HI)0.54721.44380.0257
HI total sum 2.0167
Human Criteria Weights sum (HCW) 0.9300
EI + HI total sum 6.0558
ECW + HCW total sum 3.8579
Risk Score 1.5697 (Medium)
Disclaimer/Publisher’s Note: The statements, opinions and data contained in all publications are solely those of the individual author(s) and contributor(s) and not of MDPI and/or the editor(s). MDPI and/or the editor(s) disclaim responsibility for any injury to people or property resulting from any ideas, methods, instructions or products referred to in the content.

