Article

Inertial Motion Capturing in Ergonomic Workplace Analysis: Assessing the Correlation between RULA, Upper-Body Posture Deviations and Musculoskeletal Discomfort

1
Department of Sports Science, University of Kaiserslautern-Landau, 67663 Kaiserslautern, Germany
2
Health Management, Campus Saarbrücken, University of Applied Sciences (DHfPG), 66123 Saarbrücken, Germany
3
Medical Department, Hager Group, 66440 Blieskastel, Germany
*
Author to whom correspondence should be addressed.
Safety 2024, 10(1), 16; https://doi.org/10.3390/safety10010016
Submission received: 11 December 2023 / Revised: 16 January 2024 / Accepted: 24 January 2024 / Published: 2 February 2024
(This article belongs to the Special Issue Environmental Risk Assessment—Health and Safety)

Abstract

:
(1) Background: Mobile movement analysis systems, for example, those based on Inertial Measurement Units (IMUs), enable digital real-time methods of collecting data in workplace ergonomics, but the relationship between observational method scores such as Rapid Upper Limb Assessment (RULA), upper-body posture, and their influence on musculoskeletal discomfort, has not yet been well investigated. This field study aimed to evaluate the relationship of these variables in two different target groups: production and office workers. (2) Methods: There were 64 subjects (44 men and 20 women) participating. Data collection was divided into two categories: (1) Cornell Musculoskeletal Discomfort Questionnaire (CMDQ) (n = 64) and 3D stereophotogrammetric posture analysis (n = 58), and (2) Investigation of workload via IMU-based motion capture (MoCap) and the Borg CR-10 body map (n = 24). Correlation tests and regression analysis were performed using SPSS and MATLAB software to examine the relationship between the upper-body posture and RULA. Multivariate analysis of variance (MANOVA) was applied to examine group differences. (3) Results: The findings did not support the authors’ hypothesis that posture risk at work significantly correlates with static upper-body posture and musculoskeletal discomfort. Pelvic tilt had a weak but significant influence on RULA. The data revealed interesting trends in physical exertion, musculoskeletal discomfort, and differences between production and office workers. However, the statistical analysis did not support this. Such approaches have the potential to enhance the accuracy of assessment outcomes and, in turn, provide a stronger foundation for enhancing ergonomic conditions.

1. Introduction

Work-related musculoskeletal disorders (WMSDs) are a leading contributor to reduced workforce productivity among the working population [1]. In the electronics industry, recent studies have reported a prevalence of WMSDs ranging from 35.7 to 80.5% [2,3]. In the European Union, more than half of the workers are affected [4]. Working in industry induces heavy stress owing to heavy loads [5], overexertion, and possible unergonomic working positions [6,7]. Additionally, ergonomic risks (such as repetitive motions, forceful exertions, and non-neutral body postures) may result in a high prevalence of musculoskeletal disorders among production workers [6]. Work demands play a vital role in the development of musculoskeletal pain, often mainly due to low physical capacity and imbalances [8]. In industry, there is evidence that unergonomic working positions correlate with increased perceived exertion [9] and physical discomfort [7,10,11], which can negatively affect the work and employees’ quality of life [12]. Office workers may not lift heavy weights or move in unergonomic positions, but show sedentary behaviors that correlate with lower back [13] and neck pain [14]. In practice, particularly in the planning of offices, logistics, and production halls, ergonomically well-thought-out workplace designs are usually only applied to a limited extent. The objective of ergonomics is to establish a work environment in which the employees feel comfortable and to minimize the prevalence of WMSDs [15].
Preventive examinations are important in promoting public health. One possibility for doing so is the examination of posture parameters [16,17,18]. The classification of normal and abnormal posture is often based on subjective empirical values [19]. According to Czaprowski et al. [20], a “good” body posture is attributed to maintaining a proper, ergonomically advantageous body posture when standing, ensuring mechanical efficiency during movement, and providing support for the normal functioning of internal organs. There are various possibilities for screening human posture in a stationary position, especially in the upper body segments [17]. Non-contact methods (such as 2D digital photograph analysis or 3D scans) provide an accurate and rapid way to perform clinical postural assessment [21]. In addition to manual 2D photograph analysis, stereophotogrammetric systems scan the back contour without contact or radiation exposure using light grids and record their spatial shape with high accuracy [22,23,24]. Ohlendorf [19,25,26,27], Ludwig [17], and Wolf and Huthwelker [16,28] defined reference values for certain target groups using 3D stereophotogrammetry, which can be used to preventively assess spine posture and reflecting the expected standard values for healthy individuals.
Methods that aim to identify imbalances between the ergonomic characteristics of the workplace and the physiological capabilities of workers are referred to as Ergonomic Risk Assessment Tools (ERAT) [29,30,31,32]. Several investigations focus on heart rate [33], muscle activity by surface electromyography [34,35], or risk of falls assessed by wearable stretch sensors [36]. Anthropometrics and medical history are relevant for assessing whether an individual’s physique is suited to the ergonomic requirements of a task. Observational methods are frequently used to assess the risk of occupational work [37]. The Rapid Upper Limb Assessment (RULA) [38], Rapid Entire Body Assessment (REBA), and Ovako Working Posture Assessment (OWAS) [31] are among the most commonly used applications in the field of ergonomic assessments [29,30]. These are systems that score the angular degree position of the joint and calculate the overall postural score that represents the loading on the musculoskeletal system. By summarizing scores on body strain, a score–risk relationship is established [32]. This is of particular interest to occupational physicians who must evaluate ergonomic risks in the workplace [32]. RULA is highlighted in the review by Kee [31] in comparison to OWAS and REBA, but is principally used in relation to the upper limbs.
Current research focuses on the static assessment of working ergonomics [31]; however, work processes are always dynamic and should also be evaluated as such [37]. Further investigations are required to formulate more accurate assessments of musculoskeletal disorder risks at work using directly measured exposure data [39]. Innovative technologies and increasing digitalization enable new ways of collecting and utilizing data in order to derive a concrete potential for action [40]. Inertial measurement units (IMUs) make kinematic measurements in the field possible [41,42]. They provide reliable and valid recording of the postural load at the workplace [43] and, moreover, do not significantly restrict the workers in their work processes [44]. The use of IMU results in a more precise ergonomic assessment of workplaces [32]. The evaluation of IMUs, in combination with posture scores, is required [45]. Evidence on the relationship between scores and the risk of developing musculoskeletal discomfort is pending [46,47]. Therefore, the objective of this work is the evaluation of the relationship between upper-body posture and RULA (representing the workload during a 30-min work period in production or office) and the impact of these variables on musculoskeletal discomfort.
The authors hypothesized that:
(1) Workers with moderate or severe musculoskeletal discomfort have higher levels of perceived physical exertion during the working process than those with no or mild discomfort;
(2) A reference-value-deviating upper-body posture correlates with the posture risk during the working process;
(3) A reference-value-deviating upper-body posture and high posture risk negatively influence workers’ musculoskeletal discomfort;
(4) There is a difference in these variables between production and office workers.

2. Materials and Methods

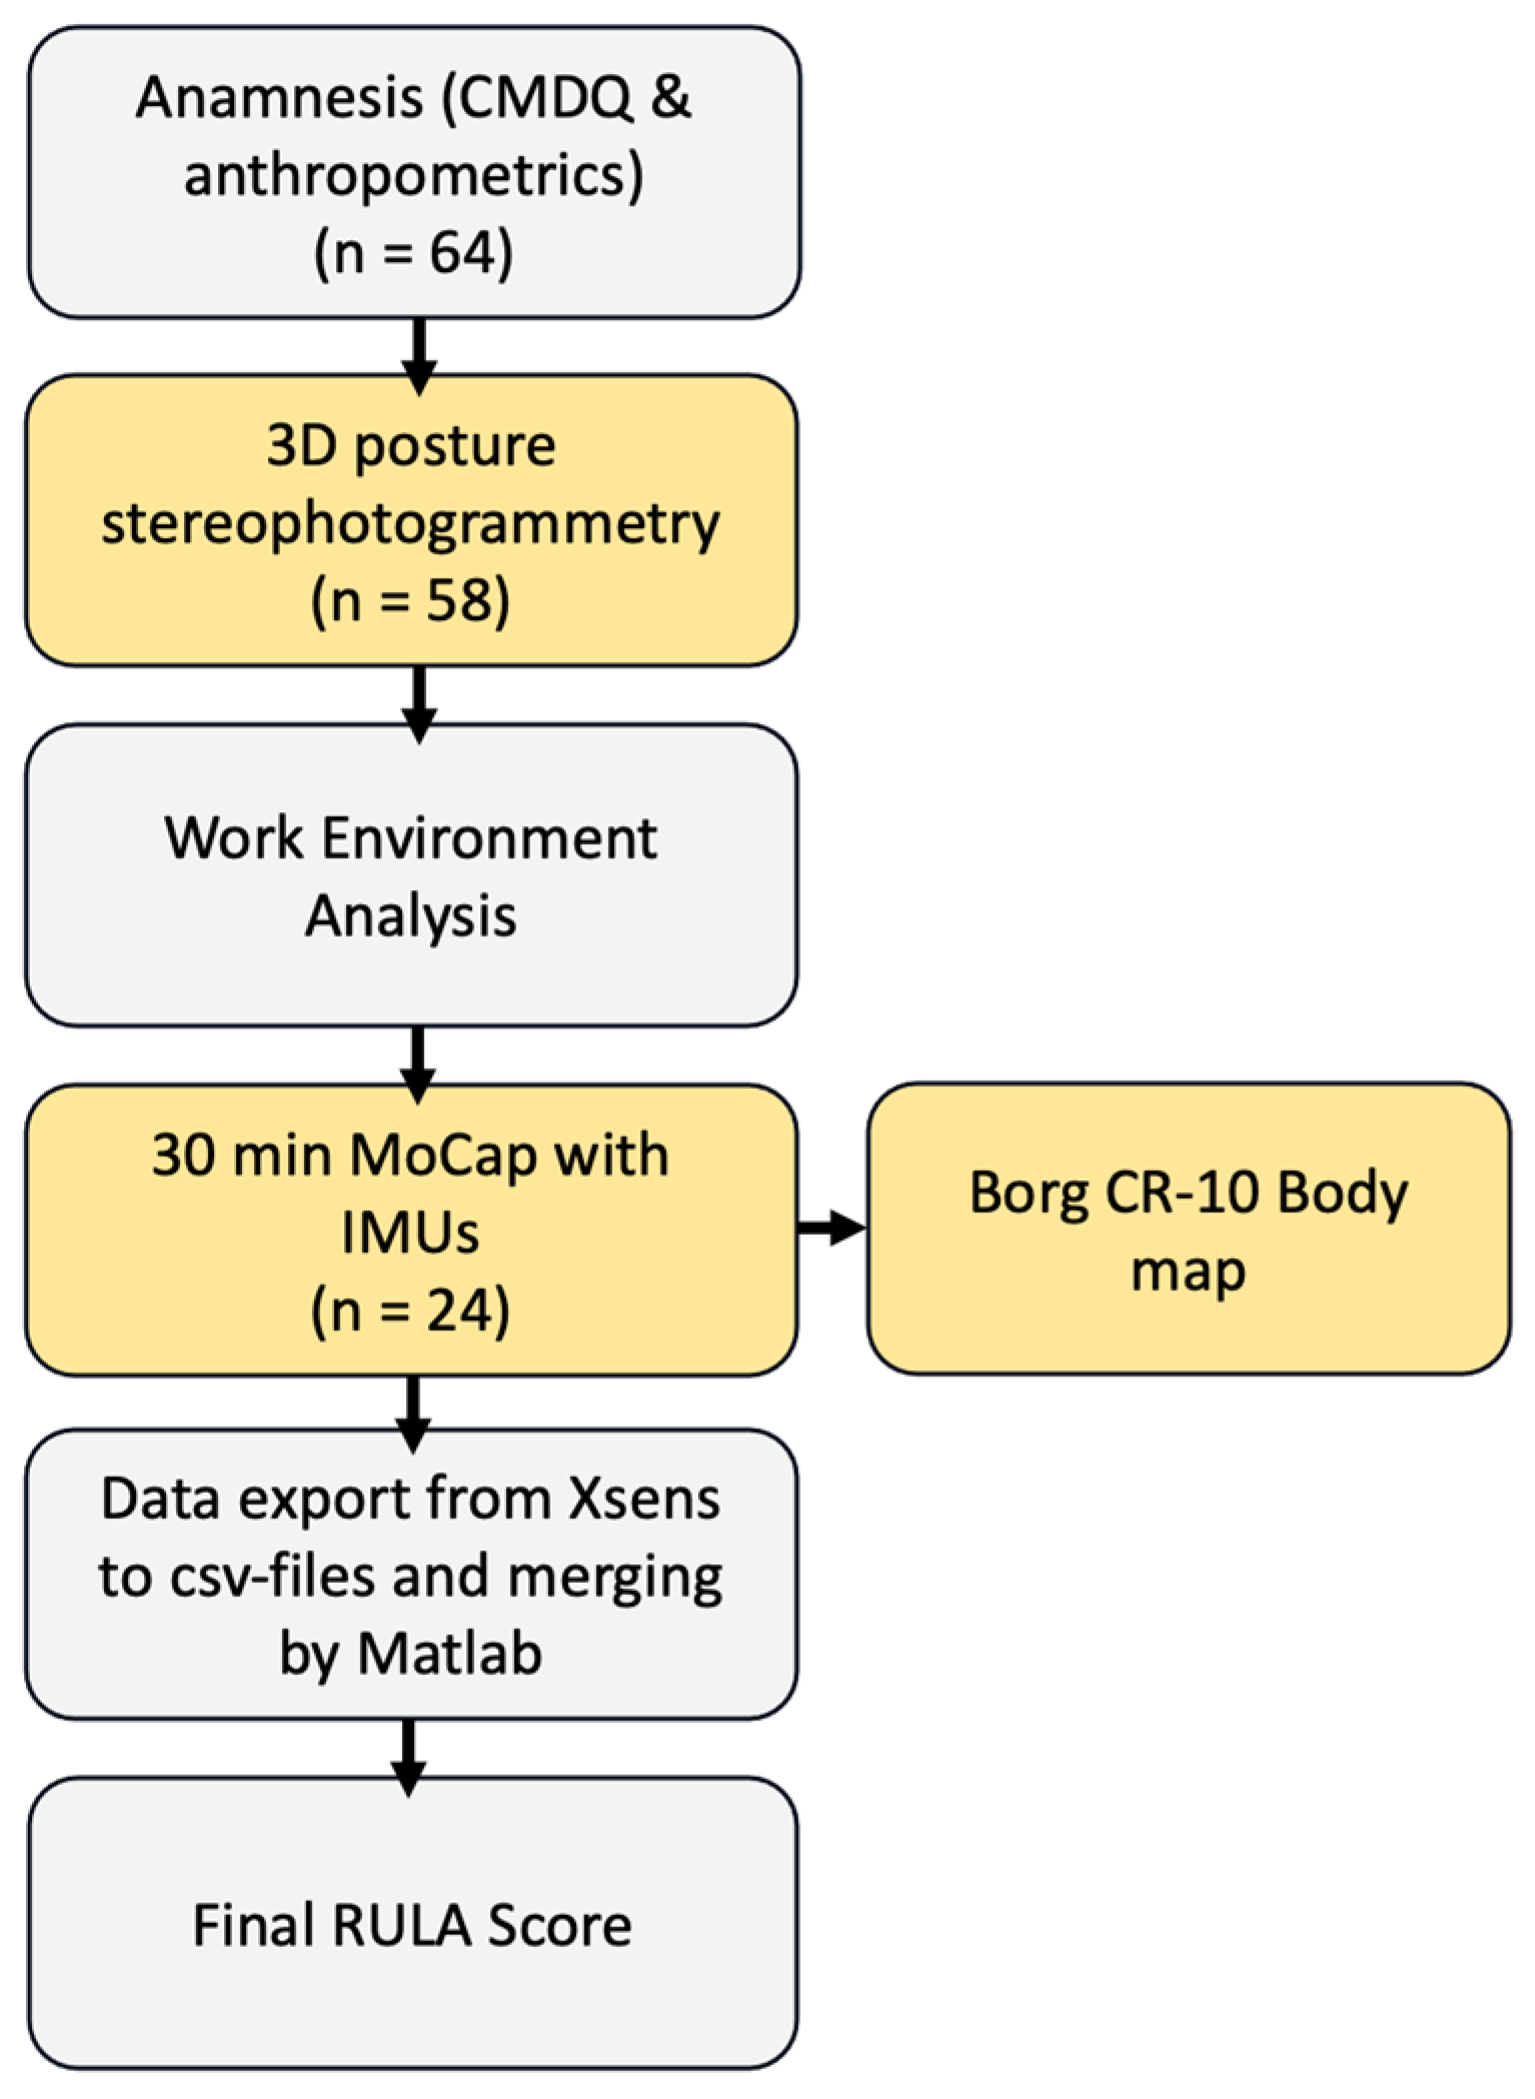
2.1. Subjects and Experimental Design

In this study, 64 subjects (male: 44, female: 20; mean age: 42.53 ± 11.64 years; mean height: 173.67 ± 9.07 cm; mean weight: 80.63 ± 15.24 kg) were included (see Table 1). The sample size was estimated a priori using G∗Power software (Version 3.1.9.6 for Macintosh, University of Kiel, Kiel, Germany). A minimum of 54 individuals was calculated (α error = 0.05; power = 0.95); a reduced statistical power of 0.6 was expected for RULA and upper-body posture, resulting in a minimum sample size of 22.
The subjects were recruited from an industrial company that produces electronic devices and control cabinets. Each participant was informed verbally and in writing and signed an informed consent form regarding data rights, recording videos, and participating in the study procedures. The study was conducted in accordance with the guidelines of the Declaration of Helsinki and was approved by the institutional ethics committees (RPTU Kaiserslautern-Landau, Nr. 66).
The following inclusion criteria were defined:
  • Over 18 years old;
  • Permanent, full-time employment contract at the company;
  • Minimum of one year of professional job experience in the current professional segment.
The exclusion criteria were
  • Acute restriction of physical activity (=medical prohibition to engage in work-related physical activity due to a medical condition or a current injury);
  • Surgical treatment of the musculoskeletal system in the last 12 months [34].
Before the measurements were conducted (see Figure 1), the test subjects were required to complete a medical history form in which the inclusion and exclusion criteria were ensured, and physical activity and work experience were also considered [48].

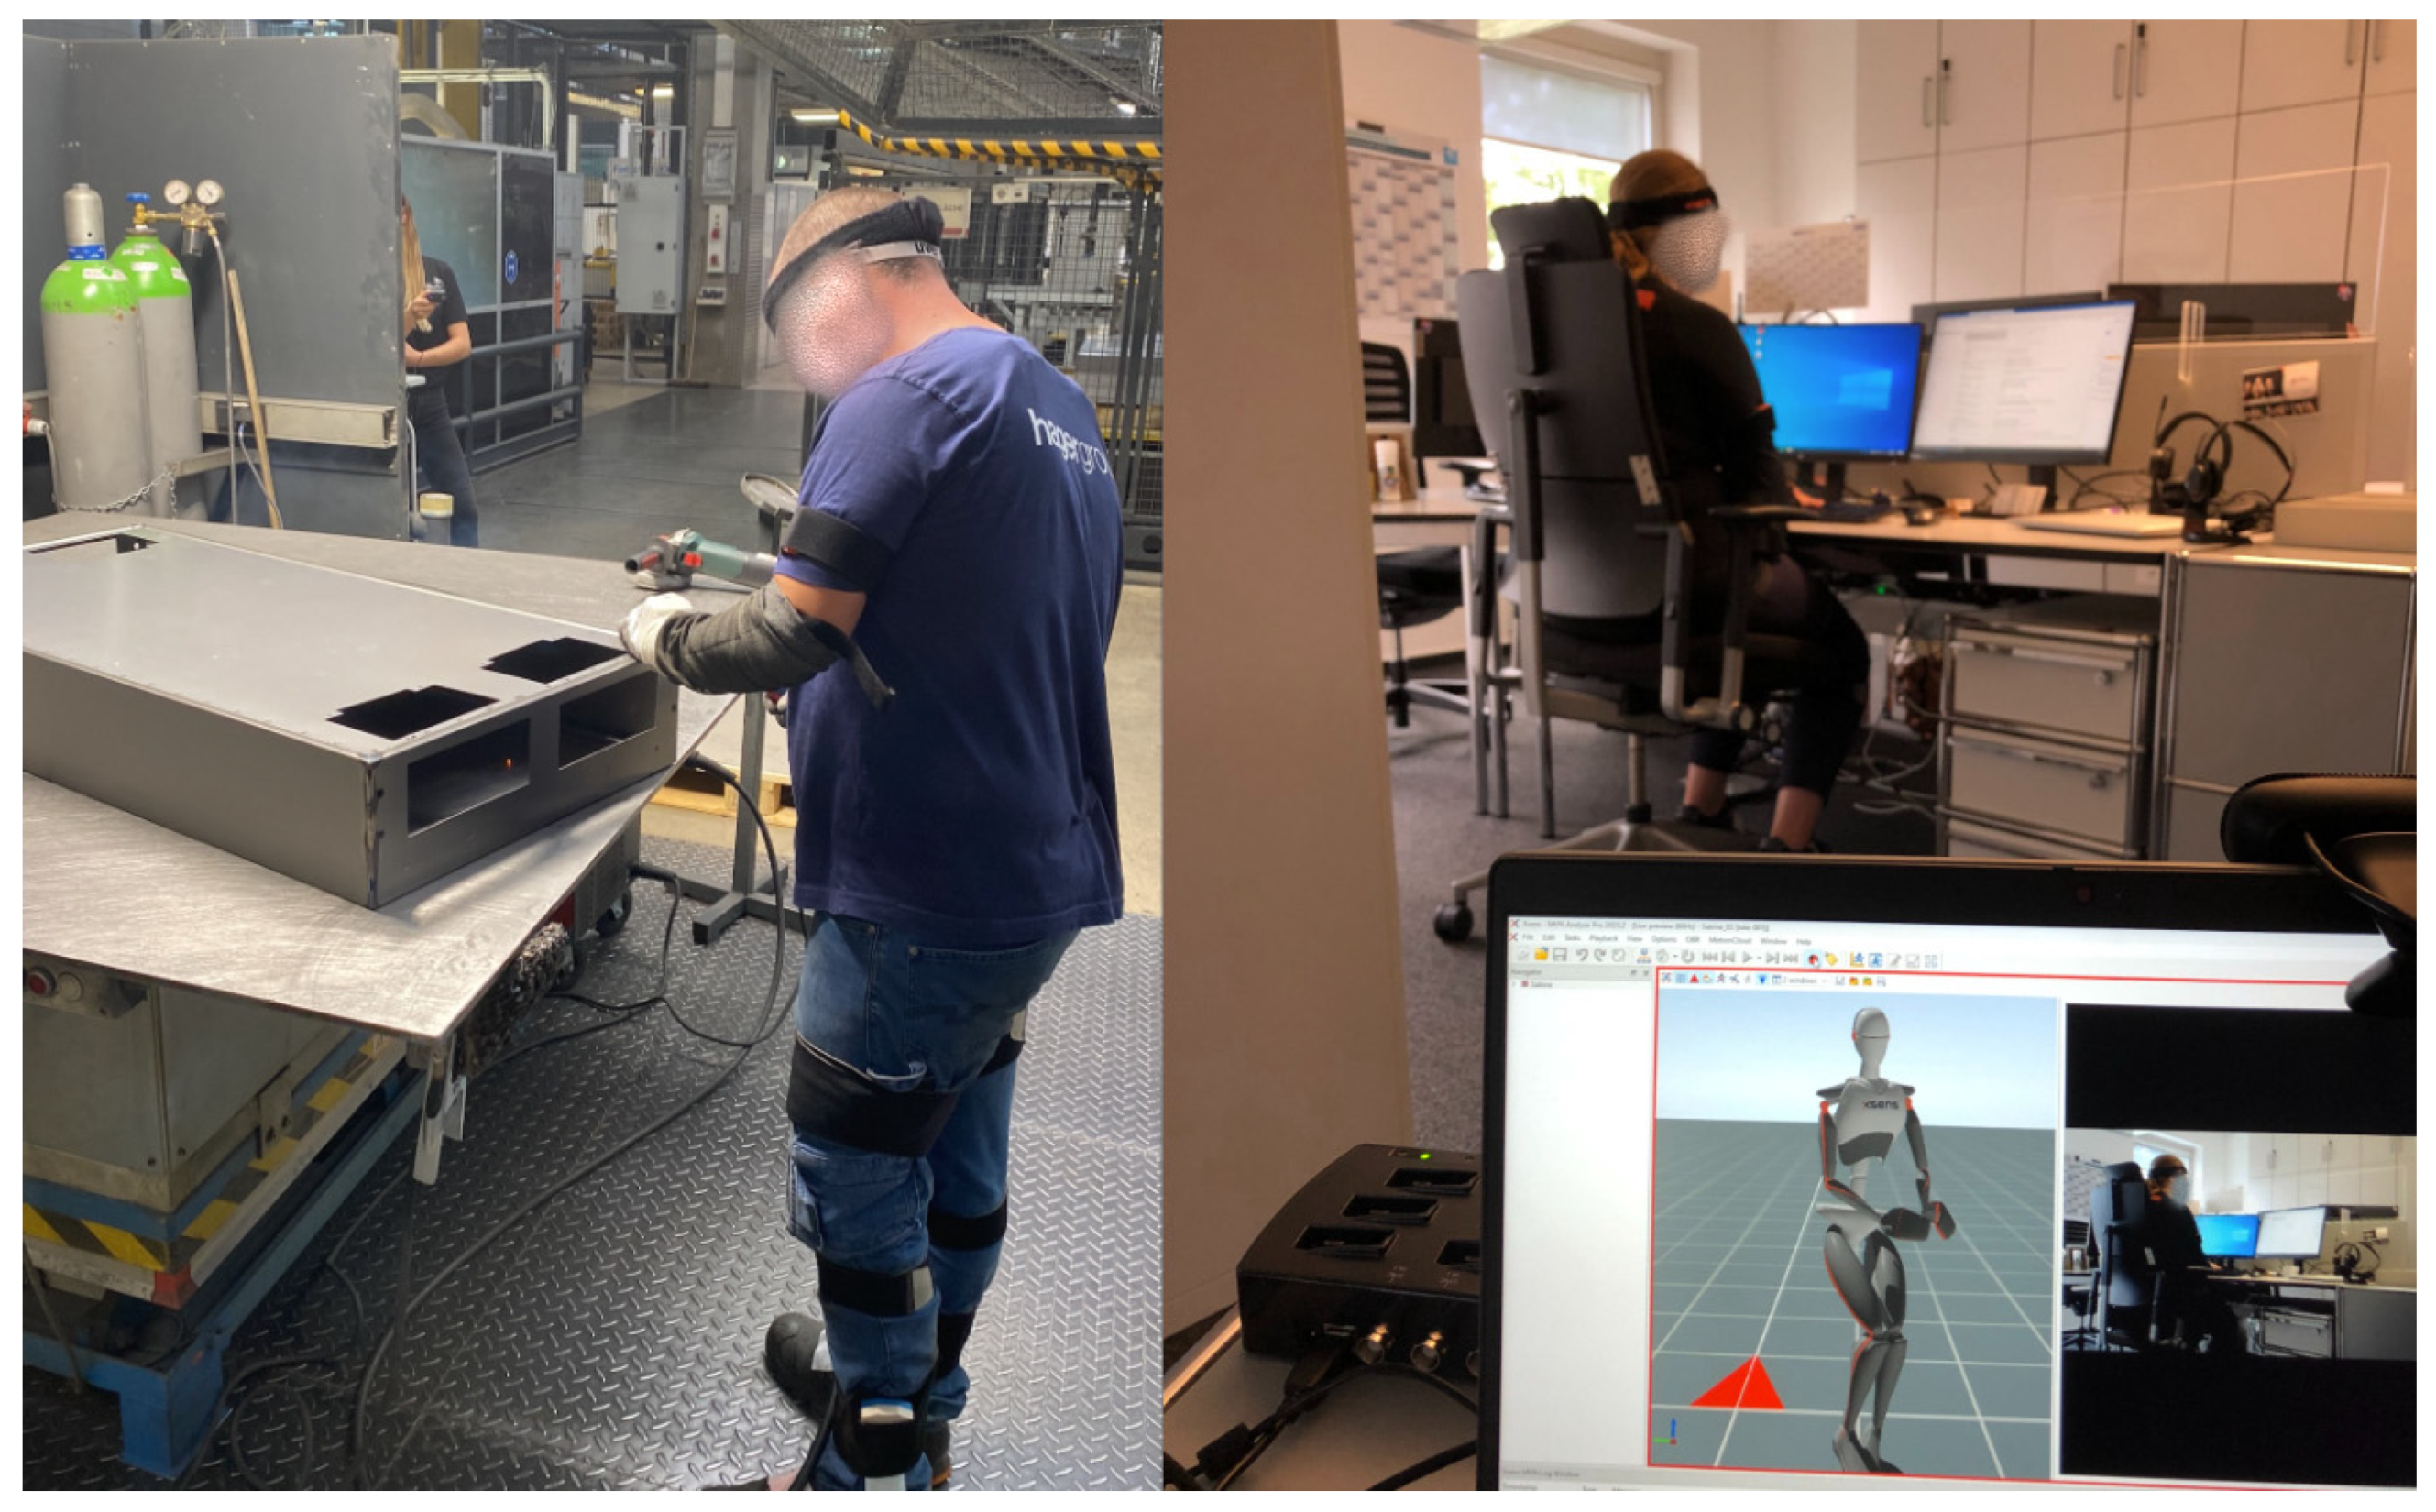
2.1.1. Work Description

Fifteen employees were assigned to the Human Resources Department and had a predominantly sedentary job of 7.5 h a day at a desk, including accounting and administrative tasks in a prolonged sitting position. In production, the work process focused on variable physical work and long periods of standing and walking. Ten different workstations were analyzed, including 49 employees, whose tasks were chosen as representatives of the company (areas: dispatch, stamping, cabinet pre-assembly and final assembly, terminal manufacturing of electrical cabinets, complete panels, and coating).

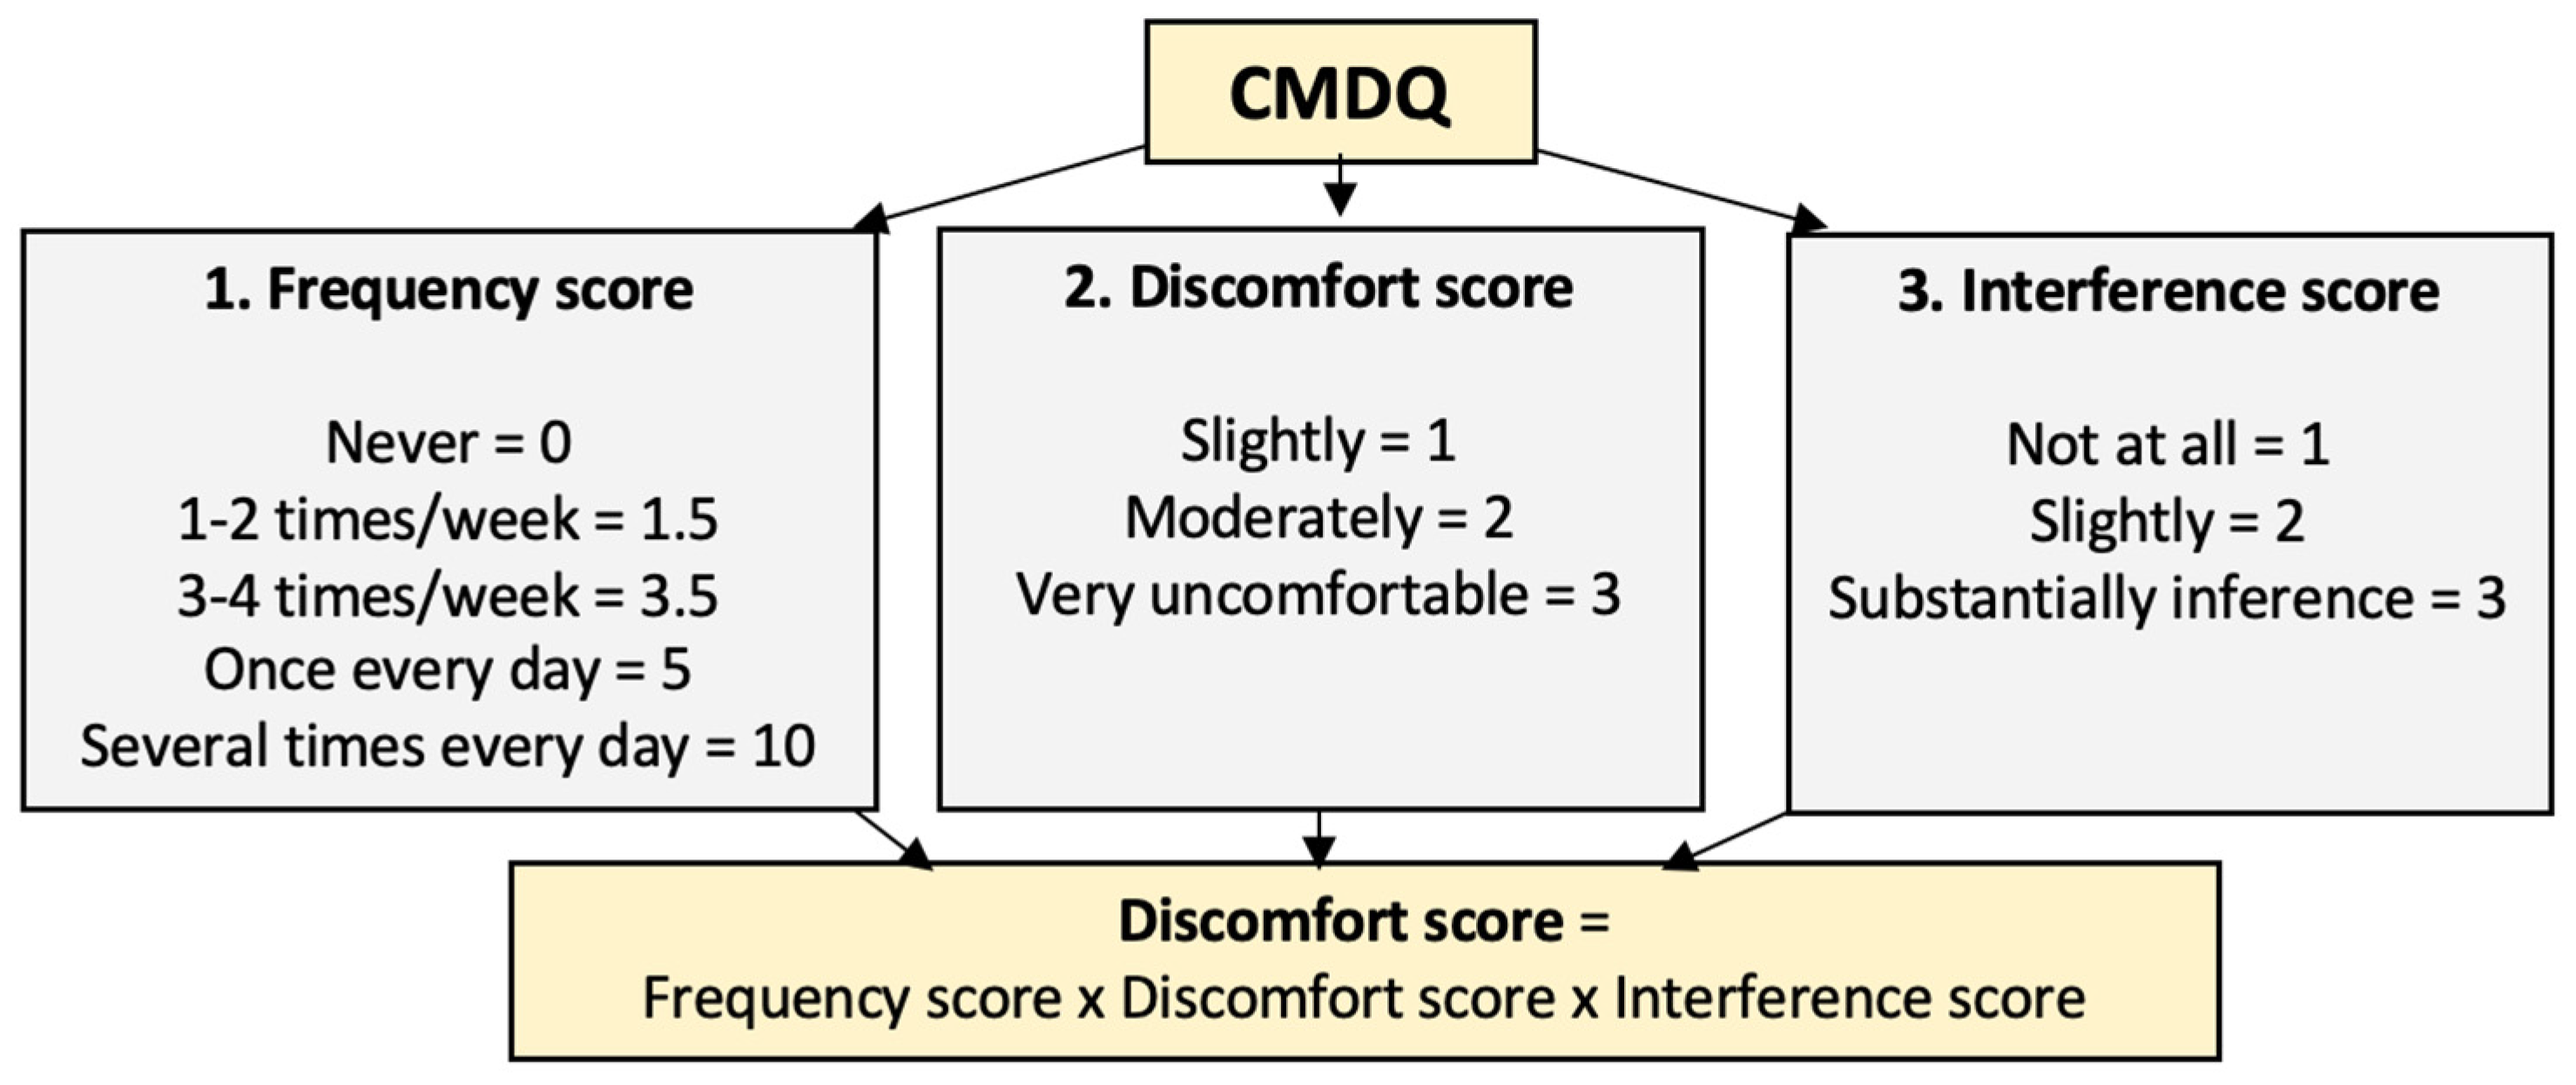
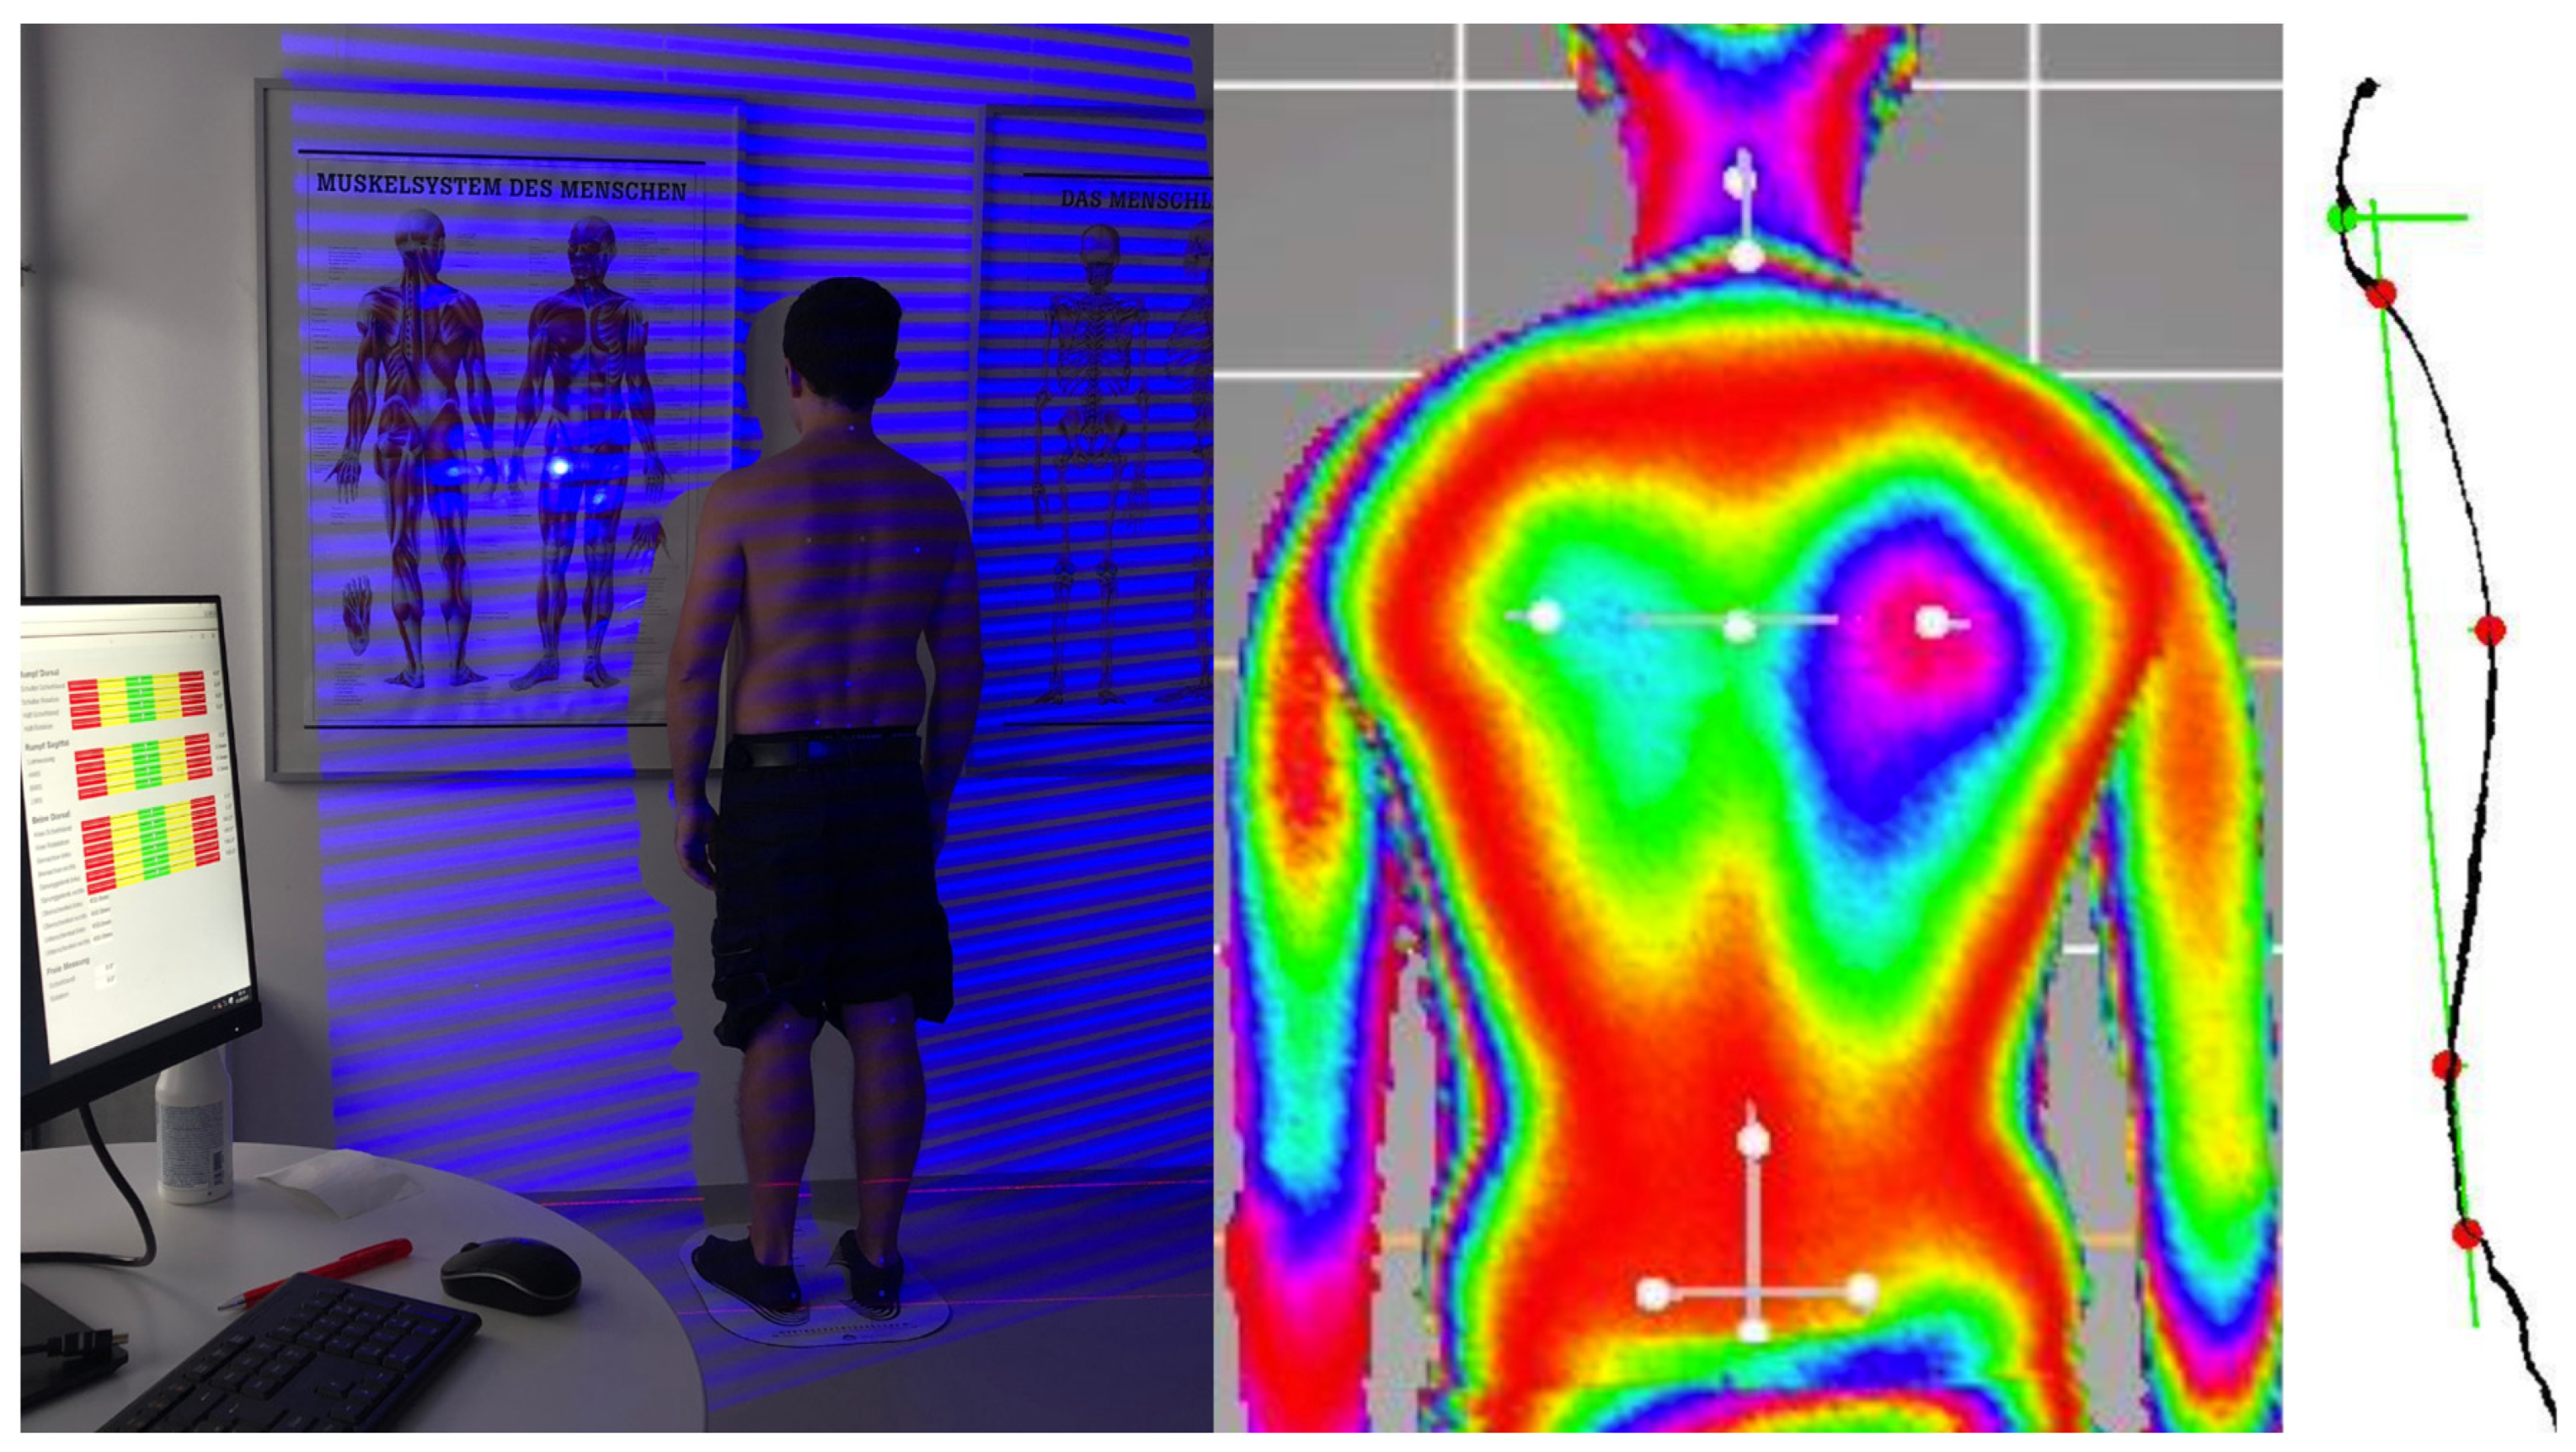
2.1.2. Assessing Musculoskeletal Discomfort and 3D Upper-Body Posture

The experimental design was divided into two main parts: (1) Medical history, Cornell Musculoskeletal Discomfort Questionnaire (CMDQ), and static 3D stereophotogrammetric posture analysis; (2) Investigation of kinematic workload via motion capture (MoCap), and documentation of physical exertion levels using the Borg CR-10 body map. First, each employee was asked about musculoskeletal discomfort. The CMDQ is a comprehensible and time-saving method for the assessment of musculoskeletal discomfort, which is available in the German female and male versions [49]. For each participant, the discomfort score was determined (see Figure 2) by assessing the frequency, discomfort level, and interference during work processes [50].
Six production workers were not available for the upper-body posture analysis due to work shift responsibilities. Therefore, the postures of 43 production employees and 15 office employees were measured statically using 3D stereophotogrammetry (Balance 4D; Paromed Bodybalance GmbH & Co. KG, Neubeuern, Germany) (see Figure 3). The Paromed scanner employs a Vialux scanning unit (Vialux GmbH, Chemnitz, Germany) and has high reliability and accuracy [51,52]. The system operates by projecting a dynamic light stripe pattern using an LED light source onto the back of the subject, thereby achieving a spatial resolution finer than 1 mm. The participants adopted their habitual stance without shoes and with their upper bodies exposed (women wore bras) at an approximate distance of 2.3 m from the scanning device. Before the measurements were taken, the examiner marked nine anatomical reference points with white tape dots measuring 12 mm in diameter according to Ludwig’s procedure [17]. Every posture analysis was performed by the same investigator, who had more than ten years of experience in applying posture analysis and using measuring equipment.
In the frontal plane, the height difference between the left (AISL) and right lower scapular angles (AISR) (scapular height) and the slope of the connecting line between the left (PSISL) and right (PSISR) pelvis to the horizontal (pelvis height) were evaluated. In the transverse plane, the rotation of the distance AISL to AISR (scapular rotation) and the rotation of the distance PSISL to PSISR (pelvic rotation) were collected. In the sagittal plane, the three posture parameters flèche cervicale (FC), flèche lombaire (FL), as well as the Kyphose Index (KI) were calculated by measuring the absolute values of the horizontal distances of the vertices from the perpendicular through the sacrum (S1) (see lowest marker of the sagittal plane in Figure 3). The assessment of these parameters is rapid and cost-effective and is known for its reliability and reproducibility [53]. One major challenge lies in distinguishing between what constitutes normal sagittal spinal curvature and when it should be classified as a postural weakness that necessitates treatment. Therefore, these values were compared to the reference values from Ohlendorf [19] (frontal and transverse planes) and Ludwig [17] (sagittal plane), and the absolute deviations [mm] from the upper and lower limits of the confidence intervals were included in the statistical analysis.

2.1.3. Kinematic Data Collection during the Work Process

Three participants were assessed during each shift. The order of subject acquisition was randomized, and the intervention time was standardized. Twenty-four subjects underwent a 30-min kinematic analysis using IMUs (Xsens, Enschede, NL) during their normal working shift (see Figure 4). The IMUs represent a robust and precise reference system for reconstructing the three-dimensional motion of employees [54]. During the data collection process, while accompanying the day-to-day work process, the sensors transmit real-time data to a dedicated hub for synchronization. This station ensures precise time synchronization for wirelessly connected devices [55,56].
After the MoCap session, participants were asked about their levels of exertion (BORG CR-10 + Body map) [57]. The Borg CR-10 body map for discomfort can be used by ergonomists and occupational healthcare providers [57,58]. The body map assessed subjective exertion levels in 23 different regions of the body.

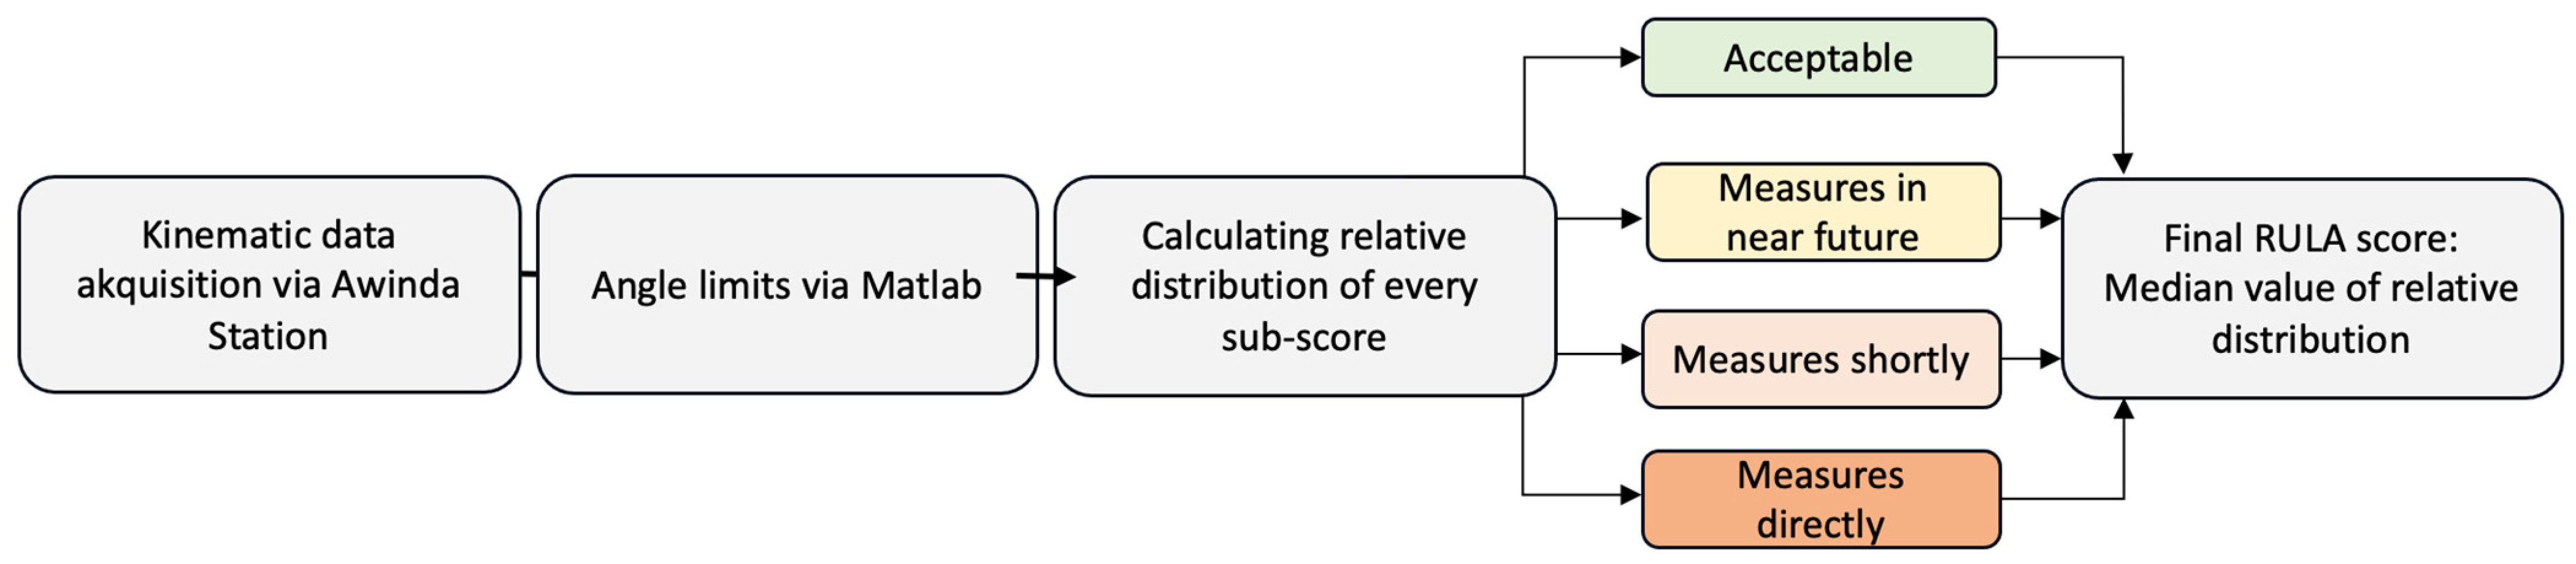
2.1.4. Observational Method RULA

The relevant ergonomic kinematic variables were rated based on the widely used RULA score, which investigates the exposure of workers to risk factors associated with work-related disorders, using a self-written MATLAB script (MathWorks, Natick, Massachusetts, United States). Posture, muscle engagement, and external loads affecting distinct body regions such as the neck, trunk, and upper limbs were evaluated using partial scores for each anatomical region (upper arm, lower arm, wrist, neck, trunk, and legs) [38]:
  • A: Upper- and lower-arms and wrists + muscle activity (none = 0; repetition or static posture > 1 min = 1) and forces (<2 kg = 0; 2–10 kg temporary = 1, 2–10 kg static or repetitive = 2; >10 kg repetitive or sudden = 3),
  • B: Neck, trunk, legs + muscle activity (see above) and forces (see above).
The final score, C, depends on A and B and reflects the WMSD risk level. This score ranges from one to seven, where one denotes a low risk, and seven signifies an exceedingly high risk of developing musculoskeletal pathologies. Specifically, scores of three or four indicate a potential need for intervention or procedural modifications, scores of five or six imply an impending need for alterations, and a score of seven denotes a pressing requirement for a paradigm shift in work procedures [59]. The leg value (“balanced supported on both sides” = 1; “one-legged”, “loaded on one side” = 2) was transferred to the diagram by the test leader, depending on the activity, as follows:
  • Office employees who exclusively worked sitting and personnel managers who worked half-sitting and half-standing/walking = 1.
  • Industrial employees who worked almost exclusively from standing = 1–1.5; industrial employees who had to work with additional loads = 1.5–2.
The use of an IMU makes it possible to map the joint angles over the entire work process [37] (see Figure 5).

2.2. Data Processing and Analysis

After motion capture was completed, the data were merged using MATLAB software (R2023a, The MathWorks, Natick, Massachusetts, USA). The kinematic data were adapted to a self-written RULA evaluation scheme and merged into scores A, B, C, and the total score. Finally, the RULA score was determined from the distribution of the individual evaluation criteria (A, B, and C), representative of the entire recorded work process.
  • (1) Physical exertion and musculoskeletal discomfort
The CMDQ body region scores were combined into the trunk (neck, shoulder, upper back, lower back), upper extremities (upper arm, elbow, lower arm, and wrist), and lower extremities (hip, upper limb, knee, lower limb, foot) and assigned to a discomfort level (no discomfort = 0:0, mild discomfort = 1:0.1–1.5, moderate discomfort = 2:1.6–10.5, severe discomfort = 3:>10.5). The homogeneity of variances was determined using Levene’s test. A one-way Welch’s ANOVA was performed with SPSS (version 29, SPSS Inc., Chicago, IL, USA) to determine the differences between workers who had complaints and those who were symptom-free.
  • (2 + 3) Upper-body posture, RULA, and musculoskeletal discomfort
Multiple regression was used to assess the relationship between the 3D posture parameters and the RULA when the criteria were met. Multicollinearity and homoscedasticity were assessed. Outliers with a standard deviation of 3 or more were removed. Forward and backward regression tests were performed. Mere pelvic tilt was identified as a significant parameter, and therefore, it was tested using single regression. Spearman or Pearson correlations (when a normal distribution was observed) were assessed for their relationship with musculoskeletal discomfort.
  • (4) Group differences between production and office workers
After preliminary testing for normal distribution (using the Shapiro–Wilk test) and variance homogeneity (Levene’s test), a one-way multivariate analysis of variance (MANOVA) was used to explore subgroup differences (industry, office). Calculations and visualizations were performed in SPSS, Microsoft Excel (version 16.78.3, Microsoft, Redmond, Washington, DC, USA), MATLAB and the Python library “Seaborn” [60]. A p-value ≤ 0.05 was chosen as the statistical cut-off point.

3. Results

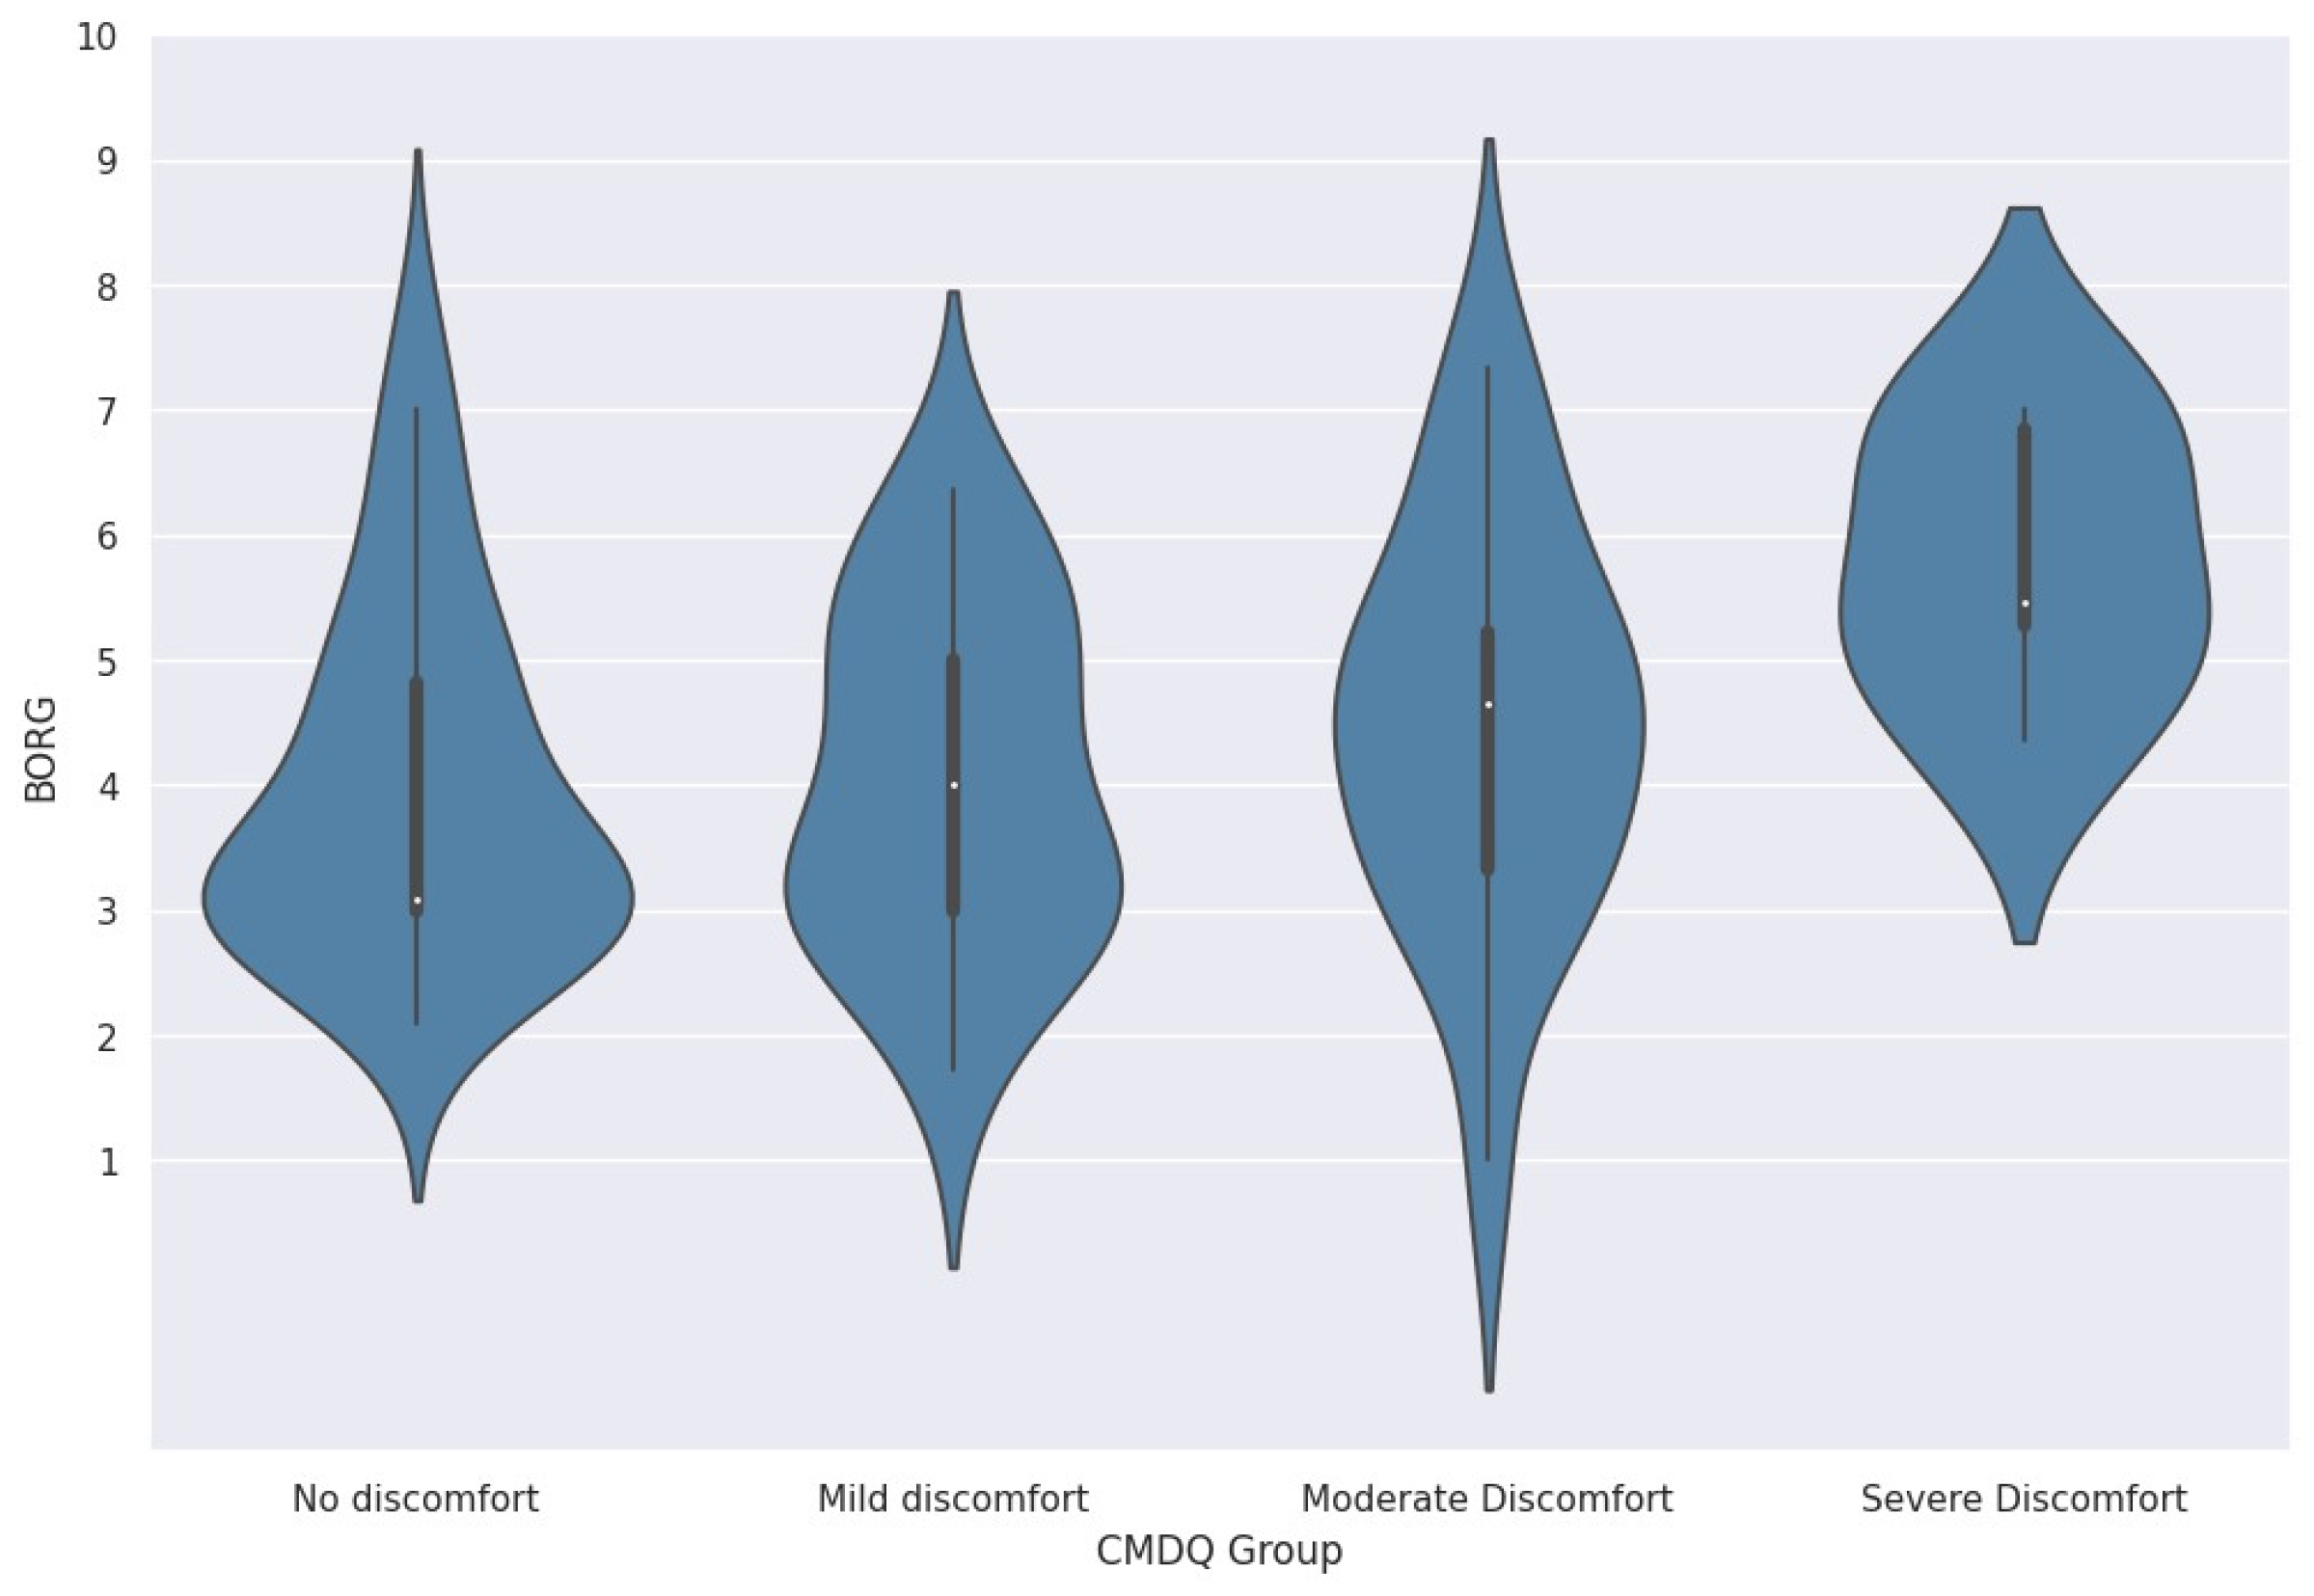
3.1. Physical Exertion and Musculoskeletal Discomfort

The perceived level of physical exertion ranged from no discomfort (median 3.09; interquartile range (IQR) 1.82) to mild discomfort (median 4; IQR: 2), moderate discomfort (median 4.64; IQR 1.89), and severe discomfort (median 5.45; IQR 1.56). The level of physical exertion was statistically significantly different for Welch’s ANOVA F(3, 17.18) = 3.427, p = 0.041, ηp2 = 0.64), but Tukey-Kramer post hoc analysis revealed no significant difference (p > 0.05) in physical exertion. The mean level of physical exertion increased from no discomfort to mild discomfort (0.045, 95% CI [−1.13, 1.22]), from mild to moderate discomfort (0.45, 95% CI [−0.91, 1.81]), and from moderate to severe discomfort (1.29, 95% CI [−0.64, 3.23]) (see also Figure 6).

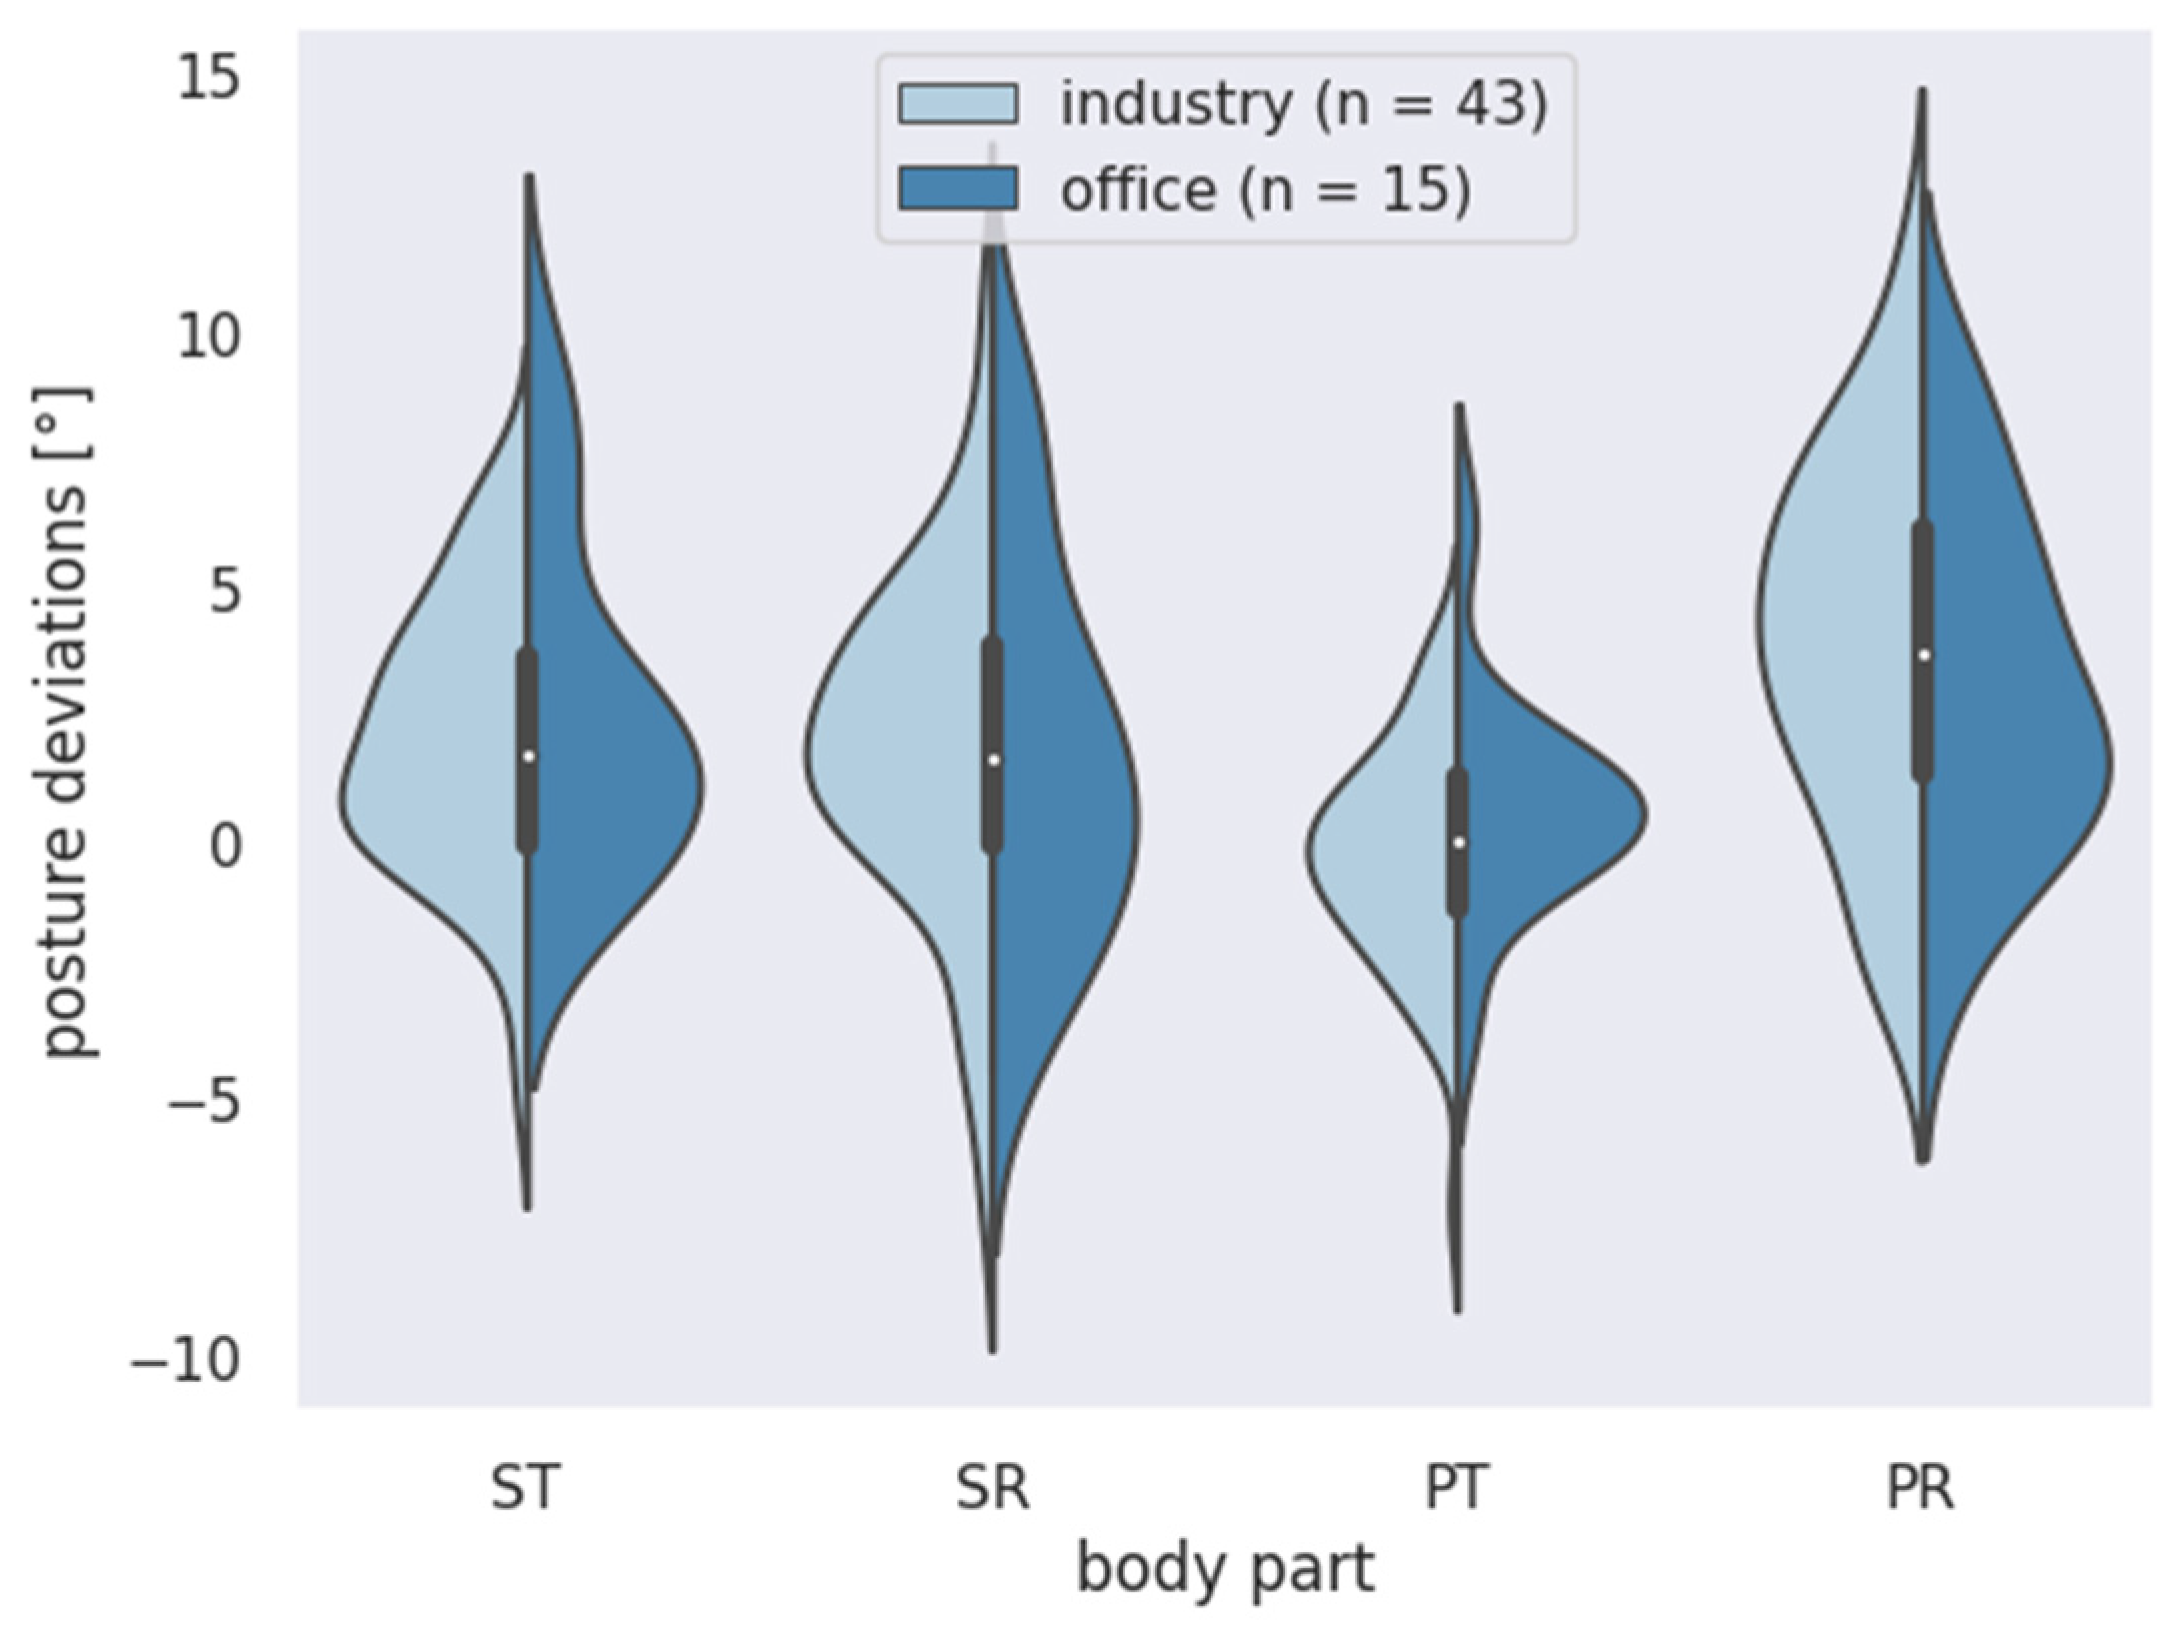
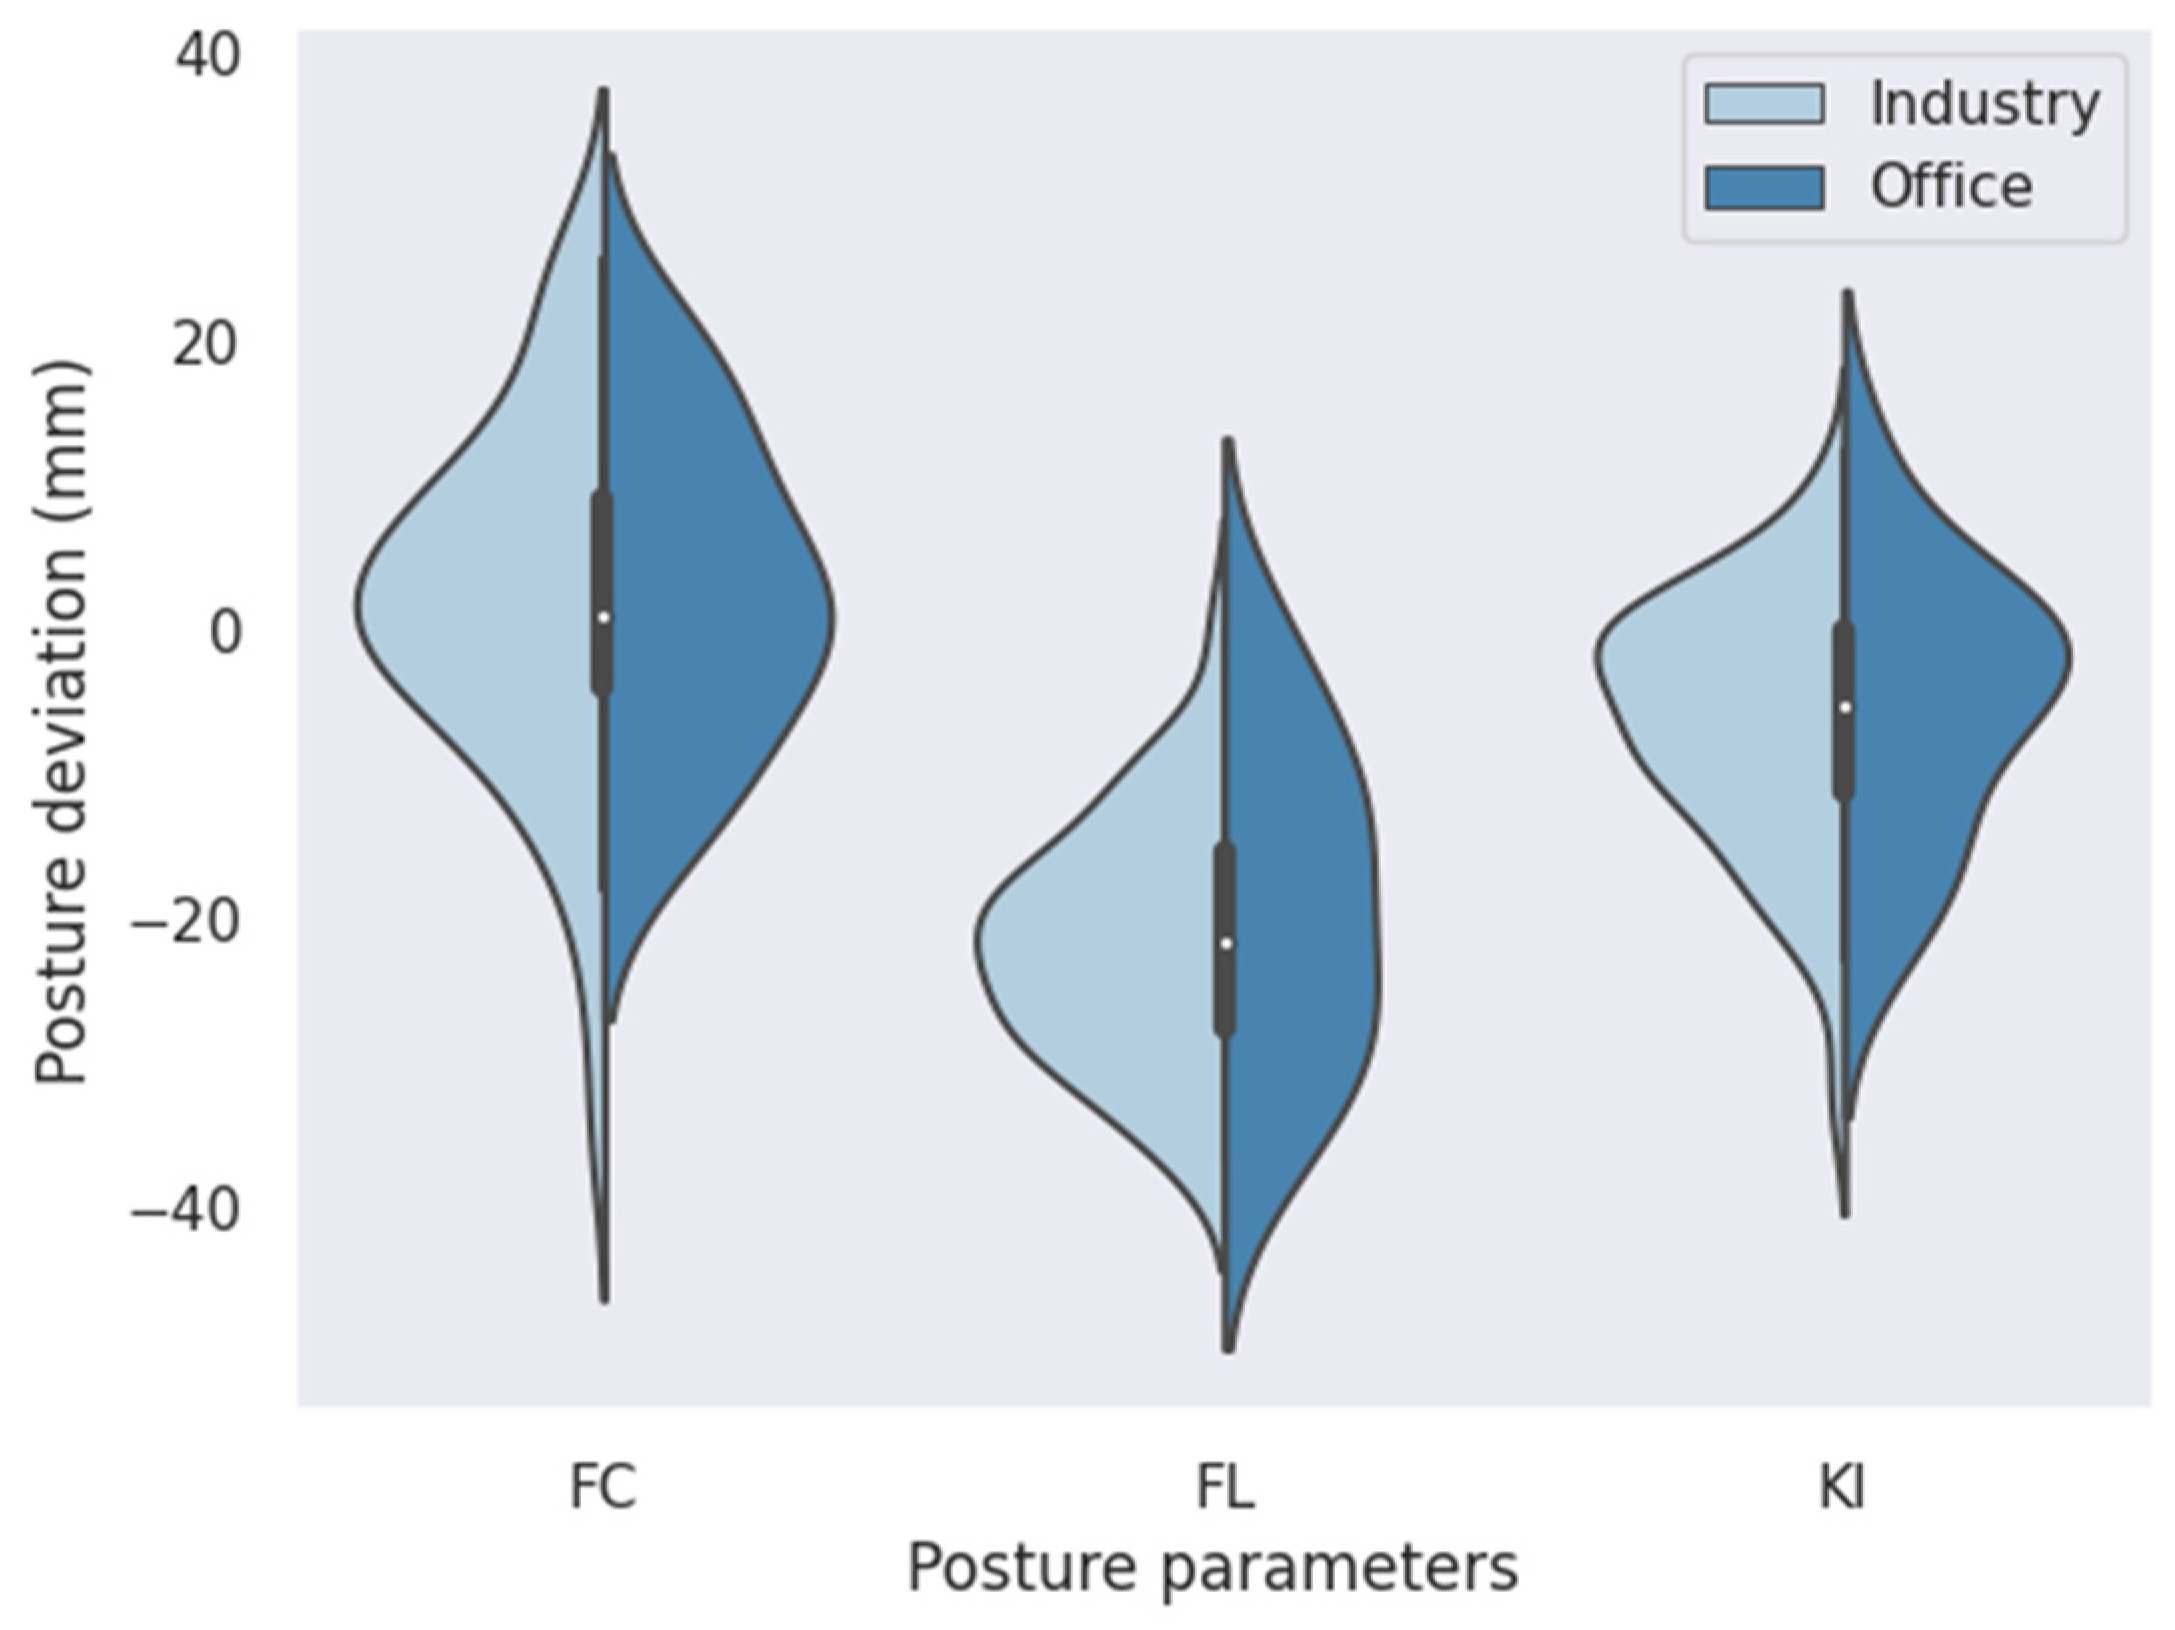
3.2. Upper-Body Posture, RULA, and Musculoskeletal Discomfort

The upper-body posture results for production and office workers are presented in Figure 7 (frontal and transverse plane parameters) and Figure 8 (sagittal plane parameters). Office workers deviated more from the reference values in the sagittal plane, whereas production workers deviated more from the reference values in the transverse plane. Overall, the sample deviated the most with respect to the FL. The RULA scores of the samples are provided in the Supplementary Materials.
Regarding pelvic tilt and RULA, a correlation coefficient (rpt/RULA = 0.45, p = 0.056) was found using Pearson’s correlation coefficient. No significant correlations with moderate or strong effects following Cohen [61] were found with respect to static postural deviations from reference values, individual RULA scores (related to body regions), or total scores (see Figure 9).
Single regression analysis showed a pelvic tilt regression coefficient of 0.473 (F(1, 16) = 4.6, p = 0.048) (regression equation: RULA = 6.126 + 0.288 × pelvic tilt). R2 was 0.223 (adjusted R2 = 0.175), indicating a moderate goodness of fit, according to Cohen [61].
Upper back problems had the second highest CMDQ score (mean ± SD, 7.62 ± 17.95) immediately after lower back problems (13.63 ± 24.59). A correlation coefficient with a strong effect (rSP/muscular discomfort = 0.65, p = 0.004) was found between shoulder rotation deviation and upper-back discomfort. The adjusted p-value according to the Benjamin-Hochberg procedure (p = 0.091) did not reach the significance level, which is why the null hypothesis was retained. No further significant moderate effects between postural deviations and variables were detected.
Regarding group differences between production and office workers, the one-way MANOVA showed no statistically significant difference between production and office workers on the combined dependent variables, F(11, 6) = 1.526, p = 0.313, ηp2 = 0.737, Wilk’s Λ = 0.263. A weakly significant difference between office workers and industrial workers concerning musculoskeletal discomfort in the lower extremities (mean ± SD, 0.83 ± 1.03, p = 0.044) was detected, but office workers had no MD in the lower extremities.

4. Discussion

This study aimed to evaluate the relationship between upper-body posture and physical effort by posture at work, as well as their impact on musculoskeletal discomfort, in two different target groups: production and office workers.

4.1. Results

First, the authors hypothesized that there would be differences in physical exertion between workers with moderate and severe musculoskeletal discomfort and workers with no or mild physical exertion. Following the descriptive data, it can be assumed that there is more discomfort in body regions in which higher subjective exertion levels are present during working processes. Nevertheless, the statistical analysis did not show any significant group differences. In general, it should be noted that the influences on exertion in the work process are multidimensional and may depend on the workers’ daily work patterns. Despite the basic assumption of Balogh et al. [62] that perceived exertion is highly correlated to the risk of developing shoulder and neck complaints, their results suggest that subjects with complaints rate higher exposure levels, and, therefore, tend to reduce their exposure. Village et al. [35] found that workload perceptions did not correlate with lumbar electromyography. In contrast, the results of Hamberg-van-Reenen et al. [8] underlined that discomfort ratings may predict future musculoskeletal pain in healthy subjects. The findings of Waongenngarm et al. [58] showed that values of 3.5 or more in physical exertion measured by the Borg CR-10 body map may be a predictor of neck and low-back pain, and Jakobsen et al. [63] assumed that a perceived exertion level of at least four on the scale may be a reliable indicator of elevated muscular loading throughout the workday. Following these assumptions, the results of this investigation provide helpful information for monitoring and managing the intensity of physical workload in the future.
Second, no systematically significant correlations could be measured between the static postural deviations from the reference values [16,17] and the measured RULA scores. Pelvic tilt had a significant influence on the RULA score, and correlations with the individual RULA components of the upper body suggested that this particularly affects the upper body. The pelvis, as the base of the spine, is known to have a strong influence on the structures of the trunk, particularly the spine, and could, therefore, influence the posture parameters adopted in the work process. However, it must be noted that the pelvic tilt of the sample deviated only marginally from the reference ranges on average (95% CI [0.062, 1.056]). The results of the correlation between static posture and musculoskeletal discomfort are partly in line with the findings of Ribeiro et al. [11], who found no correlation between the presence of pain, static posture and flexibility. The findings of upper-body posture analysis and motion capture were used to derive measures for action (exercise programs; workspace adjustment), which are to be evaluated in further studies.
While the work process takes up one-third of the day (as this study only included full-time workers), and the daily postural risk can thus have a considerable influence on the physique of employees, long-term influences such as sports activity, medical history, and leisure behavior can have an impact. The muscular interactions that support the passive musculoskeletal system also play a decisive role [9,35]. In addition, factors such as the adaptation of work equipment (adjustable desk or chair, positioning of work equipment) may also influence employees’ posture and musculoskeletal complaints [64,65].
Finally, group differences between production and office workers were evaluated. The work processes of office workers are represented by long, static sitting time spans, whereas production workers have variable processes, often with one-sided weightings and external loads. Generally, descriptive data show that in production workers, the deviation from the reference values is greater in the transverse and frontal planes, whereas in office workers, the deviations are greater in the sagittal plane. However, these differences were not statistically significant. Nevertheless, this abnormality should be further investigated, as it may have immediate implications for occupational health practitioners and their approaches to preventing musculoskeletal discomfort.

4.2. Methods

The authors decided to use the CMDQ for the detection of musculoskeletal discomfort, which is an effective tool [49]. Nevertheless, the detection of musculoskeletal discomfort depends on the individual perceptions of the worker. In the context of upper-body posture assessment, previous research established the reliability of 3D stereophotogrammetry for evaluating the trunk shape with high reliability and accuracy [51,52]. The authors decided to use the deviations from the reference values of Ohlendorf [19] and Ludwig [17], who also included a German sample of employees. It must be emphasized, due to small subgroups [17], that these are reference values and not normative values. Regarding postural risk, the authors used RULA, which has been an established assessment tool for decades in the ergonomic evaluation of work processes. RULA is more closely related to the upper limbs, but was selected as a suitable tool for assessing posture risk at work [31]. Conventional ergonomic risk assessment instruments frequently lack the sensitivity required to assess thoroughly optimized work routines [37].
The MoCap with an IMU made it possible to record the kinematic data over 30 min of the work processes, thus making it possible to determine the RULA score for each individual posture of the work process and to allow a temporal distribution in the four risk areas, which represents the overall process. This can be seen as a significant enhancement of the test results. This calculation encompassed the overall RULA scores of both body halves. Consequently, a more objective determination of the total ergonomic load is feasible, leading to a more accurate assessment of workplace ergonomics [37]. Algorithms that use IMU data to provide score-based results are an option, and proposals have recently been published [45].

4.3. Strengths and Limitations of This Study

To the best of the authors’ knowledge, this study is the first to compare static 3D upper-body posture parameters via 3D stereophotogrammetry oriented on reference values with the actual work processes of workers in production and offices recorded via MoCap (IMU). The authors decided on a field assessment; its great strength was observed in the representation of actual work processes. On the one hand, this improves external validation. For instance, real work processes include dynamic and variable activities that can never be standardized for the same posture. It is also possible to record atypical movements in the working process, affecting the variability of different actions in the production process. Refinements such as these have the potential to enhance the accuracy of assessment outcomes and provide a stronger foundation for enhancing ergonomic conditions in practical settings. On the other hand, however, this also has consequences for internal validity and reliability. Confounding influences and comparability can be controlled less effectively than in laboratory studies.
Overall, the uneven distribution of group sizes must be noted, with 49 production workers and 15 office workers. Therefore, the group comparison, especially with a reduced sample size of 24 regarding RULA assessment, which was due to individual working hours and logistical dependencies within the company, must be viewed critically.

4.4. Future Work

It is important to investigate the relationship between actual work processes, which are not exclusively recorded in the laboratory, and posture parameters and to evaluate these over a period longer than a few minutes. Factors such as environmental conditions (particularly cold and draught) and pace of work (number of movements under load in a unit of time) could also influence discomfort and the type of movement performed. In addition to kinematic analyses, future studies should also focus on further ergonomic factors, such as the possibility of workplace adjustments and their effects. Furthermore, the fatigue factor should be investigated over different shift times with different break arrangements, using recordings via MoCap and observational methods, such as RULA, REBA, or OWAS.
In addition, the development of established scores in the direction of dynamics should be pursued. Future studies should add objective measurements for fatigue, such as electromyography, larger participant numbers, especially office workers, as well as a balanced number of males and females. This field study demonstrates the need for further research on preventive measurement methods, such as posture analysis and dynamic, ergonomic workplace assessment, to determine the causes of musculoskeletal discomfort.

5. Conclusions

Technologies such as IMU enable new ways of collecting kinematic data and make it possible to optimize traditional ergonomic assessment systems such as RULA. This approach assessed the relationship between static upper-body posture parameters with real-world work processes of production and office workers and their influence on musculoskeletal discomfort. The findings do not support the authors’ hypothesis that high posture risk at work shows a strong relationship between upper body standing posture and musculoskeletal discomfort, but pelvic tilt had a significant influence on the RULA score. The results revealed interesting trends; for example, office workers deviated more from reference values in the sagittal plane, and production workers deviated more in the frontal and transverse planes concerning upper-body posture. However, the statistical analysis did not confirm this, as no group differences were identified between production and office workers despite different work requirements.
This investigation contributes to generating greater knowledge about the relationship between work-related postural demands and the musculoskeletal system. The persistently high incidence of musculoskeletal discomfort over the past few decades underscores the pressing need to improve working conditions further.

Supplementary Materials

The following supporting information can be downloaded at https://www.mdpi.com/article/10.3390/safety10010016/s1: Table S1: Results (mean and standard deviation) of musculoskeletal discomfort (MD) in production and office workers. Figure S1: Mean and standard deviation of subjective physical exhaustion (Borg CR-10 body map) of 24 participants after MoCap: Figure S2: Absolute final RULA scores; Figure S3: Pearson correlation coefficients (r) between static posture values (differences from reference values [17,19]; Y-axis) and RULA scores (X-axis); Figure S4: Correlation coefficients between static posture values (deviations from reference values [17,19]; Y-axis) and musculoskeletal discomfort (MD) (X-axis); Figure S5: Correlation coefficients between musculoskeletal discomfort (MD) (Y-axis) and RULA (X-axis).

Author Contributions

Conceptualization: S.S. and J.D.; methodology: S.S., J.D. and O.W.; validation: S.S. and J.D.; formal analysis: S.S. and J.D.; investigation: S.S., I.R.-S. and J.D.; resources: M.F.; data curation: J.D., S.S. and C.D.; writing—original draft preparation: S.S., J.D., C.D., I.R.-S. and E.B.; visualization: J.D., S.S. and C.D.; supervision: M.F.; project administration: S.S. All authors have read and agreed to the published version of the manuscript.

Funding

The project (investigation and data curation) was funded by Hager Group.

Institutional Review Board Statement

The study was conducted in accordance with the Declaration of Helsinki and approved by the Institutional Review Board (or Ethics Committee) of RPTU Kaiserslautern-Landau (Nr. 66) for studies involving humans.

Informed Consent Statement

Informed consent was obtained from all subjects involved in the study.

Data Availability Statement

Data are contained within the article and Supplementary Materials.

Acknowledgments

We are grateful to all the management authorities, represented by Eike Wagner, and the medical department, represented by Doris Albrecht-Rypalla, who cooperated with our survey despite their busy schedules and brought some critical thought-provoking impulses for the realization of the project. The authors would also like to acknowledge P. P. Zender (Zender Orthopädie GmbH, Saarbrücken) for providing us with a measurement setup for carrying out the study.

Conflicts of Interest

Author Ilsemarie Roschlock-Sachs was employed by the company Hager Group. The remaining authors declare that the research was conducted in the absence of any commercial or financial relationships that could be construed as a potential conflict of interest.

References

  1. Maulik, S.; Iqbal, R.; De, A.; Chandra, A.M. Evaluation of the working posture and prevalence of musculoskeletal symptoms among medical laboratory technicians. J. Back Musculoskelet. Rehabil. 2014, 27, 453–461. [Google Scholar] [CrossRef] [PubMed]
  2. Yang, F.; Di, N.; Guo, W.-W.; Ding, W.-B.; Jia, N.; Zhang, H.; Li, D.; Wang, D.; Wang, R.; Zhang, D. The prevalence and risk factors of work related musculoskeletal disorders among electronics manufacturing workers: A cross-sectional analytical study in China. BMC Public Health 2023, 23, 10. [Google Scholar] [CrossRef] [PubMed]
  3. Daneshmandi, H.; Kee, D.; Kamalinia, M.; Oliaei, M.; Mohammadi, H. An ergonomic intervention to relieve musculoskeletal symptoms of assembly line workers at an electronic parts manufacturer in Iran. Work 2018, 61, 515–521. [Google Scholar] [CrossRef] [PubMed]
  4. Bonfiglioli, R.; Caraballo-Arias, Y.; Salmen-Navarro, A. Epidemiology of work-related musculoskeletal disorders. Curr. Opin. Epidemiol. Public Health 2022, 1, 18–24. [Google Scholar] [CrossRef]
  5. Havet, N.; Fournier, J.; Stefanelli, J.; Plantier, M.; Penot, A. Disparate exposure to physically demanding working conditions in France. Rev. D’épidémiol. Santé Publique 2020, 68, 327–336. [Google Scholar] [CrossRef] [PubMed]
  6. Liu, Y.; Xiao, L.; Zhou, H.; Xie, C.; Huang, L. An analysis of work-related musculoskeletal disorders and ergonomic loads in male welders in shipbuilding industry. Chin. J. Ind. Hyg. Occup. Dis. 2019, 37, 201–206. [Google Scholar]
  7. Vieira, E.R.; Kumar, S. Working postures: A literature review. J. Occup. Rehabil. 2004, 14, 143–159. [Google Scholar] [CrossRef] [PubMed]
  8. Hamberg-van Reenen, H.H.; van der Beek, A.J.; Blatter, B.M.; van der Grinten, M.P.; van Mechelen, W.; Bongers, P.M. Does musculoskeletal discomfort at work predict future musculoskeletal pain? Ergonomics 2008, 51, 637–648. [Google Scholar] [CrossRef]
  9. Hellig, T.; Johnen, L.; Mertens, A.; Nitsch, V.; Brandl, C. Prediction model of the effect of postural interactions on muscular activity and perceived exertion. Ergonomics 2020, 63, 593–606. [Google Scholar] [CrossRef]
  10. Åhsberg, E.; Gamberale, F. Perceived fatigue during physical work: An experimental evaluation of a fatigue inventory. Int. J. Ind. Ergon. 1998, 21, 117–131. [Google Scholar] [CrossRef]
  11. Ribeiro, R.P.; Sedrez, J.A.; Candotti, C.T.; Vieira, A. Relationship between chronic non-specific low back pain with disability, static posture and flexibility. Fisioter. E Pesqui. 2018, 25, 425–431. [Google Scholar] [CrossRef]
  12. Walker-Bone, K.; Linaker, C. Prediction of prognosis for people off sick with upper extremity musculoskeletal disorders. Occup. Environ. Med. 2016, 73, 805–806. [Google Scholar] [CrossRef] [PubMed]
  13. Bontrup, C.; Taylor, W.R.; Fliesser, M.; Visscher, R.; Green, T.; Wippert, P.-M.; Zemp, R. Low back pain and its relationship with sitting behaviour among sedentary office workers. Appl. Ergon. 2019, 81, 102894. [Google Scholar] [CrossRef] [PubMed]
  14. Jun, D.; Zoe, M.; Johnston, V.; O’Leary, S. Physical risk factors for developing non-specific neck pain in office workers: A systematic review and meta-analysis. Int. Arch. Occup. Environ. Health 2017, 90, 373–410. [Google Scholar] [CrossRef] [PubMed]
  15. Odebiyi, D.O.; Okafor, U.A.C. Musculoskeletal Disorders, Workplace Ergonomics and Injury Prevention. In Ergonomics—New Insights; IntechOpen: Rijeka, Croatia, 2023. [Google Scholar]
  16. Huthwelker, J.; Konradi, J.; Wolf, C.; Westphal, R.; Schmidtmann, I.; Drees, P.; Betz, U. Reference Values for 3D Spinal Posture Based on Videorasterstereographic Analyses of Healthy Adults. Bioengineering 2022, 9, 809. [Google Scholar] [CrossRef] [PubMed]
  17. Ludwig, O.; Dindorf, C.; Kelm, J.; Simon, S.; Nimmrichter, F.; Fröhlich, M. Reference Values for Sagittal Clinical Posture Assessment in People Aged 10 to 69 Years. Int. J. Environ. Res. Public Health 2023, 20, 4131. [Google Scholar] [CrossRef] [PubMed]
  18. Dindorf, C.; Konradi, J.; Wolf, C.; Taetz, B.; Bleser, G.; Huthwelker, J.; Werthmann, F.; Bartaguiz, E.; Kniepert, J.; Drees, P. Classification and automated interpretation of spinal posture data using a pathology-independent classifier and explainable artificial intelligence (Xai). Sensors 2021, 21, 6323. [Google Scholar] [CrossRef] [PubMed]
  19. Ohlendorf, D.; Avaniadi, I.; Adjami, F.; Christian, W.; Doerry, C.; Fay, V.; Fisch, V.; Gerez, A.; Goecke, J.; Kaya, U. Standard values of the upper body posture in healthy adults with special regard to age, sex and BMI. Sci. Rep. 2023, 13, 873. [Google Scholar] [CrossRef]
  20. Czaprowski, D.; Stoliński, Ł.; Tyrakowski, M.; Kozinoga, M.; Kotwicki, T. Non-structural misalignments of body posture in the sagittal plane. Scoliosis Spinal Disord. 2018, 13, 6. [Google Scholar] [CrossRef]
  21. Fortin, C.; Ehrmann Feldman, D.; Cheriet, F.; Labelle, H. Clinical methods for quantifying body segment posture: A literature review. Disabil. Rehabil. 2011, 33, 367–383. [Google Scholar] [CrossRef]
  22. Walicka-Cupryś, K.; Wyszyńska, J.; Podgórska-Bednarz, J.; Drzał-Grabiec, J. Concurrent validity of photogrammetric and inclinometric techniques based on assessment of anteroposterior spinal curvatures. Eur. Spine J. 2018, 27, 497–507. [Google Scholar] [CrossRef] [PubMed]
  23. Singla, D.; Veqar, Z.; Hussain, M.E. Photogrammetric assessment of upper body posture using postural angles: A literature review. J. Chiropr. Med. 2017, 16, 131–138. [Google Scholar] [CrossRef] [PubMed]
  24. D’Amico, M.; Kinel, E.; Roncoletta, P. Normative 3D opto-electronic stereo-photogrammetric posture and spine morphology data in young healthy adult population. PLoS ONE 2017, 12, e0179619. [Google Scholar] [CrossRef] [PubMed]
  25. Ohlendorf, D.; Sosnov, P.; Keller, J.; Wanke, E.M.; Oremek, G.; Ackermann, H.; Groneberg, D.A. Standard reference values of the upper body posture in healthy middle-aged female adults in Germany. Sci. Rep. 2021, 11, 2359. [Google Scholar] [CrossRef] [PubMed]
  26. Ohlendorf, D.; Gerez, A.; Porsch, L.; Holzgreve, F.; Maltry, L.; Ackermann, H.; Groneberg, D.A. Standard reference values of the upper body posture in healthy male adults aged between 41 and 50 years in Germany. Sci. Rep. 2020, 10, 3823. [Google Scholar] [CrossRef] [PubMed]
  27. Ohlendorf, D.; Fisch, V.; Doerry, C.; Schamberger, S.; Oremek, G.; Ackermann, H.; Schulze, J. Standard reference values of the upper body posture in healthy young female adults in Germany: An observational study. BMJ Open 2018, 8, e022236. [Google Scholar] [CrossRef] [PubMed]
  28. Wolf, C.; Betz, U.; Huthwelker, J.; Konradi, J.; Westphal, R.S.; Cerpa, M.; Lenke, L.; Drees, P. Evaluation of 3D vertebral and pelvic position by surface topography in asymptomatic females: Presentation of normative reference data. J. Orthop. Surg. Res. 2021, 16, 703. [Google Scholar] [CrossRef]
  29. Lowe, B.D.; Dempsey, P.G.; Jones, E.M. Ergonomics assessment methods used by ergonomics professionals. Appl. Ergon. 2019, 81, 102882. [Google Scholar] [CrossRef]
  30. Roman-Liu, D. Comparison of concepts in easy-to-use methods for MSD risk assessment. Appl. Ergon. 2014, 45, 420–427. [Google Scholar] [CrossRef]
  31. Kee, D. Systematic comparison of OWAS, RULA, and REBA based on a literature review. Int. J. Environ. Res. Public Health 2022, 19, 595. [Google Scholar] [CrossRef]
  32. Maltry, L.; Holzgreve, F.; Maurer, C.; Wanke, E.; Ohlendorf, D. Improved ergonomic risk assessment through the combination of inertial sensors and observational methods exemplified by RULA. Zentralblatt Arbeitsmedizin Arbeitsschutz Ergon. 2020, 70, 236–239. [Google Scholar] [CrossRef]
  33. Charles, R.L.; Nixon, J. Measuring mental workload using physiological measures: A systematic review. Appl. Ergon. 2019, 74, 221–232. [Google Scholar] [CrossRef] [PubMed]
  34. Hellig, T.; Rick, V.; Mertens, A.; Nitsch, V.; Brandl, C. Investigation of observational methods assessing workload of static working postures based on surface electromyography. Work 2019, 62, 185–195. [Google Scholar] [CrossRef] [PubMed]
  35. Village, J.; Frazer, M.; Cohen, M.; Leyland, A.; Park, I.; Yassi, A. Electromyography as a measure of peak and cumulative workload in intermediate care and its relationship to musculoskeletal injury: An exploratory ergonomic study. Appl. Ergon. 2005, 36, 609–618. [Google Scholar] [CrossRef] [PubMed]
  36. Chander, H.; Burch, R.F.; Talegaonkar, P.; Saucier, D.; Luczak, T.; Ball, J.E.; Turner, A.; Kodithuwakku Arachchige, S.N.; Carroll, W.; Smith, B.K. Wearable stretch sensors for human movement monitoring and fall detection in ergonomics. Int. J. Environ. Res. Public Health 2020, 17, 3554. [Google Scholar] [CrossRef] [PubMed]
  37. Maurer-Grubinger, C.; Holzgreve, F.; Fraeulin, L.; Betz, W.; Erbe, C.; Brueggmann, D.; Wanke, E.M.; Nienhaus, A.; Groneberg, D.A.; Ohlendorf, D. Combining ergonomic risk assessment (RULA) with inertial motion capture technology in dentistry—Using the benefits from two worlds. Sensors 2021, 21, 4077. [Google Scholar] [CrossRef] [PubMed]
  38. McAtamney, L.; Corlett, E.N. RULA: A survey method for the investigation of work-related upper limb disorders. Appl. Ergon. 1993, 24, 91–99. [Google Scholar] [CrossRef]
  39. Lim, S.; D’Souza, C. A narrative review on contemporary and emerging uses of inertial sensing in occupational ergonomics. Int. J. Ind. Ergon. 2020, 76, 102937. [Google Scholar] [CrossRef]
  40. Brandl, C.; Bonin, D.; Mertens, A.; Wischniewski, S.; Schlick, C.M. Methodik zur Unterstützung des ergonomischen Interventionsprozesses am Beispiel einer automatisierten OWAS-basierten Generierung von Vorschlägen zur technischen Gestaltung von Arbeitsplätzen. In Arbeit in Komplexen Systemen. Digital, Vernetzt, Human?! Bericht zum 62. Arbeitswissenschaftlichen Kongress vom 2.–4. März 2016; RWTH Aachen University, Institut für Arbeitswissenschaft (IAW) Dortmund, GfA-Press: Aachen, Germany, 2016; ISBN 978-3-936804-20-1. Seiten 5, Projektnummer: F 2348. [Google Scholar]
  41. Crecan, C.M.; Peștean, C.P. Inertial Sensor Technologies—Their Role in Equine Gait Analysis, a Review. Sensors 2023, 23, 6301. [Google Scholar] [CrossRef]
  42. Teufl, W.; Lorenz, M.; Miezal, M.; Taetz, B.; Fröhlich, M.; Bleser, G. Towards inertial sensor based mobile gait analysis: Event-detection and spatio-temporal parameters. Sensors 2018, 19, 38. [Google Scholar] [CrossRef]
  43. Humadi, A.; Nazarahari, M.; Ahmad, R.; Rouhani, H. Instrumented ergonomic risk assessment using wearable inertial measurement units: Impact of joint angle convention. IEEE Access 2020, 9, 7293–7305. [Google Scholar] [CrossRef]
  44. Zhang, X.; Schall, M.C., Jr.; Chen, H.; Gallagher, S.; Davis, G.A.; Sesek, R. Manufacturing worker perceptions of using wearable inertial sensors for multiple work shifts. Appl. Ergon. 2022, 98, 103579. [Google Scholar] [CrossRef] [PubMed]
  45. Humadi, A.; Nazarahari, M.; Ahmad, R.; Rouhani, H. In-field instrumented ergonomic risk assessment: Inertial measurement units versus Kinect V2. Int. J. Ind. Ergon. 2021, 84, 103147. [Google Scholar] [CrossRef]
  46. Lobo, D.; Anuarbe, P.; López-Higuera, J.M.; Viera, J.; Castillo, N.; Megía, R. Estimation of surgeons’ ergonomic dynamics with a structured light system during endoscopic surgery. Int. Forum Allergy Rhinol. 2019, 9, 857–864. [Google Scholar] [CrossRef] [PubMed]
  47. Li, G.; Buckle, P. Current techniques for assessing physical exposure to work-related musculoskeletal risks, with emphasis on posture-based methods. Ergonomics 1999, 42, 674–695. [Google Scholar] [CrossRef] [PubMed]
  48. Ezzatvar, Y.; Calatayud, J.; Andersen, L.L.; Aiguadé, R.; Benítez, J.; Casaña, J. Professional experience, work setting, work posture and workload influence the risk for musculoskeletal pain among physical therapists: A cross-sectional study. Int. Arch. Occup. Environ. Health 2020, 93, 189–196. [Google Scholar] [CrossRef] [PubMed]
  49. Kreuzfeld, S.; Seibt, R.; Kumar, M.; Rieger, A.; Stoll, R. German version of the Cornell Musculoskeletal Discomfort Questionnaire (CMDQ): Translation and validation. J. Occup. Med. Toxicol. 2016, 11, 13. [Google Scholar] [CrossRef]
  50. Bandyopadhyay, S.; Bandyopadhyay, L.; Dasgupta, A.; Paul, B.; Roy, S.; Kumar, M. Quantification of Musculoskeletal Discomfort among Automobile Garage Workers: A Cross-sectional Analytical Study in Chetla, Kolkata, West Bengal. J. Clin. Diagn. Res. 2021, 15, 1. [Google Scholar] [CrossRef]
  51. Tischer, T.; Oye, S.; Wolf, A.; Feldhege, F.; Jacksteit, R.; Mittelmeier, W.; Bader, R.; Mau-Moeller, A. Measuring lower limb circumference and volume–introduction of a novel optical 3D volumetric measurement system. Biomed. Eng. Biomed. Technol. 2020, 65, 237–241. [Google Scholar] [CrossRef]
  52. Paul, S.M.; Chamberlin, A.P.; Hatt, C.; Nayak, A.V.; Danoff, J.V. Reliability, validity, and precision of an active stereophotogrammetry system for three-dimensional evaluation of the human torso. Med. Eng. Phys. 2009, 31, 1337–1342. [Google Scholar] [CrossRef]
  53. Allier, F.; Monnet, S. Mesure des flèches vertébrales par le télémètre laser. Évaluation de la fiabilité de la mesure de la flèche lombaire. Kinésithérapie Rev. 2013, 13, 41–46. [Google Scholar] [CrossRef]
  54. Roetenberg, D.; Luinge, H.; Slycke, P. Xsens MVN: Full 6DOF human motion tracking using miniature inertial sensors. Xsens Motion Technol. BV Technol. Rep 2009, 1, 1–7. [Google Scholar]
  55. Tognetti, A.; Lorussi, F.; Mura, G.D.; Carbonaro, N.; Pacelli, M.; Paradiso, R.; Rossi, D.D. New generation of wearable goniometers for motion capture systems. J. Neuroeng. Rehabil. 2014, 11, 56. [Google Scholar] [CrossRef] [PubMed]
  56. Picerno, P.; Cereatti, A.; Cappozzo, A. Joint kinematics estimate using wearable inertial and magnetic sensing modules. Gait Posture 2008, 28, 588–595. [Google Scholar] [CrossRef] [PubMed]
  57. Borg, G. Psychophysical scaling with applications in physical work and the perception of exertion. Scand. J. Work. Environ. Health 1990, 16, 55–58. [Google Scholar] [CrossRef]
  58. Waongenngarm, P.; van der Beek, A.J.; Janwantanakul, P.; Akkarakittichoke, N.; Coenen, P. Can the Borg CR-10 scale for neck and low back discomfort predict future neck and low back pain among high-risk office workers? Int. Arch. Occup. Environ. Health 2022, 95, 1881–1889. [Google Scholar] [CrossRef]
  59. Unfallversicherung, D.G. DGUV Grundsätze für Arbeitsmedizinische Vorsorgeuntersuchungen. 5. Vollst. neu Bearb. Aufl; Gentner: Stuttgart, Germany, 2010. [Google Scholar]
  60. Waskom, M.L. Seaborn: Statistical data visualization. J. Open Source Softw. 2021, 6, 3021. [Google Scholar] [CrossRef]
  61. Cohen, J. Statistical Power Analysis for the Behavioral Sciences; Routledge: New York, NY, USA, 1988; Volume 2, p. 567. [Google Scholar]
  62. Balogh, I.; Örbaek, P.; Ohlsson, K.; Nordander, C.; Unge, J.; Winkel, J.; Hansson, G.-Å.; Group, M.S.N.S. Self-assessed and directly measured occupational physical activities—Influence of musculoskeletal complaints, age and gender. Appl. Ergon. 2004, 35, 49–56. [Google Scholar] [CrossRef] [PubMed]
  63. Jakobsen, M.D.; Sundstrup, E.; Persson, R.; Andersen, C.H.; Andersen, L.L. Is Borg’s perceived exertion scale a useful indicator of muscular and cardiovascular load in blue-collar workers with lifting tasks? A cross-sectional workplace study. Eur. J. Appl. Physiol. 2014, 114, 425–434. [Google Scholar] [CrossRef]
  64. Koskelo, R.; Vuorikari, K.; Hänninen, O. Sitting and standing postures are corrected by adjustable furniture with lowered muscle tension in high-school students. Ergonomics 2007, 50, 1643–1656. [Google Scholar] [CrossRef]
  65. Rodrigues, M.S.A.; Leite, R.D.V.; Lelis, C.M.; Chaves, T.C. Differences in ergonomic and workstation factors between computer office workers with and without reported musculoskeletal pain. Work 2017, 57, 563–572. [Google Scholar] [CrossRef]
Figure 1. Experimental design and study procedure. CMDQ, Cornell Musculoskeletal Discomfort Questionnaire; IMUS, Inertial Measurement Units; MoCap, motion capture; RULA, Rapid Upper Limb Assessment.
Safety 10 00016 g001
Figure 2. Flow diagram showing the determination of the Cornell Musculoskeletal Discomfort score (CMDQ) (own visualization according to [50]).
Safety 10 00016 g002
Figure 3. Stereophotogrammetry using 3D light technology (left: application of light technology; right: automatically generated color graphic, representing the three-dimensional back contour and curvatures in the sagittal plane).
Safety 10 00016 g003
Figure 4. Motion capture (MoCap) during the working process.
Safety 10 00016 g004
Figure 5. Workflow for determining the final RULA score across the entire work process.
Safety 10 00016 g005
Figure 6. Violin plots of Borg CR-10 body map physical exertion levels in four different musculoskeletal discomfort (MD) subgroups. The violin shape is created by plotting a kernel density estimate of the data.
Safety 10 00016 g006
Figure 7. Violin plots representing the absolute 3D posture deviations from reference data of industry and office worker groups in the frontal plane (ST, shoulder tilt; PT, pelvic tilt) and transverse plane (SR, shoulder rotation; PR, pelvic rotation) in industry and office worker groups. 0 = no deviation from reference data; negative values = falling below the reference range; Positive values = exceeding the reference range.
Safety 10 00016 g007
Figure 8. Violin plots representing the absolute 3D posture deviations from reference data in the sagittal plane (KI, Kyphose index; FC, flèche cervicale; FL, flèche lombaire). 0 = no deviation from reference data; negative values = falling below the reference range; Positive values = exceeding the reference range.
Safety 10 00016 g008
Figure 9. Pearson correlation coefficients (r) between reference value-deviations of 3D upper-body posture parameters and RULA. KI, Kyphose index; FC, flèche cervicale; FL, flèche lombaire; RULA, Rapid Upper Limb Assessment.
Safety 10 00016 g009
Table 1. Anthropometric data of the sample (n = 64).
Age
(Years)
Height
(m)
Weight
(kg)
BMI
(kg/m2)
Job Experience (Years)
production
n = 49
male
n = 36
mean39.251.7682.8626.608.86
SD10.420.0713.003.688.65
min221.6360.3020.761.00
max611.88115.2041.4038.00
female
n = 13
mean48.921.6369.2326.0317.19
SD14.020.0513.484.7813.35
min251.5649.4019.141.50
max631.7393.0034.3835.00
office
n = 15
male
n = 8
mean40.131.8393.1327.777.69
SD6.660.1018.774.015.89
min301.6873.5020.011.00
max521.99132.0033.3318.00
female
n = 7
mean48.001.6974.7126.1119.86
SD13.520.0312.163.5115.76
min281.6457.4021.191.00
max621.7392.2030.8042.00
Disclaimer/Publisher’s Note: The statements, opinions and data contained in all publications are solely those of the individual author(s) and contributor(s) and not of MDPI and/or the editor(s). MDPI and/or the editor(s) disclaim responsibility for any injury to people or property resulting from any ideas, methods, instructions or products referred to in the content.

