Article

Assessing the Impact of 20 mph Speed Limits on Vehicle Speeds in Rural Areas: The Case of the Scottish Borders

1
Transport Research Institute, School of Computing, Engineering and Built Environment, Edinburgh Napier University, Edinburgh EH10 5DT, UK
2
Department of Transportation and Hydraulic Engineering, School of Rural & Surveying Engineering, Aristotle University of Thessaloniki, 54124 Thessaloniki, Greece
*
Author to whom correspondence should be addressed.
Safety 2023, 9(3), 66; https://doi.org/10.3390/safety9030066
Submission received: 2 July 2023 / Revised: 3 September 2023 / Accepted: 6 September 2023 / Published: 13 September 2023
(This article belongs to the Special Issue Human Factors in Road Safety and Mobility)

Abstract

:
This paper aims at delivering new empirical evidence as to the effectiveness of 20 mph speed limits in rural areas. For this purpose, speed and traffic data were drawn from the area of the Scottish Borders, UK, where the local Council led the rollout of a 20 mph speed limit trial in 97 villages and towns from October 2020. This intervention is considered as one of the first of its kind in the UK and overseas, as it was carried out on a large scale, in predominantly rural areas. To evaluate the impact of the 20 mph speed limit on vehicle speeds, we conducted a “before–after” quantitative analysis using traffic and speed data collected in different waves before and after the intervention. The descriptive analysis showed that both mean and 85th percentile speeds reduced directly after the introduction of the 20 mph speed limit (by 3.1 mph and 3.2 mph, respectively), and that such speed reductions were largely maintained even up to eight months after the onset of the intervention. The largest speed reductions were observed in locations with high-speed patterns before the intervention, and especially in those having mean speeds greater than 25 mph before the intervention. Both non-parametric and parametric statistical tests, which were conducted using approximately five million speed observations, showed that the observed speed changes were statistically significant for the vast majority of cases. Linear regression models were also estimated confirming the significant impact of the 20 mph limit on vehicle speeds, while controlling for the influence of traffic volume. Overall, the findings of this study will likely assist in filling an evidence gap regarding the effectiveness of 20 mph speed limits in rural settlements. They can also provide encouragement to those local authorities in the UK and abroad that are currently actively examining the possibility of setting the 20 mph as the default limit in built-up areas.

1. Introduction

1.1. Background, Aim and Contributions of the Study

Vehicle speeds have been widely acknowledged as one of the key factors that determine road safety globally. In fact, speed is a fundamental aspect of the Safe Systems Approach (SSA), which constitutes the guiding policy paradigm for road safety in many countries across the globe. The goal of the SSA is to deliver road traffic systems free from human losses, and apart from the speed, road users, infrastructure, vehicles and post-crash care also constitute major aspects of this holistic approach to road safety [1].
High speeds have been linked with higher frequencies of road collisions and with more severe casualties or fatalities [2,3,4,5]. Interestingly, based on the statistics published by the UK Department for Transport [6], five percent (5%) of total collisions and fifteen percent (15%) of total fatal collisions constitute the consequence of the violation of the speed limit by the drivers. To address the consequences of unsafe speeds on road safety, various traffic calming measures have been designed and implemented by local authorities or transport agencies. Over recent decades, the introduction of the 20 mph speed limit (approximately 30 kmph) has proven an effective measure for reducing the frequencies of collisions and KSI (killed or seriously injured) casualties [7] and assuaging the public health concerns arising from the presence of excessive speeds, especially in urban populations [8]. 20 mph speed limits have been primarily implemented in urban areas in the UK and overseas, whereas evidence on the implementation of 20 mph speed limits in rural areas is limited to date.
The 20 mph speed limit is a popular speed management intervention, the overarching aim of which is not only restricted to speed reduction but also focuses on the enhancement of road safety, the reduction in the frequency and severity of collisions, and the overall improvement of public safety perception [9]. Several studies have been carried out in the past to evaluate several aspects of 20 mph interventions in urban areas including the economic cost and benefits of 20 mph [8]; the effect of 20 mph interventions on public health and health inequalities [9,10]; the cost-effectiveness of 20 mph zones [11]; and public support and compliance [12].
Even though the evidence about the strengths and weaknesses of 20 mph interventions in urban areas is significant, similar research work about interventions in rural areas is largely missing in the literature, thus leading to a quite limited state of knowledge. The present study seeks to fill the evidence gap on the effectiveness of the 20 mph speed limit in primarily rural areas by investigating the impact of a 20 mph intervention on vehicle speeds. Specifically, the objective of this study is to provide empirical evidence about the effectiveness of the 20 mph trial in the area of the Scottish Borders in Scotland, UK. The successful implementation of the 20 mph speed limit is expected to offer safety and health benefits, such as reductions in the frequency and severity of collisions and enhancement of the overall well-being of the local residents.

1.2. Previous Research on the Effectiveness of Lower Speed Limits

This section provides a concise overview of the multi-level impact of lower speed limits on the areas where they are implemented. This multi-level impact goes beyond traffic speeds, which constitutes the natural area of impact of a new speed limit, and may include the health outcomes and subjective well-being of residents in the settlements where the lower speed limits have been implemented. Even though this study focuses on the impact of the 20 mph limit on vehicle speeds in rural areas, it is important to acknowledge all these dimensions that have led to the characterisation of the 20 mph intervention as a “public health intervention” [13].

1.2.1. Lower Speed Limits and Vehicle Speeds

A number of studies have showcased the potential of lower speed limits to evidently reduce vehicle speeds, especially in urban and suburban areas. Specifically, Hu and Cicchino [14] evaluated the impact of a speed limit reduction from 30 mph to 25 mph in Boston, USA. The study was based on vehicle speed data collected at selected sites where speed limits were reduced, and some control sites in a different area where the speed limits were not adjusted before and after the intervention. Both log-linear regression and logistic models were leveraged for the estimation of vehicle speed changes and the odds of vehicles exceeding some speed thresholds. The analysis demonstrated that the observed mean speed reductions, due to the speed limit change, were statistically significant. The study argued that the present practice of predicating the speed limits on the 85th percentile free-flow speeds without considering any other roadway attributes has always been a challenge for a range of local communities that expect a downshift in the speed limits.
In an effort to robustly quantify the impact of lower limits on prevailing speeding patterns, Heydari et al. [15] presented a methodology for the identification of the effects of a 40 km/h (25 mph) speed limit on speeding behaviour in local streets in Montreal, which previously had a 50 km/h speed limit. A full Bayes before–after method was used for the analysis of the speed data. The study showed that the transition from 50 km/h to 40 km/h was effective in terms of overall speed, but its effectiveness in terms of excessive speeding was insignificant, which poses a potential alert for future speed limit interventions aiming not only to reduce the overall speed metrics but also to tackle exceeding speed patterns that are directly associated with severe collisions [16,17].

1.2.2. 20 mph Speed Limit, Public Health and Well-Being

Apart from vehicle speeds, the lower speed limits have been found to affect several health aspects where they are applied, including road casualties, severe collisions, physical activity and well-being. Interestingly, Cleland et al. [9] investigated the effect of 20 mph speed zones and limits on health outcomes to determine the likely difference in the effectiveness of 20 mph zones and 20 mph speed limit interventions. The study was based on the identification of the literature of about three and a half decades (1983–2019), which was subsequently reviewed and analysed. The study showed that 20 mph zones are linked to a reduced frequency of collisions and casualties’ severity, whereas weak evidence was identified as to the effectiveness of 20 mph zones in reducing air pollution. Indirect effects of 20 mph zones on promoting physical activity and liveability were acknowledged, with this aspect requiring further investigation to establish the extent of such effects. In contrast, no significant links were identified between the 20 mph speed limits and any public health outcome. The study also highlighted the need for more rigorous evaluations to draw sound inferences in the future about the impact of 20 mph limits on public health outcomes. In a similar context, Cairns et al. [10] carried out an umbrella review to identify the impacts of 20 mph zones and limits on health and socio-economic status (SES) inequalities in health, with the emphasis on adults and children. The study included five systematic reviews delivering robust evidence that the 20 mph speed zones comprise effective measures in reducing collision frequency, injury severities, and traffic speed and volume, and in improving the level of perceived safety. However, no robust association was identified between the 20 mph schemes and the prevalence of SES inequalities.
Jones and Brunt [18] investigated whether 20 mph speed limits have positive effects on public health by reducing injury severities and collision frequency and improving the quality of air and the overall urban well-being through the promotion of active travel. The study estimated, through extensive modelling, the impact of a possible shift to a 20 mph limit of all 30 mph roads in Wales on the reduction in casualties, the financial savings relating to the collision prevention and shifts in death numbers attributed to major air pollutants. Finally, the interrelationship among road traffic injuries, air pollution and obesity was highlighted, but questioning, at the same time, the potential of the 20 mph limit to tackle the public health issues arising from this interrelationship.

1.2.3. Implementation of the 20 mph Speed Limit in Urban Areas

The United Kingdom is one of the countries across the globe that has been actively pursuing the establishment of 20 mph speed limits over the last 20 years, especially in urban settings. In 2012, the City of Bristol in England began a city-wide rollout of 20 mph speed limits, which was implemented in several steps. To evaluate the intervention in terms of safety impacts, Bornioli et al. compared injury counts before and after the introduction of the 20 mph speed limit while controlling for different years and areas. The analysis highlighted a general reduction in injuries, providing evidence of a city-level reduction in fatalities of 63% [19]. The city-level reduction in fatal injuries identified in that study should be set against national trends, which show that the number of deaths on built-up roads has increased from the 2010–2014 annual average of 585 to a 2017 figure of 607 deaths. This suggests that city-wide 20 mph speed limits could be an effective strategy for reducing injuries, as they encourage slower speeds to be driven. Recently, in the city of Edinburgh in Scotland, the implementation of an (almost) city-wide 20 mph speed limit, which covered sixty-six streets that were previously 30 mph streets, was evaluated by Nightingale and Jepson [20]. Based on this evaluation, the 20 mph streets recorded a statistically significant decrease in average vehicle speeds. A conclusion was that in the post-implementation period, a reduction in the number of drivers travelling above 20 mph, as measured by the number of drivers exceeding 24 mph and 30 mph [20], was identified, and that this was evidence of the effectiveness of the 20 mph speed limit intervention in the city of Edinburgh. The final paper from this study concluded by reporting that 20 mph speed limits can serve as an effective public health intervention [13].

1.2.4. 20 mph Speed Limit in Rural Areas and Evidence Gap

Overall, the literature review showed that the impact of lower speed limits, and particularly of the 20 mph speed limit, is mainly documented for urban and suburban areas. However, in rural areas, which are typically associated with higher crash fatality rates compared to urban areas [21], the effectiveness of 20 mph speed limits has not been thoroughly explored to date. According to recent statistics from the Department for Transport, significantly higher vehicle speeds are observed on rural roads of the UK compared to urban roads [22], which substantiates the reason why speed management constitutes a high priority of local communities and authorities in rural areas. As such, this study aims to provide evidence as to whether setting the speed limit to 20 mph is an effective strategy to lower vehicle speeds in predominantly rural areas.

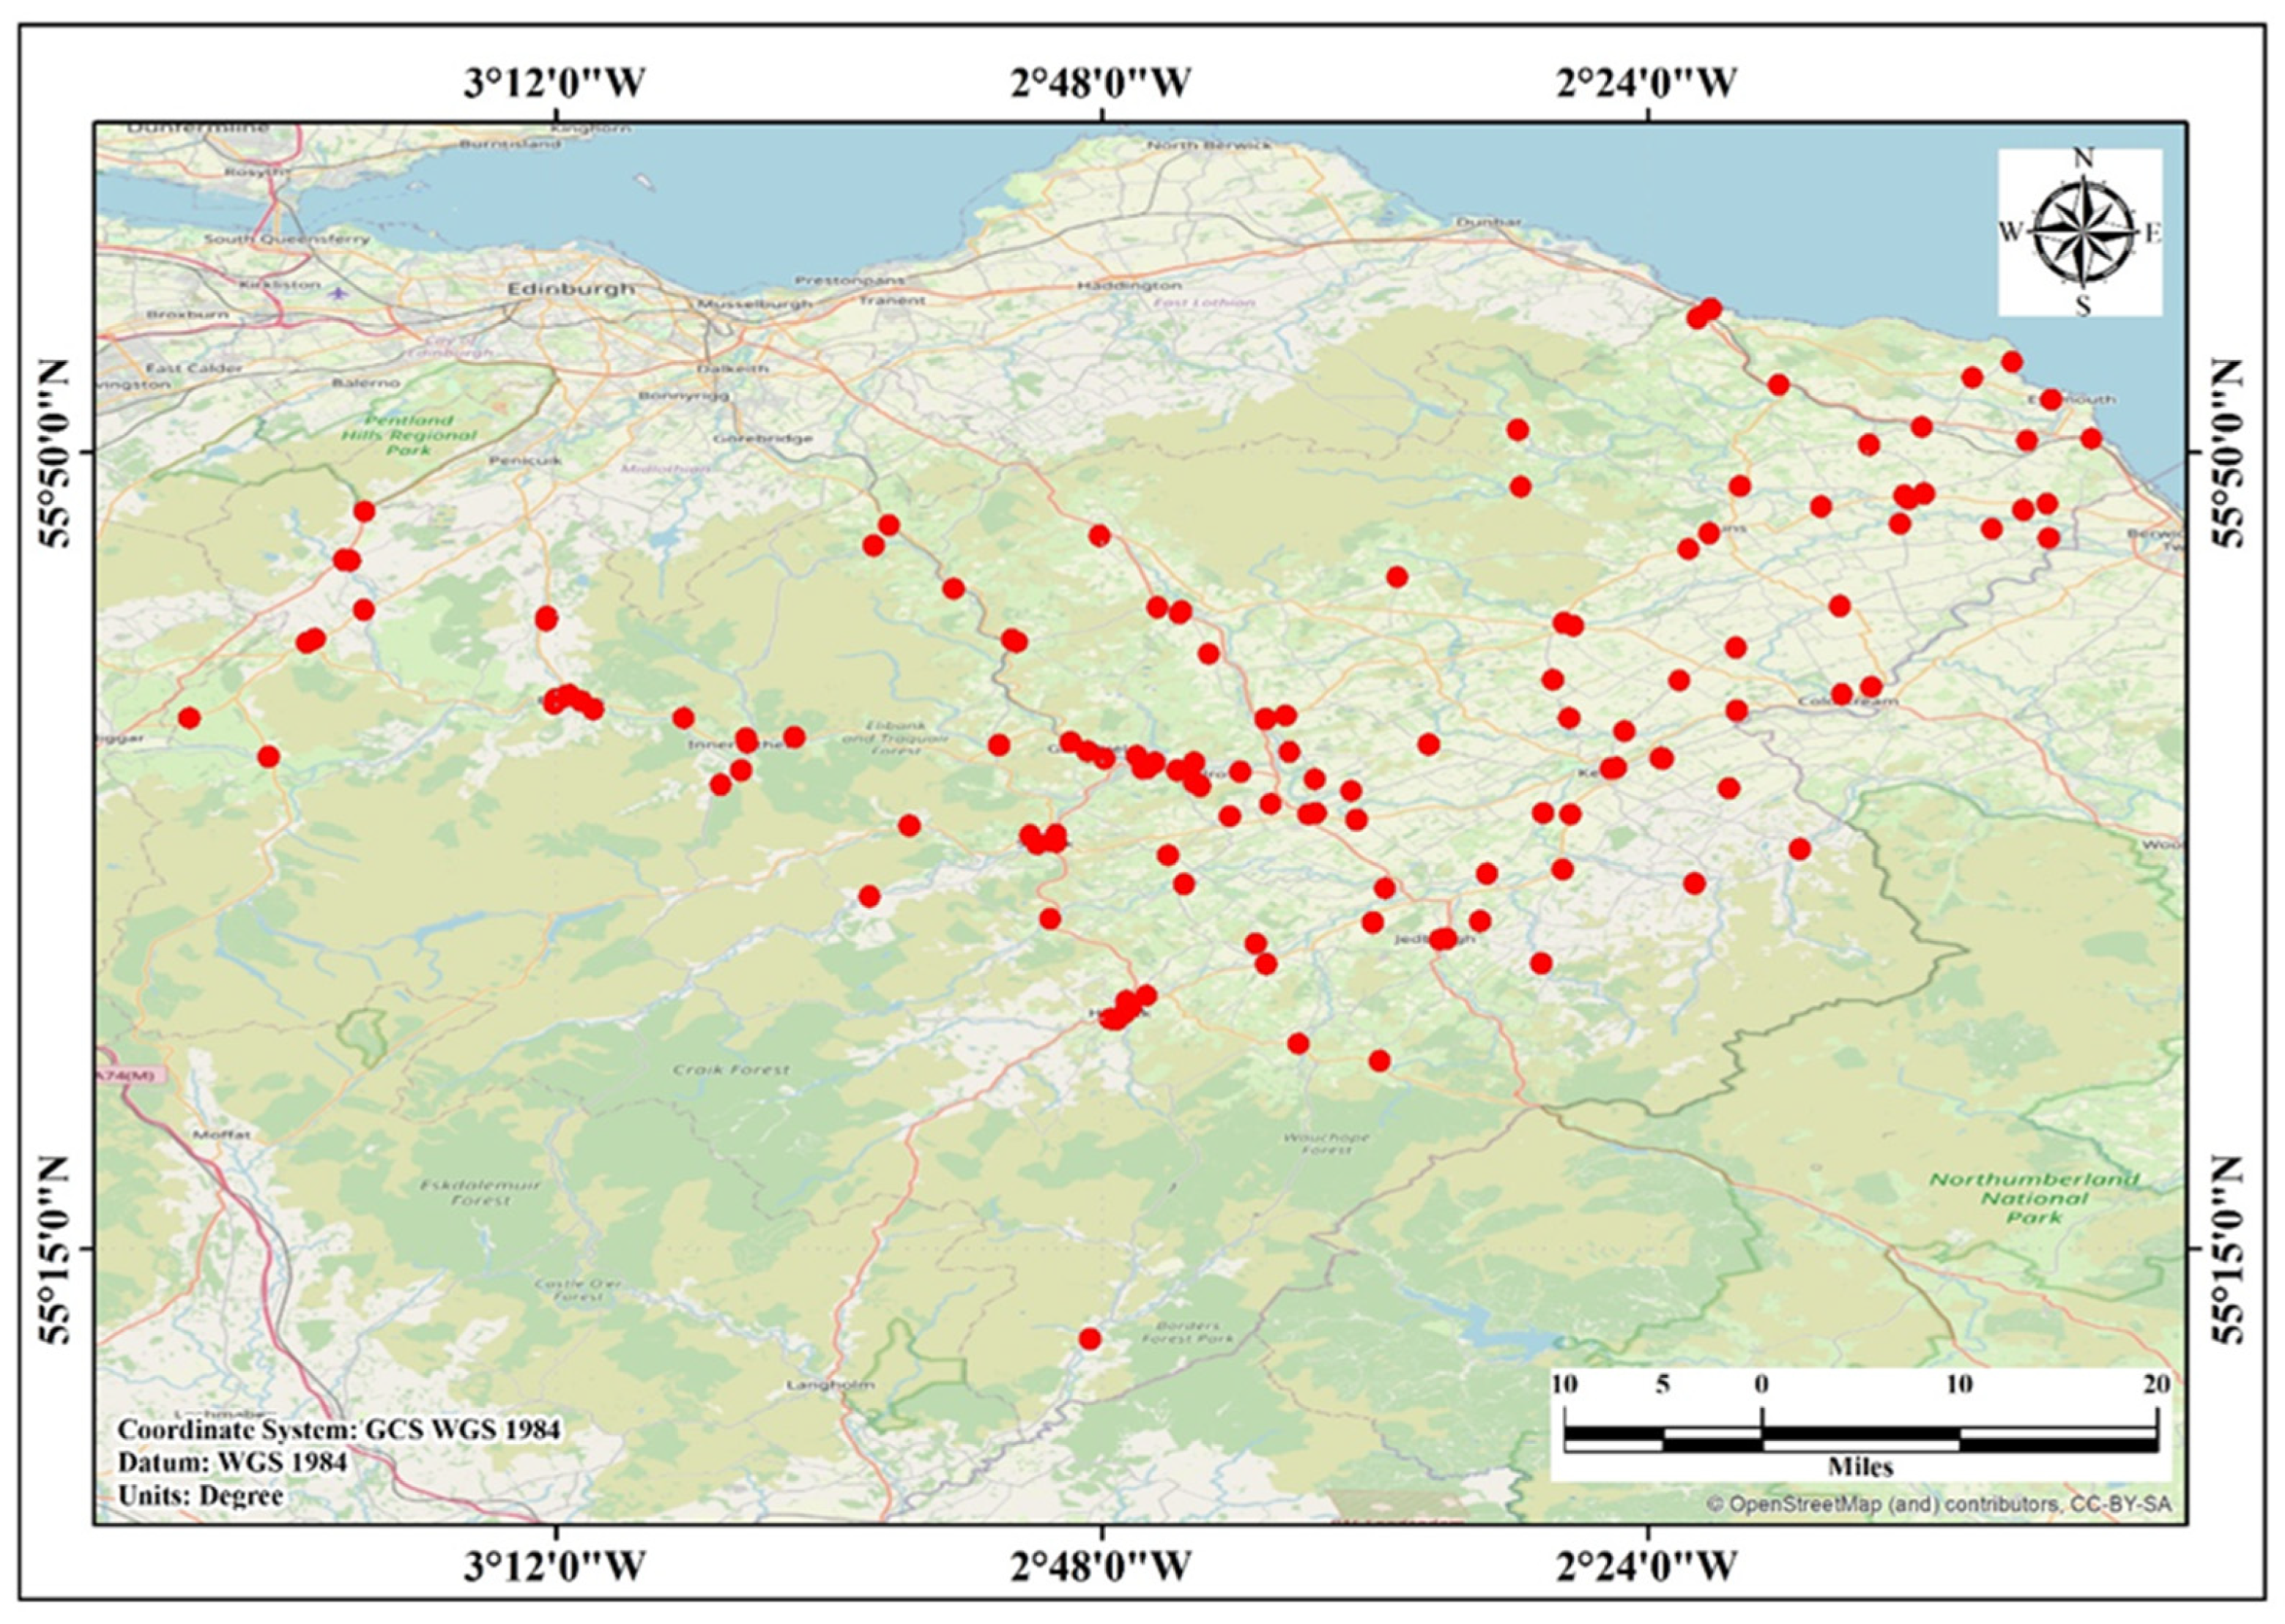
2. Materials and Methods

2.1. Overview of the Intervention and Evaluation Process

The council area of Scottish Borders, where the 20 mph intervention was implemented, is located in the eastern part of the Southern Uplands of Scotland and constitutes a largely rural area with the majority of settlements having populations significantly less than 5000. Overall, the Scottish Borders are spread over a large geographical area of 1827 square miles (4732 km2), thus comprising the 6th largest council area in Scotland in terms of area size. Due to the extent of the land mass of the Scottish Borders, the population density is quite low (around 63 persons per square mile), which highlights the rural nature of the area.
The 20 mph speed limit intervention was implemented in 97 settlements in the Scottish Borders, which all previously had a 30 mph speed limit. Due to the number of settlements where the speed limit changed, this trial constitutes one of the most unique, large-scale 20 mph speed limit schemes not only in the UK but also across the globe. The 20 mph scheme was initially implemented as a signing-only intervention, and it started in October 2020; by December 2020, the 20 mph speed limit had been established in all applicable settlements. In other words, the 20 mph signing was fully in place. In later stages of the intervention, additional signs were installed in some settlements, such as speed limit repeater and terminal signs and lane markings. Vehicle-activated signs (VASs) were also later installed in some of the settlements to increase the awareness of drivers about the newly introduced speed limit. The speed limit and a warning message were displayed on the VAS as a reminder to the driver to adhere to the 20 mph limit.
The geographical distribution of the settlements where the 20 mph intervention took place is illustrated in the following map (Figure 1); these settlements are located across five local areas: Tweeddale, Cheviot, Teviot and Liddesdale, Eildon and Berwickshire.
As to the evaluation of the intervention, a quantitative approach was used to identify the changes in various aspects of speed, as a potential outcome of the 20 mph speed limit. Specifically, a “before–after” analysis was conducted, using speed data before and after the introduction of the 20 mph speed limit. Traffic and speed data were drawn from 156 sites, which were located in the 97 settlements where the intervention took place. The data used for the evaluation of the intervention were collected through four separate survey waves, which comprised a pre-intervention survey (Survey 1) and three post-intervention surveys (Surveys 2, 3 and 4), as follows:
  • Survey 1: carried out before the introduction of the 20 mph speed limit, i.e., between August and September 2020 (also referred to as “before”).
  • Survey 2: carried out immediately after (4 or 5 weeks for most of the sites) the establishment of the 20 mph speed limit (also referred to as “After I”).
  • Survey 3: carried out several months (5 to 6 months for most of the sites) after the establishment of the 20 mph speed limit (also referred to as “After II”).
  • Survey 4: carried out several months (7 to 8 months for most of the sites) after the establishment of the 20 mph speed limit (also referred to as “After III”).
The goal of Survey 1 (pre-intervention survey wave) was to capture the pre-intervention state of speeds (when the posted speed limit was 30 mph), thus serving as a baseline measurement for comparison with the post-intervention survey waves. Survey 2 was intended to capture the post-intervention state of speeds in the short term, right after the beginning of the trial when all the 20 mph signs had been mounted, whereas Survey 3 and Survey 4 were intended to capture the post-intervention speeds at longer periods after the onset of the intervention. Overall, the survey waves were conducted with 3-to-4-month intervals.
The selection of sites included in the intervention and evaluation process was made by the Scottish Borders’ Council considering several criteria, such as traffic volumes, prevailing speeds with the previous limit (30 mph speed limit) and built environment characteristics of the settlements (e.g., balanced consideration of sites with urban and rural characteristics, with an emphasis on rural sites that constitute the majority of settlements in the area), as well as local feedback from communities as to excessive speed patterns. In Surveys 1 and 2, traffic and speed data were collected for almost all sites where the 20 mph limit was in place. Survey 3 was an intermediate survey wave, which was mostly conducted for trial monitoring purposes and did not take place across all settlements of the intervention. As such, data from Survey 3 were available only for a subset of sites among those included in Surveys 1 and 2. Survey 4 contained information from the vast majority of sites included in Surveys 1 and 2. As such, the analysis of this paper mainly provides comparisons for sites where repeated measurements (“before–after”) of speeds were available across Survey waves 1, 2 and 4.

2.2. Data Collection and Processing

Traffic surveys were carried out by the technology company TRACSIS. During these, speed and traffic data were collected using Automatic Traffic Counters (ATC), which were deployed at preselected locations. Individual speed data and other related traffic information, which included traffic volume counts and traffic composition per vehicle type, were collected through these surveys. Information about the temporal characteristics (such as day of the week, time of the day) of traffic and vehicle speeds was also provided. The surveys ran throughout the entire day (24 h per day) for an undistorted seven-day period across all selected sites. In total, more than five million individual speed observations were collected, processed and used for the evaluation of the effectiveness of the 20 mph intervention.
The individual vehicle speeds, collected through the traffic surveys, were stored in an SQL database and were subsequently processed for the investigation of speed differences before and after the 20 mph intervention. Considering the inherent complexities of the data, mainly in terms of size, dimensionality and the extent of variables in the records, the dataset could not be managed manually or using a conventional approach so that the integrity of the speed and traffic observations could be preserved. Therefore, the dataset was processed and managed using a Big Data framework based on MySQL Workbench 8.0 CE and Python 3.9; specifically, these tools were leveraged for the integration of all the disparate information into a unified database, which was afterwards made ready for suitable descriptive and statistical analyses. In all, such an integration of data enabled the joint use of individual vehicle speed observations and aggregate speed metrics (such as mean speed, 85th percentile speed) for the evaluation of the 20 mph intervention across all sites.

2.3. Speed Metrics

To understand the variations in different dimensions of speed because of the implementation of the 20 mph speed limit, the following speed metrics were examined: the mean (or average) speed, 85th percentile speed, standard deviation of speed and proportions of vehicles exceeding the speed limit as well as other speeding thresholds. These speed metrics were drawn from traffic surveys and were rigorously analysed based on the standard practice and analytical and statistical methods that have been employed in previous research relating to the evaluation of speed and traffic calming interventions [23,24,25,26,27].
Specifically, the mean speed metric has been extensively used in the UK for the evaluation of 20 mph intervention schemes [26,28]. The 85th percentile speed reflects the speed at or below which 85 percent of vehicles travel provided that prevailing traffic or weather conditions do not affect the travel speed. It represents the speed value that is considered rational for the given road environment by the majority of drivers. The standard deviation of speed indicates the extent to which the observed vehicle speed is different from the mean speed, thus providing a tangible measure of speed variability. Standard deviations with higher values show a higher spread of individual vehicle speeds around the mean value, thus a less consistent speed behaviour, while standard deviations with lower values indicate a lower spread of the individual speeds around the mean speed, therefore reflecting a greater consistency of speed patterns.
To elicit evidence about the overall compliance of drivers with the speed limit and their speed behaviour, we calculated several proportions of vehicles benchmarked against predefined speed thresholds. Specifically, we started with the percentage of vehicles exceeding the posted speed limit (PSL), which indicates the proportion of vehicles that are typically regarded as speeding vehicles [16,17]. To identify the extent of more severe speeding behaviours, the following two thresholds were also used for the calculation of the proportions of vehicles with exceeding speeds:
(i)
An enforcement-based threshold that was set in the past by the former Association of Chief Police Officers (ACPO) in the UK (currently the National Police Chiefs’ Council—NPCC) as a typical tolerance for speed enforcement. This threshold is defined as the speed limit increased by 10% plus 2 mph (i.e., 1.1 × speed limit + 2 mph). For instance, on 20 mph speed limit roads, this speed threshold stands at 24 mph. Such a speed metric can provide useful insights into the extent of drivers’ compliance and observed speeding patterns after the onset of a 20 mph speed limit intervention. This speed value is hereafter referred to as the “ACPO threshold”.
(ii)
An excessive speeding threshold, which was suggested by the Department for Transport (DfT) in the UK; this is equal to the speed limit plus 15 mph. For instance, on a road with a 20 mph speed limit, the DfT threshold is equal to 35 mph. This threshold serves as a key metric in official reports and intends to capture the extent of extreme violations of the speed limit. This speed value is hereafter referred to as the “DfT threshold”.

2.4. Statistical Analysis

Descriptive statistics, inferential analyses and linear regression modelling of speed data were carried out to comprehensively evaluate the effectiveness of the 20 mph intervention. The descriptive statistics that were computed include: percentages, frequencies, mean values, percentiles, standard deviations, minimum/maximum values and cross-tabulations across different survey waves.
Further inferential statistics were conducted to identify statistically significant differences in speed metrics before and after the introduction of the 20 mph intervention across all sites. Specifically, parametric tests (Student’s t-tests) and non-parametric tests (Wilcoxon signed-rank tests) were carried out. The use of such tests is in tandem with previous research and practice in the evaluation of speed data [23,24,29] and enables a possible triangulation of statistical evidence about the impact of the 20 mph limit on vehicle speeds. To conduct the t-tests, we used the individual vehicle speed data collected through the traffic surveys. The goal of statistical tests is to compare speed measurements from the same sites before and after the 20 mph intervention; hence, paired t-tests were performed. The sample size of the individual speed data for each site is very large (as shown in Table A1 in the Appendix A), so the sampling distribution can be considered as normal, according to the central limit theorem [30]. Similarly, the Wilcoxon signed-rank test is a non-parametric test, which was used to ascertain whether there are statistically significant differences in the distribution of sites per speed range across different survey waves.
To identify the potential impact of traffic volume fluctuations on vehicle speeds across the survey waves, controlling at the same time for the impact of the 20 mph limit and other—potentially influential—factors (e.g., COVID-19 restrictions, area type), a linear regression analysis was also conducted. To that end, an ordinary least squares approach was employed, in line with previous research and practice [31]. The linear regression model is formulated as follows:
Y = α + β Χ + ε
where Y denotes the dependent variable of interest, which varies as a function of an intercept term α and a vector of explanatory variables X. The direction and magnitude of the impact of X on Y is determined through the coefficient vector β, whereas ε represents an error term.

3. Results and Discussion

The results of the analysis of the traffic speed and volume data for the different waves of surveys are presented in this section.

3.1. Before–after Analysis of Mean and 85th Percentile Speeds

Table 1 and Table 2 provide insights into the changes in key speed metrics, which were observed across various survey waves before and after the 20 mph intervention. Specifically, the Tables provide descriptive statistics (i.e., minimum, maximum, average, and standard deviation) of the mean and 85th percentile speed for sites where the speed limit switched from 30 mph to 20 mph. In total, speed data for 109 sites were commonly available across Survey 1, Survey 2 and Survey 4.
The speed differences presented in these Tables overall suggest that speed reduced post-intervention in almost all sites. As shown in Table 1, the mean speed of vehicles across all survey sites was greater than 25 mph before the 20 mph intervention (Survey 1). In Survey 2, which was conducted just a few weeks after the introduction of the 20 mph limit, the mean speed reduced by 3.1 mph, with its value being slightly over 22 mph. During the same period, the standard deviation of the mean speed decreased by 1.55 mph, thus suggesting potentially more homogeneous speed patterns in locations where the 20 mph speed limit was implemented. Similarly, during the same period, we noticed an overall decrease in the 85th percentile speed by approximately 3.2 mph on average. More evidence about more homogeneous speed patterns after the introduction of the 20 mph limit was provided by the standard deviation of the 85th percentile speed in Survey 2, which was found to have reduced by 1.14 mph. In a period seven to eight months after the beginning of the trial (i.e., when Survey 4 was carried out), the reductions in mean and 85th percentile speeds were found to be largely maintained. In fact, during that period, the mean speed remained close to 22 mph and lower by 2.7 mph (approx.) compared to the mean speed before the intervention. Similarly, the 85th percentile speed in Survey 4 was found to be lower by 2.6 mph (approx.) compared to its counterpart before the intervention (Survey 1). The standard deviations of the mean and 85th percentile speeds were also found to be lower than their respective pre-intervention values.
To better understand how the speed metrics varied after the introduction of the 20 mph limit using the pre-intervention mean speeds as a reference basis, we distinguish and discuss two groups of sites, for which we further evaluated their “before–after” speed differences; the main criterion for this distinction was whether the mean speed of each studied location was greater or smaller than 20 mph before the intervention.

3.1.1. Group 1: Sites with Mean Speed Less Than or Equal to 20 mph “Before”

As shown in Table 2, 20 sites (out of the 109 sites with available data across the three survey waves) had mean speeds lower or equal to 20 mph. The results indicate minor speed differences before and after the 20 mph trial. The mean and 85th percentile speeds for these sites saw marginal reductions (less than one mph) in Survey 2 and Survey 4. These results suggest that for areas with already low speed patterns, the reduction in the speed limit does not induce significant changes in vehicle speeds.

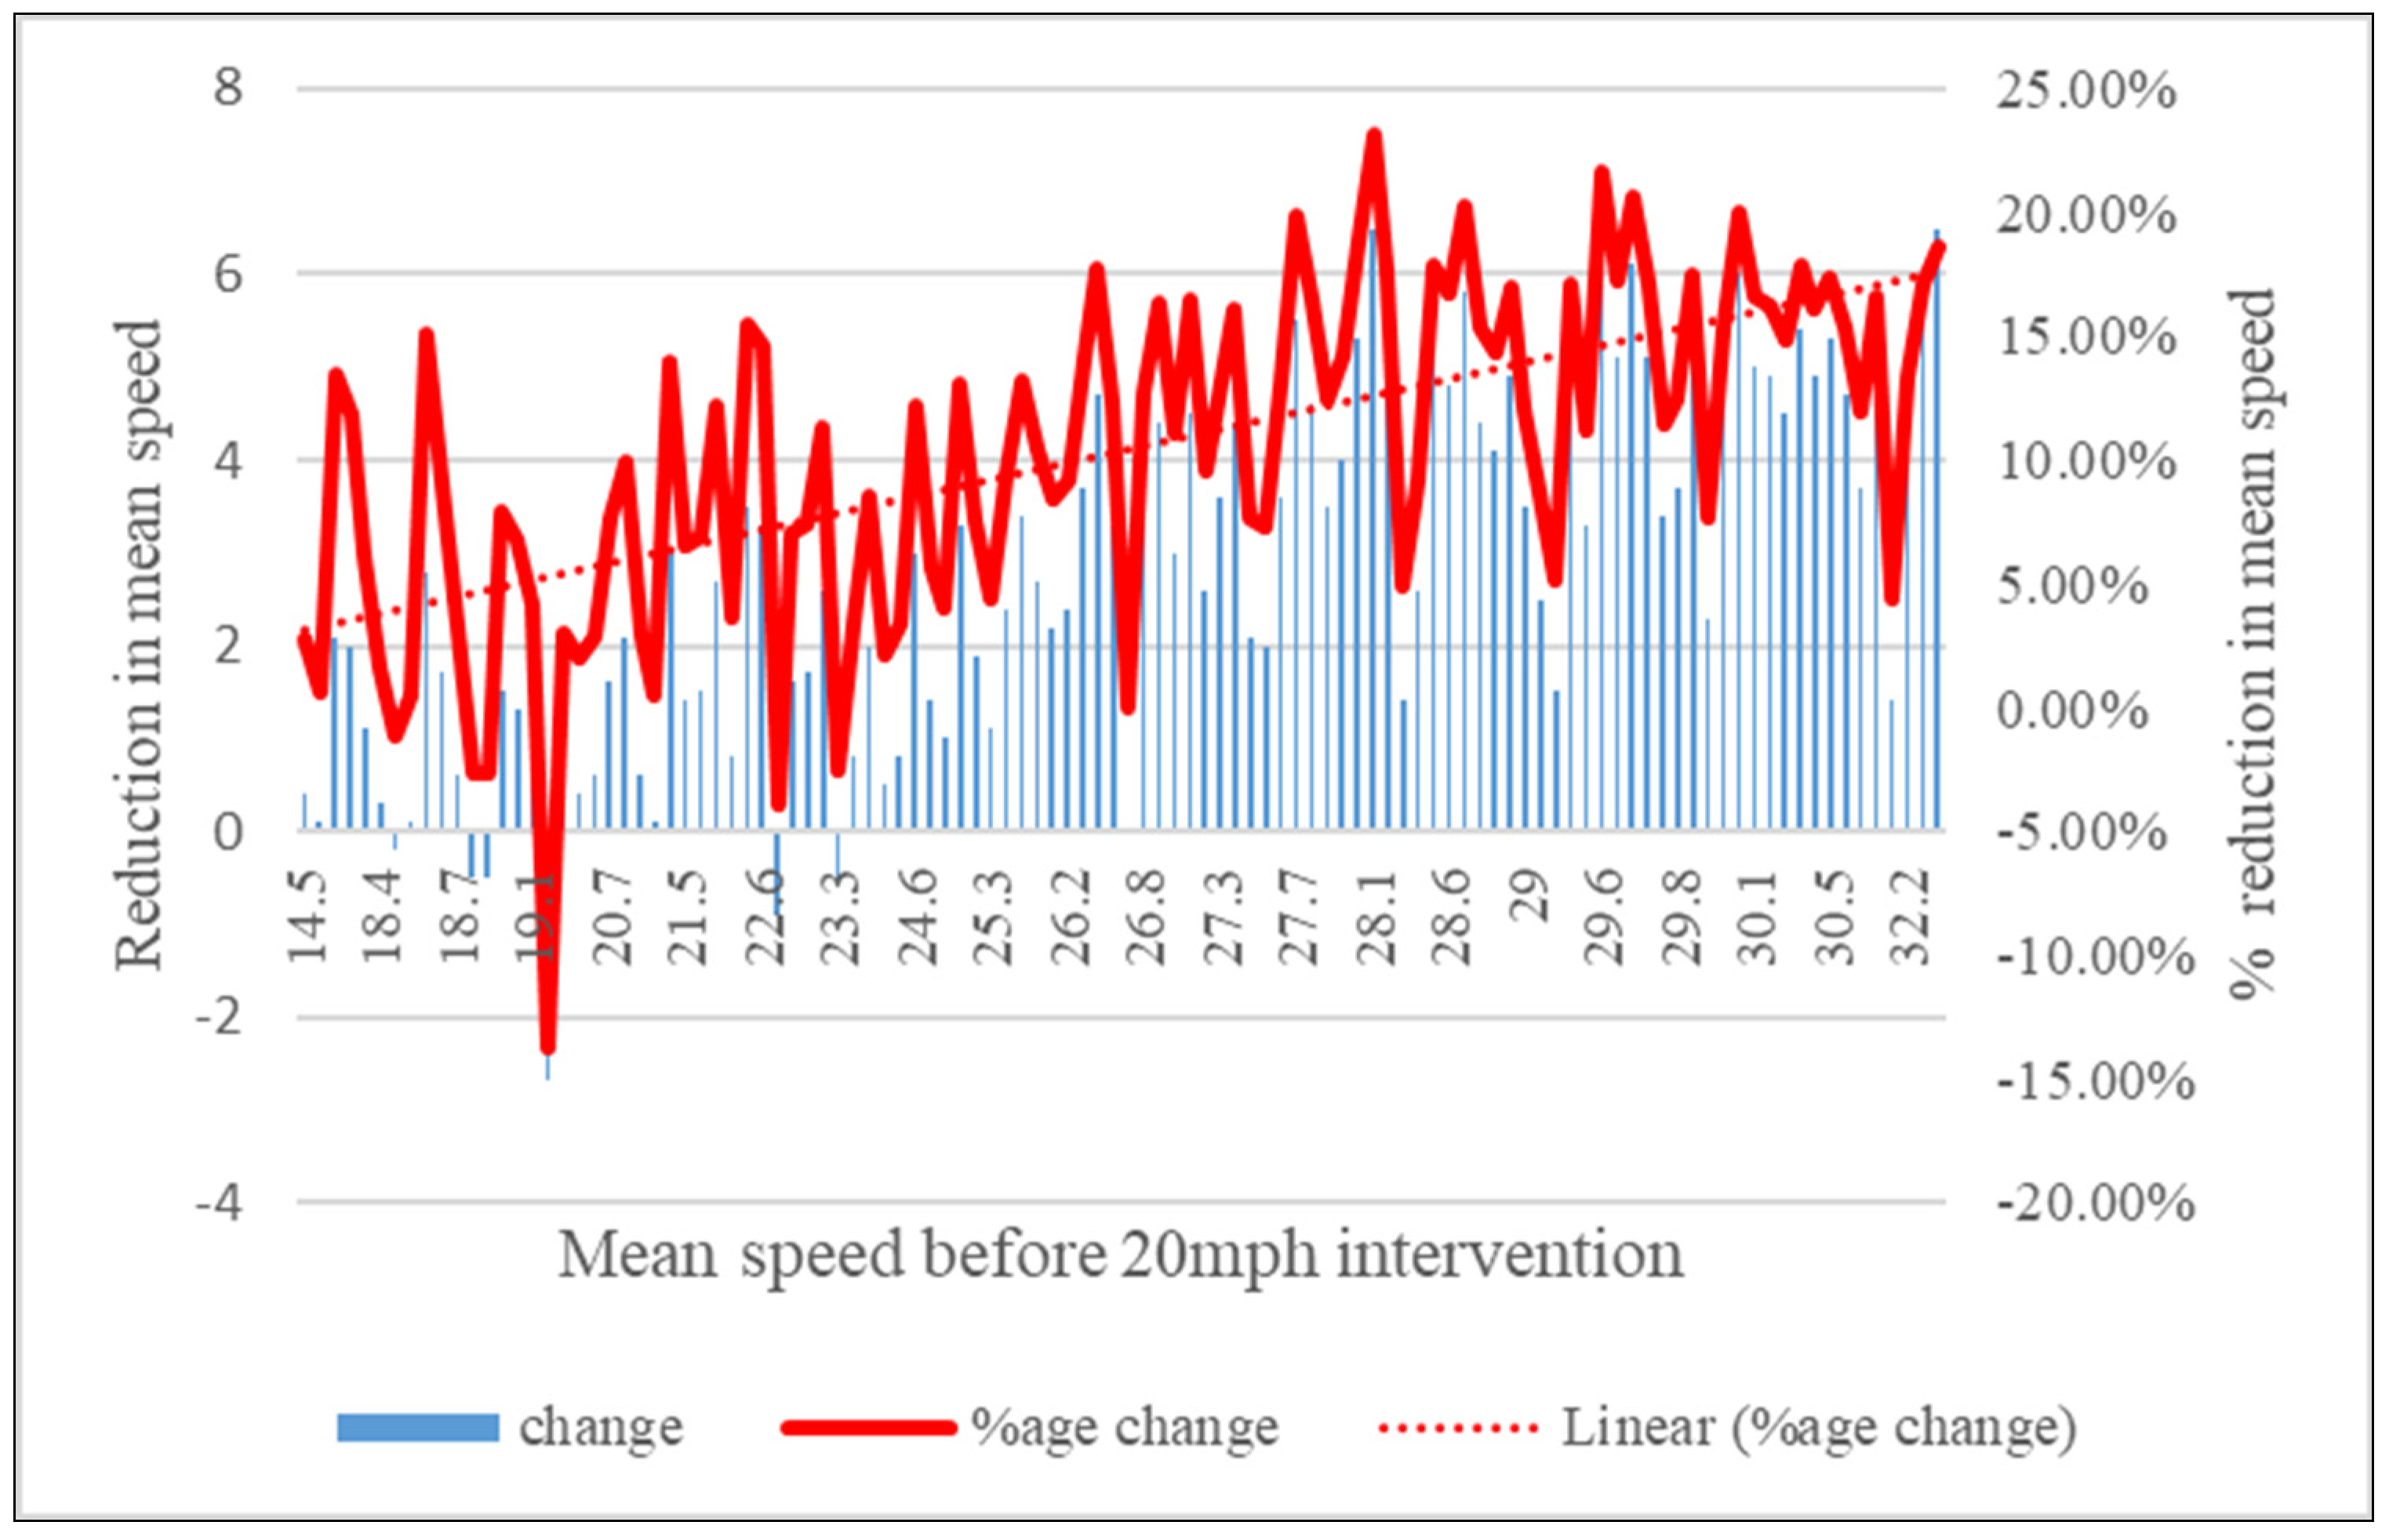
3.1.2. Group 2: Sites with Mean Speed Greater Than 20 mph “Before”

Locations with mean speeds greater than 20 mph before the trial were further classified in subgroups considering three speed ranges (they are hereafter referred to as “bands”), which were defined on the basis of 5-mph increments: (i) locations with a mean speed greater than 20 mph but lower or equal to 25 mph “before”; (ii) locations with a mean speed greater than 25 mph but lower or equal to 30 mph “before”; and (iii) locations with a mean speed greater than 30 mph but lower than 35 mph “before”. It should be noted that among the locations with available speed data before and after the intervention, the highest observed mean speed before the 20 mph intervention was lower than 35 mph.
The results (as shown in Table 2) reveal speed reductions for all speed ranges after the introduction of the 20 mph speed limit. Such reductions were identified for both mean and 85th percentile speeds, and for both Survey 2 and Survey 4. The most pronounced speed reductions were observed at sites with high-speed patterns “before”, and particularly with mean speeds belonging in the band >25–30 mph (the average speed reduction in Survey 4 compared to Survey 1 is 3.77 mph) and in the band >30–35 mph (the average speed reduction in Survey 4 compared to Survey 1 is 4.72 mph). A similar trend is also identified while examining the differences in the 85th percentile speed between Survey 1, Survey 2 and Survey 4, as shown in Table 2; the most notable reductions were observed at sites that had mean speeds “before” in the bands >25–30 mph and >30–35 mph.
Milder reductions were observed for sites with “before” mean speeds falling into the band of >20–25 mph across all survey waves. Interestingly, in Survey 4, mean speeds reduced by 1.46 mph on average compared to Survey 1, whereas 85th percentile speeds reduced by 1.94 mph on average. Marginal variations were identified when comparing mean and 85th percentile speeds between the two post-interventions surveys (i.e., Survey 2 and Survey 4). Specifically, in Survey 4, both speed metrics slightly increased for the bands >25–30 mph and >30–35 mph, but such increases were lower than 0.6 mph.
To provide more granular insights into the observed speed variations benchmarked against the pre-intervention speeds, Figure 2 offers a comprehensive, graphical overview of absolute and relative changes in mean speed between Survey 1 (“before”) and Survey 4 (“after III”). The left vertical axis shows the absolute difference in the mean speed between Survey 1 and Survey 4 (i.e., mean speed in Survey 1—mean speed in Survey 4) for each site, whereas the right vertical axis shows the percentage of the relative difference in the mean speed between Survey 1 and Survey 4 (i.e., [mean speed in Survey 1—mean speed in Survey 4]/[mean speed in Survey 1]). The mean speed “before” for each site, from the lowest to the highest value, is shown on the horizontal axis.
Overall, Figure 2 shows that speed reductions were observed for almost all sites that were included in the intervention. It is also evident that the larger the mean speed was before the 20 mph intervention, the larger the speed reduction that was observed eight months after the introduction of the 20 mph speed limit. Notably, we identified mild speed reductions of up to 10% in Survey 4 for most sites that had mean speeds less than 25 mph before the trial. Speed reductions were relatively larger at sites with mean speeds greater than 25 mph before the trial; these findings corroborate the results of the descriptive analysis presented in Table 2. For most of these sites, speed reductions exceeded 15% of their pre-intervention speeds, whereas in some cases, speed reductions were found to be close to 25%, always compared to mean speeds “before”. Specifically, for sites with mean speeds “before” in the band >25–30 mph, the average proportion of speed reduction (i.e., the percentage of speed reduction compared to the mean speed of the same site before the intervention) was almost 13.5%, whereas for sites belonging in the highest speed band (i.e., >30–35 mph), the average speed reduction was greater than 15%.

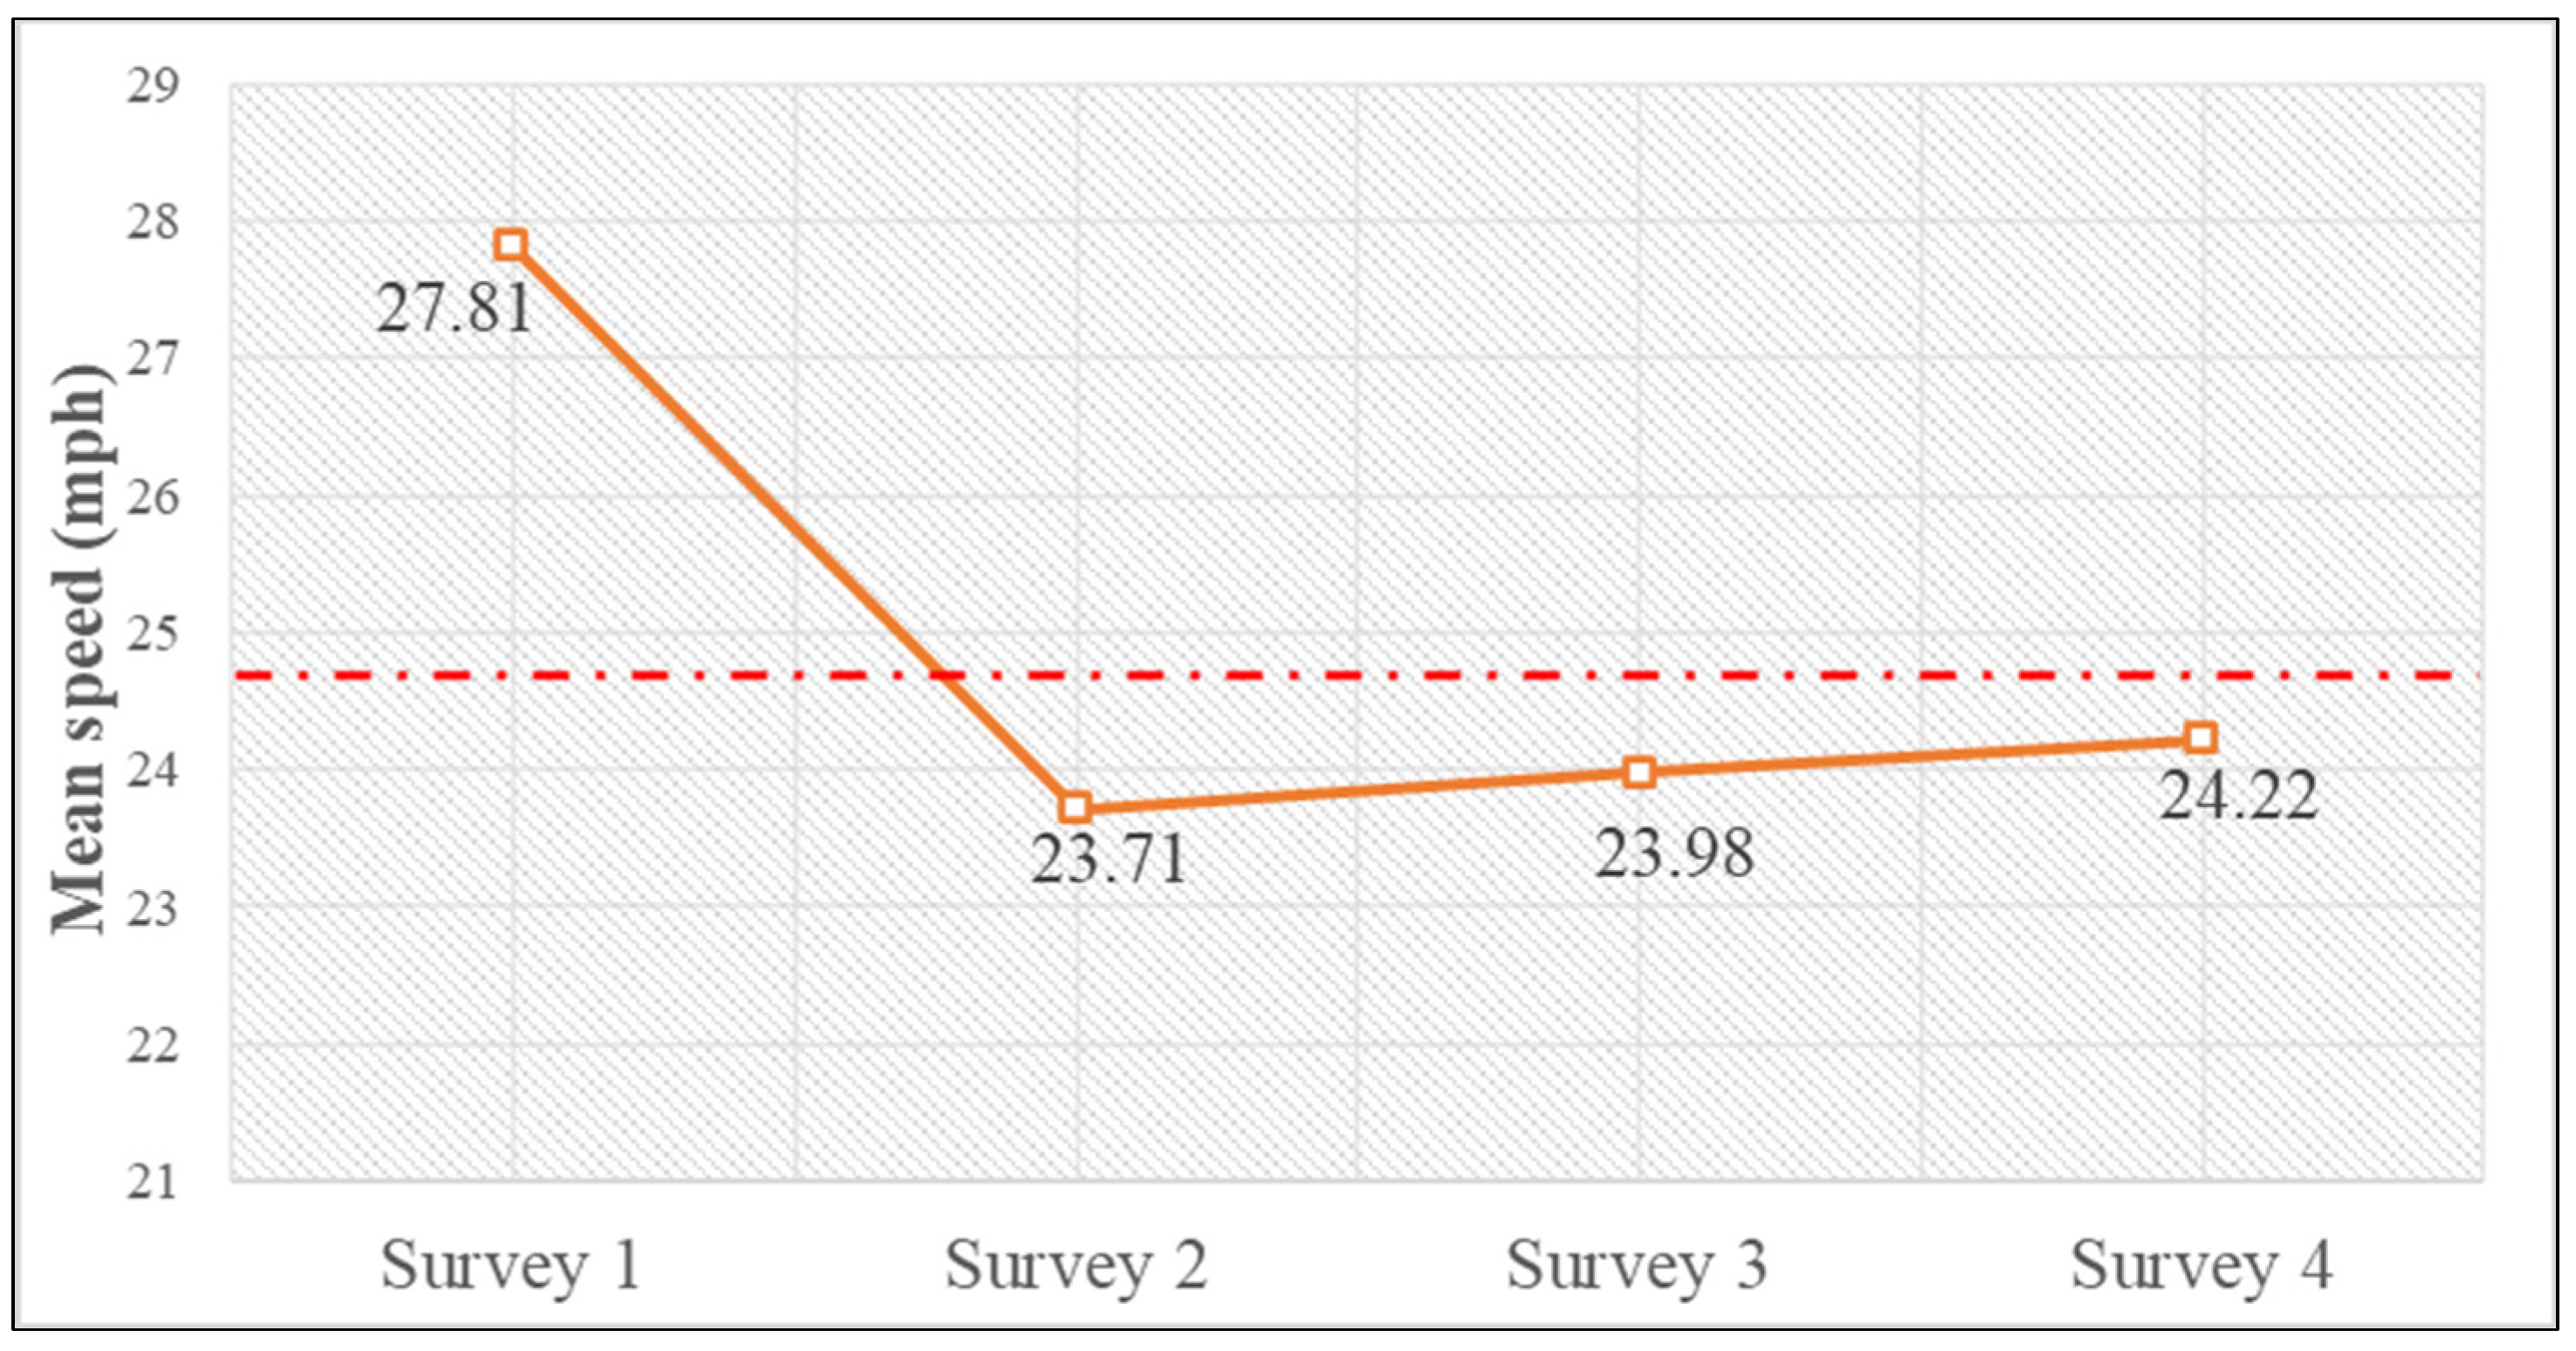
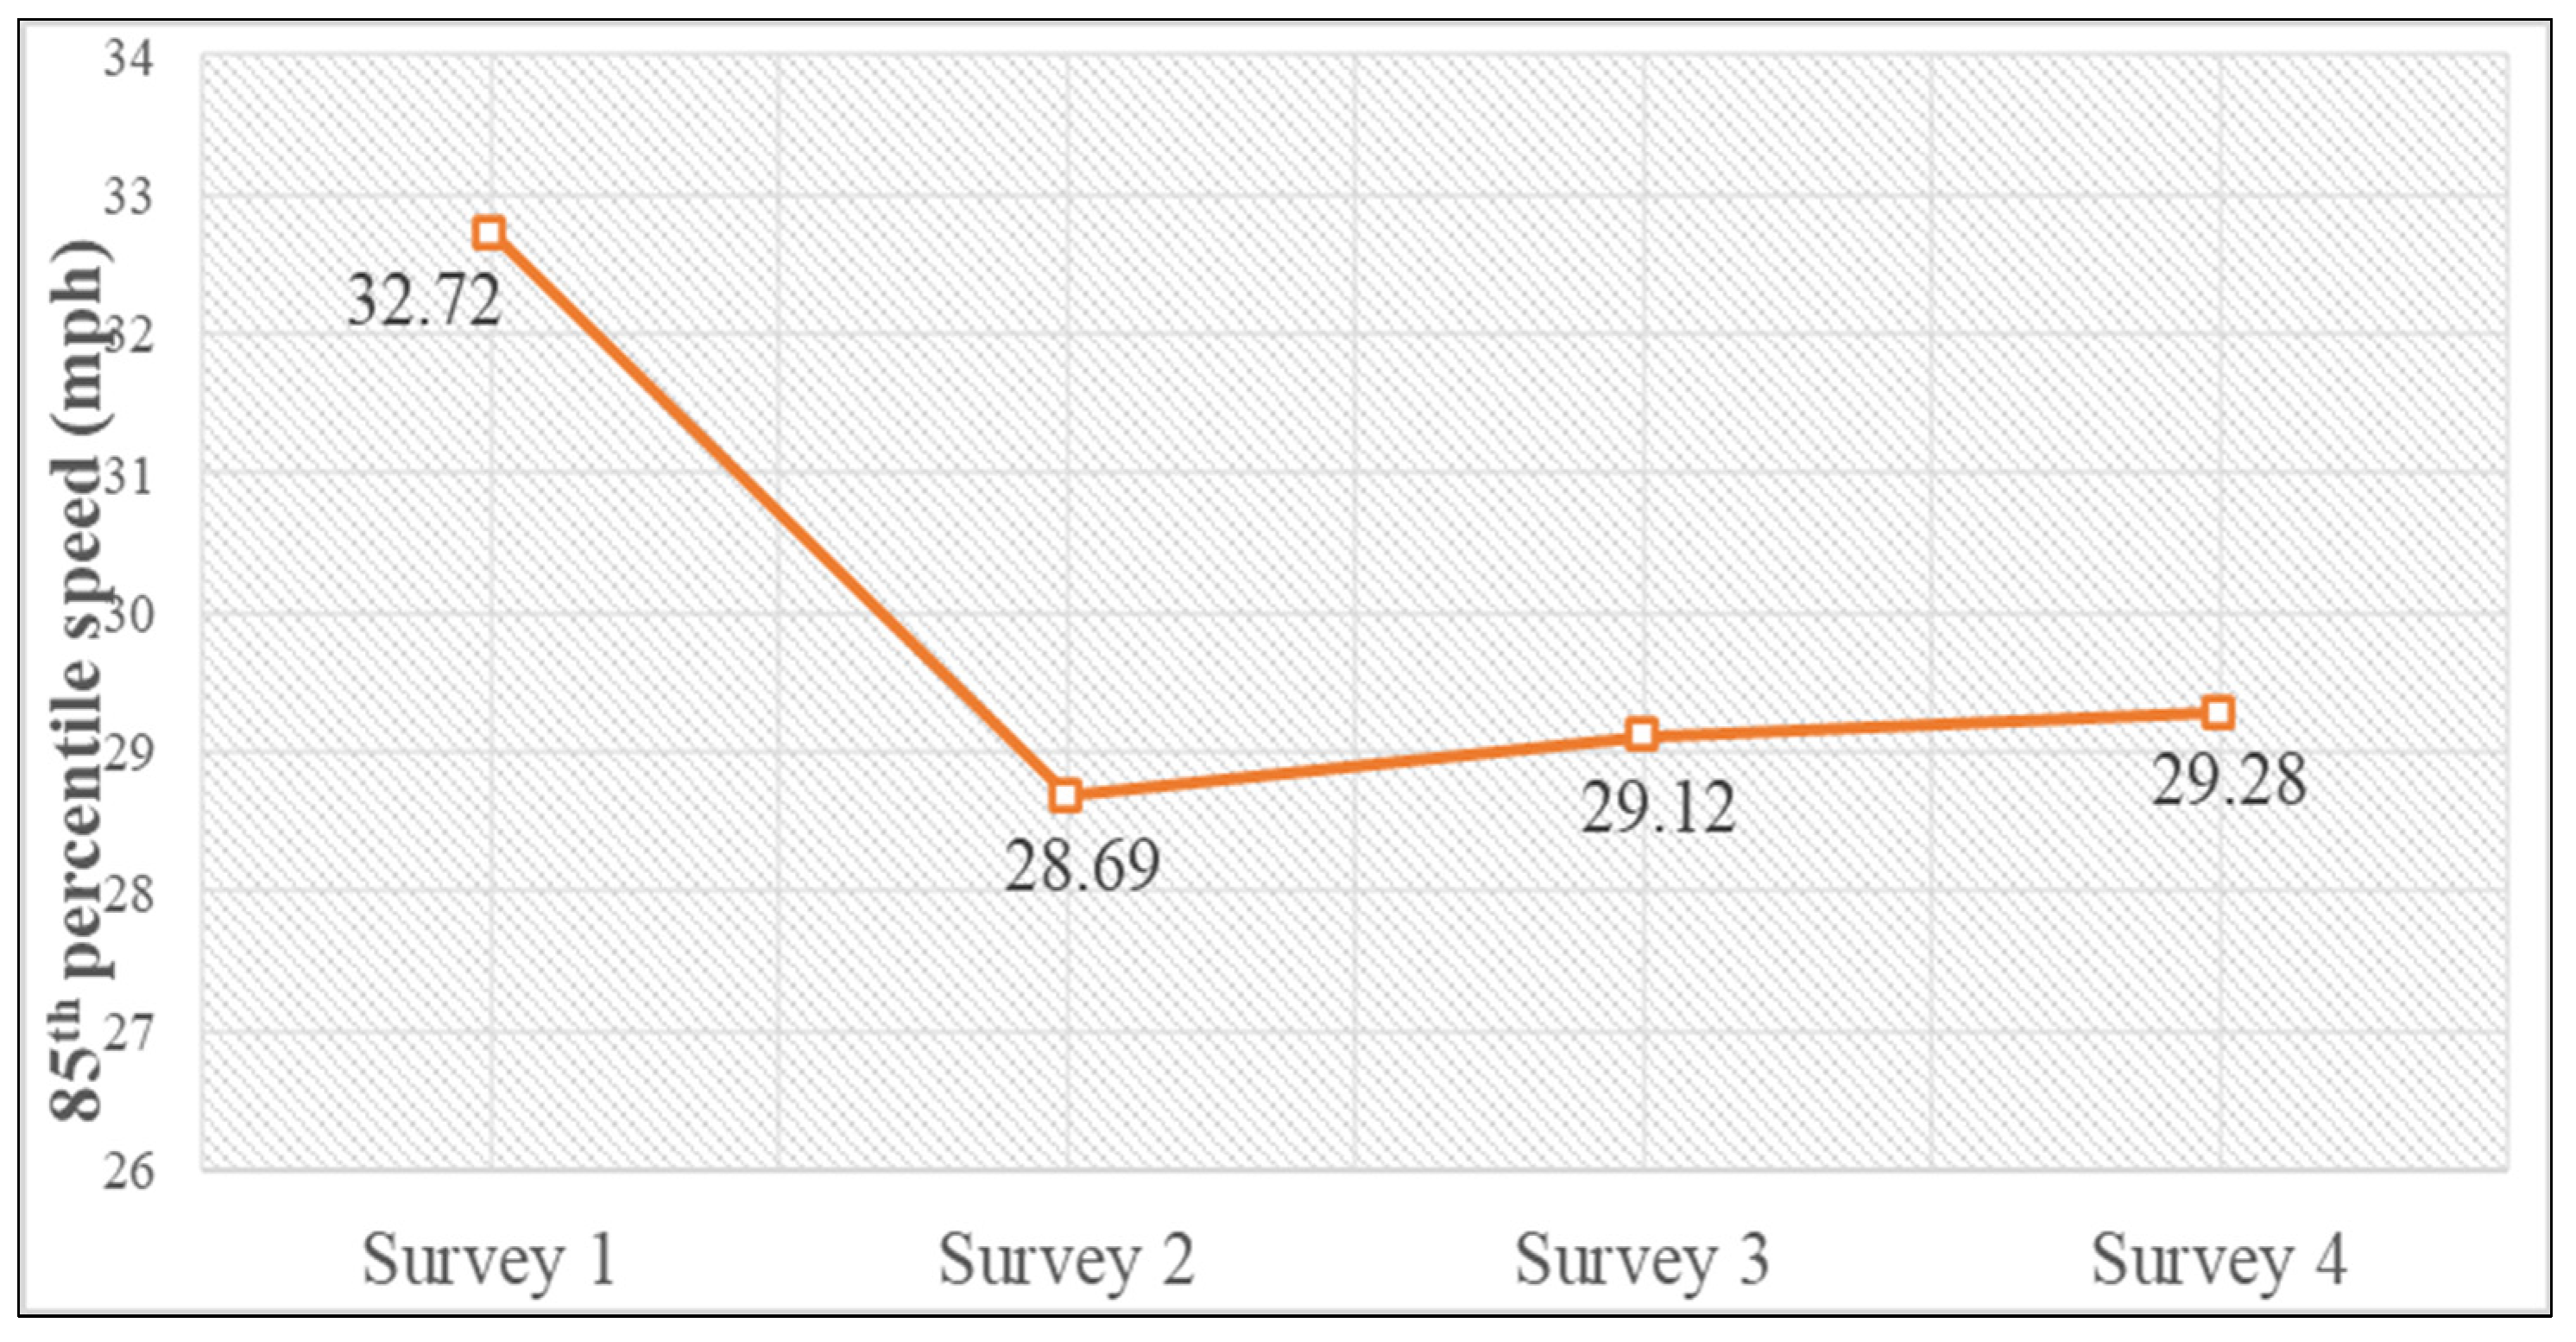
3.1.3. Evolution of Speed over Time

Using information from 55 sites with available speed data across all survey waves (i.e., Surveys 1–4), Figure 3 and Figure 4 illustrate the average evolution of the mean and 85th percentile speeds over time. Based on the analysis of all survey waves, both mean and 85th percentile speeds indicate an encouraging trajectory over time, upon the introduction of the 20 mph speed limit. As expected, the largest drop in both mean and 85th percentile speeds was observed in Survey 2, which was conducted a few weeks after the onset of the trial. In Survey 3 and Survey 4, speed reductions were largely maintained, whereas minor speed increases were identified in both waves compared to Survey 2 (less than or close to 0.5 mph).
While not as large as the speed reductions observed in Survey 2 compared to Survey 1, Surveys 3 and 4 did also report large reductions for both the mean and 85th percentile speeds compared to Survey 1. It should be noted that across all post-intervention survey waves, the mean speed remained below the 25 mph threshold, which is considered a typical pre-intervention speed threshold for implementing a 20 mph speed limit with satisfactory compliance [32]. Considering the 109 sites with available data, almost 86% of the speed reduction observed a few weeks after the introduction of the 20 mph limit (Survey 2) was found to be still evident seven to eight months after the intervention (i.e., in Survey 4 as shown in Table 2). Similarly, almost 83% of the average 85th percentile speed reduction that was observed in Survey 2 was found to be sustained in Survey 4.
Overall, the analysis of the mean and 85th percentile speeds over time revealed a generally stable trend of speeds post-intervention, with minor fluctuations being observed across some sites in the later survey waves; in most cases, the fluctuation was less than 5% in terms of speed change. However, such fluctuations (reflecting either increases or decreases in speed) were lower than 1 mph for the majority of sites; for example, the average difference between the mean speeds in Survey 2 and Survey 4 was 0.42 mph, as can be inferred from Table 2. To ascertain whether the differences in the mean speed post-intervention were statistically significant, we conducted a t-test using the mean speeds of the sites in Survey 2 and Survey 4 as values. The p-value of the t-test was 0.32, thus suggesting that the average in the mean speed values observed in Survey 4 was not statistically significant.

3.1.4. Percentage of Vehicles with Speed over PSL, ACPO and DfT

The percentages of vehicles exceeding various speeding thresholds were investigated to gain a preliminary understanding of the speeding behaviours and driver compliance across all sites before and after the 20 mph limit. To that end, we used the posted speed limit (PSL), the speed threshold employed by the Association of Chief Police Officers (ACPO) and the Department for Transport (DfT) threshold, which have been defined in the “Materials and Methods” section.
The speed limit pre-intervention was equal to 30 mph. As such, the ACPO threshold before the intervention was equal to 35 mph, whereas post-intervention, its value dropped to 24 mph. Similarly, the DfT threshold before the intervention was equal to 45 mph, whereas post-intervention, it was equal to 35 mph. An interesting observation here is that the ACPO threshold of roads with a 30 mph limit coincides with the DfT threshold of roads with a 20 mph speed limit. However, the ACPO threshold indicates an approximate cut-off value used for speed enforcement purposes, whereas the DfT threshold captures severe speeding incidents.
Overall, in Survey 1, more than 25% of vehicles were identified as having speeds exceeding the PSL, whereas in Survey 2 and Survey 4, where the posted speed limit was reduced from 30 mph to 20 mph, noticeable, yet expected increases were observed in the proportion of vehicles exceeding the PSL. This proportion is equal to 64% and 68%, in Survey 2 and Survey 4, respectively. Even though the proportions of vehicles with speeds over the PSL can inform about the overall prevalence of speeding behaviour, evidence about more serious speeding patterns can be offered by the proportions of vehicles exceeding the ACPO threshold. Given the drastic decrease in the ACPO threshold from 35 mph to 24 mph—due to the reduction in the speed limit from 30 mph to 20 mph—we observed an expected rise in the proportion of vehicles exceeding the ACPO threshold, from 7% pre-intervention, to 33% and 38% in Survey 2 and Survey 4, respectively.
However, a more robust comparison of excessive vehicle speeds can be achieved by comparing the proportion of vehicles exceeding the ACPO threshold pre-intervention with the proportion of vehicles exceeding the DfT threshold post-intervention, as these two metrics end up having the same speed value (35 mph). While 7% of vehicles, on average, had speeds greater than 35 mph across all sites in Survey 1, this proportion significantly reduced to 2% and 3% in Survey 2 and Survey 4, respectively. This finding provides additional evidence as to the significant calming effect of the 20 mph speed limit and its capacity to radically reduce incidents of severe speeding.
Overall, the observed increases in the proportions of drivers’ non-compliance post-intervention constitute direct consequences of the reduction in the speed limit from 30 mph to 20 mph. These differences align with the previous literature that focused on the evolution of speed metrics after the introduction of the 20 mph limit in urban areas [33]. However, the proportion of drivers’ non-compliance with the new speed limit seems to have a slightly increasing trend over time, so it needs to be closely monitored by local authorities and enforcement agencies.
Such an increasing trend in non-compliance metrics can also be backed up (to some extent) by the significant increase in traffic volume in Survey 4 compared to Survey 2. As seen in Table 3, the average traffic volume per site increased by approximately 37.7%; this increase may constitute an outcome of the easing of the COVID-19 travel restrictions that were in place at the period of the data collection for Survey 2. As such, the proportional increase in non-compliance metrics in Survey 4 compared to Survey 2 is way lower compared to the corresponding increase in the drivers’ exposure (i.e., traffic volume) during the same period.
This observed, non-linear relationship between exposure and non-compliance incidents may serve as preliminary evidence for potential safety-in-number effects [34]; however, further investigation on the collision frequencies for the same period is required in order to draw reliable statistical inferences.

3.2. Statistical Analysis of Vehicle Speeds

The significance and extent of variations in vehicle speeds before and after the introduction of the 20 mph speed limit were further evaluated through inferential statistical analyses. Specifically, we conducted non-parametric and parametric statistical tests for the determination of the statistical significance of differences in key speed metrics.

3.2.1. Wilcoxon Signed-Rank Tests

Several Wilcoxon signed-rank tests were conducted using the speed data collected in Surveys 1, 2 and 4. The goal of carrying out these tests was to identify whether the differences in mean speeds across the sites before and after the intervention were statistically significant. To that end, the non-parametric structure of the test was leveraged, which is not predicated on any assumption about the distribution of the compared data. The detailed results of the Wilcoxon signed-rank tests (including the calculation of mean rank and sum of ranks, which constitute fundamental components of the Wilcoxon signed-rank test statistics—for further information, see Rey and Neuhäuser [35]) are presented in Table 4. Overall, for all the comparisons carried out (Survey 1 vs. Survey 2 and Survey 1 vs. Survey 4), the p-value of the test statistic was nearly equal to zero, thus indicating statistically significant changes in the mean speed before and after the intervention at a 99% level of confidence or more. These results corroborate the findings of the descriptive analysis, as previously discussed.

3.2.2. Paired Sample t-Tests

The impact of the 20 mph speed limit on vehicle speeds was statistically evaluated, at the most disaggregate level, by conducting paired sample t-tests for each intervention site. To carry out these tests, individual (vehicle-specific) speed data were leveraged. Given that speed surveys were carried out throughout a week for each survey wave, the sample size of speed data used for the t-test analysis was quite extensive for each site. Such extremely granular speed information was available in Survey 1, Survey 2 and Survey 4, hence, resulting in an extensive dataset consisting of more than five million observations.
The overall goal of these tests was to compare and assess the differences in observed vehicle speeds before and after the establishment of the 20 mph speed limit. As opposed to Wilcoxon signed-rank tests, the t-tests are fully parametric, and given the use of speed measurements from individual vehicles, these tests offer an in-depth understanding of speed differences to the greatest possible detail. To maximise the insights drawn from the t-test analysis, we carried out two t-tests per site using the vehicle-specific data and comparing individual speeds before the 20 mph intervention (Survey 1—“before”) and a few weeks after the intervention (Survey 2—“after I”) as well as before and seven to eight months after the intervention (Survey 4—“after II”). The detailed results of all the conducted t-tests are provided in Appendix A. Overall, as can be seen from Table A1, almost 94% of sites had statistically significant speed reductions in Survey 2. In addition, 96.5% of sites, for which t-tests could be carried out across Surveys 1, 2 and 4, had statistically significant speed reductions in Survey 4 too, i.e., seven to eight months after the introduction of the 20 mph limit. It should also be noted that for nearly all cases, the “before–after” speed reductions were found to be statistically significant at a greater than 99% level of confidence.
Only for a few sites (five sites for the “before–after I” comparison and three sites for the “before–after III” comparison) did the t-test results reveal statistically insignificant speed differences. These sites feature minor speed differences (less than or equal to 0.5 mph) and, apart from Kirkhouse (site 107), their mean speeds were below or very close to 20 mph. In other words, these were sites with already low speed patterns before the intervention, for which the introduction of the 20 mph limit had a minimal impact on vehicle speeds.

3.2.3. Linear Regression Analysis of Vehicle Speeds

To investigate the potential impact of the 20 mph speed limit indicator while controlling for the impact of other traffic and contextual characteristics, we conducted a linear regression analysis, given that speed constitutes a continuous variable [31]. Interestingly, traffic volumes saw a major decrease (31% on average) in Survey 2 (1820 vehicles/day on average) compared to Survey 1 (2383 vehicle/days on average), probably due to the COVID-19 measures and travel restrictions being in place during the period when the Survey 2 data was collected (between November and December 2020 when the second national lockdown was in effect). During the period of Survey 4 (June 2021), when a significant portion of the measures had been lifted, we observed a major increase in traffic volumes, with the average value being 2506 vehicles/day (a 5% increase compared to Survey 1).
Two linear regression models were estimated, with the mean speed and 85th percentile speeds serving as dependent variables. It should be noted that several transformations of the dependent variables were investigated (e.g., log-linear), but they all resulted in an inferior statistical fit. Similar to the descriptive and inferential analysis, the sample includes observations from Survey 1, Survey 2, and Survey 4—these are the surveys with the largest amount of commonly available data (i.e., 109 locations per survey wave). The descriptive statistics of the key variables identified as statistically significant in the regression models are presented in Table 5, whereas Table 6 presents the detailed estimation results of the models along with several goodness-of-fit metrics.
The results show that the average traffic volume and the 20 mph limit indicator are both statistically significant (at a greater than 99% level of confidence) factors of the mean and 85th percentile speeds, as they both resulted in coefficients with high t-stats (the critical value is 2.58) and p-values practically equal to zero. The coefficient for the 20 mph speed limit indicator suggests that for sites with 20 mph speed limits, the mean speed is expected to reduce by (approximately) 2.84 mph, whereas the 85th percentile speed is expected to drop by (approximately) 2.86 mph. These results also back up the findings of the parametric and non-parametric statistical tests, which, due to the nature of their formulation, do not take into account other controlling factors. We also trialled other variables as controlling factors in the regression models (e.g., level of COVID-19 restrictions being in place, area type), but these did not produce statistically significant coefficients.
Turning to the goodness-of-fit metrics, the results of the Likelihood Ratio Test (full model vs model only with the intercept term) that was conducted also provide additional evidence as to the significance of the estimated models at a greater than 99% level of confidence (l.o.c.). Similar inferences about the overall significance of the estimated models are also drawn from the conducted F-tests, which returned p-values practically equal to zero.

4. Policy Implications and Conclusions

4.1. Summary of Findings

This study focused on the evaluation of the impact of the 20 mph limit intervention on vehicle speeds in the area of the Scottish Borders, UK. A key finding of the study is that the mean speed across all sites of the intervention saw an average reduction of 3.1 mph shortly after the introduction of the 20 mph limit. This was accompanied by a similar decrease in the observed 85th percentile speed, which was almost equal to 3.2 mph within the same period. Some noticeable but smaller reductions in both the mean and 85th percentile speeds were seen in places showing lower speed patterns already before the intervention. However, substantial reductions in speeds were noticeable in locations with high-speed patterns before the intervention. For instance, an average reduction of 5.4 mph was identified in locations with means speeds in the range of >30–35 mph before the 20 mph intervention.
Over a longer term, i.e., seven to eight months after the introduction of the 20 mph limit, reductions in the mean and 85th percentile speeds continued to be seen for most sites. In fact, the overall mean speed was lower by 2.7 mph (approx.) compared to the mean speed before the intervention. The 85th percentile speed was found to drop by 2.6 mph (approx.) compared to its counterpart before the intervention. Speed reductions were found to be maintained overall up to 8 months after the intervention, and especially in locations with mean speeds before the intervention in the range of >25–30 mph. Furthermore, we noticed further decreases in the mean and 85th percentile speeds, in the longer term, in sites with high mean speeds before the intervention (i.e., with mean speeds in the range of >30–25 mph). These are the findings of a series of comparisons carried out, not only considering the pre-intervention period as a benchmark, but also comparing speed data across several survey waves conducted after the introduction of the 20 mph limit.
The outcomes of the site-by-site parametric t-tests, which were conducted using disaggregate vehicle speed data, revealed that for the vast majority of locations, the changes in speed “before–after” the intervention are statistically significant at a greater than 99% level of confidence. The results of the linear regression analysis confirmed the potential of the 20 mph speed limit to reduce both mean and 85th percentile speeds, while also controlling for other potentially influential factors, such as traffic volumes.

4.2. Policy Implications and Future Work

Over the past decades, communities across Scotland have requested that their local road authorities “do something to tackle speeding”. We know from past research, including the British Crime Survey, that speeding is seen as the most antisocial behaviour among residents [36]. This new research is the first of its kind in the UK to address the introduction of 20 mph speed limits in wholly rurally based settlements, and likely any rural areas in other high-income countries, where conditions may be similar. The results of our study triangulate well with previous 20 mph speed limit schemes, such as those reported for cities including Edinburgh and Bristol [25,26]. The results confirm then that where initial speeds were highest this is where the greatest reductions occurred [26] and that this holds true whether 20 mph speed limits are implemented in large cities or smaller settlements including villages.
The results help to fill an evidence gap regarding 20 mph speed limits and rural settlements. Moreover, as previous research has shown that for rural roads there is an average 4% reduction in collisions with each 1 mph reduction in average speed [37,38], this suggests that an increased application of 20 mph speed limits is likely to help with the ambitions of the national Road Safety Framework to reduce casualties [39]. The Framework contains a battery of targets ranging from the headline 50% reduction in people killed and seriously injured by 2030 to intermediate targets including a 40% reduction in pedestrians killed or seriously injured. It is acknowledged that casualty numbers were reported to be relatively low across villages and other small settlements across the Scottish Borders. Even so, any further reductions would obviously be welcomed in terms of loss of life averted and the avoidance of serious or slight injuries and the consequent burden on the National Health Service (NHS), trauma and suffering, as well as the avoidance of productivity loss that such casualties bear.
Highway authorities, public health practitioners, researchers and advocates for sustainable transport, among others across Scotland, have been keen to learn the lessons from this forward-moving approach taken forward by the Scottish Borders Council. The results provide encouragement to consider 20 mph as the default in rural settlements. Outside of Scotland but within the UK, perhaps especially in Wales where work progresses to implement a default 20 mph in place of the current 30 mph across settlements on restricted roads by September 2023, there is particular interest in learning lessons from this 20 mph intervention, as this rural dimension and the insights and the results will inform Welsh practice. Beyond the UK there is also keen interest in the results given the prior evidence gap for the effectiveness or otherwise of 20 mph speed limits in rural areas across high-income countries. Moreover, this supports the 3rd Global Ministerial Conference on Road Safety held in Stockholm (The Stockholm Declaration) which agreed a commitment to 20 mph as a default [40].
Some limitations should be taken into account while interpreting the findings of this study. These are associated with the exclusive use of spot speeds for the evaluation of the 20 mph intervention [41], which does not allow accounting for possible variations in speed during vehicle journeys. Future research should draw data that will allow a long-term evaluation of the 20 mph speed limit considering both journey speeds and drivers’ compliance as key performance indicators. In addition, spatio-temporal variations in speeds could not be investigated in the context of this study; as such, future work can potentially shed light on the impact of factors, such as the time of the day, day of the week or location-related characteristics, on vehicle speeds [42]. Moreover, further research should identify and address any spatio-temporal travel behaviour changes and, in particular, potential shifts toward active travel modes (e.g., walking and cycling) against car-dominated travel. Furthermore, future work should consider an in-depth analysis of the frequency and injury severity of road crashes that occurred after the introduction of the 20 mph speed limit. The timeline of this study did not allow addressing this important aspect as the identification of a possible impact on road safety and the comparison with the pre-intervention state requires a long-term evaluation.

Author Contributions

Conceptualization, G.F. and A.D.; methodology, G.F., A.O. and A.D.; formal analysis, A.O. and G.F.; investigation, A.O., G.F. and A.D.; data curation, A.O.; writing—original draft preparation, G.F. and A.O.; writing—review and editing, A.D.; supervision, G.F. and A.D.; project administration, G.F.; funding acquisition, G.F. and A.D. All authors have read and agreed to the published version of the manuscript.

Funding

This research was funded by the Scottish Borders Council (Edinburgh Napier Finance Code: R1872) through the Scottish Government’s “Spaces for People” programme.

Institutional Review Board Statement

The research is exempt from requiring an ethical approval from an Institutional Review Board. A risk assessment checklist was submitted to the research management system of Edinburgh Napier University (Project ID: 2682802, 3 September 2020), and given that the research does not involve human subjects, animals, developing countries, etc., the outcome of the checklist was that this research does not require formal ethical approval.

Informed Consent Statement

Not applicable.

Data Availability Statement

Data available on request due to restrictions.

Acknowledgments

The authors would like to thank Philippa Gilhooly, from the Scottish Borders Council Roads Department, Assets and Infrastructure for providing access to all necessary data.

Conflicts of Interest

The authors declare no conflict of interest. The data collection was monitored by the funder. The funder had no role in the design of the study; in the analyses or interpretation of data; in the writing of the manuscript; or in the decision to publish the results.

Appendix A

Table A1. Detailed results of the t-tests of individual vehicle speeds.
Site NoSite NameNo. of Observations (n)Mean SDSEt-Statp-Value
beforeafter Iafter IIIbeforeafter Iafter IIIbeforeafter Iafter IIIbeforeafter Iafter IIIB-AIB-AIIIB-AIB-AIII
1Broughton11,848741612,53829.826.8726.065.997.136.330.05510.08280.056629.4547.3900
3A70345,54936,32048,50829.7124.8224.554.275.115.120.020.02680.0232146.22168.2700
4Eddleston (Central)45,07436,59948,15926.9422.6422.524.333.893.940.02040.02040.018149.29162.9300
5A70344,85636,53048,59730.424.3125.485.145.035.640.02430.02630.0256170.13139.5800
6A72 Pirn Road, Innerleithen42,38337,07244,71024.5820.8621.626.715.535.710.03260.02870.02785.6269.800
7B709 Leithen Road81736183990224.4723.6622.515.395.435.670.05970.06910.05698.9123.8200
8B7062 Kingsmeadow Road11,43110,46812,51230.7225.2926.016.765.746.260.06320.05610.05664.3155.8400
9A703 Edinburgh Road53,62640,29357,64825.2922.923.444.624.384.560.01990.02180.01980.6566.9500
11A72 Neidpath28,35821,29032,33727.422.9922.976.75.875.690.03980.04020.031678.0587.1500
12A70114,17310,52016,74440.7530.730.456.568.448.280.05510.08230.064101.46121.9100
13A7285706420946832.6927.4727.055.155.755.530.05560.07180.056957.4670.8900
14A72 Peebles Road29,65529,65537,95729.2124.425.494.274.745.030.02480.02750.0258129.66103.7300
16B6461 Duns Road1000100013,47630.1126.0927.115.796.286.790.1830.19870.058514.8946.7900
17B640035332994387727.5925.01245.935.345.540.09970.09760.08918.4426.8600
18A698 Main Street18,38012,74318,52128.5721.9223.784.584.164.330.03380.03680.0318132.99103.1400
19Main Street26562491266328.0923.9724.125.945.365.850.11530.10740.113326.1424.5300
20A698 Main Street28,93623,06830,70229.8923.3223.984.794.864.970.02820.0320.0284153.93147.6100
21Oxnam Rd16,78312,59817,04228.9524.9725.454.564.184.420.03520.03730.033977.6971.6800
23A699 Main Street15,39211,84915,66230.5224.3225.185.085.355.550.0410.04910.044396.8688.5100
24B6401 Main Street43193558390325.2521.5821.865.995.45.460.09120.09060.087428.4926.800
25Unnamed road19091417176723.0121.3221.266.044.855.390.13840.12890.12838.919.2600
26Unnamed road56638789217.8917.1416.784.474.074.250.18790.20680.14222.74.690.010
27C78, Smailholm80036815806332.2426.6727.946.486.336.660.07250.07660.074252.8241.500
28B635012,6117428 36.6433.18 5.55.73 0.0490.0665 41.83 0
31B6364 Main Street79046921880929.5525.6726.274.924.914.980.05530.0590.053148.0142.8700
32B6401 Cheviot Place43153432431128.4825.2625.876.476.246.760.09850.10650.102922.2118.2800
33Unnamed road76863774421.0120.5618.916.555.595.320.23650.22130.19511.426.860.160
34Unnamed road, Ashkirk33892704401820.0519.1519.443.873.533.890.06650.06790.06139.496.7200
36A72 Vine Street32,30328,73932,41127.8823.0823.333.664.024.130.02040.02370.0229153.41148.2800
37B6394 Main Street91638053778315.6414.2413.523.082.962.690.03220.0330.030530.3947.7600
38A610523,36414,76922,85829.5825.5123.245.184.825.160.03390.03960.034178.01131.7600
39Main Street, Ettrickbridge29222194314523.0321.8620.355.745.24.970.10610.11110.08867.6319.3400
40Old Stage Road1065829117821.3619.9318.366.886.285.750.21090.21790.16764.7211.1700
41B6374 Melrose Road, Galashiels53,31552,00150,47829.6223.1124.454.563.914.090.01980.01710.0182248.66192.2300
42Scott Street42,61242,61247,15023.7320.9322.914.7744.290.02310.01940.019792.9427.0400
43A7 Abbotsford Road128,740115,609125,38827.1621.0922.724.273.763.920.01190.01110.0111373.67273.1900
44Windyknowe Road, Galashiels11,97811,97814,25825.8622.3823.194.533.934.290.04140.03590.035963.4848.700
45B6360 Main St, Gattonside17,17714,87516,20229.7823.8624.554.894.684.940.03730.03840.0388110.6897.1500
46Shoestanes Rd, Heriot749662123015.1215.4525.994.34.137.390.1570.16040.2107−1.48−41.410.140
47Thirlestane Dr, Lauder36672592456616.8714.5614.893.173.043.110.05230.05980.046129.128.4100
48B6362 Stow Rd, Lauder13,5473757637834.7726.4828.279.376.376.620.08050.10380.082863.0756.2900
49B6359 Main St, Lilliesleaf36313631430820.5919.4519.995.724.6250.0950.07660.07629.354.900
52Main Street, Midlem35513059308123.521.7523.036.085.365.180.1020.0970.093412.413.4300.001
53B6361 Main Street, Newstead41633459451821.7820.6620.314.754.184.280.07360.07110.063710.8815.0900
55Station Road, Oxton33923392411822.2520.6819.495.444.775.210.09340.08190.081312.6422.2600
56Unnamed road86286298915.1514.8415.133.493.493.450.11890.11880.10981.830.210.0670.845
57A707 Linglie Road, Selkirk9723533410,39935.7232.9532.337.057.156.790.07150.09790.066622.8234.6700
59Bleachfield Road, Selkirk15,07011,26817,15524.7422.4923.335.044.434.70.04110.04180.035938.5125.8200
60A7 Galashiels Road56,06124,09031,03429.6223.8823.543.884.594.560.01640.02960.0259169.74198.6900
61A7, Stow (North)53,51322,56129,09526.7723.523.54.414.574.570.01910.03040.026891.0999.5100
64A6088, Chesters47362945549622.9321.4721.283.964.243.830.05750.07820.05171521.3800
65A698 Jedburgh Road, Denholm28,55226,54132,16328.7223.8324.335.45.475.810.0320.03360.0324105.3896.4300
67B6399 Liddesdale Road, Hawick11,828872211,87925.5323.1123.075.034.874.930.04620.05210.045234.7438.0900
69B6357 North Hermitage Street58363882674429.1122.7727.585.515.65.780.07210.08980.070455.115.2100
70B6437 Main St, Allanton85207194890029.2622.4224.324.995.15.720.05410.06010.060684.6160.8700
71B6355, Ayton10,018865311,26725.7521.7822.455.014.294.530.05010.04610.042758.3250.2100
72Unnamed rd., Burnmouth56503226659227.5424.4425.515.155.385.550.06860.09470.068326.5420.9600
73Crosshill/Kirkgate, Chirnside59295268620018.3817.518.643.162.953.130.04110.04060.039815.25−4.4400
74Hoprig Rd /The Square30442940353719.0119.9119.544.14.254.250.07430.07830.0715−8.37−5.1700
76Duns Road, Coldsteam91087940906628.1122.7622.85.364.935.360.05610.05530.056367.8166.7700
77Unnamed road, Cove2173754206914.4715.1814.133.643.863.520.0780.14050.0774−4.373.1200.002
78A6105 Langtongate, Duns28,45526,03931,63528.8222.8223.876.044.785.090.03580.02960.0286129.23108.1300
79B6461 Main Street, Eccles10,87310,029 3124.31 6.165.33 0.05910.0532 84.19 0
80A1107, Eyemouth23,65315,06923,74228.5423.7423.354.294.254.690.02790.03460.0304107.94125.6400
81Unnamed road, Foulden13311331147923.3522.6423.916.975.785.90.1910.15860.15342.85−2.310.0040.021
82A6105, Foulden18,04513,49318,13937.3631.8536.895.265.785.270.03920.04970.039287.048.4800
83Main Street, Gavinton21532153315328.5923.7122.755.435.225.760.11690.11250.102730.0437.4800
84Bankhouse, Grantshouse58155361318.8218.9119.285.255.285.330.21760.22460.2154−0.3−1.50.7640.133
85Duns Road between Queens Row and The Avenue Greenlaw17,09116,998910029.9524.8727.85.475.215.720.04180.03990.0687.8729.4800
86B6461 Main Street97707936993326.7922.2923.385.444.554.90.0550.0510.049259.9946.1600
87A6112, Lennel49113557504328.7523.424.645.845.656.390.08330.09470.0942.3833.5300
88Gifford Road, Longformacus20521317175318.6417.7718.493.583.33.610.07910.09080.08617.31.3300.183
90A6112, Preston15,09311,26413,45130.0524.525.145.114.965.160.04160.04670.044588.8280.6400
91B6438 Main St, Reston46383609523927.3424.224.74.514.544.660.06620.07560.064431.2328.5900
92B6438, St Abbs76563073756120.0320.4819.624.744.644.250.05420.08370.0488−4.445.700
93A6112, Main St, Swinton96707635932424.9722.5323.964.684.114.620.04750.0470.047836.4614.9600
94B6456, Westruther29112911469126.1522.8123.875.445.35.250.10080.09820.076723.717.9300
105South Parks65506304903422.6320.819.334.734.2640.05840.05360.042123.0645.7200
106Traquair44633248646329.0226.3426.477.347.356.840.10990.1290.085115.8418.3100
107Kirkhouse (near Traquair)30522350531225.272524.156.3365.950.11450.12370.08171.597.960.1120
108Minto1897181484223.322.1722.515.435.074.950.12460.11910.17066.563.7100
109Yarrowford79379383118.6318.8515.824.234.394.480.15030.15580.1554−1.0112.960.3110
111Cotgreen Road35223522389219.0617.2918.323.783.453.780.06370.05820.060520.498.3500
112Oxnam21782178276428.0325.0824.525.855.865.620.12540.12550.106816.6221.3100
114Unnamed road, Lanton1092985139018.6818.216.963.693.963.810.11170.12630.10222.8511.370.0050
115B6356, Clintmains24631327311128.1121.7521.635.234.354.860.10540.11950.087139.9147.3800
116B6356, Bemersyde1517839209420.9719.8520.375.124.885.120.13150.16860.11195.233.4600.001
117Unnamed road, Hume13491272146427.4125.0725.336.115.76.490.16640.15990.169610.178.7400
120Auchencrow59359390120.718.3819.085.394.34.90.22120.17660.16328.25.9300
121Nether Blainslie (near Lauder)1299890172926.3823.7121.678.366.87.270.2320.22810.17488.1916.1700
SD—standard deviation, SE—standard error, t-stat—t-statistic, B-AI: before–after I, B-AIII: before–after III.

References

  1. Larsson, P.; Tingvall, C. The safe system approach—A road safety strategy based on human factors Principles. In Engineering Psychology and Cognitive Ergonomics. Applications and Services, Proceedings of the 10th International Conference, EPCE 2013, Held as Part of HCI International 2013, Las Vegas, NV, USA, 21–26 July 2013; Springer: Berlin/Heidelberg, Germany, 2013; Part II 10; pp. 19–28. [Google Scholar]
  2. Quddus, M. Exploring the Relationship Between Average Speed, Speed Variation, and Accident Rates Using Spatial Statistical Models and GIS. J. Transp. Saf. Secur. 2013, 5, 27–45. [Google Scholar] [CrossRef]
  3. Olowosegun, A.; Babajide, N.; Akintola, A.; Fountas, G.; Fonzone, A. Analysis of pedestrian accident injury-severities at road junctions and crossings using an advanced random parameter modelling framework: The case of Scotland. Accid. Anal. Prev. 2022, 169, 106610. [Google Scholar] [CrossRef] [PubMed]
  4. Fountas, G.; Fonzone, A.; Olowosegun, A.; McTigue, C. Addressing unobserved heterogeneity in the analysis of bicycle crash injuries in Scotland: A correlated random parameters ordered probit approach with heterogeneity in means. Anal. Methods Accid. Res. 2021, 32, 100181. [Google Scholar] [CrossRef]
  5. Ahmed, S.S.; Alnawmasi, N.; Anastasopoulos, P.C.; Mannering, F. The effect of higher speed limits on crash-injury severity rates: A correlated random parameters bivariate tobit approach. Anal. Methods Accid. Res. 2022, 34, 100213. [Google Scholar] [CrossRef]
  6. Department for Transport. Road Traffic Estimates: Great Britain 2016; Department for Transport: London, UK, 2017. [Google Scholar]
  7. Sarkar, C.; Webster, C.; Kumari, S. Street morphology and severity of road casualties: A 5-year study of Greater London. Int. J. Sustain. Transp. 2018, 12, 510–525. [Google Scholar] [CrossRef]
  8. Steinbach, R.; Cairns, J.; Grundy, C.; Edwards, P. Cost benefit analysis of 20 mph zones in London. Inj. Prev. 2013, 19, 211–213. [Google Scholar] [CrossRef]
  9. Cleland, C.L.; McComb, K.; Kee, F.; Jepson, R.; Kelly, M.P.; Milton, K.; Nightingale, G.; Kelly, P.; Baker, G.; Craig, N.; et al. Effects of 20 mph interventions on a range of public health outcomes: A meta-narrative evidence synthesis. J. Transp. Health 2020, 17, 100633. [Google Scholar] [CrossRef]
  10. Cairns, J.; Warren, J.; Garthwaite, K.; Greig, G.; Bambra, C. Go slow: An umbrella review of the effects of 20 mph zones and limits on health and health inequalities. J. Public Health 2015, 37, 515–520. [Google Scholar] [CrossRef]
  11. Peters, J.L.; Anderson, R. The cost-effectiveness of mandatory 20 mph zones for the prevention of injuries. J. Public Health 2013, 35, 40–48. [Google Scholar] [CrossRef]
  12. Tapp, A.; Nancarrow, C.; Davis, A. Support and compliance with 20 mph speed limits in Great Britain. Transp. Res. Part F Traffic Psychol. Behav. 2015, 31, 36–53. [Google Scholar] [CrossRef]
  13. Milton, K.; Kelly, M.P.; Baker, G.; Cleland, C.; Cope, A.; Craig, N.; Foster, C.; Hunter, R.; Kee, F.; Kelly, P.; et al. Use of natural experimental studies to evaluate 20 mph speed limits in two major UK cities. J. Transp. Health 2021, 22, 101141. [Google Scholar] [CrossRef] [PubMed]
  14. Hu, W.; Cicchino, J.B. Lowering the speed limit from 30 mph to 25 mph in Boston: Effects on vehicle speeds. Inj. Prev. 2020, 26, 99–102. [Google Scholar] [CrossRef]
  15. Heydari, S.; Miranda-Moreno, L.F.; Liping, F. Speed limit reduction in urban areas: A before–after study using Bayesian generalized mixed linear models. Accid. Anal. Prev. 2014, 73, 252–261. [Google Scholar] [CrossRef] [PubMed]
  16. Pantangi, S.S.; Fountas, G.; Anastasopoulos, P.C.; Pierowicz, J.; Majka, K.; Blatt, A. Do High Visibility Enforcement programs affect aggressive driving behavior? An empirical analysis using Naturalistic Driving Study data. Accid. Anal. Prev. 2020, 138, 105361. [Google Scholar] [CrossRef] [PubMed]
  17. Pantangi, S.S.; Fountas, G.; Sarwar, M.T.; Anastasopoulos, P.C.; Blatt, A.; Majka, K.; Pierowicz, J.; Mohan, S.B. A preliminary investigation of the effectiveness of high visibility enforcement programs using naturalistic driving study data: A grouped random parameters approach. Anal. Methods Accid. Res. 2019, 21, 1–12. [Google Scholar] [CrossRef]
  18. Jones, S.J.; Brunt, H. Twenty miles per hour speed limits: A sustainable solution to public health problems in Wales. J. Epidemiol. Community Health 2017, 71, 699–706. [Google Scholar] [CrossRef]
  19. Bornioli, A.; Bray, I.; Pilkington, P.; Parkin, J. Effects of city-wide 20 mph (30 km/hour) speed limits on road injuries in Bristol, UK. Inj. Prev. 2020, 26, 85–88. [Google Scholar] [CrossRef] [PubMed]
  20. Nightingale, G.; Jepson, R. Report on Key Outcomes Following the Implementation of 20 mph Speed Limits in the City of Edinburgh; University of Edinburgh: Edinburgh, UK, 2019. [Google Scholar]
  21. Zwerling, C.; Peek-Asa, C.; Whitten, P.S.; Choi, S.-W.; Sprince, N.L.; Jones, M.P. Fatal motor vehicle crashes in rural and urban areas: Decomposing rates into contributing factors. Inj. Prev. 2005, 11, 24–28. [Google Scholar] [CrossRef]
  22. Department for Transport. Rural Roads Targeted in New Safety Campaign to Prevent Deaths and Injuries among Young Drivers; UK Department for Transport: London, UK, 2023. [Google Scholar]
  23. Corkle, J.; Giese, J.L.; Marti, M.M. Investigating the Effectiveness of Traffic Calming Strategies on Driver Behavior, Traffic Flow and Speed; Minnesota Local Road Research Board: St. Paul, MN, USA, 2001. [Google Scholar]
  24. Sarwar, M.T.; Fountas, G.; Bentley, C.; Anastasopoulos, P.C.; Blatt, A.; Pierowicz, J.; Majka, K.; Limoges, R. Preliminary Investigation of the Effectiveness of High-Visibility Crosswalks on Pedestrian Safety Using Crash Surrogates. Transp. Res. Rec. 2017, 2659, 182–191. [Google Scholar] [CrossRef]
  25. Vaitkus, A.; Čygas, D.; Jasiūnienė, V.; Jateikienė, L.; Andriejauskas, T.; Skrodenis, D.; Ratkevičiūtė, K. Traffic Calming Measures: An Evaluation of the Effect on Driving Speed. Promet Traffic Transp. 2017, 29, 275–285. [Google Scholar] [CrossRef]
  26. Bornioli, A.; Bray, I.; Pilkington, P.; Bird, E.L. The effectiveness of a 20 mph speed limit intervention on vehicle speeds in Bristol, UK: A non-randomised stepped wedge design. J. Transp. Health 2018, 11, 47–55. [Google Scholar] [CrossRef]
  27. Nightingale, G.F.; Williams, A.J.; Hunter, R.F.; Woodcock, J.; Turner, K.; Cleland, C.L.; Baker, G.; Kelly, M.; Cope, A.; Kee, F.; et al. Evaluating the citywide Edinburgh 20 mph speed limit intervention effects on traffic speed and volume: A pre-post observational evaluation. PLoS ONE 2022, 16, e0261383. [Google Scholar] [CrossRef] [PubMed]
  28. ROSPA. A Guide to 20 mph Limits; ROSPA: Birmingham, UK, 2019. [Google Scholar]
  29. Son, S.; Jeong, J.; Park, S.; Park, J. Effects of advanced warning information systems on secondary crash risk under connected vehicle environment. Accid. Anal. Prev. 2020, 148, 105786. [Google Scholar] [CrossRef] [PubMed]
  30. Ghasemi, A.; Zahediasl, S. Normality tests for statistical analysis: A guide for non-statisticians. Int. J. Endocrinol. Metab. 2012, 10, 486–489. [Google Scholar] [CrossRef] [PubMed]
  31. Washington, S.; Karlaftis, M.G.; Mannering, F.; Anastasopoulos, P. Statistical and Econometric Methods for Transportation Data Analysis, 3rd ed.; Chapman and Hall/CRC: Boca Raton, FL, USA, 2020. [Google Scholar]
  32. 20’s Plenty for Us. The 25mph Conundrum. 2021. Available online: https://www.20splenty.org/the_25mph_conundrum#:~:text=Many%20people%20ask%20what%20to,speed%20is%20a%20flawed%20approach. (accessed on 22 April 2021).
  33. Maher, M. 20 mph Research Study: Process and Impact Evaluation: Headline Report; Atkins: Epsom, UK, 2018. [Google Scholar]
  34. Elvik, R.; Bjørnskau, T. Safety-in-numbers: A systematic review and meta-analysis of evidence. Saf. Sci. 2017, 92, 274–282. [Google Scholar] [CrossRef]
  35. Rey, D.; Neuhäuser, M. Wilcoxon-signed-rank test. In International Encyclopedia of Statistical Science; Springer: Berlin/Heidelberg, Germany, 2011; pp. 1658–1659. [Google Scholar]
  36. Poulter, D.R.; McKenna, F.P. Is speeding a “real” antisocial behavior? A comparison with other antisocial behaviors. Accid. Anal. Prev. 2007, 39, 384–389. [Google Scholar] [CrossRef]
  37. Finch, D.; Kompfner, P.; Lockwood, C.; Maycock, G. Speed, Speed Limits, and Accidents; Transport Research Laboratory: Berkshire, UK, 2004. [Google Scholar]
  38. Taylor, M.; Lynam, D.; Baruya, A. The Effects of Drivers’ Speed on the Frequency of Road Accidents; Transport Research Laboratory: Berkshire, UK, 2000. [Google Scholar]
  39. Transport Scotland. Scotland’s Road Safety Framework to 2030. Together, Making Scotland’s Roads Safer; Transport Scotland: Glasgow, Scotland, 2021. [Google Scholar]
  40. Eneroth, T. Stockholm Declaration. In Proceedings of the Third Global Ministerial Conference on Road Safety: Achieving Global Goals 2030, Stockholm, Sweden, 19–20 February 2020. [Google Scholar]
  41. Da Silva, A.R.; de Melo Santos, M. Impact on average vehicle speed with the introduction of educational actions and optical character recognition equipment in the Federal District, Brazil. Transportes 2020, 28, 294–308. [Google Scholar] [CrossRef]
  42. Fountas, G.; Fonzone, A.; Gharavi, N.; Rye, T. The joint effect of weather and lighting conditions on injury severities of single-vehicle accidents. Anal. Methods Accid. Res. 2020, 27, 100124. [Google Scholar] [CrossRef]
Figure 1. Geographical distribution of intervention settlements in the area of Scottish Borders, UK.
Safety 09 00066 g001
Figure 2. Absolute and relative speed changes “After III” compared to mean speed “before”.
Safety 09 00066 g002
Figure 3. Mean speed over time across 55 sites with available data across all survey waves.
Safety 09 00066 g003
Figure 4. Eighty-fifth percentile speed over time across sites with available data across all survey waves.
Safety 09 00066 g004
Table 1. Overall descriptive statistics of mean and 85th percentile speeds before and after the 20 mph intervention.
Survey WavenMinimumMaximumAverageStd. Deviation
Mean85th PercentileMean85th PercentileMean85th PercentileMean85th Percentile
Survey 1 (“before”)10914.5018.1034.8042.4025.3330.214.5644.896
Survey 2 (“after I”)10914.2017.3027.6034.1022.2227.033.0183.753
Survey 4 (“after III”)10913.5016.2030.2035.6022.6427.593.2743.932
Table 2. Descriptive statistics of mean speed and 85th percentile speed by speed band.
Speed Band (mph)Survey WavenMinimumMaximumAverageStd. Deviation
Mean85th PercentileMean85th PercentileMean85th PercentileMean85th Percentile
0–20Survey 1 (“before”)2014.5018.1020.0026.1018.0622.221.6712.193
Survey 2 (“after I”)2014.2017.3020.5025.3017.4121.361.7812.252
Survey 4 (“after III”)2013.5016.2026.0033.2018.0122.132.8353.626
>20–25Survey 1 (“before”)2420.6025.9025.0030.8022.5827.981.2661.380
Survey 2 (“after I”)2418.4022.9024.1028.8021.0125.781.2311.429
Survey 4 (“after III”)2418.4023.3024.0030.0021.1226.041.7061.832
>25–30Survey 1 (“before”)5225.2029.4030.0036.4027.9432.741.4121.654
Survey 2 (“after I”)5221.1024.1026.9034.1023.7128.601.2932.131
Survey 4 (“after III”)5221.6025.9027.7033.5024.1729.181.4861.961
>30–35Survey 1 (“before”)1330.1033.8034.8042.4031.1736.521.3632.348
Survey 2 (“after I”)1324.3029.1027.6034.1025.8731.831.1311.772
Survey 4 (“after III”)1324.9030.0030.2035.6026.4532.471.5812.042
Table 3. Overall proportions of vehicles exceeding the speed thresholds.
Survey WavenAverage Traffic Volume (Vehicles)>PSL>ACPO>DfT
Survey 1 (“before”)109238325%7%0.04%
Survey 2 (“after I”)109182064%33%2%
Survey 4 (“after III”)109250668%38%3%
Table 4. Results of the Wilcoxon signed-rank tests on vehicle speeds.
“Before” vs. “after I” Comparison
Wilcoxon Signed-Rank TestnMean RankSum of Ranks
Sites with speed decrease10860.106491.00
Sites with speed increase610.6764.00
Ties1
Before” vs. “after III” Comparison
Wilcoxon Signed-Rank TestnMean RankSum of Ranks
Sites with speed decrease10156.155671.00
Sites with speed increase730.71215.00
Ties1
Table 5. Descriptive statistics of key variables.
Key VariableMeanStandard DeviationMinimumMaximum
Mean speed (mph)23.483.8513.5034.80
85th percentile speed (mph)28.374.3616.2042.40
20 mph indicator (1 if 20 mph speed limit is in place, 0 otherwise)66.67%-0.001.00
Average traffic volume (103 vehicles/day)2.2562.7720.05518.391
Table 6. Estimation results of linear regression models of mean and 85th percentile speeds.
Mean Speed85th Percentile Speed
Coefficientt-Statistic95% Confidence IntervalCoefficientt-Statistic95% Confidence Interval
Intercept24.45466.7723.73625.17229.60968.0328.75630.462
20 mph indicator (1 if 20 mph limit is in place, 0 otherwise)−2.836−7.07−3.622−2.049−2.863−6.01−3.798−1.929
Average traffic volume (103 vehicles/day)0.4105.950.2700.5400.3003.640.1400.450
Log-likelihood at zero−903.893−944.715
Log-likelihood at convergence−864.335−920.779
Likelihood Ratio Test (LRT) results79.1147.87
F-test results44.3425.54
Disclaimer/Publisher’s Note: The statements, opinions and data contained in all publications are solely those of the individual author(s) and contributor(s) and not of MDPI and/or the editor(s). MDPI and/or the editor(s) disclaim responsibility for any injury to people or property resulting from any ideas, methods, instructions or products referred to in the content.

