Article

A Deep-Learning Approach to Driver Drowsiness Detection

1
Department of Computer Engineering, College of Computer Science and Information Technology, Imam Abdulrahman Bin Faisal University, Dammam 31441, Saudi Arabia
2
Department of Computer Science, College of Computer Science and Information Technology, Imam Abdulrahman Bin Faisal University, Dammam 31441, Saudi Arabia
3
Department of Computer Science, Abbottabad University of Science and Technology, Abbottabad 22020, Pakistan
*
Authors to whom correspondence should be addressed.
Safety 2023, 9(3), 65; https://doi.org/10.3390/safety9030065
Submission received: 31 May 2023 / Revised: 30 August 2023 / Accepted: 31 August 2023 / Published: 13 September 2023
(This article belongs to the Special Issue Safety and Risk Management in Digitalized Process Systems)

Abstract

:
Drowsy driving is a widespread cause of traffic accidents, especially on highways. It has become an essential task to seek an understanding of the situation in order to be able to take immediate remedial actions to detect driver drowsiness and enhance road safety. To address the issue of road safety, the proposed model offers a method for evaluating the level of driver fatigue based on changes in a driver’s eyeball movement using a convolutional neural network (CNN). Further, with the help of CNN and VGG16 models, facial sleepiness expressions were detected and classified into four categories (open, closed, yawning, and no yawning). Subsequently, a dataset of 2900 images of eye conditions associated with driver sleepiness was used to test the models, which include a different range of features such as gender, age, head position, and illumination. The results of the devolved models show a high degree of accountability, whereas the CNN model achieved an accuracy rate of 97%, a precision of 99%, and recall and F-score values of 99%. The VGG16 model reached an accuracy rate of 74%. This is a considerable contrast between the state-of-the-art methods in the literature for similar problems.

1. Introduction

Drowsiness, defined as a feeling of sleepiness, may lead to the following symptoms: reduced response time, an intermittent lack of awareness, or the presence of microsleeps (blinks lasting more than 500 milliseconds). A lack of sleep affects thousands of drivers who drive on highways daily, including taxi drivers, truck drivers, and people traveling long distances. Moreover, the feeling of drowsiness reduces drivers’ degree of attention, resulting in hazardous conditions. This significantly increases the possibility of drivers missing road signs or exits, drifting into other lanes, or even becoming involved in accidents and is one of the major contributing factors to accidents on the road. Globally, fatalities and injuries have increased yearly due to driver drowsiness while driving. Nowadays, artificial intelligence (AI) has become a significant factor in resolving many global issues. An instance of this is in the reduction in the number of accidents on the road that are caused by drowsiness via safety driver drowsiness detection technology that can help prevent accidents caused by drivers who fall asleep while driving. A multitude of behavioral and overall health issues, including impaired driving performance, have been related to sleep disturbances. Thousands of accidents worldwide are caused by insufficient sleep, exhaustion, inadequate road conditions, and weariness [1]. The public health administration is concerned about the potential involvement of inadequate driving, asleep-in-traffic accidents, deaths, and injuries that have been increasing because of such issues. Table 1 shows the ratio of accidents and percentage of fatalities and injuries attributable to drowsy driving in the Kingdom of Saudi Arabia [2], the United Kingdom [3], the United States [4], and Pakistan [5].
The main contribution of this study is to develop a drowsiness detection system using computer vision techniques to identify a driver’s face in the images, then use deep-learning techniques to predict whether the driver is sleepy/drowsy or not based on their face image in a real-time environment. Moreover, this is a first-of-its-kind study in Saudi Arabia to be conducted on a public and diversified dataset that is very much aligned with regional aspects such as facial features, gender-based features, etc. In most of the studies in the literature, accuracy was considered to be the only figure of merit or the sole evaluation metric, while other metrics, such as precision, recall, and F1-score, are missing, despite their ability to comprehend a model’s effectiveness in a variety of ways. In this proposed study, all four metrics are investigated, and a 99% value is obtained for precision, recall, and F1-score, while the accuracy is 97%. This makes the proposed model distinct from the others. Finally, the proposed study primarily investigates two models—one of which is the designed CNN model and the other a pretrained model—and contrasts their effectiveness, finding that the CNN outperforms the alternative.
To accomplish this, a deep-learning model is developed and trained on a dataset obtained from Kaggle, a web-based data science platform from which data and machine learning researchers may discover and share datasets for analysis and model development. This study potentially contributes to the Saudi Vision 2030 for smart cities and road and public safety while driving, especially on highways, where there is a relatively higher speed limit and more potential for road accidents.
In terms of theoretical contribution, this study provides a comprehensive review of related studies in the literature, finds a research gap, and describes the motivation behind this study, especially from a KSA perspective. As far as the practical contributions are concerned, the proposed approach provides practices to be implemented by the administration and road safety departments to detect drivers’ conditions and prevent fatal accidents on the road in real time. Overall, this study is a good contribution to the existing body of knowledge.
The rest of this paper is structured as follows: Section 2 provides the related work in the literature, while Section 3 highlights the dataset and its potential features used in this study. The proposed model’s description and deployment are provided in Section 4, and an evaluation is performed in Section 5. Section 6 concludes this paper.

2. Related Work

The study in [6] proposed to detect driver drowsiness based on eye state. A dataset was created with 2850 images separated into different classes. In this paper, a novel framework based on deep learning is developed to identify driver fatigue while driving a car. The Viola–Jones face detection method is utilized to recognize the eye area, a stacked deep convolution neural network is created to determine important frames in camera sequences, and the SoftMax layer in a CNN classifier is used to classify if the driver is sleeping or non-sleeping. As a result, the model achieved an improved accuracy of 96.42% compared with traditional CNN. In [7], the authors utilized a forward deep-learning CNN to identify driver sleepiness. The authors used two datasets: the Closed Eye in the Wild dataset (CEW) and the Yawing Detection Dataset (YawDD). The proposed model achieved an accuracy of 96%. Similarly, another study [8] proposed a video-based model using ensemble CNN (ECNN), which is comprised of four different CNN architectures to measure the degree of sleepiness. The authors used the YawDD dataset, which consists of 107 images, and a 93% F1-score was achieved using the proposed ECNN. The authors aim to investigate a more balanced and larger dataset in the future for improvement. The authors of [9] used recurrent neural networks (RNNs) and CNNs to detect drowsiness as well as a fuzzy logic-based approach to extract numeric data from the images. It was carried out using the UTA Real-Life Drowsiness Dataset (UTA-RLDD), which includes 60 videos. RNN and CNN achieved 65%, whereas fizzy logic obtained 93%.
Florez et al. [10] proposed a drowsy driving detection system via real-time eye status identification using three deep-learning algorithms, namely InceptionV3, VGG16, and ResNet50V2. In this regard, they used the dataset named NITYMED, containing drivers’ videos with diverse drowsiness states. The technique was promising in terms of detection accuracy.
Utaminingrum et al. [11] conducted research on rapid eye recognition using image-processing techniques based on a robust Haar sliding window while utilizing a private dataset collected in Malang City. The proposed approach achieves 92.40% accuracy. The technique was not robust against the variable lighting conditions, and the authors aimed to make it robust, faster, and precise in their future study.
Budiyanto et al. [12] conducted a study on a private dataset to develop an eye detection system based on image processing for vehicle safety. They have achieved 84.72% accuracy when the facial situation is upright and slanted no more than 45 degrees. The major shortcoming of the study is that eye identification was more effective at particular light intensity values and facial positions. Li et al. [13] carried out a study to detect fatigue while driving to improve traffic safety. They suggested a new detection method f based on facial multi-feature fusion and applied it to an open-source dataset named WIDER_ FACE [14]. The proposed method has obtained good results with 95.10% accuracy. However, there is still a need for enhancement in some areas, such as high intrusiveness and detection performance in complicated surroundings. Hazirah et al. [15] used a computer vision approach named PERCLOS and support vector machine (SVM) to categorize eye closeness for observing driver concentration and tiredness. They also compare the performance of the proposed approach for RGB and grayscale images. The approach achieves an accuracy of 91% on photos with lenses, while photos without lenses scored 93% accuracy. Furthermore, the trials reveal that RGB images outperform grayscale images in terms of classification accuracy, whereas grayscale images outperform RGB images in terms of processing time. The study has one limitation: it employed an unpublished, private dataset. In a recent study conducted in [16], an innovative real-time model was developed utilizing computer vision techniques to identify instances of driver fatigue or inattention. The primary objective of the model is to enhance driving safety by alerting drivers when there are signs of inattention or fatigue. To carry out this study, a significant dataset of videos was collected, which was analyzed using the Viola–Jones algorithm. This algorithm consists of four stages, including Haar feature selection, constructing an integral image, AdaBoost for training, and cascade classifiers for detecting faces. Through this methodology, the authors were able to achieve an accuracy exceeding 95%.
A recent study [17] employed SVM to detect drowsiness by conducting image segmentation and emotion detection, specifically tracking facial expressions such as eyes and mouth movement, using a private dataset. Additionally, the model exhibited robustness to changes in illumination, enabling it to perform effectively in varying lighting conditions with an accuracy of 93%. To further optimize the performance, the researchers also intend to enhance the model’s adaptability to various environmental conditions. The authors of [18] introduced an image-processing method to identify sleepiness by assessing the conditions of the mouth, eyes, and head. The authors presented a new and effective methodology, influenced by the human visual system (HVS) [19]. In the proposed algorithm, a private dataset was pre-processed to reduce noise and guarantee illumination invariance. Subsequently, the behavior of the mouth, eyes, and head were extracted to aid in detecting the driver’s drowsiness. Based on these three features, a new algorithm is developed to determine whether the driver is drowsy based on head dropping, yawning, and closed eyes. The proposed model yielded an accuracy of 90%. Another study [20] proposed a detector for detecting blinking and drowsiness using a pre-trained CNN based on Dlib features. The detector computes Euclidean distance between recorded eye coordinates to estimate eye aspect ratio (EAR). Moreover, the CNN was trained using the HAAR cascade algorithm to detect facial features. The dataset employed in this study consisted of 17,000 images. Furthermore, the model’s performance was evaluated in varying facial angles and low-light conditions using an infrared camera, and it achieved a satisfactory accuracy of 99.83%. In a research study conducted by the authors of [21], a vision-based system for driver drowsiness detection was developed. The system employed the histogram of oriented gradient (HOG) technique for feature extraction and the Naïve Bayes (NB) algorithm for classification. A dataset named NTHU-DDD, consisting of 376 videos, was used to train and evaluate the proposed model, which achieved an accuracy of 85.62%. To enhance the model’s generalization capability, the authors plan to utilize different datasets in their future research.
In another study [22], the objective was to reduce the number of accidents caused by tired and sleepy drivers. To identify significant facial characteristics, shape prediction techniques are applied. OpenCV’s built-in HAAR cascades performed face detection. A dataset named iBUG-300w, containing 300 indoor and outdoor images, was used. When the face is properly aligned, and there are no wearing obstructions, the accuracy is almost 100%. In [23], the authors aimed to create a system that can determine a driver’s level of weariness using a series of images that are taken such that the subject’s face is visible. Two different approaches are developed, focusing on reducing false positives, to determine if the driver shows sleepiness symptoms or not. The first uses a recurrent CNN (RCNN), whereas the second option uses deep learning to extract numerical information from photos, which are then added to a fuzzy logic-based system. UTA Real-Life Drowsiness Dataset (UTA-RLDD) is used with videos of 60 distinct individuals in two different states: awake and drowsy. Moreover, this dataset is realistic. Both alternatives achieved comparable accuracy levels: roughly 65% on training data and 55–65% on test data. In [24], authors proposed an approach that uses machine learning to identify sleepiness from images. To categorize eyes as open or closed, CNN was used. In this regard, the media research lab’s eyes dataset is used. Various eye images of males and females closed or open, glasses on or off, and eyes that reflect light in intensities are included in the dataset. The approach obtained training and testing accuracies of 98.1% and 94%, respectively.
In [25], the main goal was to create a system that accurately assesses a driver’s level of drowsiness based on the angle of their eyelids. The system was dependable enough to send the appropriate notifications as well as email emergency contacts. OpenCV is used for face detection, and it also works with the EAR function. If a person is not facing the camera, the result of this research states that the eyeballs cannot be detected. In [26], the authors aimed to build a computer vision-based model to observe the condition of the eyes and mouth to identify the weariness state of the driver to provide a good safety tool. The dataset comprised 16,600 images with eleven features. The authors utilized four distinct algorithms, which are random forest, k-nearest neighbor (kNN), general regression neural network, and genetic algorithm-based RNN (GA-RNN), to contrast the results. The best-performing algorithm with high generalization and solidity was the GA-RNN, with an accuracy of 93.3%. A recent study conducted by Chand and Karthikeyan [27] provides a deep-learning model to detect drowsiness and analyze emotions to predict the status of the driver and prevent car accidents. The authors used an image dataset of size of 17,243 containing four different classes (normal, fatigue, drunk, reckless) to build the system. They employed the SVM, kNN, and CNN algorithms to investigate the outcome. The CNN was the outstanding algorithm with a high accuracy of 93%.
A study by Phan et al. [28] intended to utilize deep-learning algorithms to build a system for recognizing the driver’s fatigue status and firing an alarm to wake the user. For this research, the authors used a mixed dataset of 16,577 images and videos to deliver a binary classification (drowsiness and non-drowsiness). They applied two deep-learning algorithms to conduct this experiment, which are the MobileNet-V2 and ResNet-50V2. The best model performance for the study was the ResNet-50V2, with an accuracy of 97%. As a limitation of this work, the study delivers a binary classification of the problem, where, in real life, detecting the yawning is also important to prevent any future accidents. The study by Zhao et al. [29] proposed a driver drowsiness detection system using facial dynamic fusion information and a deep belief network (DBN) with a private dataset. The system achieved an accuracy of 96.70% in detecting driver drowsiness using dynamic landmark and texture features of the facial region. The proposed system has significant potential for improving road safety and could also have applications in sleep medicine. The authors compared their approach with state-of-the-art methods and found it outperformed them in terms of accuracy, robustness, and efficiency. However, the only limitation is that a private dataset was used. Overall, this study represents an important step toward the development of reliable and accurate driver drowsiness detection systems.
A study by Alhaddad et al. [30] proposed an image-processing-based system for detecting driver drowsiness using EAR and blinking analysis. The study used a private dataset and achieved a detection accuracy of 92.10%. The system used the Dlib library for facial landmark detection and EAR calculation to detect the driver’s drowsiness. The study’s contribution lies in its ability to accurately detect drowsiness regardless of the size of the eye, demonstrating the effectiveness of image-processing methods for drivers’ drowsiness detection. Guede-Fernández et al. [31] aimed to develop a novel algorithm for monitoring a driver’s state of alertness by analyzing respiratory signals. The researchers used a quality signal classification algorithm and a Nested LOSOCV algorithm for model selection and assessment. The novel algorithm, called TEDD, was validated using a private dataset, achieving an accuracy of 96.6%. The techniques include signal processing, feature extraction, and machine learning. The results suggest that respiratory signal analysis can be an effective approach for drowsiness detection in drivers.
Vishesh et al. [32] developed a computer vision-based system to detect driver drowsiness in real time using eye blink detection. The authors used a CNN and OpenCV for image processing and feature extraction, along with a new method called horizontal and vertical gradient features (HVGFs) to improve accuracy. The study used an eye blink dataset consisting of eye images from 22 participants. CNN was trained on 80% of the dataset and tested on the remaining 20%, achieving an accuracy of 92.86% in detecting eye blinks. However, based on the experimental outcome, the proposed method can achieve an accuracy of 97%. The relationship between the rate of eye movement and the level of driver drowsiness was also analyzed. The authors found a correlation between the rate of eye movement and the degree of drowsiness, which could help detect and prevent accidents caused by driver fatigue. The study concluded that the proposed system could effectively detect driver drowsiness and be integrated with existing driver assistance systems to improve road safety. The developed prototype serves as a base for further development and potential implementation in vehicles to reduce the risk of accidents caused by drowsy driving.
Mehta et al. [33] developed a real-time driver drowsiness detection system using non-intrusive methods based on EAR and eye closure ratio (ECR). The system uses a webcam to capture images of the driver’s face and extracts features from the eyes using EAR and ECR. The study used a dataset comprised facial images of 10 subjects recorded while driving. The authors manually annotated the images to indicate whether the driver was drowsy or not. The dataset was split into a training set (80%) and a testing set (20%). Moreover, the authors used a random forest (RF) to classify the drowsy and non-drowsy states of the driver based on the EAR and ECR features. The proposed model achieved an accuracy of 84% in detecting driver drowsiness. Finally, the study concluded that the proposed system could be used as a part of a driver monitoring system to improve road safety. However, the system’s performance can be further improved using a larger dataset and robust classification algorithms.
Another study [34] aimed to classify drowsy and non-drowsy driver states based on respiration rate detection using a non-invasive, non-touch, impulsive radio ultra-wideband (IR-UWB) radar. A dataset was acquired, consisting of age, label (drowsy/non-drowsy), and respiration per minute. Different machine learning models were used in the study, namely, SVM, decision tree, logistic regression, gradient boosting machine (GBM), extra tree classifier, and multilayer perceptron (MLP). As a result, SVM achieved the best accuracy of 87%. A study conducted by the authors of [35] aimed to develop a system to reduce accidents caused by the driver’s drowsiness. The dataset was developed and generated by the authors. In this study, images are preprocessed using the Haar cascade classifiers to methodically improve the CNN model’s hyperparameters. The performance of the model is measured using a variety of metrics, including accuracy, precision, recall, F1-score, and confusion matrix. Therefore, the model classified the input data with 97.98% accuracy, 98.06% precision, 97.903% recall, and 97.981% F1-score.
In [36], the objective of the study was to develop a system that can recognize drowsy driving and warn the driver to prevent accidents. Images were gathered from the online public dataset titled “Driver drowsiness”, available on the Kaggle website. The Naïve Bayes region of interest (NB-RoI) algorithm is used to detect the eyes, and a single-layer artificial neural network (ANN) algorithm is utilized for labeling the eyes as “drowsy” or “alert” based on the detection of eye closure. Accuracy and miss rate are the performance measures used in the study. The ANN model achieved 81.62% accuracy and a miss rate of 18.38%.
A comprehensive summary of the reviewed literature is presented in Table 2, which emphasizes the type of dataset, methods, and algorithms used, and the best results obtained in this study. From the table, it is evident that driver drowsiness detection is among the hottest and emerging areas of research in public and road safety, which needs more research to improve the performance of the classification algorithms for observing the drivers’ behavior, especially in real-time environments [37].

3. Data Acquisition and Preprocessing

This section focuses on the dataset description and preprocessing, etc., followed by the model development phase and finally the evaluation and comparison. In this regard, the data flow chart is given in Figure 1. That depicts all the steps included in this study, starting from the literature review, then dataset selection criteria, data pre-processing, proposed model development, and finally, the analysis and evaluation of the results obtained via a variety of experiments. The dataset was obtained from public data sources like Kaggle, and after due preprocessing, the model was built. Though the dataset contains some demographic features like gender, age group, etc., they were not explicitly used in the analyses, like gender-based or age-group-based analyses.

3.1. Dataset Description

Driver downiness dataset is publicly available at Kaggle [38] for training and testing the model. The dataset contains 2900 images divided into four categories based on the degree of sleepiness (open, closed, yawning, and no yawning). The dataset provides a clear understanding of the different eye conditions captured in the dataset. In addition to the eye condition labels, the dataset also includes several important features that enhance the analysis of driver sleepiness. The gender feature reveals the gender of the driver in the images, enabling the exploration of potential variations in sleepiness patterns between different genders. The age feature categorizes the drivers into specific age groups, facilitating investigation into any notable differences in sleepiness patterns across various age ranges. The head position feature describes the orientation of the driver’s head in the images. It offers valuable insights into how the head position relates to the manifestation of sleepiness and whether specific positions are more prevalent among drowsy drivers. Lastly, the illumination feature characterizes the lighting conditions present in the images, which is crucial for accurate facial recognition tasks. Understanding the impact of illumination on detecting driver sleepiness plays a vital role in developing robust and effective models for this domain. In terms of gender and age group, the dataset is almost evenly distributed. Around 1490 images are male, and 1410 images are from female drivers. There are three age brackets, namely young, middle aged, and elderly. There are 1100, 1000, and 800 images in each group, respectively. Nonetheless, in the analyses, these features were not considered but rather planned for the future expansion of the study. The dataset consists of 726 images of the open class, 726 images of the closed class, 725 images of the yawn class, and 723 images of the non-yawn class.

3.2. Dataset Pre-Processing

Data pre-processing is one of the most important steps that improve the efficiency of any classification problem, as it helps to clean and transform the data into more understandable and ideal formats. Google Colab [39] was used to pre-process the dataset and develop the models. Initially, we extracted the face from the image without its background since it was irrelevant and distracting. After that, the images were resized to (145 × 145) for the CNN model and (64 × 64) for the VGG16 model, as required via VGG. Furthermore, the dataset was converted into a NumPy array. The labels of the dataset’s images are categorized into (open, closed, yawn, and no-yawn). Thus, we performed one-hot encoding techniques on the labels to transform the categorical target labels into 0, 1, 2, and 3. It was carried out using the LabelBinarizer() method from the sklearn library, with mapping 0 for yawn, 1 for no yawn, 2 for closed, and 3 for open. Additionally, the dataset was divided into training and testing datasets, where 70% of the dataset was for training the model using CNN and VGG16 to predict the nature of drowsiness, while 30% was for testing and evaluating the final model performance. Finally, to improve the robustness of the model, data augmentation method namely ImageDataGenerator was utilized to increase the dataset and ensure that the model receives different variations of the image in terms of rotating the image to different angles.

4. Proposed Model Development and Training

4.1. Model Description

In deep learning, a sequential CNN is a type of artificial neural network that filters inputs into valuable information using three types of layers. Firstly, the input layer, where we feed images to the model, and the overall number of pixels in an image mirrors the number of neurons in this layer. Secondly, it uses hidden layers in which the output from the input layer is fed into it. The number of hidden layers is determined via the model and the amount of data. Every hidden layer might have a varied number of neurons, which is usually more than the number of pixels in the image. Thirdly, the output layer, where the hidden layer’s output is passed into a logistic function, which turns each class’s output into its likelihood score. The result of applying filters to each layer image is captured via a CNN’s feature map. The goal of visualizing a feature map for a given set of images is to broaden the knowledge of the features detected using the proposed CNN. In this study, CNN has been employed for detecting the level of drowsiness of a driver by identifying the state of the eye. The model’s performance heavily relies on the number of images available in the dataset, and 2900 images were sufficient to adequately train the proposed model. The CNN model layers used were Conv2D, MaxPooling2D, Flatten, Dropout, and Dense, respectively [40]. Each layer is briefly described subsequently.

4.1.1. Conv2D Layer

Keras Conv2D is a two-dimensional convolution layer that generates a tensor of outputs by winding a convolution kernel with the layer input. To illustrate further, the kernel is a convolution matrix or mask that could be used to blur, sharpen, emboss, identify edges, and more by performing a convolution between a kernel and an image. In this layer, the kernel slides over two-dimensional data and executes element-wise multiplication with results that are added together to obtain a single output from the operation. In the case of a colored image containing three color channels, red, green, and blue (RGB), the two-dimensional convolution process is performed separately for each channel, and the results are combined for the final output [41], as shown in Figure 2.

4.1.2. MaxPooling2D Layer

The pooling operation entails passing a two-dimensional filter across every channel of the feature map and epitomizing the features that fall inside the filter’s coverage zone. Max pooling is a pooling operation that picks the peak element out from the feature map area enclosed via the filter. As a result, the production of the max-pooling layer would become a feature map that contains the most prominent features of those in the prior feature map [42].

4.1.3. Flatten Layer

Flattening is the way of converting a matrix derived from convolutional and pooling layers into a single features vector while maintaining batch size. This layer is essential since the input to ANNs contains a one-dimensional array [43].

4.1.4. Dropout Layer

A dropout layer is a layer that prevents some neurons from contributing to the next layer and leaves the rest unmodified. This layer is used to train data that suffer from overfitting. If this layer is missing, the first batch of training samples will have a disproportionately negative impact on later samples, preventing them from features learning that are only present in later samples. The dropout layer results in a significant improvement in the basic architecture and builds a better implicit mode [44].

4.1.5. Dense Layer

The dense layer is an unpretentious layer containing neurons. All neurons transmit inputs to each neuron in this layer. The output from the convolutional layers is used to classify the image by the dense layer. This process results in a structure that achieves accurate results with a few components and parameters for a single group of operations [].

4.2. Model Development

4.2.1. Haar Cascade Classifier
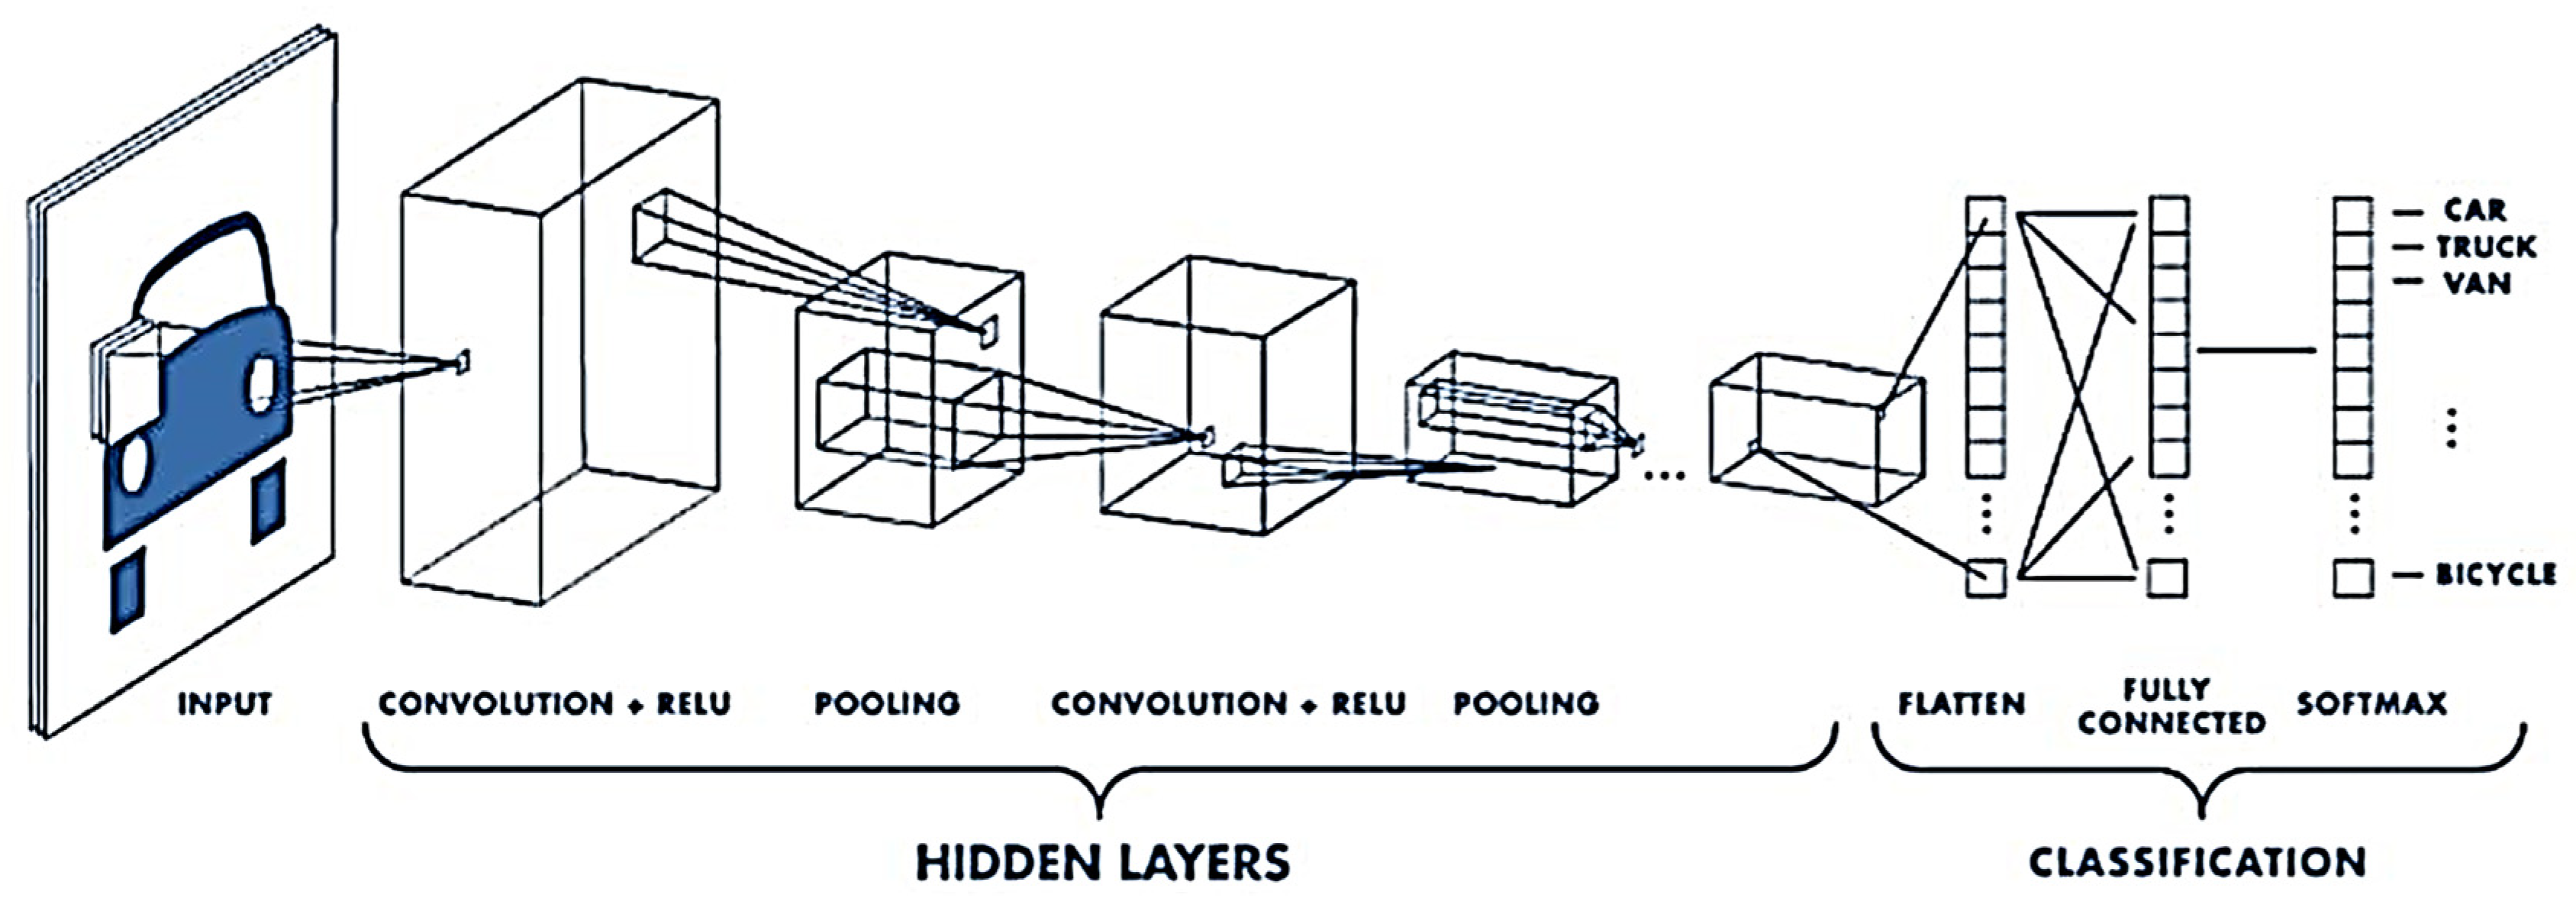
The Haar cascade classifier is a well-known and widely used technique in computer vision due to its effectiveness in detecting objects with high accuracy. In this study, the Haar cascade classifier was employed as a machine learning-based object detection algorithm with the primary aim of detecting faces. After successful face detection, the image processing pipeline cropped and resized the detected face regions, which were then stored with class labels. The standardized format of cropped and resized face regions facilitated further processing and analysis, such as feature extraction and classification. Moreover, the Haar cascade classifier was chosen for its effectiveness in detecting faces with a high level of accuracy, which was vital in achieving reliable results in the research.

4.2.2. CNN Model

The CNN architecture was developed to train the model to identify the eyes and mouth state of a driver to detect the level of drowsiness. The architecture consists of a Conv2D layer with a “relu” activation function and “he_normal” kernel initializers, along with MaxPooling2D, Flatten, and Dropout layers. Finally, a dense layer with a “softmax” activation function is employed since the classification output is multilabel.

4.2.3. VGG16 Model

The CNN architecture was used to train the transfer learning model VGG16 on the large ImageNet dataset [45]. The model is composed of sixteen layers: thirteen convolutional layers and three dense (fully connected) layers. As a starting point, the knowledge that the model gained throughout training may perform well in assessing the level of drowsiness. The Keras framework was used to load the model and its weights. Furthermore, a flattened layer was included for flattening the outcome of the VGG16 model to be utilized as an input for the fully connected layer (dense). Finally, a dense output layer with a “softmax” activation function was included.

4.3. Model Training

The purpose of the model training procedure is to discover the best set of parameters for generalizing new data while avoiding overfitting and underfitting. Several optimization and regularization approaches were used to train the model throughout this phase.

4.3.1. Optimization Techniques

Since this is a multiclassification problem, the “categorical_crossentropy” loss function was used to allow the optimization algorithms, such as Adam, to alter the model parameters during the training to generate the least potential loss. Furthermore, an appropriate learning rate was set to assist “Adam” in updating the model parameters.

4.3.2. Regularization Techniques

Regularization techniques were utilized to prevent overfitting. L2 regularization was utilized in the VGG16 model, which helped in improving the performance of the model. In addition, an early stopping technique was employed in both models, which allows for specifying many training epochs while monitoring the performance of the model. This technique will stop the training process once the model performance stops improving to avoid overfitting and to increase the generalization of the model.

5. Proposed Model Evaluation

This study used four performance measures to evaluate the model and its classification performances, which are accuracy, precision, recall, and F1-score. The number of right predictions made in the model across all types of predictions is referred to as accuracy. Precision, on the other hand, calculates the total number of true positive predictions in the positive class, whereas recall determines the total number of true positive predictions in all positive examples, and the F1-score is a weighted average of both the precision and the recall. Subsequently, the equations show the formulas for each performance measure. True Positives (TP) is when the actual and predicted data are both positive. True Negatives (TN) is when the actual and predicted data values are both negative. False Positives (FP) is when the actual data is negative while the predicted data is positive. False Negatives (FN) are when the actual data is positive, but the predicted data value is negative [45].

5.1. Evaluation Metrics

Accuracy and error are commonly used to evaluate the performance of deep-learning models. They show the relationship between the predicted and actual values of the model. To assess the performance of the proposed model on the given datasets, four measures are used: accuracy, F-score, recall, and precision. Further, intelligent methods are used in many health informatics [46,47,48,49,50], data visualization [51,52,53,54,55], and other related areas [56,57,58].
  • Accuracy: The result of dividing the number of true classified outcomes by the whole of classified instances. The accuracy is computed using the equation:
Accuracy = TP + TN TP + TN + FP + FN
  • Recall: The percentage of positive tweets that are properly determined using the model in the dataset. The recall is calculated using
Recall = TP TP + FN
  • Precision: The proportion of true positive tweets among all forecasted positive tweets. The equation of precision measure is calculated using the following:
Percision = TP TP + FP
  • F1-score: A harmonic mean of precision and recall. The F-score measure equation is
F 1 score = 2 × Precision × Recall Precision +   Recall

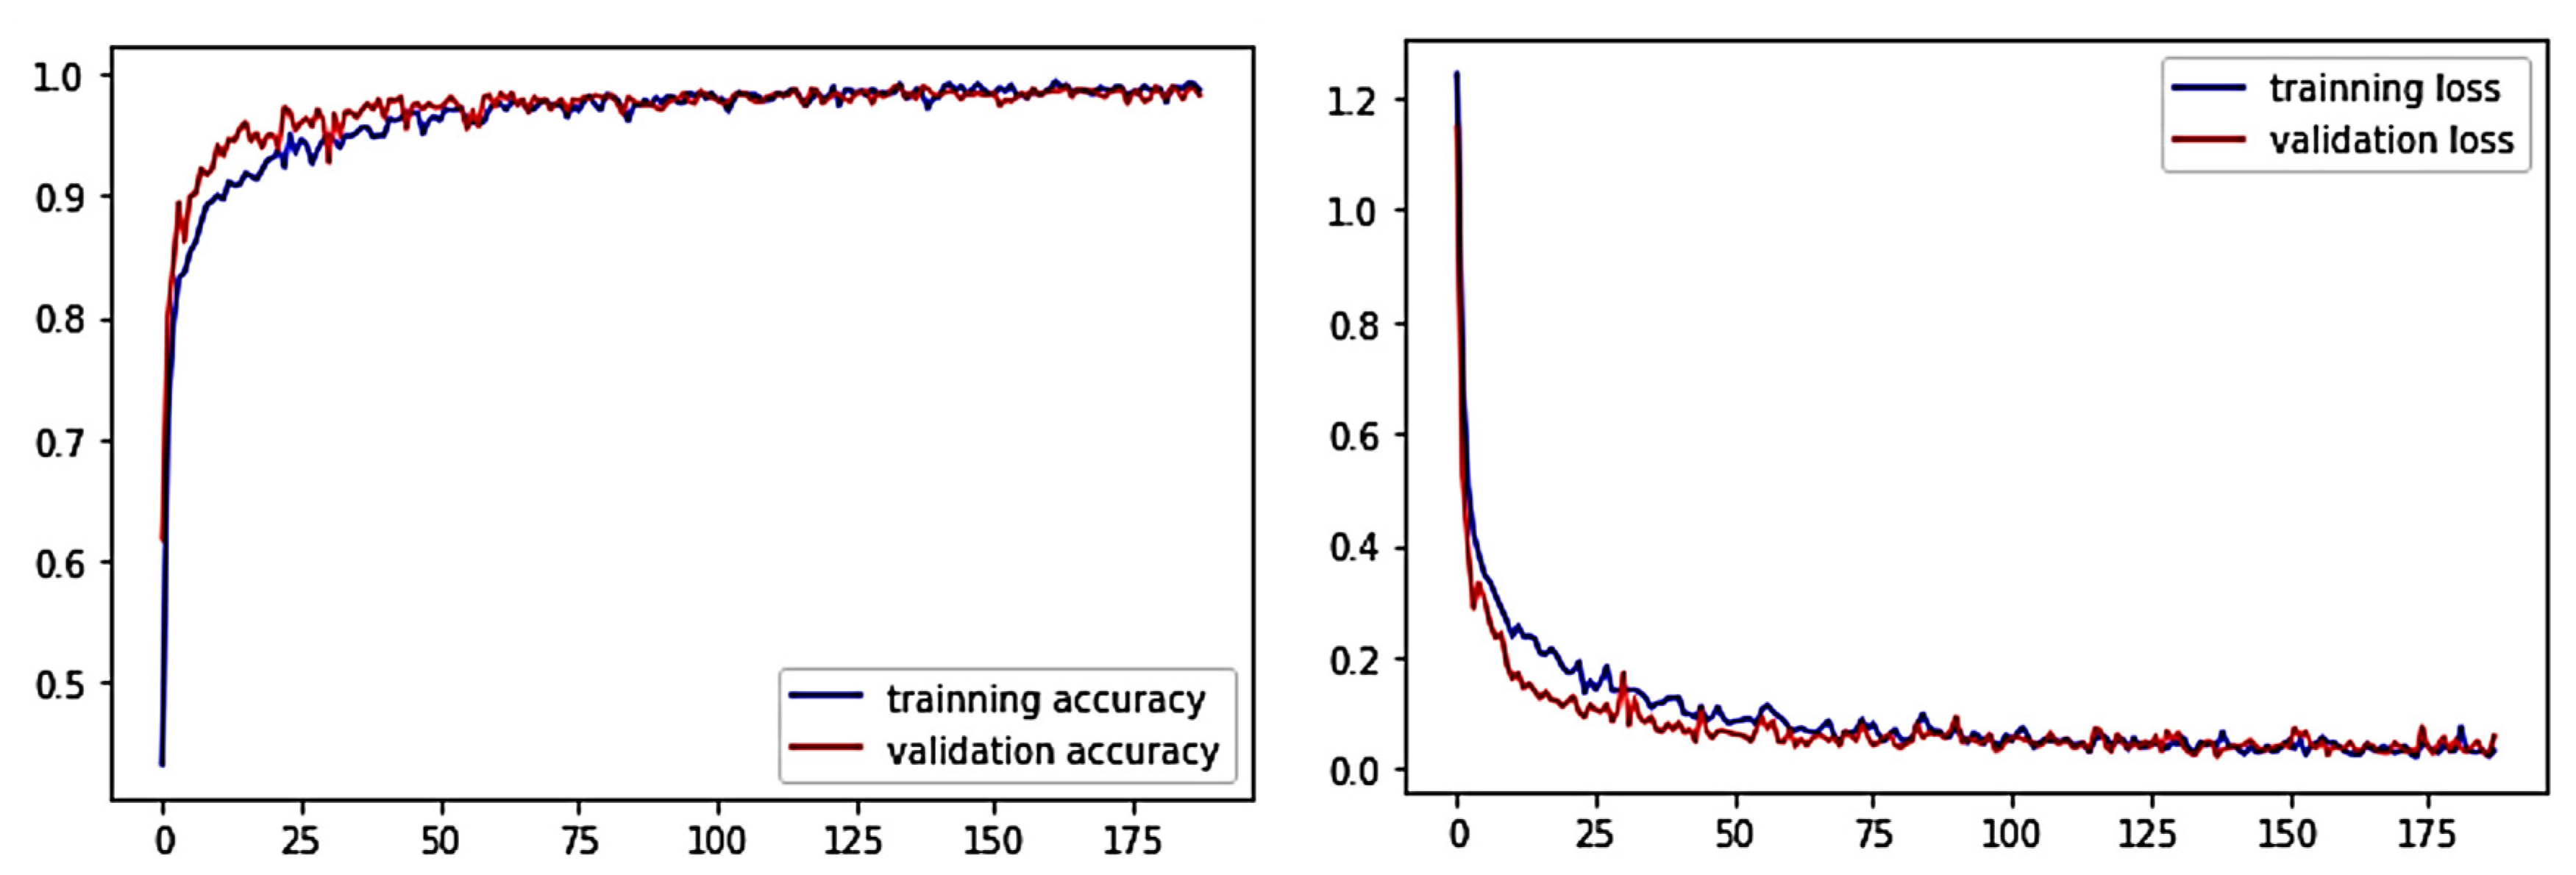
5.1.1. CNN Model Evaluation

The developed CNN model achieved an accuracy of 97% in the detection of the driver’s level of drowsiness. Table 3 shows the classification report, which displays the precision, recall, F1, and support scores for each class in the CNN model.
Figure 3 shows the history of fitting the CNN model, which displays the accuracy and the loss plots on the training and validation datasets throughout training epochs, respectively. It is apparent that after 20 epochs, algorithms start converging in both the training and validation phases. Similarly, the loss begins to taper off towards the zero line, as shown in the later part of the figure.

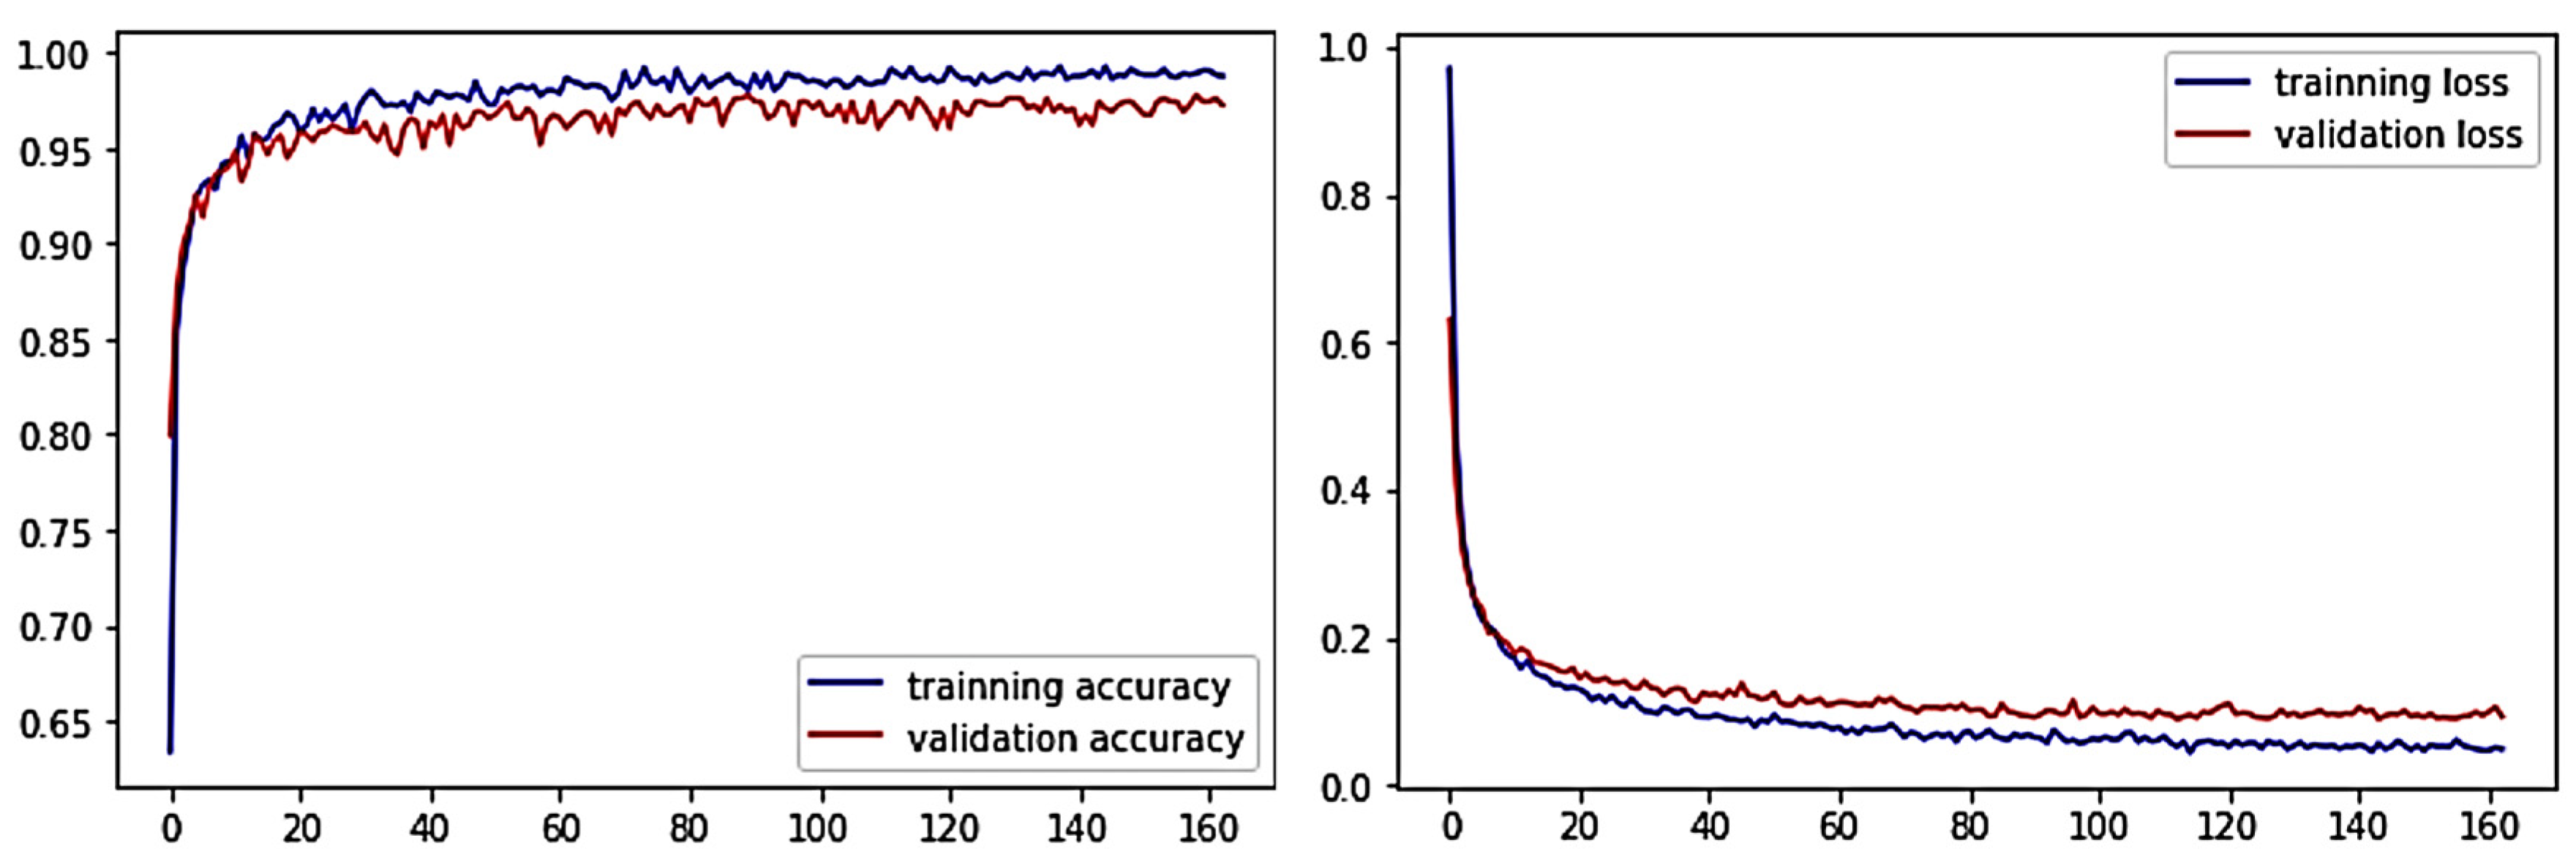
5.1.2. VGG16 Model Evaluation

The customized VGG16 model achieved an accuracy of 74% in detection of the driver’s level of drowsiness. Table 4 shows the classification report, which displays the precision, recall, F1, and support scores for each class in the VGG16 model.
Figure 4 shows the history of fitting the CNN model, which displays the accuracy and the loss plots on the training and validation datasets throughout training epochs. It is apparent that immediately after 20 epochs, the system starts converging, and after a few tens of epochs, the error goes to zero approximately. That indicates that the system has reached a steady state.

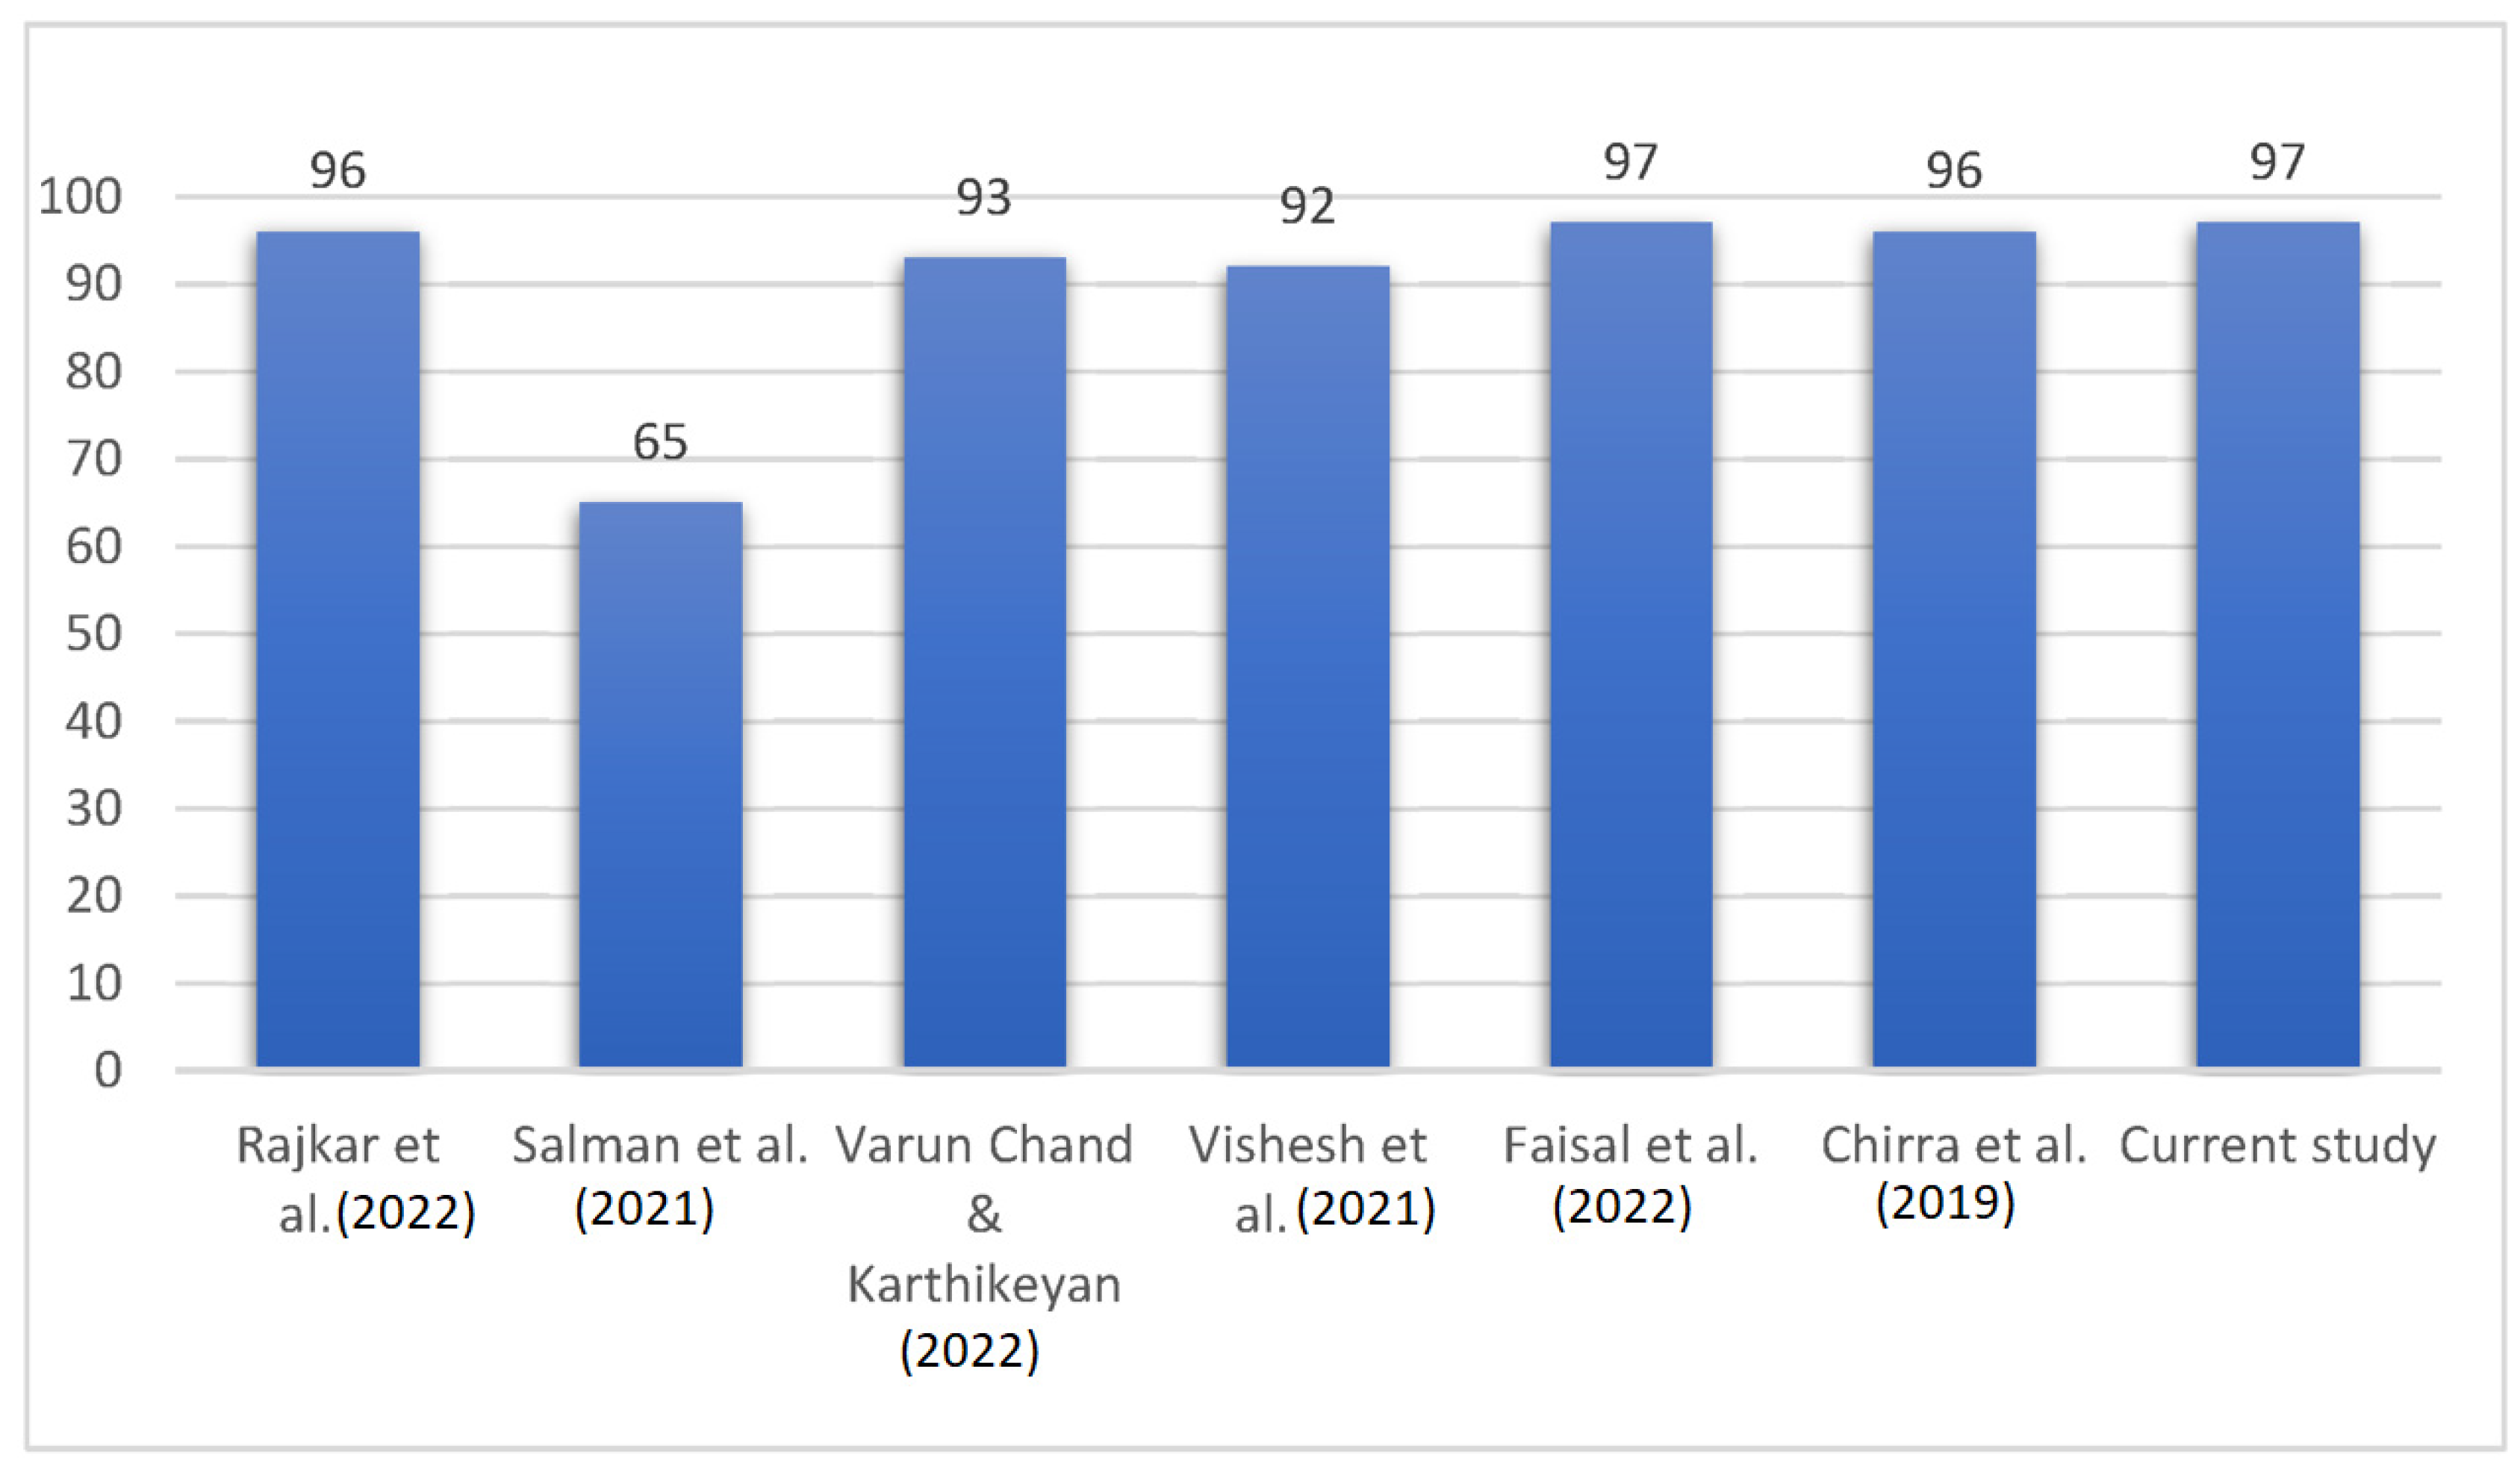
5.1.3. Comparative Analysis

Figure 5 shows a histogram that contrasts the results of this study with the results of other investigations that used CNN to detect driver drowsiness. The proposed scheme exhibits an accuracy of 97%. Although the study of [35] has the same results and studies [6,7] have obtained results close to the proposed results in terms of accuracy, the proposed scheme exhibits better precision, recall, and F1-score compared to these studies where these metrics are not considered for their models’ evaluation.

5.1.4. Statistical Analysis

In practice, Welch’s t-test is used to test the hypothesis that two populations have equal means and unequal variances, also known as the unequal variance t-test [59]. In this current study, it is sensible to perform this test since the classes are nearly balanced. Since the test is applicable to the binary populations, the four classes are added to two, that is, open-eye and now-yawning classes with 1449 instances and closed-eye and yawning classes with 1451 instances, respectively. Upon calculation [60], the t value was obtained as 8.133821. Since the absolute value of the test statistic 5.132 was not larger than the obtained t value, the null hypothesis of the test cannot be rejected. Hence, there is not sufficient verification to state that the mean values of the two populations are considerably distinct. This proves that this study is statistically valid.

5.1.5. Discussion

This proposed study addresses the problem of driver’s drowsiness detection using deep-learning approaches. In this regard, a state-of-the-art dataset has been obtained from public data sources. The evaluation of this study reveals its effectiveness in terms of accuracy, precision, recall, and F1-score. In contrast to the state-of-the-art approaches, this study possesses a good accuracy of 97%. Though some studies also reveal the same score in terms of accuracy, their evaluation in terms of other metrics such as precision, recall, and F1-score are either not available or poor in contrast to this proposed study, which exhibits 99% for all the metrics, respectively. Moreover, this study hypothesized and evaluated using Weltch’s t-test [61] and was proven valid. This study is potentially applicable to road and public safety applications. The feature can be added to the surveillance cameras to detect the drivers’ conditions, and precautionary measures can be taken based on the outcome. As far as the limitations of this study are concerned, it is mainly based on the public dataset with assumptions that the images are clear and the face was unveiled. Moreover, the analyses based on gender and age group are not conducted in the current study and planned expansion of the proposed approach. For the diverse datasets with various face orientations, the system’s effectiveness may not be the same. This study is an incremental approach that takes the existing research to the next level in terms of enhancement in performance and improved results. Moreover, this study provides a new direction for future research by exploiting more features of the dataset such as gender, age group, face orientation, face with veil, makeup, mask, etc., as in KSA, most lady drivers prefer to wear a veil while driving.

6. Conclusions and Future Work

In conclusion, this research aims to investigate deep learning to detect driver drowsiness and accurately classify it into four groups: closed, open, no yawn, and yawn. To achieve accurate results, the dataset (drowsiness dataset) consisting of 2900 images was used and trained in this project. The CNN technique is effective in this task of classifying the different drowsiness categories classified as four various classes. The CNN model structure of Conv2D, MaxPooling2D, Flatten, and Dropout layers helped with enhancing the performance of detection. Thus, the CNN modeling technique achieved the best results among all the benchmark studies with an accuracy of 97%, precision of 99%, and recall and F1 score of 99%. In contrast to the state-of-the-art approaches, the proposed study exhibits comparable results in terms of accuracy and outperforms in terms of precision, recall, and F1-score. This proposed study is a potential contribution towards road and public safety, especially in metropolitan areas, highways, and smart cities. Public administration and governmental agencies can be the potential stakeholders of the study, especially in the Kingdom of Saudi Arabia. The idea can be implemented via smart surveillance and integrated into the traffic monitoring systems. From Saudi Arabi’s perspective, in the future, this study can be extended to observe the conditions of female drivers wearing veils by integrating more diverse datasets. In this regard, the new dataset can be produced to add features such as gender, age group, year of driving experience, veils, makeup, eyelashes, etc. Moreover, drivers’ psychological conditions, in addition to the current features, can be added. Further, we aim to improve the efficiency of drowsiness detection systems with the help of deep-learning techniques as well as using supportive models that can be integrated with CNN to increase accuracy further and reduce the computation time.

Author Contributions

Conceptualization, M.I.B.A. and M.Y.; methodology, H.A., F.A., D.A., M.A. (Manar Alahmari), M.A. (Munira Alhumaidan) and S.A.; soft-ware, H.A., F.A., D.A., M.A. (Manar Alahmari), M.A. (Munira Alhumaidan) and S.A.; validation, M.I.B.A., A.R., G.Z. and M.Y.; formal analysis, S.A., G.Z., A.R., and F.A.; investigation, A.R., M.Y., M.A. (Manar Alahmari) and M.A. (Munira Alhumaidan); resources, G.Z. and M.Y.; data curation, M.A. (Manar Alahmari) and M.A. (Munira Alhumaidan); writing—original draft preparation, H.A., F.A., D.A., S.A., M.A. (Manar Alahmari) and M.A. (Munira Alhumaidan); writing—review and editing, A.R. and G.Z.; visualization, A.R., H.A. and D.A.; supervision, M.I.B.A. and M.Y.; project administration, M.I.B.A.; funding acquisition, H.A., F.A., D.A., M.A. (Manar Alahmari), M.A. (Munira Alhumaidan) and S.A. All authors have read and agreed to the published version of the manuscript.

Funding

This research received no external funding.

Institutional Review Board Statement

Not applicable.

Informed Consent Statement

Not applicable.

Data Availability Statement

The experiment was conducted on a public dataset, which is available with the corresponding author and can be provided upon request.

Conflicts of Interest

The authors declare no conflict of interest.

References

  1. Khan, M.A.A.; Alsawwaf, M.; Arab, B.; Alhashim, M.; Almashharawi, F.; Hakami, O.; Olatunji, S.O.; Farooqui, M.; Rahman, A. Road Damages Detection and Classification Using Deep Learning and UAVs. In Proceedings of the Asian Conference on Innovation in Technology (ASIANCON), Ravet, India, 26–28 August 2022; pp. 1–6. [Google Scholar] [CrossRef]
  2. Jamal, A.; Rahman, M.T.; Al-Ahmadi, H.M.; Mansoor, U. The Dilemma of Road Safety in the Eastern Province of Saudi Arabia: Consequences and Prevention Strategies. Int. J. Environ. Res. Public Health 2020, 17, 157. [Google Scholar] [CrossRef] [PubMed]
  3. Tavakoli Kashani, A.; Rakhshani Moghadam, M.; Amirifar, S. Factors affecting driver injury severity in fatigue and drowsiness accidents: A data mining framework. J. Inj. Violence Res. 2022, 14, 75–88. [Google Scholar] [CrossRef] [PubMed]
  4. Tefft, B.C. Prevalence of Motor Vehicle Crashes Involving Drowsy Drivers, United States 2009–2013. AAA Foundation for Traffic Safety. Available online: https://aaafoundation.org/prevalence-motor-vehicle-crashes-involving-drowsy-drivers-united-states-2009-2013 (accessed on 14 June 2018).
  5. Azam, K.; Shakoor, A.; Shah, R.A.; Khan, A.; Shah, S.A.; Khalil, M.S. Comparison of fatigue related road traffic crashes on the national highways and motorways in Pakistan. J. Eng. Appl. Sci. 2014, 33, 47–54. [Google Scholar]
  6. Chirra, V.R.R.; Uyyala, S.R.; Kolli, V.K.K. Deep CNN: A Machine Learning Approach for Driver Drowsiness Detection Based on Eye State. Rev. D’Intell. Artif. 2019, 33, 461–466. [Google Scholar] [CrossRef]
  7. Rajkar, A.; Kulkarni, N.; Raut, A. Driver drowsiness detection using deep learning. In Applied Information Processing Systems, Proceedings of ICCET 2021, Lonere, India, 30–31 January 2021; Springer: Singapore, 2022; pp. 73–82. [Google Scholar]
  8. Salman, R.M.; Rashid, M.; Roy, R.; Ahsan, M.M.; Siddique, Z. Driver drowsiness detection using ensemble convolutional neural networks on YawDD. arXiv 2021, arXiv:2112.10298. [Google Scholar]
  9. Magán, E.; Sesmero, M.P.; Alonso-Weber, J.M.; Sanchis, A. Driver drowsiness detection by applying deep learning techniques to sequences of images. Appl. Sci. 2022, 12, 1145. [Google Scholar] [CrossRef]
  10. Florez, R.; Palomino-Quispe, F.; Coaquira-Castillo, R.J.; Herrera-Levano, J.C.; Paixão, T.; Alvarez, A.B. A CNN-Based Approach for Driver Drowsiness Detection by Real-Time Eye State Identification. Appl. Sci. 2023, 13, 7849. [Google Scholar] [CrossRef]
  11. Utaminingrum, F.; Praetya, R.P.; Sari, Y.A. Image Processing for Rapidly Eye Detection based on Robust Haar Sliding Window. Int. J. Electr. Comput. Eng. 2017, 7, 823–830. [Google Scholar] [CrossRef]
  12. Budiyanto, A.; Manan, A.; Wahyuni, E.S. Eye Detection System Based on Image Processing for Vehicle Safety. Techné J. Ilm. Elektroteknika 2020, 19, 11–22. [Google Scholar] [CrossRef]
  13. Li, K.; Gong, Y.; Ren, Z. A Fatigue Driving Detection Algorithm Based on Facial Multi-Feature Fusion. IEEE Access 2020, 8, 101244–101259. [Google Scholar] [CrossRef]
  14. Wider Face: A Face Detection Benchmark. Available online: http://shuoyang1213.me/WIDERFACE/ (accessed on 10 April 2023).
  15. Rodzi, A.H.; Zin, Z.M.; Ibrahim, N. Vision based Eye Closeness Classification for Driver’s Distraction and Drowsiness Using PERCLOS and Support Vector Machines: Comparative Study between RGB and Grayscale Images. J. Phys. Conf. Ser. 2019, 1235, 012036. [Google Scholar] [CrossRef]
  16. Jose, J.; Vimali, J.S.; Ajitha, P.; Gowri, S.; Sivasangari, A.; Jinila, B. Drowsiness Detection System for Drivers Using Image Processing Technique. In Proceedings of the 2021 5th International Conference on Trends in Electronics and Informatics (ICOEI), Tirunelveli, India, 3–5 June 2021; pp. 1527–1530. [Google Scholar] [CrossRef]
  17. Dogiwal, S.R.; Sharma, V. Driver Fatigue Detection Analysis Based on Image Segmentation & Feature Extraction Using SVM. SKIT Res. J. 2020, 10, 1–5. [Google Scholar]
  18. Kholerdi, H.A.; TaheriNejad, N.; Ghaderi, R.; Baleghi, Y. Driver’s drowsiness detection using an enhanced image processing technique inspired by the human visual system. Connect. Sci. 2016, 28, 27–46. [Google Scholar] [CrossRef]
  19. Naseem, M.T.; Qureshi, I.M.; Rahman, A.; Muzaffar, M.Z. Robust and Fragile Watermarking for Medical Images using Redundant Residue Number System and Chaos. Neural Netw. World 2020, 30, 177–192. [Google Scholar] [CrossRef]
  20. Singh, G. Real Time Drivers Drowsiness Detection and alert System by Measuring EAR. Int. J. Comput. Appl. 2018, 181, 38–45. [Google Scholar] [CrossRef]
  21. Bakheet, S.; Al-Hamadi, A. A framework for instantaneous driver drowsiness detection based on improved HOG features and naïve Bayesian classification. Brain Sci. 2021, 11, 240. [Google Scholar] [CrossRef] [PubMed]
  22. Jain, M.; Bhagerathi, B.; Sowmyarani, C.N. Real-Time Driver Drowsiness Detection using Computer Vision. Int. J. Eng. Adv. Technol. 2021, 11, 109–113. [Google Scholar] [CrossRef]
  23. Kongcharoen, W.; Nuchitprasitchai, S.; Nilsiam, Y.; Pearce, J.M. Real-Time Eye State Detection System for Driver Drowsiness Using Convolutional Neural Network. In Proceedings of the 2020 17th International Conference on Electrical Engineering/Electronics, Computer, Telecommunications and Information Technology (ECTI-CON), Phuket, Thailand, 24–27 June 2020; pp. 551–554. [Google Scholar] [CrossRef]
  24. Pachouly, S.P.; Bhondve, N.B.; Dalvi, A.D.; Dhande, V.D.; Bhamare, N.B. Driver Drowsiness Detection using Machine Learning with Visual Behaviour. Int. J. Creat. Res. Thoughts 2020, 8, 2974–2979. [Google Scholar]
  25. Albadawi, Y.; Takruri, M.; Awad, M. A Review of Recent Developments in Driver Drowsiness Detection Systems. Sensors 2022, 22, 2069. [Google Scholar] [CrossRef]
  26. Wang, X.; Chen, L.; Zhang, Y.; Shi, H.; Wang, G.; Wang, Q.; Han, J.; Zhong, F. A real-time driver fatigue identification method based on Ga-GRNN. Front. Public Health 2022, 10, 991350. [Google Scholar] [CrossRef]
  27. Varun Chand, H.; Karthikeyan, J. CNN based driver drowsiness detection system using emotion analysis. Intell. Autom. Soft Comput. 2022, 31, 717–728. [Google Scholar] [CrossRef]
  28. Phan, A.-C.; Nguyen, N.-H.-Q.; Trieu, T.-N.; Phan, T.-C. An efficient approach for detecting driver drowsiness based on Deep Learning. Appl. Sci. 2021, 11, 8441. [Google Scholar] [CrossRef]
  29. Zhao, L.; Wang, Z.; Wang Liu, Q. Driver drowsiness detection using facial dynamic fusion information and a DBN. IET Intell. Transp. Syst. 2018, 12, 127–133. [Google Scholar] [CrossRef]
  30. Silahtaroğlu, M.; Dereli, S. An image processing-based system proposal for real-time detection of drowsiness from a vehicle driver’s eye movements. Acad. Perspect. Procedia 2021, 4, 74–80. [Google Scholar] [CrossRef]
  31. Guede-Fernández, F.; Fernández-Chimeno, M.; Ramos-Castro, J.; García-González, M.A. Driver Drowsiness Detection Based on Respiratory Signal Analysis. IEEE Access 2019, 7, 81826–81838. [Google Scholar] [CrossRef]
  32. Vishesh, P.; Raghavendra, S.; Jankatti, S.; Rekha, V. Eyeblink detection using CNN to detect drowsiness level in drivers for road safety. Indones. J. Electr. Eng. Comput. Sci. 2021, 22, 22222. [Google Scholar] [CrossRef]
  33. Sukrit, M.; Sharad, D.; Sahil, G.; Arpita, J.B. Real-Time Driver Drowsiness Detection System Using Eye Aspect Ratio and Eye Closure Ratio. In Proceedings of the International Conference on Sustainable Computing in Science, Technology and Management (SUSCOM), Jaipur, India, 26–28 February 2019. [Google Scholar]
  34. Siddiqui, H.U.R.; Saleem, A.A.; Brown, R.; Bademci, B.; Lee, E.; Rustam, F.; Dudley, S. Non-Invasive Driver Drowsiness Detection System. Sensors 2021, 21, 4833. [Google Scholar] [CrossRef]
  35. Faisal, T.; Negassi, I.; Goitom, G.; Yassin, M.; Bashir, A.; Awawdeh, M. Systematic development of real-time driver drowsiness detection system using Deep Learning. IAES Int. J. Artif. Intell. 2022, 11, 148–160. [Google Scholar] [CrossRef]
  36. Kavitha, M.N.; Saranya, S.S.; Adithyan, K.D.; Soundharapandi, R.; Vignesh, A.S. Novel approach for driver drowsiness detection using Deep Learning. AIP Publ. 2021, 2387, 140027. [Google Scholar] [CrossRef]
  37. Rahman, S.; Dash, S.; Luhach, A.K.; Chilamkurti, N.; Baek, S.; Nam, Y. A Neuro-fuzzy approach for user behaviour classification and prediction. J. Cloud Comp. 2019, 8, 17. [Google Scholar] [CrossRef]
  38. Perumandla, D. Drowsiness_Dataset, Kaggle. 2020. Available online: https://www.kaggle.com/datasets/dheerajperumandla/drowsiness-dataset (accessed on 10 February 2023).
  39. Google Collab: Welcome to Colaboratory—Colaboratory. Available online: https://colab.research.google.com/?utm_source=scs-index (accessed on 20 April 2023).
  40. Introduction to Convolution Neural Network—GeeksforGeeks, Geeks for Geeks. 2022. Available online: https://www.geeksforgeeks.org/introduction-convolution-neuralnetwork/ (accessed on 16 April 2022).
  41. PyTorch Conv2D Explained with Examples—MLK—Machine Learning Knowledge, MLK—Machine Learning Knowledge. 2022. Available online: https://machinelearningknowledge.ai/pytorch-conv2d-explained-with-examples (accessed on 16 April 2022).
  42. CNN. Introduction to Pooling Layer—GeeksforGeeks, GeeksforGeeks. 2022. Available online: https://www.geeksforgeeks.org/cnn-introduction-to-pooling-layer/ (accessed on 16 April 2022).
  43. Tensorflow.js tf.layers.flatten() Function—GeeksforGeeks, GeeksforGeeks. 2022. Available online: https://www.geeksforgeeks.org/tensorflow-js-tf-layers-flatten-function/ (accessed on 16 April 2022).
  44. Pelt, D.M.; Sethian, J.A. A mixed-scale dense convolutional neural network for image analysis. Proc. Natl. Acad. Sci. USA 2018, 115, 254–259. [Google Scholar] [CrossRef]
  45. ImageNet. Available online: image-net.org (accessed on 1 May 2023).
  46. Goutte, C.; Gaussier, E. A Probabilistic Interpretation of Precision, Recall and F-Score, with Implication for Evaluation. In Advances in Information Retrieval; Losada, D.E., Fernández-Luna, J.M., Eds.; Lecture Notes in Computer Science; Springer: Berlin/Heidelberg, Germany, 2005; Volume 3408. [Google Scholar] [CrossRef]
  47. Basheer Ahmed, M.I.; Zaghdoud, R.; Ahmed, M.S.; Sendi, R.; Alsharif, S.; Alabdulkarim, J.; Albin Saad, B.A.; Alsabt, R.; Rahman, A.; Krishnasamy, G. A Real-Time Computer Vision Based Approach to Detection and Classification of Traffic Incidents. Big Data Cogn. Comput. 2023, 7, 22. [Google Scholar] [CrossRef]
  48. Olatunji, S.O.; Alsheikh, N.; Alnajrani, L.; Alanazy, A.; Almusairii, M.; Alshammasi, S.; Alansari, A.; Zaghdoud, R.; Alahmadi, A.; Basheer Ahmed, M.I.; et al. Comprehensible Machine-Learning-Based Models for the Pre-Emptive Diagnosis of Multiple Sclerosis Using Clinical Data: A Retrospective Study in the Eastern Province of Saudi Arabia. Int. J. Environ. Res. Public Health 2023, 20, 4261. [Google Scholar] [CrossRef] [PubMed]
  49. Talha, M.; Sarfraz, M.; Rahman, A.; Ghauri, S.A.; Mohammad, R.M.; Krishnasamy, G.; Alkharraa, M. Voting-Based Deep Convolutional Neural Networks (VB-DCNNs) for M-QAM and M-PSK Signals Classification. Electronics 2023, 12, 1913. [Google Scholar] [CrossRef]
  50. Ibrahim, N.M.; Gabr, D.G.; Rahman, A.; Musleh, D.; AlKhulaifi, D.; AlKharraa, M. Transfer Learning Approach to Seed Taxonomy: A Wild Plant Case Study. Big Data Cogn. Comput. 2023, 7, 128. [Google Scholar] [CrossRef]
  51. Olatunji, S.O.; Alansari, A.; Alkhorasani, H.; Alsubaii, M.; Sakloua, R.; Alzahrani, R.; Alsaleem, Y.; Alassaf, R.; Farooqui, M.; Basheer Ahmed, M.I.; et al. Preemptive Diagnosis of Alzheimer’s Disease in the Eastern Province of Saudi Arabia Using Computational Intelligence Techniques. Comput. Intell. Neurosci. 2022, 2022, 5476714. [Google Scholar] [CrossRef] [PubMed]
  52. Olatunji, S.O.; Alansari, A.; Alkhorasani, H.; Alsubaii, M.; Sakloua, R.; Alzahrani, R.; Alsaleem, Y.; Almutairi, M.; Alhamad, N.; Alyami, A.; et al. A Novel Ensemble-Based Technique for the Preemptive Diagnosis of Rheumatoid Arthritis Disease in the Eastern Province of Saudi Arabia Using Clinical Data. Comput. Math. Methods Med. 2022, 2022, 2339546. [Google Scholar] [CrossRef]
  53. Rahman, A.; Ahmed, M.; Zaman, G.; Iqbal, T.; Khan, M.A.A.; Farooqui, M.; Ahmed, M.I.B.; Ahmed, M.S.; Nabeel, M.; Omar, A. Geo-Spatial Disease Clustering for Public Health Decision Making. Informatica 2022, 46, 21–32. [Google Scholar] [CrossRef]
  54. Gollapalli, M.; Rahman, A.; Musleh, D.; Ibrahim, N.; Khan, M.A.; Sagheer, A.; Ayesha, A.; Aftab, K.M.; Mehwash, F.; Tahir, I.; et al. A neuro-fuzzy approach to road traffic congestion prediction. Comput. Mater. Contin. 2022, 73, 295–310. [Google Scholar] [CrossRef]
  55. Rahman, A.; Ahmed, M.I.B. Virtual Clinic: A CDSS Assisted Telemedicine Framework. In Telemedicine Technologies; Elsevier: Amsterdam, The Netherlands, 2019; pp. 227–238. [Google Scholar]
  56. Khan, T.A.; Fatima, A.; Shahzad, T.; Rahman, A.; Alissa, K.; Ghazal, T.M.; Al-Sakhnini, M.M.; Abbas, S.; Khan, M.A.; Ahmed, A. Secure IoMT for Disease Prediction Empowered with Transfer Learning in Healthcare 5.0, the Concept and Case Study. IEEE Access 2023, 11, 39418–39430. [Google Scholar] [CrossRef]
  57. Mohammed, I.; Alsuhaibani, S.A. Alsuhaibani, S.A. A neuro-fuzzy inference model for diabetic retinopathy classification. In Intelligent Data Analysis for Biomedical Applications; Academic Press: Cambridge, MA, USA, 2019; pp. 147–172. [Google Scholar]
  58. Ahmed, M.I.B.; Rahman, A.U.; Farooqui, M.; Alamoudi, F.; Baageel, R.; Alqarni, A. Early identification of COVID-19 using dynamic fuzzy rule based system. Math. Model. Eng. Probl. 2021, 8, 805–812. [Google Scholar] [CrossRef]
  59. Alotaibi, S.M.; Rahman, A.; Basheer, M.I.; Khan, M.A. Ensemble machine learning based identification of pediatric epilepsy. Comput. Mater. Contin. 2021, 68, 149–165. [Google Scholar]
  60. Ahmed, M.S.; Rahman, A.; AlGhamdi, F.; AlDakheel, S.; Hakami, H.; AlJumah, A.; AlIbrahim, Z.; Youldash, M.; Alam Khan, M.A.; Basheer Ahmed, M.I. Joint Diagnosis of Pneumonia, COVID-19, and Tuberculosis from Chest X-ray Images: A Deep Learning Approach. Diagnostics 2023, 13, 2562. [Google Scholar] [CrossRef] [PubMed]
  61. Statology. Weltch t-Test. 2020. Available online: https://www.statology.org/welchs-t-test-calculator/ (accessed on 3 August 2023).
Figure 1. Methodological steps of this study.
Safety 09 00065 g001
Figure 2. The general flow of CNN.
Safety 09 00065 g002
Figure 3. CNN history plots.
Safety 09 00065 g003
Figure 4. VGG16 history plots.
Safety 09 00065 g004
Figure 5. Comparative analysis with [7], [8], [27], [32], [35] and [6].
Safety 09 00065 g005
Table 1. Ratio of accidents and percentage of fatalities and injuries attributable to drowsy driving.
Country% of Accidents% of Fatalities and Injuries
Kingdom of Saudi Arabia11.6%6.2%
United Kingdom2–4%10–20%
United States1–3%41%
Pakistan19%35.5%
Table 2. Summary of literature review.
Ref.DatasetMethodsBest Result
[6]A private dataset consists of 2850 images.Deep-stacked CNNAccuracy of 96%.
[7]Two datasets: the Closed Eye in the Wild dataset (CEW) and the Yawing Detection Dataset (YawDD).Forward deep-learning CNNAccuracy of 96%.
[8]YawDD dataset which consists of 107 images.Ensemble CNN (ECNN).F1 score of 93%.
[9]UTA Real-Life Drowsiness Dataset (UTA-RLDD), which includes 60 videos.Recurrent and convolutional neural networks, as well as a fuzzy logic-based approach.Accuracy of 93% in fuzzy logic-based approach.
[10]NITYMED videos dataset.InceptionV3, VGG16 and ResNet50V2Accuracy of 99.71% for eyeball detection.
[11]Private dataset.Haar sliding window.Accuracy of 92%.
[12]Private dataset.Viola–Jones Method.Accuracy of 84%.
[13]WIDER_ FACE dataset.Improved YOLOv3-tiny network.Accuracy of 95%.
[14]Private dataset.Computer Vision PERCLOS approach and the Support Vector Machines algorithm.Accuracy of 91%.
[15]Private dataset.Viola–Jones algorithm.Accuracy of 95%.
[17]Private dataset.Support Vector Machine algorithm.Accuracy of 93%.
[18]Private dataset.Viola–Jones algorithm.Accuracy of 90%.
[19]Private dataset consists of 17,000 images.CNNAccuracy of 99%.
[20]The NTHU-DDD dataset, consisting of 376 videos.Histogram of Oriented Gradient (HOG) technique and Naïve Bayes (NB) algorithm.Accuracy of 85%.
[21]The UTA Real-Life Drowsiness Dataset (UTA-RLDD).Recurrent and convolutional neural network.Accuracy of 65%.
[22]The ibug-300w Dataset contains 300 images.Opencv’s built-in HAAR cascades.The accuracy is 100%.
[23]Media Research Lab’s dataset of eyes is used.Convolutional neural network.The accuracy is 94%.
[24]No mention of the source.Opencv with the EAR function.Not mentioned.
[26]16,600 images with 11 features.Random forest, k-nearest neighbor, general regression neural network, and generic algorithm (GA)-RNN.GA-RNN with an accuracy of 93%.
[27]Image dataset of size 17,243.SVM, KNN, and the CNN.Conventional neural network (CNN) with an accuracy of 93%.
[28]Mixed dataset of size 16,577 of images and videos.Mobilenet-V2 and resnet-50V2.Resnet-50V2 with an accuracy of 97%.
[29]A private dataset.Deep belief network (DBN).Achieved an accuracy of 96%
[30]A private dataset.Eye Aspect Ratio (EAR) and blinking analysis, and Dlib library.An accuracy of 92%.
[31]A private dataset.A novel algorithm for monitoring driver’s state called TEDD.An accuracy of 96%.
[32]Eye Blink dataset, consisting of eye images from 22 participants.CNN and opencv, along with a new method called Horizontal and Vertical Gradient Features (hvgfs).Achieve an accuracy of 97%.
[33]Used a dataset of 10 subjects to generate the facial images.Random forest.An accuracy of 84%
[34]A dataset consisting of age, label (drowsy/non-drowsy), and respiration per minute.Support Vector Machine, Decision Tree, Logistic Regression, Gradient Boosting Machine, Extra Tree Classifier and Multilayer Perceptron.Support Vector Machine achieved the best accuracy of 87%.
[35]The dataset used was developed and generated by the authors.CNN97% accuracy.
[36]Online dataset from KaggleArtificial Neural Network.97% accuracy.
Table 3. Classification report of CNN.
ClassPrecisionRecallF1-Score
00.950.920.94
10.930.960.95
20.990.980.98
30.980.990.98
Table 4. Classification report of VGG16.
ClassPrecisionRecallF1-Score
00.400.940.56
10.550.150.23
20.980.640.77
30.820.980.89
Disclaimer/Publisher’s Note: The statements, opinions and data contained in all publications are solely those of the individual author(s) and contributor(s) and not of MDPI and/or the editor(s). MDPI and/or the editor(s) disclaim responsibility for any injury to people or property resulting from any ideas, methods, instructions or products referred to in the content.

