1. Introduction
In 2020, an estimated 439,206 large trucks were involved in police-reported traffic crashes nationwide. Of these, there were 4965 fatalities and 146,930 injuries from crashes involving large trucks. Of the fatalities, 3512 (71%) were occupants of other vehicles, 831 (17%) were occupants of large trucks, and 622 (13%) were non-occupants (pedestrians, bicyclists, or other nonoccupants) [
1].
In 2019, at least one driver-related factor was recorded for 33% of the large-truck-associated fatal crashes. The most common driver-related factor was “speeding of any kind (7.6%)”, and “distraction or inattention (5.3%)” was the second most common factor [
2]. Commercial long-haul truck drivers generally operate under time constraints for on-time deliveries, making speeding a potential hazard. Given drivers’ time-saving bias during a journey, drivers tend to underestimate the actual time saving and may exceed speed limits more frequently [
3,
4]. Preventing speeding violations by truck drivers is therefore a potentially critical factor in efficiently reducing fatal crashes.
Given the high impact of this factor on crashes, there is significant motivation to improve safety by targeting drivers’ speeding behavior. Driver training is one potential intervention to improve drivers’ speeding behaviors; however, this may not be adequate given potential issues with training standards [
5]. Other interventions include behavior-based safety approaches that leverage in-vehicle data recorder (IVDR) technologies to provide real-time and post hoc feedback to drivers regarding their driving and safety performance. These can be deployed to collect driving performance on-board, as well as the drivers’ movements, mental/physical condition, and sometimes voice. There is evidence that such in-vehicle observation systems may result in behavior modification and accident reduction by as much as 20% [
6], even if a driver is not explicitly being provided feedback. Providing feedback to drivers can improve these benefits. Studies have shown that providing drivers with proper feedback can reduce the collision rate and costs [
7], reduce the frequency of risky driving behavior [
8], and lead to slower speeds [
9]. The feedback may be provided instantaneously as additional information (i.e., on-board telematics for vehicle kinematics like speeding or acceleration/deceleration, or distance to surrounding vehicles) during the trip. The feedback can also be provided retrospectively, for example, in commercial freight as a supervisory coaching or summary report [
10], or for teen drivers in the form of guardianship [
11].
However, there is evidence that immediate feedback alone may not have long-term effects [
10], and drivers may only rely on the technology for assistance, but with no behavioral change. Additionally, the feedback from the devices must be consistent and transparent [
12] and in line with the drivers’ safety judgment about their actions, otherwise drivers may express resistance to supervision, especially if they do not understand why the feedback was provided. For a more sustainable change, a longer-term behavior change may be required that can possibly result from retrospective behavior-based safety programs such as training, education, or feedback provided by fleet owners or third-party providers (e.g., SmartDrive [
13] or Lytx [
14]). The effect of the retrospective safety programs on improving driving habits depends on what drivers learn from the feedback and drivers’ attitude after completing them. Communication between safety supervisors and drivers plays an important role, in which the safety value-based interactions and concern for physical well-being promotes the quality of the relationship between the driver and supervisor [
15].
Previous research indicates that a combination of video-monitoring and behavioral coaching can reduce safety-related events [
16], and a coaching program combined with immediate feedback may show a greater reduction in drivers’ risky behaviors than immediate feedback alone [
10,
17,
18]. More recent studies have also looked at the impact of feedback programs on speeding behaviors, including in the presence of incentive programs [
19,
20,
21,
22]. One such study assessed taxi drivers using a randomized controlled trial, studying the impact of providing information, or information with incentives (reward or punishment) on drivers’ speeding behaviors [
19]. This study found that the impact of providing information alone (feedback only) was minimal, as compared to the higher impact of tying such feedback with a reward or punishment. Another study examined a population of bus drivers [
20] to examine the effects of incentives towards speeding reduction. This study found that small but reliable rewards were more effective than large but infrequent rewards, and that incentives, surveillance, and driver feedback in real time produced a significant decline in violations. Yet another randomized controlled trail [
21] that examined feedback with incentives found improvements in the drivers who received feedback and incentives, versus those who did not receive any feedback. A driving simulator study of young drivers examining speeding reduction via cognitive training [
22] found that feedback interventions were effective in speed reduction in simulated drives, regardless of the types of feedback. It is evident that there is significant supporting, albeit sometimes mixed [
20], evidence on the impact of feedback on speed reduction. Moreover, while several studies have been conducted in this domain, studies specifically focused on long-haul truck drivers [
10,
14,
16] have not been as frequently conducted, and even fewer have examined the subset of drivers who are overrepresented in risky events [
23]. Therefore, while a retrospective behavior-based safety program enhances safety, further investigation is needed to understand the impact of such programs, based on specific driver types or characteristics, including a history of high-risk behaviors. In addition, the persistence of these forms of risky behavior reduction over time is not well understood. This study was therefore undertaken to examine these two factors, with a specific focus on speeding violations, given their importance as a driver-related factor in fatal crashes. This research investigated how a retrospective behavior-based safety program combined with immediate feedback affected long-haul truck drivers’ speeding violations over time, given different driving styles. The research addressed these following questions:
- (1)
Do behavior-based safety programs help reduce speeding violations?
- (2)
What is the impact of these programs on speeding violations for different styles of drivers?
- (3)
What is the impact of these programs on speeding violations over time?
2. Method
This study was a secondary analysis of speeding violation data from a long-haul trucking fleet with about 500 power units in the United States that had deployed a behavior-based driver safety system which included in-vehicle data recorders (IVDRs) and safety manager feedback. The data consisted of speeding violation rates for 245 long-haul truck drivers over 37 weeks. Due to the nature of the IVDR installation and safety-program deployment timelines within the fleet, the available data included speeding events during a period of time when the drivers were not provided feedback. The rest of this section details the safety program, the event data, and the analyses approach.
2.1. In-Vehicle Data Recorder (IVDR) and Driver Safety Feedback Program
The IVDR used in this fleet included in-cabin event recorders that recorded videos of the forward roadway and that of the driver whenever an event was triggered. The triggers were based on data from an on-board data acquisition system (DAS) that collected vehicle kinematic performance, such as speed, acceleration, throttle/brake force, steering angle, turn signal engagement, etc. Based on the DAS measures, drivers could receive a visual notification of an event, in the form of a blinking LED, for various types of events, including speeding, sharp turns, hard brakes, running traffic lights, and crashes. For each event, information about the event including occurrence, timestamps, kinematic data (g-force, speed, etc.), and a brief 10 s video was saved to a remote server. These events were used as material for the post-drive feedback provided by the fleet safety managers. The driver safety feedback program thus included instant real-time feedback in the form of the in-cab LED notification, as well as potential post hoc feedback from fleet safety managers based on the events.
2.2. Data Description
The data available for analysis only included the event occurrences and a description of the event (speeding, tailgating, braking, etc.) for drivers, along with timestamps and mileage information to calculate rates longitudinally. These data were collected by the fleet as part of their commercial operations and were not collected by the researchers as a part of an experiment. The researchers were simply given access to the deidentified data for secondary analyses, and the researchers had no access to personally identifiable information. Events were associated with a driver ID that was de-identified. Kinematic and video data were not made available for analyses, and neither was information about drivers, power units, and safety managers. Of all the recorded event occurrences, speeding events comprised about 91% of the data (6464 out of 7123). The other safety-related events included failure to wear a seatbelt (1141, 16%), tailgating (892, 13%), hard braking (580, 8%), talking on a hand-held cell phone (172, 2%), cornering violations (49, 0.7%), and running stop signs or lights (31, 0.4%). Multiple behaviors could be observed in a single event (e.g., speeding and tailgating or tailgating and hard braking). Speeding events therefore were greatly more frequent than any other category of events. A speeding event was recorded as long as a driver exceeded the speed limit, but the information on how much a speed limit was exceeded by was not available. Event data were continuously collected across 37 weeks. Given the different mileages driven by the drivers over the time period of interest, we calculated the rate of speeding events over mileage and time. Accordingly, speeding event rates were calculated as the number of observed speeding events per 1000 miles per week per driver (one speeding rate per driver per week).
Two hundred and thirty out of the 245 drivers had usable and valid data. From this subset of drivers, 116 drivers were exposed to the in-vehicle feedback as well as the safety manager feedback. The remaining 114 drivers did not receive any feedback, despite the events being recorded for them. This was a result of the deployment timeline for the fleet and provided a grouping of drivers based on whether they received feedback or not. For the analyses, the 116 drivers were considered to be the ‘feedback group’, and the remaining 114 were considered to be the ‘no-feedback group’.
The timeline for the 37 weeks included an initial 4-week period when the IVDRs were installed in the vehicle, but no feedback was given to any driver. In weeks 5, 6, and 7, some of the feedback-group drivers started receiving feedback, but it was only by week 8 that all drivers in the feedback-group had started receiving feedback. Given this situation, we only considered events from the first 4 weeks, and weeks 8–37 for analysis. The first 4 weeks were considered equivalent to a baseline period for both groups, i.e., no drivers received feedback. For the purposes of this paper, this period is referred to as stage 1. These 4 weeks, i.e., stage 1, were compared with the subsequent 30 weeks, i.e., stage 2 (weeks 8–37). In the subsequent 30 weeks, i.e., stage 2, the feedback group received real-time LED notifications, as well as post hoc coaching by the safety manager for safety events, and the no-feedback group did not receive any feedback.
2.3. Data Analysis
The analysis was conducted in two phases: (1) a cluster analysis of drivers to identify driver types by risk, and (2) a comparison of the effects of the behavior-based driver safety program based on risk clusters and the presence of feedback.
2.3.1. Cluster Analysis
To address the first and second research questions regarding the impact of the safety program on drivers, it was crucial to identify differing driving styles prior to further analysis. Given that the principle of clustering involves segregating the population into groups as unalike as possible [
24], cluster analysis offered an appropriate method that classified drivers into subgroups based on their characteristics. However, the deidentified data used in this research only provided information about the events involving the drivers, excluding any descriptions about the drivers themselves. As a result, the research team selected the speeding event rate during stage 1 as the input for the clustering algorithm.
Two typical heuristic clustering methods are K-means and K-medoids. Both approaches specify an initial number of groups, iteratively reassign objects to the groups until convergence, and determine all clusters at once [
25]. This research aimed to partition drivers into two distinct clusters characterized by relatively higher and lower speeding event rates, using the data collected in stage 1. Limiting the divisions to two clusters of higher and lower risk made it easier for the fleet owner to apply the results practically. K-medoids was selected due to its robustness to outliers and noise and performed with the same efficiency as K-means on small or mid-size datasets [
26]. For this study, the K-medoids PAM algorithm used two medoids of the training subsamples that assigned each driver’s data to the nearest medoid and sought to minimize the sum of dissimilarities between points clustered in a partition and a point as the center of that partition [
27].
Upon completing the clustering process, the Mann–Whitney U Test was administrated to verify the significance of the differences between non-paired clusters during stage 2. Significant differences would be expected if an appropriate clustering method was utilized.
2.3.2. Group Comparisons
The speeding event rates between stages 1 and 2 were then compared for each cluster. Due to the number of drivers in each cluster (7 the in feedback group and 11 in the no-feedback group), the nonparametric Wilcoxon signed rank test was used for the higher-risk cluster, and the paired-samples t-test was used for the lower-risk cluster.
2.3.3. Trend Analysis
Regression models were created to model the change in speeding event rate over time across all 30 weeks of stage 2 for both risk-clusters and for both the feedback and no-feedback groups.
3. Results
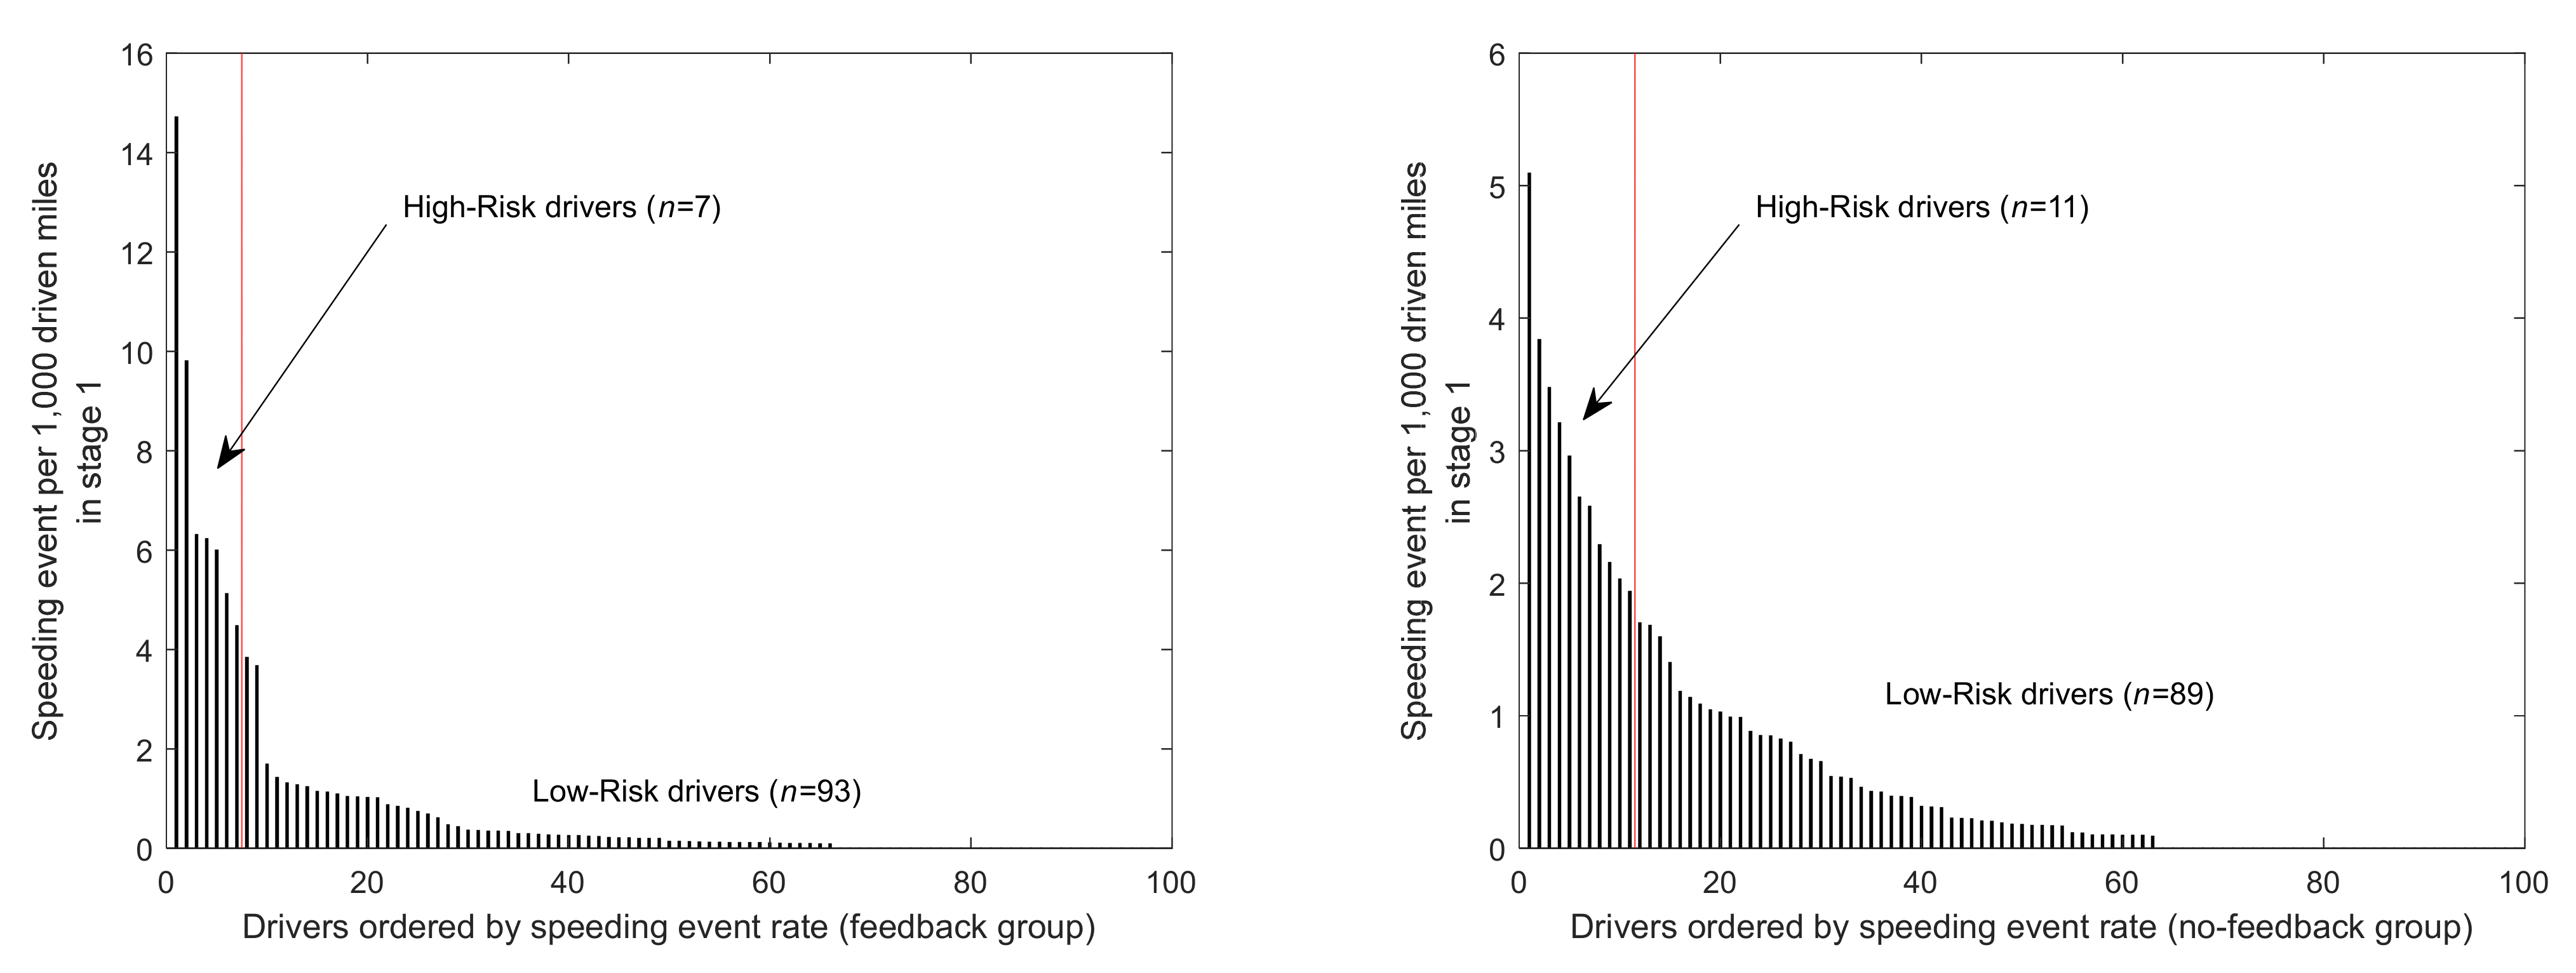
3.1. Clustering Truck Drivers
Prior to the cluster analysis, a criterion was applied to the feedback and no-feedback groups to include drivers who had at least some driving exposure during stage 1. The criterion for inclusion was that a driver should have no stage 1 weeks with zero miles driven. This resulted in the exclusion of 16 drivers from the feedback group, and 14 drivers from the no-feedback group, resulting in 100 drivers in each group for the cluster analysis. The K-medoids clustering algorithm resulted in 93 drivers categorized as lower-risk and 7 drivers as higher-risk for the feedback group. Similarly, 89 drivers were categorized as lower-risk and 11 as higher-risk in the no-feedback group. The distribution of mean speeding event rates for the stage 1 weeks by driver is shown in
Figure 1.
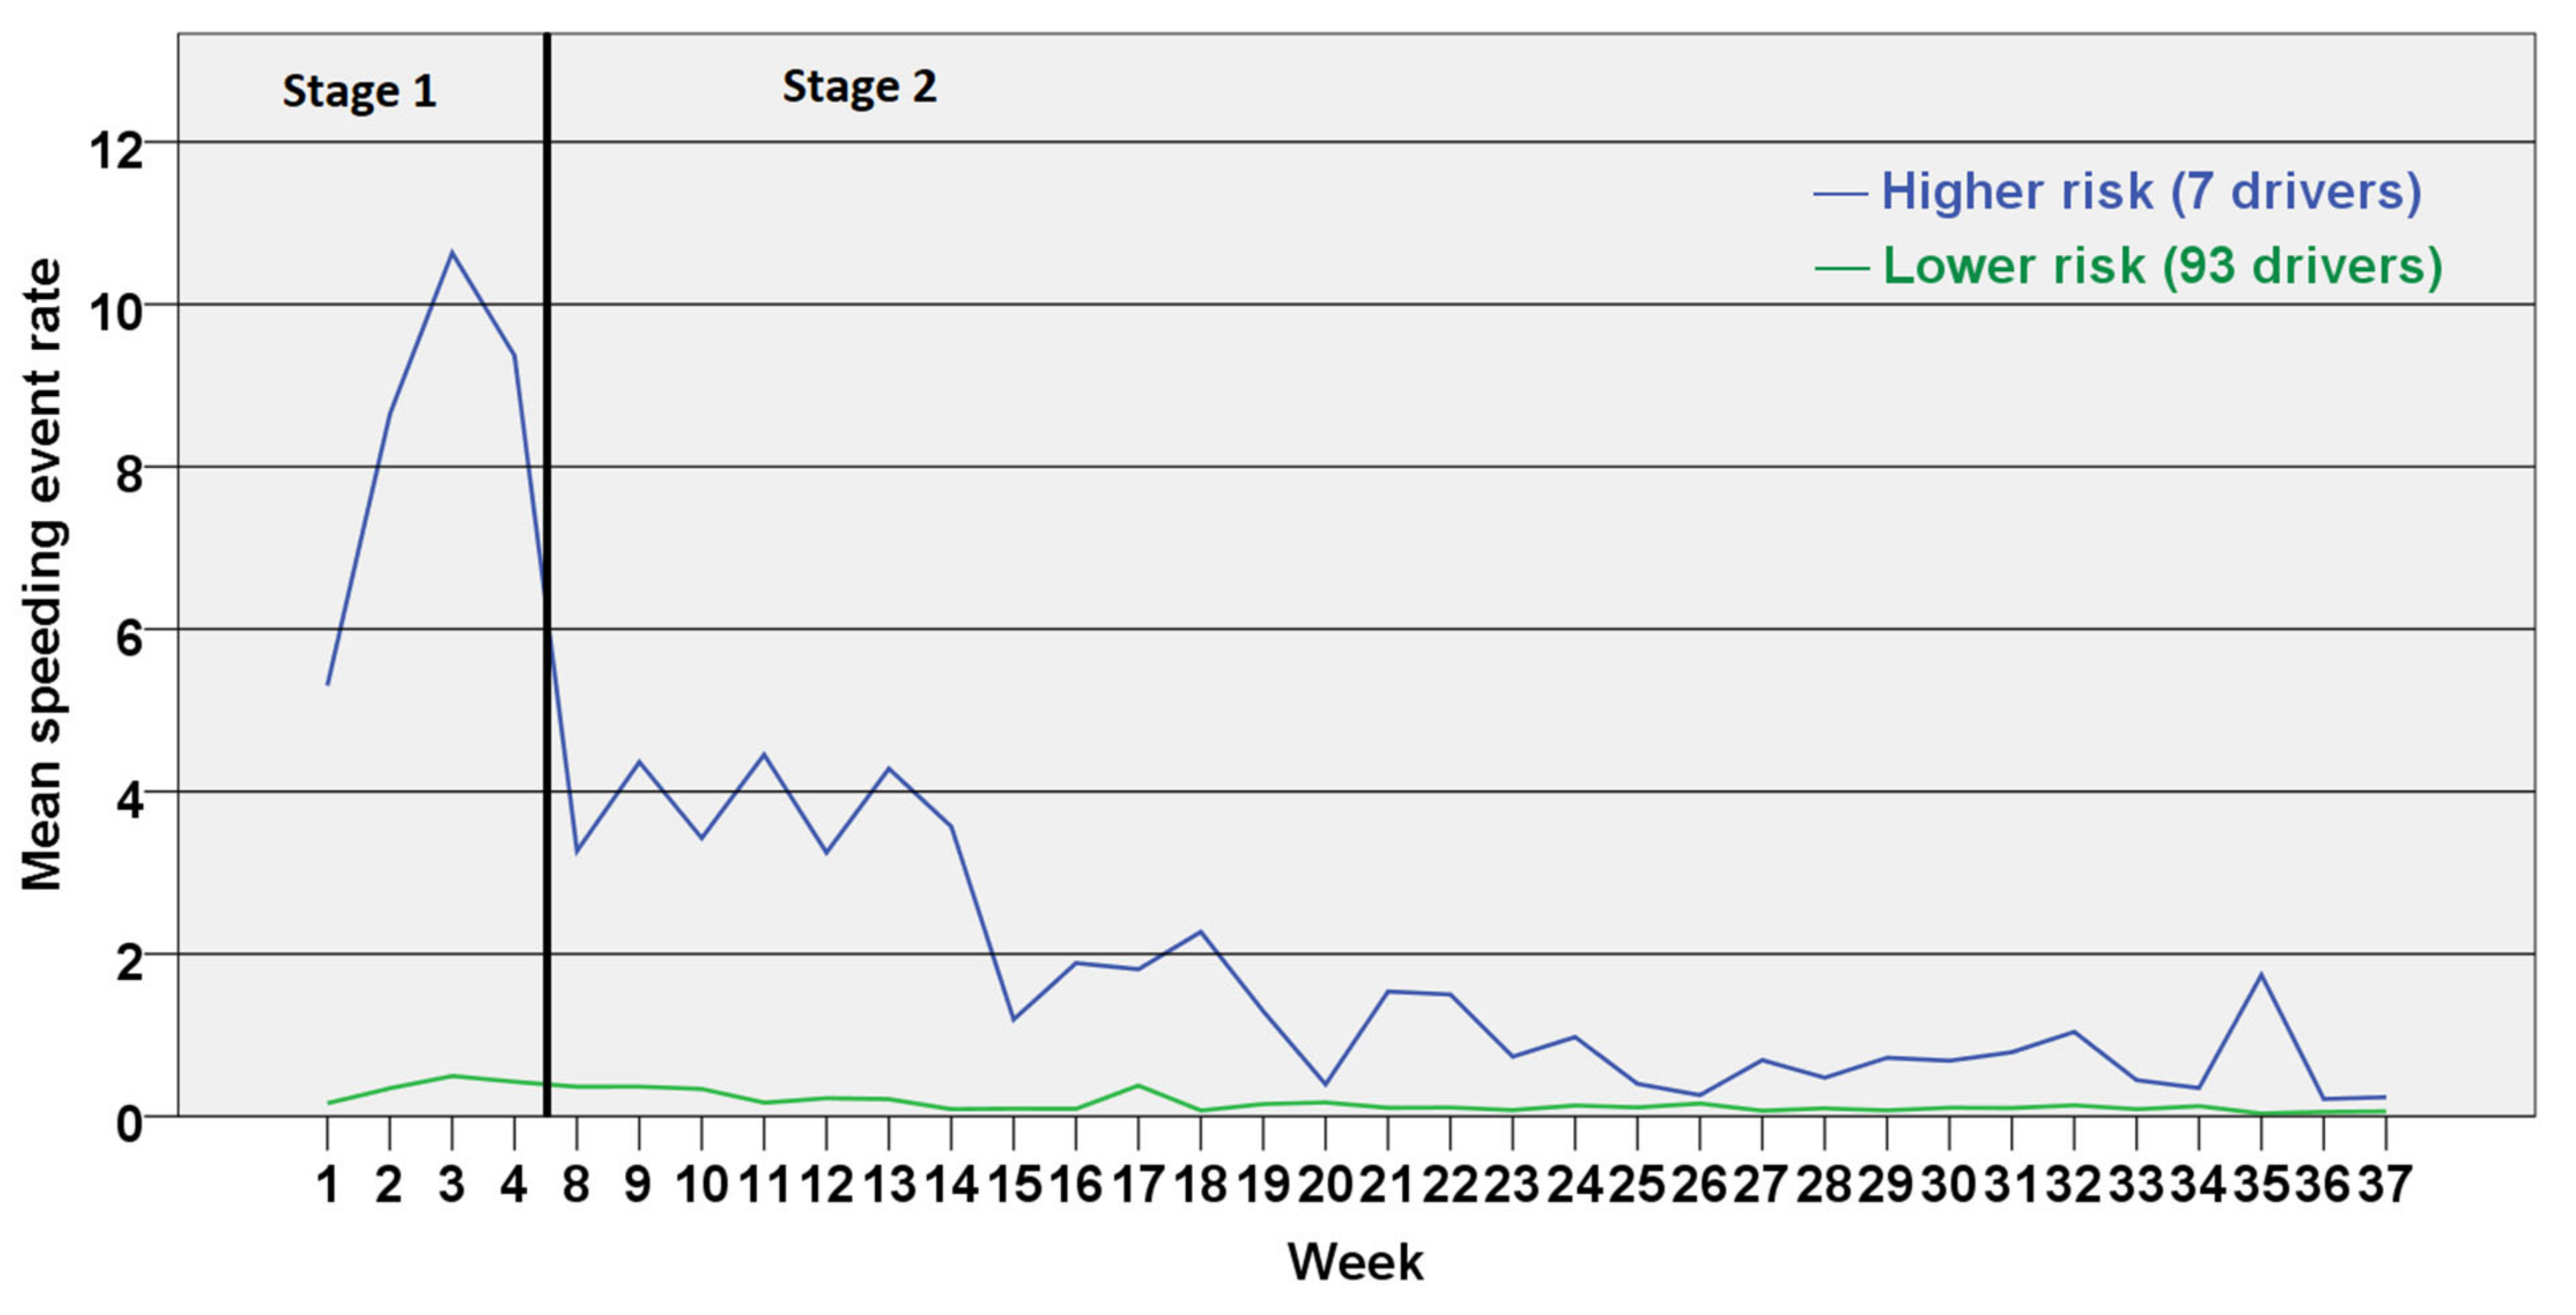
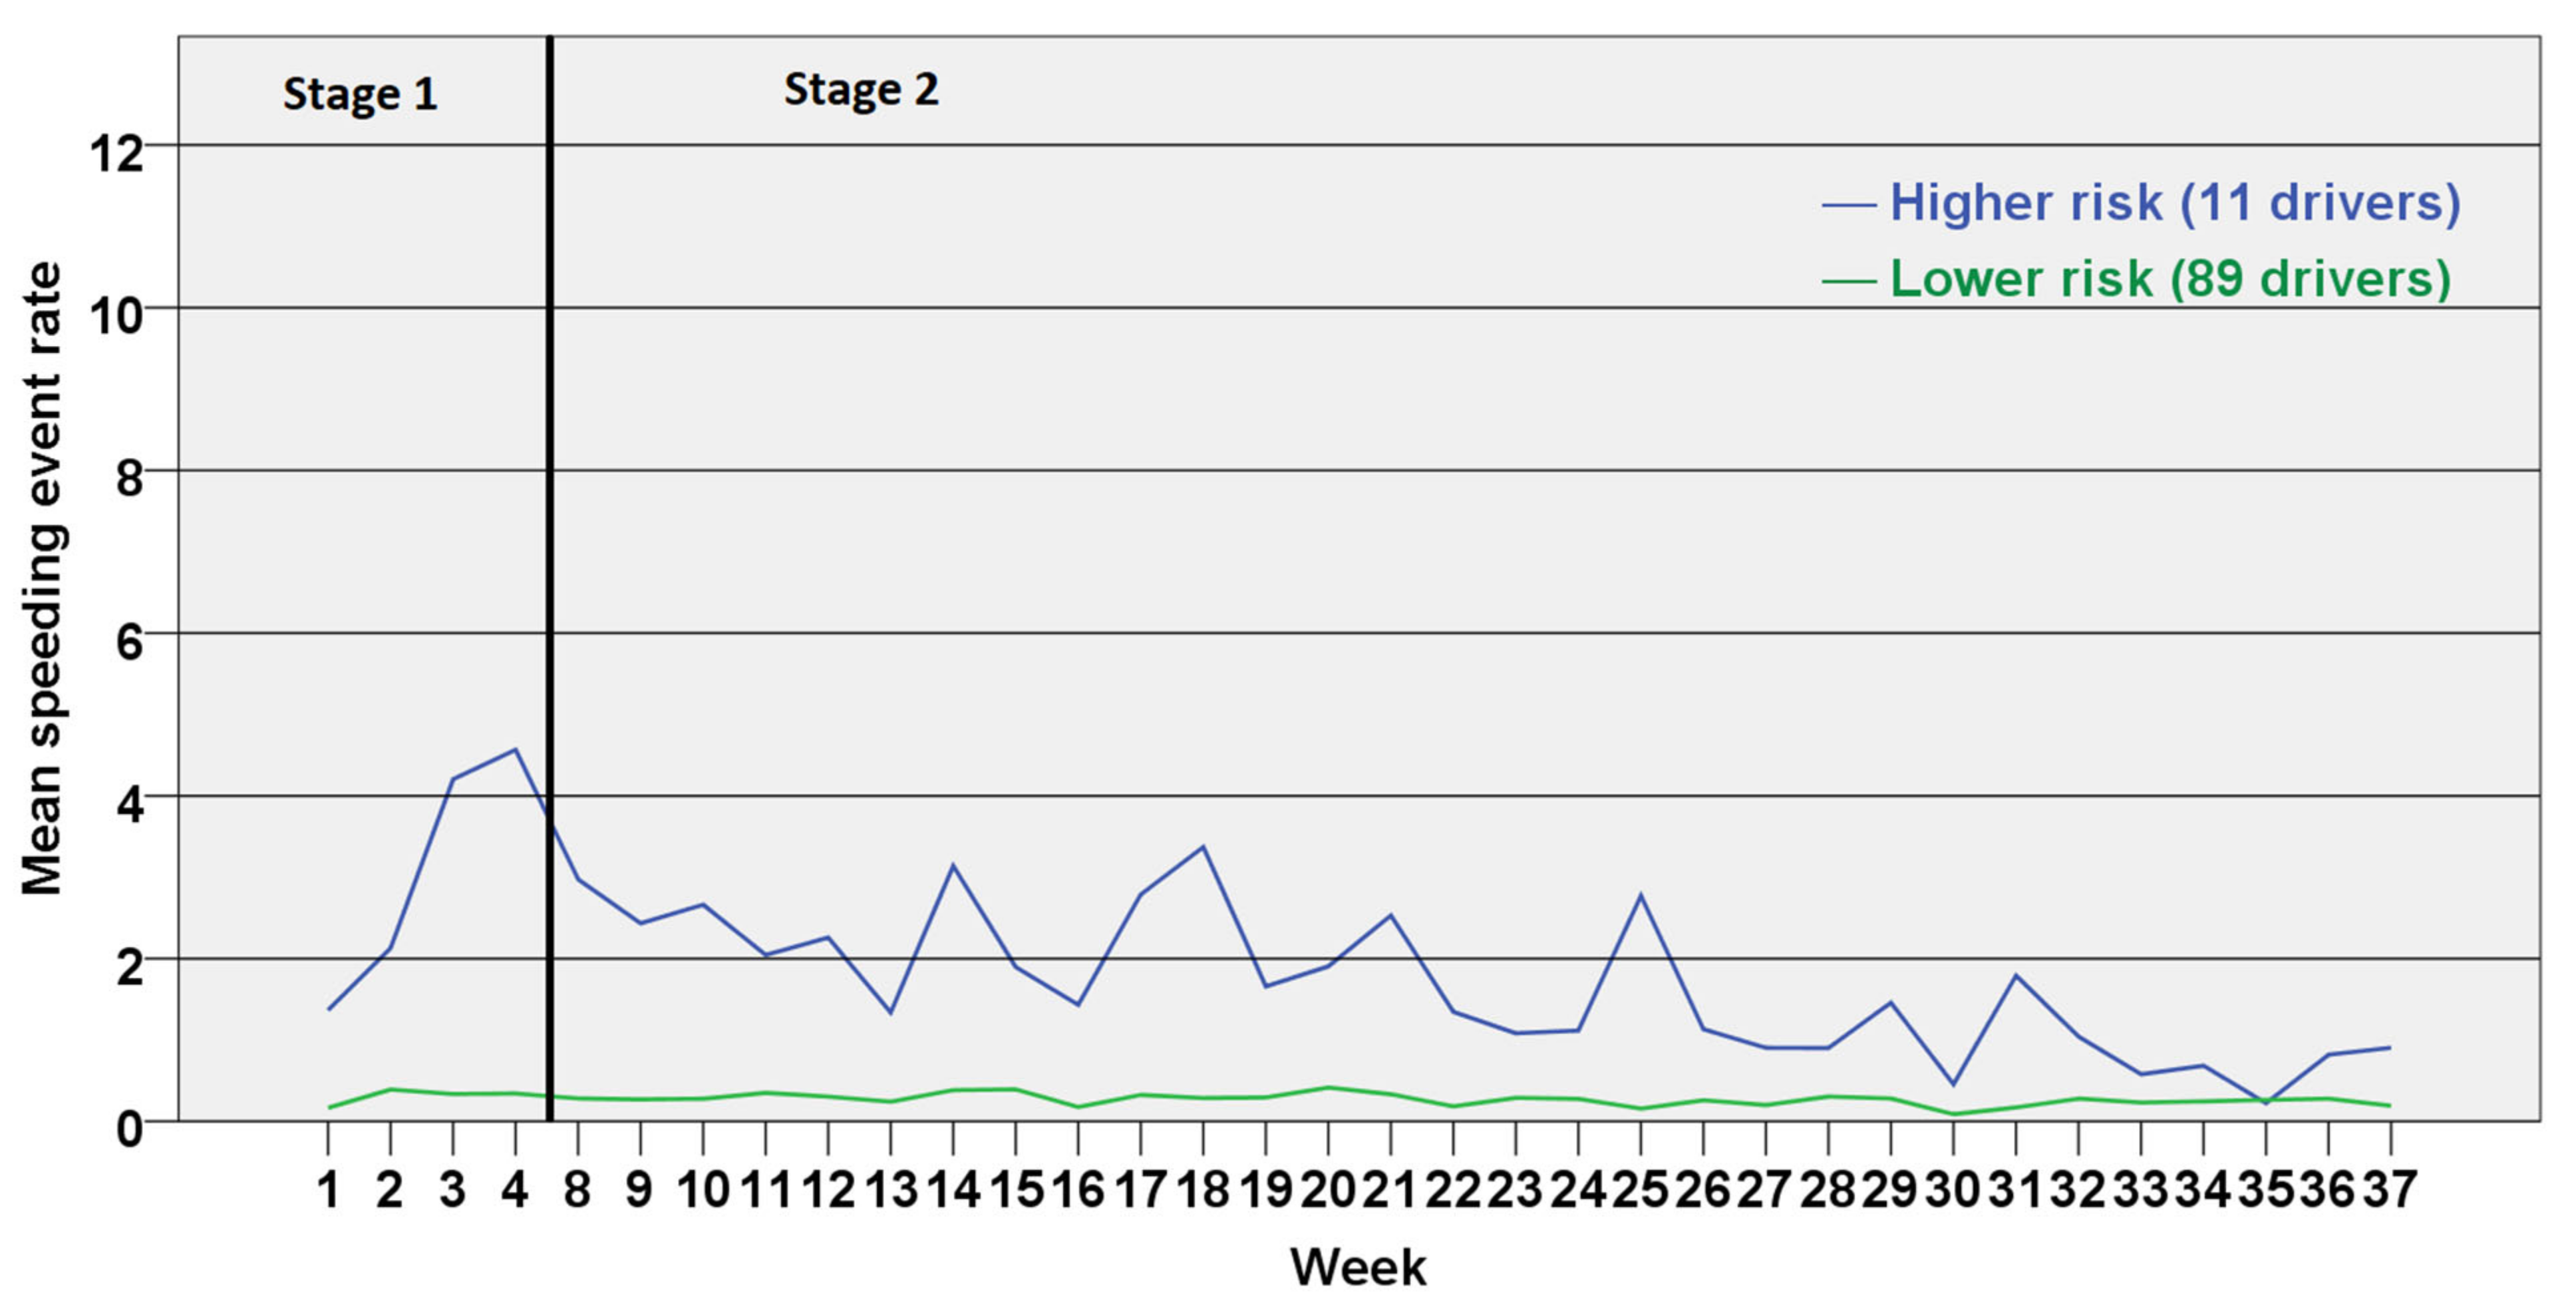
Figure 2 and
Figure 3 show the mean speeding event rates over time by the two clusters for stage 1 (weeks 1–4) and stage 2 (weeks 8–37), for the feedback group and the no-feedback group, respectively. Given that the clustering identified the two clusters in stage 1, we tested the event rates across clusters for stage 2 as well. The Mann–Whitney U test showed that, in stage 2, the mean speeding event rates between higher-risk and lower-risk clusters were significantly different for both groups (feedback group, U = 45, Z = 3.79,
p < 0.001; no-feedback group, U = 50, Z = 4.85,
p < 0.001).
3.2. Effect of the Safety Program on Speeding Event Rates
To examine the effects of the safety program on speeding event rates, we compared the speeding event rates between the two stages, for both the higher-risk and lower-risk clusters.
Given the small sample of drivers in the higher-risk cluster (7 in the feedback group and 11 in the no-feedback group), the non-parametric Wilcoxon signed rank test was run for both groups to compare the paired speeding event rates in stages 1 and 2. For the higher-risk drivers in the feedback group, the mean speeding event rate in the stage 1 (8.48) weeks was found to be significantly higher than in the stage 2 (1.58) weeks (7 drivers, Z = 2.366, p < 0.01). For the higher-risk cluster in the no-feedback group as well, the speeding event rate showed a significant decrease from the stage 1 (3.07) to stage 2 (1.77) weeks (11 drivers, Z = 2.401, p < 0.01); however, this decrease was not as high as in the feedback group.
For the lower-risk cluster, given the greater sample of drivers (93 in the feedback group and 89 in the no-feedback group), a paired-samples t-test was used to compare speeding event rates in stages 1 and 2. For this lower-risk cluster, the results comparing the stages were different. For the feedback group, the mean speeding event rate in stage 1 (0.36) weeks was significantly higher than in the stage 2 (0.15) weeks (t(92) = 3.625, p = 0.001). However, for the no-feedback group, there was no significant difference in speeding event rates between stage 1 (0.31) and stage 2 (0.27) (t(88) = 1.124, p = 0.13).
The above findings indicate that the drivers in the feedback group, i.e., those who participated in the safety program, had lower speeding event rates over time, regardless of if they were in the higher-risk or the lower-risk clusters. The higher-risk drivers in the feedback group had a greater decrease in their speeding rates than the lower risk ones.
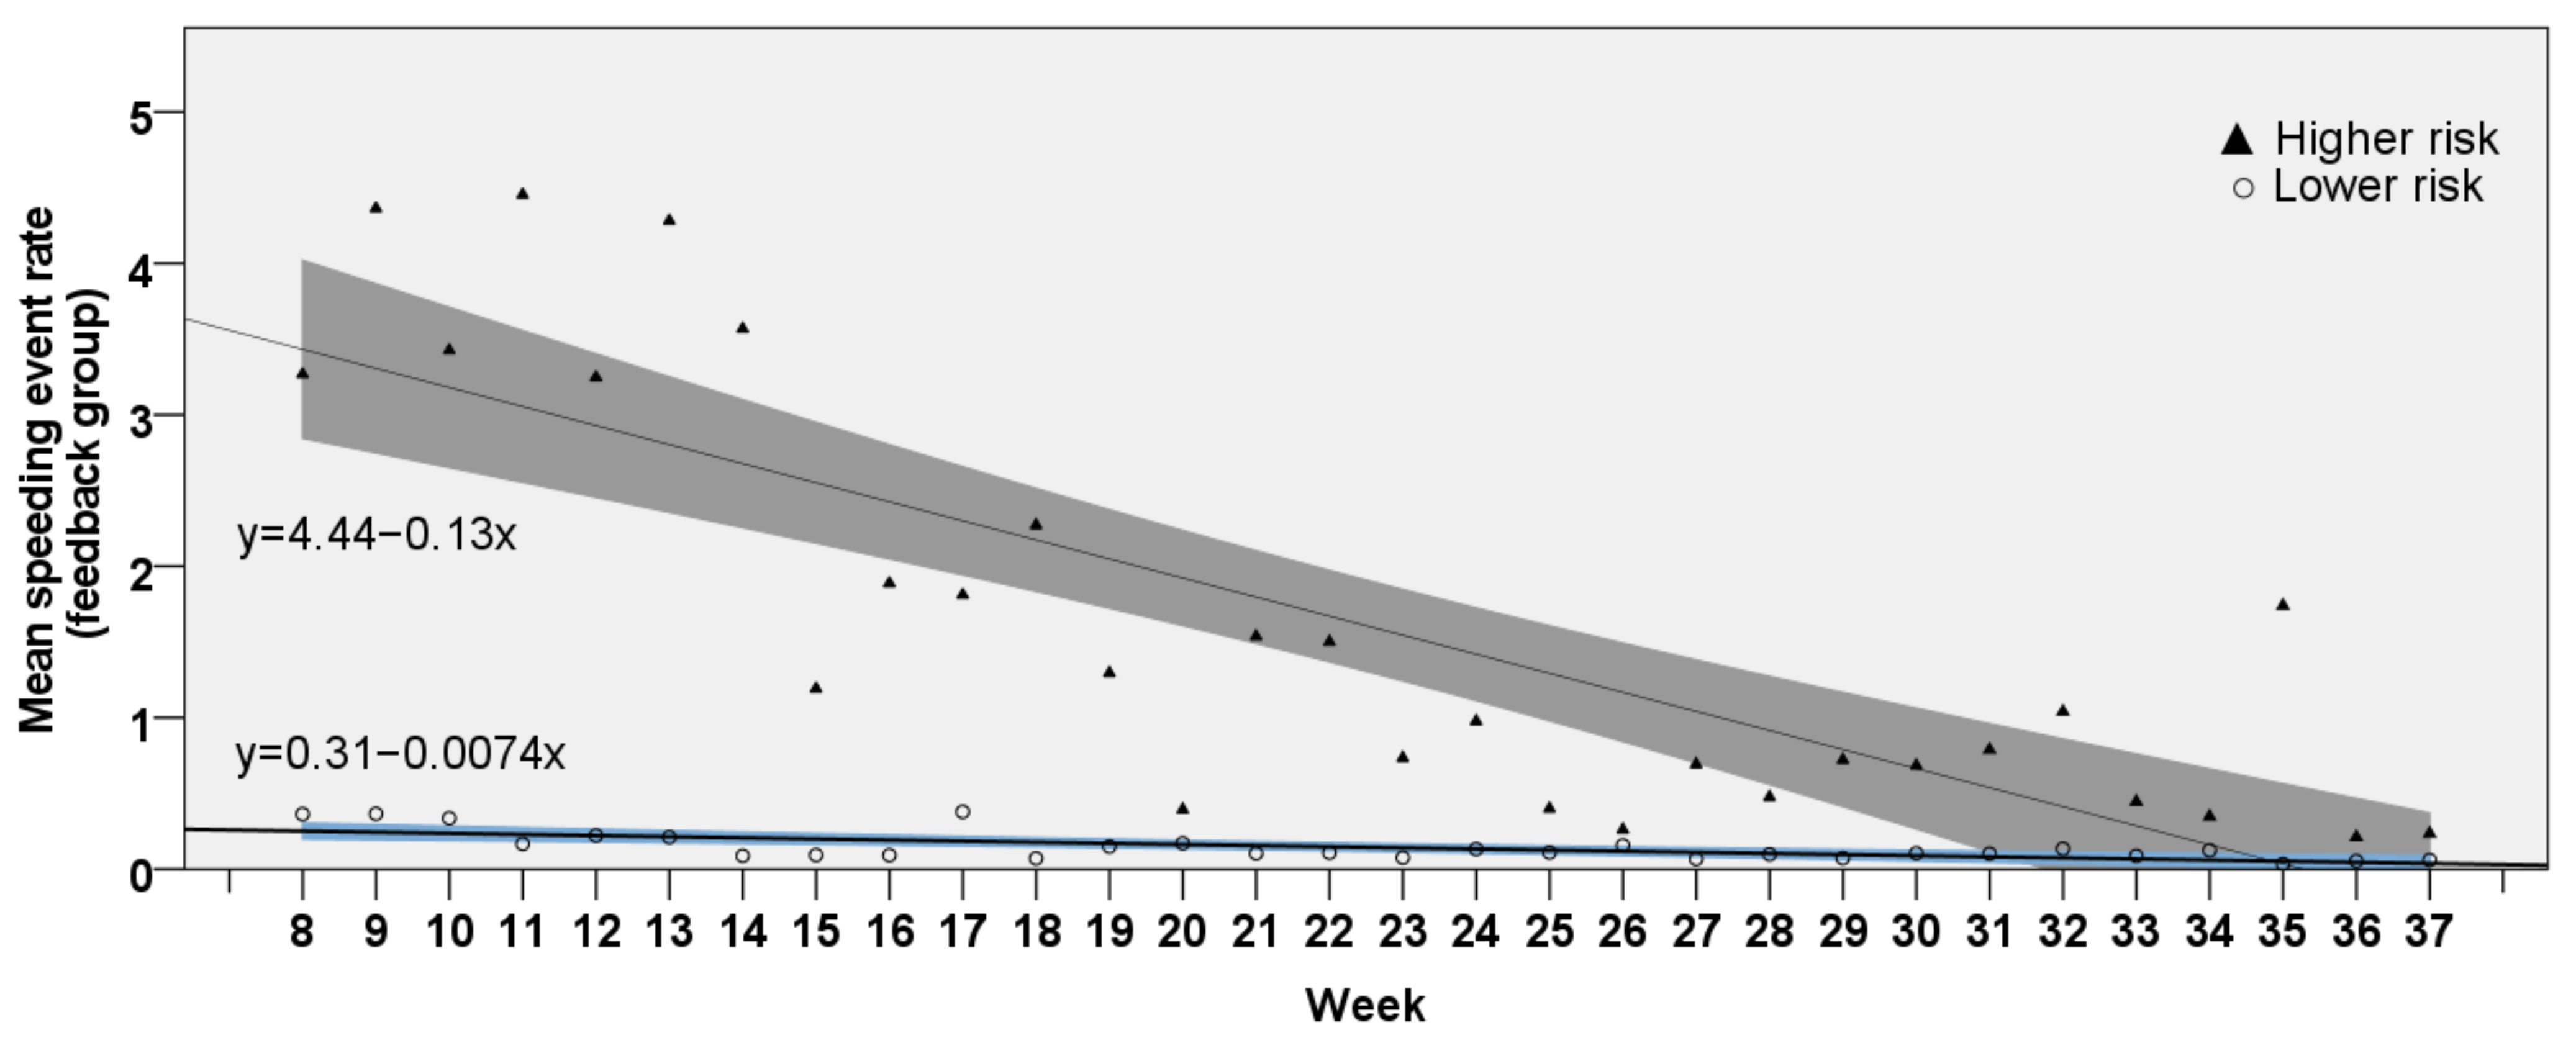
3.3. Trend Analysis of the Speeding Event Rate in Stage 2
The trend analysis aimed to understand how the speeding event rate changed over time within the stage 2 period alone. For the feedback group,
Figure 4 shows the means of the speeding-event rate and the predicted rates by linear regression, with the shaded regions as the 95% confidence intervals. The higher-risk clustered drivers had a significant decrease in the speeding event rate with a slope of −0.13 (t(28) = −7.41,
p < 0.001). This can be interpreted as a predicted decrease in event rate by 1.3 every ten weeks. In comparison, the low-risk cluster also had a significant decrease in speeding event rate with a slope of −0.0074 (t(28) = −4.80,
p < 0.001), indicating a much shallower slope and a smaller decrease in event rates over time. Essentially, this means that for lower-risk drivers, the safety program’s potential impact was low given that their speeding event rates were already low to begin with.
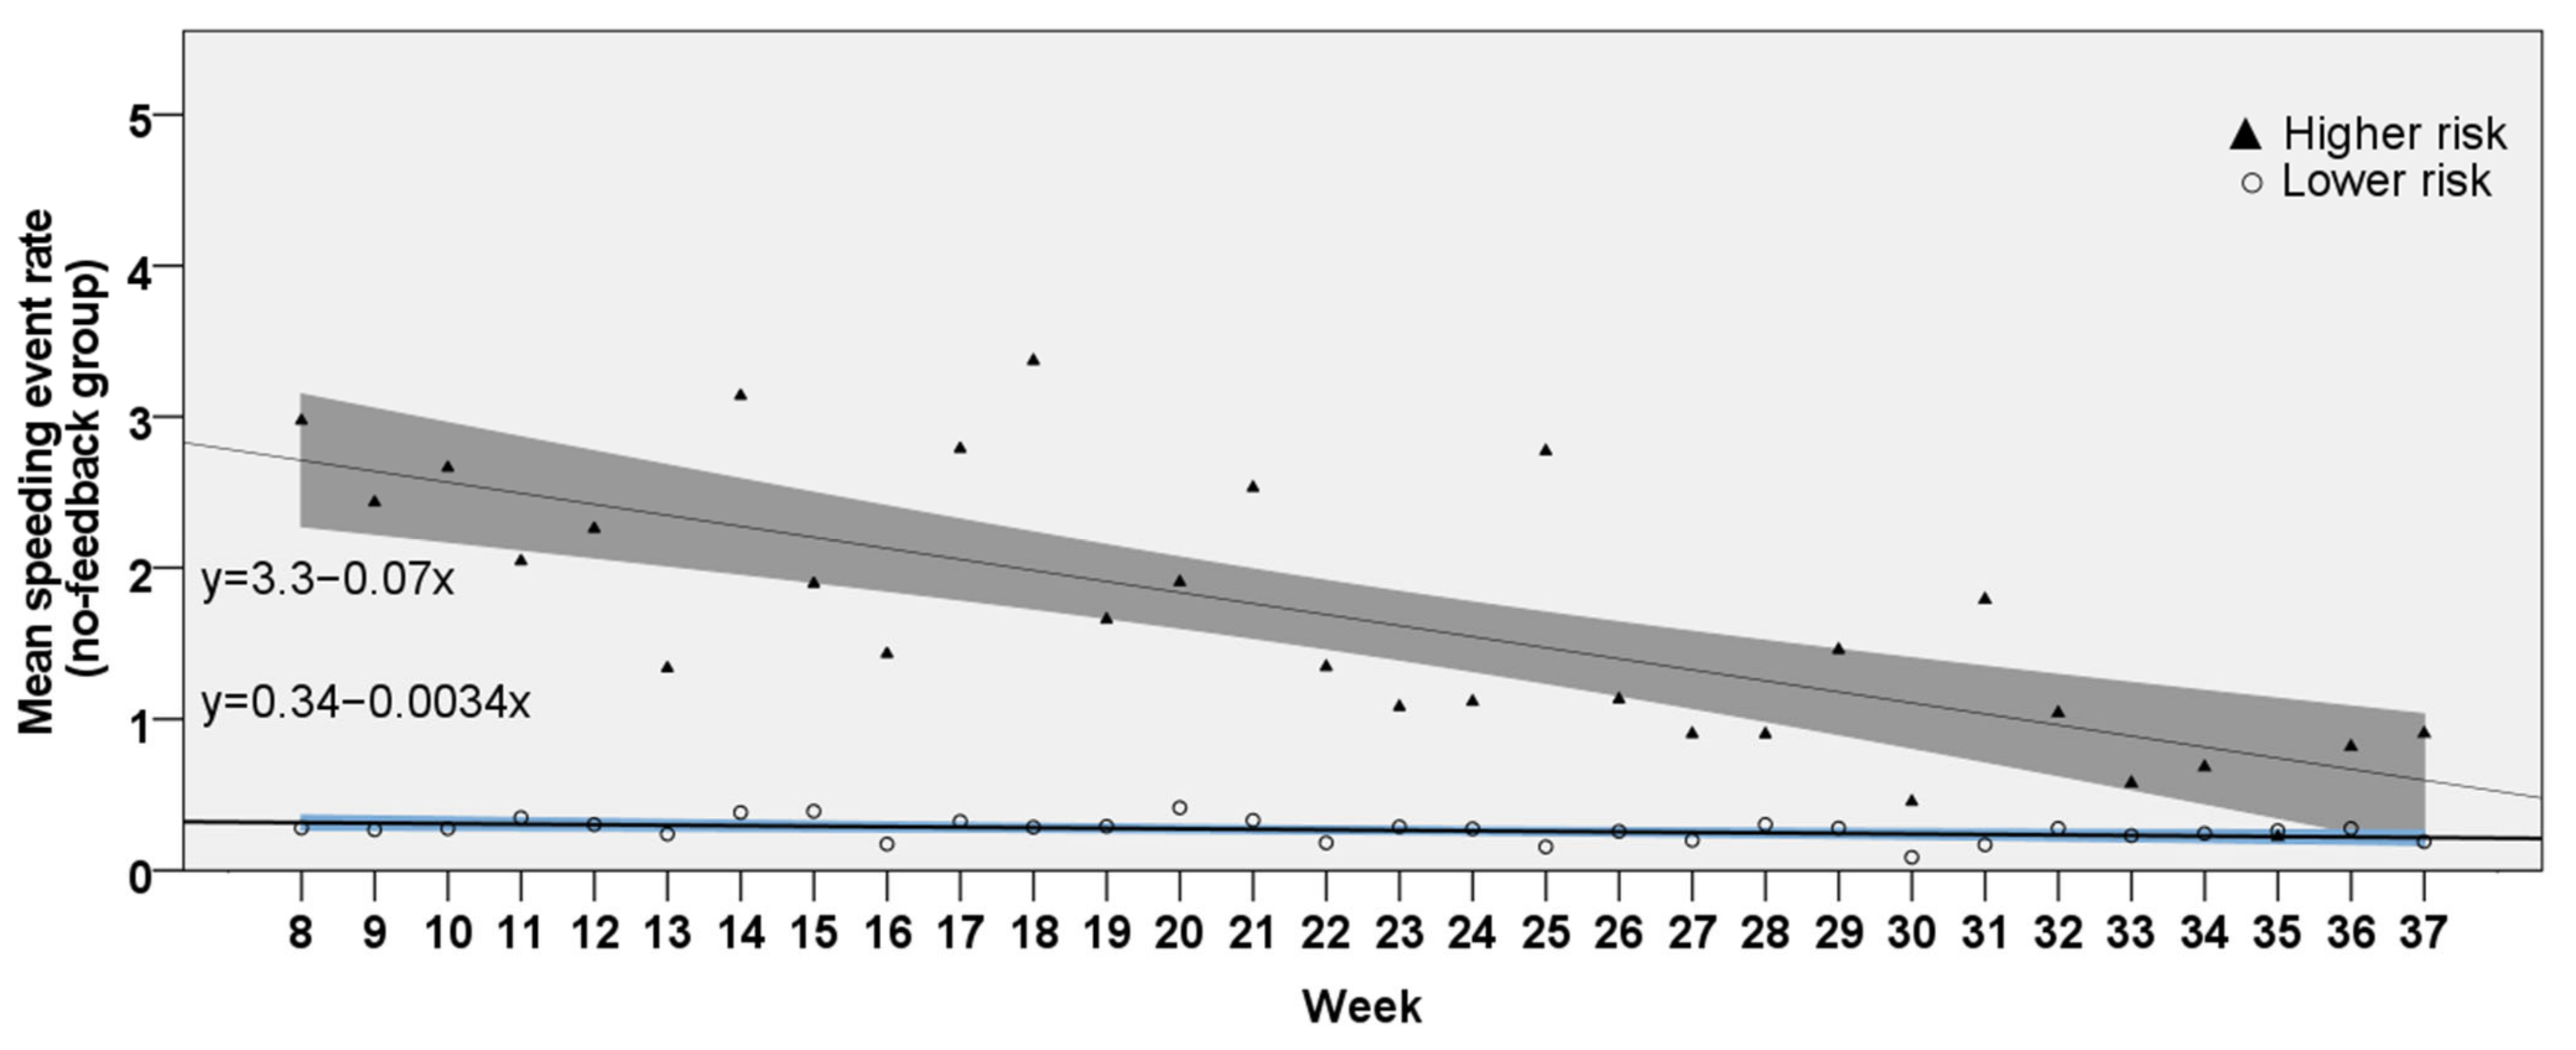
For the no-feedback group,
Figure 5 shows the mean speeding event rates, linear regressions for prediction, and the 95% confidence intervals. The speeding event rates for the higher-risk cluster significantly decreased with a slope of −0.07 (t(28) = −5.77,
p < 0.001), indicating a potential predicted decrease in the event rate by 0.7 over 10 weeks. These higher-cluster drivers who were not in the feedback group also tended to decrease event rates in stage 2, but the tendency did not drop as sharply as for the feedback group. For the lower-risk cluster in the no-feedback group, the fitted line slope was only −0.0034 (t(28) = −2.40,
p < 0.05). This is even closer to zero than the low-risk cluster in the feedback group, again indicating that these drivers’ speeding performances were low to begin with and without much room for further improvement.


