Article

Effective Trigger Speeds for Vehicle Activated Signs on 20 mph Roads in Rural Areas

1
Transport Research Institute, School of Computing, Engineering and Built Environment, Edinburgh Napier University, Edinburgh EH10 5DT, UK
2
Department of Transportation and Hydraulic Engineering, School of Rural & Surveying Engineering, Aristotle University of Thessaloniki, 54124 Thessaloniki, Greece
*
Author to whom correspondence should be addressed.
Safety 2024, 10(1), 25; https://doi.org/10.3390/safety10010025
Submission received: 23 November 2023 / Revised: 25 February 2024 / Accepted: 27 February 2024 / Published: 6 March 2024
(This article belongs to the Special Issue Human Factors in Road Safety and Mobility)

Abstract

:
This paper aims to offer novel empirical evidence as to the identification of the most effective Trigger Speeds (TS) for Vehicle-Activated Signs (VAS) in rural areas. To achieve this, an experimental study was carried out in the area of Scottish Borders, UK, in settlements with 20 mph speed limits. To determine the effective trigger speeds for VAS, in terms of reducing vehicle speeds, a comparative quantitative analysis was conducted using traffic and speed data collected during different waves of a traffic survey, for which various TS settings were deployed (24 mph, 28 mph and 35 mph). The descriptive analysis showed that the 24 mph TS threshold seems to be more effective compared to the other TS settings considered, mainly in terms of reducing the 85th percentile speeds. The 28 mph threshold was identified to yield slightly lower mean speeds compared to the other TS settings. Non-parametric and parametric statistical tests were conducted on the basis of approximately 2.8 million speed observations to identify any statistically significant speed differences under various TS settings. Overall, the findings of this study show that the application of VAS in addition to 20 mph speed limits helps reduce vehicle speeds. In particular, setting a TS to remind drivers, especially those driving between 21–24 mph, that they should slow down has led to statistically significant reductions in speeds driven. This provides road safety benefits both from the reduction in kinetic energy in the transport system, any consequent crash-related outcomes, and also by improving perceived safety for all who use and live close to roads where 20 mph speed limits augmented with VAS have been implemented.

1. Introduction

The global challenge of road safety remains a perennial issue considering the magnitude of the injuries and deaths associated with human mobility across the world. Global road casualties are shown to have increased in 2022; nonetheless, they are still lower than the pre-COVID-19 levels [1]. In the UK, comparing pre- and post-COVID-19 collision and casualty data, there is a decline of 3% in 2022 as compared to 2019 [2]. Scotland has a target to reduce road traffic deaths by 2030 yet it had achieved no reduction considering fatality data from 2022 [3]. This is an indication that more strategic efforts are still required to prevent and mitigate road crashes and their impacts on the society and economy, especially in the aftermath of the COVID-19 pandemic [4].
As widely acknowledged, vehicle speeds are key contributors to road safety. A wide array of previous studies point to the significant impact of speeding and speed variations on school safety [5]; residential neighbourhoods safety [6,7,8]; cyclist safety [9]; and pedestrian safety [10]. To mitigate the negative impact of speeds on public health, a range of traffic calming measures have been deployed either individually or jointly to curb the dominant speeds of motorised traffic, above all in built-up areas, and, consequently, to reduce the frequency and severity of collisions. Through physical, engineering [11], or psychological measures [12], the traffic calming interventions aim at facilitating the behavioural change of motorised users and boosting the perceived safety and confidence of non-motorised users in using the road space.
Indeed, 20 mph (or 30 km/h) speed limits are at the heart of speed management measures implemented in settlements and communities aiming to reduce the speed of motorised traffic and foster the shift away from the use of motorised means of travel. Recently published studies [8,9,10] on the effectiveness of 20 mph speed limits in urban and rural areas suggest that that combined effects of lower speed limits with other traffic calming measures may entail plausible effects in terms of speed reduction as well as in terms of promotion of public health and well-being [13,14]. Gonzalo-Orden et al. [15] evaluated the effectiveness of speed reduction on different street sections based on different traffic calming measures such as normal and raised crosswalks, speed warning signs, and lane narrowing. The effectiveness of similar measures across different urban areas in Spain (Europe) was evaluated indicating plausible outcomes in terms of reduction of traffic speed and volume and reduced occurrences of pedestrian-associated deaths involved in a crash [16]. Similar studies in different cities in the United States and other countries point to the repeatability and universality in efficiency of traffic calming measures [17,18].
Vehicle-activated signs (VAS) constitute a potentially key sub-group of traffic calming measures, which can potentially have a synergistic impact on speed and mode choice alongside other speed management measures. Specifically, it has been established that VAS jointly implemented with other traffic calming measures have varying effects on speeds, mainly in terms of speed reductions and variations [19,20,21]. Notably, VAS help enhance the consciousness of drivers as to their driving speed and its alignment (or mis-alignment) with the speed limit on a given road segment. A vehicle-activated sign is a traffic-responsive safety sign equipped with sensors and it is deployed alongside the road to warn and inform the drivers once they exceed the posted speed limit by displaying messages [19]. The VAS operation is based on the principle that a specific warning or informative message will be displayed when the speed of an approaching vehicle exceeds a pre-determined threshold. Previous evidence suggests that VAS, especially when combined with other calming measures, help mitigate the direct effects of speeding and speed variations on road safety [22] and help promote active travel [23].
According to Jomaa et al. [20], VAS are extensively deployed to reduce speeding and enhance safety. However, there is very sparse evidence in the literature as to the determination of the Trigger Speed (TS), which can deliver an optimal effectiveness of VAS, in terms of reducing vehicle speeds. The TS represents a critical speed value at which the VAS is either activated or displays a specific message that is different to any messages shown for speeds below this threshold. This present study aims to fill in the research gap on the determination of the most effective trigger speed for VAS in predominantly rural areas.
There is little evidence from the international literature as to the effectiveness of VAS ([13,20,24]). This evidence gap includes the determination of most effective TS for VAS activation and any messages that are displayed to drivers to alert them to their actual speed and potentially words indicating that they need to reduce their speed. The lack of evidence about the trigger speeds of VAS is most pronounced on roads with lower speed limits (20 mph/30 kmph and 30 mph/50 kmph), especially in rural areas. The lower speed limits may not significantly affect the speed at which the VAS is activated; however, the information that is displayed on the VAS (e.g., whether the vehicle is above or below the speed limit, actual vehicle speed) should be potentially disseminated at varying speed levels of the approaching vehicles [25]. This is important in order to ensure that the drivers receive critical information about their speed selection, especially when an urgent action is needed (e.g., braking and speed reduction). Previous studies have not investigated how trigger speed should be set in a low-speed road environment, and particularly, on 20 mph roads, as previous investigations of optimal trigger speeds mainly refer to 30 mph (40 km/h) roads.
In this context, the present study seeks to contribute to the world-wide evidence on VAS, particularly in a high-income country. The overarching aim of this study is to provide new evidence as to the most effective trigger speed for VAS in a predominantly rural area where 20 mph is the default speed limit for roads in built-up areas. Setting optimal trigger speeds of VAS in such areas is expected to further adjust vehicle speeds and expand the gains of the 20 mph speed limit in terms of collision and casualty reduction and potentially the promotion of active travel. To achieve this aim, the objectives of this study were set out as follows:
  • to identify the most effective TS for VAS on roads with a 20 mph speed limit; and;
  • to identify whether the TS policy evidently affects vehicle speed selection and driver behaviour.

2. Materials and Methods

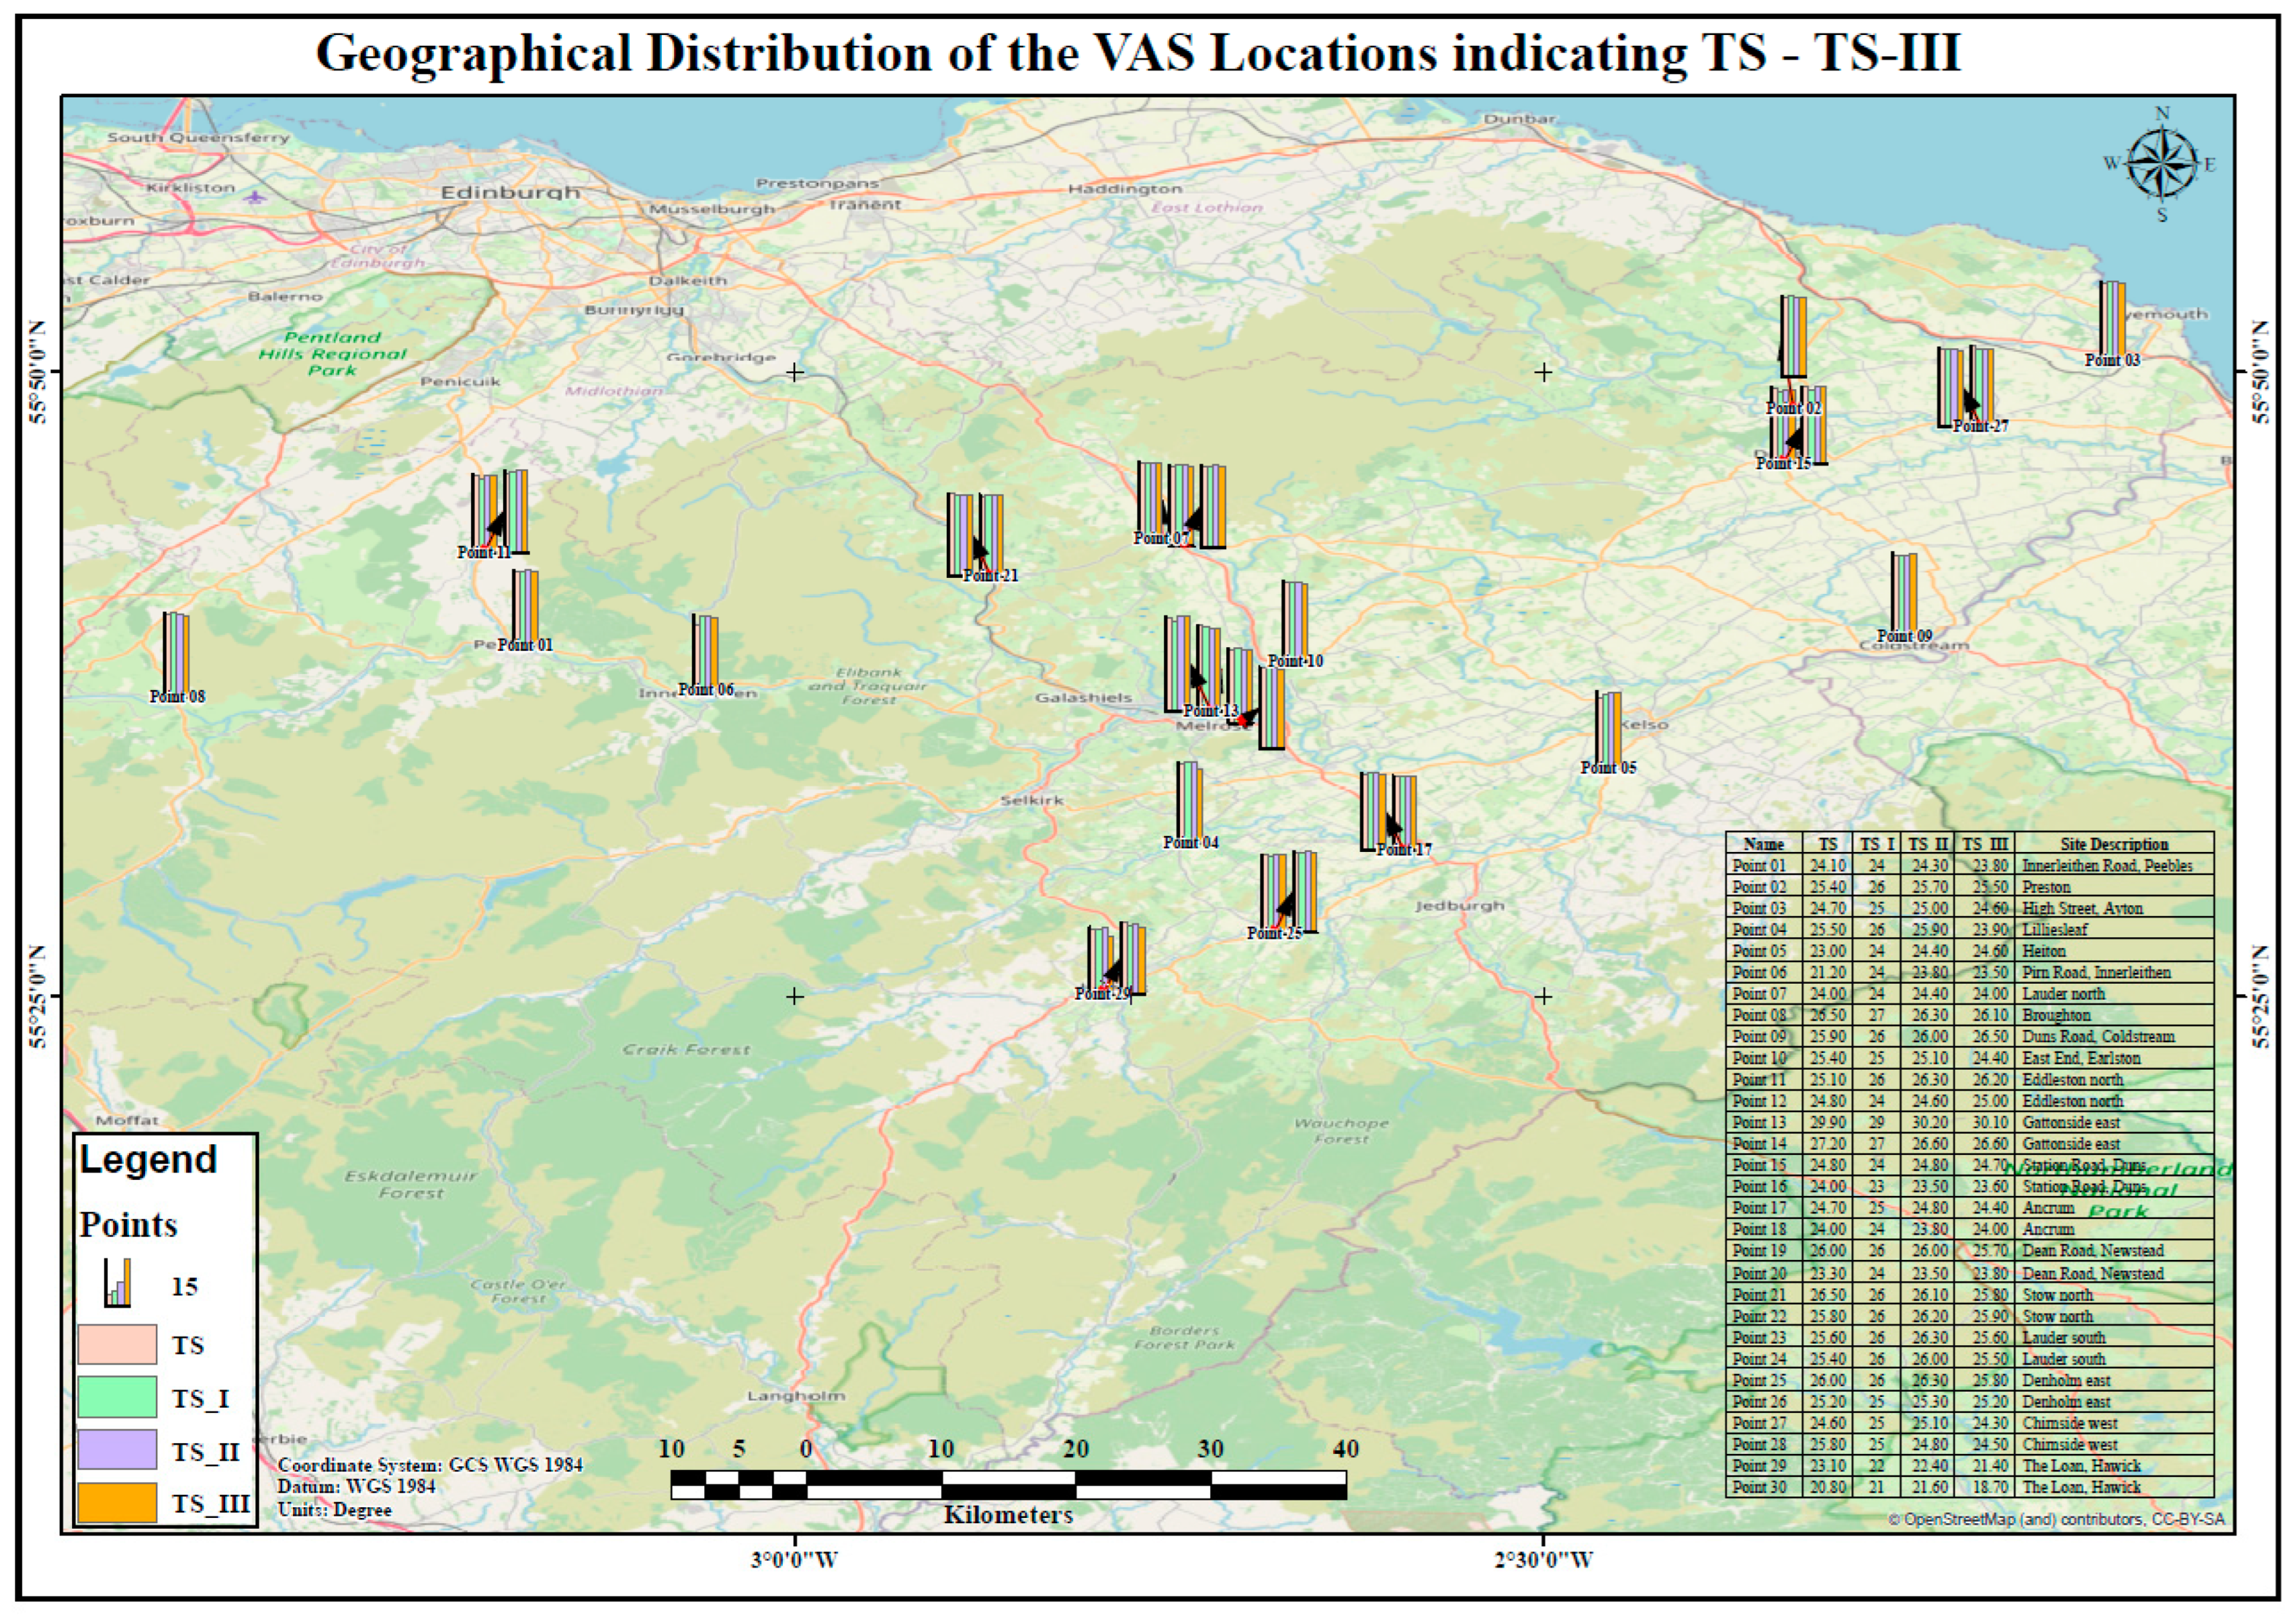
2.1. Data Source, Collection and Processing

To identify the most effective TS for VAS on 20 mph roads, the Scottish Borders area in the UK was selected as a suitable case study. Following the completion of the 20 mph speed limit intervention in the Scottish Borders area, which led to the establishment of a default 20 mph speed limit in built-up areas (see [13] for more details), the Scottish Borders Council (SBC) launched a new project focusing on trigger speeds for VAS in 2022. The introduction of VAS added a potentially significant traffic calming measure to increase the safety and overall well-being of all road users, inclusive of those outside of vehicles, as well as potential wider environment benefits. As such, the Scottish Borders area constitutes the most appropriate spatial setting for accommodating one of the key objectives of this study, i.e., the identification of the most effective TS for VAS in a 20 mph speed limit context. This project explores the most effective trigger speeds for VAS, in terms of speed reduction, in order to encourage drivers to reduce to or maintain their speeds at or close to 20 mph.
The TS for VAS were introduced at over 30 sites across various settlements of the Scottish Borders Council in the period between June 2022 and March 2023. The selection of the site is based on the outcomes of the 20 mph speed limit intervention and the local knowledge of the area based on the traffic history; this ensures a reasonable spread and a good coverage. Figure 1 shows a map with the geographical distribution of the locations (sites) where VAS were deployed.
For this study, we also made use of historical speed data from the commencement of 20 mph speed limits across almost all SBC settlements since December 2020. The data is available in the following order of phases:
  • VAS installed and activated with the benchmark TS [TS data–28 mph threshold speed];
  • VAS activated with the TS-I [TS-I data–24 mph threshold speed];
  • VAS activated with the TS-II [TS-II data–35 mph threshold speed];
  • VAS activated with the TS-III [TS-III data–28 mph threshold speed].
The breakdown of the VAS settings across all phases is shown in Table 1.
As shown in Table 1, the VAS are activated when the vehicle speed exceeds the 12 mph threshold in all cases. This is a pre-set speed value that remains constant across all the phases of the study. If the speed of the approaching vehicle is lower than the speed limit of the road (i.e., 20 mph), the speed of the vehicle is displayed on the VAS, along with a “Thank you” message. The wording of this message serves as an acknowledgment to the driver for their compliance with the speed limit. For vehicles exceeding the speed limit, the content of the message serves as a warning to the drivers to comply with the traffic rules; in that case, the VAS displays a “Slow down” message and the actual vehicle speed. However, the latter is displayed on the VAS screen only up to a particular speed threshold. If highly exceeding speeds are continuously displayed on VAS, an erroneous message may be communicated to the non-compliant drivers, who may believe that they can drive at that speed without legal consequences. To address this potential issue, the speed is displayed only up to a certain speed threshold, and when the approaching vehicles exceed that threshold, then only a “Slow down” message is displayed. The speed value at which the actual speed of the vehicle is no longer displayed on the VAS is considered as the trigger speed in this study. The actual setting of the experiment shows that the only parameter subject to change across the survey waves was the speed at which the “Slow down” message is only shown on the VAS screen. TS was set to take different values across the different phases of the study, which are the following:
  • Twenty-four mph, which is a typical threshold of enforcement for twenty (20) mph roads according to enforcement policy guidance issued by the former Association of Chief Police Officers (ACPO) in the UK (currently the National Police Chiefs’ Council—NPCC).
  • Twenty-eight (28) mph, which constitutes a speed value that approximates the average 85th percentile speed of twenty mph roads in the Scottish Borders area according to recent evidence (see [8] for further details) and historical speed data from the SBC. This speed threshold is typically considered as trigger speed for VAS, according to the standard practice in the UK [20]; therefore, it is considered as a benchmark TS in this study.
  • Thirty-five (35) mph, which represents a threshold of excessive speeds for twenty mph roads according to the guidance of the Department for Transport (DfT) in the UK.
Overall, four waves of traffic surveys were conducted, processed, and analysed along with the historical data drawn from a previous project on the evaluation of the 20 mph speed limit. Corresponding to different sign settings (relating to trigger speeds and VAS display), Surveys 1–4 were conducted at different time periods across 2022–2023, as follows:
  • The “TS” survey, which was conducted with starting date on the 11 of July 2022, also referred to as “Survey 1”.
  • The “TS-I” survey with starting date on the 14 of November 2022, also referred to as “Survey 2”.
  • The “TS-II” survey with starting date on the 16 of January 2023, also referred to as “Survey 3”.
  • The “TS-III” survey with starting date on the 18 of March 2023, also referred to as “Survey 4”.
Each survey wave was carried out by Tracsis, a traffic survey technology company. In addition to the speed data, other associated traffic information, which includes traffic volume counts, and traffic composition by vehicle class was collected and processed. All the survey waves took place for a period of 7 days, 24 h daily at various data collection locations (hereafter referred to as “sites”). Automatic traffic counters (specifically, pneumatic tubes) were used for the collection of speed data from each individual vehicle passing through the data collection sites.
Due to the granularity of the data, the disaggregate speed dataset was quite extensive, and as such, it was further processed and managed by leveraging MySQL- and Python-based algorithms. The data-wrangling process resulted into a unified database for all study locations, which was fit-for-purpose for descriptive and statistical analyses. In all, two million seven hundred and ninety-two thousand four hundred and twenty-one individual speed records were collected, processed, and analysed (the breakdown per each survey wave is: TS–689111, TS I–706035, TS II–673998, TS III–723277, Total–2792421). The individual speed data were collected for different vehicle classes, which include the Pedal cycle/Motorcycle, Car/Light Good Vehicles (LGV), Public Service Vehicle (PSV), Ordinary Goods Vehicle 1 (OGV1), and Ordinary Goods Vehicle 2 (OGV2).
The speed metrics that were computed in this study include the mean speed, the 85th percentile speed and standard deviation of individual vehicle speeds. The use of these metrics can help understand the differences in several dimensions of speed associated with different VAS settings. The suitability and reliability of these metrics for the evaluation of traffic calming measures has been showcased and proven in previous studies [5,26,27,28,29,30] and they are also in line with the current appraisal practice of speed interventions.

2.2. Analysis

To identify the most effective trigger speed for VAS on roads with a 20 mph speed limit, descriptive statistics were deployed for the aforementioned speed metrics. Prior to this, individual speed data were processed using Python-based algorithms, to consolidate the data in a format that is fit for analysis. Thereafter, further statistical tests including Wilcoxon signed-rank tests and t-tests were conducted to identify any statistically significant associations between the trigger speeds and the considered speed metrics.
The descriptive analysis of the speed data includes the calculation of the following key statistics: percentages, frequencies, mean values, percentiles, standard deviations, minimum/maximum values.
Several t-tests were conducted to establish whether differences in vehicle speeds observed under different VAS setting (TS, TS-I, TS-II, TS-III) are statistically significant or not. To carry out the t-tests, the speed data collected from the individual vehicles passing through each site across all the survey waves were used. The essence of performing the statistical tests is to enable a robust comparison of speed measurements on the same site between two different VAS settings (e.g., TS versus TS-I); thus, paired t-tests were carried out (see the Appendix A for the details).
In addition, the study employed the Wilcoxon signed-rank test (a non-parametric test) to determine whether statistically significant differences of average speed metrics exist between different VAS settings (e.g., TS versus TS-I).

3. Results and Discussion

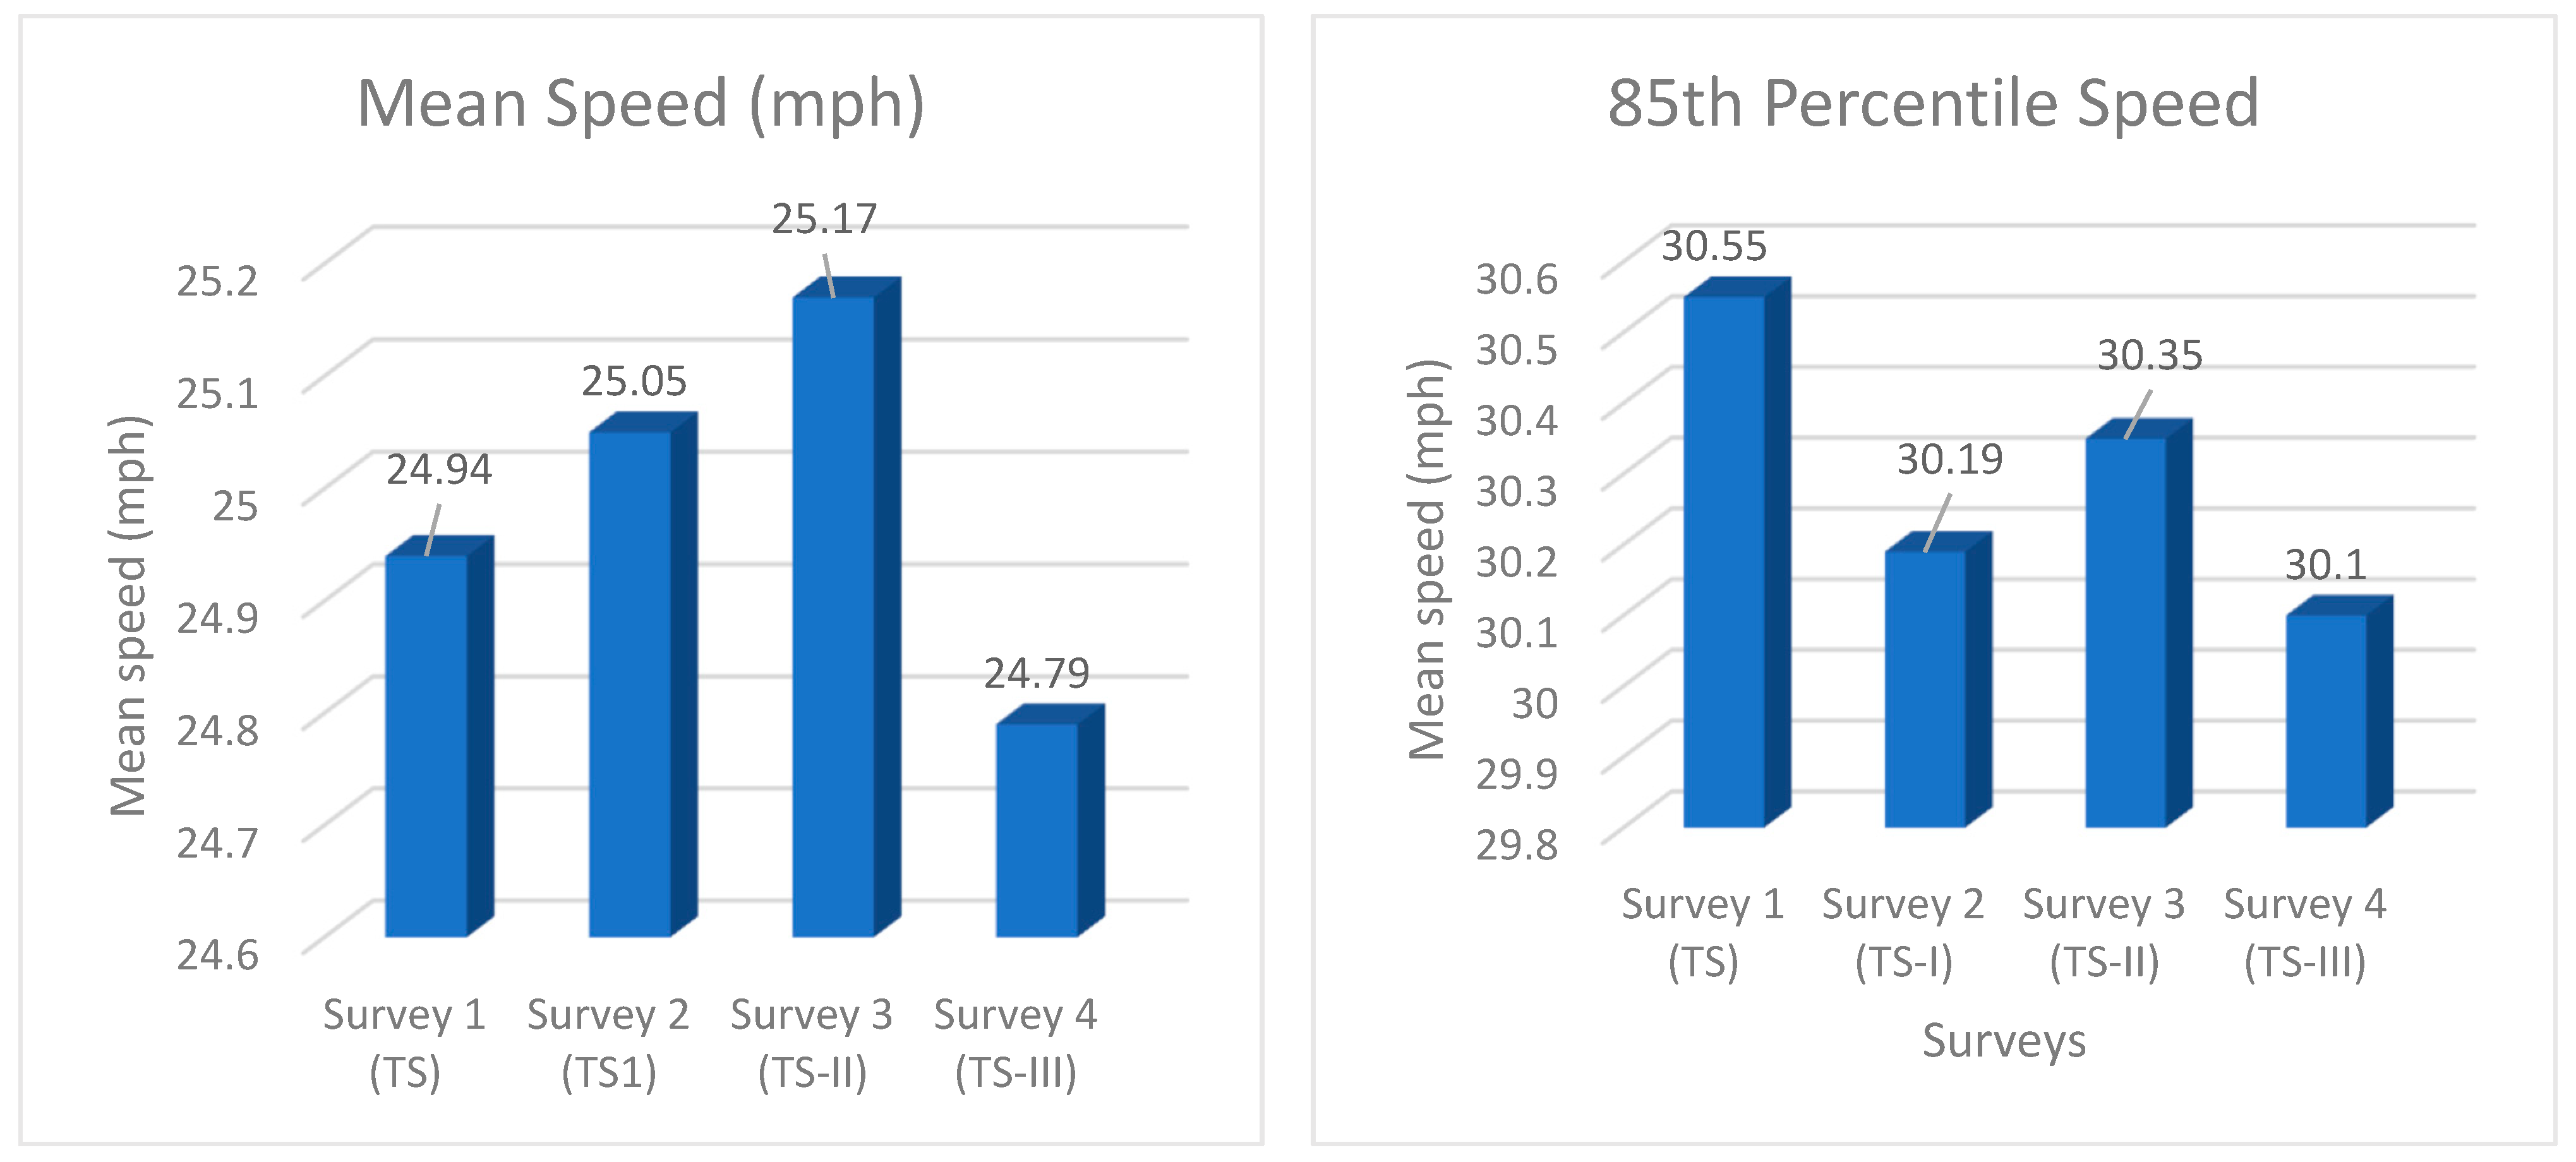
3.1. Analysis of Mean and 85th Percentile Speeds

Table 2 shows the key descriptive statistics of vehicle speeds across the four survey waves, which correspond to different TS settings. In Survey 1, where the benchmark TS was applied, the mean speed across all survey sites is 24.94 mph. A few weeks after the implementation of the TS-I (i.e., in Survey 2), the mean speed is 25.05 mph, thus indicating a 0.11 mph increase compared to TS. Comparing Survey 1 (TS) and Survey 3 (TS-II), the mean speed was found to increase by 0.23 mph on average. When comparing Survey 1 (TS) and 4 (TS-III), where the trigger speed was equal to 28 mph in both cases, a slight drop of 0.15 mph in the average speed can be seen. Overall, it is observed that the reduction of the trigger speed from 28 mph (TS) to 24 mph (TS-I) is associated with a marginal increase of mean speed (by 0.11 mph), whereas the increase of the threshold speed from 28 mph to 35 mph (TS-II) is also associated with a weak mean speed increase equal to 0.23 mph.
The opposite trend is observed for the 85th percentile speeds. As shown in Table 2, decreases in 85th percentile speeds were observed between TS and TS-I, and TS-I and TS-II, equal to 0.36 mph and 0.20 mph, respectively. While, by comparing Survey 1 (TS) and 4 (TS-III), a slight drop of 0.45 mph in the average speed is observed. Overall, it is shown that the reduction in the TS speed from 28 mph (TS) to 24 mph (TS-I) is associated with a mild reduction in the 85th percentile speed, whereas the increase in the TS threshold speed from 28 mph (TS) to 35 mph (TS-II) is also associated with a marginal decrease in the 85th percentile speed. The repeat of the 28 mph TS threshold in TS-III resulted in a lower 85th percentile speed, close to that observed during TS-I. Given that the 85th percentile speed reflects the speed at or below which 85 percent of all vehicles were identified to travel, it can be inferred that when the lowest TS threshold (i.e., the 24 mph threshold) is in place, the vast majority of vehicles travel with slightly lower speeds. In other words, when the other TS thresholds are in place (i.e., the 28 mph or the 35 mph threshold), the majority of vehicles travel at slightly higher speeds compared to the 24 mph TS threshold.
As shown in Table 2, the standard deviations of the mean and 85th percentile speeds have the lowest value when the 35 mph TS was used (TS-II). In other words, speeds are slightly more homogeneous when the highest TS value is used. Reductions in the standard deviation of speeds (compared to the benchmark TS threshold) were also found when the 24 mph was in place. Figure 2 shows a visual comparison of mean and 85th percentile speeds under different TS settings (Survey 1–4).

3.2. Analysis of Mean and 85th Percentile Speed Band for TS-TS1-TSII-TSIII

To provide a more detailed overview of speeds across the survey waves, a breakdown of the proportion of sites corresponding to different speed bands (defined using a 5 mph increment) was developed. As shown in Table 3, TS-I is linked with a visible reduction in the proportion of sites with mean speed in the range of >25–30 mph, compared to TS. Interestingly, 53 per cent of sites had mean speed in the range of >25–30 mph in TS; this value drops to 47 per cent in TS-I. An equal increase in the proportion of sites with mean speed in the range of >20–25 mph is observed in TS-I compared to TS. Comparing TS with TS-II, while the proportion of sites having mean speed in the range of >20–25 mph remains the same (47%), we see that the proportion of sites with mean speed in the range of >25–30 mph decreases in TS-II, as for 3% of sites (i.e., a single site) in TS-II, the mean speed belongs to an even higher speed range, i.e., the >30–35 mph. Overall, this analysis shows that when the 24 mph threshold is in place, the majority of sites have mean speeds belonging to lower speed ranges, and in particular, to the >20–25 mph range.
Also, Table 3 shows that TS-I (24 mph TS threshold) seems to outperform the TS (28 mph threshold) and TS-II (35 mph threshold), in terms of reducing the proportions of sites with 85th percentile speed in high-speed ranges. However, when comparing TS-III with the TS-I, no major differences are observed. As far as the mean speed is concerned, all the sites during the TS-I had mean speeds lower than 30 mph, whereas in TS-III there was a single site with mean speed in the high range >30–35 mph. Pertaining to the 85th percentile speeds, the distribution of sites across all speed bands is quite similar between TS-I and TS-III, with the latter having slightly more sites in the >25–30 mph instead of the >30–25 mph range. Overall, the 24 mph TS threshold is associated with the lowest proportion of sites with high mean speeds; in addition, the lowest proportions of high 85th percentile speeds are identified when the 24 mph and the repeat 28 mph threshold were in place.

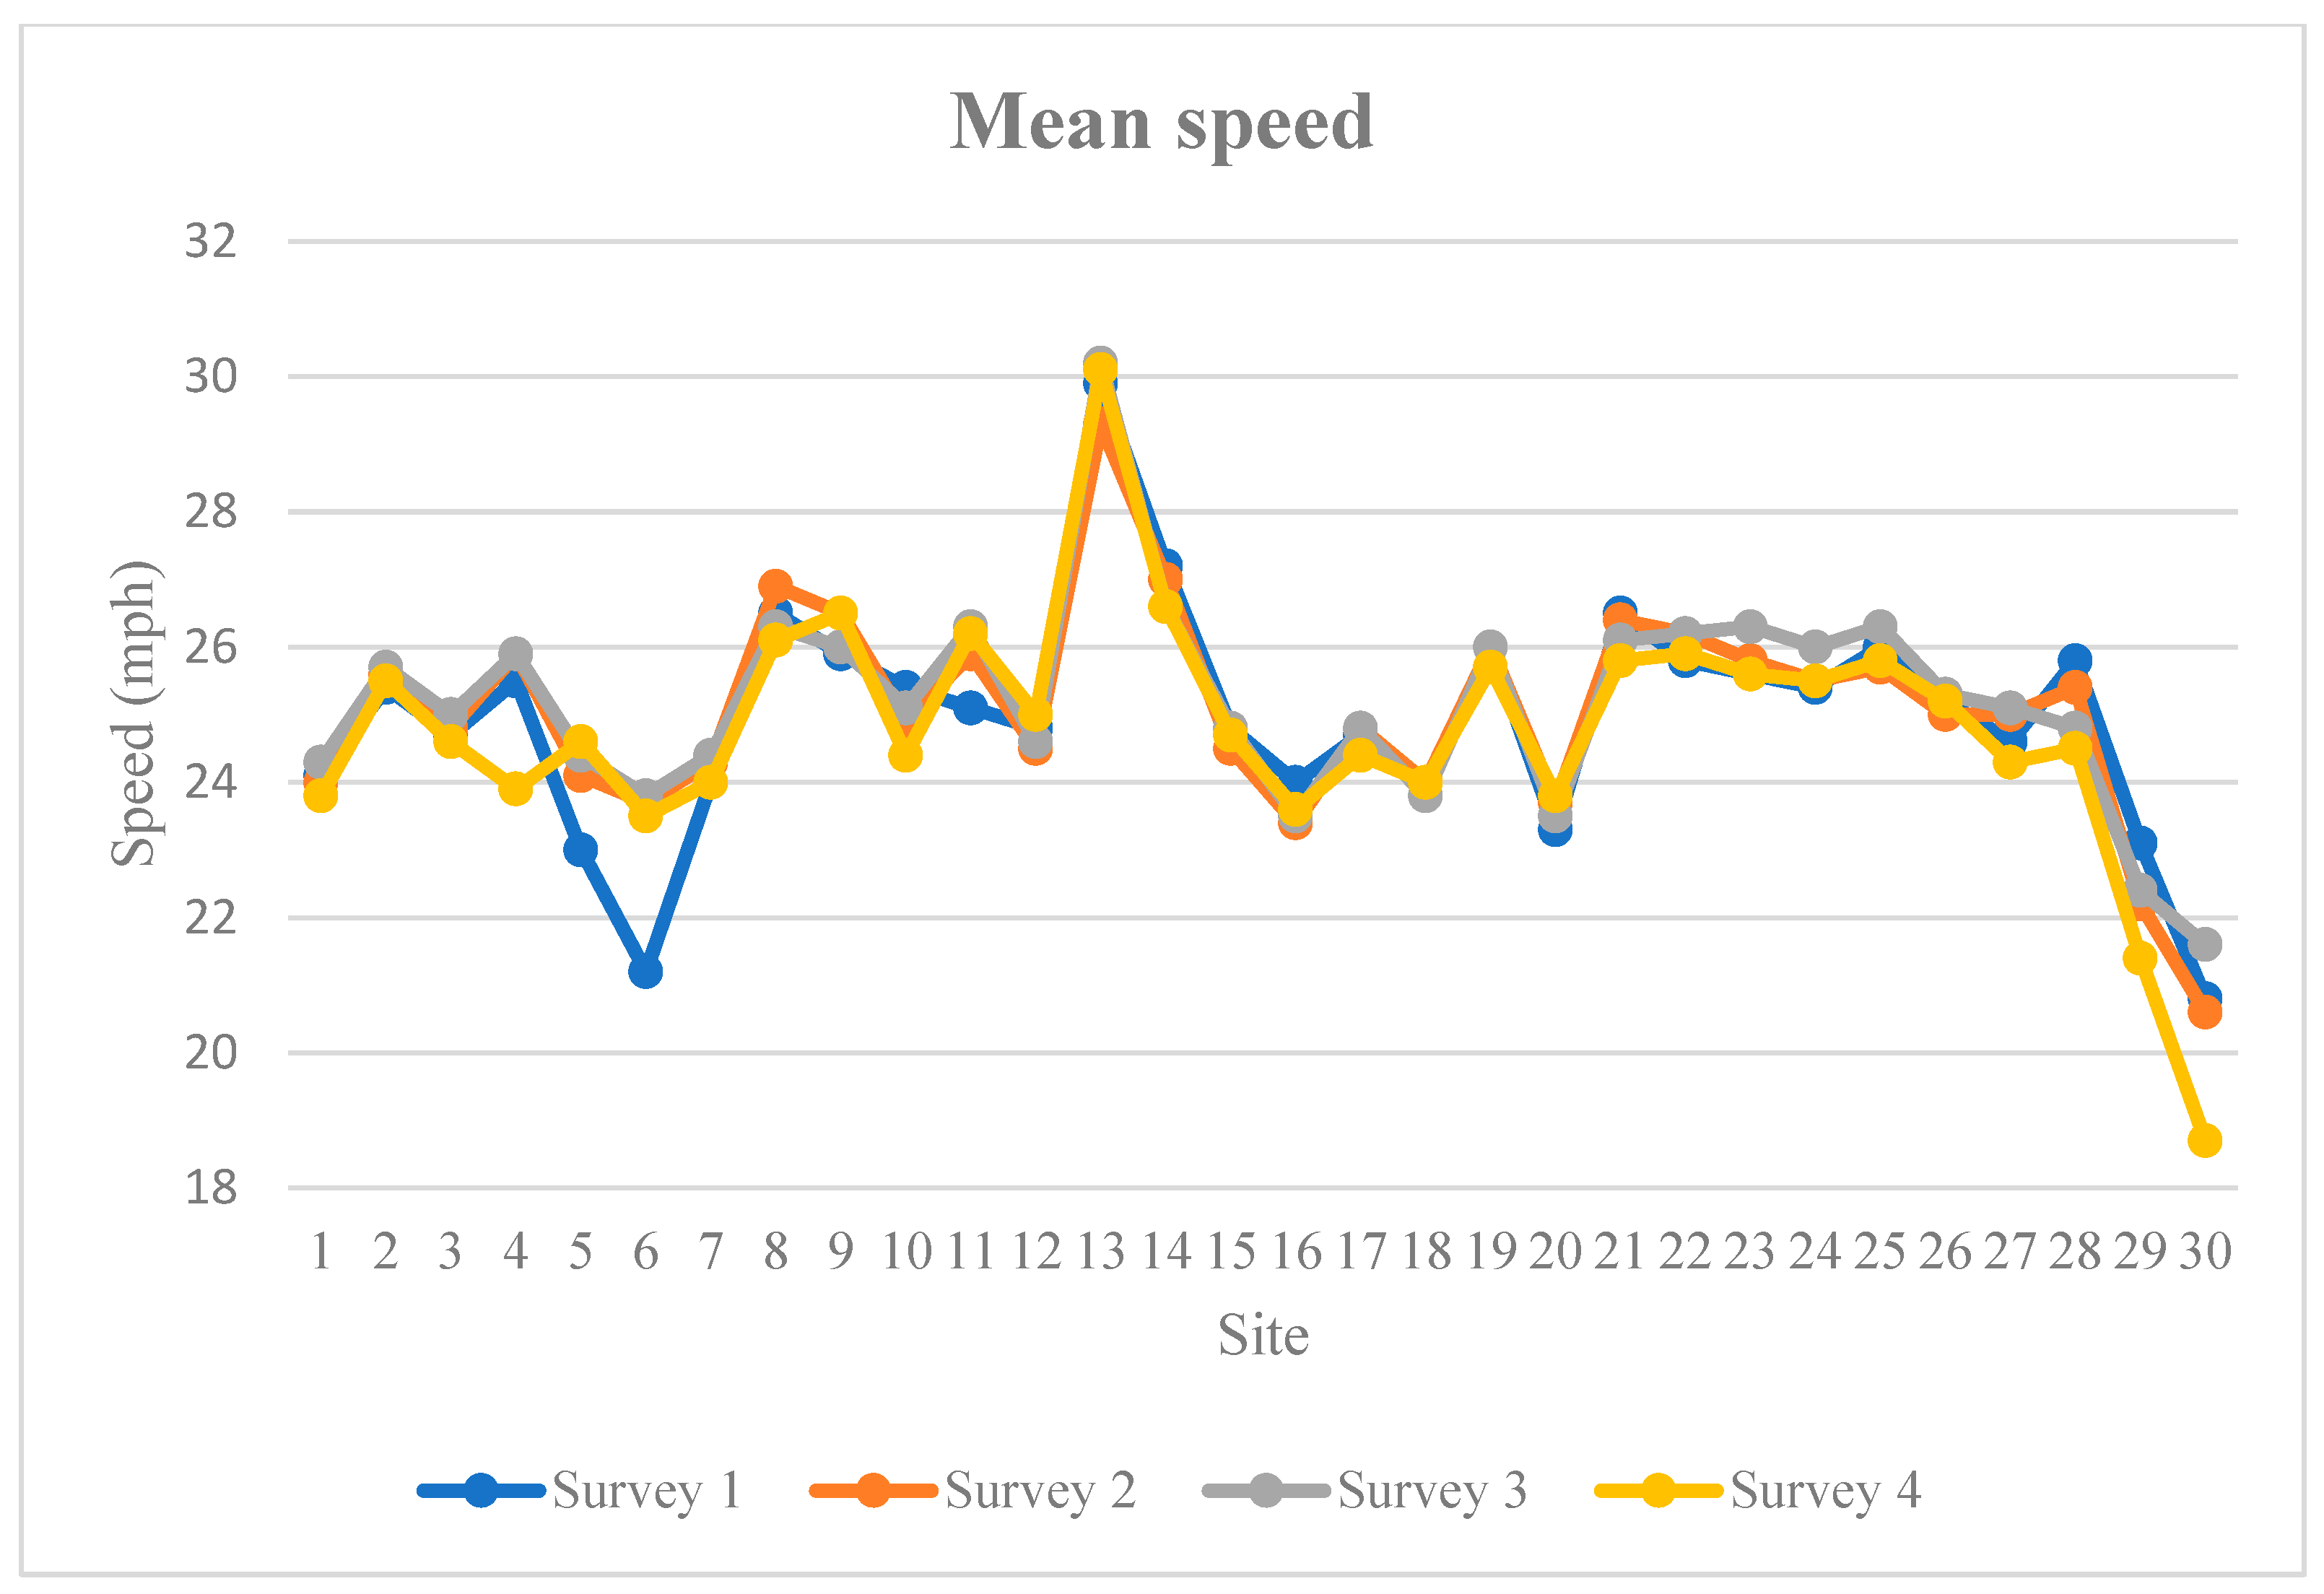
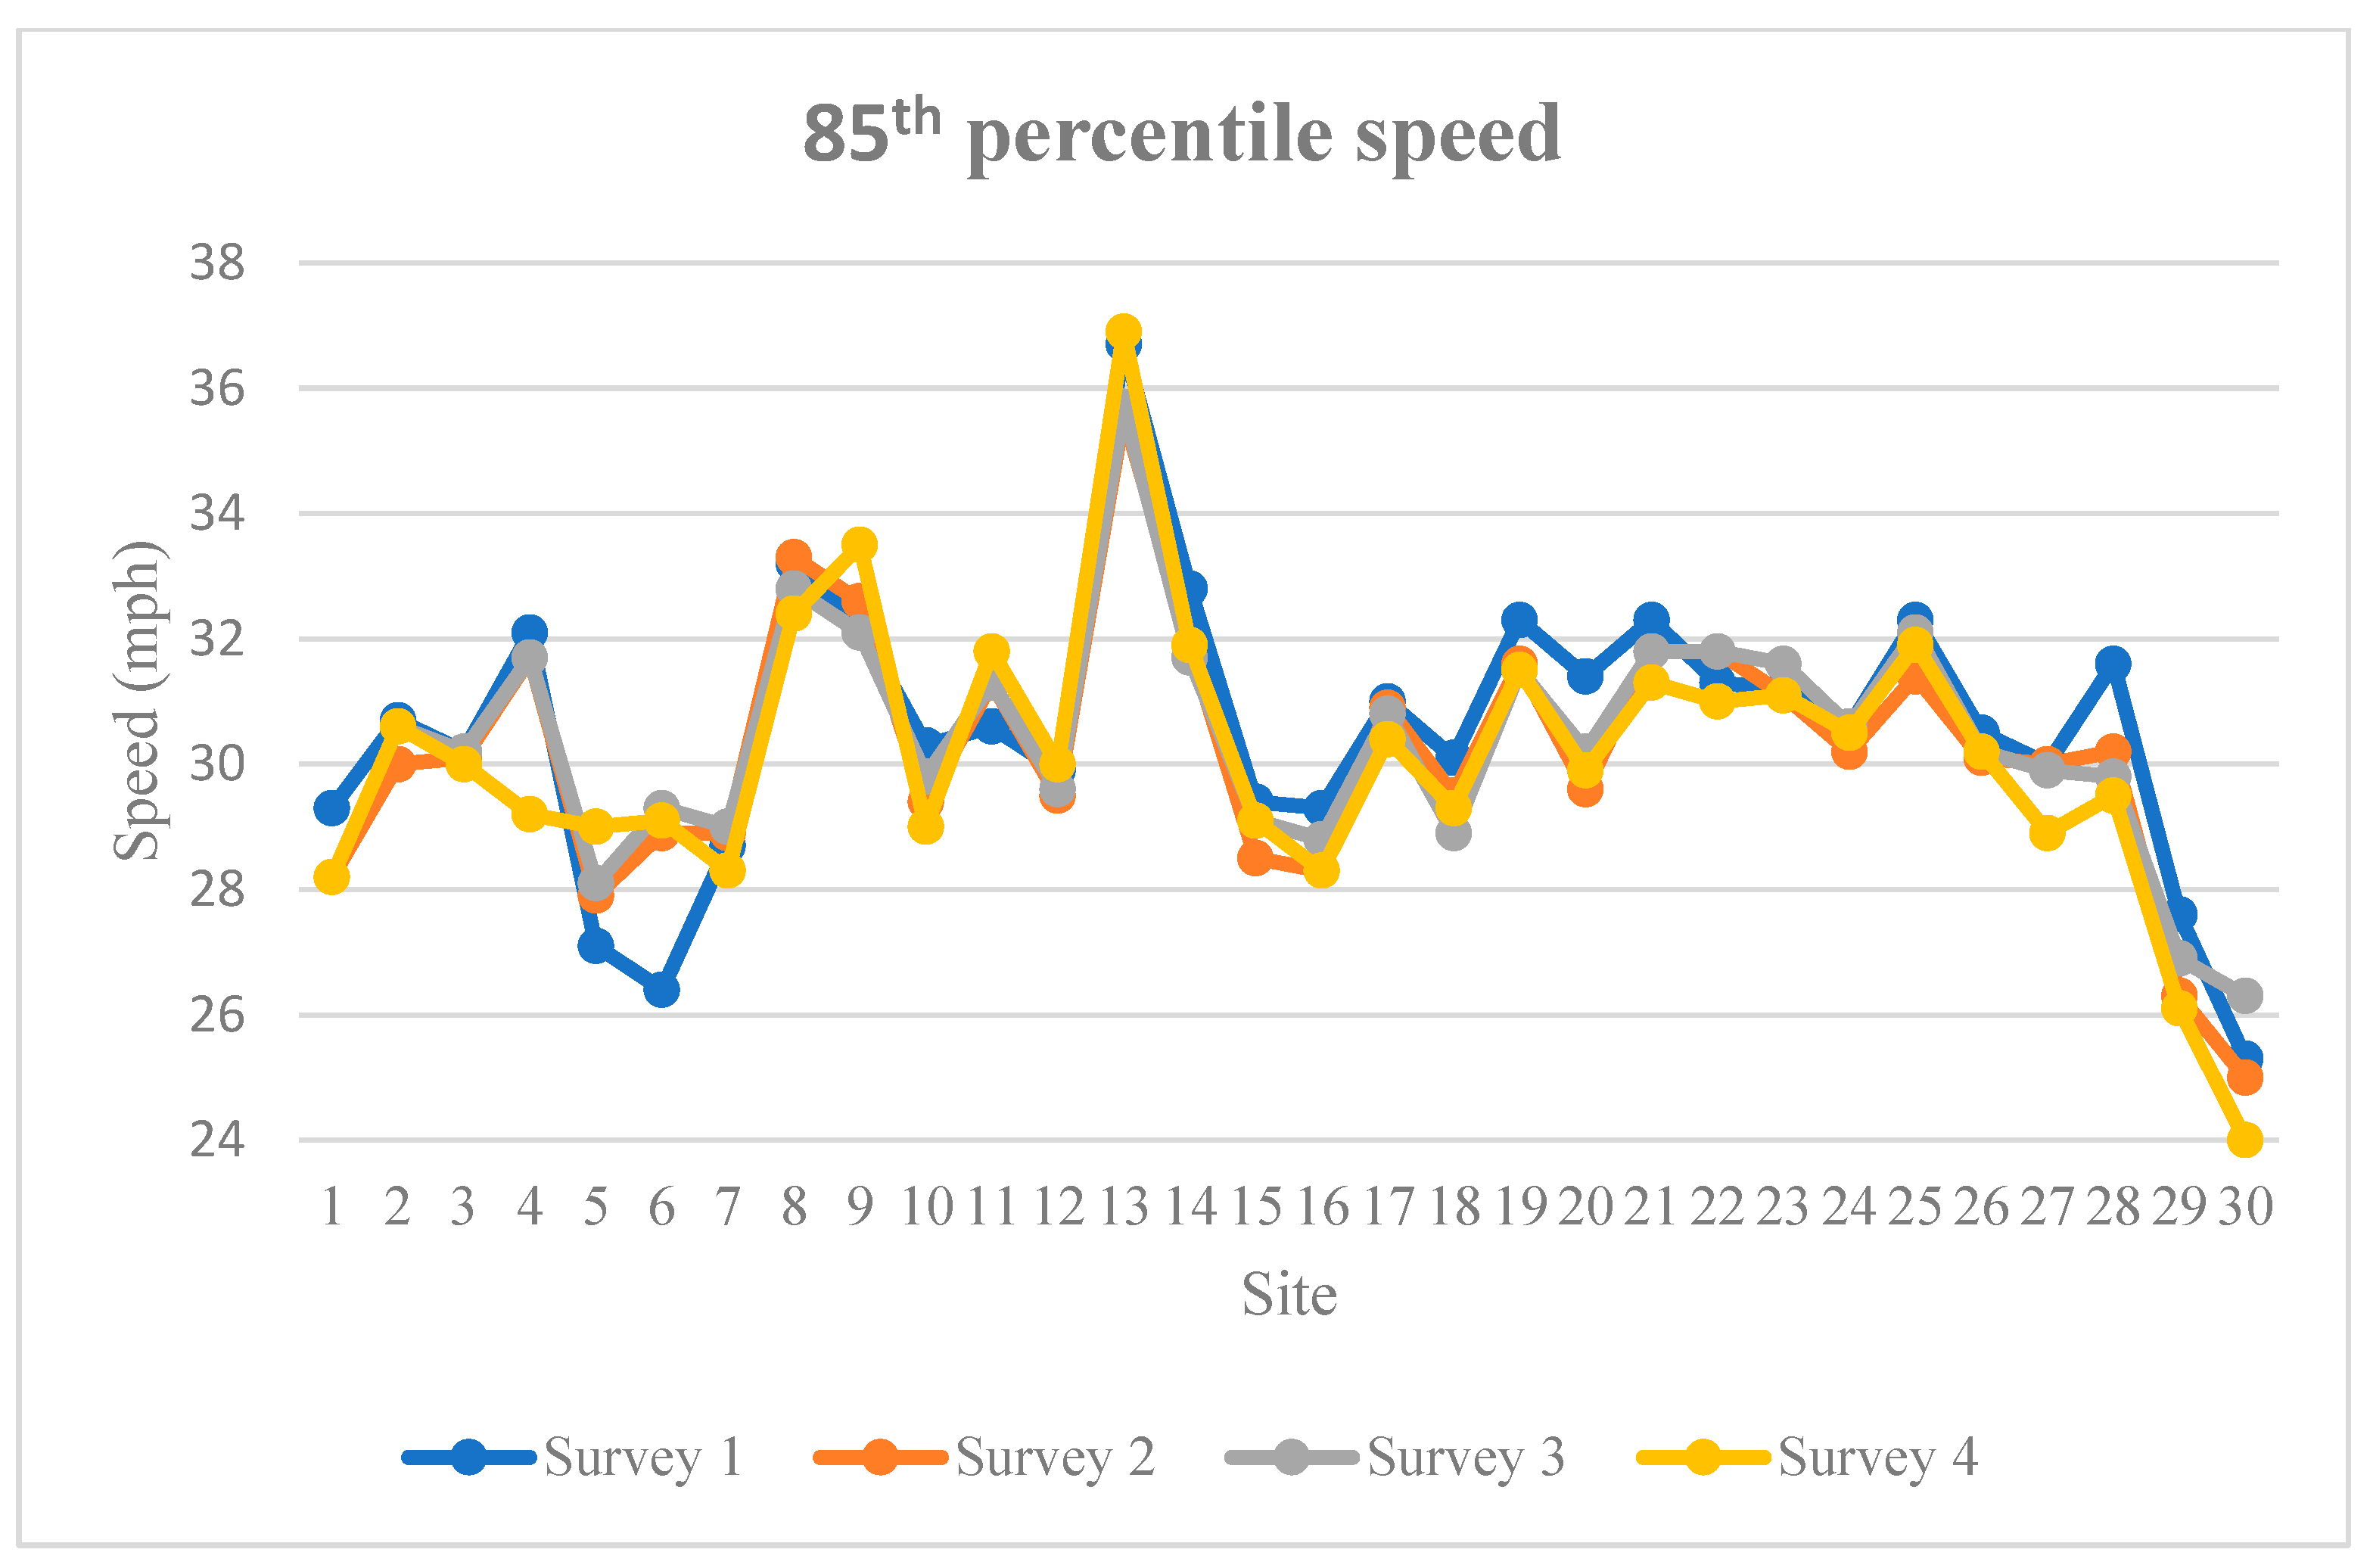
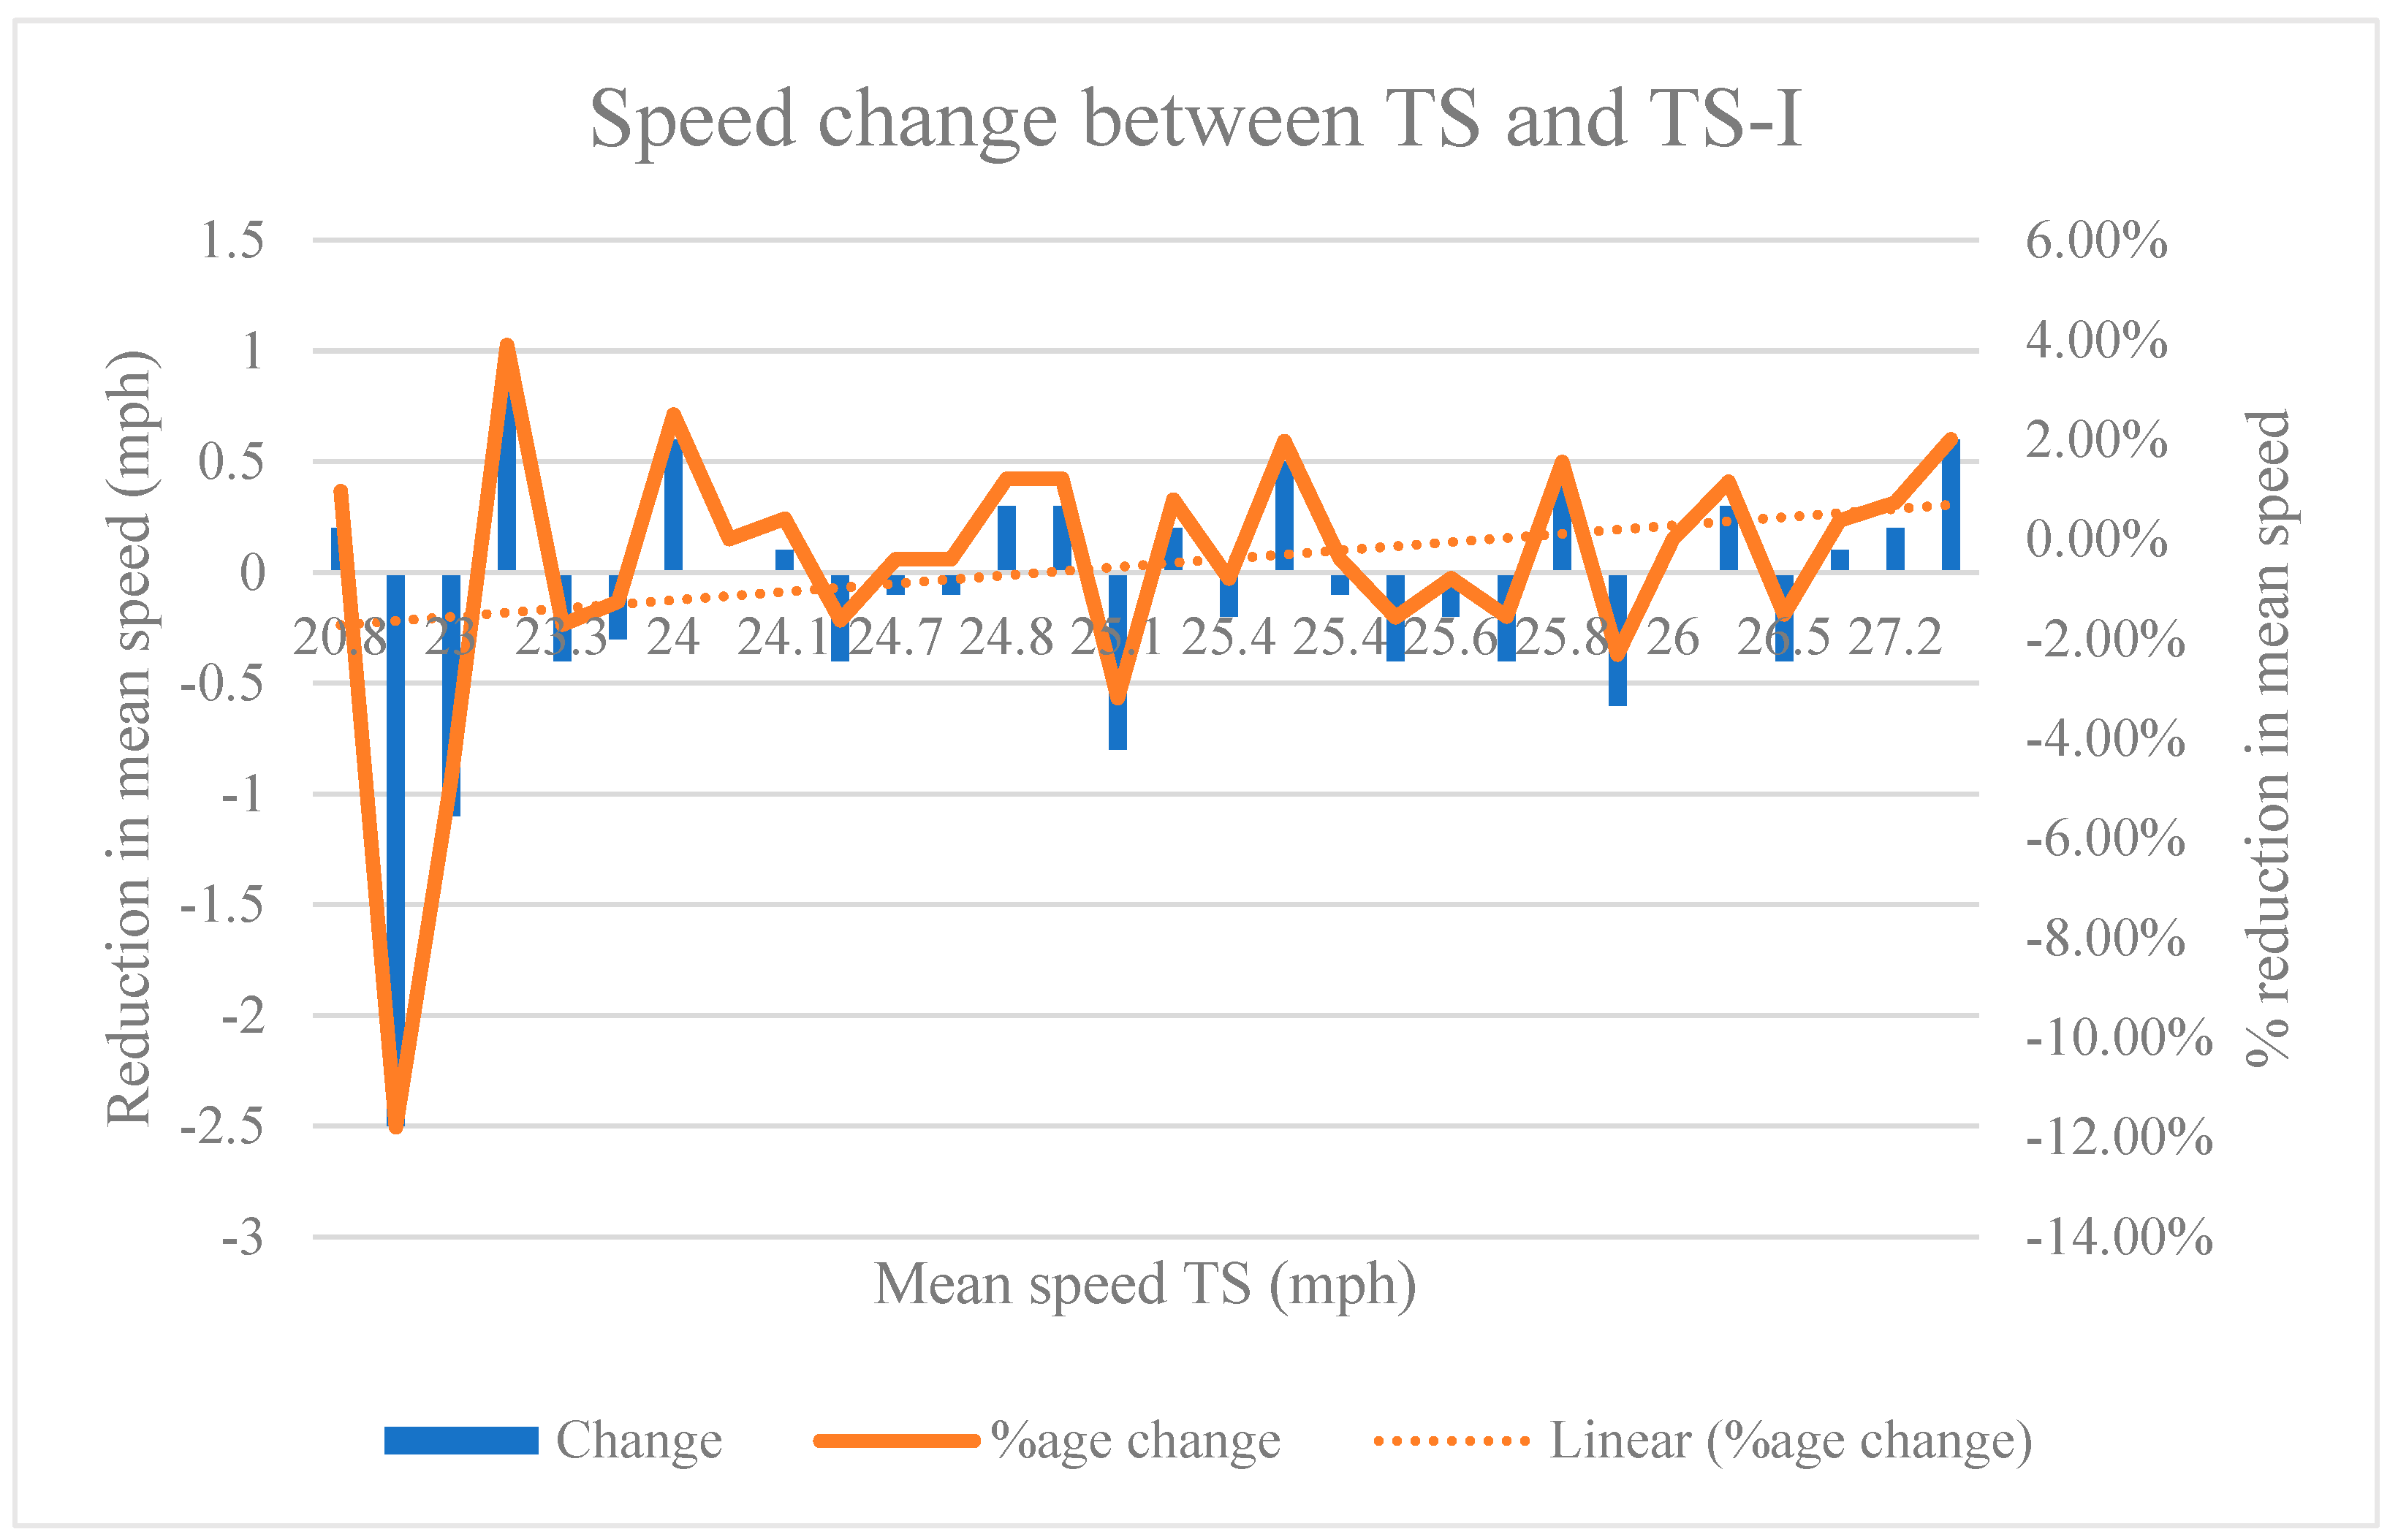
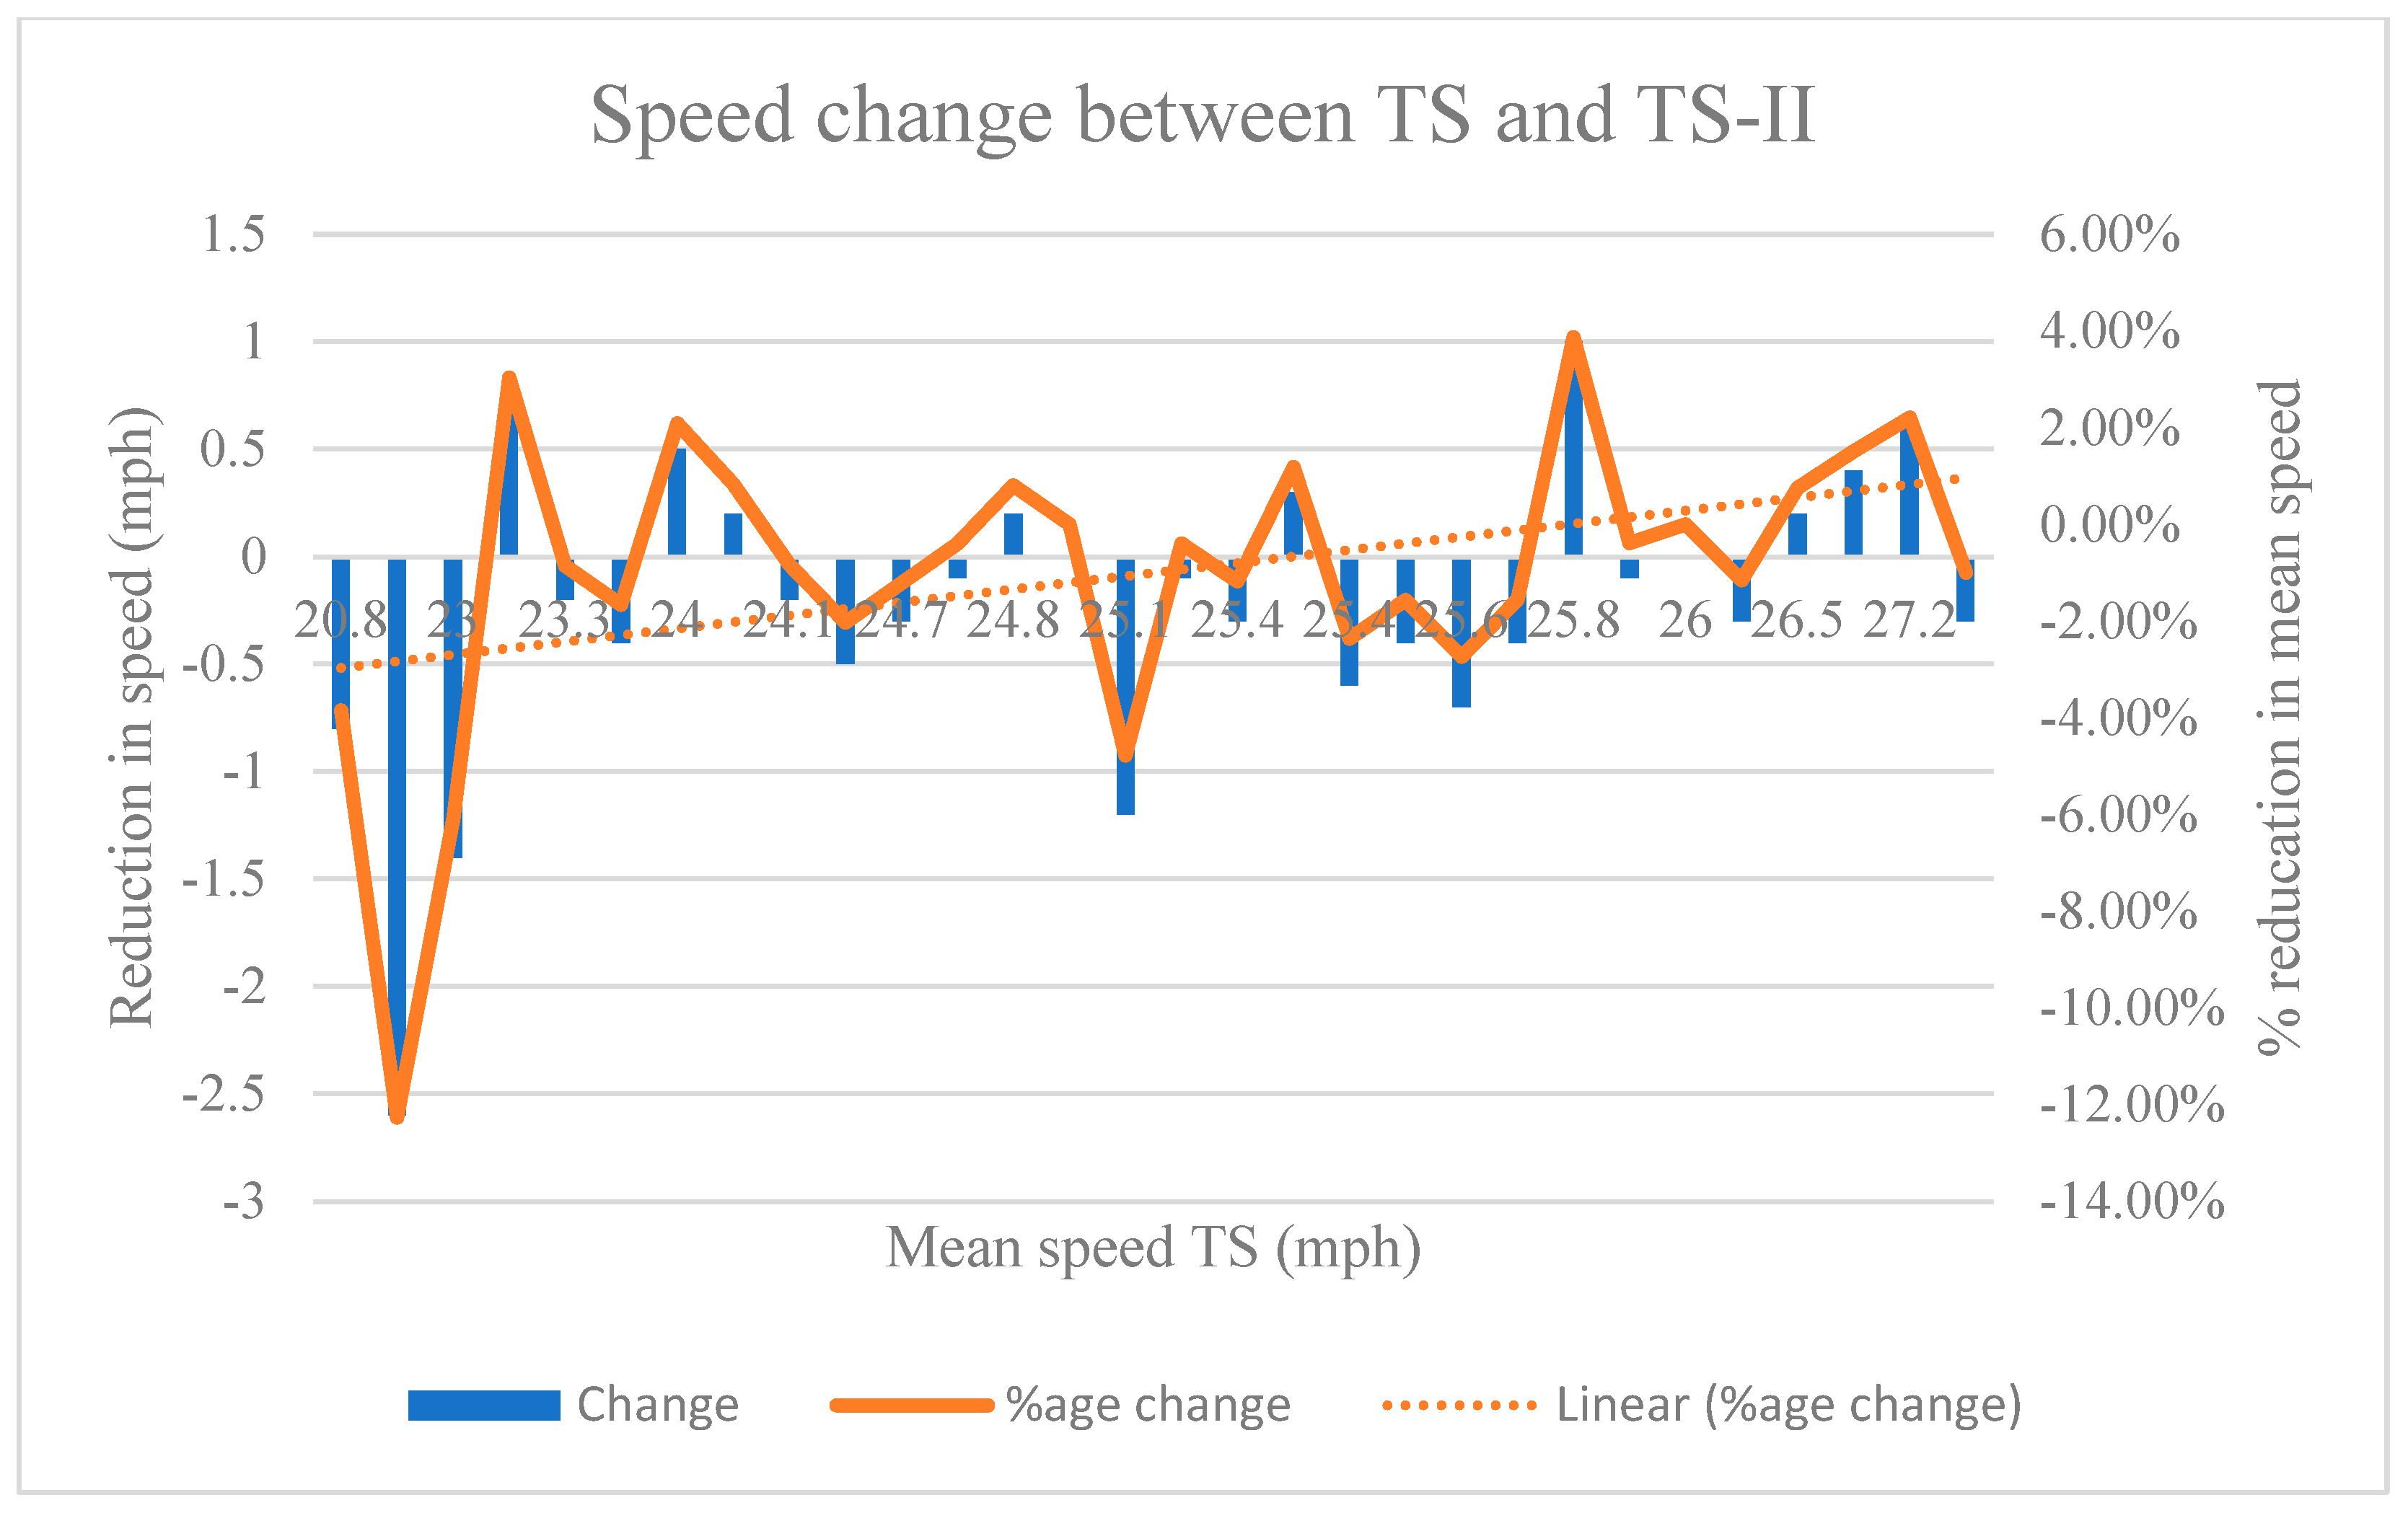
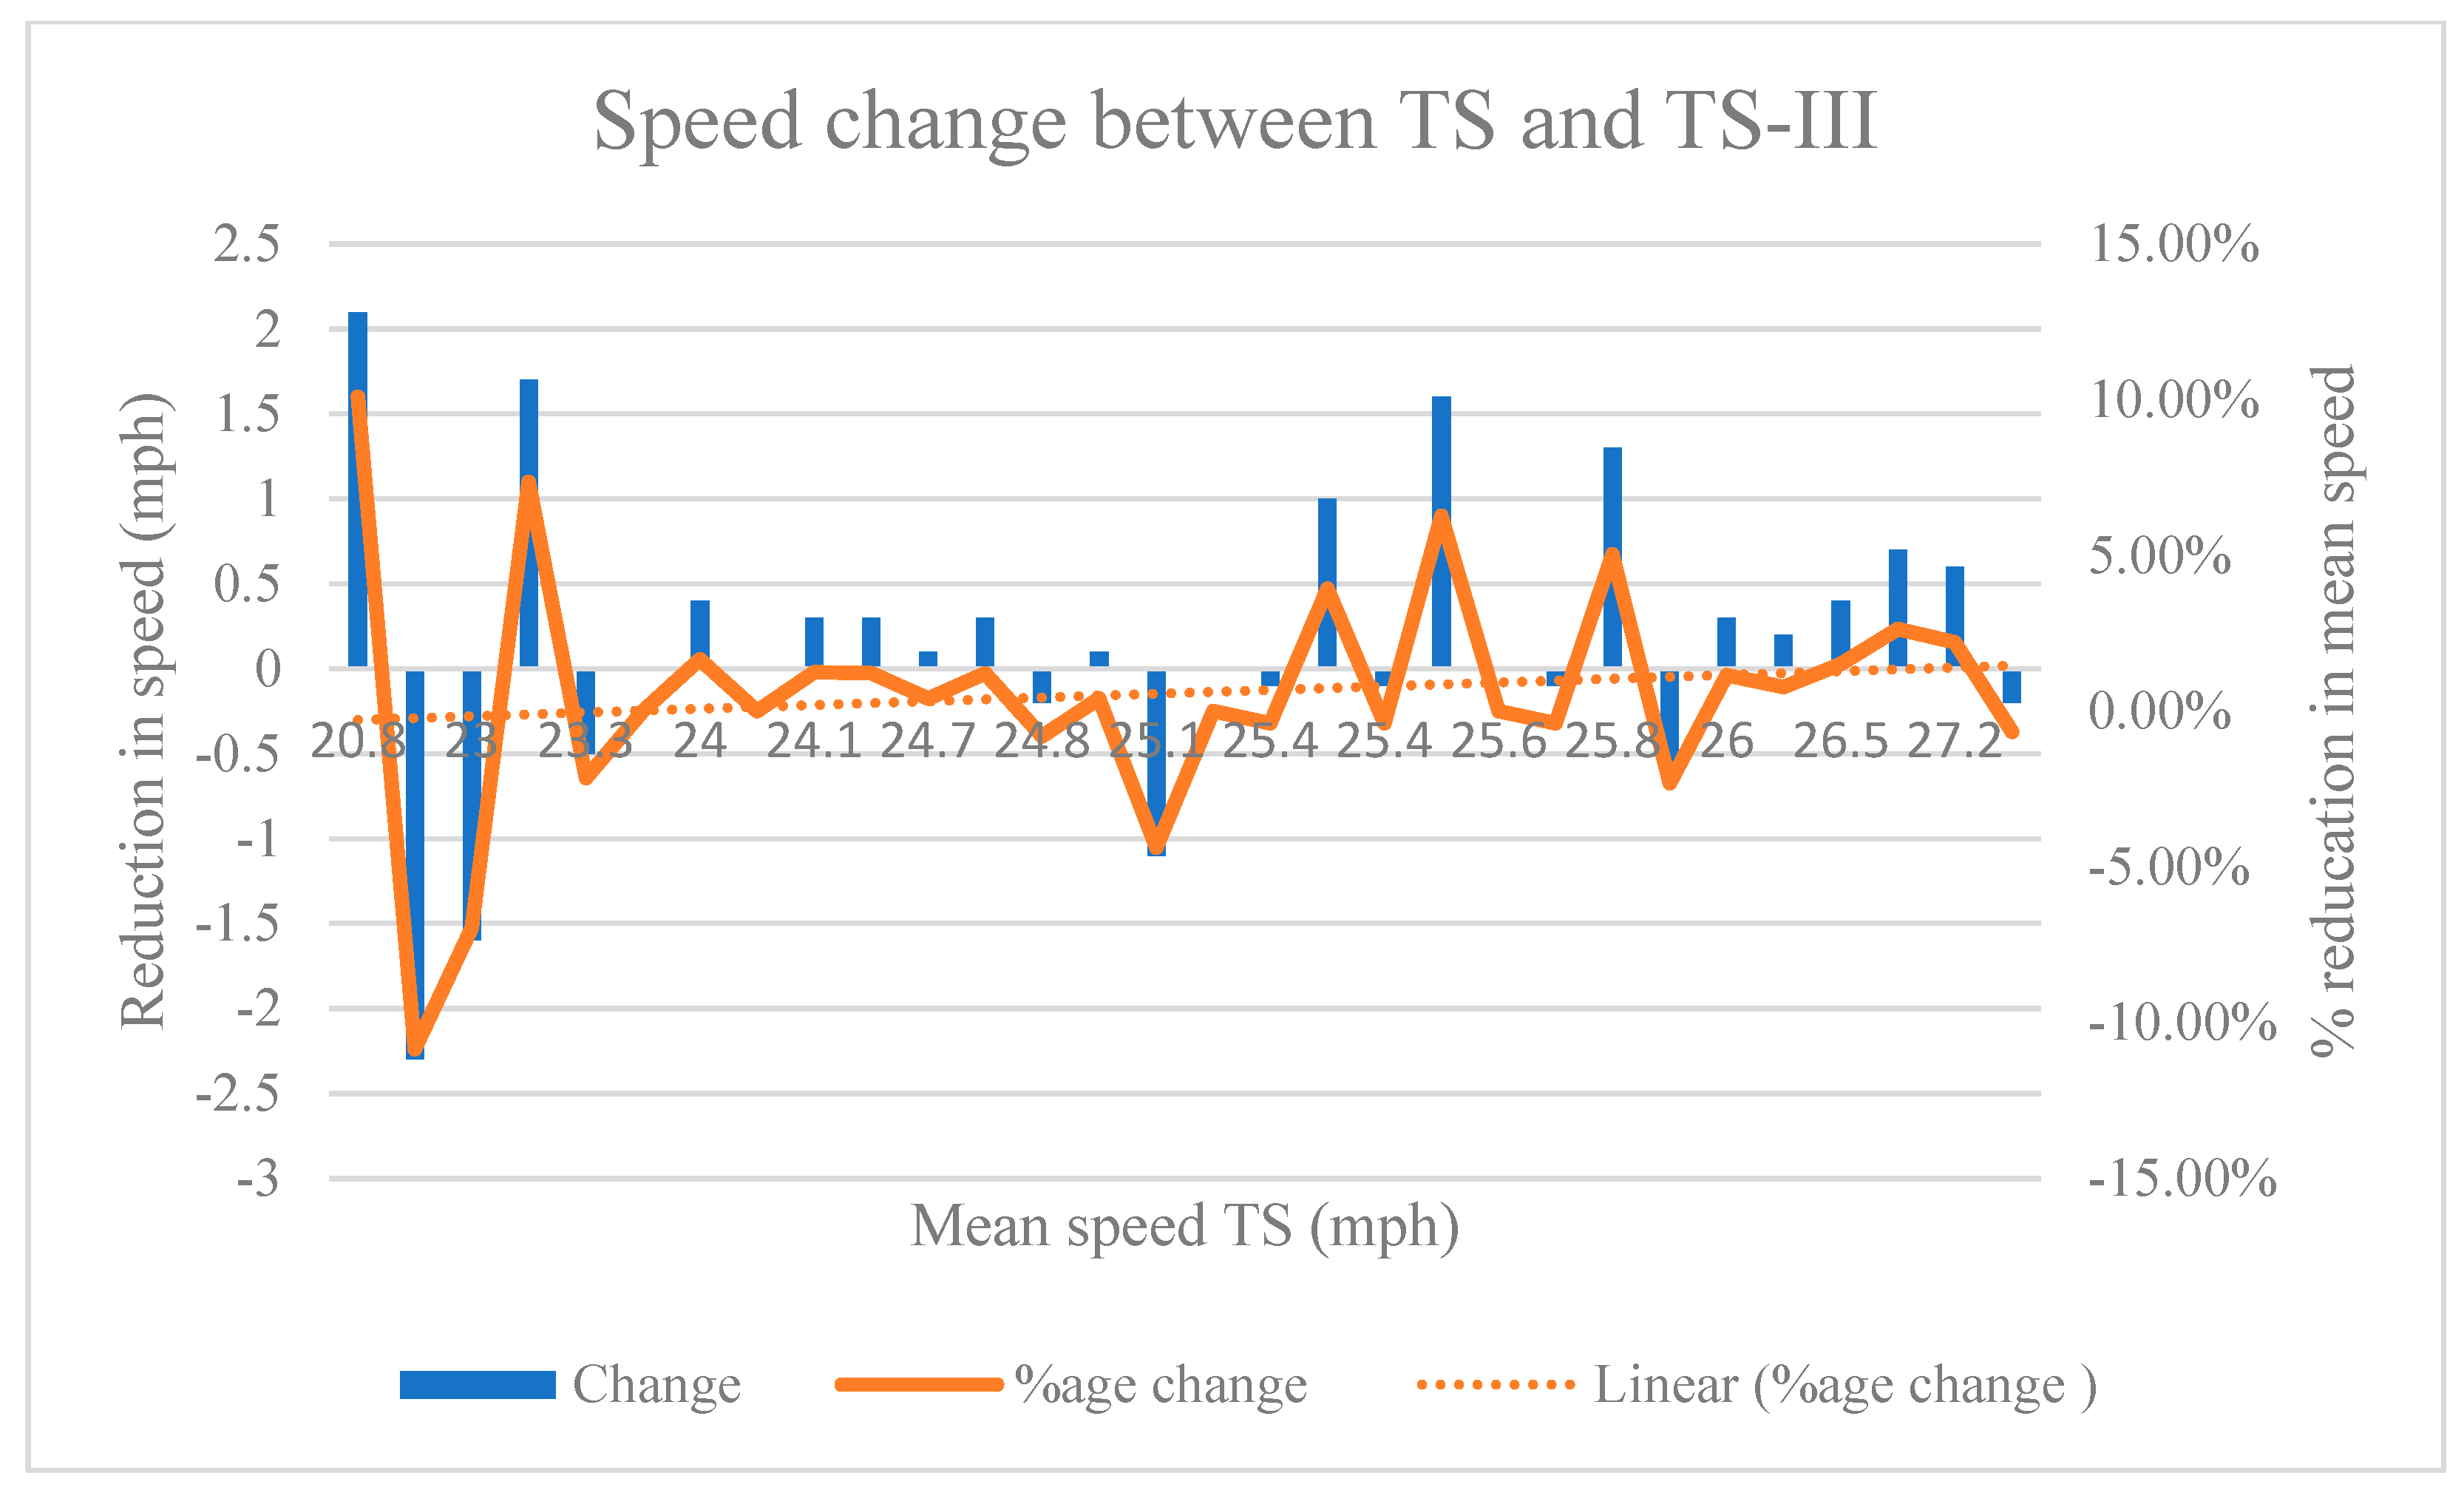
3.3. Analysis of Mean and 85th Percentile Speed by Site

Comparing the mean and the 85th speeds across the 30 sites where the VAS were installed and activated with different TS settings, Figure 3 shows that mean speeds are very close (in magnitude) across all survey waves. In some cases (e.g., sites 5 and 6), mean speeds in TS are evidently lower than TS-I, TS-II, and TS-III, whereas in some other cases (e.g., 28 and 29) speeds are evidently lower in TS-I, TS-II, and TS-III compared to TS.
The trend is a little clearer in Figure 4, which provides a visual comparison of the 85th percentile across all sites. It is evident that 85th percentile speeds in TS-I (Survey 2), TS-II (Survey 3), and TS-III (Survey 4) are slightly lower compared to TS for the vast majority of sites.
Table 4 shows the mean speed difference for each site between Survey 1 and 2, Survey 1 and 3, and Survey 1 and 4. The speed differences observed in Table 4 corroborate with the findings drawn from Figure 3 and Figure 4.
Figure 5 presents a broad, graphical overview of absolute and relative changes in mean speed between Survey 1 (TS) and Survey 2 (TS-I). Figure 6 similarly presents a comprehensive graphical illustration of absolute and relative changes in mean speed between Survey 1 (TS) and Survey 3 (TS-II), while a detailed graphical overview of absolute and relative changes in mean speed between Survey1 (TS) and Survey 4 (TS-III) is presented in Figure 7. In these Figures, the left vertical axis shows the absolute difference of mean speed between the two surveys considered (i.e., mean speed in Survey 1–mean speed in Survey 2 for Figure 5, mean speed in Survey 1–mean speed in Survey 3 for Figure 6, and mean speed in Survey 1–mean speed in Survey 4 for Figure 7) for each site. While the right vertical axis illustrates the relative difference of mean speed between Survey 1 and Survey 2 in Figure 5 (i.e., [mean speed in Survey 1–mean speed in Survey 2]/[mean speed in Survey 1]) and between Survey 1 and Survey 3 in Figure 6 (i.e., [mean speed in Survey 1–mean speed in Survey 3]/[mean speed in Survey 1]), also, between Survey 1 and Survey 4 in Figure 7 (i.e., [mean speed in Survey 1–mean speed in Survey 4]/[mean speed in Survey 1]).
Overall, Figure 5 shows that for the vast majority of sites, the change in the mean speed between TS (28 mph threshold) and TS-I (24 mph threshold) lies within the range of −2% and 2%. This is consistent with the findings of the descriptive analysis as well as those of Figure 3, which suggested marginal differences in mean speeds between TS and TS-I. Figure 6 suggests that the mean speed differences between TS (28 mph threshold) and TS2 (35 mph threshold) are still marginal, but in a few cases a bit more pronounced compared to the corresponding speed differences observed in Figure 5. While Figure 7 shows that for most sites the mean speed difference between TS (28 mph threshold) and TS-III is between 0% and 10%. Overall, more instances of slight speed increases are observed in TS-II compared to TS-I.

3.4. Stistical Analysis of Vehicle Speeds

Both non-parametric (Wilcoxon signed-rank tests) and parametric (t-tests) statistical tests were deployed to determine the statistical significance of differences in key speed metrics between TS (Survey 1) and TS-I (Survey 2), TS (Survey 1), and TS-II (Survey 3) and TS (Survey 1) and TS-III (Survey 4).

3.4.1. Wilcoxon Signed-Rank Tests

Wilcoxon signed-rank tests were conducted to identify the most effective TS threshold between TS-I, TS-II, and TS-III, since TS serves as the benchmark. This was achieved by utilizing the non-parametric structure of the test devoid of any assumption about the distribution of data that are being compared; the same test was also deployed for speed variation evaluation in previous studies [5]. The comprehensive results of the Wilcoxon Signed-Rank test (including the mean rank and sum of ranks) are presented in Table 5. The outcomes show that there is no statistically significant speed difference in aggregate mean speeds between TS and TS-I (p-value = 0.568), whereas there is marginal evidence of statistical significance of differences in aggregate mean speeds between TS and TS-II at a 90% level of confidence (p-value = 0.10). Also, there is no evidence of statistical significance of differences in aggregate mean speeds between TS and TS-III (p-value = 0.18). In contrast, the differences in 85th percentile speeds between TS and TS-I were identified as statistically significant at a greater than 99% level of confidence (p-value = 0.007), whereas the differences in 85th percentile speeds between TS and TS-II were also statistically significant at a 94% level of confidence (p-value = 0.06). Also, the differences in 85th percentile speeds between TS and TS-III were statistically significant at a 99% level of confidence (p-value = 0.01). These outcomes support the findings of the descriptive analysis, as discussed earlier.

3.4.2. Paired Sample t-Tests

To identify the most effective TS threshold, vehicle speeds at the most disaggregated level were statistically evaluated utilizing paired sample t-tests per each individual site included in the VAS intervention. Nearly three million observations accrued from TS (Survey 1) to TS-III (Survey 4) were used as the sample size for the t-test analysis. An abundance of paired t-tests were carried out, corresponding to different pairs of the TS settings that were in place across the different survey waves.
More specifically, a series of 240 statistical tests were carried out using individual vehicle speeds at the most disaggregated level. A first set of 60 t-tests were conducted for each specific site of this study comparing TS versus TS-I, and TS versus TS-II. The comprehensive outcomes of all the t-tests are presented in Appendix A. A little more than 83% of sites yield statistically significant speed differences with a greater than 99% level of confidence when comparing TS versus TS-II. Exactly 80% of sites resulted in statistically significant speed differences when comparing TS versus TS-I. Out of these sites, more than half exhibited statistically significant speed reductions in TS-I (compared to TS), whereas for the rest, we observed slightly lower speeds in TS. The second set of 180 t-tests were conducted for each specific site of this study comparing TS versus TS-III, TS-I versus TS-III and TS-II versus TS-III. About 67% of sites resulted in statistically significant speed differences with a greater than 99% level of confidence when comparing TS versus TS-III, while nearly 24% of sites yield statistically insignificant speed differences. Comparing TS-I with TS-III, about 87% of sites resulted in statistically significant speed differences. Also, comparing TS-II versus TS-III, about 87% of sites resulted in statistically significant speed differences, while approximately 13% of sites each resulted in not statistically significant speed differences.
Overall, the combination of the results of these tests show that the overall speed differences observed across cases with different VAS trigger speed settings may not be that pronounced; however, there is significant evidence of statistically observable speed differences, mostly associated with the vehicles travelling at higher percentile speeds at each site.

4. Policy Implications and Conclusions

4.1. Summary of Findings

This study aimed to investigate the effectiveness of different trigger speeds for VAS on roads with 20 mph speed limit in predominantly rural settlements. To that end, speed and traffic data from the Scottish Borders area were collected across four survey waves corresponding to different speed thresholds above the speed limit, at which the actual speed of the driver is not displayed on the VAS any longer and a warning message is communicated to the drivers. In summary, slightly lower mean speeds are observed in cases where the TS threshold (28 mph) is set close to the 85th percentile speed, whereas when the TS threshold is set close to a typical speed enforcement threshold (24 mph), the 85th percentile speed seem to be lower. In summary, the outputs of the descriptive and statistical analysis of the speed and traffic data provide evidence on the following:
  • Overall, the 24 mph TS threshold for the VAS seems to be more effective compared to the other TS settings considered in this study, mainly in terms of reducing the 85th percentile speeds. When the specific TS value is in place, the vast majority of vehicles have upper speeds close to 24 mph, which is a typical enforcement threshold according to the ACPO guidance.
  • Mean speeds between all tested TS thresholds exhibit marginal differences, with slightly increasing trends being observed for 24 mph and 35 mph.
  • Aggregate differences in mean speeds are not statistically significant when the 28 mph is compared with the 24 mph; whereas the differences are–marginally–statistically significant when the 28 mph is compared with the 35 mph.
  • A slight reduction in 85th percentile speeds is found when the 24 mph TS threshold is in place. This reduction is statistically observable at high confidence levels. The figures of the 85th percentile speed statistics for the 28 mph TS threshold are mixed and require further investigation.
  • Standard deviations of speeds were relatively lower in TS-I and TS-II compared to TS, thus suggesting more homogeneous speed patterns with 24 mph and 35 mph TS thresholds, respectively.
As a last note, the major limitation in this study is that the number of sites is smaller as compared to previous speed limit evaluations; this is because the deployment of VAS at a large scale is a resource-demanding process. Notably, all the observed speed differences are quite marginal, so further evidence is required to be obtained by more extensive studies in the future. Other controlling factors (e.g., traffic context, site-specific characteristics, seasonal variations, etc.) should be also further investigated while comparing the mean and 85th percentile speeds for different TS settings. As such, these findings should be interpreted with caution. Future research could consider the expansion of the study by including more sites and longer periods of data collection as well as by considering additional trigger speed metrics; the latter can be either lower than 24 mph or within the range of 24 and 28 mph, as both values were identified as most likely to have observable associations with different dimensions of traffic speeds. In addition, future research should potentially focus on the impact of seasonal variations (e.g., holiday vs non-holiday periods), as the characteristics of the ambient traffic environment may vary across different periods. Furthermore, future endeavours could also encompass information for more controlling factors, such as vehicle- or driver-specific characteristics.

4.2. Policy Implications and Future Work

In the context of previous widespread application of 20 mph speed limits across almost all SBC settlements, this study provides new insights into how the setting of TS for VAS can assist with speed selection and driver behaviour alongside 20 mph speed limits. National and international evidence from the introduction 20 mph and 30 kmph in place of 30 mph and 50 kmp/h speed limits shows significant reductions in mean and 85th percentile speed but still a significant percentage of drivers at speeds over 24 mph (39 kmp/h). Setting a TS to remind drivers, especially when driving between 21–24 mph, that they should slow down appears to result in further reductions in speeds driven. The finding that the 24 mph TS results in slight reductions of the 85th percentile speeds, especially when compared with the benchmark TS, is potentially interesting, considering that the 85th percentile speed represents the speed that is chosen by the vast majority of drivers in light of the prevailing traffic and road conditions. Further speed reductions can provide road safety benefits both from the reduction in kinetic energy in the transport system, any consequent outcome of crashes, greater crash avoidance potential, and also in improving perceived safety for all who use and live close by to roads where 20 mph speed limits augmented with VAS have been implemented.
As with the introduction of 20 mph speed limits, early evidence of positive change towards lower speeds driven is encouraging. However, there remains a need to keep abreast of changes in driver behaviour over time. It may be that all or some drivers who regularly travel across the SBC area may be less influenced by these VAS over time. Alternatively, it could lead to a change to sustained longer term lower speeds driven as a consequent of the introduction of VAS. These are currently hypothetical questions to be explored over a longer time period than reported here.
As a coda, research from demand management interventions, not least the Sustainable Travel Towns project (2004–2009), found that the more sustainable travel interventions implemented within a set geographic area, the greater the likelihood of positive behaviour change [20]. TRL researchers noted the synergetic effects of multiple interventions increased the positive impacts. They also noted a possible ‘network effect’ whereby sufficient interventions on routes form networks. As they also noted, this might be considered a ‘whole systems’ effect and this may be applicable to SBC given the widespread implementation of 20 mph, which has laid the foundations for additional interventions to help create just such a whole systems effect. Such thinking is commonly applied in public health research as ‘systems thinking’ and is starting to be applied in the road transport sector. Thus, it is suspected that beyond the introduction of widespread 20 mph speed limits and VAS signs across SBC area there may also be other interventions which can help further shift a greater number of drivers towards the 20 mph speed limit compliance. This may include psychological traffic calming measures such as centre line removal [22] from appropriate roads, edge-lines and other low-cost physical or perceptual measures featuring technological innovation (e.g., new-age high-visibility crosswalks [27] or perceptual traffic calming based on Internet-of-Things technology [31], AI methods [32], smart environments [33], or infrastructure-to-vehicle communications [34]).

Author Contributions

Conceptualization, A.D., G.F. and A.O.; methodology, A.O., G.F. and A.D.; validation, G.F. and A.D.; formal analysis, A.O.; investigation, A.O., G.F. and A.D.; data curation, A.O.; writing—original draft preparation, A.O.; writing—review and editing, G.F. and A.D.; supervision, G.F. and A.D.; project administration, A.D. All authors have read and agreed to the published version of the manuscript.

Funding

This research was funded by the Scottish Borders Council (Edinburgh Napier Finance code: R1872).

Institutional Review Board Statement

A risk assessment checklist was submitted to the Worktribe system of the Edinburgh Napier University (Project ID: 2682802, 3 September 2020). The research does not involve human subjects, animals, developing countries, etc., and, as such, the outcome of the checklist was that this research does not require formal ethical approval.

Data Availability Statement

Data available on request due to restrictions.

Acknowledgments

The authors would like to thank Philippa Gilhooly, from the Scottish Borders Council Roads Department, Assets and Infrastructure for ensuring uninterrupted access to all applicable data.

Conflicts of Interest

The authors declare no conflicts of interest. The data collection was monitored by the funder. The funder had no role in the design of the study; in the analyses or interpretation of data; in the writing of the manuscript; or in the decision to publish the results.

Appendix A

Table A1. Results of the t-tests per each site across TS, TS-I and TS-II.
Site NoSite NameNo. of ObservationsMean SDSEt-Statp-Value
TSTS-ITS-IITSTS-ITS-IITSTS-ITS-IITSTS-ITS-IITS–TS-ITS–TS-IITS–TS-ITS–TS-II
01Innerleithen Road, Peebles54,18449,38359,74724.1223.9624.335.314.364.310.02280.01960.01765.29−7.340.0000.000
02Preston11,38712,05810,73325.4425.5925.724.994.494.670.04680.04090.0451−2.45−4.320.0140.000
03High Street, Ayton10,7309333905224.6824.8225.035.415.155.020.05220.05330.0528−1.89−4.730.0590.000
04Lilliesleaf41624370426325.5225.9525.956.675.825.770.10340.08800.0884−3.13−3.130.0020.002
05Heiton126029,65329,3102.9824.1324.399.364.073.980.26380.02360.0232−79.84−80.840.0000.000
06Pirn Road, Innerleithen38,85134,71632,94621.1923.7323.845.425.405.510.02750.02900.0303−63.49−64.740.0000.000
07Lauder north54,90048,88342,74323.9524.2624.404.804.664.610.02050.02110.0223−10.38−14.780.0000.000
08Broughton10,2088519707726.4926.8526.296.516.336.430.06440.06860.0764−3.841.960.0000.050
09Duns Road, Coldstream72606876696025.9526.4825.966.376.436.510.07480.07760.0780−4.90−0.120.0000.901
10East End, Earlston18,60319,81721,66425.4524.8625.094.844.704.940.03550.03340.033611.977.370.0000.000
11Eddleston north42,27941,25940,77925.0825.9126.275.435.355.130.02640.02630.0254−22.04−32.360.0000.000
12Eddleston north42,00241,56739,63724.7724.5024.635.225.044.910.02550.02470.02467.523.850.0000.000
13Gattonside east10,99411,18911,95929.8529.3030.176.826.285.780.06500.05940.05296.29−3.760.0000.000
14Gattonside east13,00212,76912,35327.1927.0326.595.304.754.990.04650.04200.04492.589.310.0100.000
15Station Road, Duns26,79629,30926,50724.7924.5424.794.574.124.280.02790.02410.02636.980.060.0000.950
16Station Road, Duns27,87630,61828,20624.0223.4123.495.525.215.650.03310.02980.033713.6111.110.0000.000
17Ancrum35152884297724.7424.7524.786.225.765.600.10490.10730.1026−0.06−0.260.9520.794
18Ancrum34692938309523.9823.9623.765.835.395.070.09900.09940.09100.121.630.9020.104
19Dean Road, Newstead30043136298925.9926.0026.006.095.625.480.11100.10030.1003−0.05−0.040.9570.969
20Dean Road, Newstead29413521301123.3223.6623.527.446.106.500.13710.10280.1184−1.99−1.100.0460.271
21Stow north26,38029,13725,15326.4526.3526.085.885.435.720.03620.03180.03612.067.340.0390.000
22Stow north26,43527,12825,19825.8526.2526.225.485.495.590.03370.03330.0352−8.42−7.620.0000.000
23Lauder south48,32244,55540,20225.5725.8126.335.605.425.530.02550.02570.0276−6.86−20.310.0000.000
24Lauder south48,76446,92744,00025.3625.4526.005.184.744.630.02340.02190.0221−2.82−19.870.0050.000
25Denholm east29,81230,69629,00425.9925.7026.296.125.645.760.03540.03220.03386.14−6.140.0000.000
26Denholm east30,35029,60828,55325.2225.0025.315.265.054.900.03020.02930.02905.21−2.130.0000.033
27Chirnside west20,98220,87919,94724.6125.0125.055.164.904.670.03560.03390.0330−8.17−9.070.0000.000
28Chirnside west20,71923,20420,07325.8125.4324.775.744.835.040.03990.03170.03567.3319.300.0000.000
29The Loan, Hawick26,43628,30923,54223.0822.1522.424.604.264.610.02830.02530.030024.4816.000.0000.000
30The Loan, Hawick23,48822,79422,31820.8220.5821.584.434.374.550.02890.02900.03045.74−18.160.0000.000
SD–Standard Deviation, SE–Standard Error, t-stat–t Statistic.
Table A2. Results of the t-tests per each site across TS, TS-I and TS-III.
Site NoSite NameNo. of ObservationsMean SDSEt-Statp-Value
TSTS-ITS-IIITSTS-ITS-IIITSTS-ITS-IIITSTS-ITS-IIITS–TS-IIITS-I–TS-IIITS–TS-IIITS-I–TS-III
01Innerleithen Road, Peebles54,18449,38354,60224.1223.9623.805.314.364.610.02280.01960.019710.465.630.0000.000
02Preston11,38712,05810,90325.4425.5925.484.994.495.020.04680.04090.0481−0.621.750.5340.080
03High Street, Ayton10,730933310,30324.6824.8224.635.415.155.170.05220.05330.05090.722.620.4730.009
04Lilliesleaf41624370470925.5225.9523.946.675.825.230.10340.08800.076212.2917.210.0000.000
05Heiton126029,65326,7372.9824.1324.569.364.074.490.26380.02360.0274−81.36−11.930.0000.000
06Pirn Road, Innerleithen38,85134,71634,77521.1923.7323.525.425.405.620.02750.02900.0301−57.055.020.0000.000
07Lauder north54,90048,88352,94523.9524.2623.984.804.664.540.02050.02110.0197−0.829.770.4120.000
08Broughton10,2088519863026.4926.8526.136.516.336.220.06440.06860.06693.887.540.0000.000
09Duns Road, Coldstream72606876612925.9526.4826.476.376.437.100.07480.07760.0908−4.460.030.0000.979
10East End, Earlston18,60319,81724,11625.4524.8624.444.844.704.600.03550.03340.029621.779.470.0000.000
11Eddleston north42,27941,25942,55325.0825.9126.235.435.355.480.02640.02630.0265−30.50−8.560.0000.000
12Eddleston north42,00241,56745,29224.7724.5024.985.225.045.150.02550.02470.0242−6.05−13.870.0000.000
13Gattonside east10,99411,18913,09229.8529.3030.096.826.286.950.06500.05940.0607−2.66−9.310.0080.000
14Gattonside east13,00212,76913,64827.1927.0326.635.304.755.060.04650.04200.04338.786.570.0000.000
15Station Road, Duns26,79629,30928,25524.7924.5424.714.574.124.340.02790.02410.02582.33−4.780.0200.000
16Station Road, Duns27,87630,61831,63424.0223.4123.625.525.215.030.03310.02980.02839.20−5.010.0000.000
17Ancrum35152884323624.7424.7524.386.225.765.560.10490.10730.09772.562.590.0110.010
18Ancrum34692938339423.9823.9623.975.835.395.200.09900.09940.08930.04−0.090.9660.931
19Dean Road, Newstead30043136322625.9926.0025.756.095.625.540.11100.10030.09761.661.810.0980.071
20Dean Road, Newstead29413521321923.3223.6623.827.446.105.610.13710.10280.0989−2.97−1.130.0030.259
21Stow north26,38029,13727,76326.4526.3525.795.885.435.570.03620.03180.033413.4912.250.0000.000
22Stow north26,43527,12828,25925.8526.2525.865.485.495.190.03370.03330.0309−0.348.440.7320.000
23Lauder south48,32244,55544,86825.5725.8125.555.605.425.560.02550.02570.02620.437.180.6700.000
24Lauder south48,76446,92744,65325.3625.4525.505.184.745.040.02340.02190.0238−4.10−1.440.0000.151
25Denholm east29,81230,69631,09625.9925.7025.796.125.645.870.03540.03220.03334.15−2.000.0000.046
26Denholm east30,35029,60830,46625.2225.0025.205.265.054.960.03020.02930.02840.56−4.810.5780.000
27Chirnside west20,98220,87922,63124.6125.0124.265.164.904.610.03560.03390.03067.4616.470.0000.000
28Chirnside west20,71923,20422,20325.8125.4324.535.744.835.040.03990.03170.033824.4819.560.0000.000
29The Loan, Hawick26,43628,30926,56423.0822.1521.434.604.264.740.02830.02530.029140.6518.660.0000.000
30The Loan, Hawick23,48822,79423,37620.8220.5818.694.434.375.330.02890.02900.034946.9941.780.0000.000
SD–Standard Deviation, SE–Standard Error, t-stat–t Statistic.
Table A3. Results of the t-tests per each site between TS-II and TS-III.
Site NoSite NameNo. of ObservationsMean SDSEt-Statp-Value
TS-IITS-IIITS-IITS-IIITS-IITS-IIITS-IITS-IIITS-II–TS-IIITS-II–TS-III
01Innerleithen Road, Peebles59,74754,60224.3323.804.314.610.01760.019719.920.000
02Preston10,73310,90325.7225.484.675.020.04510.04813.630.000
03High Street, Ayton905210,30325.0324.635.025.170.05280.05095.500.000
04Lilliesleaf4263470925.9523.945.775.230.08840.076217.180.000
05Heiton29,31026,73724.3924.563.984.490.02320.0274−4.680.000
06Pirn Road, Innerleithen32,94634,77523.8423.525.515.620.03030.03017.580.000
07Lauder north42,74352,94524.4023.984.614.540.02230.019714.260.000
08Broughton7077863026.2926.136.436.220.07640.06691.620.106
09Duns Road, Coldstream6960612925.9626.476.517.100.07800.0908−4.280.000
10East End, Earlston21,66424,11625.0924.444.944.600.03360.029614.440.000
11Eddleston north40,77942,55326.2726.235.135.480.02540.02651.190.232
12Eddleston north39,63745,29224.6324.984.915.150.02460.0242−10.110.000
13Gattonside east11,95913,09230.1730.095.786.950.05290.06070.970.331
14Gattonside east12,35313,64826.5926.634.995.060.04490.0433−0.690.489
15Station Road, Duns26,50728,25524.7924.714.284.340.02630.02582.340.020
16Station Road, Duns28,20631,63423.4923.625.655.030.03370.0283−2.830.005
17Ancrum2977323624.7824.385.605.560.10260.09772.860.004
18Ancrum3095339423.7623.975.075.200.09100.0893−1.670.095
19Dean Road, Newstead2989322626.0025.755.485.540.10030.09761.790.073
20Dean Road, Newstead3011321923.5223.826.505.610.11840.0989−1.970.049
21Stow north25,15327,76326.0825.795.725.570.03610.03345.890.000
22Stow north25,19828,25926.2225.865.595.190.03520.03097.590.000
23Lauder south40,20244,86826.3325.555.535.560.02760.026220.440.000
24Lauder south44,00044,65326.0025.504.635.040.02210.023815.470.000
25Denholm east29,00431,09626.2925.795.765.870.03380.033310.590.000
26Denholm east28,55330,46625.3125.204.904.960.02900.02842.770.006
27Chirnside west19,94722,63125.0524.264.674.610.03300.030617.570.000
28Chirnside west20,07322,20324.7724.535.045.040.03560.03385.070.000
29The Loan, Hawick23,54226,56422.4221.434.614.740.03000.029123.670.000
30The Loan, Hawick22,31823,37621.5818.694.555.330.03040.034962.450.000
SD–Standard Deviation, SE–Standard Error, t-stat–t Statistic.

References

  1. ITF. Road Safety Annual Report 2022; OECD Publishing: Paris, Frence, 2022. [Google Scholar]
  2. Department for Transport. Reported Road Casualties Great Britain, Provisional Results: 2022 National Statistics; Department for Transport: London, UK, 2023. Available online: https://www.gov.uk/government/statistics/reported-road-casualties-great-britain-provisional-results-2022/reported-road-casualties-great-britain-provisional-results-2022 (accessed on 15 January 2024).
  3. Transport Scotland. Key Reported Road Casualties Scotland 2022; Transport Scotland: Glasgow, Scotland, 2023. [Google Scholar]
  4. Bi, H.; Shang, W.-L.; Chen, Y.; Yu, K.; Ochieng, W.Y. An Incentive Based Road Traffic Control Mechanism for COVID-19 Pandemic Alike Emergency Preparedness and Response. IEEE Trans. Intell. Transp. Syst. 2022, 23, 25092–25105. [Google Scholar] [CrossRef]
  5. Olowosegun, A.; Fountas, G.; Davis, A. Assessing the Impact of 20 mph Speed Limits on Vehicle Speeds in Rural Areas: The Case of the Scottish Borders. Safety 2023, 9, 66. [Google Scholar] [CrossRef]
  6. Dinh, D.D.; Kubota, H. Drivers’ perceptions regarding speeding and driving on urban residential streets with a 30 km/h speed limit. IATSS Res. 2013, 37, 30–38. [Google Scholar] [CrossRef]
  7. Islam, M.T.; El-Basyouny, K. Full Bayesian evaluation of the safety effects of reducing the posted speed limit in urban residential area. Accid. Anal. Prev. 2015, 80, 18–25. [Google Scholar] [CrossRef] [PubMed]
  8. Lee, G.; Joo, S.; Oh, C.; Choi, K. An evaluation framework for traffic calming measures in residential areas. Transp. Res. Part D Transp. Environ. 2013, 25, 68–76. [Google Scholar] [CrossRef]
  9. Fountas, G.; Fonzone, A.; Olowosegun, A.; McTigue, C. Addressing unobserved heterogeneity in the analysis of bicycle crash injuries in Scotland: A correlated random parameters ordered probit approach with heterogeneity in means. Anal. Methods Accid. Res. 2021, 32, 100181. [Google Scholar] [CrossRef]
  10. Olowosegun, A.; Babajide, N.; Akintola, A.; Fountas, G.; Fonzone, A. Analysis of pedestrian accident injury-severities at road junctions and crossings using an advanced random parameter modelling framework: The case of Scotland. Accid. Anal. Prev. 2022, 169, 106610. [Google Scholar] [CrossRef]
  11. Llewellyn, R.; Cowie, J.; Fountas, G. Solar-Powered Active Road Studs and Highway Infrastructure: Effect on Vehicle Speeds. Energies 2021, 14, 7209. [Google Scholar] [CrossRef]
  12. Leonardi, S.; Distefano, N. Traffic-Calming Measures as an Instrument for Revitalizing the Urban Environment. Sustainability 2024, 16, 1407. [Google Scholar] [CrossRef]
  13. Cairns, J.; Warren, J.; Garthwaite, K.; Greig, G.; Bambra, C. Go slow: An umbrella review of the effects of 20 mph zones and limits on health and health inequalities. J. Public Health 2015, 37, 515–520. [Google Scholar] [CrossRef]
  14. Cleland, C.L.; McComb, K.; Kee, F.; Jepson, R.; Kelly, M.P.; Milton, K.; Nightingale, G.; Kelly, P.; Baker, G.; Craig, N.; et al. Effects of 20 mph interventions on a range of public health outcomes: A meta-narrative evidence synthesis. J. Transp. Health 2020, 17, 100633. [Google Scholar] [CrossRef]
  15. Gonzalo-Orden, H.; Rojo, M.; Pérez-Acebo, H.; Linares, A. Traffic Calming Measures and their Effect on the Variation of Speed. Transp. Res. Procedia 2016, 18, 349–356. [Google Scholar] [CrossRef]
  16. Gonzalo-Orden, H.; Pérez-Acebo, H.; Unamunzaga, A.L.; Arce, M.R. Effects of traffic calming measures in different urban areas. Transp. Res. Procedia 2018, 33, 83–90. [Google Scholar] [CrossRef]
  17. Huang, H.F.; Cynecki, M.J. Effects of Traffic Calming Measures on Pedestrian and Motorist Behavior. Transp. Res. Rec. 2000, 1705, 26–31. [Google Scholar] [CrossRef]
  18. Abdulmawjoud, A.A.; Jamel, M.G.; Al-Taei, A.A. Traffic flow parameters development modelling at traffic calming measures located on arterial roads. Ain Shams Eng. J. 2021, 12, 437–444. [Google Scholar] [CrossRef]
  19. Jomaa, D.; Yella, S.; Dougherty, M. A Comparative Study between Vehicle Activated Signs and Speed Indicator Devices. Transp. Res. Procedia 2017, 22, 115–123. [Google Scholar] [CrossRef]
  20. Jomaa, D.; Dougherty, M.; Yella, S.; Edvardsson, K. Effectiveness of trigger speed of vehicle-activated signs on mean and standard deviation of speed. J. Transp. Saf. Secur. 2016, 8, 293–309. [Google Scholar] [CrossRef]
  21. Winnett, M.A.; Wheeler, A.H. Vehicle-Activated Signs: A Large Scale Evaluation; Transport Research International Documentation: Washington, DC, USA, 2002. [Google Scholar]
  22. Quddus, M. Exploring the Relationship Between Average Speed, Speed Variation, and Accident Rates Using Spatial Statistical Models and GIS. J. Transp. Saf. Secur. 2013, 5, 27–45. [Google Scholar] [CrossRef]
  23. Singleton, P.A.; Wang, L. Safety and Security in Discretionary Travel Decision Making: Focus on Active Travel Mode and Destination Choice. Transp. Res. Rec. 2014, 2430, 47–58. [Google Scholar] [CrossRef]
  24. Sadeghi-Bazargani, H.; Saadati, M. Speed Management Strategies; A Systematic Review. Bull. Emerg. Trauma 2016, 4, 126–133. [Google Scholar]
  25. Jomaa, D.; Yella, S. Predicting Automatic Trigger Speed for Vehicle-Activated Signs. J. Intell. Syst. 2020, 29, 1079–1091. [Google Scholar] [CrossRef]
  26. Corkle, J.; Giese, J.L.; Marti, M.M. Investigating the Effectiveness of Traffic Calming Strategies on Driver Behavior, Traffic Flow and Speed; SRF Consulting Group, Inc.: Minneapolis, MN, USA, 2001. [Google Scholar]
  27. Sarwar, M.T.; Fountas, G.; Bentley, C.; Anastasopoulos, P.C.; Blatt, A.; Pierowicz, J.; Majka, K.; Limoges, R. Preliminary Investigation of the Effectiveness of High-Visibility Crosswalks on Pedestrian Safety Using Crash Surrogates. Transp. Res. Rec. 2017, 2659, 182–191. [Google Scholar] [CrossRef]
  28. Vaitkus, A.; Čygas, D.; Jasiūnienė, V.; Jateikienė, L.; Andriejauskas, T.; Skrodenis, D.; Ratkevičiūtė, K. Traffic Calming Measures: An Evaluation of the Effect on Driving Speed. Promet-Traffic&Transp. 2017, 29, 275–285. [Google Scholar] [CrossRef]
  29. Bornioli, A.; Bray, I.; Pilkington, P.; Bird, E.L. The effectiveness of a 20 mph speed limit intervention on vehicle speeds in Bristol, UK: A non-randomised stepped wedge design. J. Transp. Health 2018, 11, 47–55. [Google Scholar] [CrossRef]
  30. Nightingale, G.F.; Williams, A.J.; Hunter, R.F.; Woodcock, J.; Turner, K.; Cleland, C.L.; Baker, G.; Kelly, M.; Cope, A.; Kee, F.; et al. Evaluating the citywide Edinburgh 20mph speed limit intervention effects on traffic speed and volume: A pre-post observational evaluation. PLoS ONE 2022, 16, e0261383. [Google Scholar] [CrossRef] [PubMed]
  31. Kavianpour, S.; Haghighi, F.; Sheykhfard, A.; Fountas, G.; Das, S. Effectiveness of Traffic Calming Zone in Crash Prone Areas: A Case Study in Iran. In Proceedings of the Transportation Research Board 102nd Annual Meeting, Washington, DC, USA, 8–12 January 2023. [Google Scholar]
  32. Chen, X.; Wang, Z.; Hua, Q.; Shang, W.-L.; Luo, Q.; Yu, K. AI-Empowered Speed Extraction via Port-Like Videos for Vehicular Trajectory Analysis. IEEE Trans. Intell. Transp. Syst. 2023, 24, 4541–4552. [Google Scholar] [CrossRef]
  33. Bi, H.; Shang, W.-L.; Chen, Y.; Wang, K. Joint Optimization for Pedestrian, Information and Energy Flows in Emergency Response Systems With Energy Harvesting and Energy Sharing. IEEE Trans. Intell. Transp. Syst. 2022, 23, 22421–22435. [Google Scholar] [CrossRef]
  34. Yang, L.; Zhan, J.; Shang, W.-L.; Fang, S.; Wu, G.; Zhao, X.; Deveci, M. Multi-Lane Coordinated Control Strategy of Connected and Automated Vehicles for On-Ramp Merging Area Based on Cooperative Game. IEEE Trans. Intell. Transp. Syst. 2023, 24, 13448–13461. [Google Scholar] [CrossRef]
Figure 1. Geographical distribution of the VAS locations indicating TS–TS-III.
Safety 10 00025 g001
Figure 2. VAS mean and 85th percentile speeds.
Safety 10 00025 g002
Figure 3. Mean speed of each site across survey waves 1, 2, 3, and 4.
Safety 10 00025 g003
Figure 4. 85th percentile speed of each site across survey waves 1, 2, 3, and 4.
Safety 10 00025 g004
Figure 5. Speed change between TS and TS-I.
Safety 10 00025 g005
Figure 6. Speed change between TS and TS-II.
Safety 10 00025 g006
Figure 7. Speed change between TS and TS-III.
Safety 10 00025 g007
Table 1. VAS Settings for TS–TS-III.
VAS SettingsTSTS-ITS-IITS-III
No display on VAS0–12 mph0–12 mph0–12 mph0–12 mph
Vehicle speed display on VAS and “Thank you” message12–20 mph12–20 mph12–20 mph12–20 mph
Vehicle speed display on VAS and “Slow down” message21–28 mph21–24 mph21–35 mph21–28 mph
Only “Slow down” message–Speed threshold>28 mph>24 mph>35 mph>28 mph
Table 2. Overall descriptive statistics of mean and 85th percentile speeds across all survey waves.
Survey WavenMinimumMaximumAverageStd. Deviation
Mean85th PercentileMean85th PercentileMean85th PercentileMean85th Percentile
TS3020.8025.3029.9036.7024.9430.551.712.21
TS-I3020.6025.0029.3035.6025.0530.191.592.07
TS-II3021.6026.3030.2035.7025.1730.351.551.87
TS-III3018.7024.0030.1036.9024.7930.101.862.27
Table 3. Mean and 85th percentile speed range for TS–TS-III.
Speed Band (mph)TSTS-ITS-IITS-III
Mean
Speed (%)
85th Percentile Speed (%)Mean Speed (%)85th Percentile Speed (%)Mean Speed (%)85th Percentile Speed (%)Mean Speed (%)85th Percentile Speed (%)
0–20------3.3-
>20–2547.0-53.03.047.0-53.33.3
>25–3053.034.047.044.050.044.040.150.1
>30–35-63.0-50.03.053.03.343.3
>35–40-3.0-3.0-3.0-3.3
Table 4. Mean speed differences across all survey waves.
Site NoSurvey 1Survey 2Speed Diff S1 and S2Survey 3Speed Diff S1 and S3Survey 4Speed Diff S1 and S4
124.1024.000.1024.30−0.2023.800.30
225.4025.60−0.2025.70−0.3025.50−0.10
324.7024.80−0.1025.00−0.3024.600.10
425.5025.90−0.4025.90−0.4023.901.60
523.0024.10−1.1024.40−1.4024.60−1.60
621.2023.70−2.5023.80−2.6023.50−2.30
724.0024.30−0.3024.40−0.4024.000.00
826.5026.90−0.4026.300.2026.100.40
925.9026.50−0.6026.00−0.1026.50−0.60
1025.4024.900.5025.100.3024.401.00
1125.1025.90−0.8026.30−1.2026.20−1.10
1224.8024.500.3024.600.2025.00−0.20
1329.9029.300.6030.20−0.3030.10−0.20
1427.2027.000.2026.600.6026.600.60
1524.8024.500.3024.800.0024.700.10
1624.0023.400.6023.500.5023.600.40
1724.7024.80−0.1024.80−0.1024.400.30
1824.0024.000.0023.800.2024.000.00
1926.0026.000.0026.000.0025.700.30
2023.3023.70−0.4023.50−0.2023.80−0.5
2126.5026.400.1026.100.4025.800.70
2225.8026.20−0.4026.20−0.4025.90−0.10
2325.6025.80−0.2026.30−0.7025.600.00
2425.4025.50−0.1026.00−0.6025.50−0.10
2526.0025.700.3026.30−0.3025.800.20
2625.2025.000.2025.30−0.1025.200.00
2724.6025.00−0.4025.10−0.5024.300.30
2825.8025.400.4024.801.0024.501.30
2923.1022.200.9022.400.7021.401.70
3020.8020.600.2021.60−0.8018.702.10
Table 5. Results of the Wilcoxon signed rank tests on vehicle speeds.
“TS” vs. “TS-I” Comparison
Wilcoxon Signed Rank TestNMean RankSum of Ranks
Survey 2 (“TS-I”) speed–Survey 1(“TS”) speedSites with speed decrease1313.69178.00
Sites with speed increase1515.20228.00
Ties2
Total30
“TS” vs. “TS-II” Comparison
Wilcoxon Signed Rank TestNMean RankSum of Ranks
Survey 3 (“TS-II”) speed–Survey 1(“TS”) speedSites with speed decrease914.56131.00
Sites with speed increase1914.47275.00
Ties2
Total30
“TS” vs. “TS-III” Comparison
Wilcoxon Signed Rank TestNMean RankSum of Ranks
Survey 4 (“TS-III”) speed–Survey 1(“TS”) speedSites with speed decrease1316.38213.00
Sites with speed increase1613.88222.00
Ties1
Total30
Disclaimer/Publisher’s Note: The statements, opinions and data contained in all publications are solely those of the individual author(s) and contributor(s) and not of MDPI and/or the editor(s). MDPI and/or the editor(s) disclaim responsibility for any injury to people or property resulting from any ideas, methods, instructions or products referred to in the content.

