1. Introduction
Awareness regarding workplace safety in developing countries remains relatively low. Especially in Indonesia, this is evident through the high number of insurance claims with the Social Security Administrative Agency of Indonesia (BPJS Ketenagakerjaan) for Employment Accidents, totaling 234,370 claims due to workplace accidents in 2022 [
1]. The causes of these accidents are manifold, often attributed to inadequate planning, production organization, unsafe workplace conditions, and human factors. These human factors may stem from psychological origins or reflect societal, cultural, and organizational training issues [
2]. The lack of compliance with Standard Operating Procedures (SOPs) regarding the use of Personal Protective Equipment (PPE) plays a role in these accidents, influencing the overall safety level. Studies suggest that lower frequency of PPE use corresponds to higher chances of workplace accidents [
3].
PPE serves as a safeguarding tool used by workers to protect themselves from occupational hazards. Utilizing PPE stands as a critical strategy in preventing injuries and occupational illnesses stemming from workplace hazard exposure, which can result from direct contact with chemicals, radiation, physical, electrical, and mechanical risks, and other workplace dangers. Among the most significant methods to safeguard worker health and safety in the workplace against potential risks or hazards is the proper use of PPE [
4].
The National Institute for Occupational Safety and Health (NIOSH), a United States federal agency tasked with the role of conducting research and formulating recommendations to prevent work-related injuries and illnesses, integrates the use of PPE within the Hierarchy of Controls, a methodology to determine the most effective actions for controlling exposure to hazards. This hierarchy comprises five levels of control actions, ranked by effectiveness: elimination, substitution, engineering controls, administrative controls, and PPE. When other control methods fall short in reducing hazardous exposure to safe levels, organizations must provide PPE. Moreover, PPE is frequently used in situations where hazards are not adequately controlled, making it the last line of defense in creating a safe environment when other controls prove insufficient.
It is essential to acknowledge that accidents can occur not only in the workplace but also in educational settings during practical learning activities. Generally, student learning activities mostly occur within classrooms; however, they also take place in laboratories. Laboratory-based learning involves practical experiences directly related to the objects within the lab. During laboratory activities, students must adhere to SOPs, or the procedures outlined for that specific laboratory. Notably, the use of PPE is crucial in manufacturing teaching laboratories in universities. This is because these types of spaces house machinery and equipment that could pose risks to student safety.
The potential hazards within the laboratory arise from the interaction between humans and machinery. Manufacturing teaching laboratories house various machines such as CNC machines, lathes, shapers, milling machines, drills, grinders, electric welding machines, saws, and wire cutting machines. These machines have fast-moving, automated components. Additionally, tools like hammers, chisels, and saws have shapes and usage patterns that pose risks to users. Accidents in the laboratory encompass scenarios such as eye exposure to metal shavings, skin injuries due to metal dust contact, slipping on spilled lubricants, eye injuries from welding exposure, clothing being pulled into machines, finger injuries from chisels, saws, and grinders, chuck dislodging incidents, falling objects hitting the head, hand injuries from lathes, falling laboratory tools injuring feet, hand injuries during machine operation, and hands getting trapped in machinery.
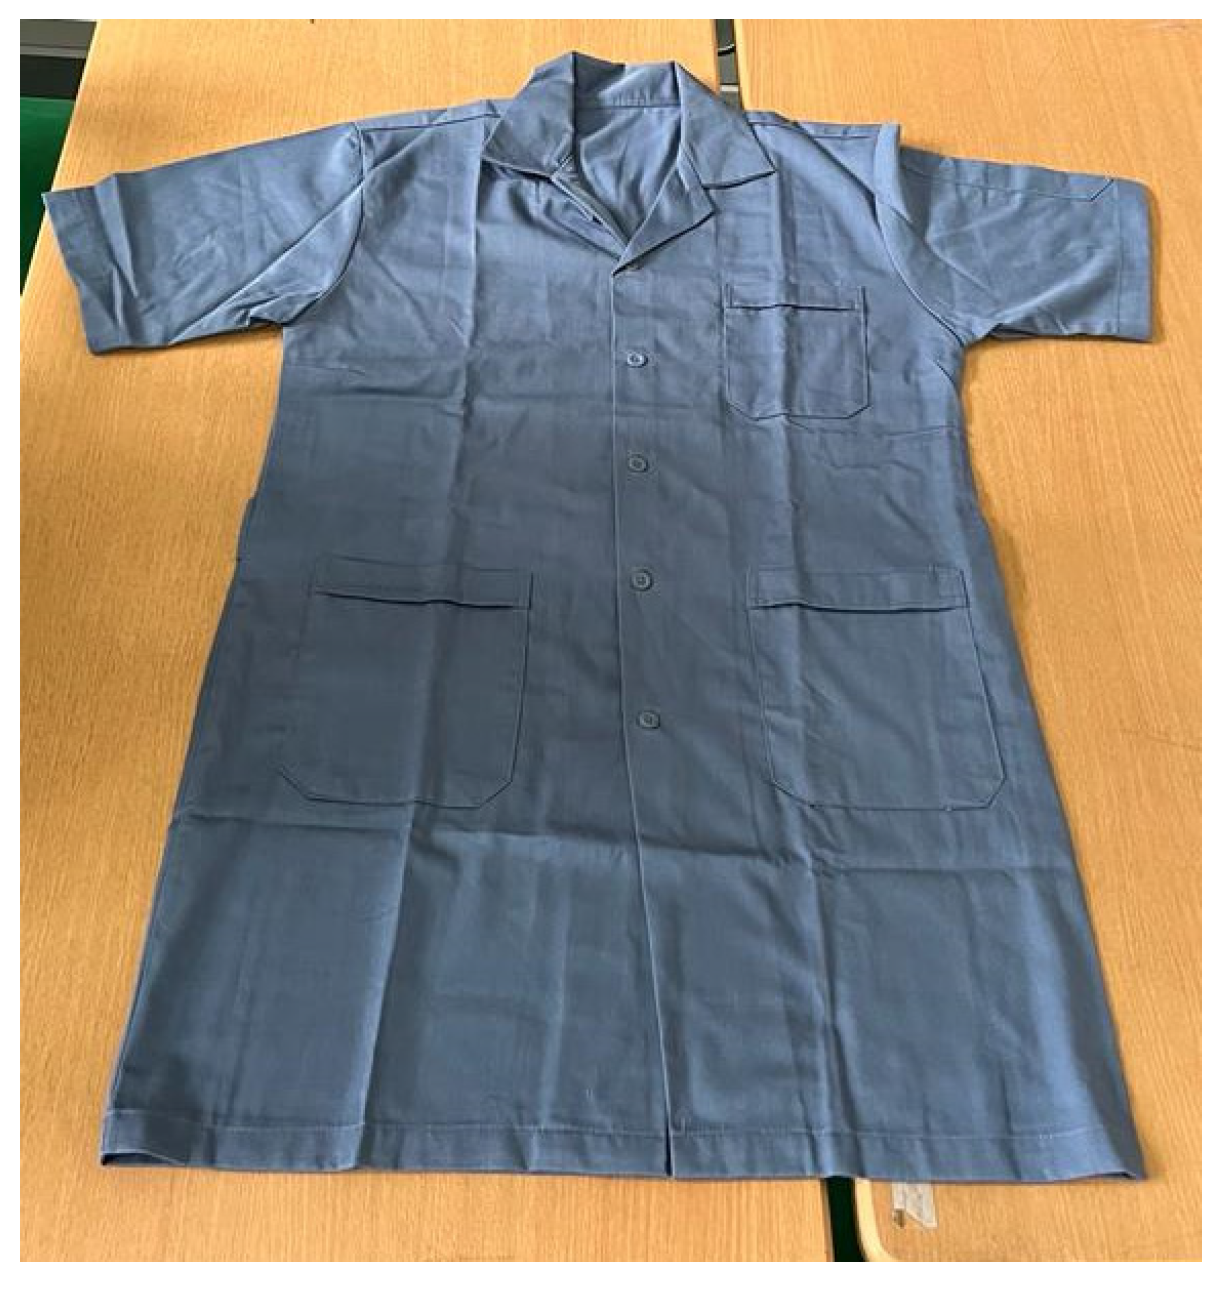
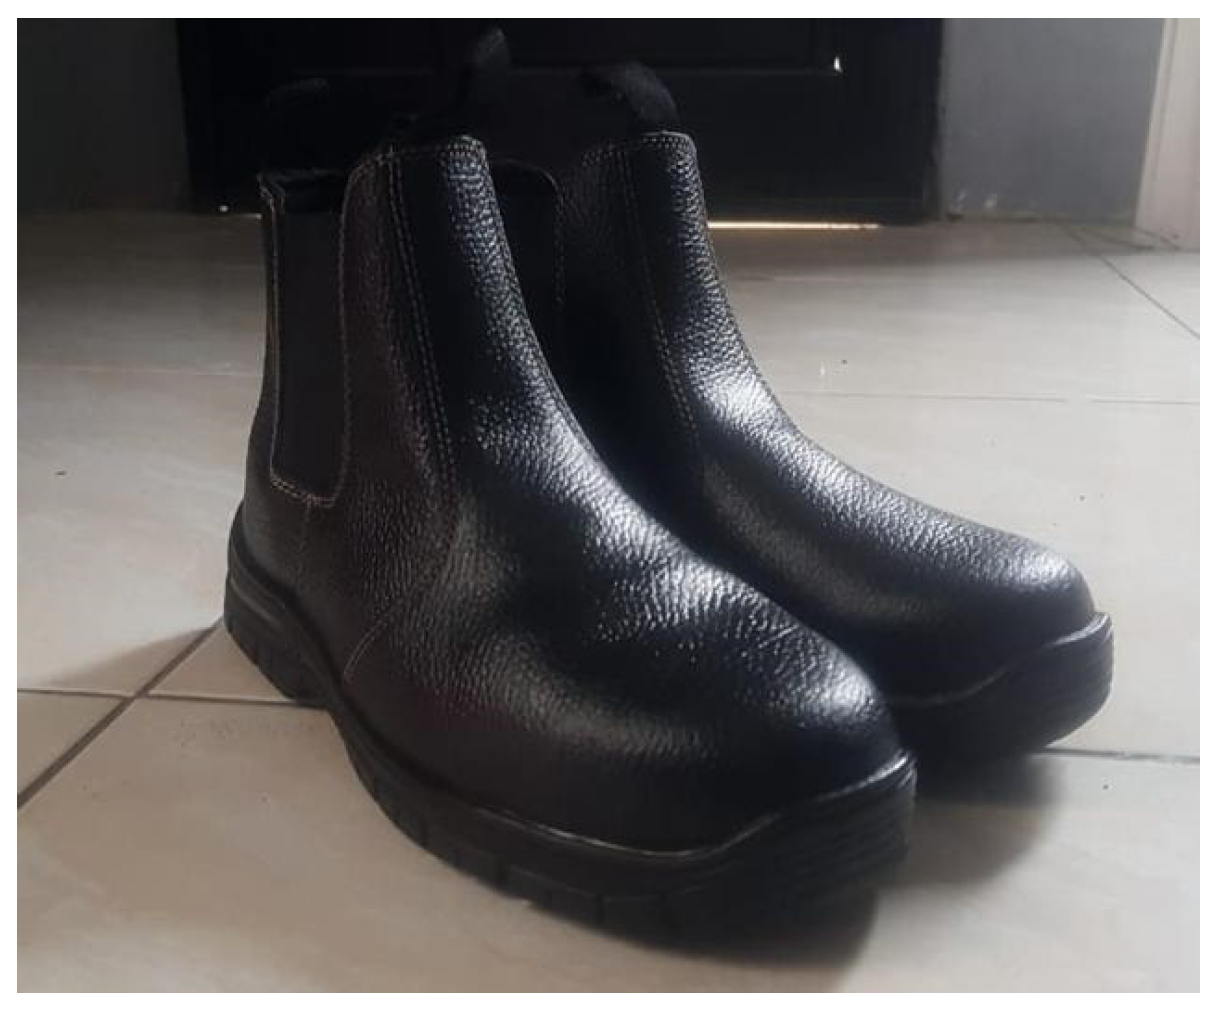
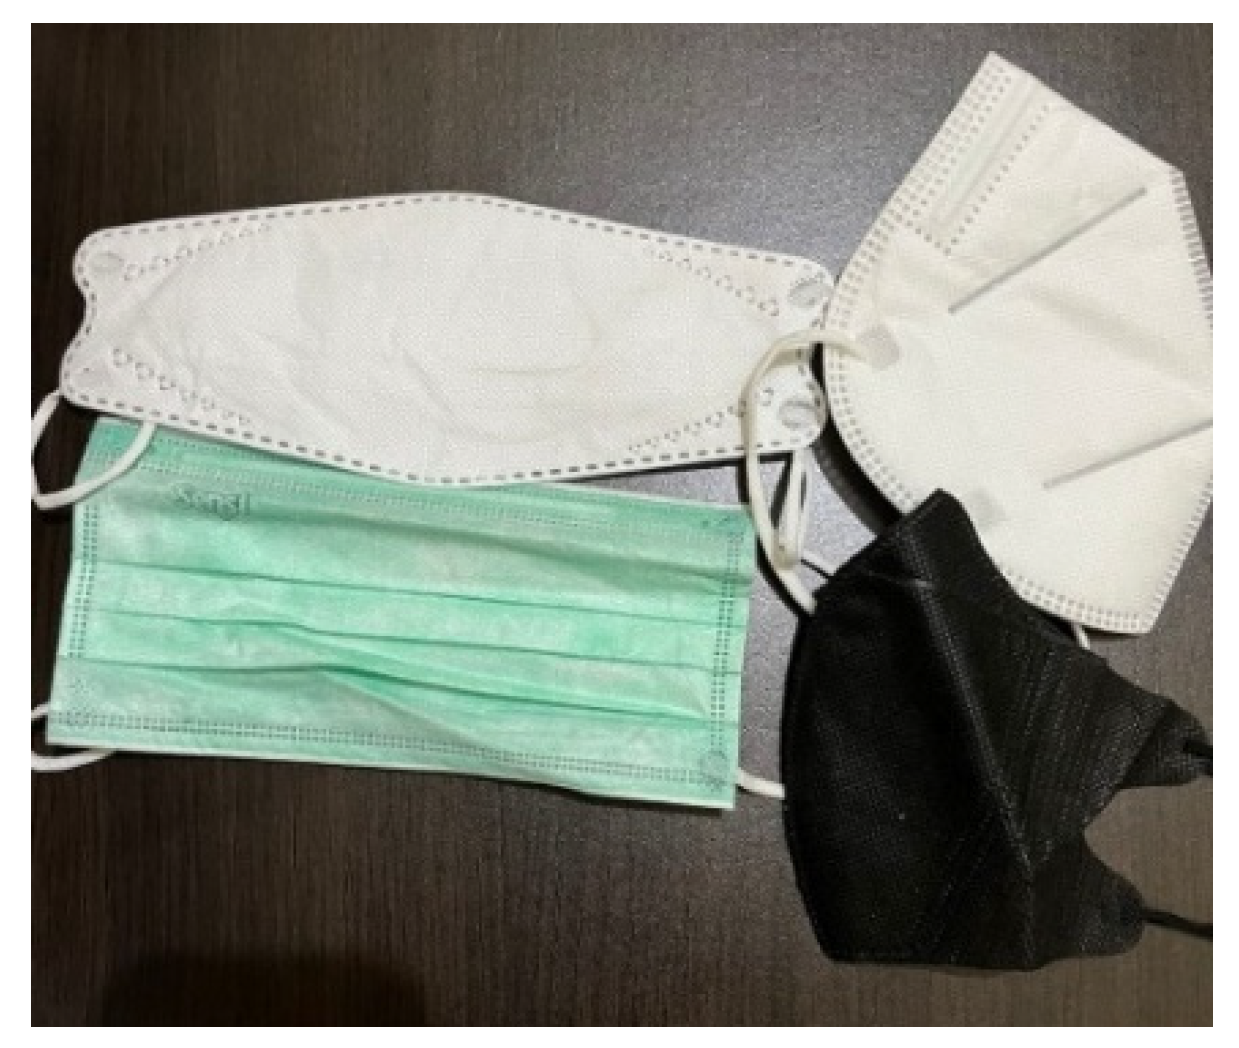
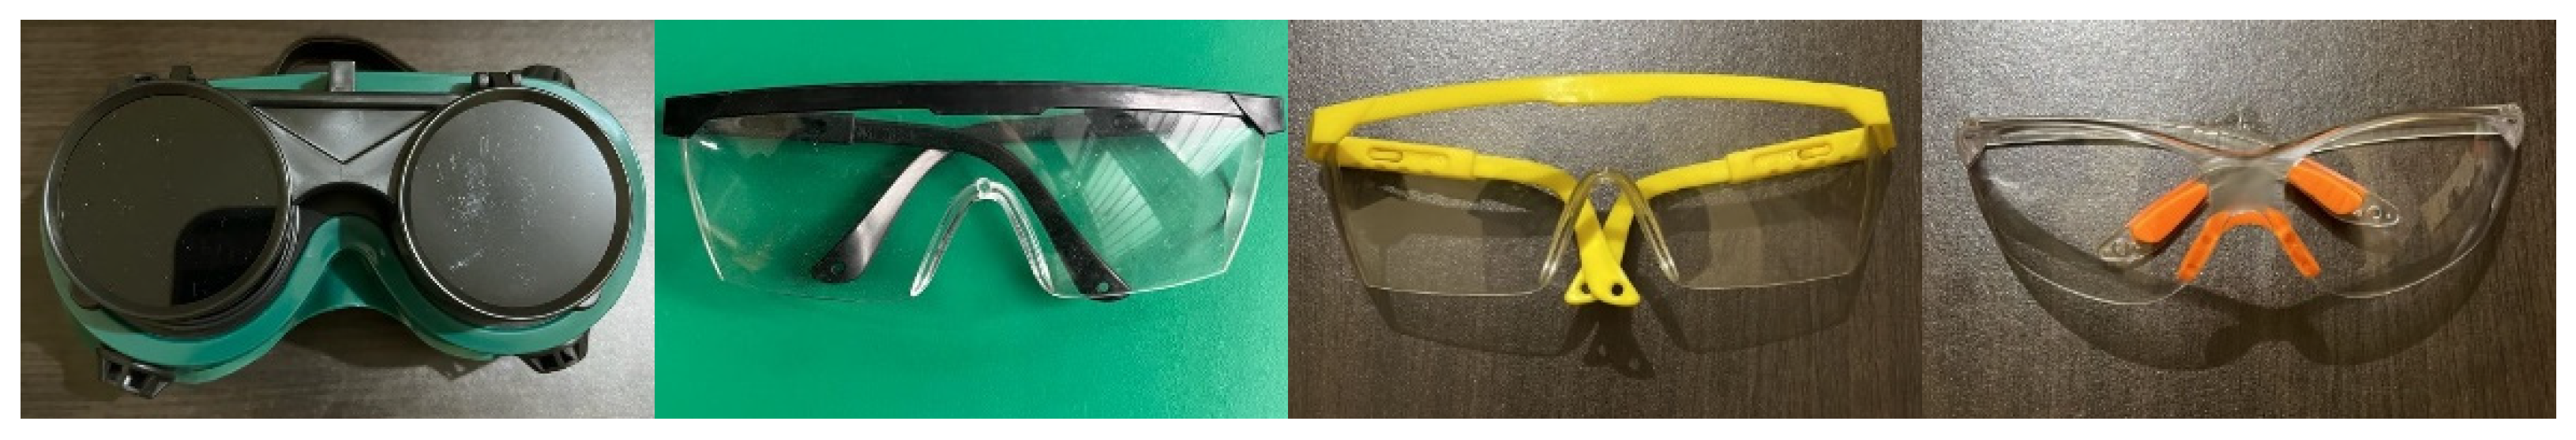
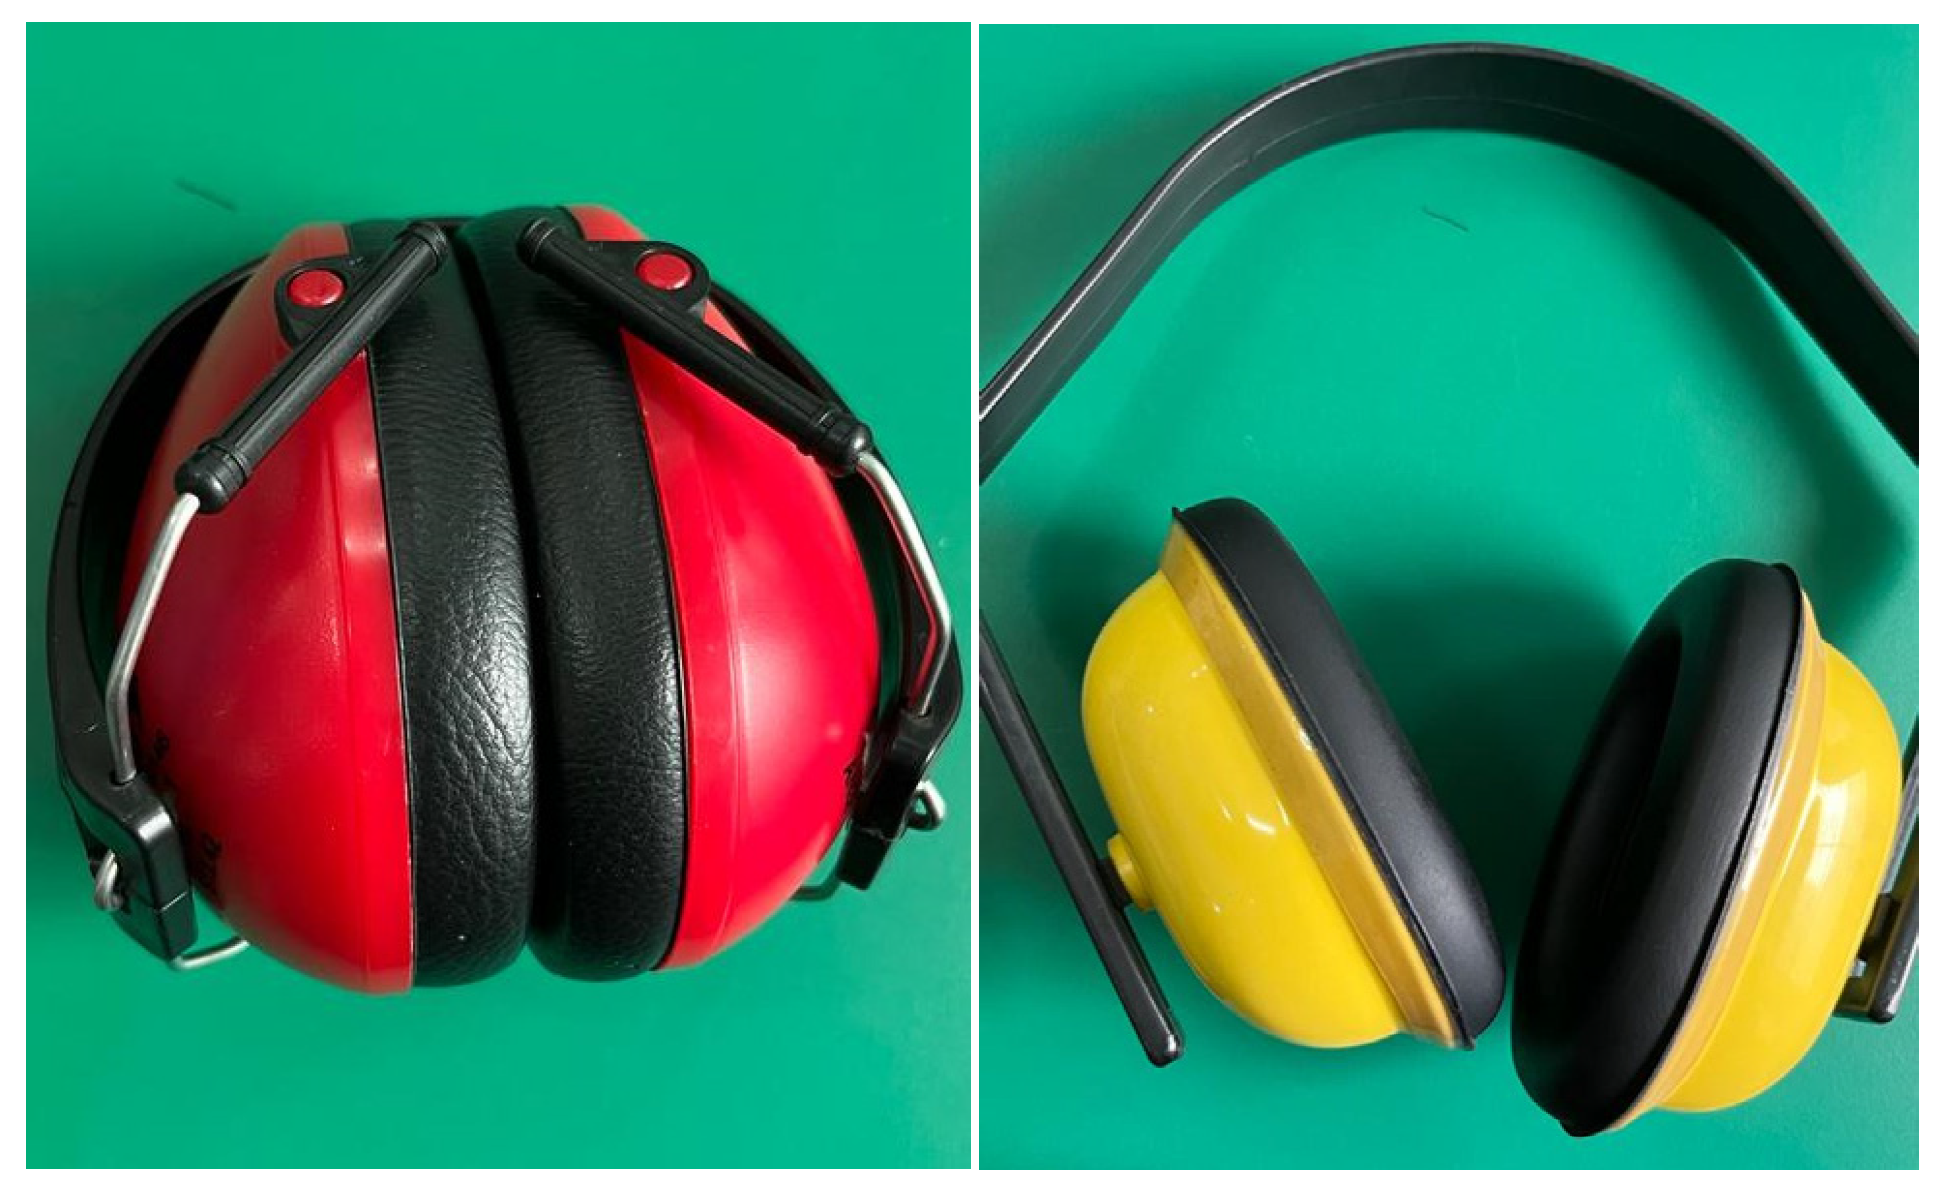
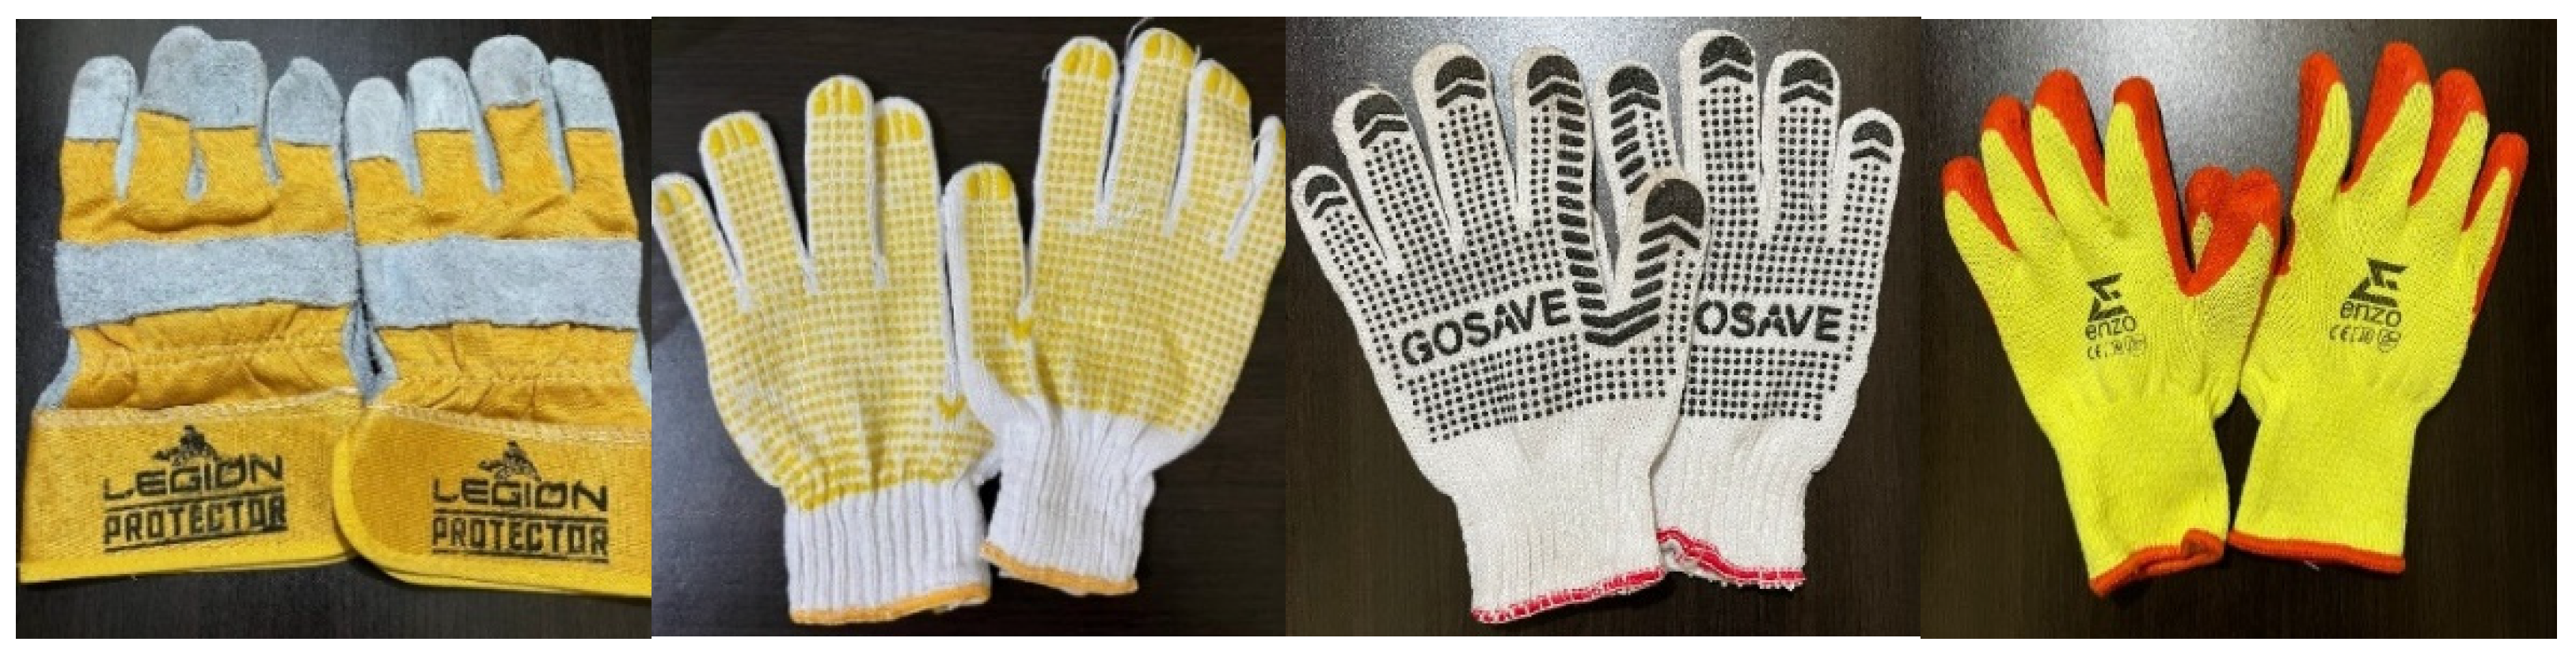
Given the occurrence of such accidents, the proper use of PPE becomes mandatory for students’ compliance and safety. However, issues related to the use of PPE by students persist, including inadequate usage and varying levels of compliance. Incomplete PPE usage might involve not wearing all the required pieces. Improper usage, on the other hand, encompasses using PPE in ways that deviate from the prescribed guidelines. The necessary PPE for manufacturing teaching laboratories include hard hats, lab coats, safety shoes, masks, safety glasses, earmuffs, and gloves. Activities such as welding and grinding necessitate the simultaneous use of these seven types of PPE. However, compliance with these PPE types extends beyond concurrent usage; students in the manufacturing teaching laboratories should adhere to wearing all seven PPE types during their activities.
To ensure the completeness and accuracy of PPE usage, this study develops detection models using artificial intelligence, especially deep learning. Convolutional Neural Networks (CNNs) are employed to classify whether students are wearing PPE appropriately and completely during activities in the manufacturing teaching laboratories. CNNs possess the ability to recognize and detect objects within digital images, largely due to enhanced computational power, large datasets, and improved training techniques [
5]. The challenge, however, lies in maintaining high detection accuracy. Addressing this challenge, the You Only Look Once (YOLO) algorithm proves effective in object detection [
6].
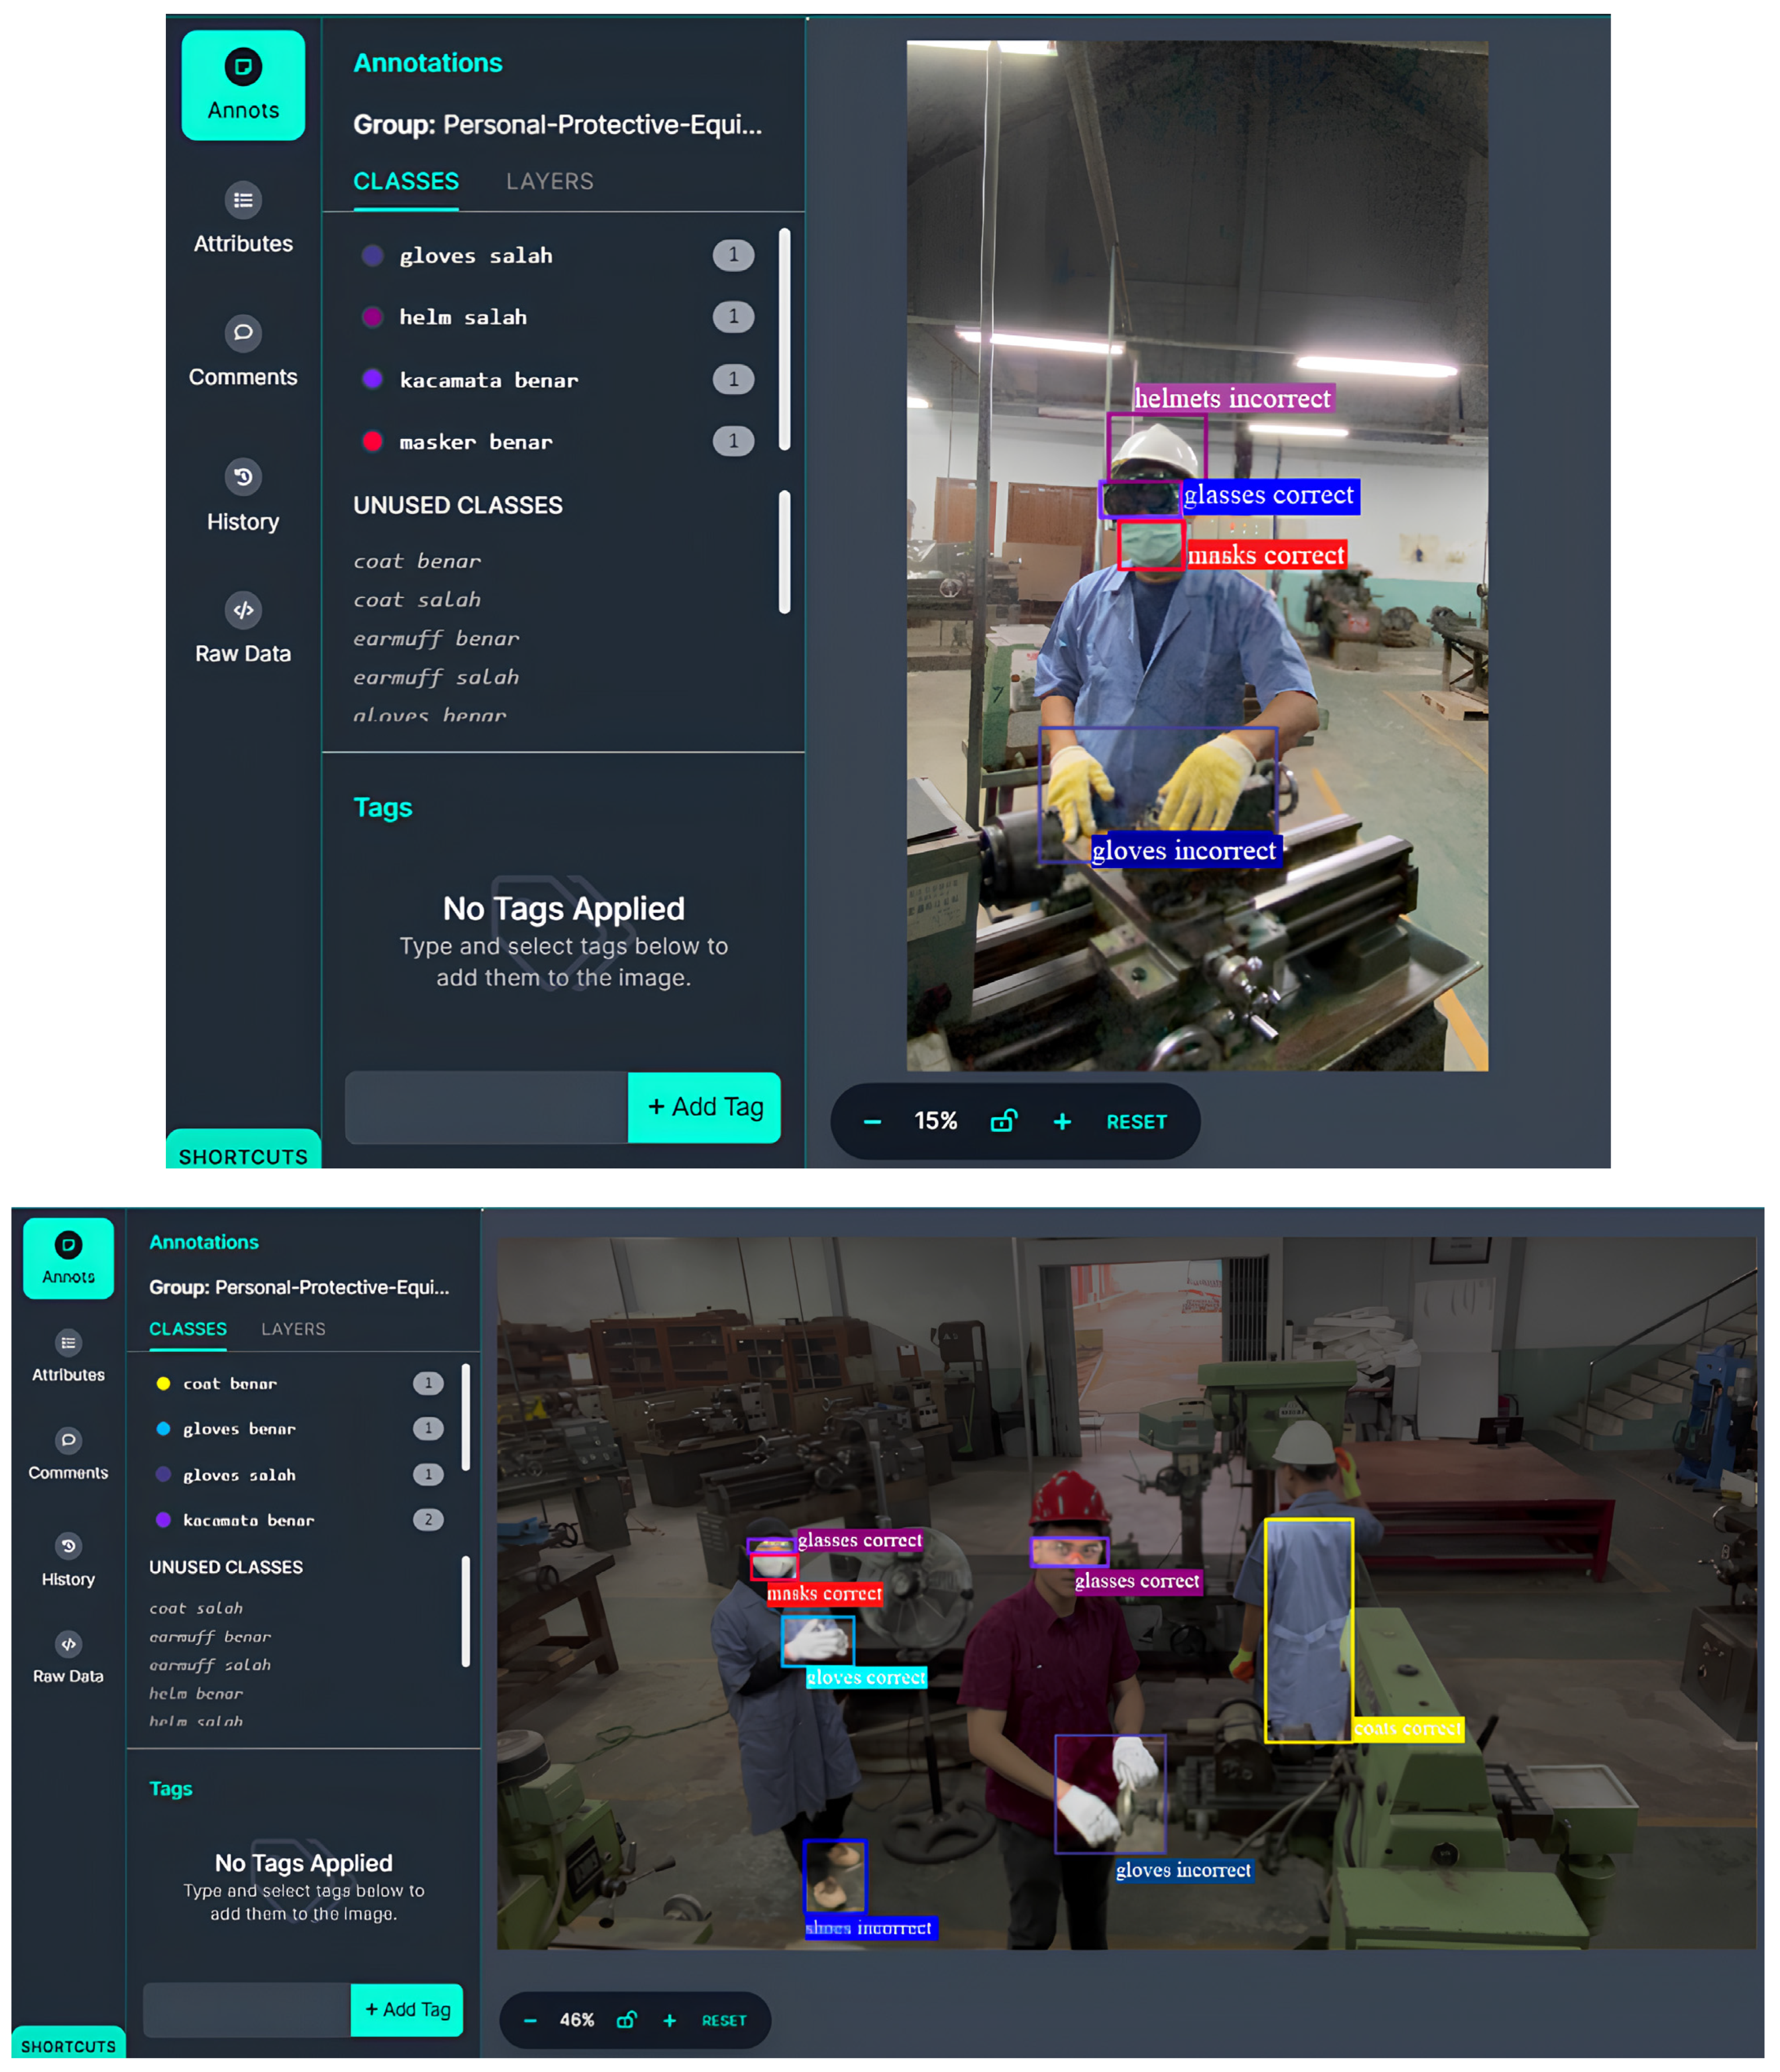
Based on this, this research focuses on identifying the level of completeness and accuracy in the usage of PPE in the manufacturing teaching laboratories in universities by developing a CNN detection model using the YOLO algorithms. The main objective is to implement a detection system that optimally identifies PPE objects within a detection frame. This visual-based object detection process relies on the presence of PPE objects in the image, and the number of detected PPE objects in a single frame is unaffected by the number of individuals. As such, the detection system is developed to identify the PPE object that can be implemented in images with single or multiple individuals within a single frame. The goal is for this system implementation to accurately and automatically detect PPE objects used by students and laboratory users, ensuring that PPE usage conforms appropriately and dutifully to its intended purpose.
2. Literature Review
PPE serves the vital purpose of safeguarding its wearer’s body from occupational hazards and preventing accidents. However, several factors, including low awareness of PPE usage, discomfort, fatigue, and negligence, contribute to insufficient PPE utilization and incorrect handling among workers [
7]. Research conducted by [
8] concerning accurate PPE usage detection at construction sites has highlighted the potential of computer–vision-based methods for automatically detecting PPE completeness. These methods offer non-invasive, cost-effective perception on-site, as they typically identify all workers and PPE components before verifying if a worker is using PPE based on their relationship with the involved equipment.
The need to detect PPE arises in order to enhance the completeness and accuracy of its usage, thereby reducing workplace accidents [
9]. Consequently, there exists a significant practical requirement to utilize technology that can assist practitioners in improving or ensuring PPE completeness. While efforts to incorporate electronic circuits into PPE have been made [
10], technologies allowing visual and noncontact completeness adherence to safety regulations are more prevalent and practical to implement. To accommodate this requirement, deep learning becomes a prominent approach for PPE detection.
In research by [
6], a CNN was used to concurrently detect workers’ use of hard hats and vests. Overall, CNN-based methods directly process images of workers and classify the status of PPE usage, including both the level of completeness and accuracy, through an end-to-end inference process. A research conducted research on PPE detection with the aim of reducing workplace accidents in the construction industry [
11]. Their study employed a CNN to detect PPE usage by workers and classify various types of PPE, such as determining if each worker wears a hard hat. Beyond hard hats, some studies have extended PPE detection to various tools, with simultaneous detection processes. Ref. [
12] detected multiple types of PPE, including hard hats and vests, using a CNN for a comprehensive safety assessment. Moreover, Ref. [
6] used a CNN to simultaneously detect workers’ use of hard hats and vests. Overall, CNN-based methods directly process images of workers, classifying both the level of completeness and accuracy of PPE usage.
Earlier research on PPE completeness and accuracy detection using deep learning extensively analyzed and reviewed various deep learning algorithms employed in developing systems aimed at identifying PPE usage. The selection of these algorithms is based on the methods or techniques used in the developed systems to identify the presence of PPE objects. In a study conducted by [
13] which focused on PPE detection at construction sites, the YOLO detection method was used to identify hard-hat-wearing personnel. The detection of PPE objects was carried out using YOLOv3 and YOLOv4. In the PPE detection process, the proposed model offered practical detection performance in terms of speed and accuracy. This method holds significant potential for automated inspection of PPE components. Based on testing results, it was able to achieve detection efficiency of over 25 FPS and a mAP value of 97%, which can be utilized to ascertain whether construction personnel adhere to safety regulations and meet real-time, high-accuracy requirements. This demonstrates that YOLOv3 possesses high accuracy and detection speed, while YOLOv4 outperforms YOLOv3, particularly in terms of detecting small objects with improved speed and accuracy.
The YOLO algorithm exists in multiple versions, each with its own performance characteristics. In a study conducted by [
14], the focus was on PPE detection at construction sites, specifically considering the use of YOLOv5. Their study aimed to detect PPE usage among construction workers across six PPE categories: shoes, jackets, vests, gloves, glasses, and hard hats. The performance of the proposed YOLOv5s model variant was compared to other algorithms through three indicators: precision, recall, and F1 score. Comparative algorithms included YOLOv4, Faster-RCNN MobileNetV3, and Faster-RCNN Resnet50. The results of a five-fold cross-validation technique revealed that YOLOv5s exhibited the most effective performance in terms of precision and recall indicators. The enhanced YOLOv5 model yielded the highest precision and recall values compared to benchmark models.
In research by [
9] conducted in the manufacturing industry, several deep learning architectures were considered: MobileNetV2, VGG19, Dense-Net, Squeeze-Net, InceptionV3, and ResNet. All algorithm models were pretrained on the ImageNet dataset and implemented using the PyTorch framework. The study was conducted within the manufacturing sector to classify various types of PPE used by workers, including hard hats, gloves, and protective glasses. The obtained performance indicated that MobileNetV2, Dense-Net, and ResNet were the top-performing classifiers. These three models achieved comparable performance, with MobileNetV2 offering the added advantage of being the most computationally efficient. For hard hat classification, both MobileNetV2 and ResNet showed superior performance, with an average accuracy of 95%.
PPE detection within the manufacturing sector was also explored by [
15], focusing on the detection of hard hats. The algorithms used in their study were YOLOv4 and YOLOv4-Tiny. YOLOv4-Tiny is a lightweight version of the complete YOLOv4, explicitly designed to reduce object detection time. A dataset of 7112 labeled images was used to discern images containing workers wearing hard hats or not. Results showed that, for the YOLOv4 configuration, the hard hat class achieved an AP50 score of 96.09%. In YOLOv4-Tiny, the AP50 score reached 86.53% for hard hats. The trade-off between accuracy and complexity of these two networks is evident. While YOLOv4 achieved the highest object recognition level, the YOLOv4-Tiny network demonstrated the best latency in object detection tasks.
Furthermore, a study conducted by [
16] employed a ReID model for accuracy in detecting and inferring the usage of PPE by each identified worker. For ReID, a novel loss function called similarity loss was designed to encourage the deep learning model to learn more discriminative human features. By combining ReID and PPE classification results, a workflow was developed to record incidents of workers not wearing the required PPE. With a real construction site dataset, the proposed method improved worker ReID and PPE classification accuracy by 4% and 13%, respectively, facilitating site video analysis and safety compliance inspection among workers. For the ReID component, three algorithm models were utilized: ResNet50, OSNet, and OSNet + BDB. The results revealed that ResNet50 exhibited the highest accuracy performance with a precision of 97.91%.
Based on the research by [
8] regarding accurate PPE usage detection at construction sites to prevent potential hazards, the employed algorithm utilized the OpenPose model for worker pose estimation. To expedite the detection process, an optimized method adopted the MobileNet network as a feature extractor. This network employed depth-wise separable convolution filters to separate depth and spatial information, enhancing computational efficiency. The study took into consideration worker poses and body postures for detection. The inclusion of pose consideration aimed to estimate key human points, localize body regions and heads based on these key points, and utilize image classification for PPE detection. The proposed worker detection method achieved a precision of 99.61% and a recall of 98.04% in worker detection, indicating that 0.39% of workers were falsely detected, and 1.96% of workers were missed in the images.
Apart from construction sites, the detection of PPE objects is also performed in offshore drilling operations. A study conducted by [
17] aimed to propose a framework for PPE detection. The proposed framework aimed to enhance the accuracy, reliability, and performance of PPE detection compared to existing methods. The detected PPE objects were safety hard hats and workwear for offshore drilling. The framework was built using YOLOV4 and evaluated using accuracy, recall, false alarm rate (FAR), missed alarm rate (MAR), and detection time as evaluation metrics. The proposed method was then compared with other methods from the literature, and experimental results indicated that the proposed framework outperformed other methods for PPE detection on offshore drilling platforms. The accuracy values for safety hard hat detection was 87.8%, while for workwear, the accuracy value was 93.1%. This framework could detect workers not wearing safety hard hats or workwear in a timely manner and generate alarm messages. However, a limitation of the study was that the detection system did not accurately identify PPE when the heads or torsos of some workers were partially obscured by pipes during operations. This could lead to inaccurate detection results and reduce the overall accuracy of the framework. Additionally, extreme weather conditions such as fog and heavy rain at sea could result in blurry images, making it difficult to accurately locate and identify workers, thereby reducing PPE detection accuracy.
The application of PPE object detection is also carried out in public spaces, as these spaces pose exposure risks that can impact health. A study conducted by [
18] detected PPE objects such as face shields, face masks, and gloves. The algorithm used was YOLOv4. The study utilized a total of 8000 iterations and resulted in a mAP value of 79% for all detected PPE classes and a loss value of 2.97. Overall, the YOLOv4 algorithm proved to be a fast and accurate model suitable for object detection monitoring purposes.
The development of CNN models in relation to this topic has been carried out in various work settings. The most frequently studied work location is construction sites. Some studies have also developed models based on datasets from nuclear power plants, industrial workplaces, factories, and public spaces. Previous studies that conducted PPE detection, such as those research that focused on construction site PPE detection [
6,
8,
13,
19,
20]. Meanwhile, research by [
9], Refs. [
14,
15] conducted in industrial settings, and [
17] conducted research in the offshore drilling environment. The common objective of these previous studies was to detect PPE to prevent workplace accidents. Similarly, other studies, like that of [
18] aimed to detect PPE in public areas to prevent human exposure to hazards, thus necessitating the use of PPE for prevention. In contrast, the focus of this study is on PPE detection in manufacturing teaching laboratories in universities to prevent workplace accidents.
In high-risk work environments such as industrial factories, construction sites, and nuclear power plants, rigorous monitoring of PPE usage is commonplace. This is largely attributed to well-defined SOPs and structured activity schedules. In contrast, manufacturing teaching laboratories in universities often exhibit less stringent oversight of PPE compliance. Ref. [
21] surveyed the compliance of PPE usage, in which the results indicate that respondents from academics are significantly less compliant with wearing a lab coat (66%) and eye protection (61%) than respondents from government labs (73% and 76%, respectively) and from industry (87% and 83%, respectively). Ref. [
22] further collected data of incidents in industrial and university labs, in which a majority of the incidents (65%) were taking place in universities. This discrepancy stems from the lack of formalized SOPs specifically for PPE and the variable nature of individual visitation schedules. Given these unique challenges, there is a compelling need for an advanced PPE detection system. The identification of PPE compliance and adequacy can be achieved through a detection system that employs deep learning technology with a CNN, given the unique challenges posed by this context. Although several studies have been proposed to develop PPE detection in various industrial sites, to the best of our knowledge this is the first study dedicated to the development of a CNN-based PPE detection model specifically for laboratory environments. Hence, the purpose of this study is to develop a CNN model for detecting compliance and adequacy of PPE usage among visitors in manufacturing teaching laboratories in universities.
The distinction of this study from previous related research lies in its execution within manufacturing teaching laboratories in universities, whereas prior studies were conducted in construction sites, industrial settings, power plants, and nuclear facilities. The differentiating factor from earlier research, despite a shared focus on PPE detection, lies in the diverse environmental backgrounds of each research location. The varying background context of detection locations leads to differing detection outcomes even when utilizing the same detection methodology. Additionally, there are differences in the type of PPE used in industrial and university laboratories. This study encompasses seven types of PPEs, going beyond detecting the presence of PPE objects in images to providing precision levels of usage for each individual piece of PPE. The PPE classes investigated include hard hats, lab coats, shoes, masks, protective eyewear, and gloves. Furthermore, this study advances the development of detection models that are capable of not only identifying PPE objects in use but also evaluating their correct utilization. This factor is particularly critical in university settings, as students and laboratory users typically receive less training on PPE usage compared to workers in industrial and construction sectors. Consequently, this leads to a higher incidence of incorrect use of PPE within academic environments.
This study develops PPE detection models by harnessing the YOLO algorithms, noted for their efficacy and precision in related fields. Our research evaluates three versions: YOLOv4, YOLOv5, and YOLOv6, each chosen for its distinctive strengths. The inclusion of these variants is crucial to comprehensively assess their performance in PPE detection, especially within the consistent setting of manufacturing teaching laboratories in universities. Despite the uniform environment, variations in the algorithms’ design can lead to different model outputs, underscoring the need to explore the effectiveness of each YOLO version.
Empirical evidence suggests varied strengths among these algorithms: YOLOv6 often surpasses its predecessors in general performance, largely owing to its more advanced development. However, this does not diminish the notable precision and high mean Average Precision (mAP) score of YOLOv4 [
23], nor the exceptional detection speed of YOLOv5 [
24]. Conversely, YOLOv6, while more accurate overall [
20], has shown limitations in close-up object detection and stability compared to YOLOv5 [
20]. To address these conflicting findings and further our understanding of these algorithms’ capabilities in PPE detection, our study conducts a detailed comparative analysis of YOLOv4, YOLOv5, and YOLOv6.
3. Detection Method
3.1. YOLOv4
YOLO is a deep learning technique that excels in rapid, accurate object detection and classification, adapting well to detection tasks [
25]. Unlike two-stage algorithms that separate object detection into distinct phases, YOLO encapsulates the process in a single pass through the neural network, analyzing an image in one stride to predict object locations and classifications. This streamlined approach allows YOLO to offer real-time performance benefits, making it highly efficient for applications requiring immediate detection results. YOLO’s architecture mimics human neural networks, enabling it to recognize and detect objects by leveraging previously learned data, thus exhibiting remarkable proficiency when presented with new, unseen images. This efficiency and adaptability render YOLO a preferred choice over other object detection algorithms, especially in scenarios where speed and accuracy are important.
The YOLOv4 algorithm, developed by [
26], represents an advancement over its predecessor, YOLOv3, and operates as a one-stage detector, demonstrating a remarkable capability for rapid object detection [
26]. YOLOv4 consists of three essential components: the backbone block, neck block, and head block. The backbone block serves the purpose of feature extraction from images. Subsequently, the neck block enhances feature effectiveness by introducing additional layers between the backbone and head/neck. In YOLOv4, the head block is responsible for identifying and classifying objects within each bounding box, achieved by applying anchor boxes to the feature map and generating a final output vector containing class probabilities, object scores, and bounding box information [
27].
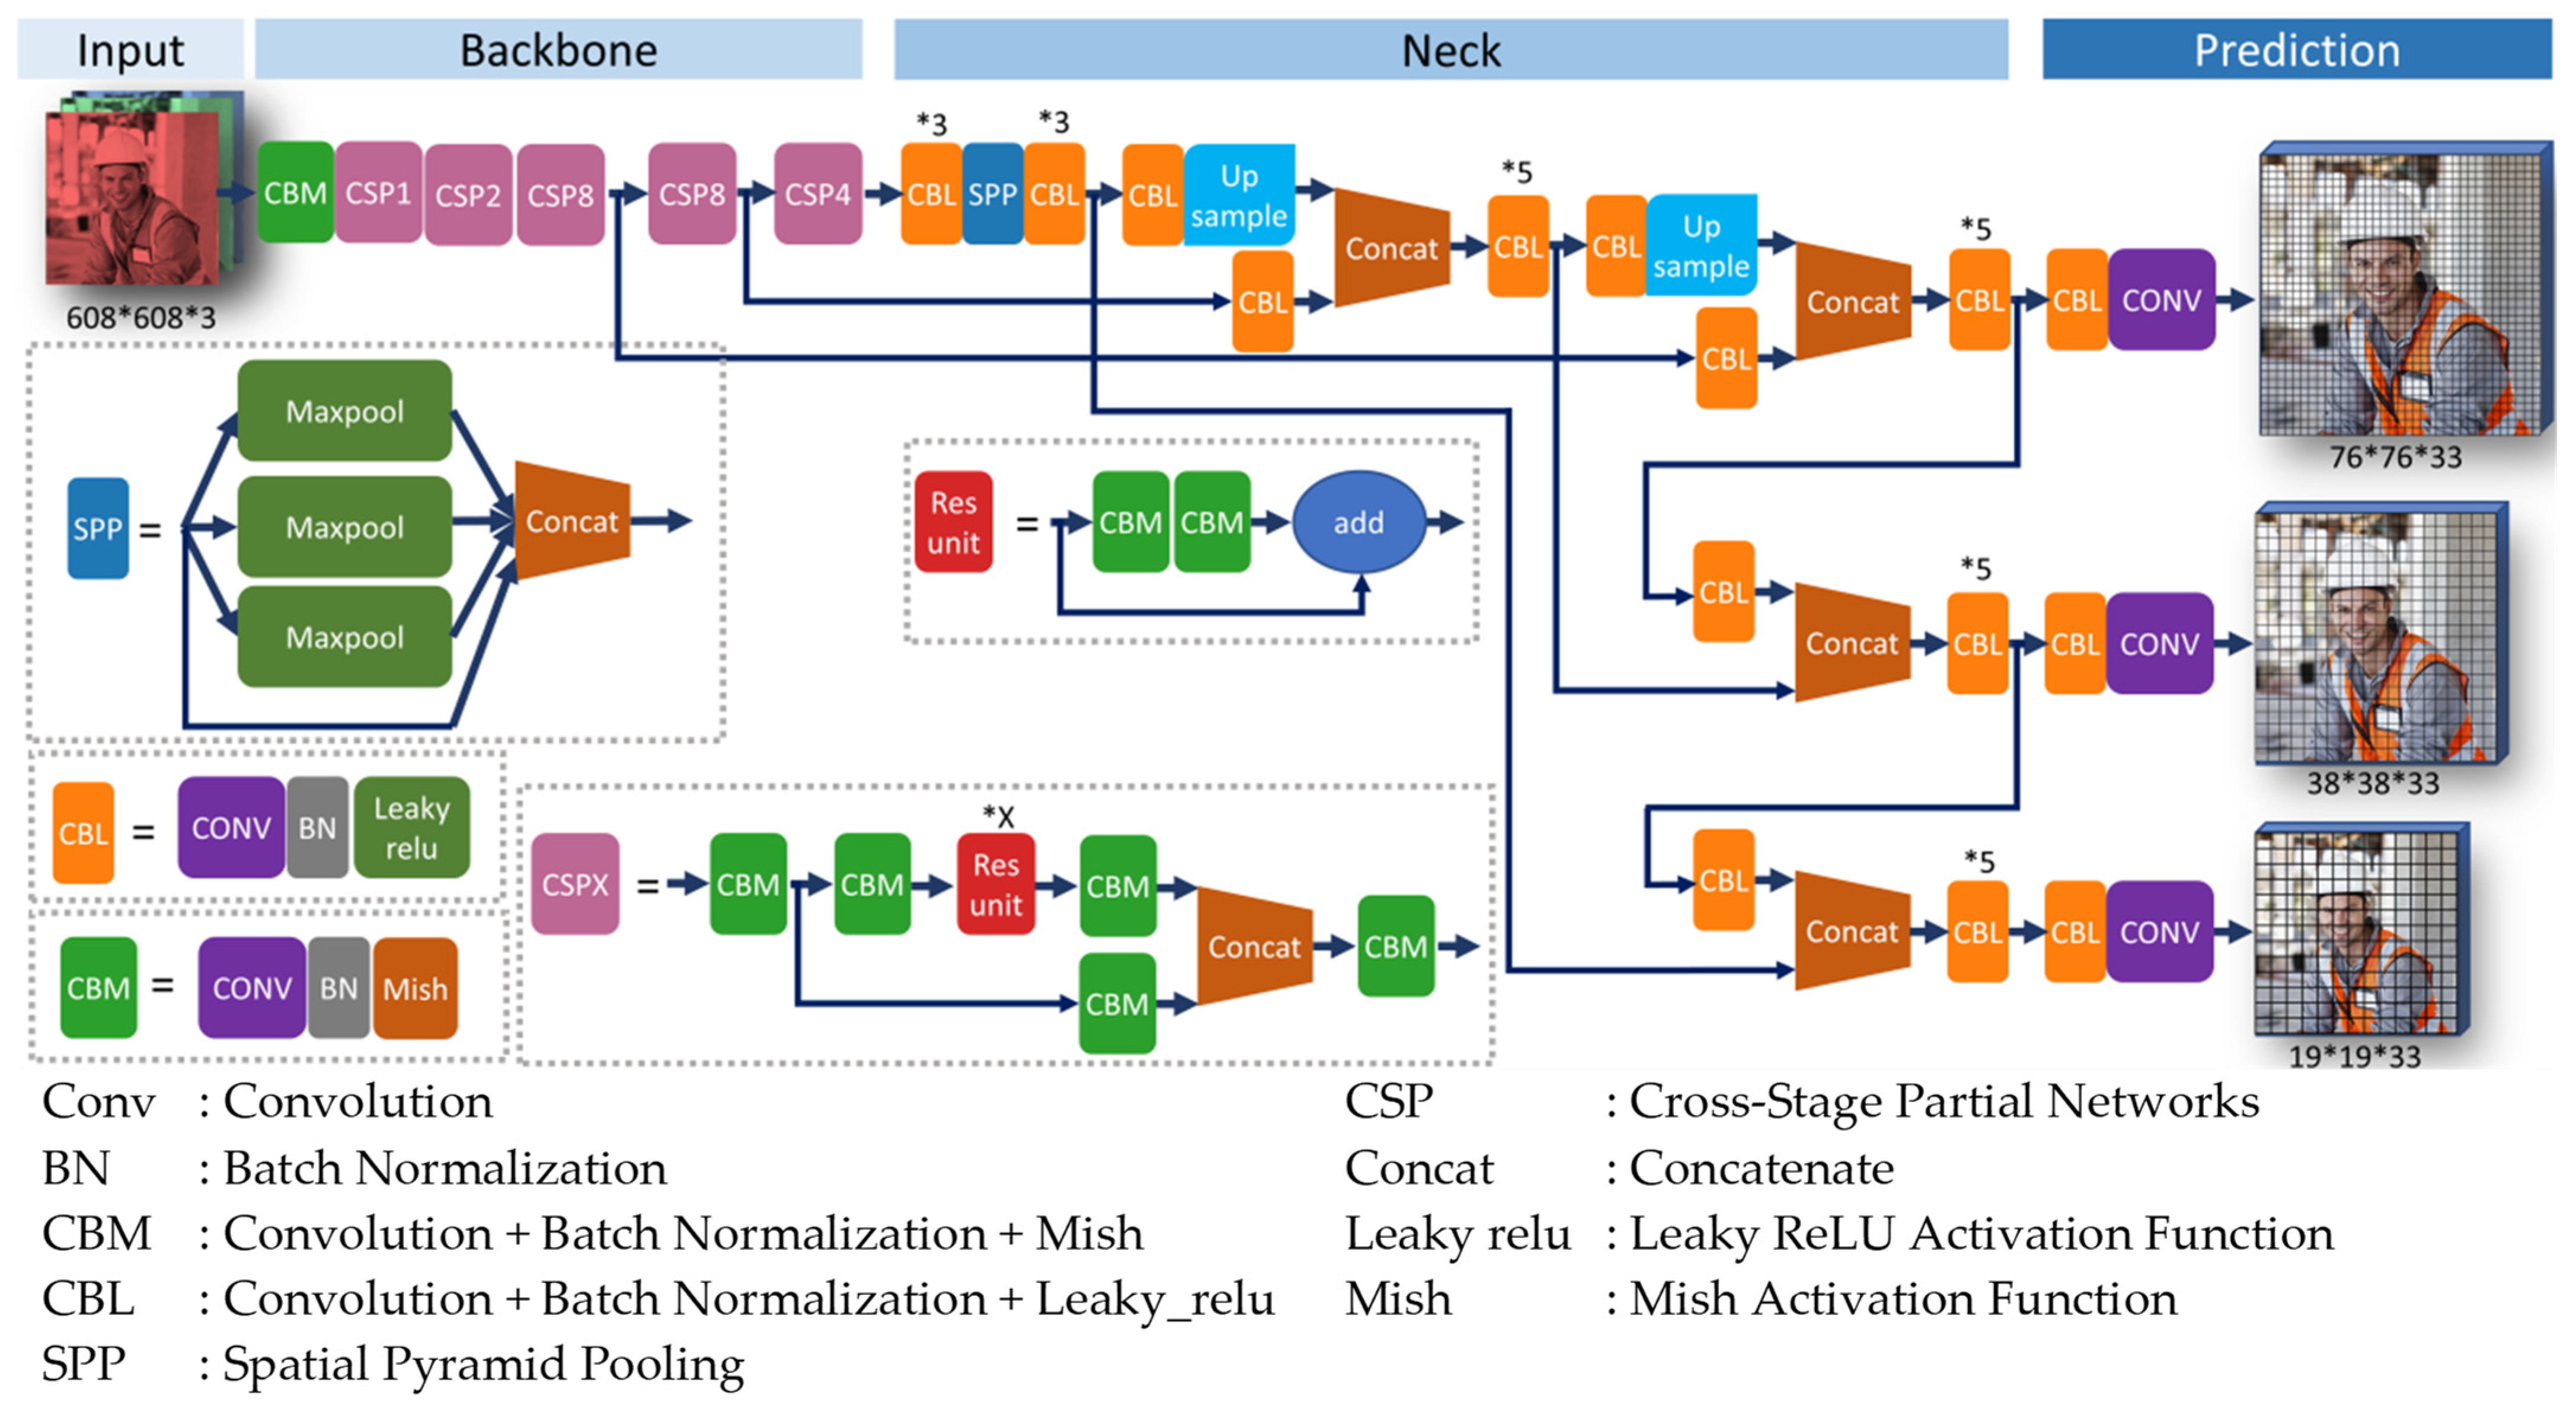
Figure 1 presents an illustration of the YOLOv4 architecture.
The YOLOv4 architecture initiates its processing pipeline with an input layer that accommodates an image of 608 by 608 pixels, encoded in three color channels (RGB). This input is then subjected to a series of convolutional operations within the custom CBM blocks, where each convolutional layer is followed by batch normalization and the Mish activation function, thereby allowing for initial feature extraction and nonlinear activation.
Subsequent to the initial feature extraction, the architecture employs CSP blocks, specifically CSP1, CSP2, and CSP8. These blocks ingeniously partition the feature maps, process each segment independently, and subsequently merge the results. This strategic design is aimed at reducing computational overhead while enhancing the efficiency of the feature extraction process.
Interspersed with these CSP blocks are sequences of CBL modules, each comprising convolutional layers, batch normalization, and Leaky ReLU activation functions. These modules are replicated multiple times within the network (denoted by the symbols *3 or *X), indicating their repeated application for the purpose of feature refinement.
The SPP layer, situated after the CSP8 block, introduces a critical enhancement to the architecture. By executing max-pooling operations at varying scales, the SPP layer aggregates contextual information and ensures a comprehensive receptive field, which is vital for capturing features at different scales and resolutions.
Upon completion of the backbone’s feature extraction phase, the architecture’s ‘Neck’ serves as a sophisticated feature fusion mechanism. It employs upsampling and concatenation operations to amalgamate feature maps from disparate layers. This fusion process allows the network to consolidate information across different resolutions, thereby enabling more accurate object detection across varying scales.
In the concluding ‘Prediction’ phase, the YOLOv4 model employs convolutional layers at three distinct scales, specifically 76 × 76, 38 × 38, and 19 × 19. These scales correspond to the network’s ability to capture small, medium, and large object details, respectively. At each scale, the convolutional layers predict bounding boxes, objectness scores, and class probabilities. The output of the network is a set of bounding boxes and associated class predictions, which are superimposed onto the original input image, effectively highlighting the detected objects.
The incorporation of mosaic data augmentation, along with optimizations in the backbone, network training, activation functions, and loss functions, elevates YOLOv4 as a robust algorithm for object detection. Inspired by its previous ability in object detection, this study employs YOLOv4 for the object detection algorithms for PPE detection. In this study, the YOLOv4 model is constructed through the utilization of transfer learning and employs a loss function comprising both box loss and classification loss. Originally, YOLOv4 had undergone training on the Common Objects in Context (COCO) dataset, encompassing over 200,000 labeled images across 80 distinct classes. Its utilization in detecting PPE objects within manufacturing teaching laboratories in universities is attributed to YOLOv4’s ability to strike a balance between speed and accuracy in object detection [
23].
3.2. YOLOv5
The YOLOv5 object detection algorithm is a one-stage, anchor-based object detection method. Its architecture comprises three key components: the backbone, neck, and head. With its comprehensive design, the YOLOv5 model is proficient in learning the characteristics and image features from the provided dataset, allowing it to perform object detection based on the features acquired during the training process [
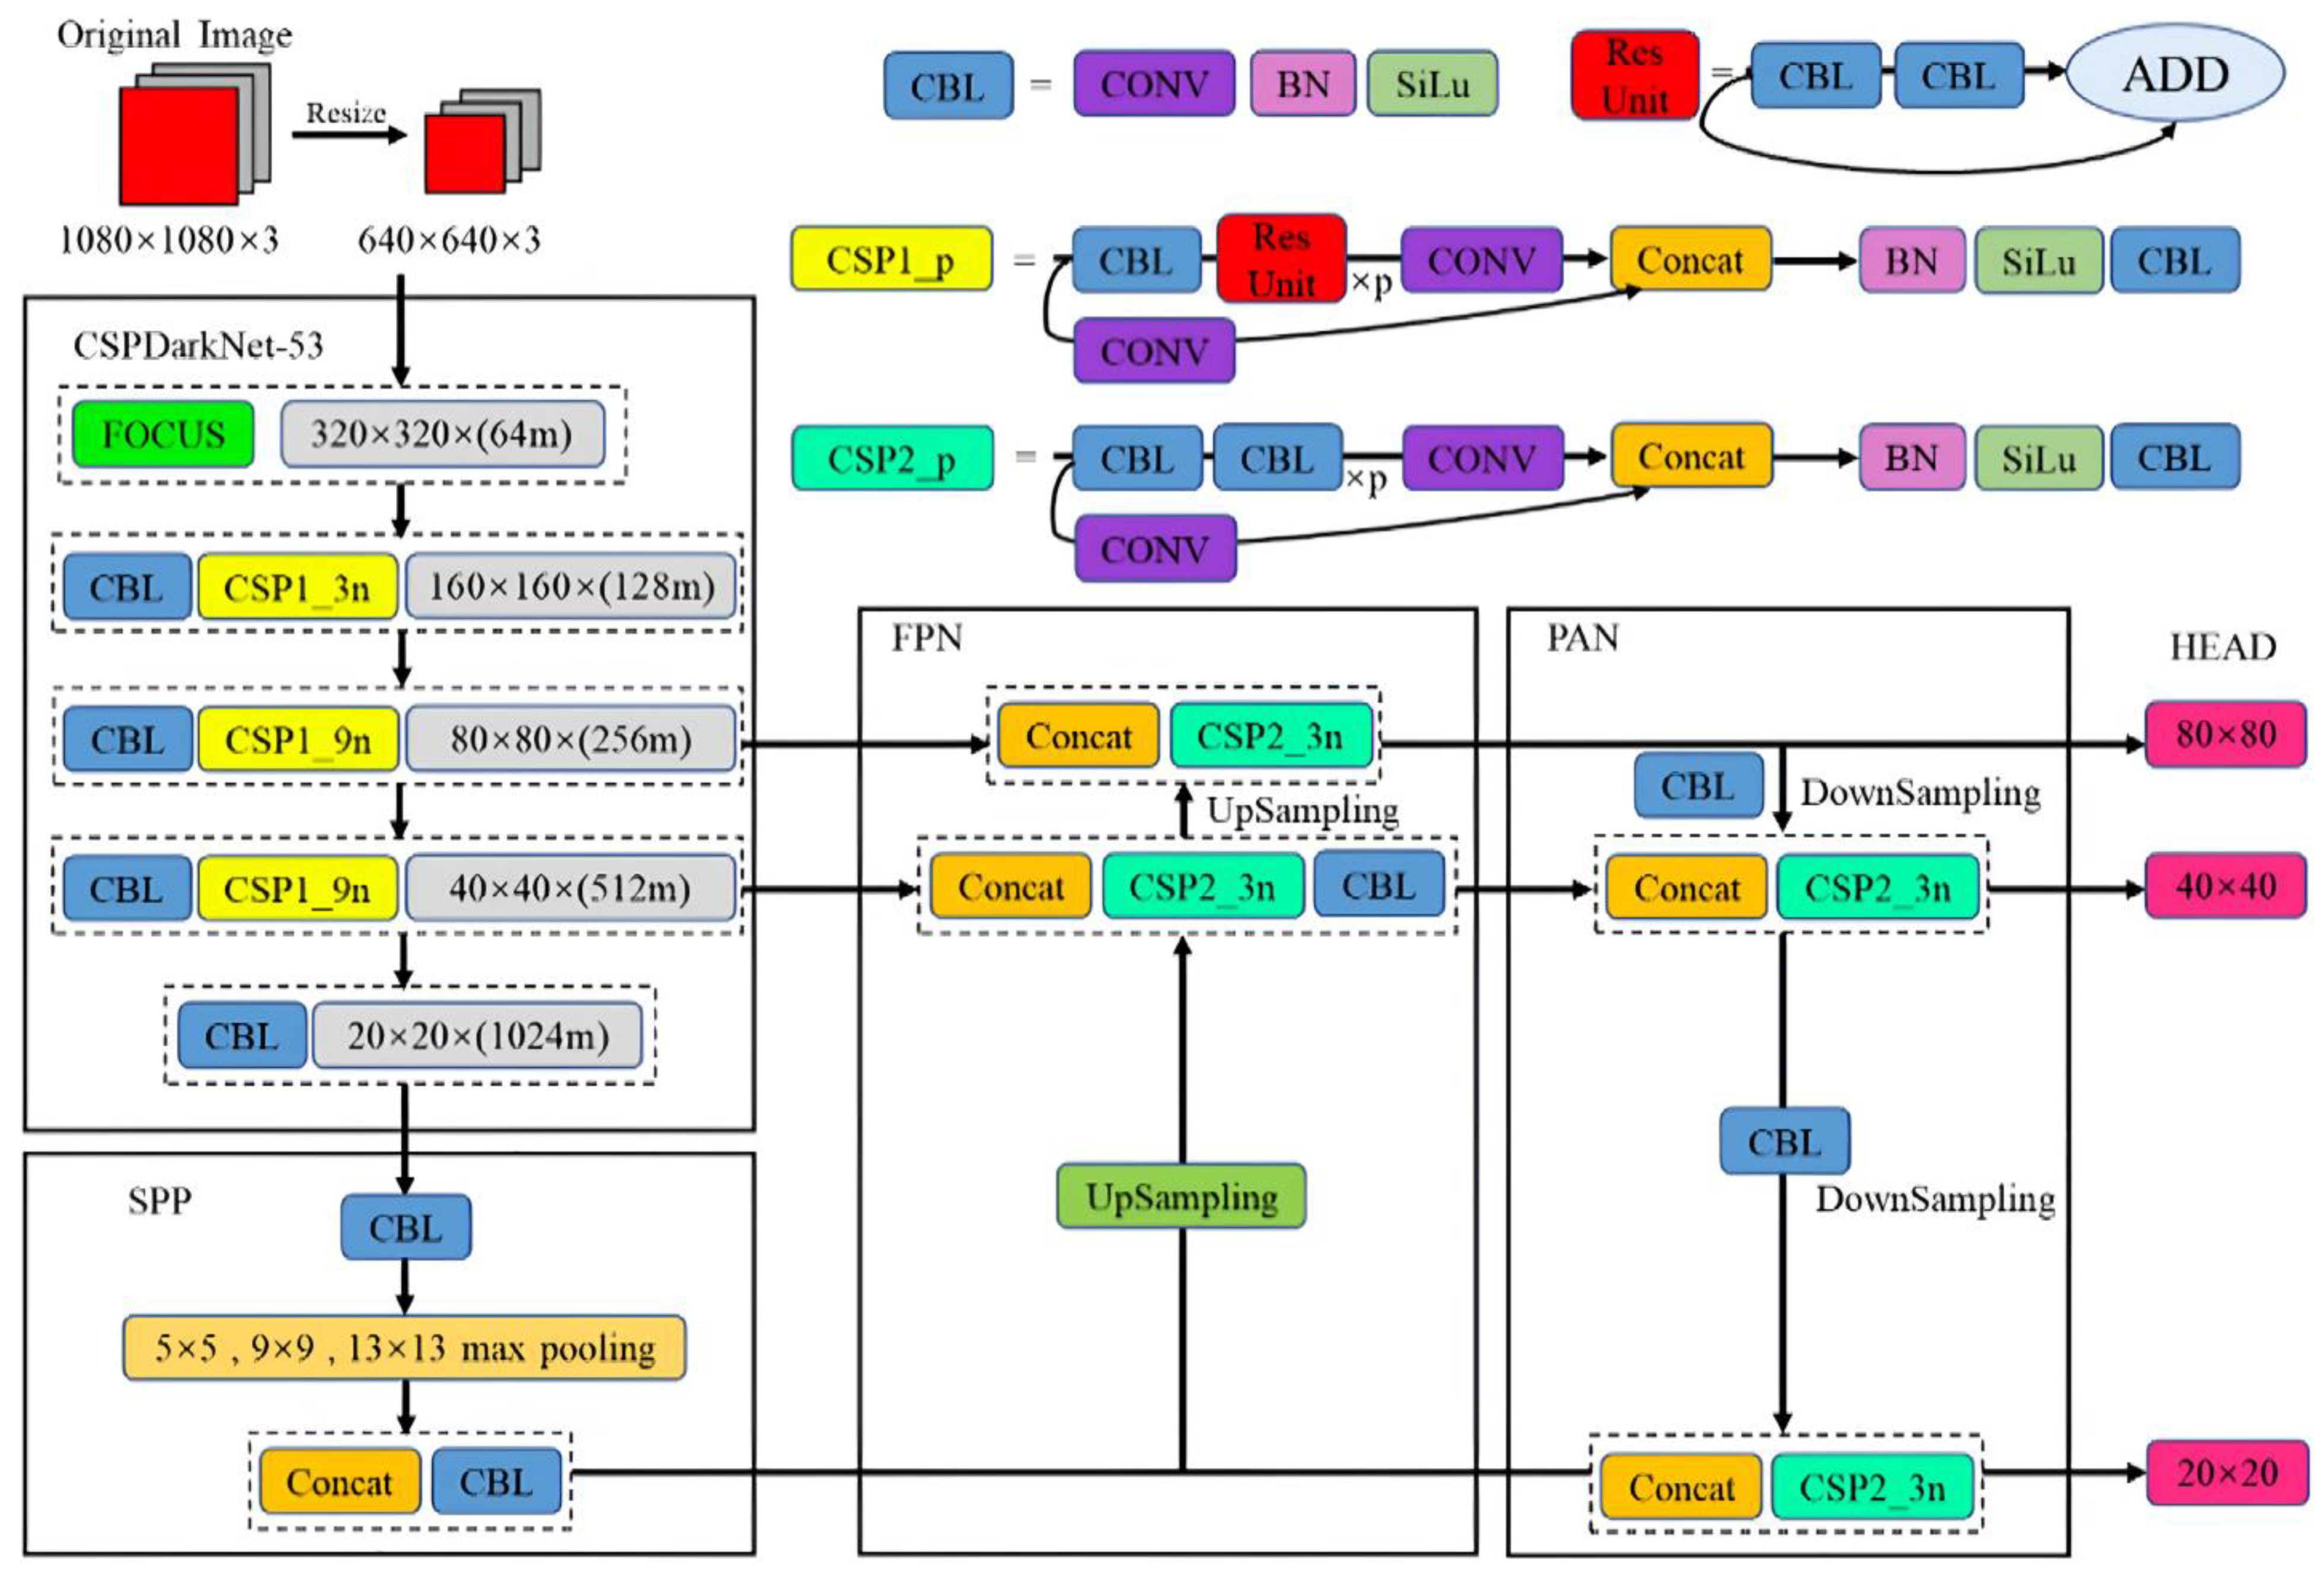
20]. The architecture of YOLOv5 is illustrated in
Figure 2.
The first stage of processing is undertaken via the CSPDarkNet-53 backbone, which comprises a series of CBL layers, interspersed with CSP blocks. The CSP blocks, denoted by CSP1 with varying multiplicative factors (3n and 9n), serve to manage computational efficiency by splitting the feature map into two parts, processing each independently, and then recombining them. This structure is repeated at multiple scales, progressively halving the spatial dimensions while doubling the depth of the feature maps, as seen in the transition from 320 × 320 to 20 × 20 pixels.
The SPP layer follows, which aggregates the feature maps using max-pooling operations at 5 × 5, 9 × 9, and 13 × 13 scales. This operation captures spatial hierarchies and robust features at varying scales, leading to a concatenated feature map that is fed into additional CBL layers.
The architecture then transitions into the Neck, composed of a Feature Pyramid Network (FPN) and a Path Aggregation Network (PAN). The FPN utilizes top-down and lateral connections to merge feature maps from different levels of the backbone, enhancing semantic information at each scale. The PAN, conversely, facilitates the bottom-up pathway, enhancing the feature hierarchy by aggregating lower-level spatial details through a series of upsampling and concatenation operations. This structure ensures that finer-grained features are preserved and enhanced as they flow through the network.
Finally, the detection heads, referred to as the HEAD in the diagram, process the aggregated feature maps to produce object detections at three distinct scales: 80 × 80, 40 × 40, and 20 × 20. These scales correspond to different grid sizes where the network predicts bounding boxes, object classes, and confidence scores. The multi-scale detection capability allows YOLOv5 to effectively detect objects of various sizes within the image.
In this research, YOLOv5 serves as one of the selected algorithms. Here, the transfer learning approach is also used to develop the YOLOv5 model for PPE detection. Similar to YOLOv4, YOLOv5 also originally underwent training on the Common Objects in Context (COCO) dataset, an extensive collection of data used for object recognition, segmentation, and labeling [
30]. The selection of YOLOv5 for detecting PPE objects in manufacturing teaching laboratories in universities is justified by its excellent sensitivity in object detection [
29].
3.3. YOLOv6
The YOLOv6 CNN is an object detection algorithm that operates in a single stage, identifying objects in images without the need for preliminary regional proposal network (RPN) processing. This leads to enhanced detection speed, accuracy, and model parameter reduction.
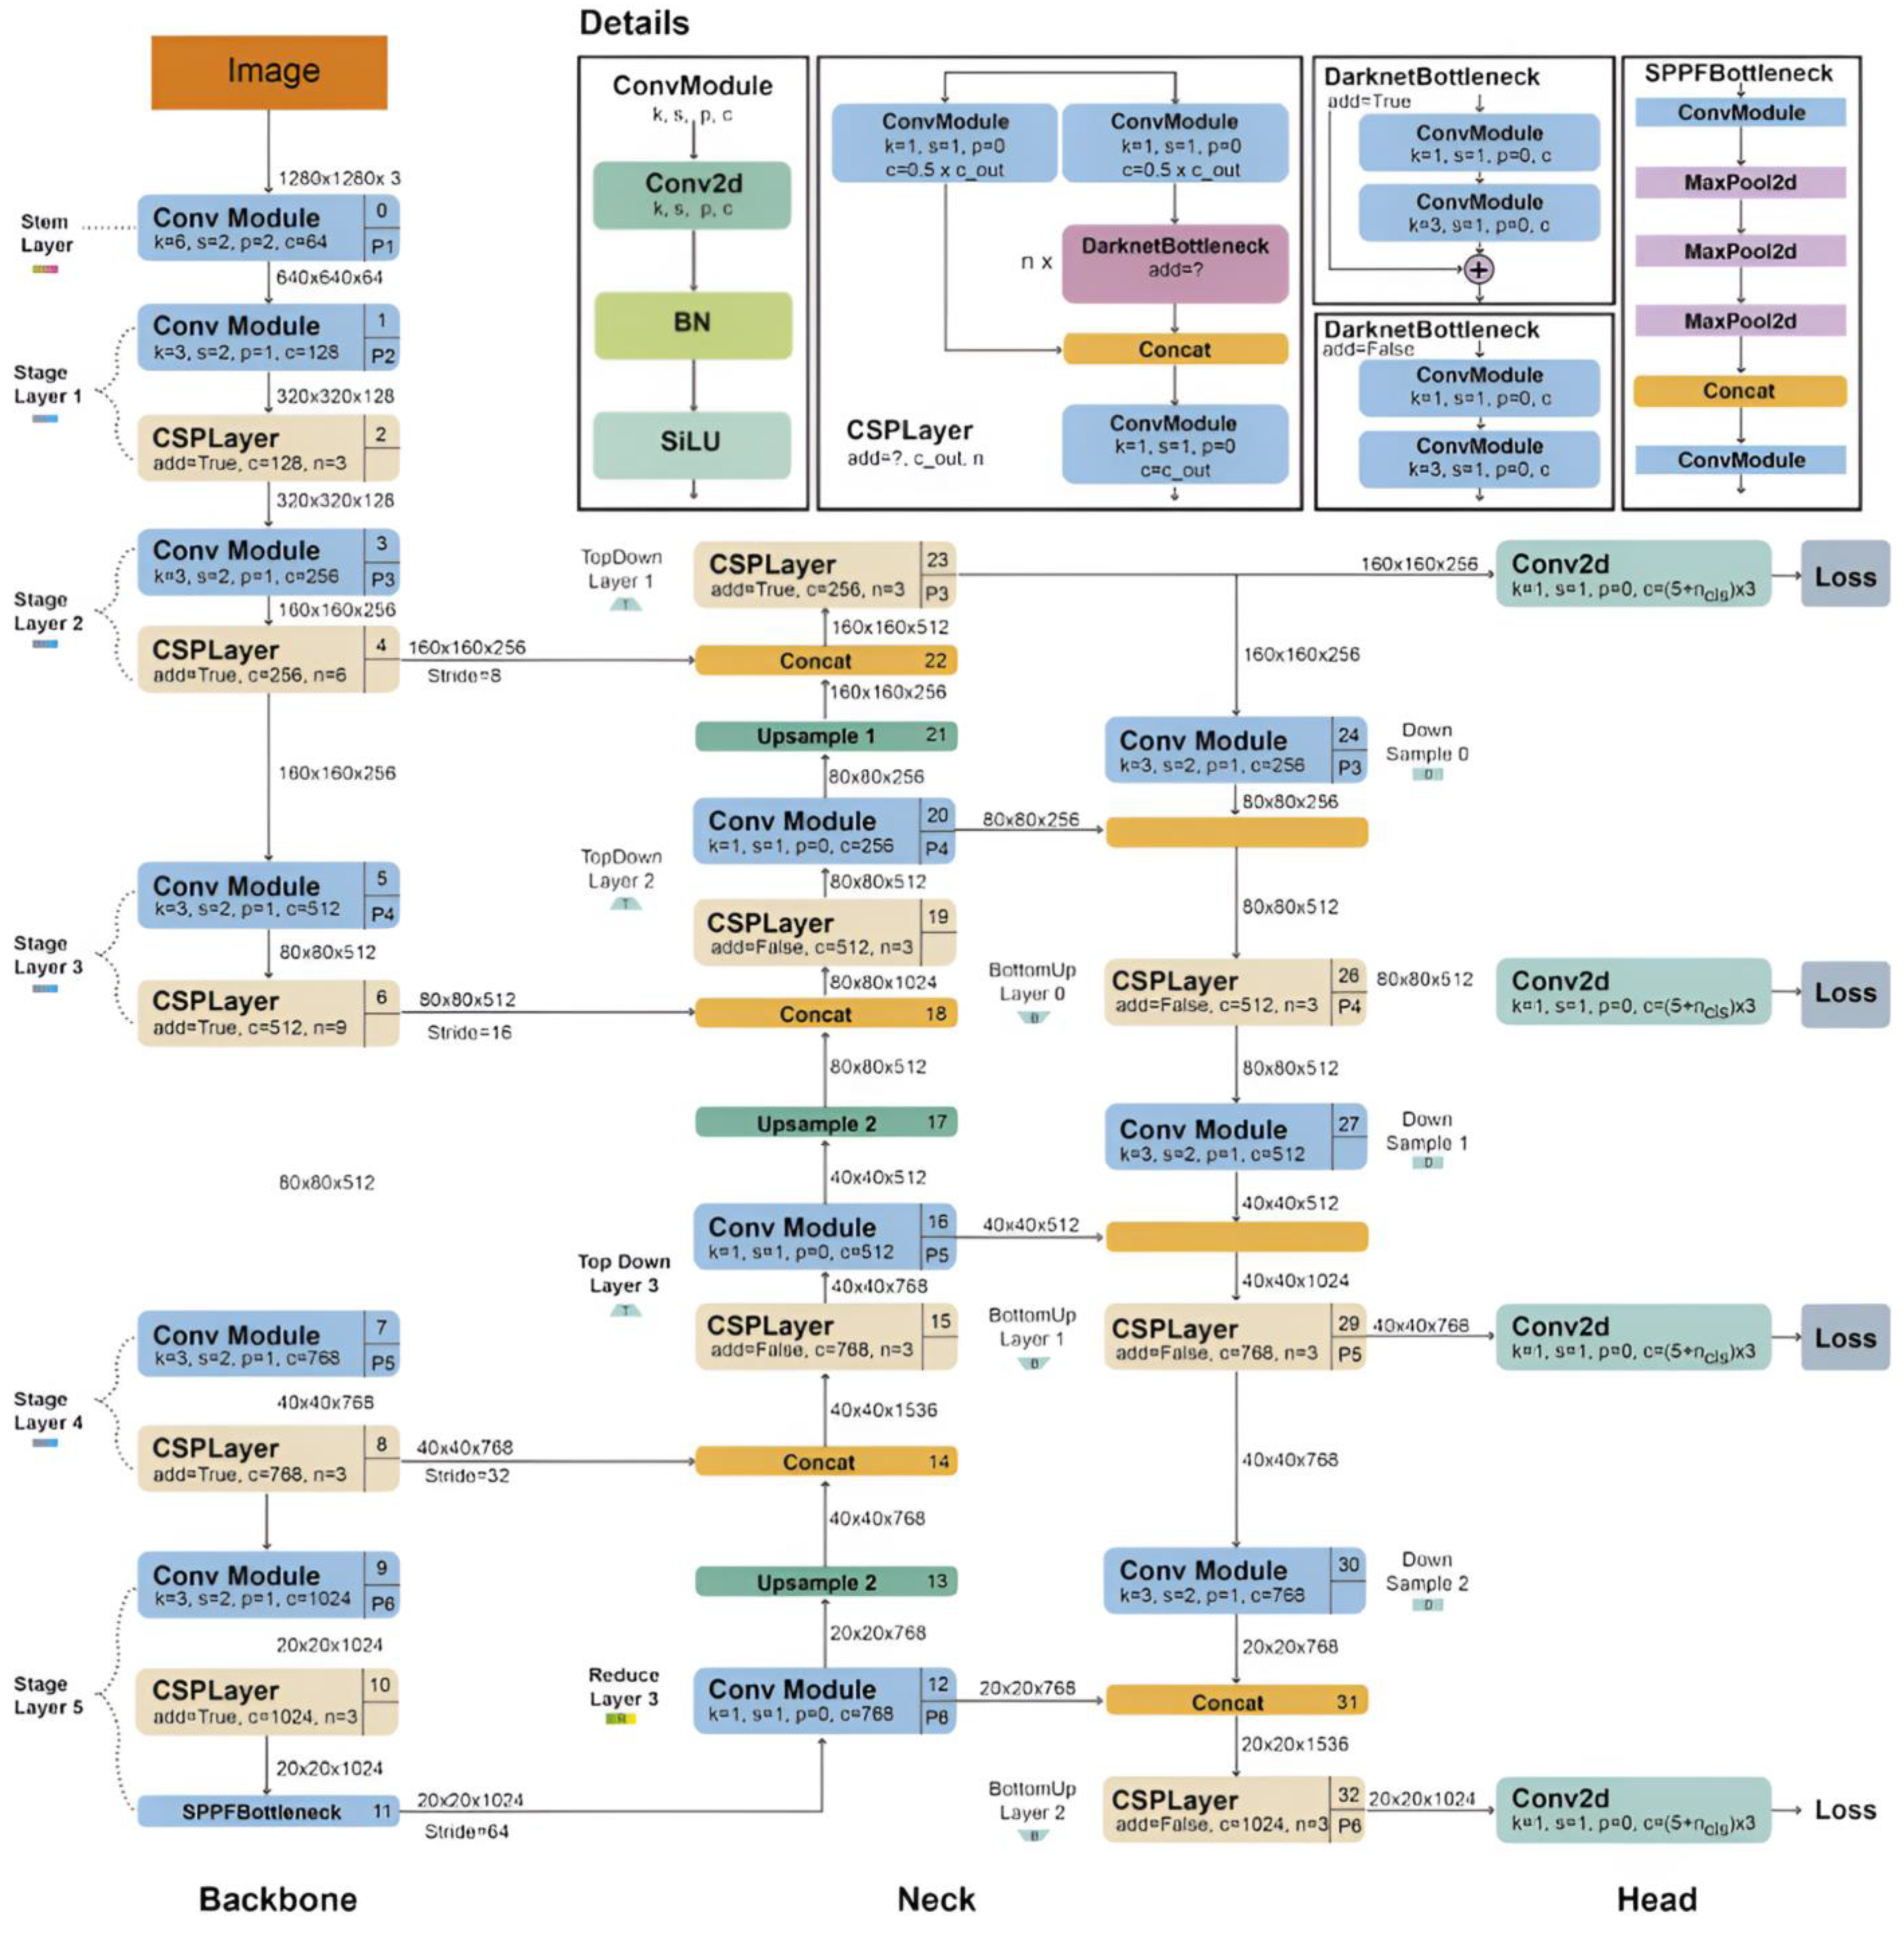
Figure 3 presents an illustration of the YOLOv6 architecture.
The model architecture is methodically organized into a series of stages, each building upon the preceding one to incrementally refine and enhance the feature representation of the input image. At the inception of the model, an input image with a resolution of 1280 × 1280 pixels is passed through a stem layer, which is a convolutional module designed to initiate the feature extraction process. This layer prepares the image for deeper processing within the network.
Progressing into the model, the architecture is delineated into multiple stages, each composed of various convolutional modules and CSP layers. Convolutional modules, characterized by specific kernel sizes, padding, and stride values, are responsible for detecting patterns and features at different spatial hierarchies of the input image. BN and the SiLU (Sigmoid Linear Unit) activation function are consistently applied after convolutional operations to stabilize the learning process and introduce nonlinearity.
The architecture further incorporates specialized bottleneck modules, namely DarknetBottleneck and SPPFBottleneck. These modules are designed to further condense and filter the feature maps, focusing the model’s attention on the most salient features. The DarknetBottleneck employs a residual structure, allowing gradients to flow more effectively during training, while the SPPFBottleneck leverages spatial pyramid pooling to capture contextual information at various scales.
As the processed features flow through the network’s backbone, they are advanced into the Neck, which is composed of additional convolutional modules and CSP layers. The culminating section of the model, the Head, is tasked with the critical role of generating predictions. It processes the aggregated feature maps and applies convolutional layers to predict object bounding boxes, class probabilities, and confidence scores across various scales, resulting in precise localization and identification of objects within the image.
Each stage of the architecture is intricately linked to the next, ensuring that the feature representation becomes increasingly refined. The model outputs a set of predictions, which are compared against the ground truth during training using loss functions, guiding the network to minimize errors and improve detection performance.
In this research, YOLOv6 is selected as one of algorithms for detecting PPE objects within a university laboratory setting. The selection of YOLOv6 is attributed to its notable advantages, including improved processing speed and object detection accuracy when compared to its predecessors, ranging from YOLOv1 to YOLOv5 [
25]. Similar to the previous method, the transfer learning approach is chosen for training the YOLOv6 model.
3.4. Evaluation Metrics
The test results are analyzed and interpreted to assess the performance of all CNN models, addressing the research questions and objectives defined in advance. The analysis involves comparing the outcomes of the three algorithms using predefined evaluation metrics. These evaluation metrics are utilized to assess and analyze the model’s performance and include precision, recall, F1 score, accuracy, Average Precision (AP), and mean Average Precision (mAP). Additionally, for the training results, an analysis is conducted based on the loss curve to gauge the accuracy of the object detection, taking into consideration the components of loss, which comprise box loss (loss related to bounding boxes), object loss (loss related to object detection), and class loss (loss related to class prediction). The detailed criteria for performance evaluation of the three models both in training and in the testing process are shown in
Table 1.
5. Experiment and Result
After the datasets for training and validation, both with single or multiple individuals in the images, had been formed, the next step was to use the training dataset to build the models and then observe the architecture performance based on the validation dataset. Three models are generated based on YOLOv4, YOLOv5, and YOLOv6. Afterward, the performance of the models is evaluated based on obtained precision, recall, and mAP. Further, the model performance in detecting each PPE objects is assessed by evaluating the confusion matrix.
5.1. Results of YOLOv4
Three models are developed using YOLOv4, with the number of epochs set to 50, 75, and 100. Training processes are executed using the hyperparameter values described in
Section 4. The computation times are longer with the increase in the number of epochs. The training process for the YOLOv4 detection models took 285 min for the 50 epochs model, 337 min for the 75 epochs model, and 450 min for the 100 epochs model. However, the increase in the number of epochs also allows the model to learn more on the pattern of the datasets, as indicated by the increase in evaluation metrics; albeit, the increase is not significant.
Table 5 presents the value of the evaluation metrics both for all classes and in each of the testing datasets for the YOLOv4 models.
The results indicate that the YOLOv4 models undergo underfitting during the training process since the evaluation metric values are relatively low. The results also indicate that there is a significant gap in the obtained evaluation metrics values for each class. This occurrence is influenced by significant differences in the number of objects within each class. For example, the average precision in the masks correct class is significantly higher than the earmuff correct class since the masks correct class has a significantly higher number of annotated objects (2166 annotation), while the earmuff correct class has 205 annotations. Similar results were also observed for recall and F1 score values, in which the class with the higher number of annotated objects has relatively higher metric values.
The results presented in the table indicate that among the three types of epochs used in the YOLOv4 model, the highest F1 score is achieved for the epoch 100 model. The selection of the best model is based on the F1 score because it encapsulates both precision and recall values. Additionally, the mAP, which serves as a quality measure for an object detection system by considering precision at various threshold levels for different objects, attains its highest value for the epoch 100 model. This suggests that among the three epoch models, the 100 epochs model exhibits the best performance in detecting PPE objects among the YOLOv4 models.
5.2. Results for YOLOv5
The training processes for the YOLOv5 models took significantly lower computation time than the YOLOv4 models, albeit with the same number of epochs. The training process for the YOLOv5 detection models took 78 min, 120 min, and 155 min for the YOLOv5 models with the number of epochs set to 50, 75, and 100 epochs, respectively.
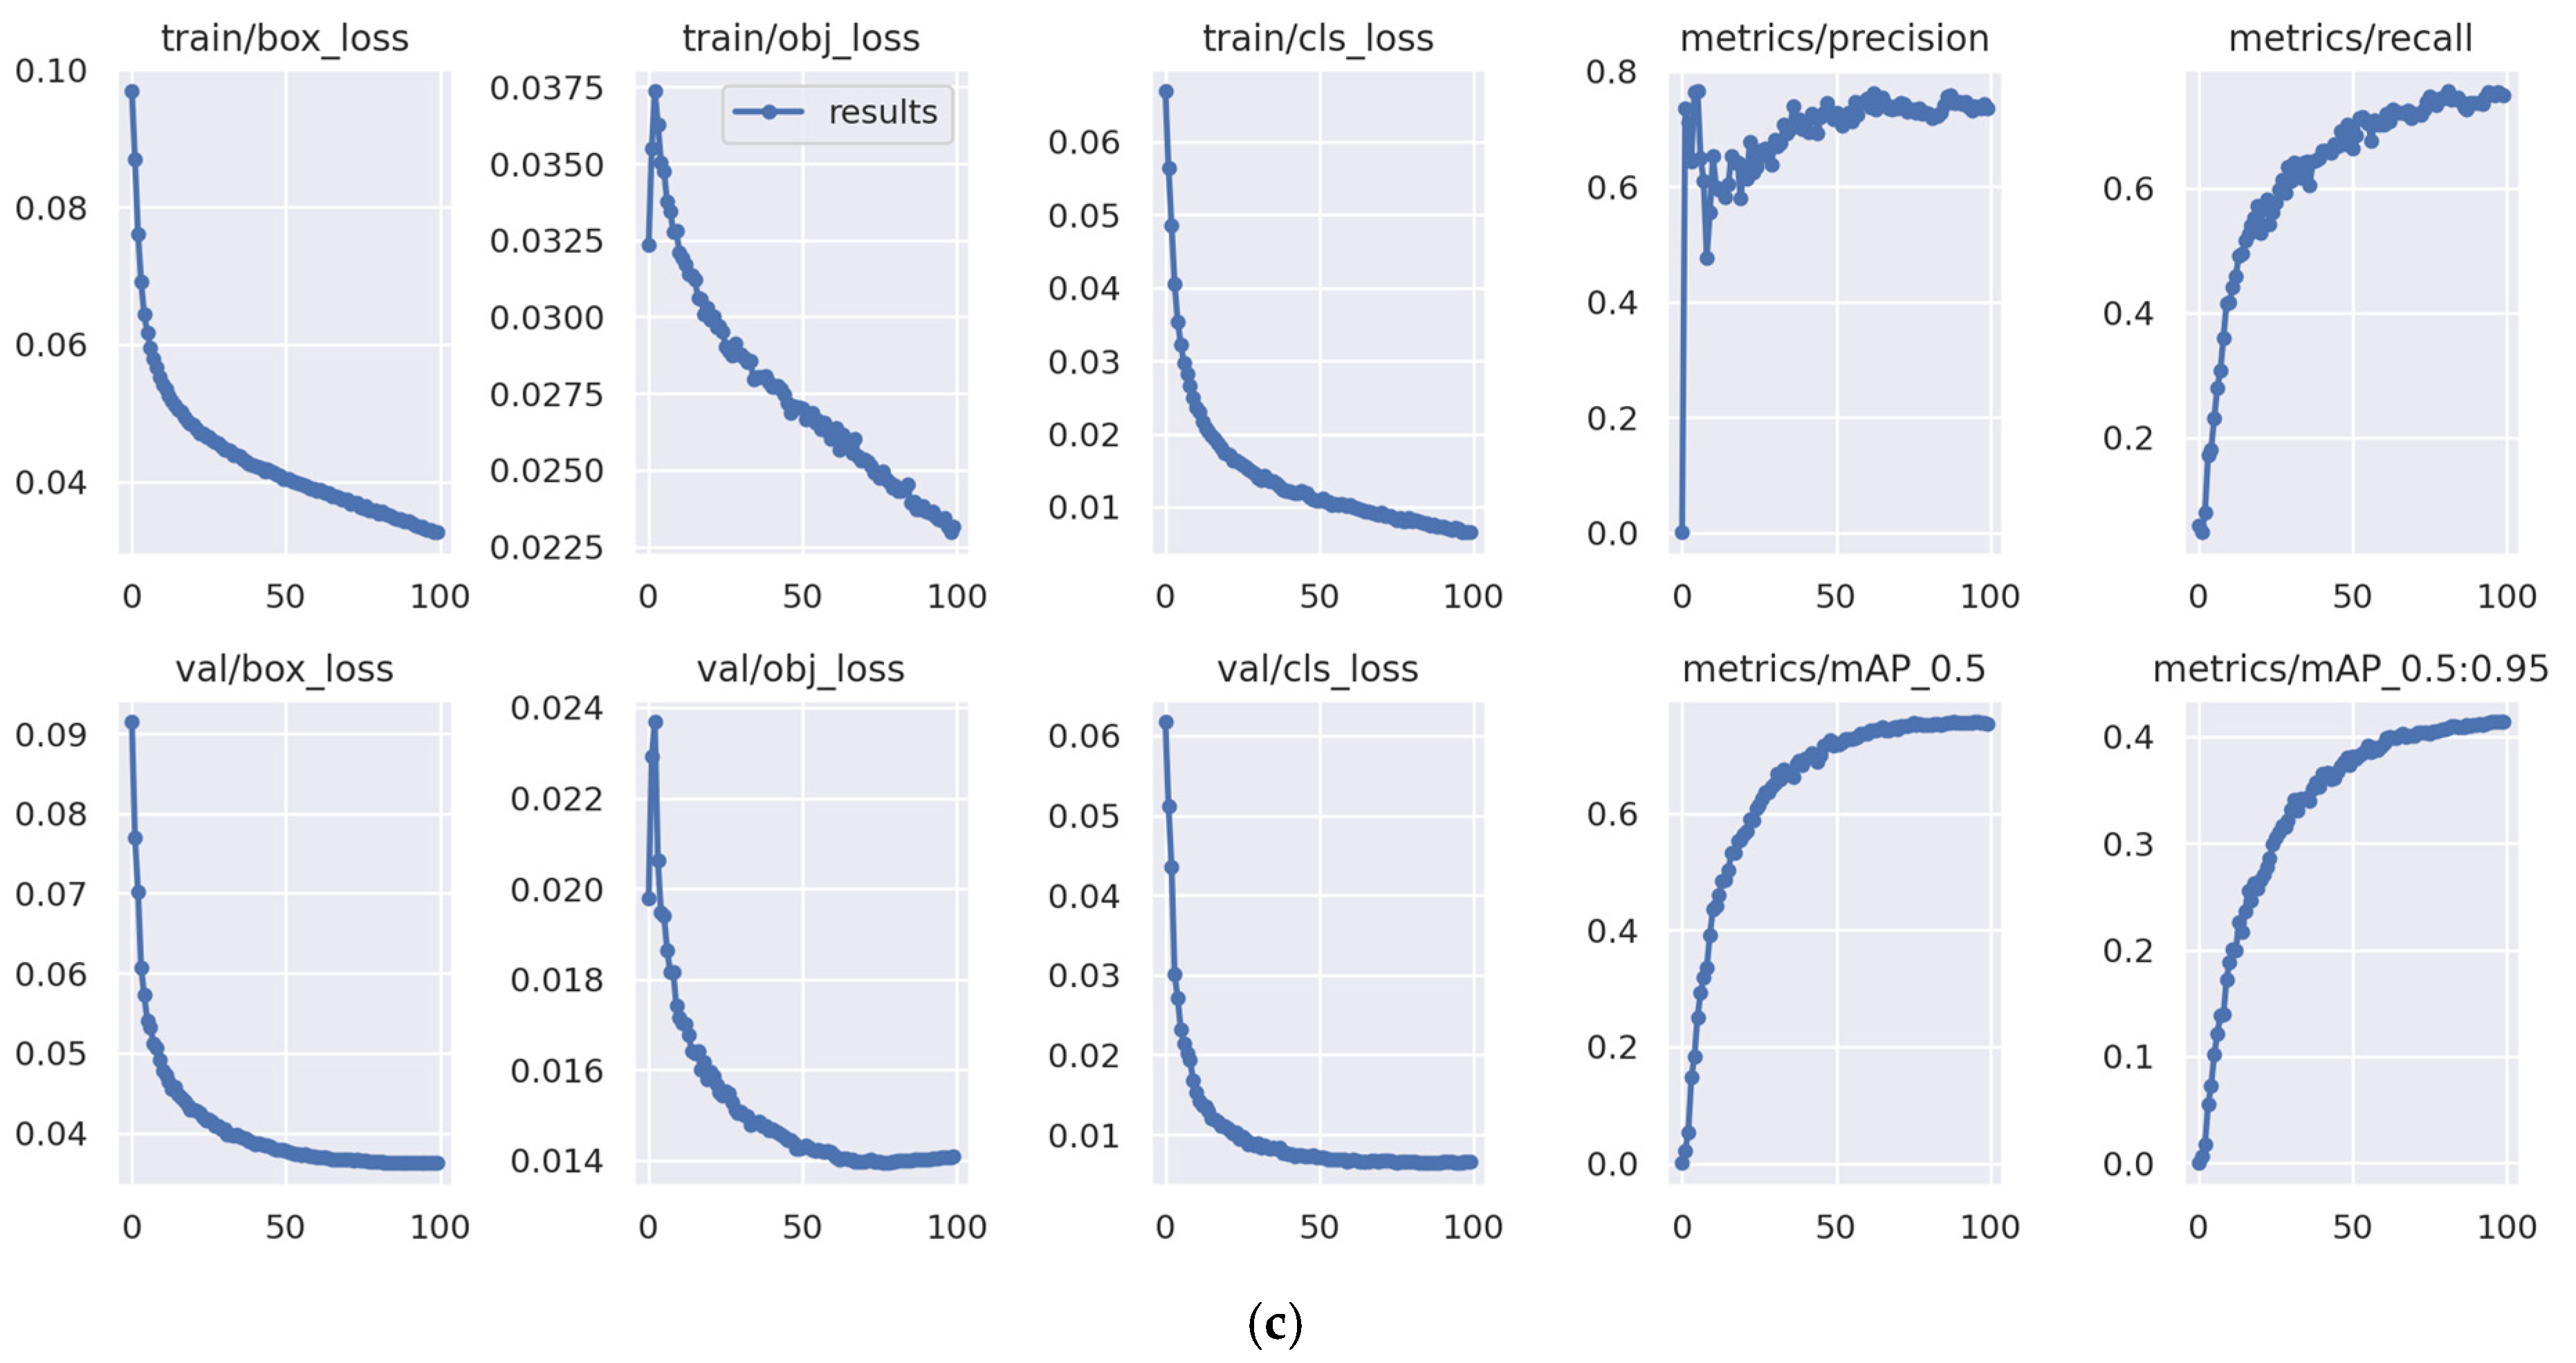
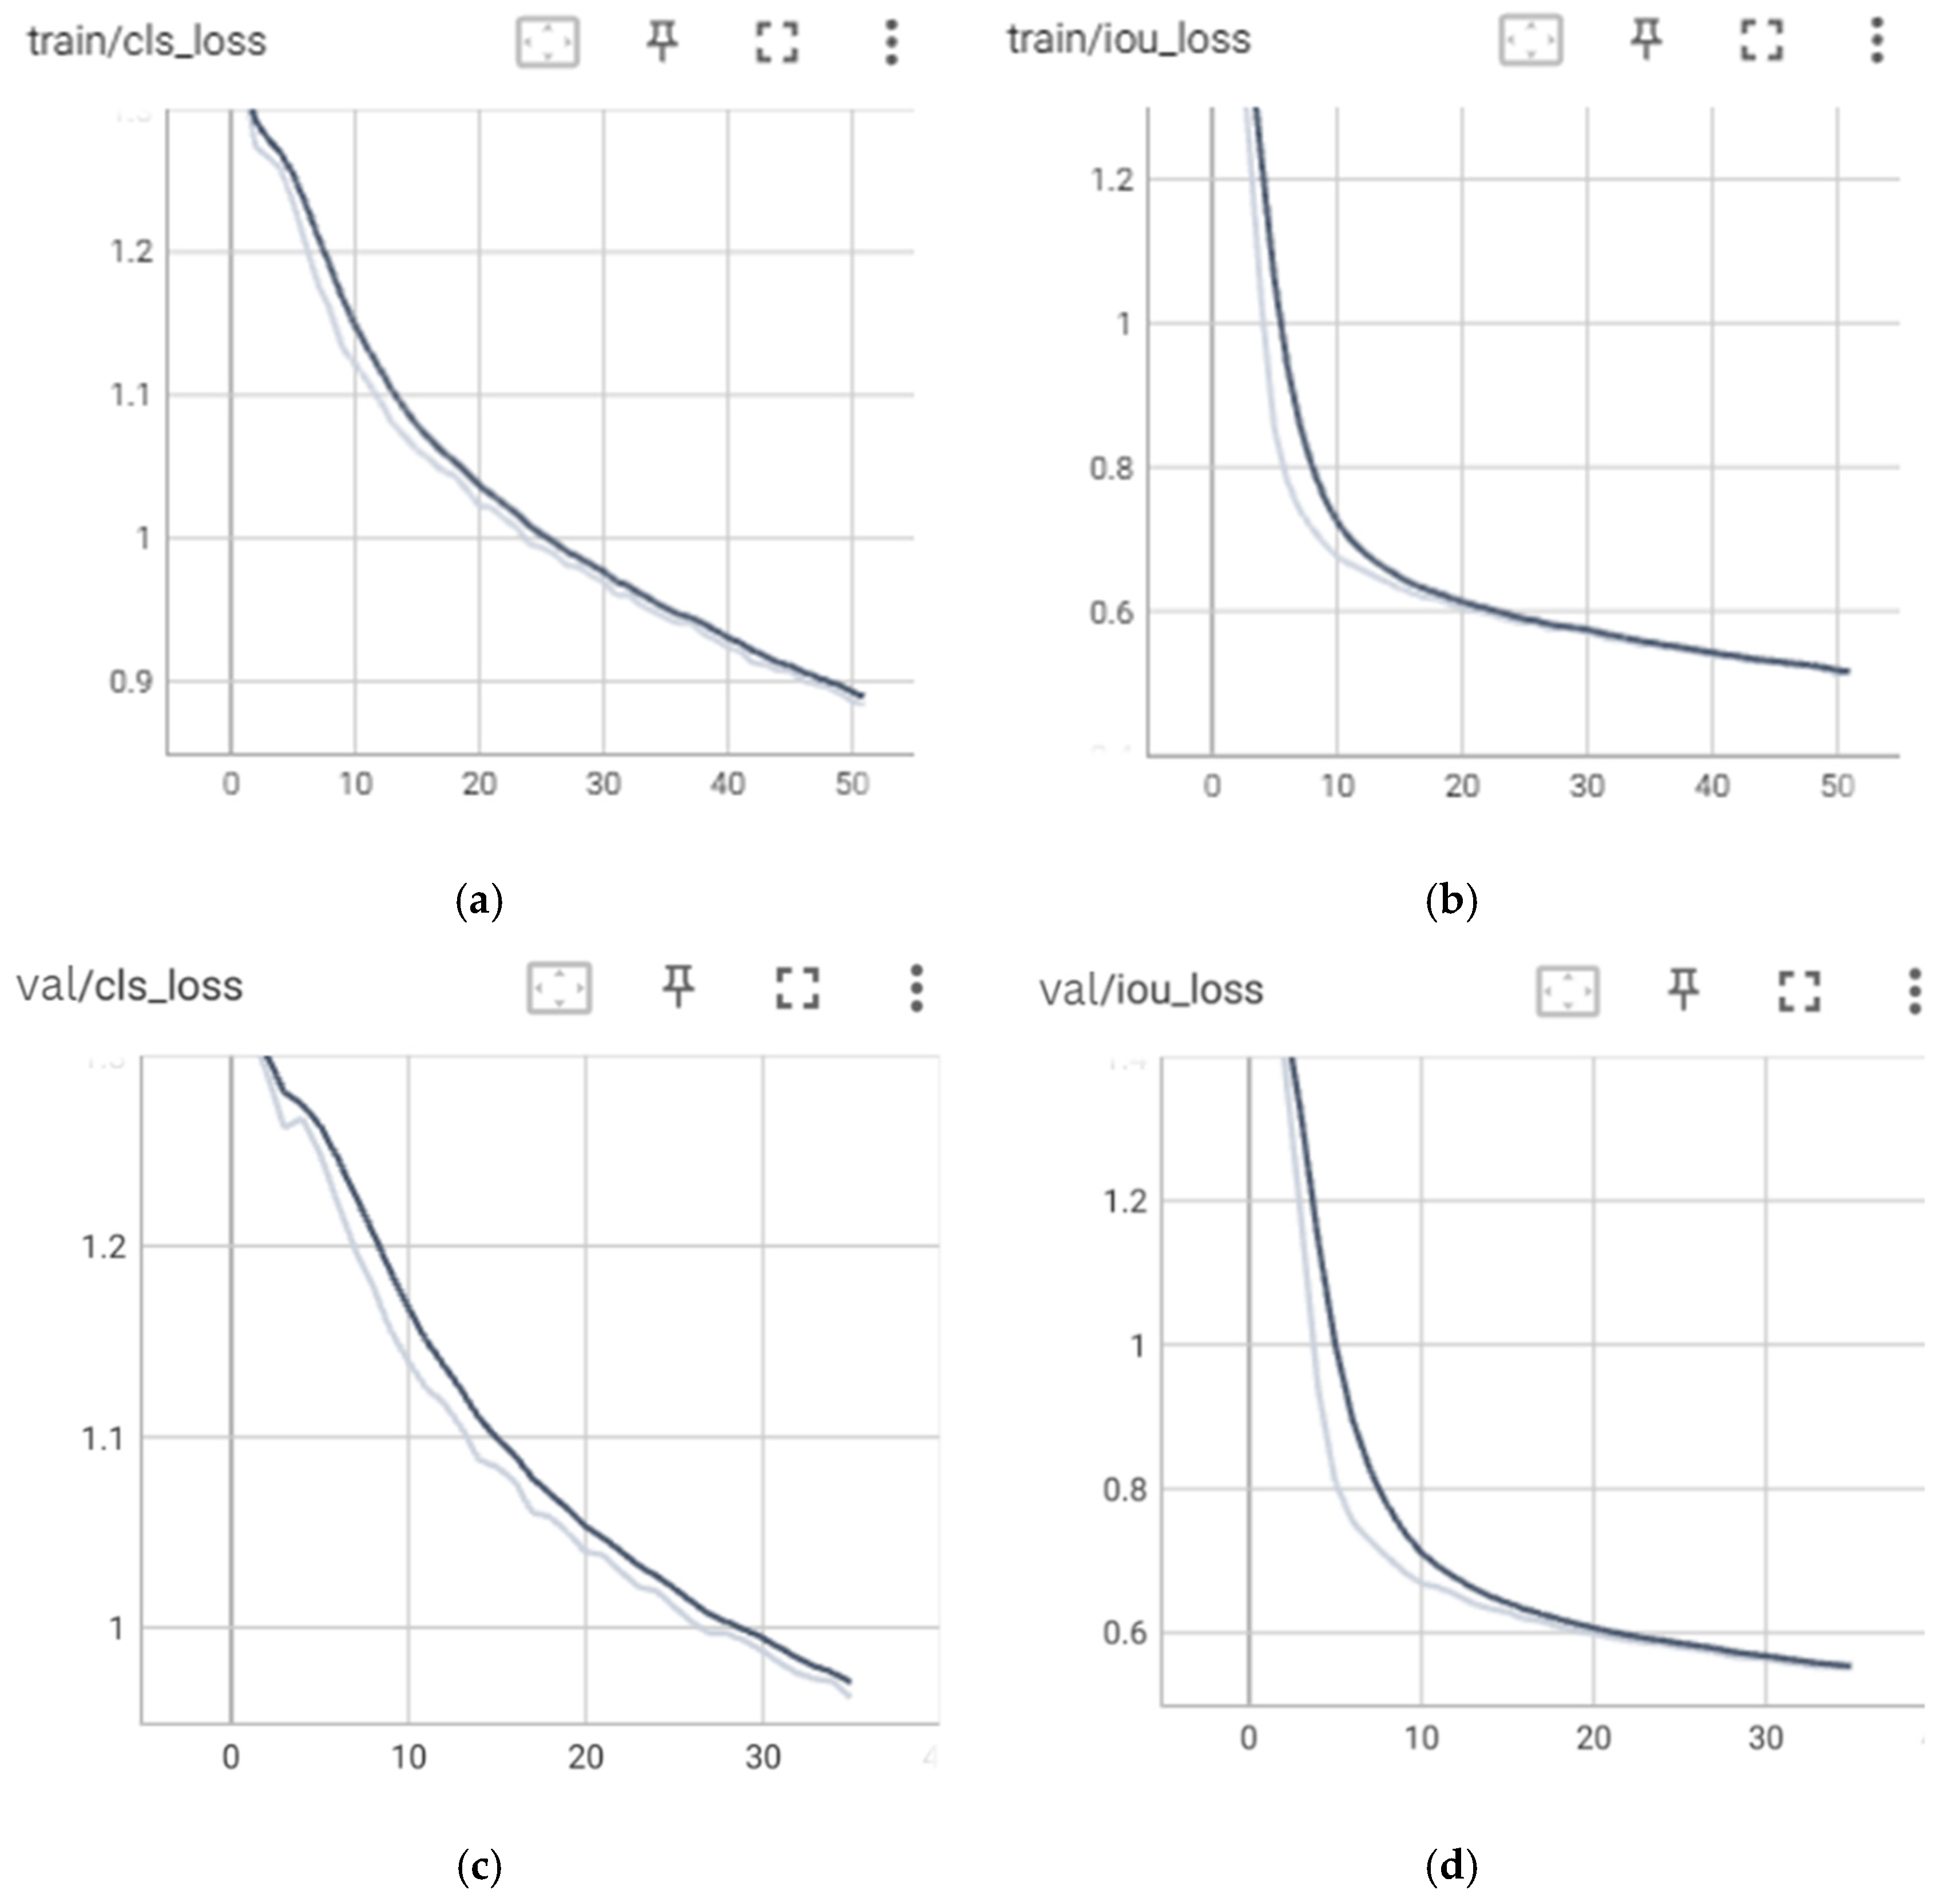
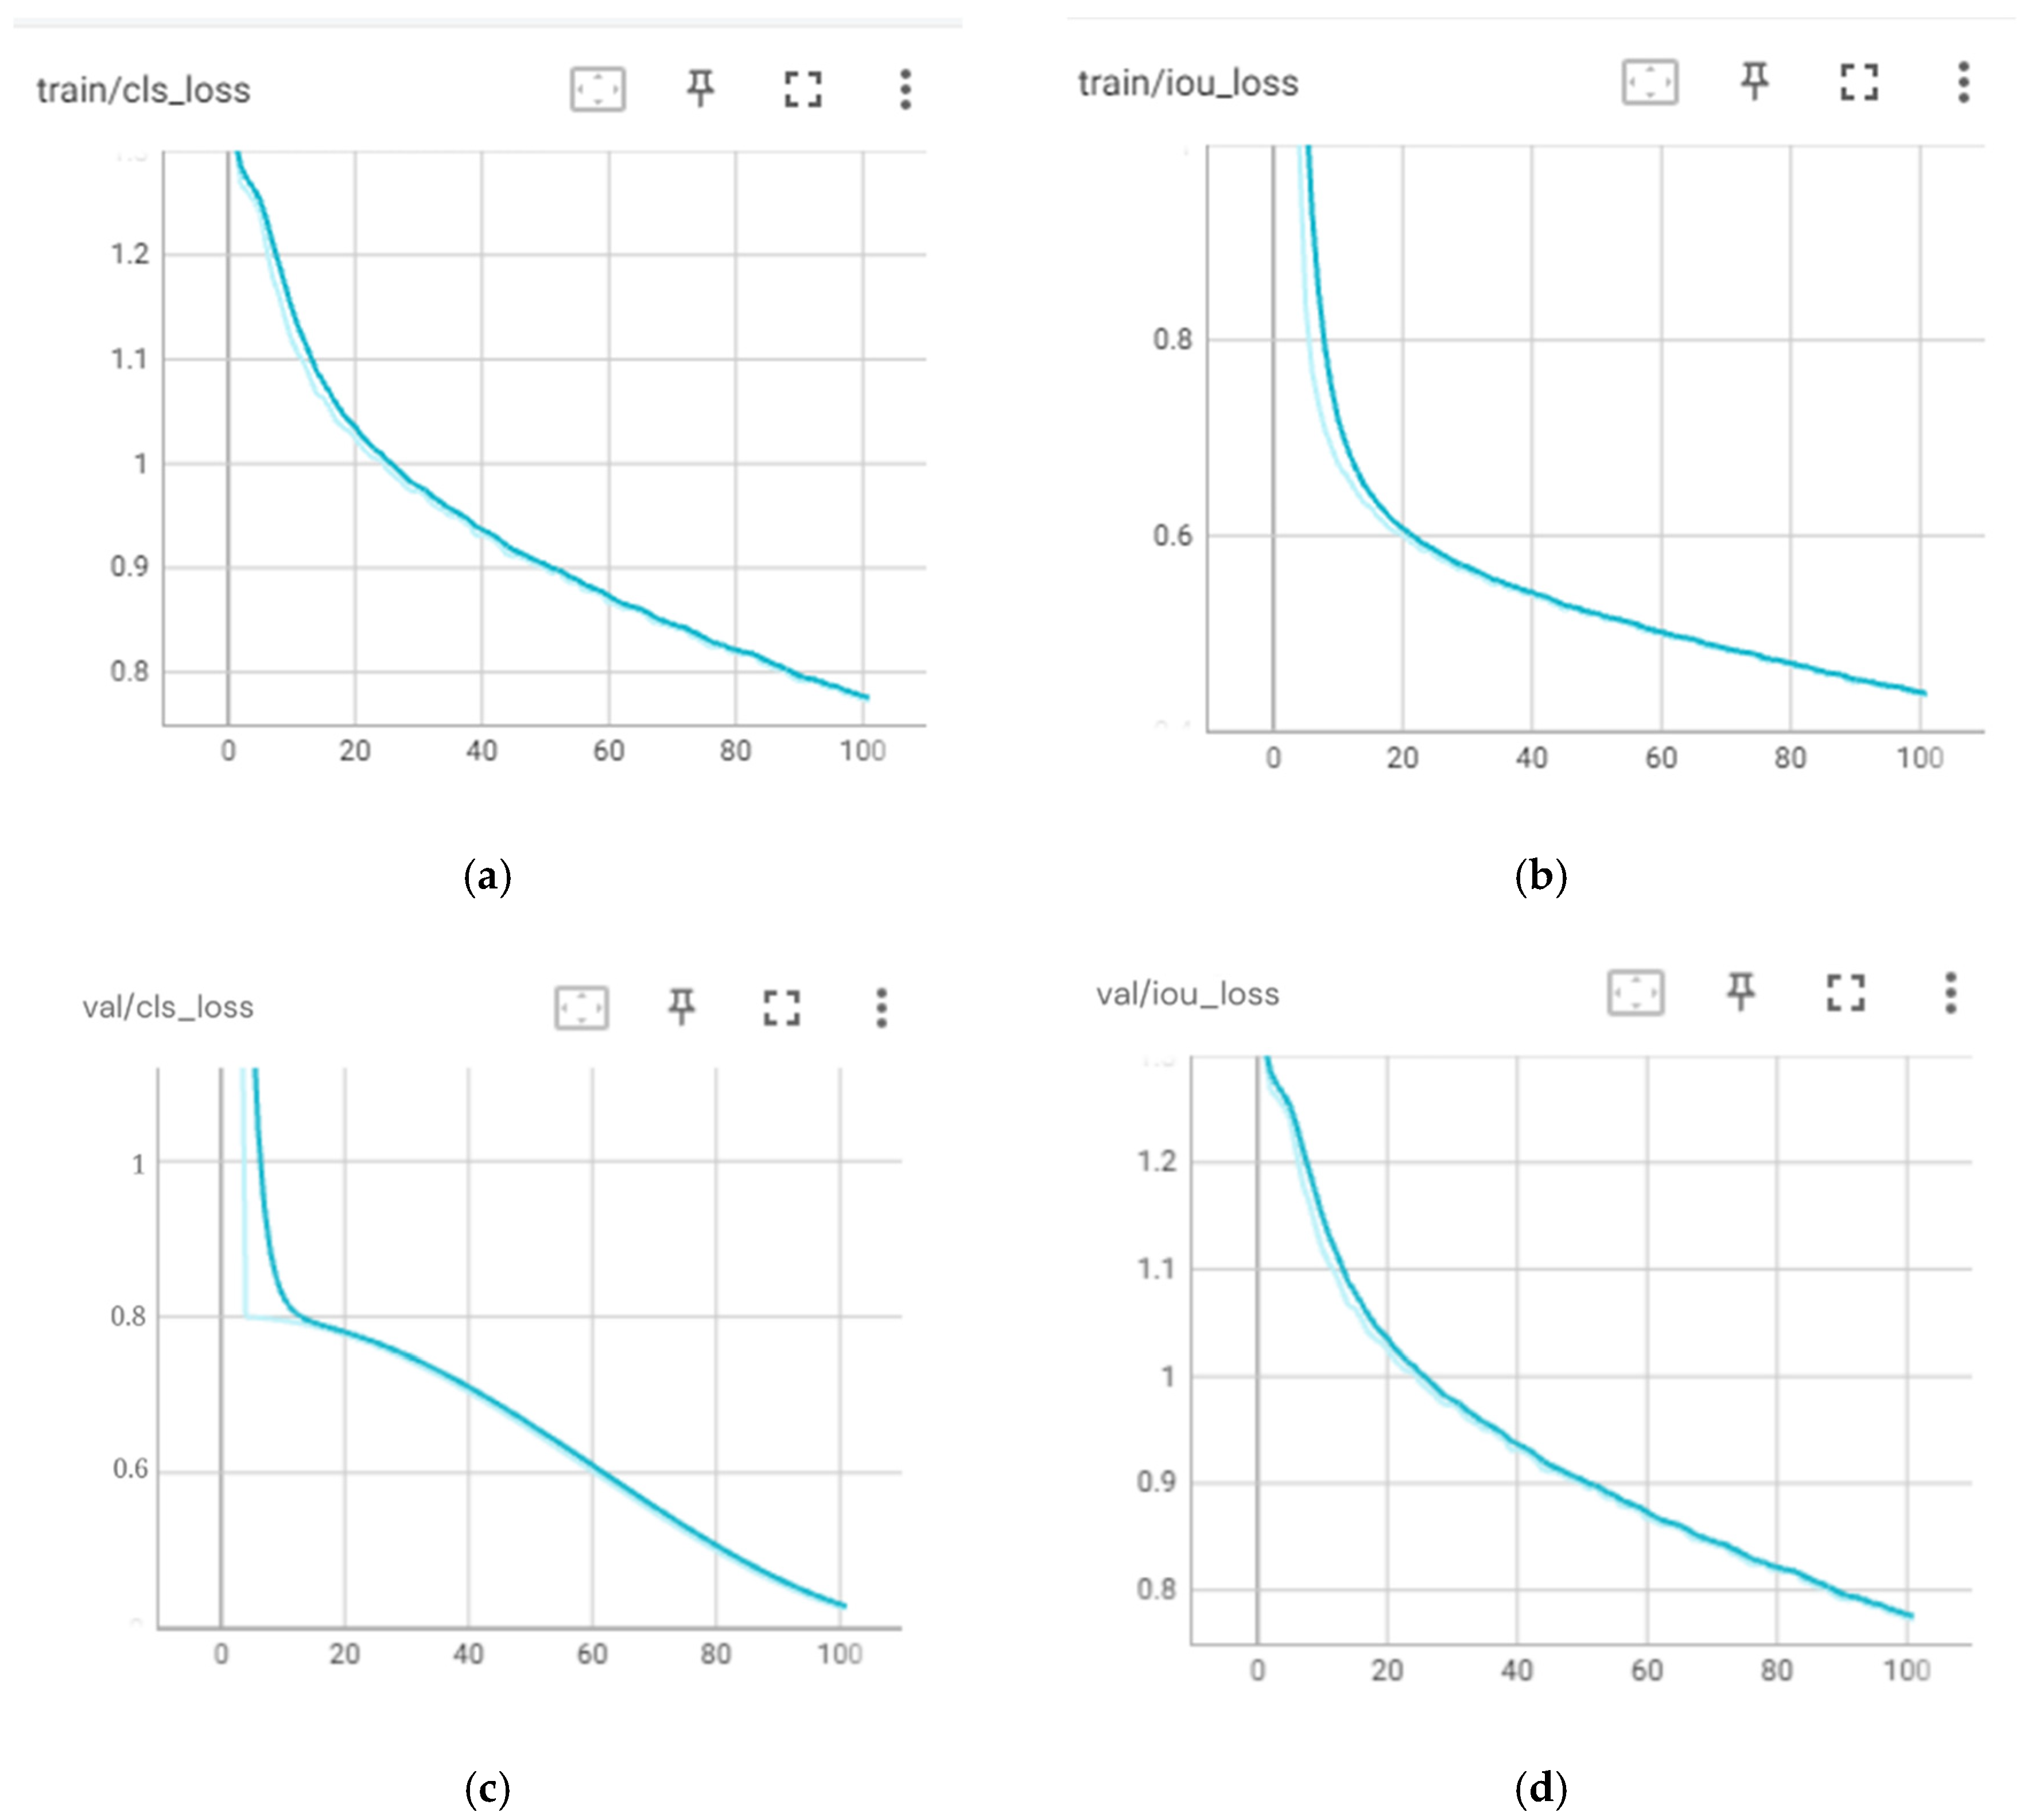
Figure 12 presents the loss curves for the YOLOv5 models obtained during the training process.
The curves in
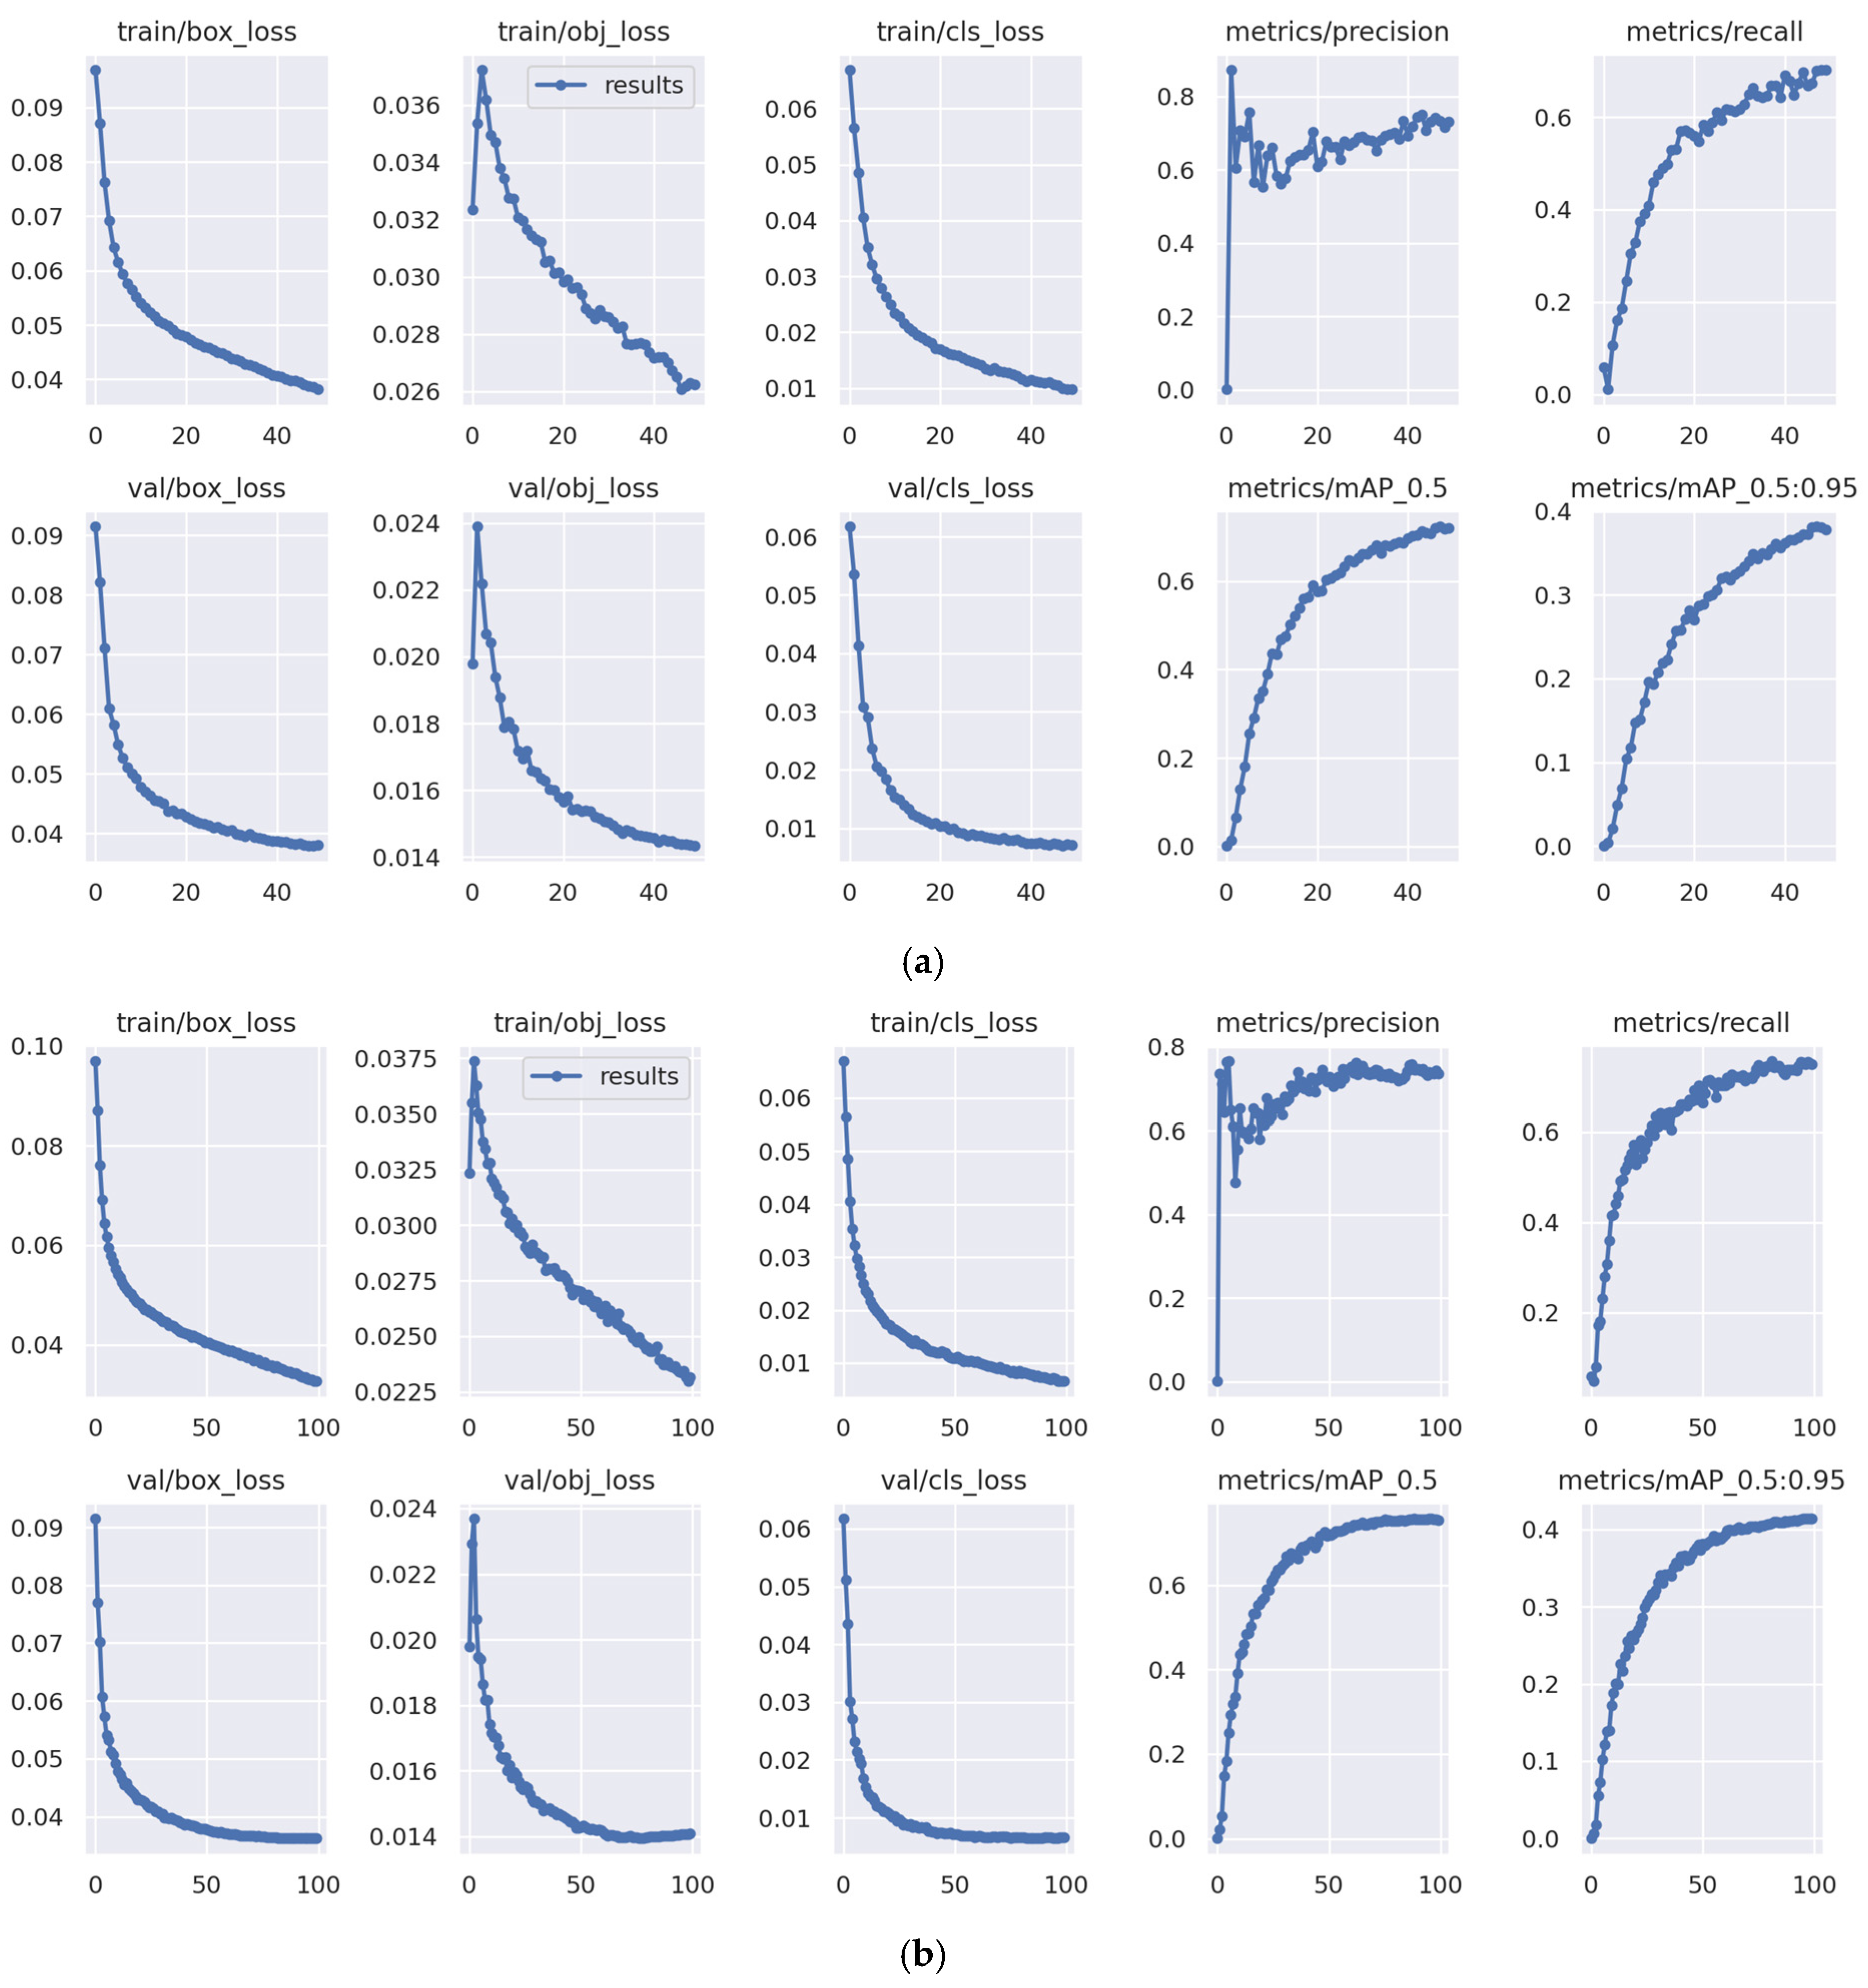
Figure 12 illustrate the changes in the loss function values during the training and validation phases of the model. The loss function serves as a metric for assessing how accurately the model makes predictions. The primary goal during model training is to optimize the loss function so that the model can make increasingly accurate predictions over time. Ideally, the loss values on the curve will decrease as training progresses, indicating that the model is improving its understanding of patterns in the data.
Referring to
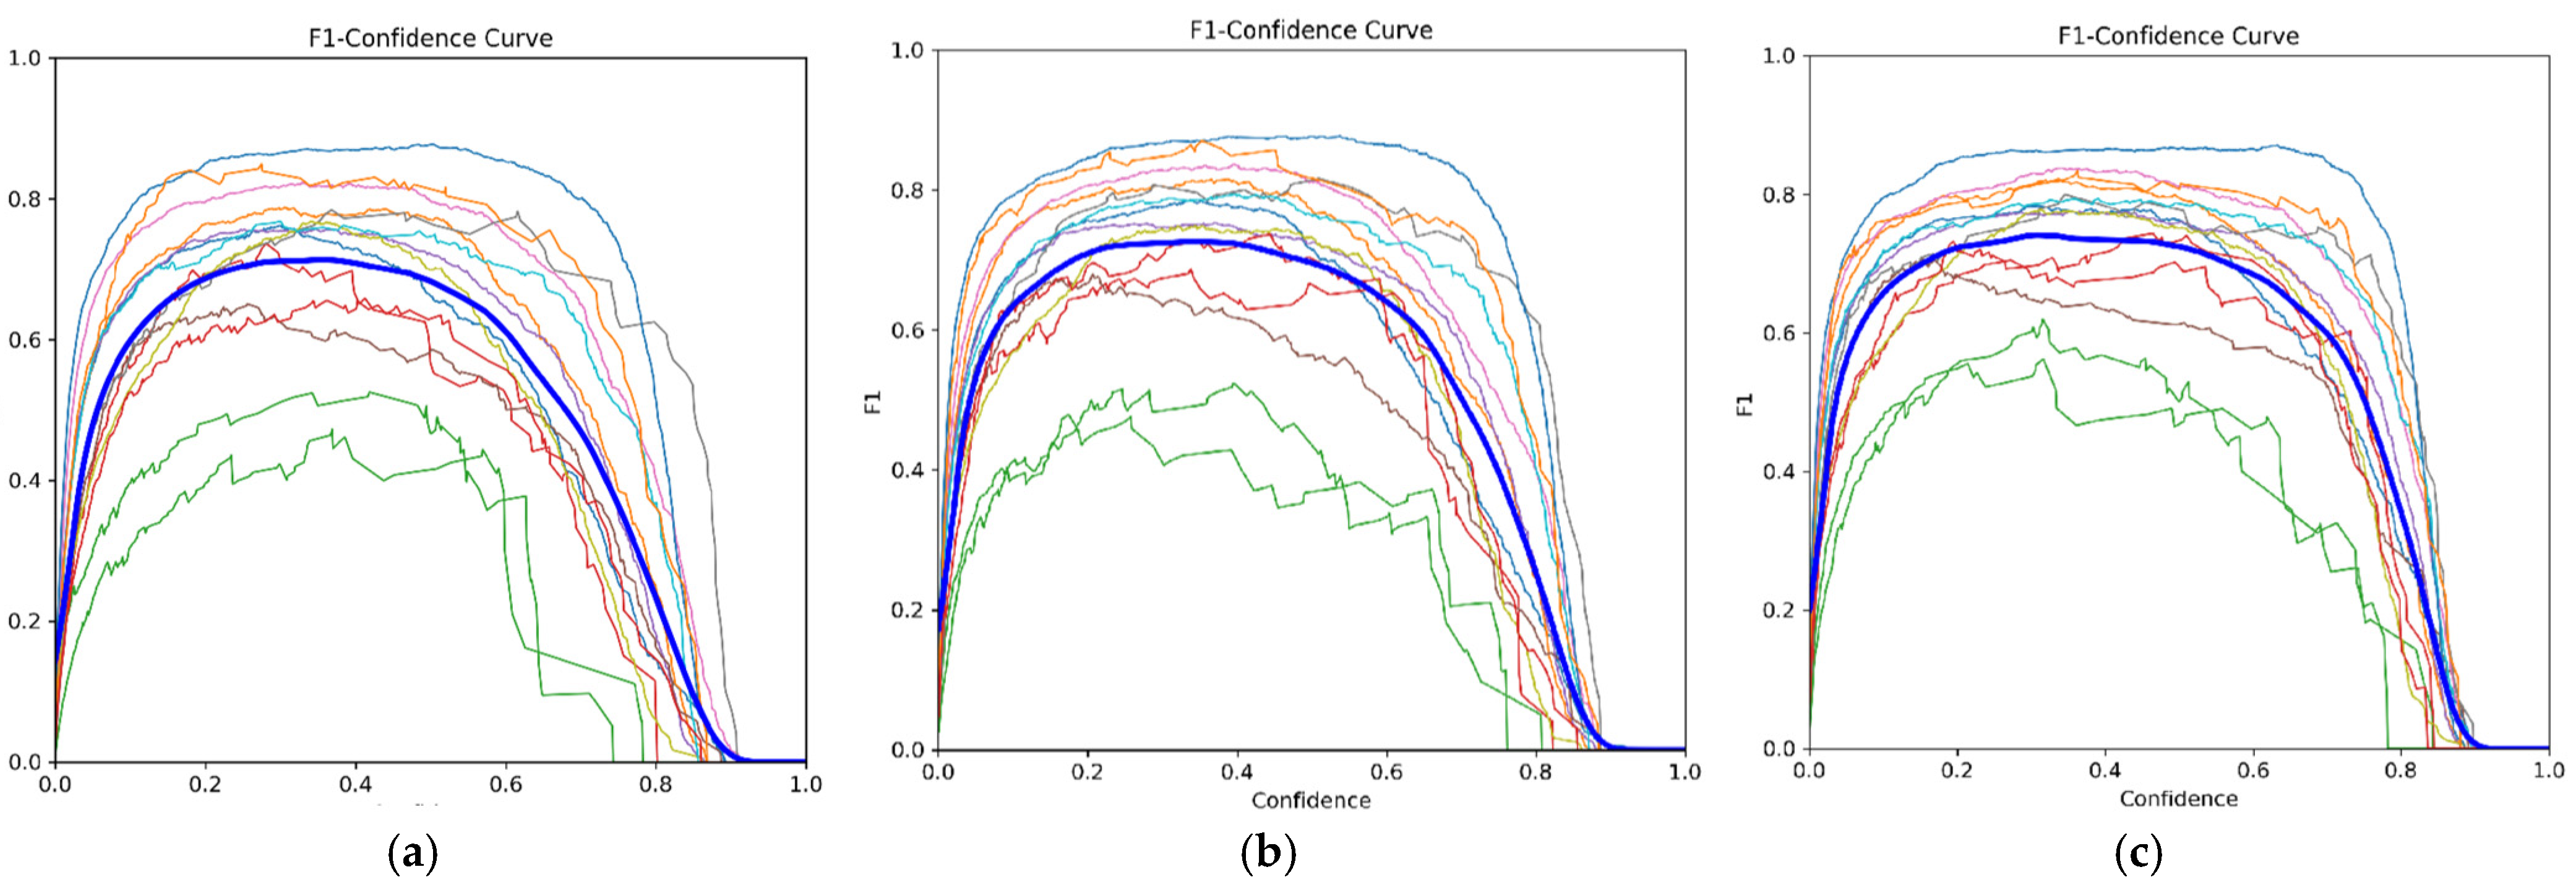
Figure 12, we can observe that the curves for box loss, object loss, and class loss on both training and validation exhibit a decreasing trend in all models. This signifies that the models are getting better at predicting box locations, recognizing objects within the image grid more precisely, and classifying objects into their correct categories. This also indicates progress in the models’ comprehension of the structure and characteristics of objects in the images. In the 75 and 100 epochs models, there is a consistent positive trend in the training and validation data, without significant fluctuations in the validation data, thus indicating that there was no overfitting. However, in the 50 epochs model, it can be observed that the decreasing trend is terminated before reaching convergence both in training and validation loss, which implies that the training process of the model might be underfitting. This finding is also confirmed by the curves of the metric values, in which the 50 epochs model generally obtained lower precision, recall, and mAP at the end of the training process than the 75 and 100 epochs models. Further analysis is performed by evaluating the F1–confidence, precision–confidence, and precision–recall curves which are presented in
Figure 13,
Figure 14 and
Figure 15.
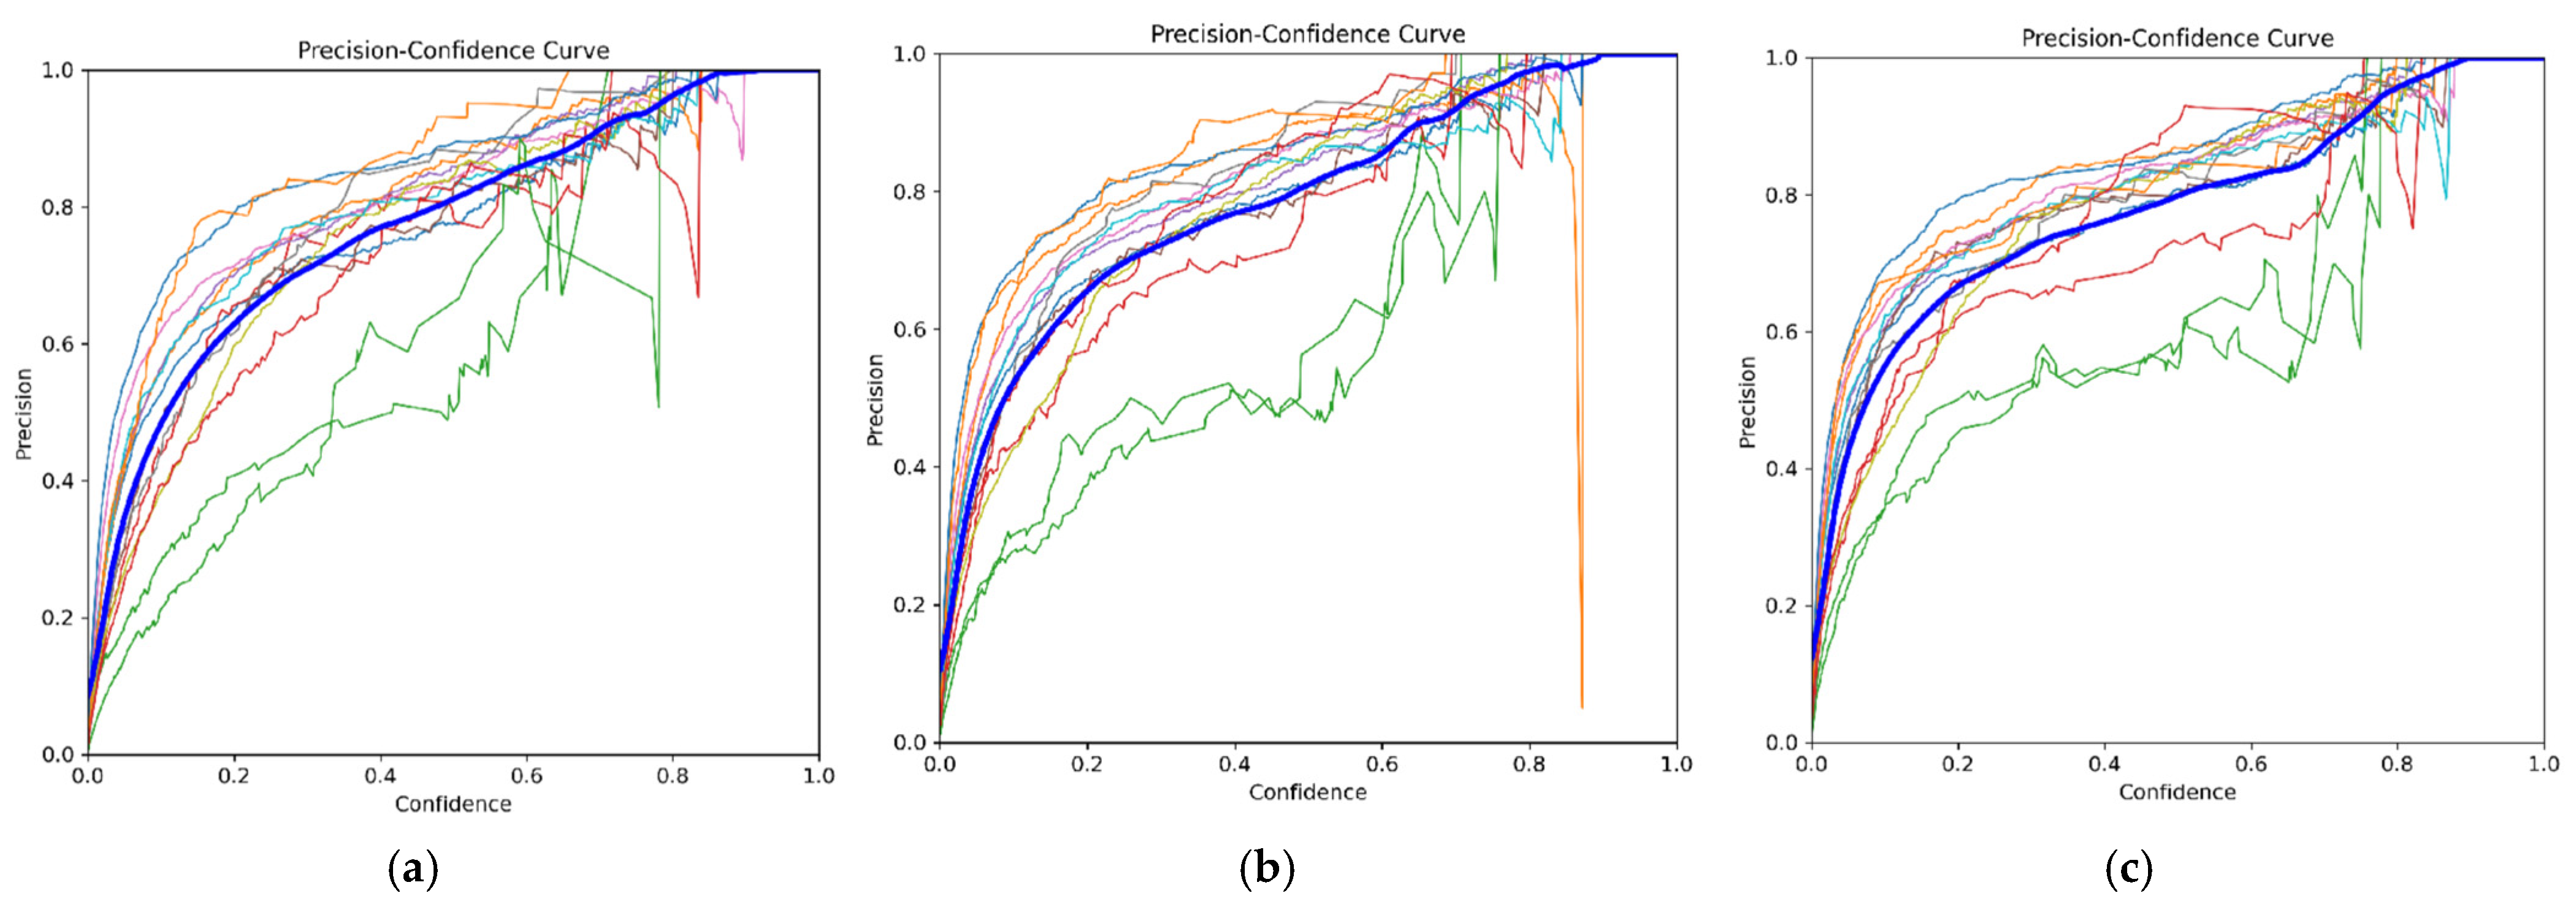
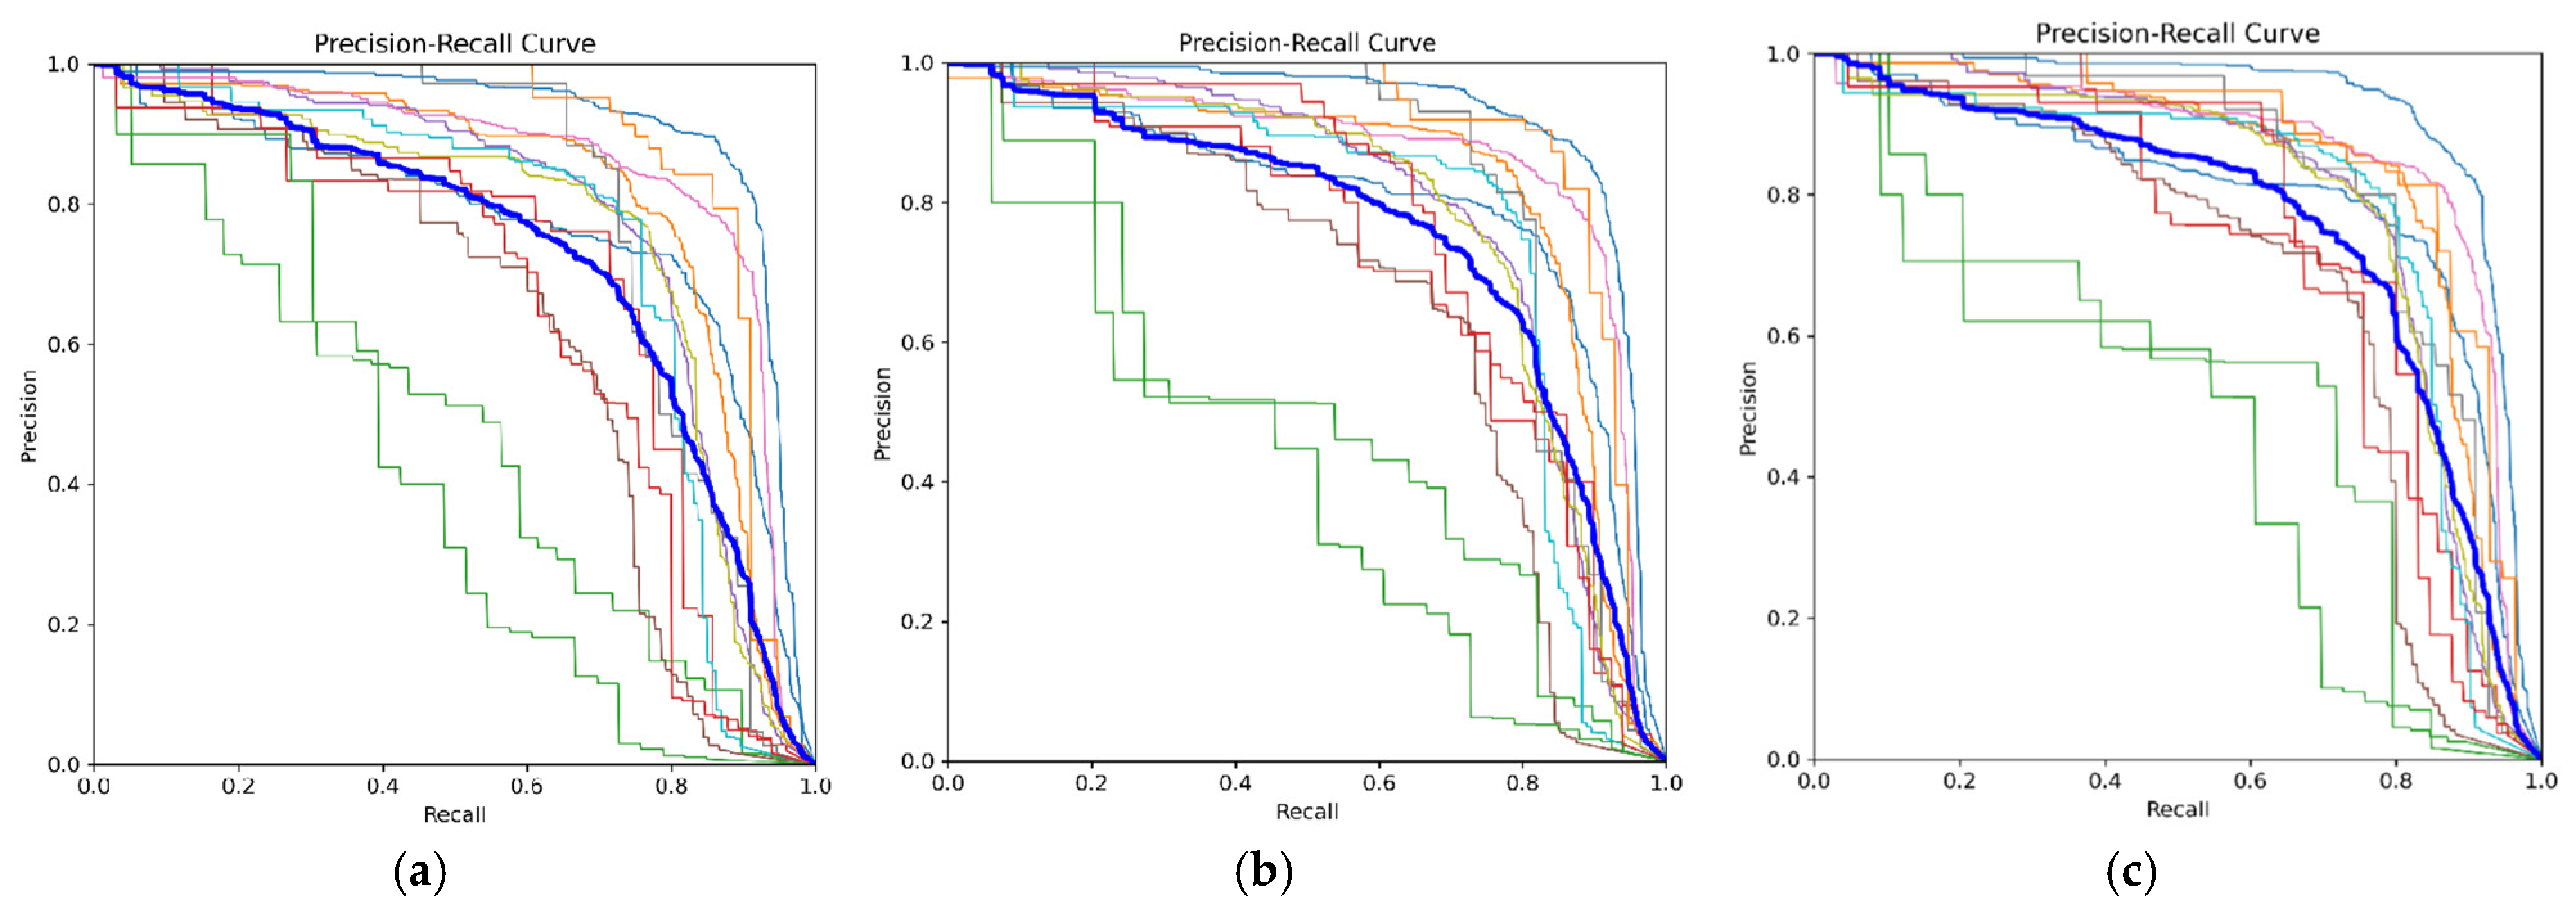
In
Figure 13,
Figure 14 and
Figure 15, the color of each curve represents each PPE classes, providing a visualization of their respective values. Meanwhile, the dark blue curve symbolizes the data for all PPE classes.
Figure 13 illustrates that a higher F1 score indicates superior model performance in PPE detection across a broad range.
Figure 14 suggests that a higher position of the curve correlates with increased model accuracy in PPE prediction. Meanwhile,
Figure 15 demonstrates the precision–recall relationship; the closer a curve is to the top edge, the better the balance between precision and recall, indicating optimal model performance.
The F1–confidence curve provides an insight into how well the model can make accurate predictions for the positive class while considering its ability to identify most of the positive objects present. For example, for the 50 epochs model, it is noted that the peak F1 score is 0.71 for all classes at a confidence level of 0.354. This implies that at this specific point on the curve, the classification model performs quite well, which means that the model is proficient at classifying positive and negative instances, achieving a balanced precision and recall. The peak F1 score obtained with the 75 epochs model is 0.73 at the same confidence level. While the 100 epochs model yields a peak F1 score of 0.74 at a confidence level of 0.31. Hence, indicating that, in general, both models performed better than the 50 epochs model.
In
Figure 14, the precision–confidence curve for the YOLOv5 50 epochs model yields a result in which all classes have a precision value of 1.00 at a confidence level of 0.924. This outcome indicates that, based on the precision–confidence curve, all classes exhibit a precision of 1.00 (100%) at a confidence level of 0.924. This means that at this point on the curve, the classification model demonstrates exceptionally high precision performance, meaning that every time the model makes a positive prediction at a confidence level of 0.924, it is always correct (no false positives). Meanwhile, for the 75 epoch models, 100% precision is obtained at a confidence level of 0.898, while in the 100 epochs model 100% precision is obtained at a confidence level of 0.904. As such, in this aspect, the 75 epochs model is favorable since it can obtain high precision at a lower confidence level. This underscores that the model can return completely correct predictions with a relatively lower value of confidence.
The results for the precision–recall curves also strengthen the claim that the 75 and 100 epochs models generally are more favorable since they score higher in mAP, with values of 0.749 and 0.757, respectively, at a threshold of 0.5, as compared to the 50 epochs model with a mAP value of 0.724 at a threshold of 0.5. In addition, an analysis is also performed for evaluating the ability of the models to predict each class, which is depicted in
Table 6.
The results indicated in
Figure 13,
Figure 14 and
Figure 15 show that there are some classes that have significantly lower metric values than all other classes with respect to prediction (highlighted with a green line), which are also confirmed by the result of validation shown in
Table 6. Those classes are safety shoes correct utilization and earmuffs correct utilization. The same finding is observed in all YOLOv5 models (and also YOLOv4 models). This unfavorable performance is attributed to the limited number of annotated objects in both classes which hinders the training process of the model in learning the pattern of these two classes.
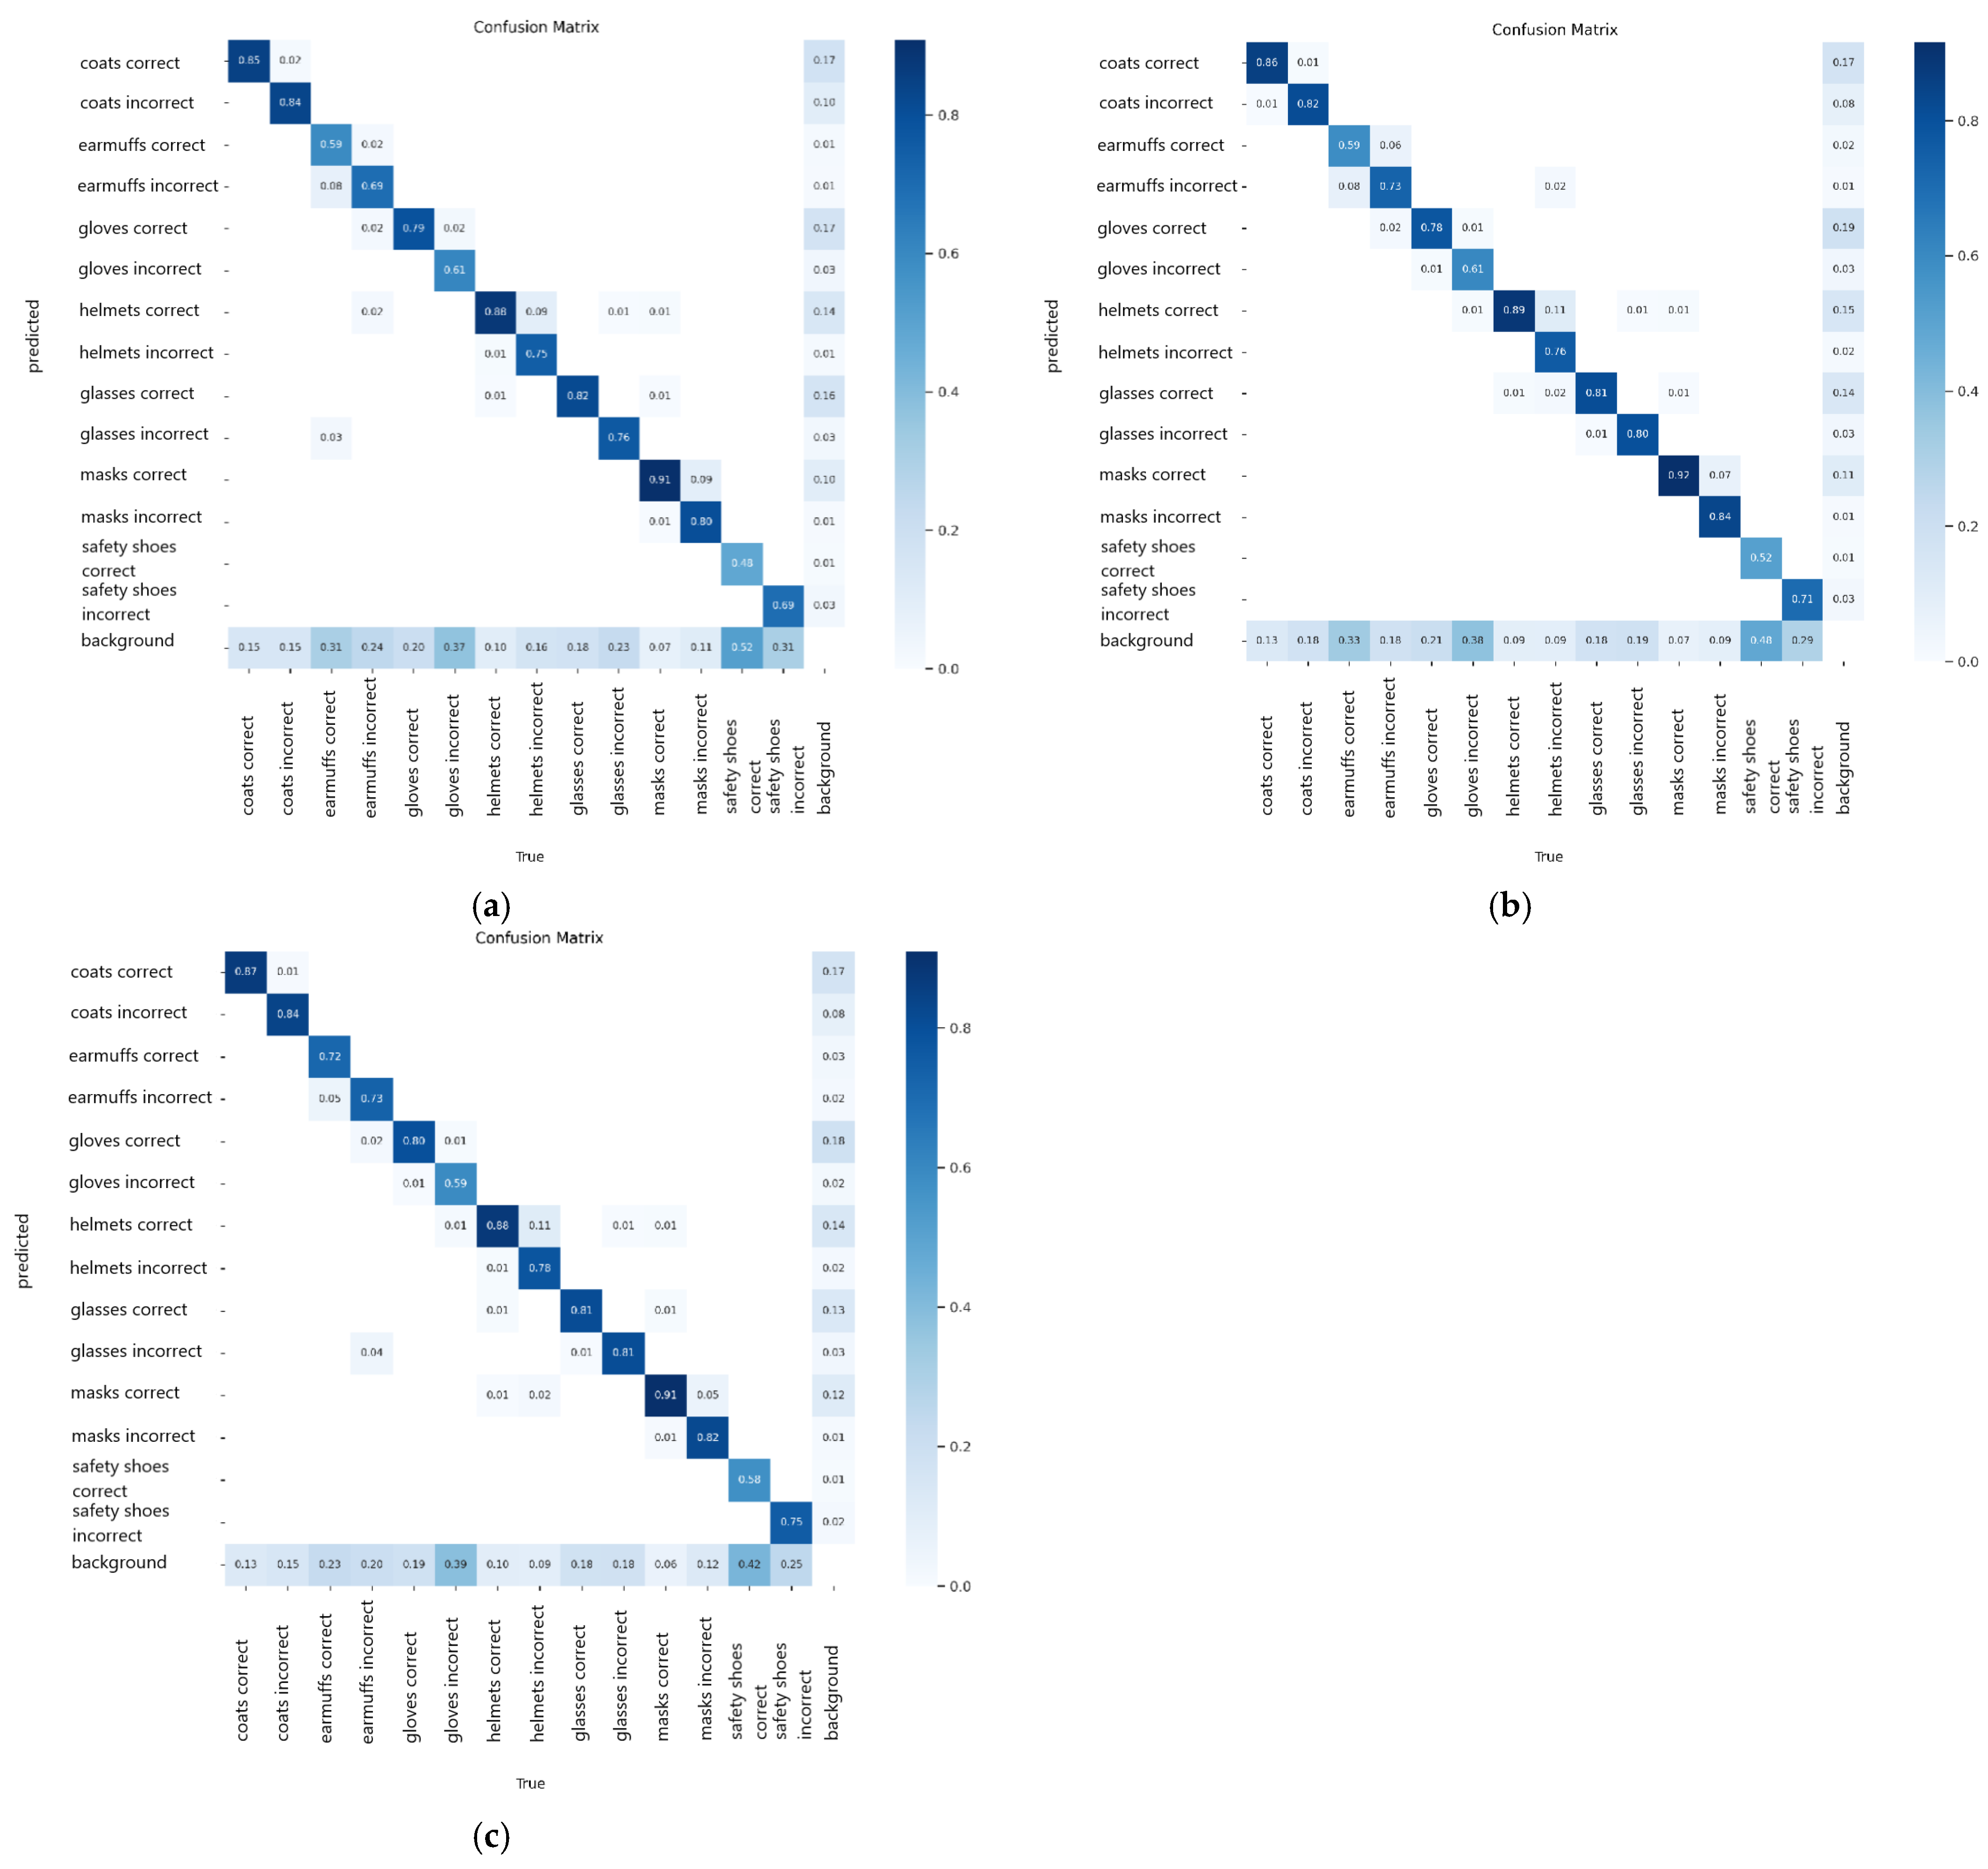
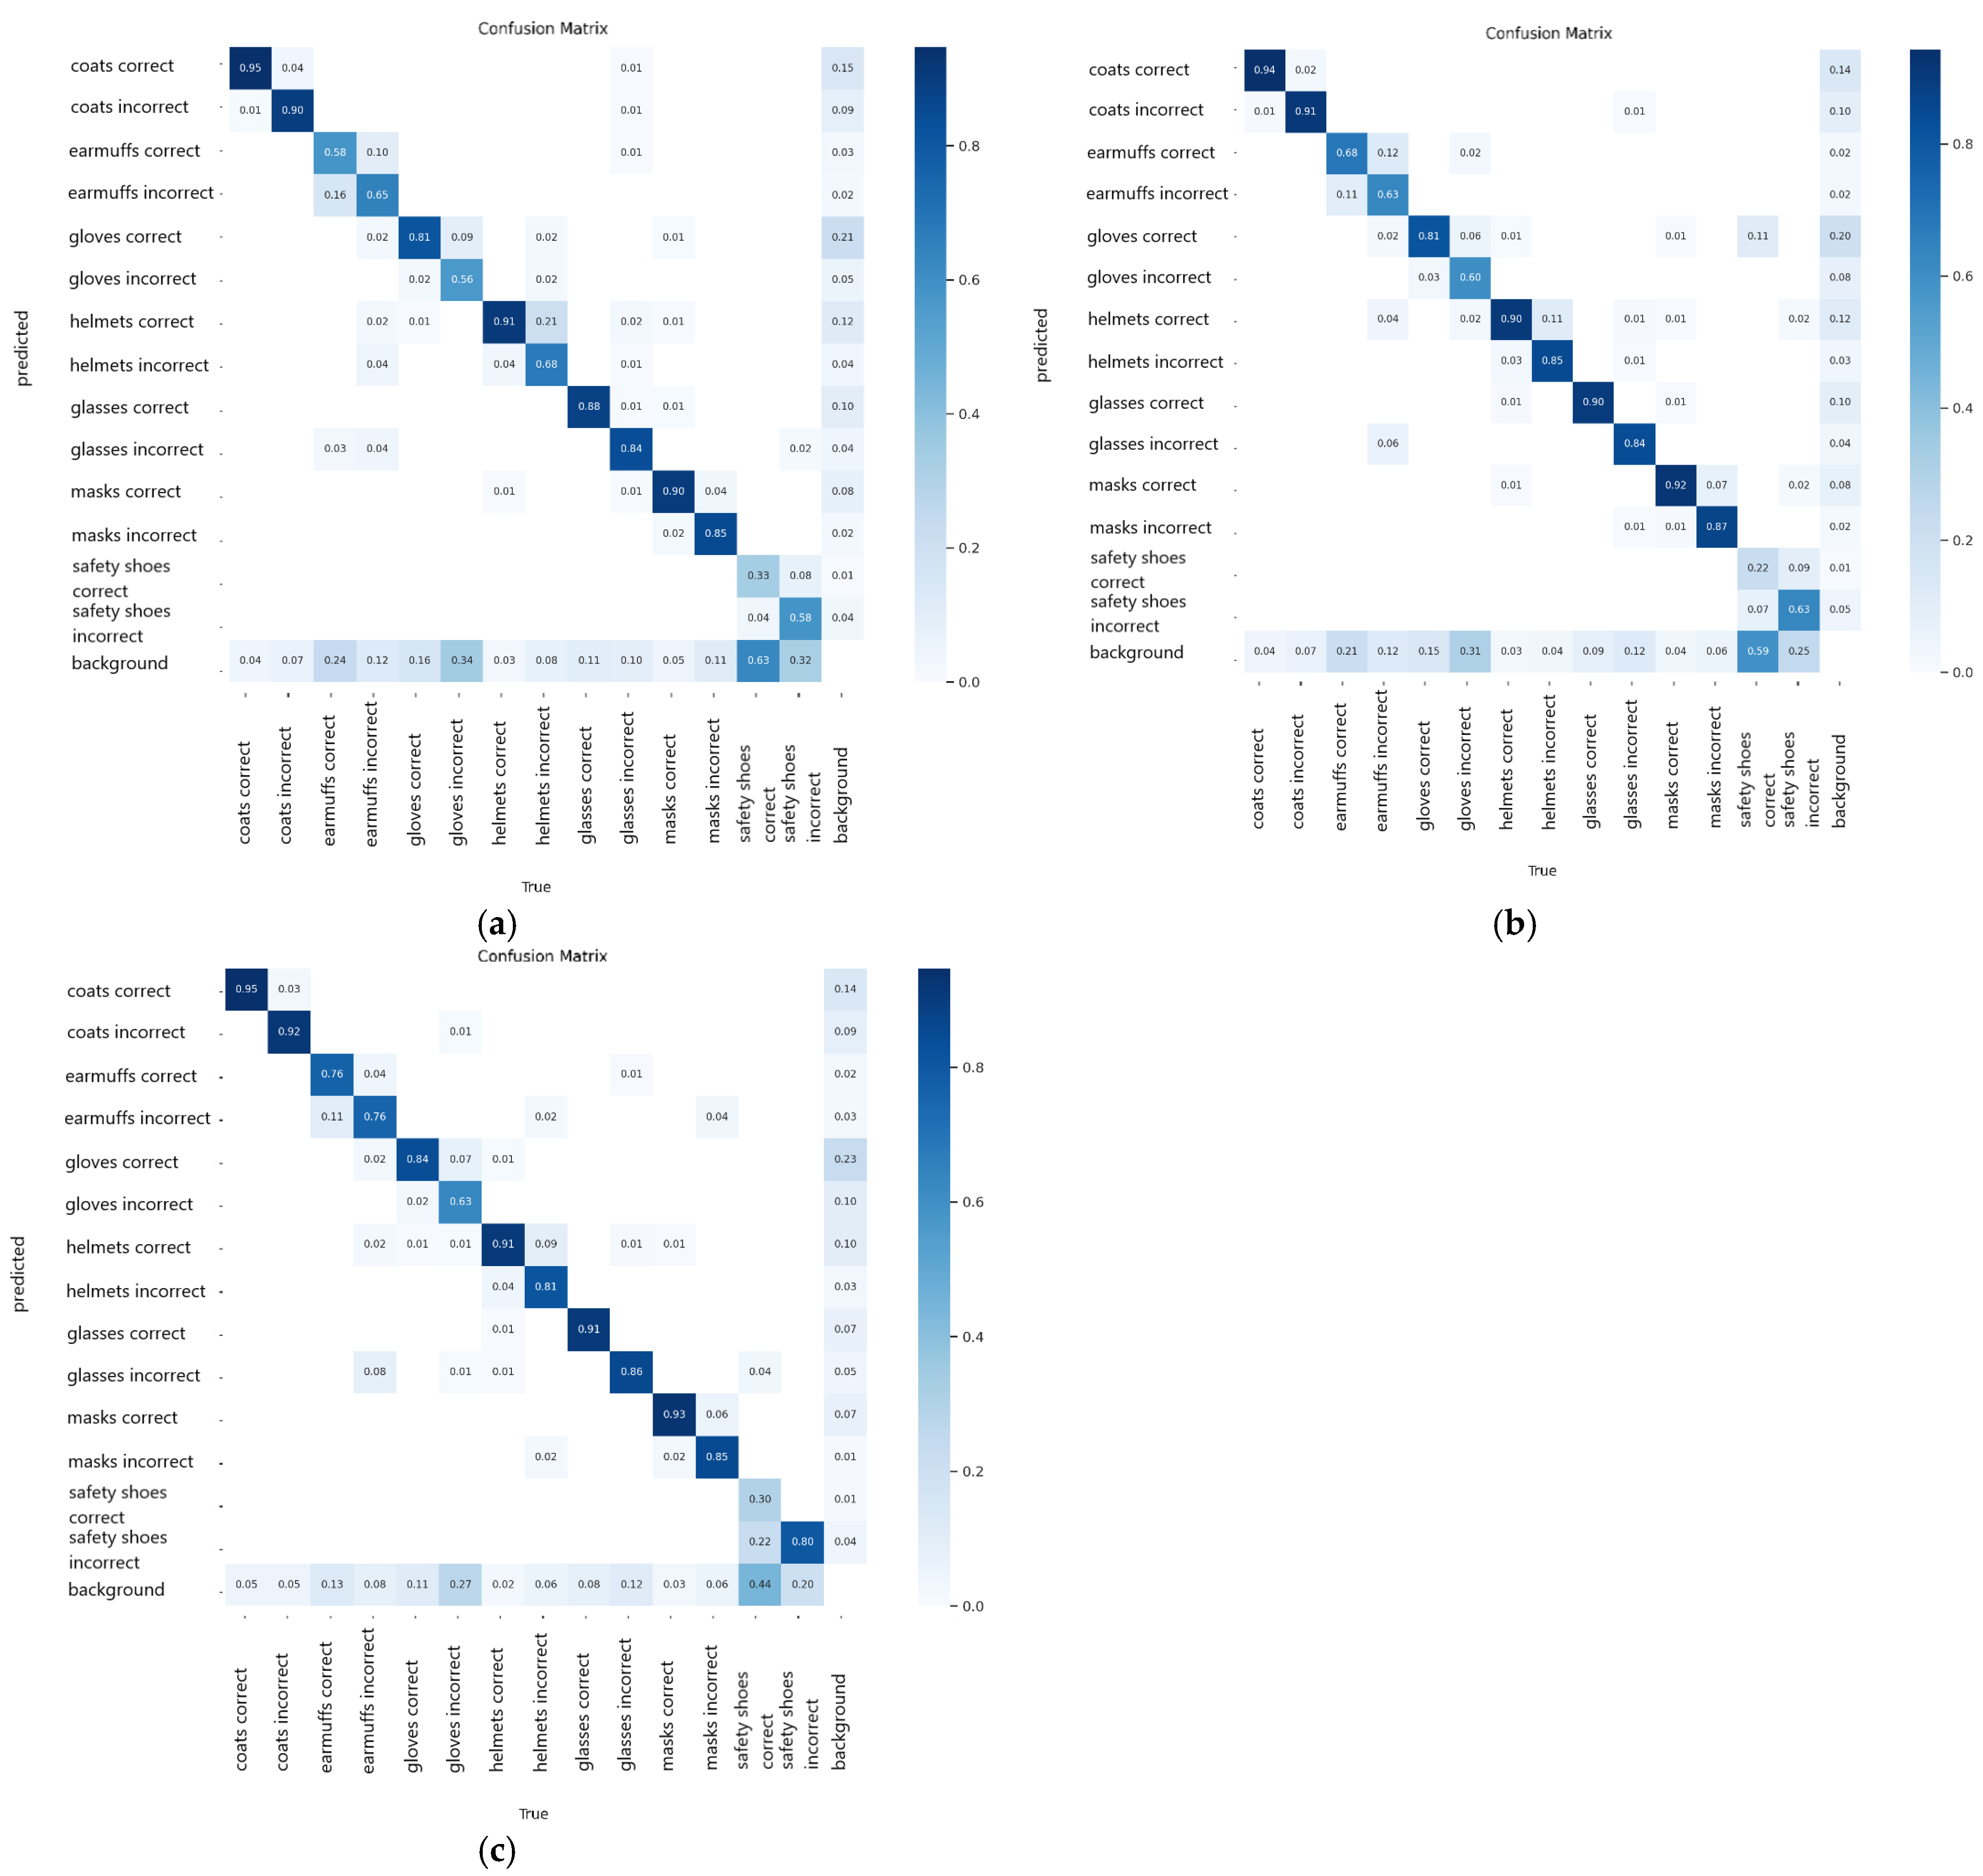
Moving on, the analysis is detailed by observing the confusion matrix presented in
Figure 16. The safety shoes correct class obtained the lowest prediction accuracy at 0.48, 0.52, and 0.58 for the 50, 75, and 100 epochs models, respectively. In this class, the models fail to detect the correct safety shoes object, thus detecting this object as background. The same phenomenon also happened in the prediction of the earmuffs correct class. However, the 100 epochs model provides relatively better prediction with higher accuracy for these classes than the other two YOLOv5 models. It is also observed that all YOLOv5 models can differentiate the correct and incorrect utilization of PPE objects, indicated by a low value of wrong prediction via mistakenly detecting correct utilization as incorrect utilization and vice versa. The error is mostly attributed to the failure of detecting the object and assigning it as the background. Based on this finding, it can be safely claimed that the 100 epochs model is the best performed model using the YOLOv5 algorithm.
5.3. Results for YOLOv6
Similar to the other YOLO algorithms, three models are developed using YOLOv6, with the number of epochs set to 50, 75, and 100 epochs. The training time for the YOLOv6 models was 118 min, 137 min, and 190 min for the 50, 75, and 100 epochs models, respectively.
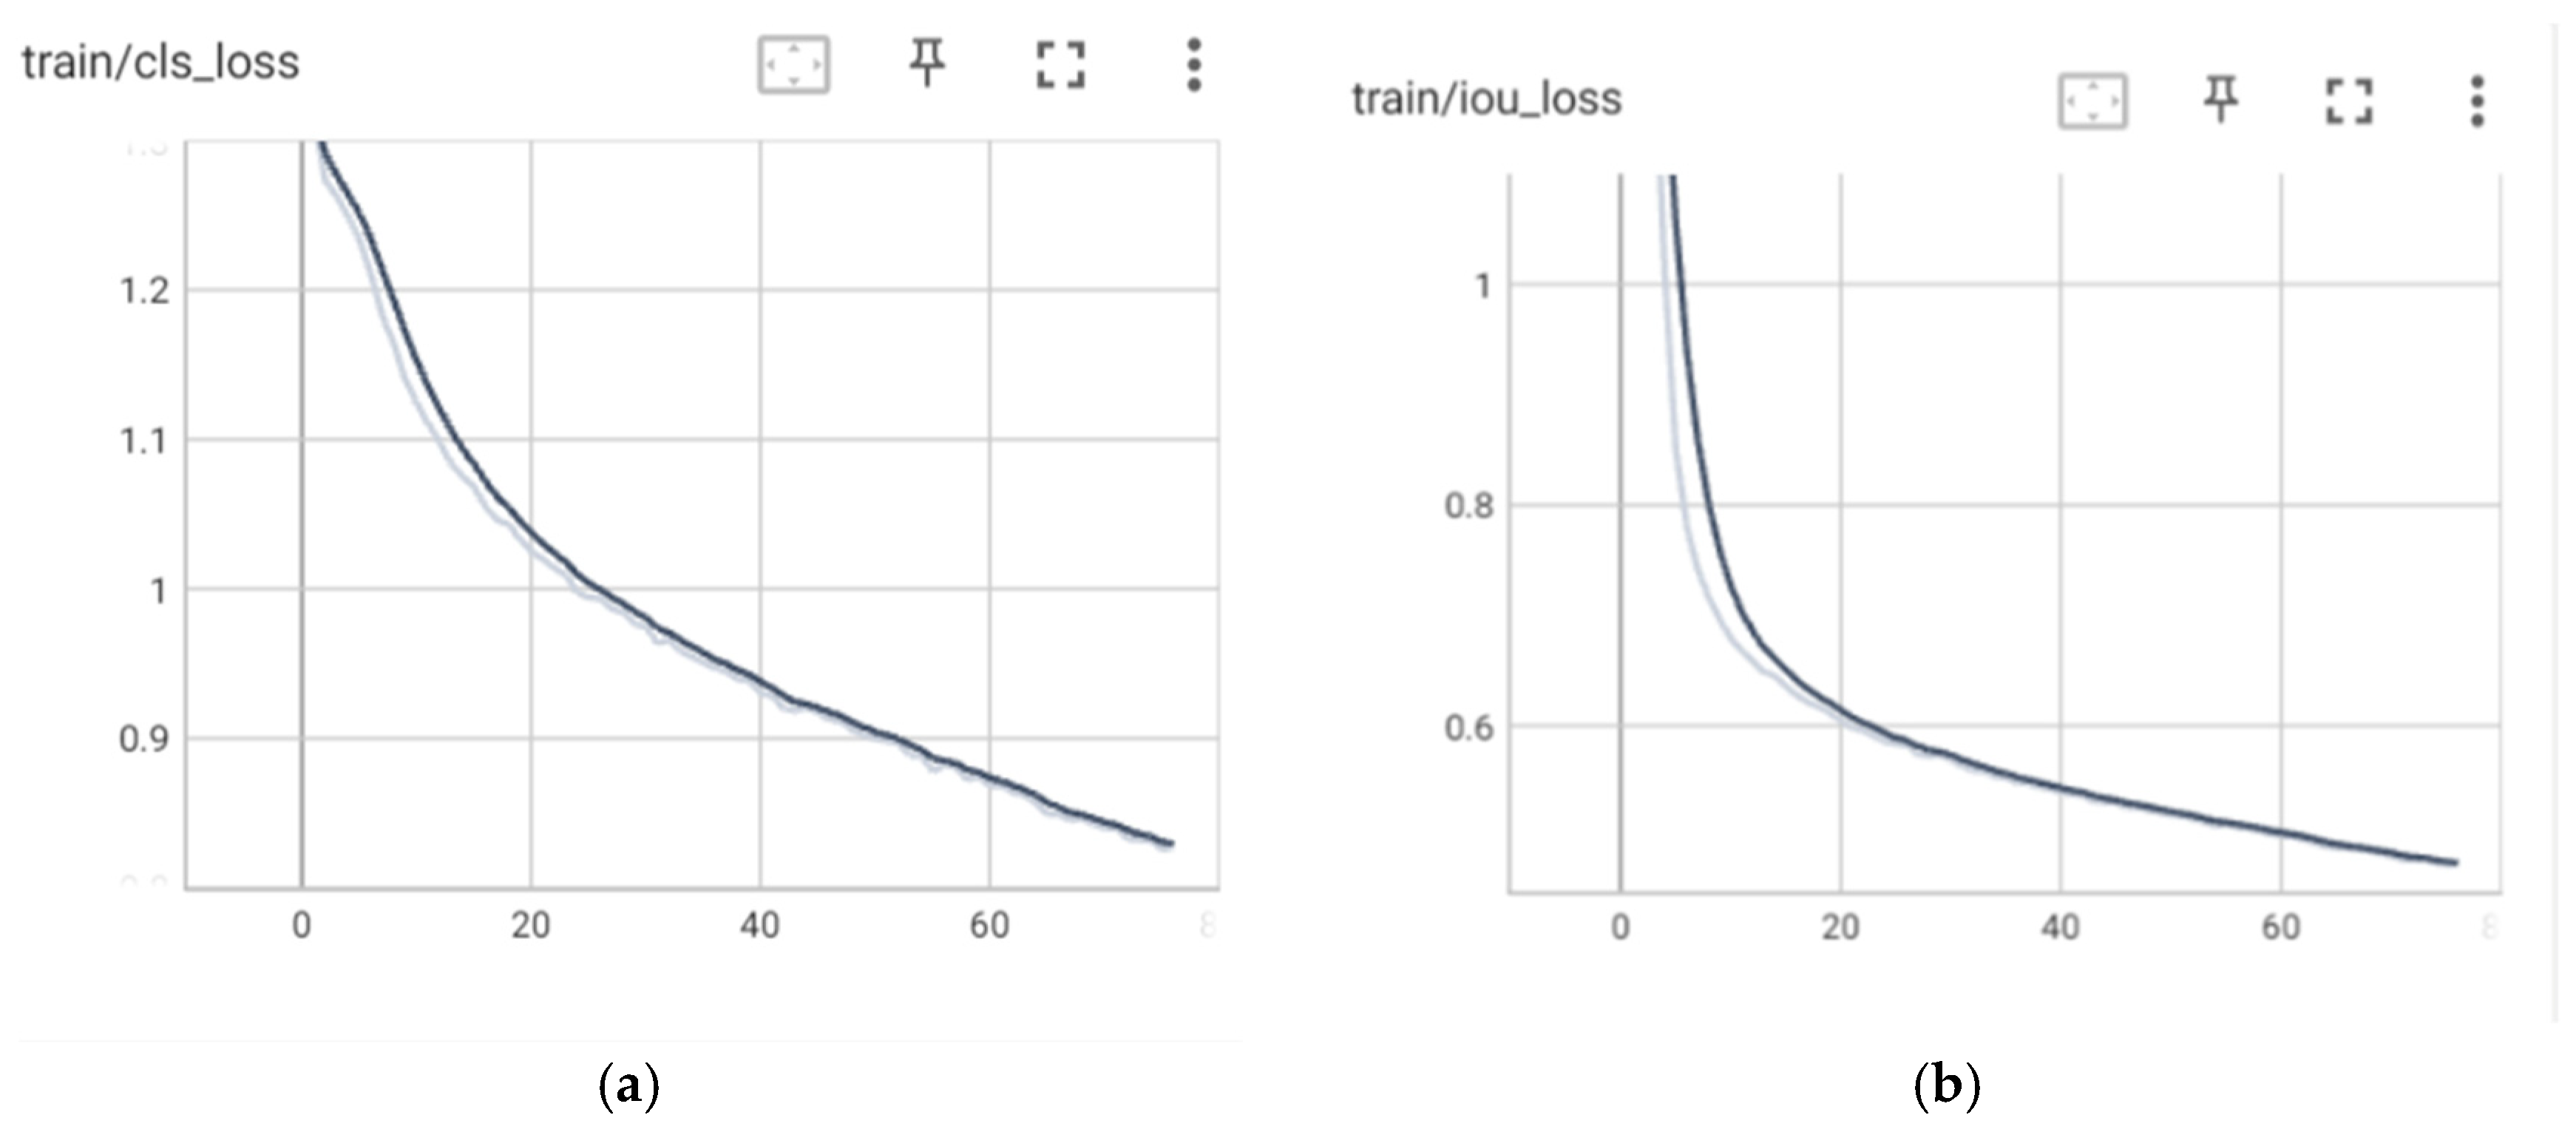
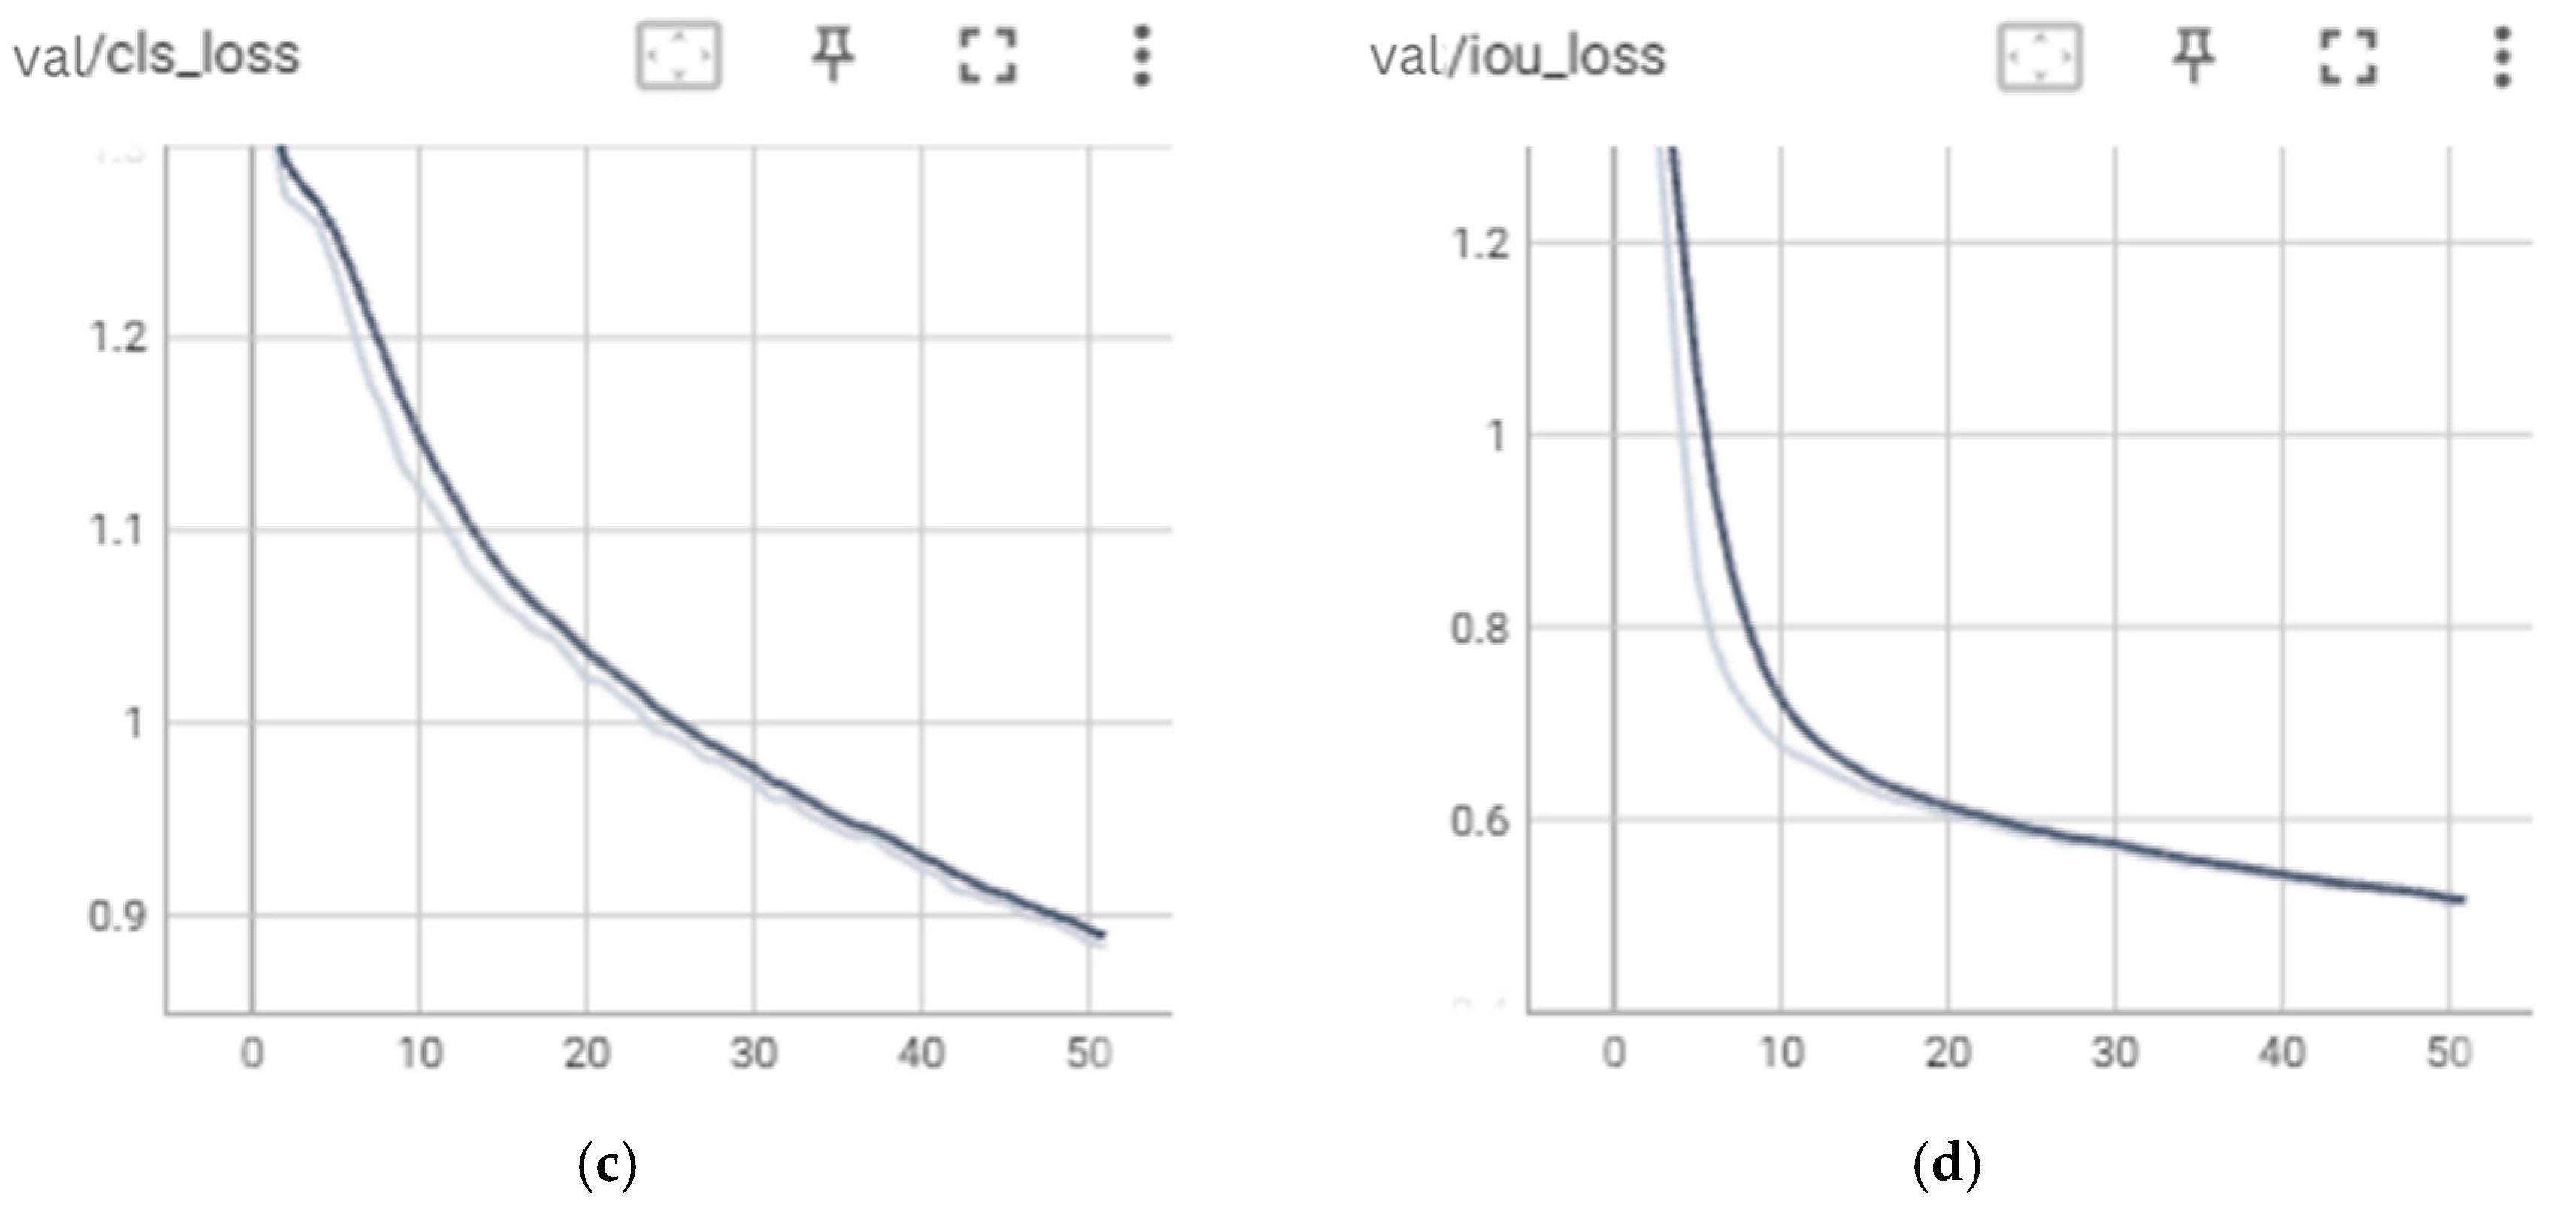
Figure 17,
Figure 18 and
Figure 19 present the loss curves both on training and validation datasets during the training process for YOLOv6 models.
Based on the figures, it can be observed that there is no indication of overfitting as the decreased trend of loss curves for both training and validation are consistent. However, there is an indication that the models encounter underfitting since the training stops before the loss curves reach convergence. As such, the YOLOv6 models might obtain lower loss if the number of epochs is increased and the training continues. Moving on, the performances of the YOLOv6 models in detecting the proper utilization and adequacy of each PPE class for the testing datasets are evaluated.
Table 7 presents the detailed results of the models, while
Figure 20 illustrates the confusion matrix for the three models of YOLOv6.
Similar to the other models, there is low performance of the YOLOv6 models in detecting certain PPE classes, which are earmuffs correct, hard hats incorrect, and safety shoes correct utilization. The low metric values for those classes are mainly attributed to an imbalance of the number of training images. Nevertheless, the overall performance of the YOLOv6 models is significantly better than the YOLOv4 models.
Based on the results of the detection model testing using YOLOv6, the best performance was achieved with the YOLOv6 model with the number of epochs set at 100. This is because it yielded the highest values for the evaluation metrics, including recall, mAP, F1 score, and accuracy, when compared to the 50 epochs and 75 epochs models. While the precision value of the 100 epochs model was lower than those of the 75 epochs model, the model with the highest F1 score is considered the best choice because it represents a balance between precision and recall. Therefore, epoch 100 is chosen as the optimal epoch.
The precision result for the best model, which is the 100 epochs model, is 0.738, meaning that approximately 73.8% of objects identified as positive by the model are indeed relevant objects. The recall result is 0.725, indicating that the model can detect approximately 72.5% of all true positive objects. The F1 score, which combines precision and recall to provide an overall measure of model performance, is 0.727, showing that the model maintains a good balance between precision and recall.
The mAP is a value that combines multiple precision–recall values at different decision thresholds into a single average score. The mAP result is 0.736, indicating that the model performs well in detection across various decision thresholds. Accuracy represents the overall percentage of correct predictions out of all predictions. In the YOLOv6 detection model with 100 epochs, the accuracy achieved is 82.02%, indicating that the model correctly predicts approximately 82.02% of all test dataset examples. In conclusion, the YOLOv6 detection model with the number of epochs set to 100 demonstrates strong performance with adequate values for precision, recall, mAP, F1 score, and accuracy.
5.4. Comparison of the Models
Based on the results obtained from the model of each algorithm (the 100 epochs models of YOLOv4, YOLOv5, and YOLOv6), a comparison was conducted to determine the best PPE detection model. The criteria for selecting the best detection model are based on precision, recall, mean Average Precision (mAP), and F1 score values. The choice of evaluation metrics is crucial because these values consider the model’s accuracy and its ability to correctly identify various object classes. Accuracy is not considered a determining factor for assessing model success since it can be biased and may not provide an accurate representation of object detection quality when there is an imbalance in the number of objects in each class. In this case, the number of objects in each class is not uniform and balanced. The performance comparison of the best model using each algorithm on the validation dataset is presented in
Table 8.
Therefore, when examining precision, recall, mAP, and F1 score values, it is evident that the best model is YOLOv5, scoring the best values in each evaluation metric. However, the differences in values between YOLOv5 and YOLOv6 in each metric are not significantly large, so both algorithms can be considered equally effective in object detection. Meanwhile, YOLOv4 demonstrates performance below the other two algorithms, indicating that the YOLOv4 model is still not quite effective in detecting PPE objects.
In addition to having the highest metric values for PPE object detection, YOLOv5 also boasts faster computation times for both training and testing compared to the other two algorithms. The testing time of each model is presented in
Table 9. The average testing time is measured for detecting PPE objects in a single image. The time taken during testing indicates the model’s ability to perform detection at varying speeds. When a model can detect objects quickly, especially when measured in milliseconds, it can be considered to have real-time detection capabilities. In this research, the fastest time for detection recorded was 1.02 s, indicating that the model is quite proficient at detection when considering its speed in recognizing objects. Noted that testing time presented in the table is not only the time taken for making a prediction, but also includes the time for importing the data and preprocessing the image.
5.5. Discussion
The object detection system is designed to monitor the use of PPE in real-time and issue alerts for any incorrect usage or absence of PPE. These cameras are strategically positioned at various angles to encompass the front, rear, and side areas surrounding the machinery within manufacturing teaching laboratories in universities. To ensure comprehensive coverage within the detection zone, a single camera is capable of effectively detecting objects within an area of approximately 15 m2. Given this coverage capacity, the camera can encompass up to three machines within its field of view.
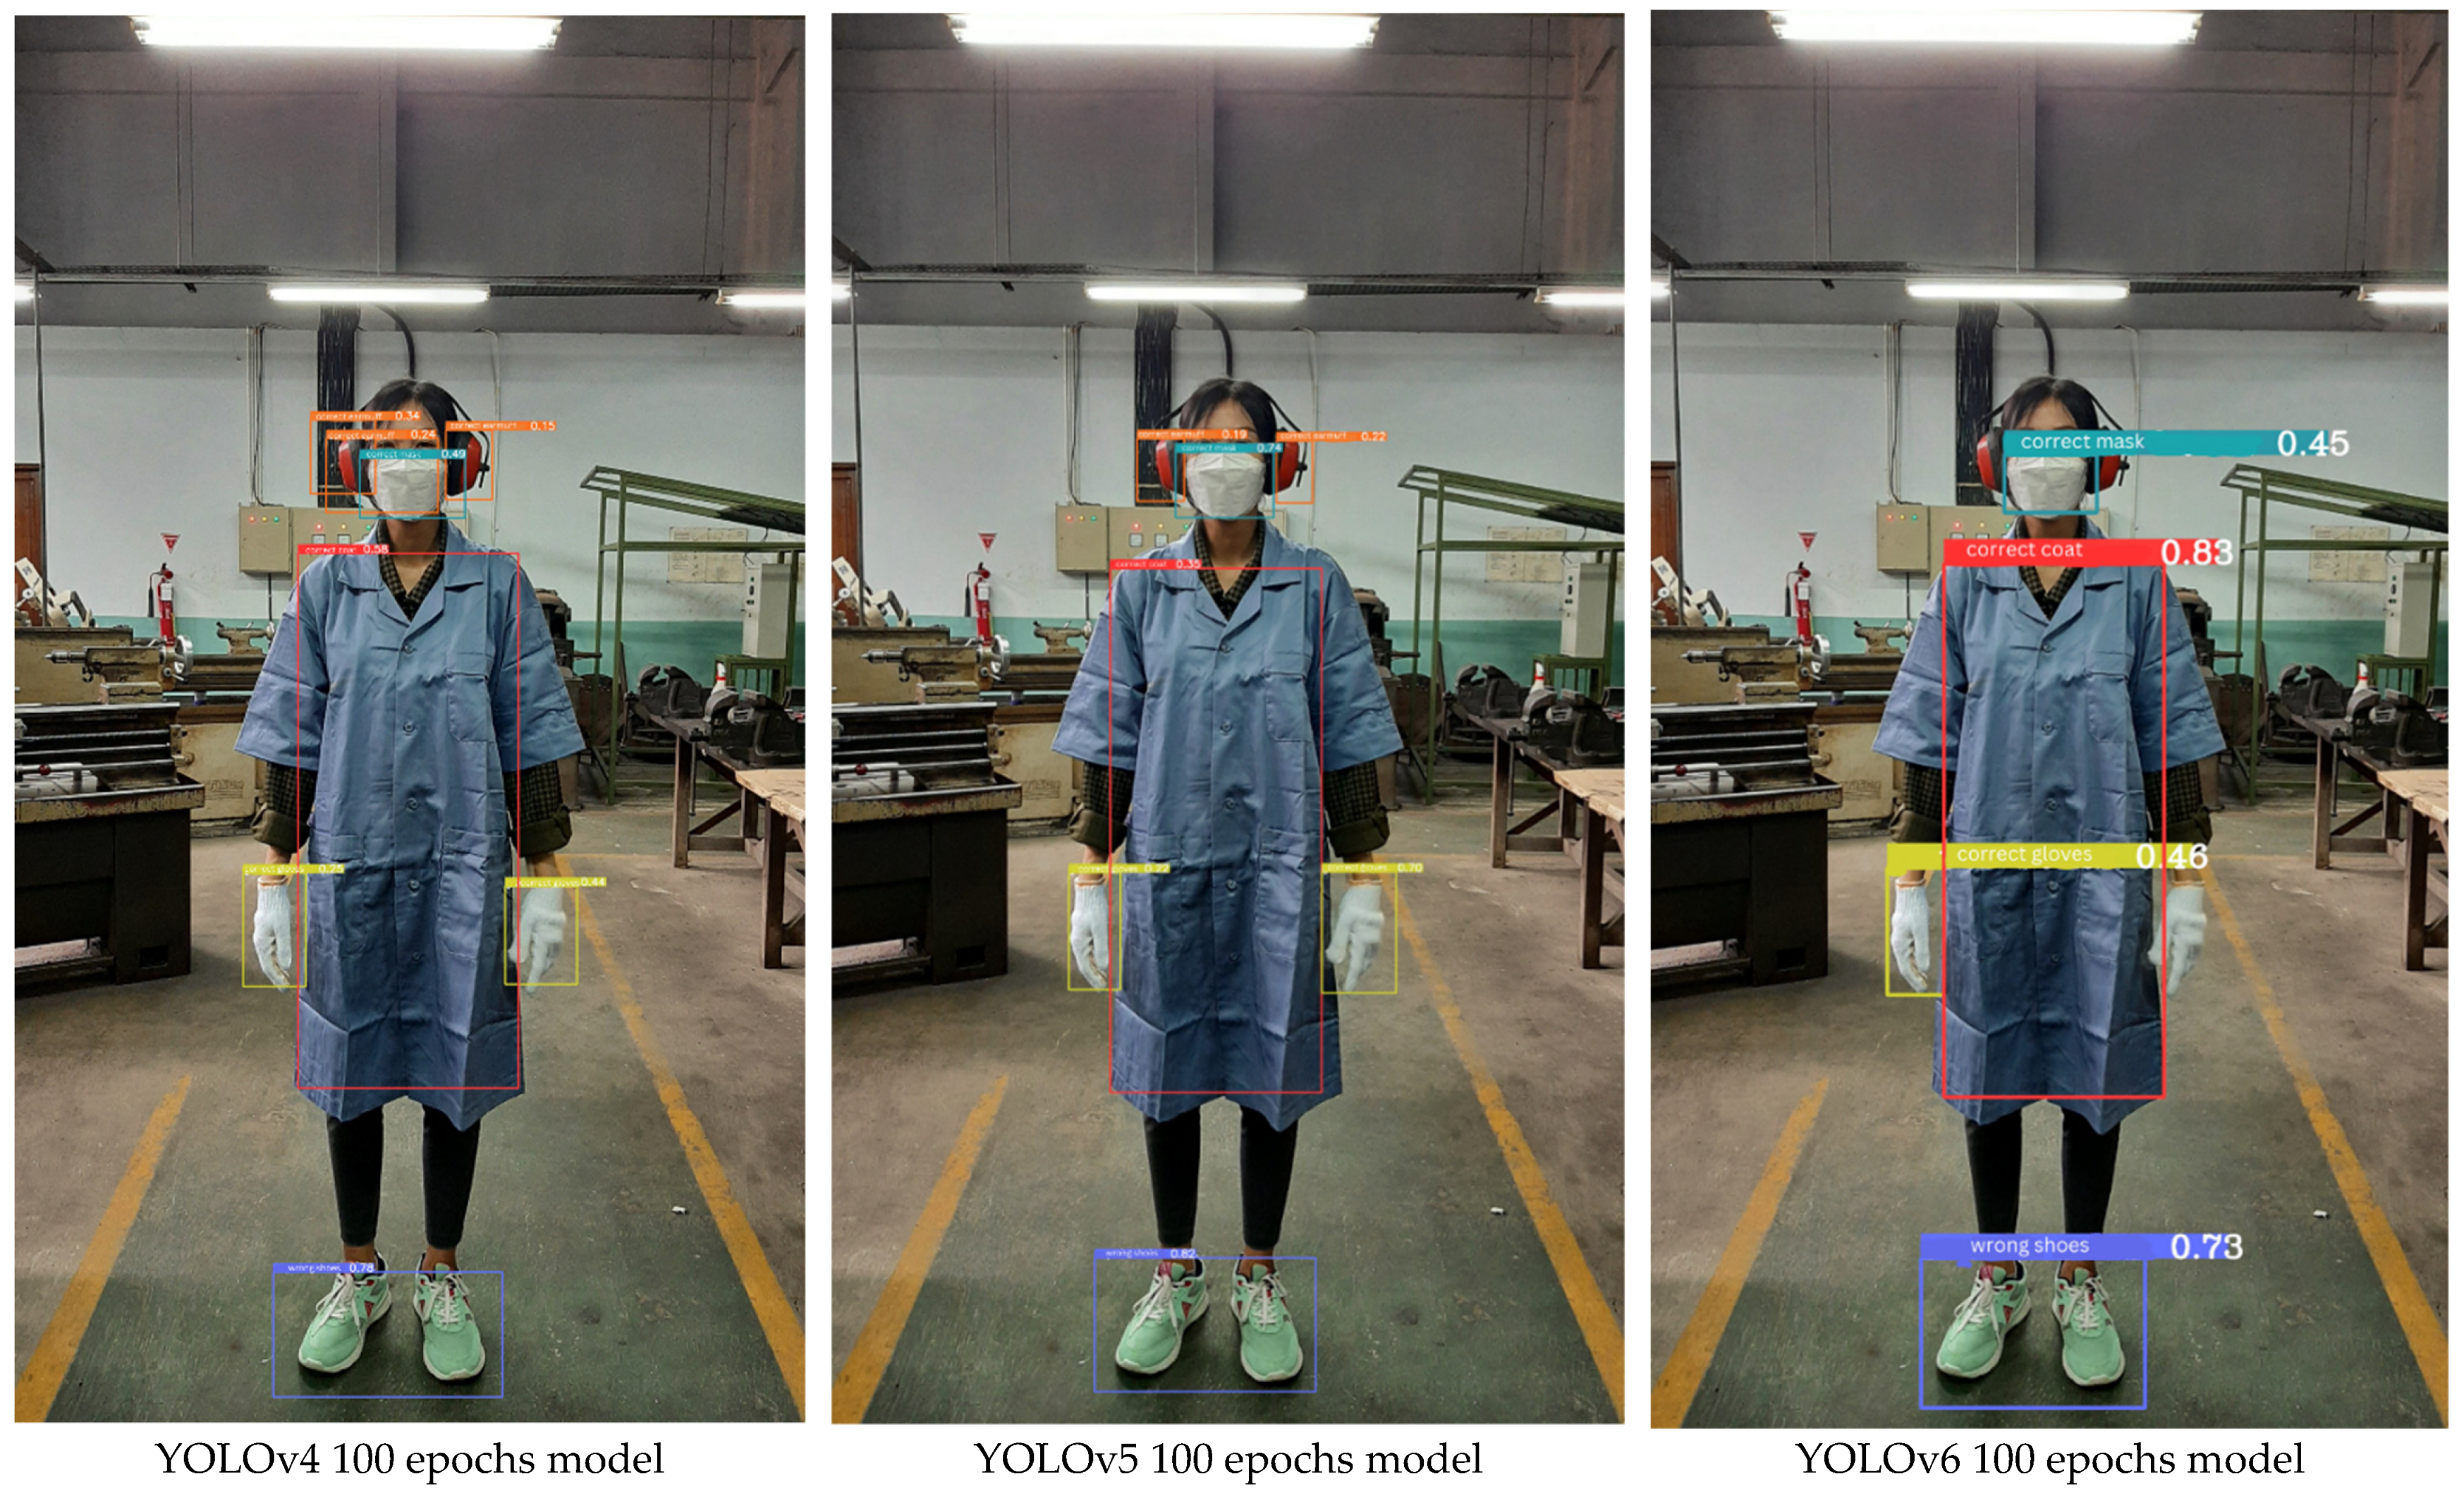
The detection of PPE using YOLOv4, YOLOv5, and YOLOv6 has yielded results that indicate YOLOv5 with 100 epochs as the best detection model when compared to the other two YOLO variants. This conclusion is based on the evaluation metric values, which show that the YOLOv5 model outperforms the other models across all four evaluation metrics, despite having slightly lower accuracy than YOLOv6 with 100 epochs. Examples of the results of the best model for each YOLO version are presented in
Figure 21 and
Figure 22. It is observed that there are some errors and instances of missed detections in the models. In the single individual image, the YOLOv4 and YOLOv5 models are able to find all PPE objects and detect them as the correct classes. Meanwhile, the YOLOv6 model fails to detect earmuff objects.
The situations that cause errors when detecting are when an object is covered by another object and when a PPE object is captured by a small camera. To overcome this, cameras can be placed on various sides that include the machine and its users. As such, the usage of PPE can be constantly monitored. When detecting a PPE object that has a similarity to the background, the model encountered a detection error. In order to overcome this, there is a need to augment training datasets with various backgrounds or more complex location backgrounds to avoid the inability to detect objects of varying colors and shapes.
Another error is that when there is a PPE object that is not used by humans but is present in the camera capture (e.g., PPE is on the table), then the detection model will detect that there is a PPE object. This is an error when implemented as a warning signal for PPE usage alerts. To resolve this problem, adding labels or annotations is required for PPE objects that are not used by humans.
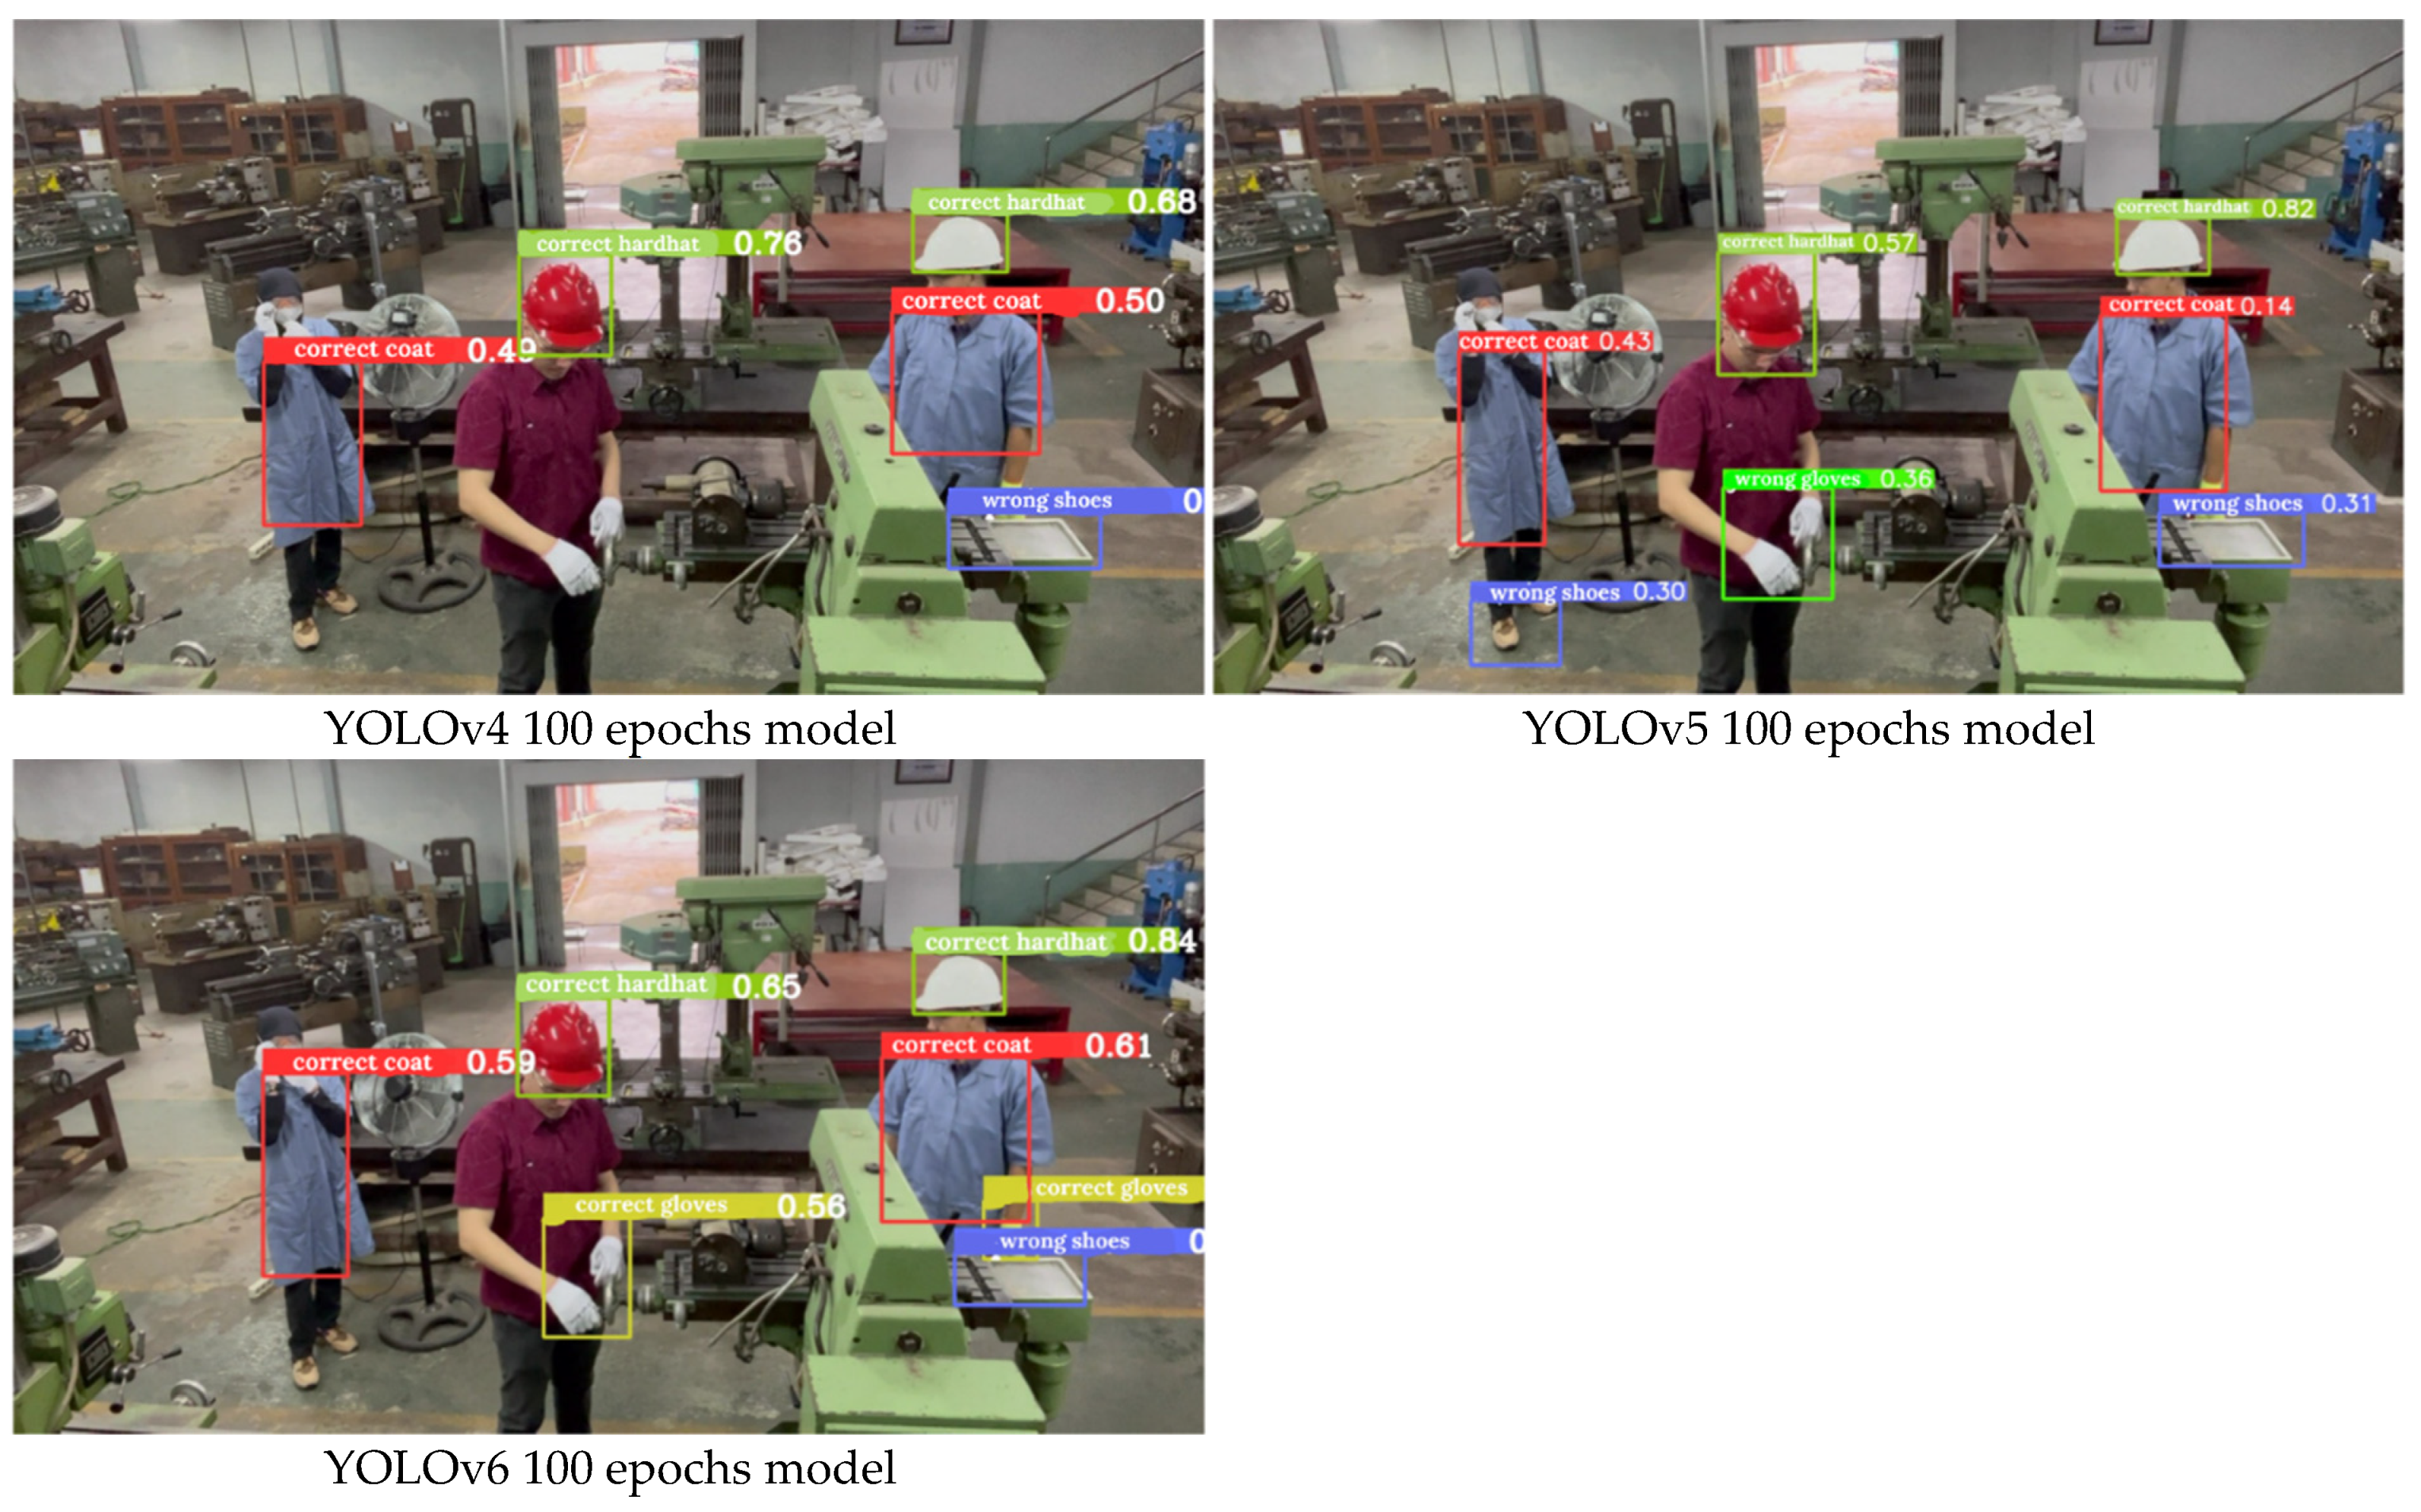
In the images with multiple individuals, YOLOv5 could not detect some of the gloves, masks, and glasses, and the model mistakenly classifies machine parts as safety shoes incorrect. In YOLOv6, errors include misclassifying machine parts as safety shoes incorrect, and missed detections of glasses, masks, and gloves. However, in the case of YOLOv6, the detection results for the multiple individual image show that gloves are correctly detected on the third individual (on the far right), whereas YOLOv5 fails to detect them. Errors in detection, such as machine parts being classified as safety shoes incorrect, occur due to the presence of objects that resemble the background, affecting the detection capability. This is because visual-based detection relies on similarities in color and shape, which can lead to misclassifications. Another factor is the imbalance in the number of objects from different classes in the training data, causing the model to be biased towards the class with the higher number of objects. This can result in higher detection errors for classes with fewer objects, such as the safety shoes correct objects which are frequently mistaken as incorrect. Additionally, during the annotation process, if there are objects outside the designated class that fall within the bounding box, it can confuse the model and lead to incorrect detections of background objects that resemble the target class.
In this study, all proposed CNN models have data limitations, meaning they can only detect PPE objects that were part of the training dataset (the 14 PPE classes). After conducting further experiments, it is found that the models cannot detect other types of PPE objects because the deep learning models built in this research are based on supervised learning, where the model can only detect objects based on what it learned from the training datasets. To enhance the detection capabilities of the deep learning models, it is advisable to introduce data variations or different types of PPE objects into the training and testing datasets for further research, not only in the setting of manufacturing teaching laboratories, but also other science (e.g., chemical and biological) laboratories.
This study also found that class imbalance can affect the performance of the detection model, especially in underrepresented classes. In addressing class imbalances, data resampling can be performed. The technique used is to oversample the number of samples in the minority class by retrieving new data in the minority class and replicating or making copies of existing data. This would enhance the deep learning model’s ability to learn more efficiently, thereby boosting its performance in detecting objects.
Adapting this system for real-world university settings, it could be integrated with monitoring cameras within laboratory environments, akin to a CCTV setup equipped with an alert system—for instance, issuing a warning notice when PPE is not being used or is misused by individuals. This real-time monitoring ensures continuous detection and intervention, making it a practical and effective safety tool. The system only necessitates investment in surveillance cameras and computer devices, thus it is relatively easier to be implemented in the laboratory. Its primary advantage lies in minimizing both physical harm and financial losses related to accidents and medical care for university affiliates, thereby enhancing safety and reducing potential liabilities.
On the other side of the spectrum, enhancing the education and training of laboratory staff, students, and visitors remains a pivotal strategy for improving the correct utilization of PPE within manufacturing teaching laboratories. This approach not only involves instructing users on the correct selection and fitting of PPE but also extends to educating them about its limitations and the necessity for regular inspection to ensure its integrity and effectiveness. Comprehensive and efficient training programs, tailored to address the specific hazards encountered in these environments, play a crucial role in fostering a deeper understanding of safety protocols and the underlying reasons for their implementation.


