Article

Methodology for Monitoring Work Zones Traffic Operations Using Connected Vehicle Data

1
Lyles School of Civil Engineering, Purdue University, West Lafayette, IN 47906, USA
2
Indiana Department of Transportation, Indianapolis, IN 46219, USA
*
Author to whom correspondence should be addressed.
Safety 2022, 8(2), 41; https://doi.org/10.3390/safety8020041
Submission received: 18 April 2022 / Revised: 15 May 2022 / Accepted: 27 May 2022 / Published: 1 June 2022

Abstract

:
The National Work Zone Safety Information Clearinghouse estimated there were approximately 115,000 work zone crashes with 842 fatalities in 2019. There is broad consensus that it is important for agencies to develop near real-time risk assessment of work zone traffic operations to proactively identify improvement opportunities. Due to the huge spatial distribution and relatively low frequency of crashes, legacy techniques of monitoring crash locations do not scale well for identifying all but the most severe construction zone operational problems. Past research identified hard braking and congestion as strong predictors for crashes in and around work zones. This paper presents scalable methodologies that can be used to systematically analyze hard-braking and speed data obtained from connected vehicles. These techniques have been applied to over 205 billion records in Indiana since 2019. These statewide data analytics are fused into concise graphics to identify work zones with emerging anomalies in congestion and/or hard braking. Weekly screening reports, institutionalized in Indiana for the past two years, provide information for agile agency monitoring and response. Case studies show quantitative changes in work zone performance measures, and corresponding surveillance video images illustrate the significance of these changes. During this period of near real-time monitoring and agile agency response, Indiana interstate crash rates have been reduced by 31% from 2019 to 2021, even though most 2021 interstate traffic volumes have rebounded to pre-pandemic 2019 volumes.

1. Motivation

There are approximately 115,000 crashes and 842 fatalities each year in work zones across 4.2 million miles of roads in the United States. Due to the huge spatial distribution and relatively low frequency of crashes, legacy techniques of monitoring crash locations do not scale well for identifying all but the most severe construction zone operation problems.
Work zones often cause change in traffic patterns that may result in increased delay and in some cases, crash incidents. In 2019, nationwide fatal crashes in work zones increased by 11% compared to the previous year [1,2]. Despite lower volumes in 2020 due to the COVID-19 pandemic, crashes within work zones in the United States were observed to be rising in several states [3,4,5,6]. The United States Department of Transportation’s National Highway Traffic Safety Administration also released early estimates of traffic fatalities for the first half of 2021, showing a further rise in these numbers [7]. Timely assessing risk levels of ongoing work zones is a priority, so agencies can be agile in implementing mitigating measures. However, traditional methods of using only crash data for assessing work zone safety take multiple years to accumulate a significant number of events in order to make decisions.

2. Opportunity to Leverage Connected Vehicle Data to Monitor Work Zones Traffic Operations

The objective of this study was to demonstrate how CV data sources can be used to provide near real-time insights to identify opportunities to improve the traffic operation of construction work zones. On average, one in every twenty vehicles traversing on Indiana highways is connected today and provides anonymous trajectory data to these providers [8]. One such data source, hard-braking events, is used to assess the risk levels at different work zones. These data coupled with other measures such as the duration and extent of congestion can be used to assess the operation of work zones in near real time [9]. These data-driven techniques for monitoring a statewide interstate system are important so an agency can efficiently identify which work zones should be evaluated for potential operational improvements. The paper is organized as follows:
  • Literature review (Section 3);
  • CV attributes available for near real-time analysis (Section 4);
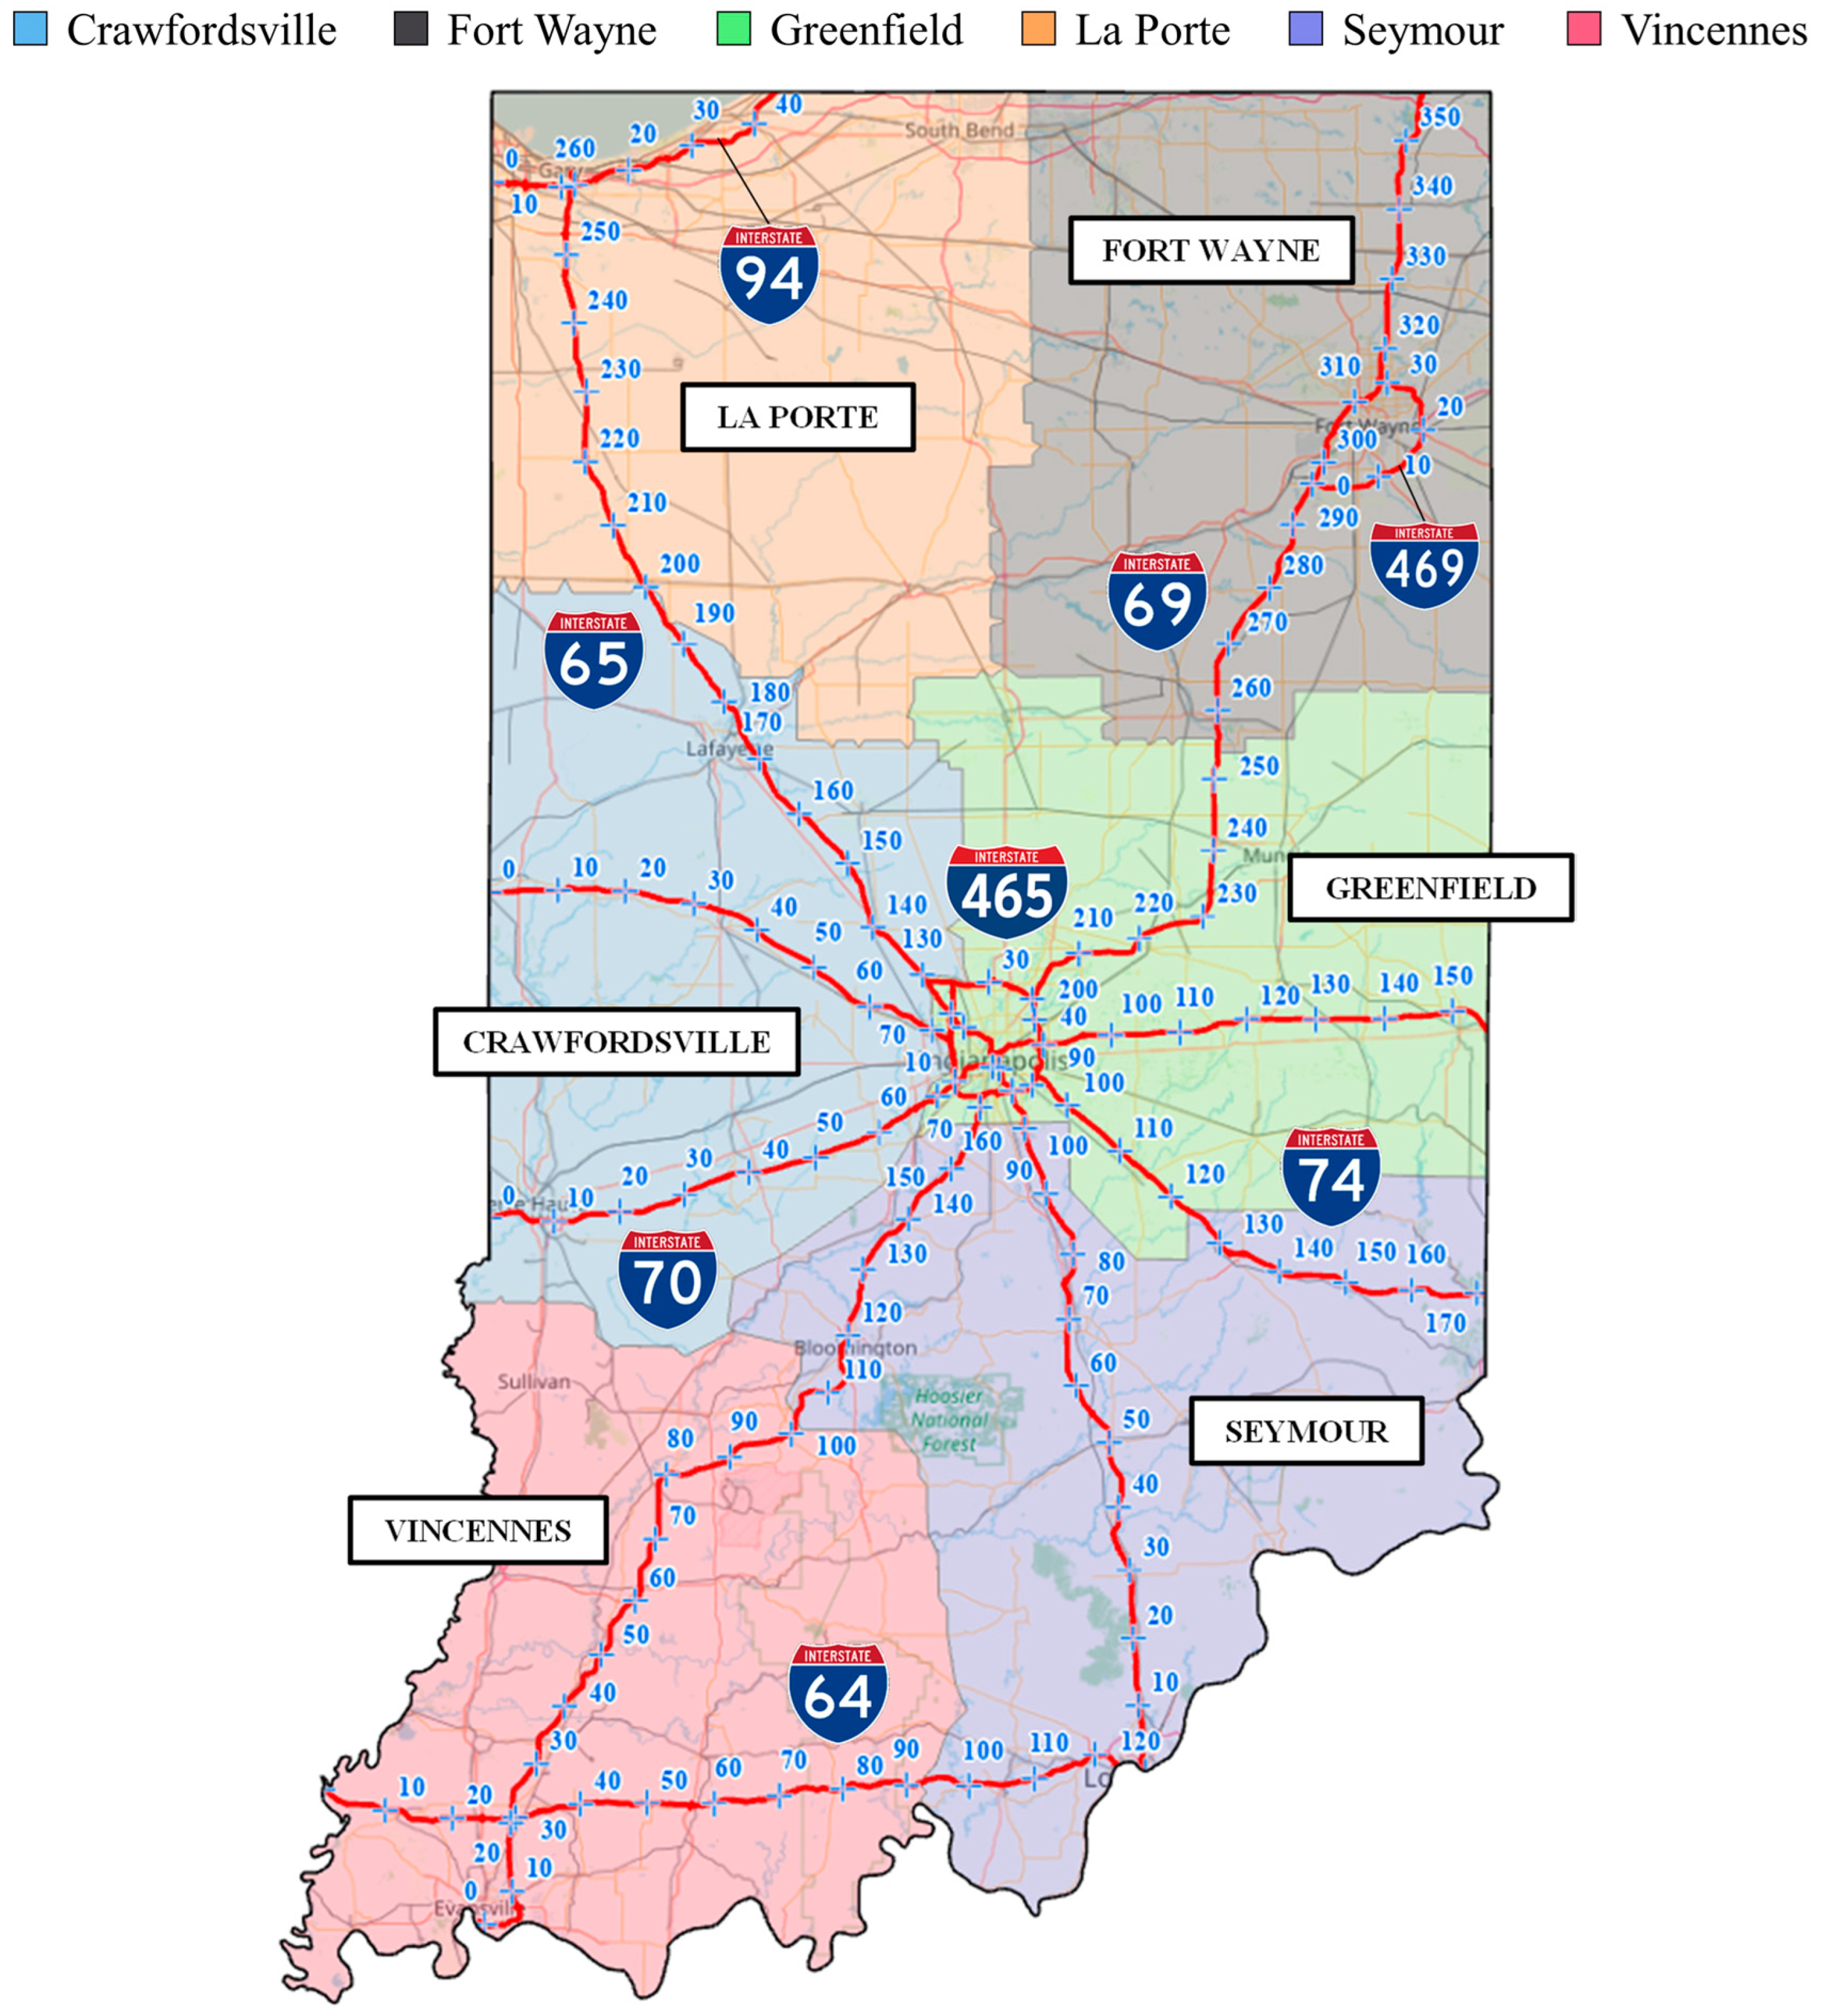
  • Indiana interstates and districts used for partitioning analysis (Section 5);
  • Performance measures assessing changes on adjacent interstate network associated with closure of a major interchange (Section 6 and Section 7);
  • Seasonal monitoring of an interstate construction job for recommending queue warning truck location (Section 8);
  • Tactical analysis of interstate cross overs that are used to inform design decisions for future interstate cross over designs (Section 9 and Section 10);
  • Conclusions (Section 11).

3. Literature Review

State departments of transportation (DOTs) have long relied on historical volume counts fed into queue forecasting models when making maintenance-of-traffic and resource allocation decisions for construction work zones. CV data now provide the ability to incorporate real-time data into the decision-making process in favor of relying on historical and often outdated volume counts.
Probe data studies in the past have used multiple sources including Bluetooth, toll tag, license plate, and cell phone reads among others to measure work zone mobility performance by monitoring individual vehicles passing through a work zone [10]. Segment-based probe vehicle data have been used to generate mobility performance measures for interstates in Indiana to provide a real-time visualization of interstate mobility and to enable comparative analyses among interstate corridors [11]. The 2015 Indiana Mobility Report and Performance Measure Dashboards report laid the foundation for several such mobility performance measures that have been adopted by the Indiana Department of Transportation (INDOT) and several other transportation agencies [12,13]. The performance measures include congestion profiles, speed profiles, incident detection tools, queue intensity maps and segment based rankings [9]. These CV-based performance measures eliminate the need for most roadside sensors. As a result, work zones monitoring has been transitioning from infrastructure-based sensors to CV data across Indiana.
High-fidelity, trajectory and event-based CV data have emerged in the past few years and have helped develop fine-grained mobility impact studies and methodologies for work zones. The research has looked at traffic diversions and effects to traffic signal performance on alternative routes as a result of interstate congestion [14,15]. A 2019 study of 23 construction work zones covering approximately 150 centerline miles of interstate roadway in Indiana found the occurrence of 1 crash per mile for every 147 hard-braking events in and around a work zone [16]. A pilot evaluation of 11 lane closure exceptions on interstates in Indiana during the summer of 2020 demonstrated how real-time access to CV data enabled decision makers to implement agile lane closure policies and leverage a reduction in traffic volumes to benefit construction schedules while not adversely impacting work zone mobility [17]. Scalable methodologies using trajectory data and hard-braking events from connected vehicles have been leveraged for independent queue validation and providing actionable information to decision makers [18].
A three-year study of interstate crashes showed that the crash rates in congested regions was 24 times higher than the crash rates under uncongested conditions on the Indiana interstate [19]. Work zone safety research has relied on crash reporting, user complaints and safety inspections [20] and more recently placed significant emphasis on disaggregate modeling of crash severity to analyze safety performance [21]. However, due to the low frequency and delay involved in obtaining crash statistics, it is difficult to use crash data to identify all but the most significant safety problems. The recent availability of event data from connected vehicles such as hard braking holds promise for agencies being able to track work zone safety performance in near real-time. Hard-braking events have already been shown to be effective as a proactive surrogate metric in evaluating intersection safety [22] as well as interstate work zone safety [16], and they are very well positioned to be used as a real-time safety metric for monitoring construction activity. Additionally, CV data have been effectively utilized to evaluate the effectiveness of, and the driving behavior of motorists in response to, auxiliary work zone safety equipment such as queue warning trucks, presence lighting, digital speed limit trailers, speed feedback displays and speed limit signs, among others [22,23,24,25]. The aforementioned studies have shown encouraging applications of CV data toward an independent validation and evaluation of mobility and safety in construction work zones.
This paper describes a process for using real-time connected vehicle trajectory and event data along with historical crash incident reporting to create highly scalable methodologies for performance measures that provide quantitative weekly summaries of work zone mobility and safety. These reports can be used by agencies to agilely adapt to changing roadway conditions due to traffic and construction activities.

4. Connected Vehicle Data Attributes

The probe vehicle data used in this study were obtained from a private sector data provider. Information about traffic speeds for 0.5 to 3.0 miles of road segments was provided at 1 min intervals. Crash incidents records in the state of Indiana were gathered from a publicly available database. Hard-braking event data were provided by another private sector CV data provider along with anonymous trajectory information. A hard-braking event is defined by a vehicle experiencing a deceleration greater than 2.67 m/s2 (0.272 g). These events are accompanied with location and time information. All records are then geo-referenced to the mile marker system of Indiana’s interstates.
The Indiana Department of Transportation (INDOT) has also deployed more than 500 cameras in its statewide surveillance system. Images from these surveillance cameras are utilized to ground truth CV identified traffic anomalies.

5. Statewide Interstate Network and Districts

INDOT maintains and operates over 1250 miles of Interstate over eight different routes in Indiana. Figure 1 shows the Indiana interstate system. It also shows the six INDOT districts: Crawfordsville, Fort Wayne, Greenfield, La Porte, Seymour, and Vincennes. The posted speed limit on most interstates is 70 mph, except in urban areas. In general, the analysis described in this paper is organized by district, although in some cases, with construction zones adjacent to district boundaries, it is important to analyze the corridor on a regional basis and not stop at the district boundary.

6. Statewide Crash and Congestion Statistics

Weekly crash incidents and mile–hours of congestion for the entire interstate system (Figure 1) in Indiana are compared for a three-year period from 1 January 2019 through 31 December 2021, as shown in the longitudinal overview of the Indiana interstate system presented in Figure 2. Median traffic speeds below 45 miles per hour (mph) are considered as congested traffic conditions, which is a threshold established and utilized by multiple studies in the past [9]. Callout i in Figure 2a identifies a significant decrease in crash incidents around the end of March and April in 2020. This corresponds to the decrease in traffic on Indiana interstates after the first stay-at-home directive from the Indiana Governor effective from 24 March to 6 April 2020 [26] and further updated orders in response to coronavirus 2019 (COVID-19). Callout ii shows the rise in crash incidents in January and early February in 2021 due to severe winter storm impacts [27,28,29]. It is also noticeable from Figure 2b that weekly mile–hours of congestion peaked for the 2021 summer months (June through August), when the constructions activities are at their peak.
Figure 3 shows monthly crash incidents on the Indiana interstate over three years from 2019 to 2021. Incidents in 2020 were lowest compared to other years due to low traffic volumes on the interstate affected by COVID-19. INDOT’s traffic count station on I-65 around mile marker (MM) 186 in the northern part of the state had shown that the Average Annual Daily Traffic (AADT) dropped to 35,660 during 2020 compared to 41,898 in the year 2019 [30]. AADT values increased back to 42,476 in 2021. Crash incidents decreased during each month with an overall decrease of 31% in 2021 from 20,737 to 14,314 compared to 2019. During the months of construction activities, i.e., April through October, the crashes decreased by 21% from 10,585 to 8356 for the interstate system shown in Figure 1. Decreasing trends are hypothesized to be the benefit of institutionalizing monitoring techniques discussed in this study that use CV data and proactive interventions, such as Protect the Queue [31], that has been shown to reduce hard-braking events by 80% during the presence of a queue warning truck [24].

7. 2021 Construction Season

Longitudinal analysis of the entire interstate system shown in Figure 2 provides a broad overview of statewide congestion. Figure 4 shows a bar plot representation of weekly mile–hours of congestion stacked by interstates (Figure 4a) and stacked by INDOT districts (Figure 4b). The construction season in Indiana occurs from April through October with varying time periods depending on the project. Callout i (week of 18 May), callout ii (week of 1 June) and callout iii (week of 5 July) on Figure 4 point to the increase in congestion on I-465, I-70, and I-74, respectively, in the Greenfield district. The increased congestion was also observed to last through the upcoming weeks, indicating it to be the start of work zone activity in the area.
The three observed cases of increased mile–hours of congestion in the system-wide weekly view were further analyzed using hard-braking events and daily mile–hours of congestion by interstate and direction of travel (Figure 4 callouts i, ii, and iii). Figure 5 shows the daily mile–hours of congestion for the I-465 inner loop (Figure 5a) and outer loop (Figure 5b) stacked by different speed bins below 45 mph from April 2021 to the end of December 2021. Callout i points to the mid-May period after which the congestion had increased on I-465 in both directions. This also corresponds to the operational event where INDOT closed the North Split in downtown Indianapolis along I-70 and I-65 starting Saturday, 15 May 2021 [32]. The traffic count station on I-465 MM 18.45 had shown that AADT values increased from 121,277 in April to 132,027 in May [33]. The AADT then further increased to 151,143 in June. The weekly trend of congestion was also observed with weekends having the least mile–hours of congestion. Weekly hard-braking events were also compared over similar months. Figure 6a shows the weekly total number of hard-braking events along the I-465 inner loop direction and Figure 6c for the outer loop direction. Figure 6b shows the percentage change in hard-braking events compared to the previous week for the inner loop and Figure 6d for the outer loop. Callout i points to the same week of rise in mile–hours of congestion shown in Figure 4 and Figure 5. The percentage change in hard-braking events monitors the events over weeks and stands out in cases of significant jumps. An increase in the hard-braking threshold of 50%, denoted by the black dotted line, was used to identify any cases of significance.
Daily mile–hours of congestion and hard-braking events for callouts i, ii and iii (on Figure 4) are shown in Figure 5, Figure 6, Figure 7, Figure 8, Figure 9 and Figure 10, respectively. Callout ii on Figure 7 points to the rise in mile–hours of congestion due to the start of a repair and reconstruction project [34], on I-70 east of Indianapolis starting in June 2021 in the eastbound direction (Figure 7a) and almost a month later in the westbound direction (Figure 7b). Hard-braking events showed an almost 20% increase (callout ii in Figure 8a,b). Callout n (Figure 8) shows a higher increase in hard-braking events in both directions that corresponds to the closure of the North Split in the downtown area [32].

8. Case Study Illustrating Impact on I-70 Corridor

The previous examples provided an overview of how CV data can be used at the system level. There is also considerable benefit to analyzing individual segments of roads associated with a specific construction project. Figure 11 compares the year before construction (2020) with the year of construction (2021) in the Greenfield district for the week of 31 May. Hard-braking events for the entirety of I-70 in the eastbound (EB) --direction for every 1 mile during each week are compared with the previous week, as well as the same two weeks the year before, as shown in Figure 11. The vertical axis was set to a maximum of 150 events to observe the variation on the majority of other sections. In 2020, there were significant hard-braking events around MM 90 due to work zone operation from MM 83 to MM 96 [35] on the interstate east of Indianapolis near I-465. The callouts on Figure 11d show five 1-mile segments with the greatest increase in hard-braking events compared to the previous week (Figure 11c). All five of these segments lie within the section of interstate from MM 90 to MM 125. The same section is also observed to have a significant increase by 138% in hard-braking events overall. An increase in hard-braking events is considered to be a surrogate for an increase in crash risk severity on the interstate [16]. The week-by-week view of hard-braking events by 1-mile segments for the entire interstate identifies smaller sections of the interstate that are showing a significant rise in these events compared to the previous weeks.
Daily hard-braking events and mile–hours of congestion over four weeks for the identified section of I-70 from MM 90 to MM 125 are compared in Figure 12. The mile–hours of congestion are stacked by different speed bins below 45 mph. The increase in both mile–hours of congestion and hard-braking events are observed to be consistent starting from Tuesday, 1 June 2021. The start date of lane closures and alterations to traffic patterns is confirmed from INDOT’s news release [35] for roadwork on this section of interstate.
Spatial–temporal traffic speed heatmaps were also developed to provide granular view of the traffic conditions, crash incidents and hard-braking events. Figure 13 shows one such heatmap for I-70 EB from MM 90 to MM 125 for the one-week period from Monday, 31 May to Sunday, 6 June (Figure 11d). Callout i shows the change in the traffic patterns from Tuesday, 1 June, 2021. Traffic speeds were below 15 mph, forming a queue for approximately 5 miles downstream of MM 108. Traffic was also moving slowly (speeds below 45 mph) upstream of this location for approximately 8 miles. The traffic delay patterns were also observed to repeat for the rest of the week. Four crash incidents were also observed around the work zone region. Excessive braking was observed to be occurring at the back of the queue (events touching the pink region), inside the queue (events inside the pink region) or while traversing through the work zone. Over the six days, a total of 291 hard-braking events related to the work zone are observed, with 44% occurring at the back of the queue, 13% inside the queue and the remaining 43% while traversing through the work zone. The black horizontal line represents the exit locations on the interstate. Some hard-braking events are observed at these exit locations, which are unrelated to the work zone operations.
The analysis thus far provides a statewide overview of the entire system and presented systematic methodologies to identify areas of concern or potential high-risk sections of interstate by integrating CV data with other emerging data sources. Weekly reports comprising of this analysis were distributed during the 2021 construction season and were actively utilized by contractors and INDOT officials to aid in their decision making and scheduling of queue warning trucks.

9. Median Cross over Case Study I

Cross overs were identified as a relatively high driver workload activity. Two case studies from the 2021 construction season relating to median cross overs are presented that show the applicability of methodologies using CV data. All the prescribed guidelines in the Indiana Design Manual were followed during the setup of these work zones.
Figure 14 shows an image captured while entering the median cross over at MM 154.4 on the I-65 northbound (NB) direction. Callout s shows the skid marks ahead of the cross over on the interstate, indicating vehicles excessively braking at the horizontal curve. Figure 15 shows the speed comparison during the cross over for a week from 12 April to 18 April (Figure 15a) and after the end of the operation for a week from 3 May to 9 May (Figure 15b) along the 10 mile segment from MM 150 to MM 160 on I-65 NB. Callout s points to the same location as skid marks from Figure 14. Speeds were observed to drop more than 25 mph around this location during the cross over operation. The speeds dropped and picked back up within a 0.8–1 mile stretch of interstate also with lane shifting illustrating high driver workload [36,37,38] and potential sudden braking.
Figure 16 shows monthly hard-braking events from May 2020 to October 2021 across the I-65 NB direction at the Manson and Colfax area from MM 150 to 160. Hard-braking events data were not available for January 2021 through March 2021. The cross over operation shown in Figure 14 was operational during the month of April up until Friday, 23 April. Callout i points to the increase in hard-braking events in April 2021 for a total of 951 events. During the months of May through December 2020 before the cross over, there were only 191 average monthly hard-braking events. After the cross over had ended, the average monthly hard-braking events dropped by 49.8% to 477 per month from May 2021 to October 2021, although it was still higher than the pre-construction average. The average monthly unique trajectories before, during crossover and after return to normal remained around 0.1, 0.11 and 0.12 million, respectively. The reduction in hard-braking events directly correlates to crash incidents [16]. The early warning signs shown in hard-braking events caught practitioners’ attention to take corrective measures at the earliest opportunity to improve safety.
Figure 17 shows hard-braking events by 1-mile stretches of interstate between MM 150 and MM 160 along I-65 NB before cross over (week of 21 December, Figure 17a), during cross over (week of 5 April, Figure 17b) and after the cross over (week of 3 May, Figure 17c). Callout s points to the same location as skid marks shown on Figure 14 with more than 150 hard-braking events over a one week period.
Two crash incidents were also observed at this work zone on 4 April and 11 April. Figure 18 shows the traffic speed heatmap on incident days from MM 145 to MM 160 on the I-65 NB direction. The first incident on 4 April (Figure 18a) occurred around 11:00 AM in morning, resulting in stopped or slow-moving traffic for about 1.5 h. This incident caused queuing over 7 miles downstream of the work zone. The second incident on 11 April (Figure 18b) occurred at 2:30 PM in the afternoon and stopped traffic for about 2 h. This incident also caused queuing for about 8 miles. The early actions taken might have prevented such incidents at the location. Indiana DOT adopted the early warning signs on this I-65 work zone and worked with contractors to make adjustments to temporary barrier wall arrangements and temporary pavement markings.

10. Median Cross over Case Study II

Another case study was presented from median cross over on I-70 EB around MM 66.4. Hard-braking events before and after the traffic was diverted are shown in Figure 19. Callout i points to the month of September 2021 during which median cross over was active. Monthly hard-braking events increased during this month by almost 33% to 200 from around 150 before and after months. The existing hard-braking events were related to the interstate exit also present at MM 66.
Three significant crash incidents on 4 September, 3 October, and 24 October during this cross over operation on I-70 EB are shown in Figure 20 with associated camera images C1, C2 and C3. The queue lengths propagated for approximately 7 miles (Figure 20a), 6 miles (Figure 20c) and 14 miles (Figure 20e), respectively. The scene clearance time lasted for about 10, 7 and 13 h, respectively. The incidents caused a significant amount of queuing and traffic delays. The Indiana DOT took immediate actions on this I-70 work zone to modify the temporary concrete barrier-to-guardrail transition. Case studies such as this demonstrate the use of CV data for operational data-driven decision making.
Early warning signs can be detected by tracking newly set up work zones on interstates for a few weeks using the performance measures described. The availability of the data makes this methodology easily scalable and adaptable for work zones on highways anywhere in the United States. This also presents a national-level opportunity for assessing and providing feedback to followed design procedures.

11. Summary of Workflow

With most states having several hundred miles of geographically distributed work zones, it is important to have both methodological processes for analyzing the CV data and a workflow that provides for timely review by humans of areas identified for further evaluation. The integration of human review into the workflow in Indiana is as follows:
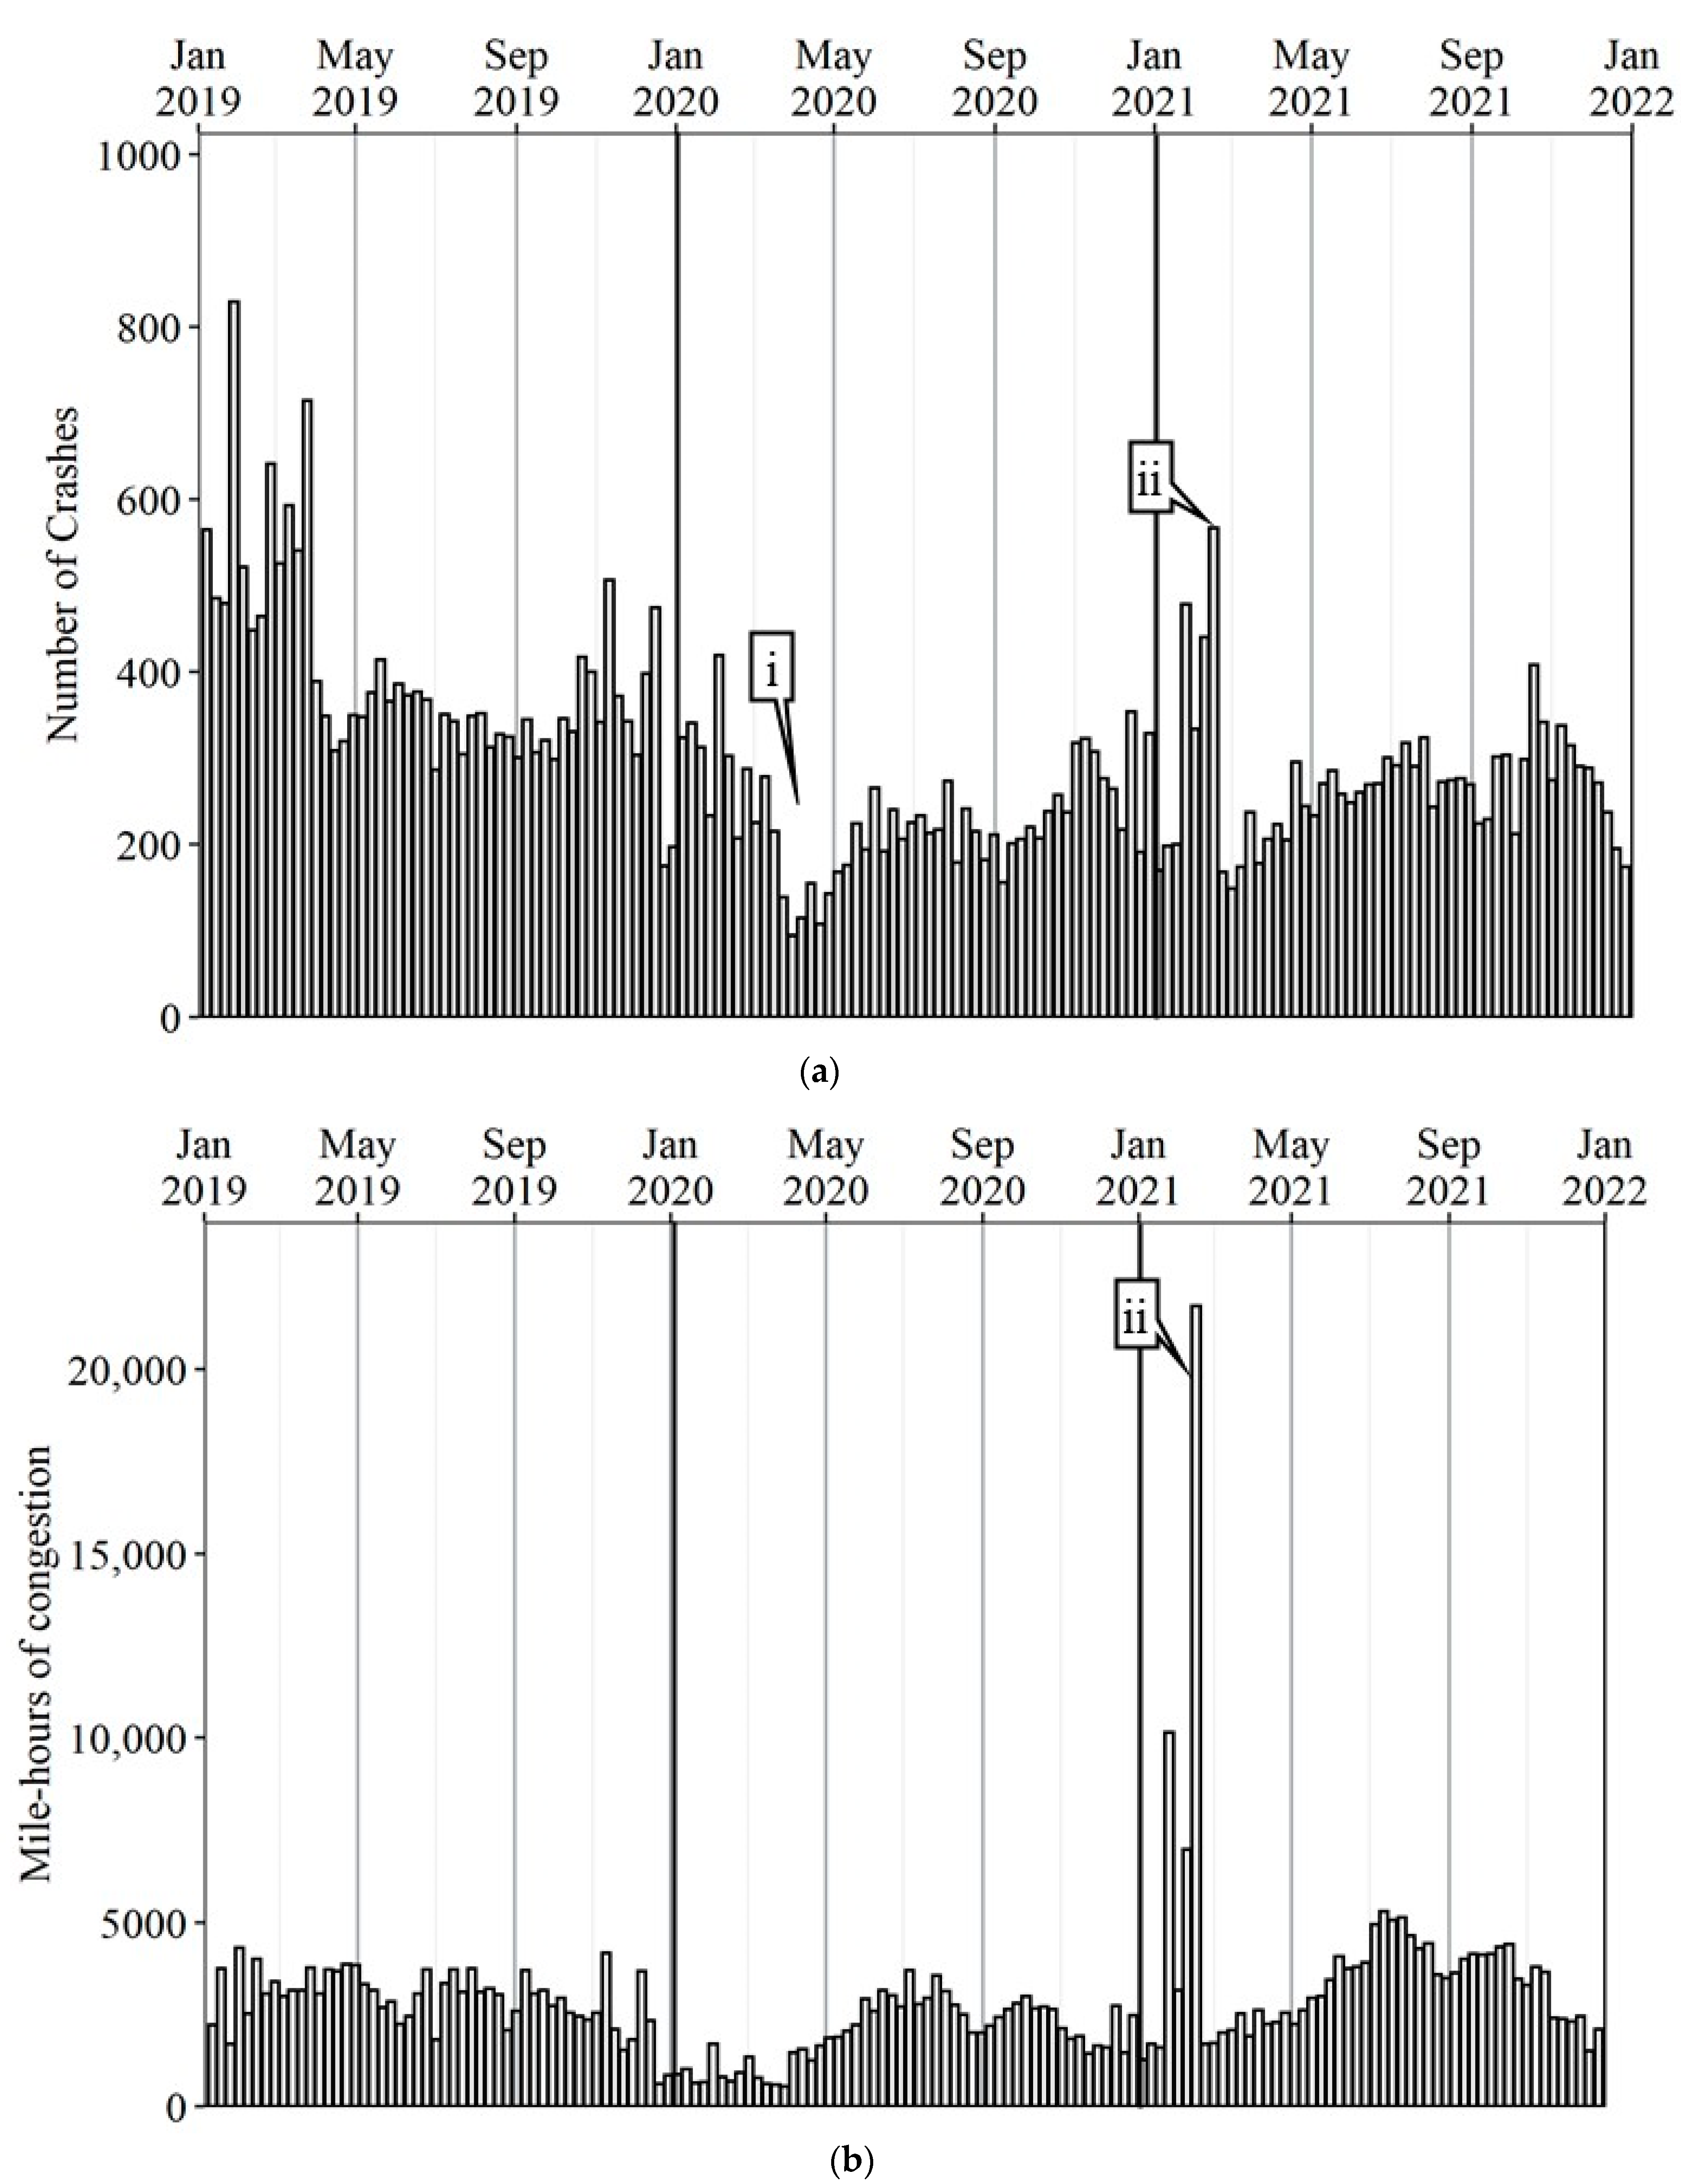
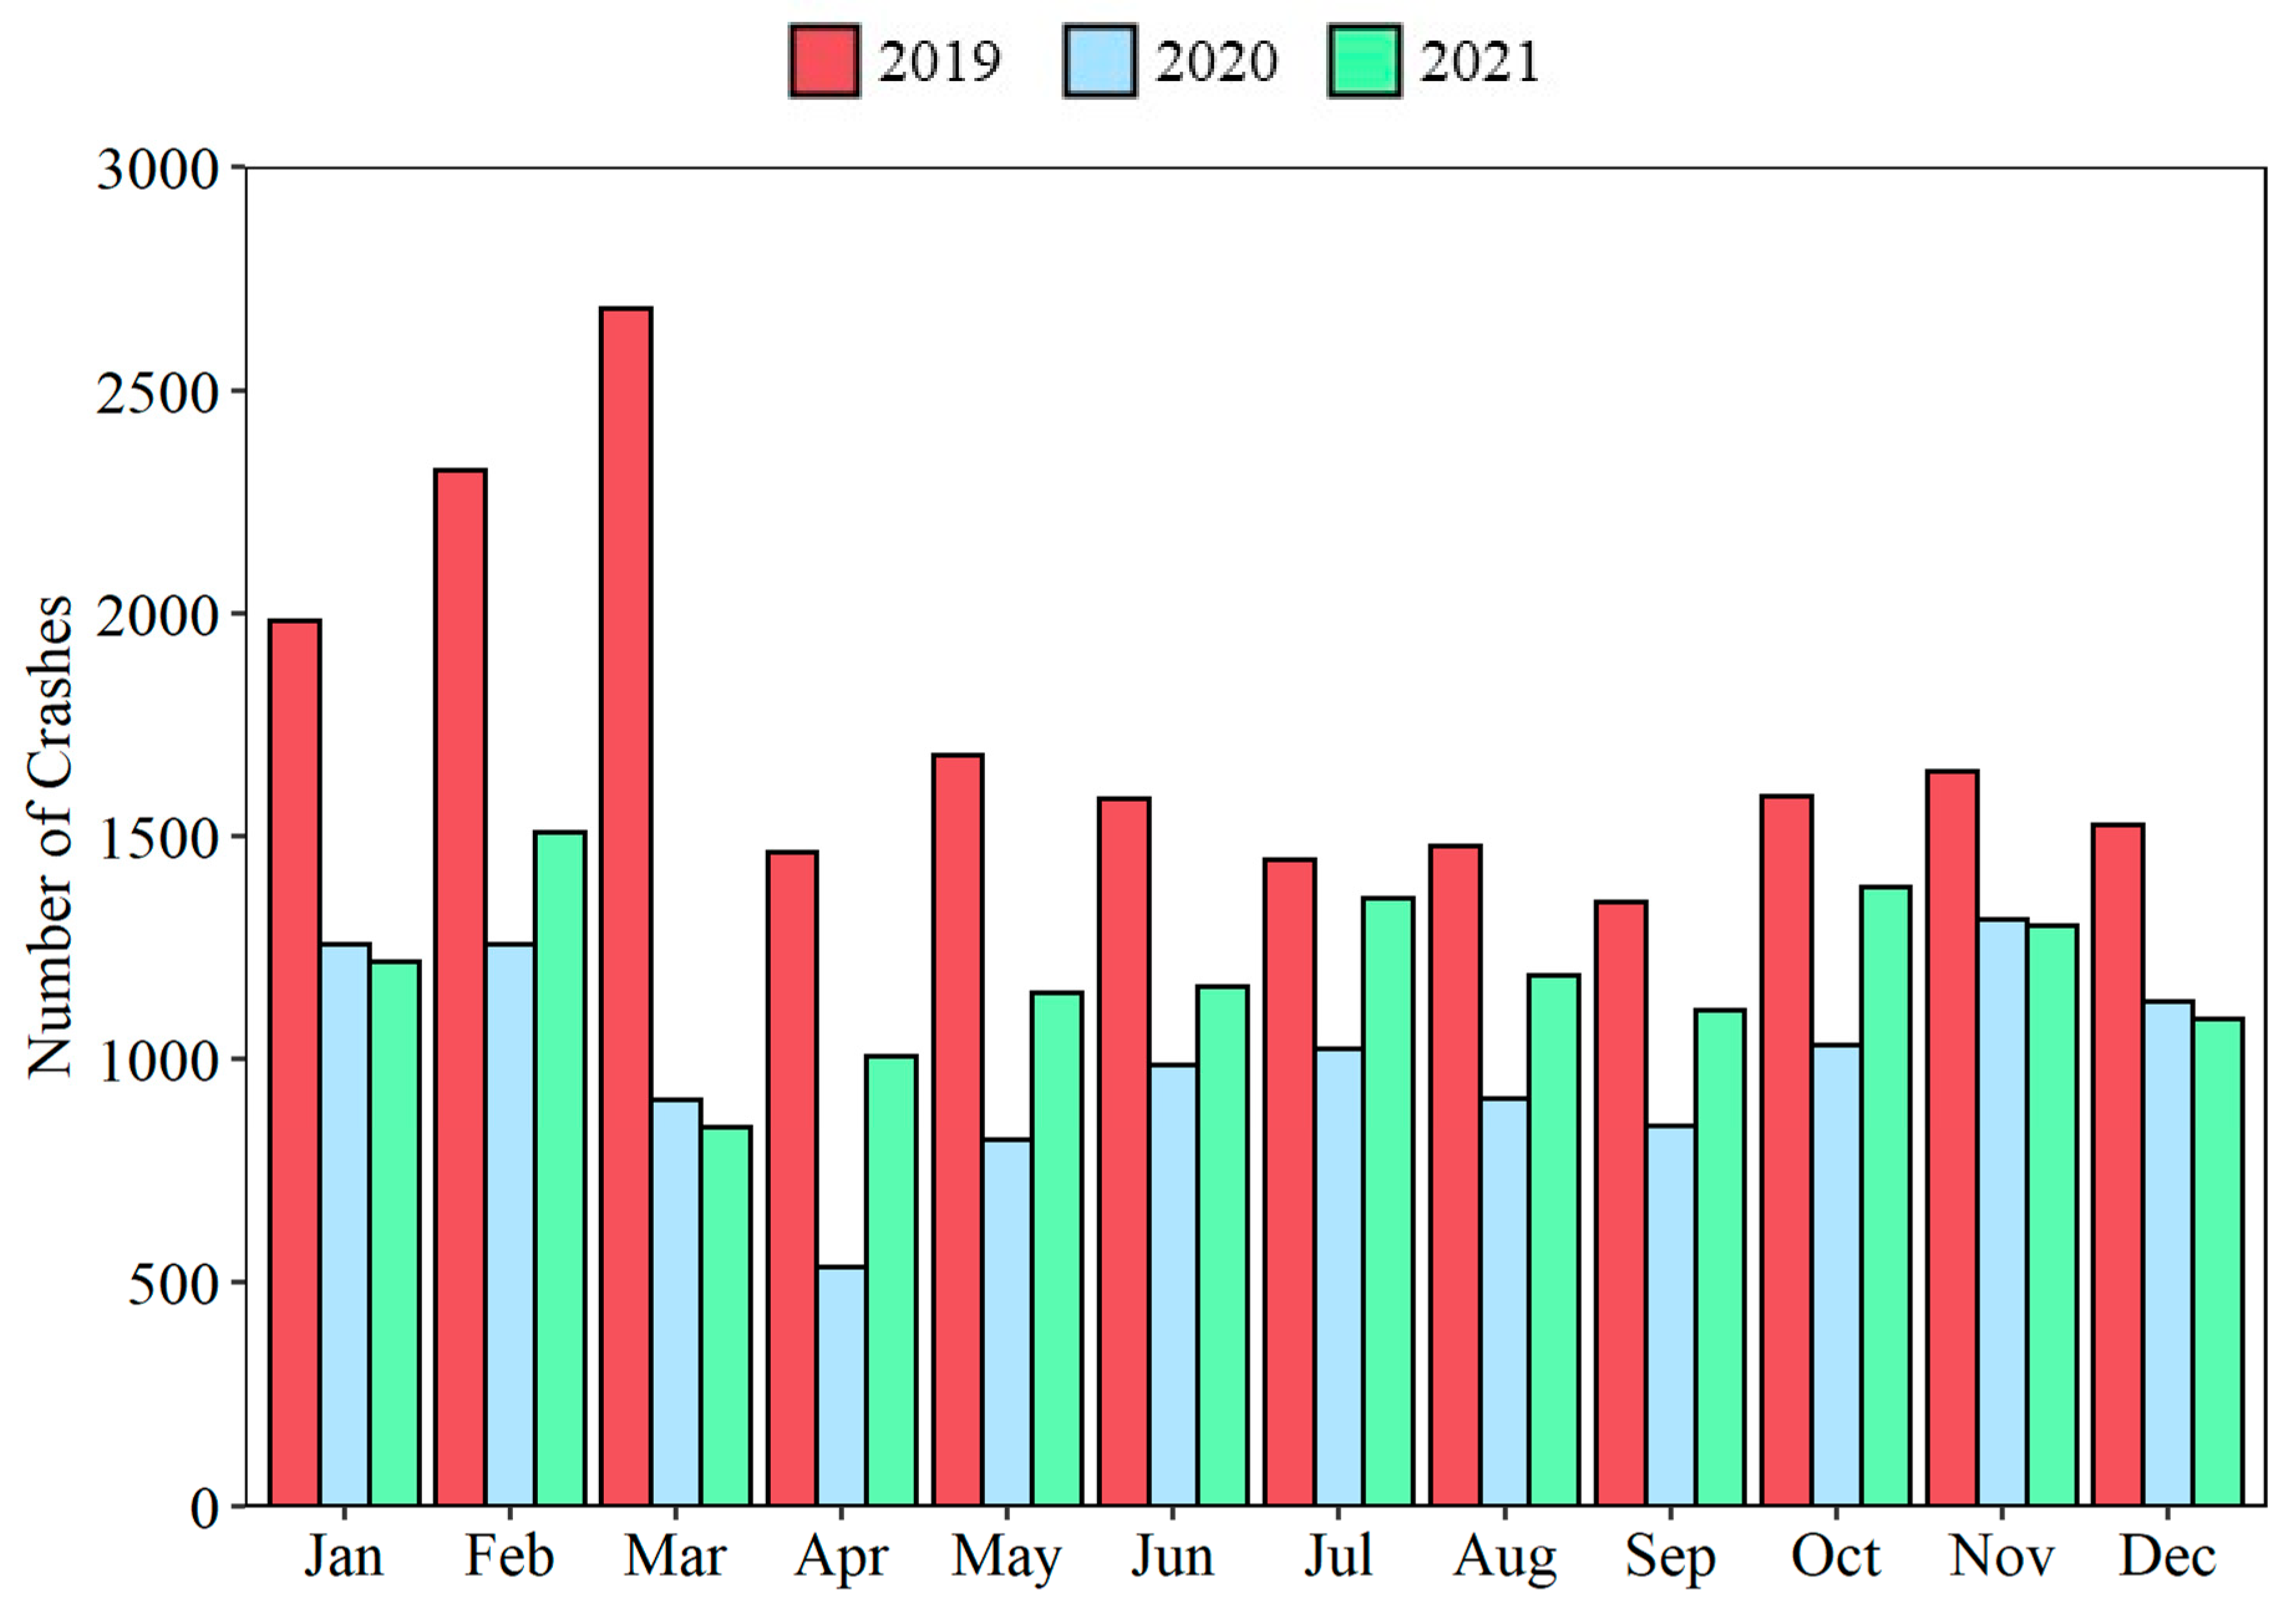
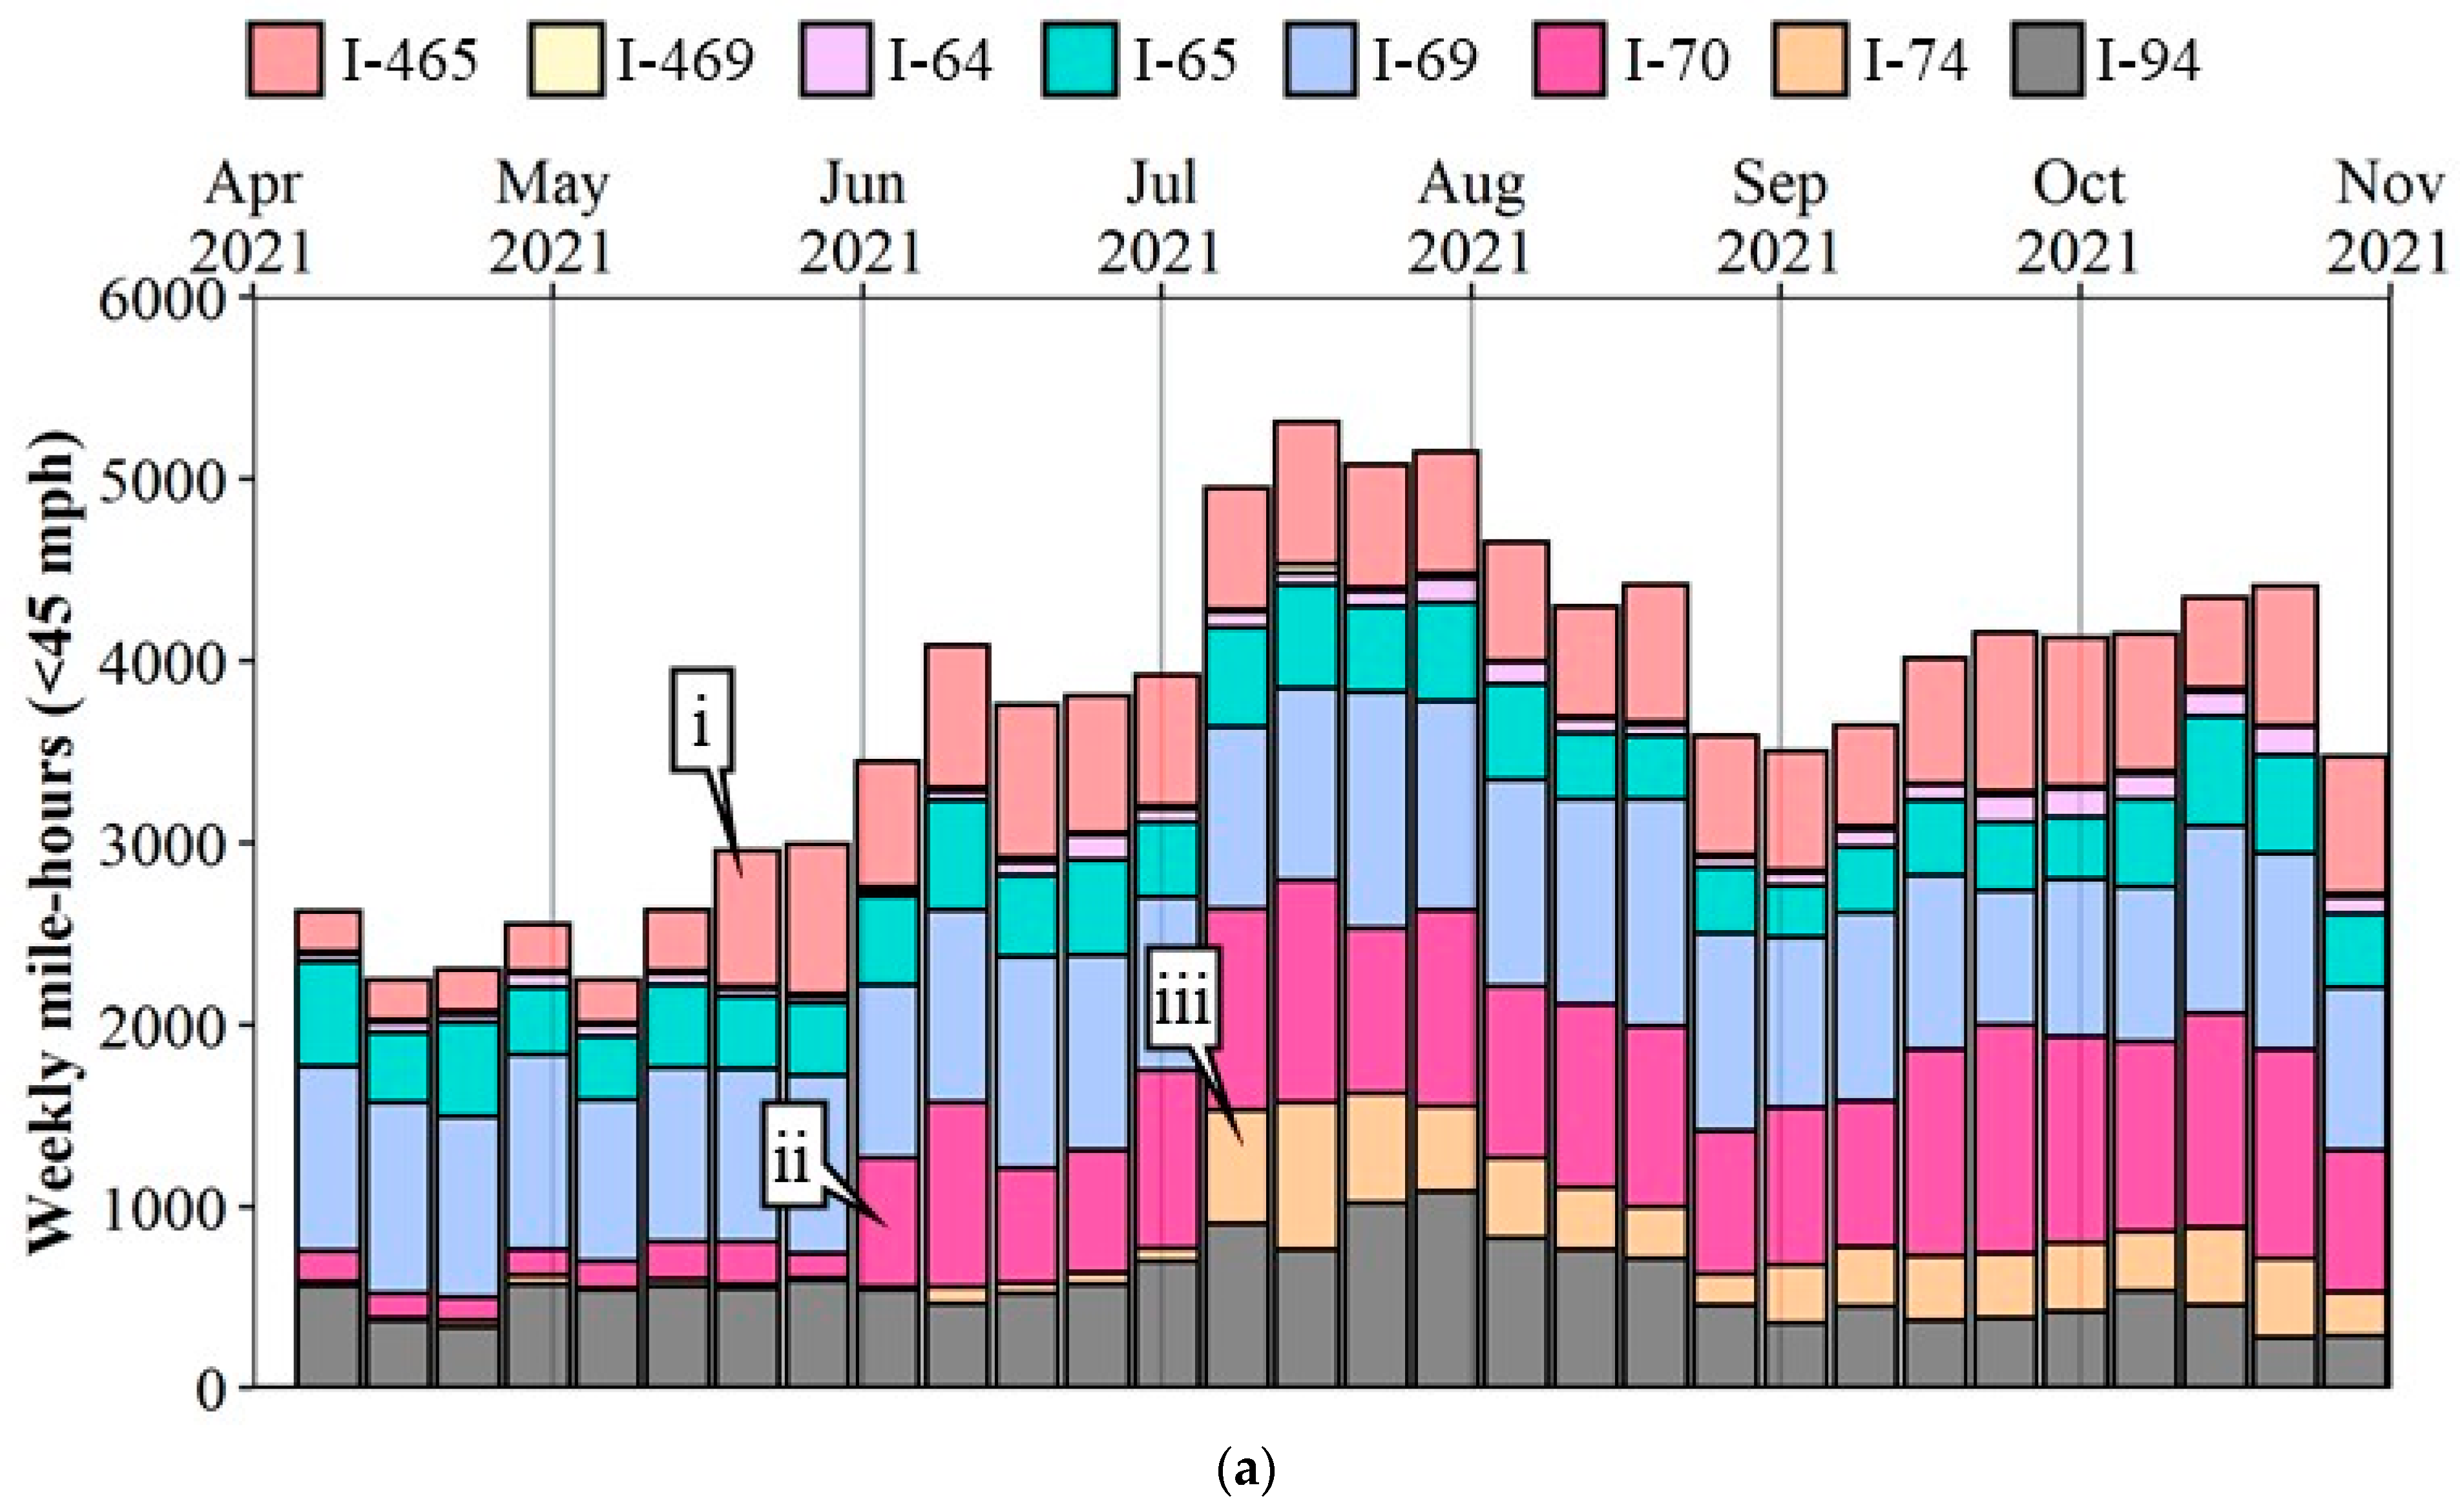
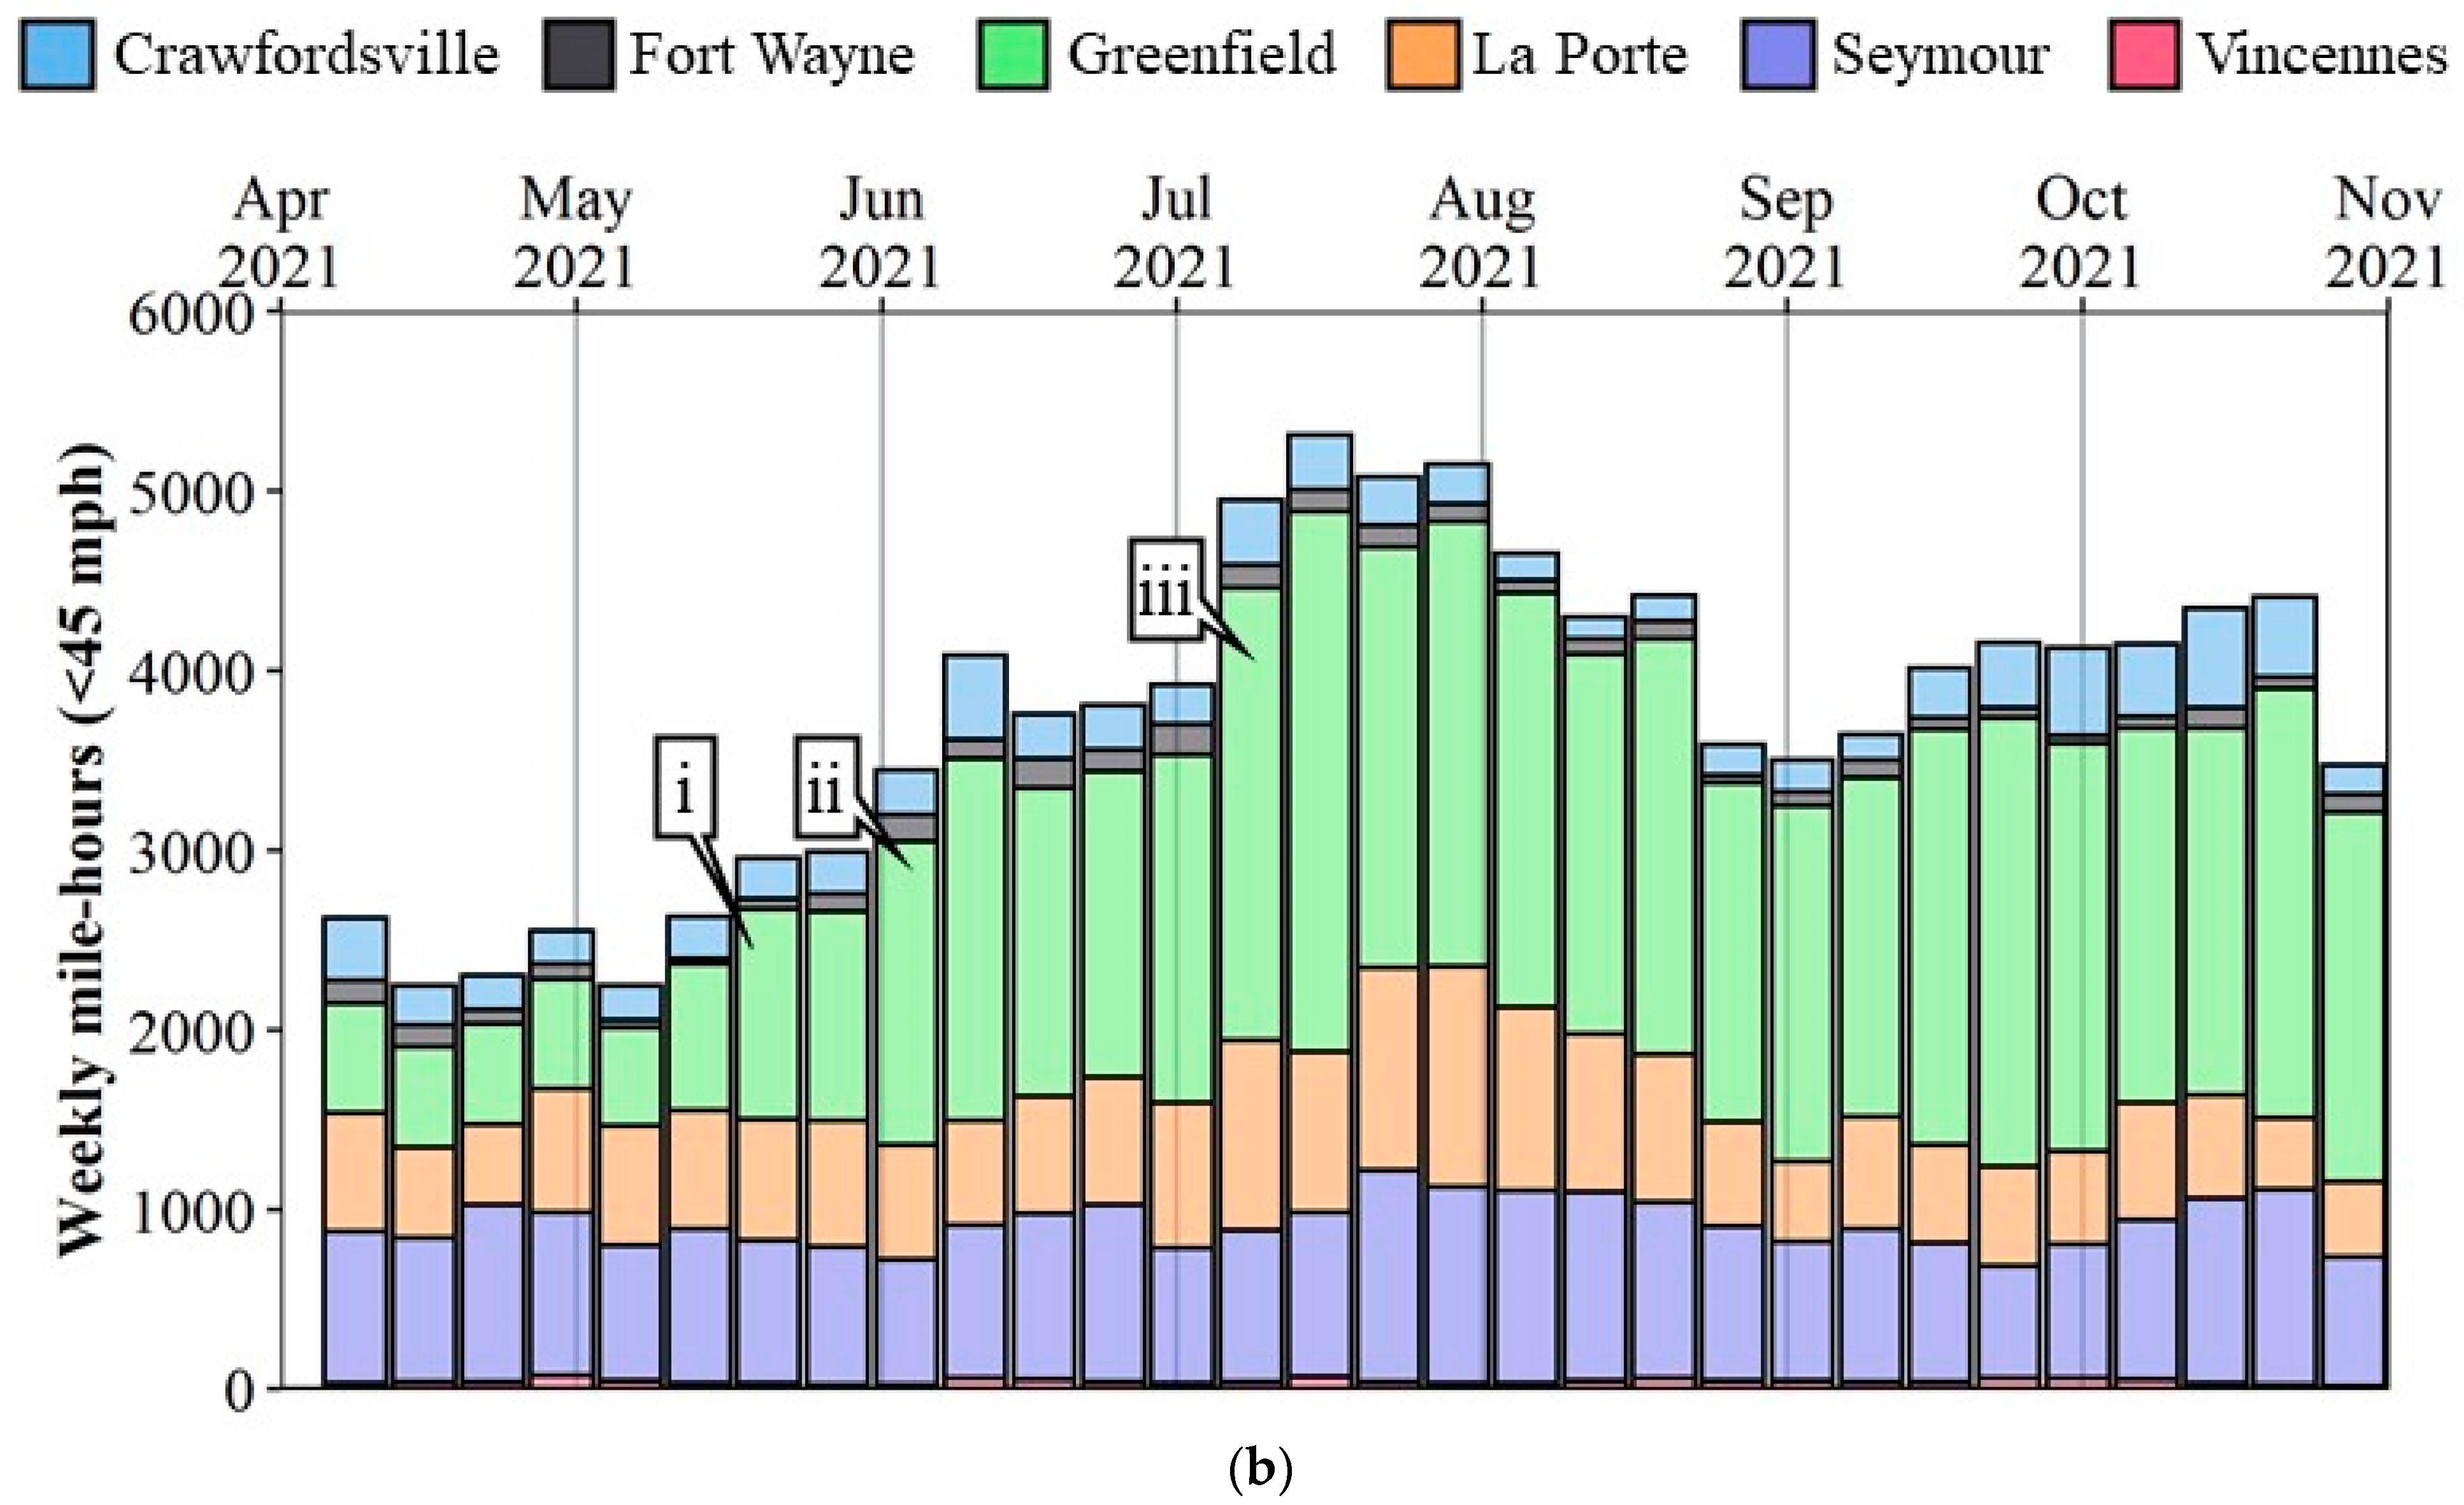
  • System wide, multi-year, longitudinal assessment of congestion (Figure 2) and crashes (Figure 3) provide important data and graphics for engineers to identify emerging trends. To identify areas to focus on, it is important to look at weekly changes by both Interstate Corridor and geographic district (Figure 4).
  • Tactical level analysis can then be performed by examining interstate-specific delays by direction (Figure 5) and corresponding hard-braking events (Figure 6).
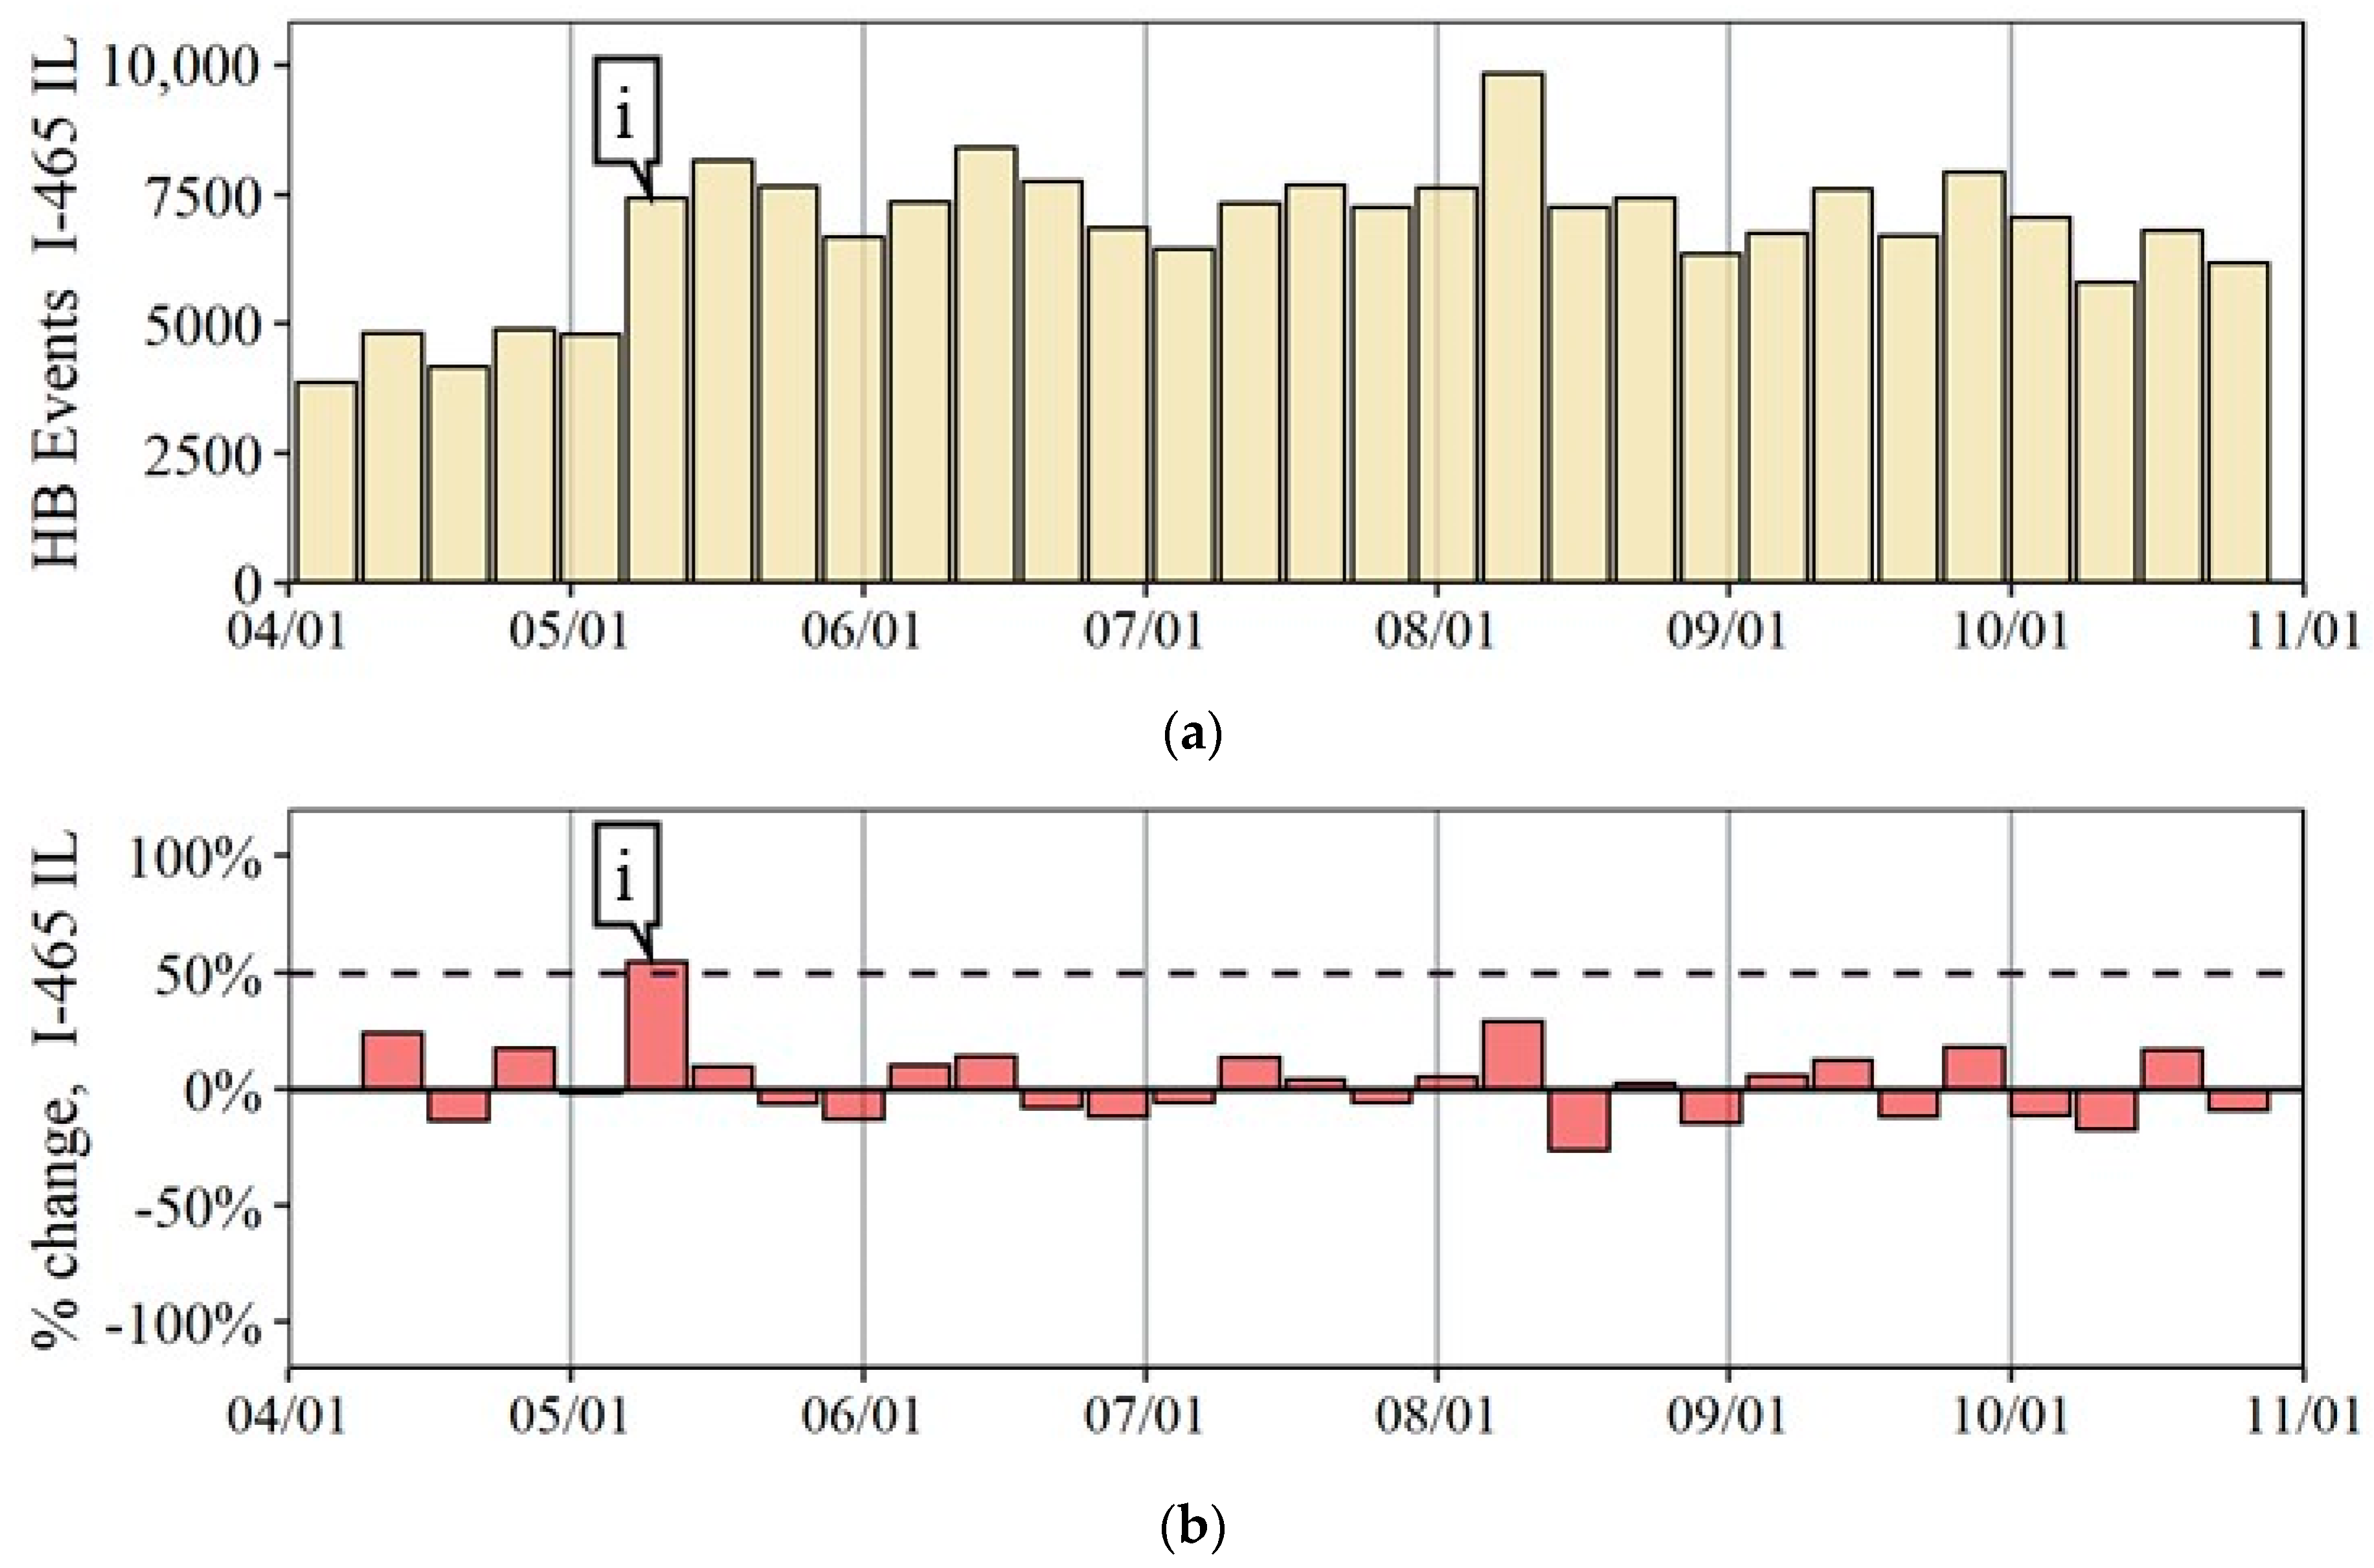
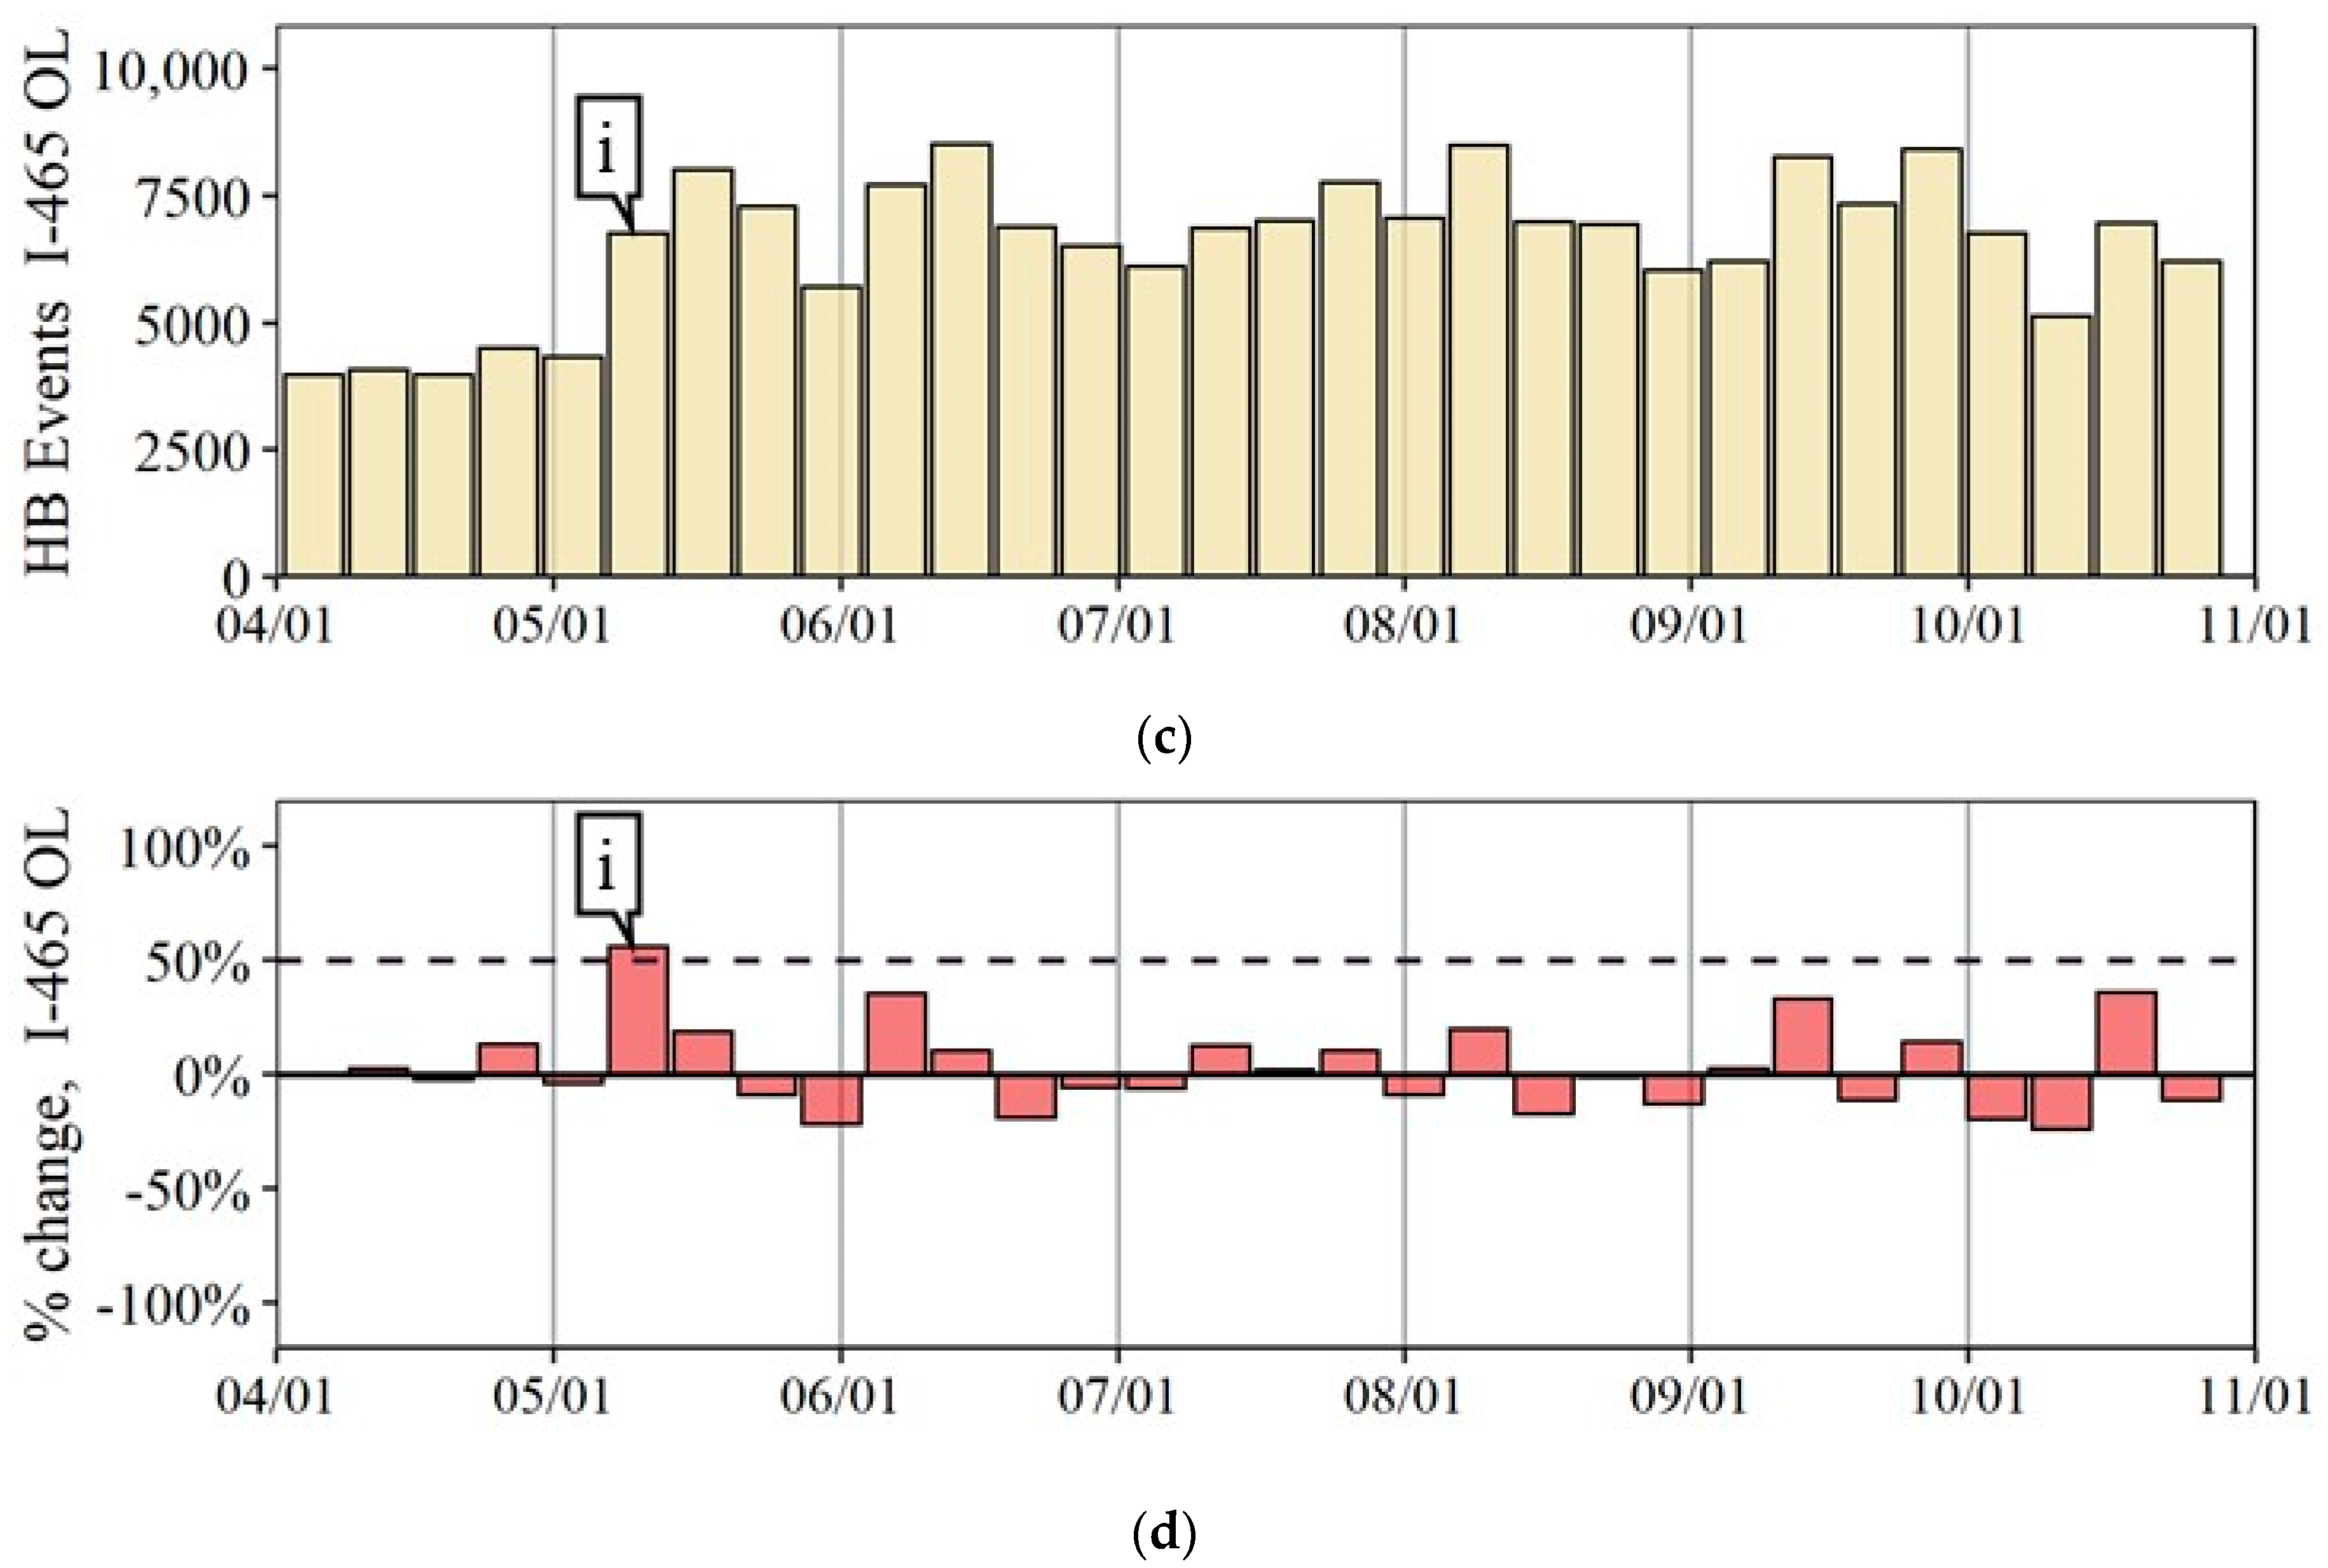
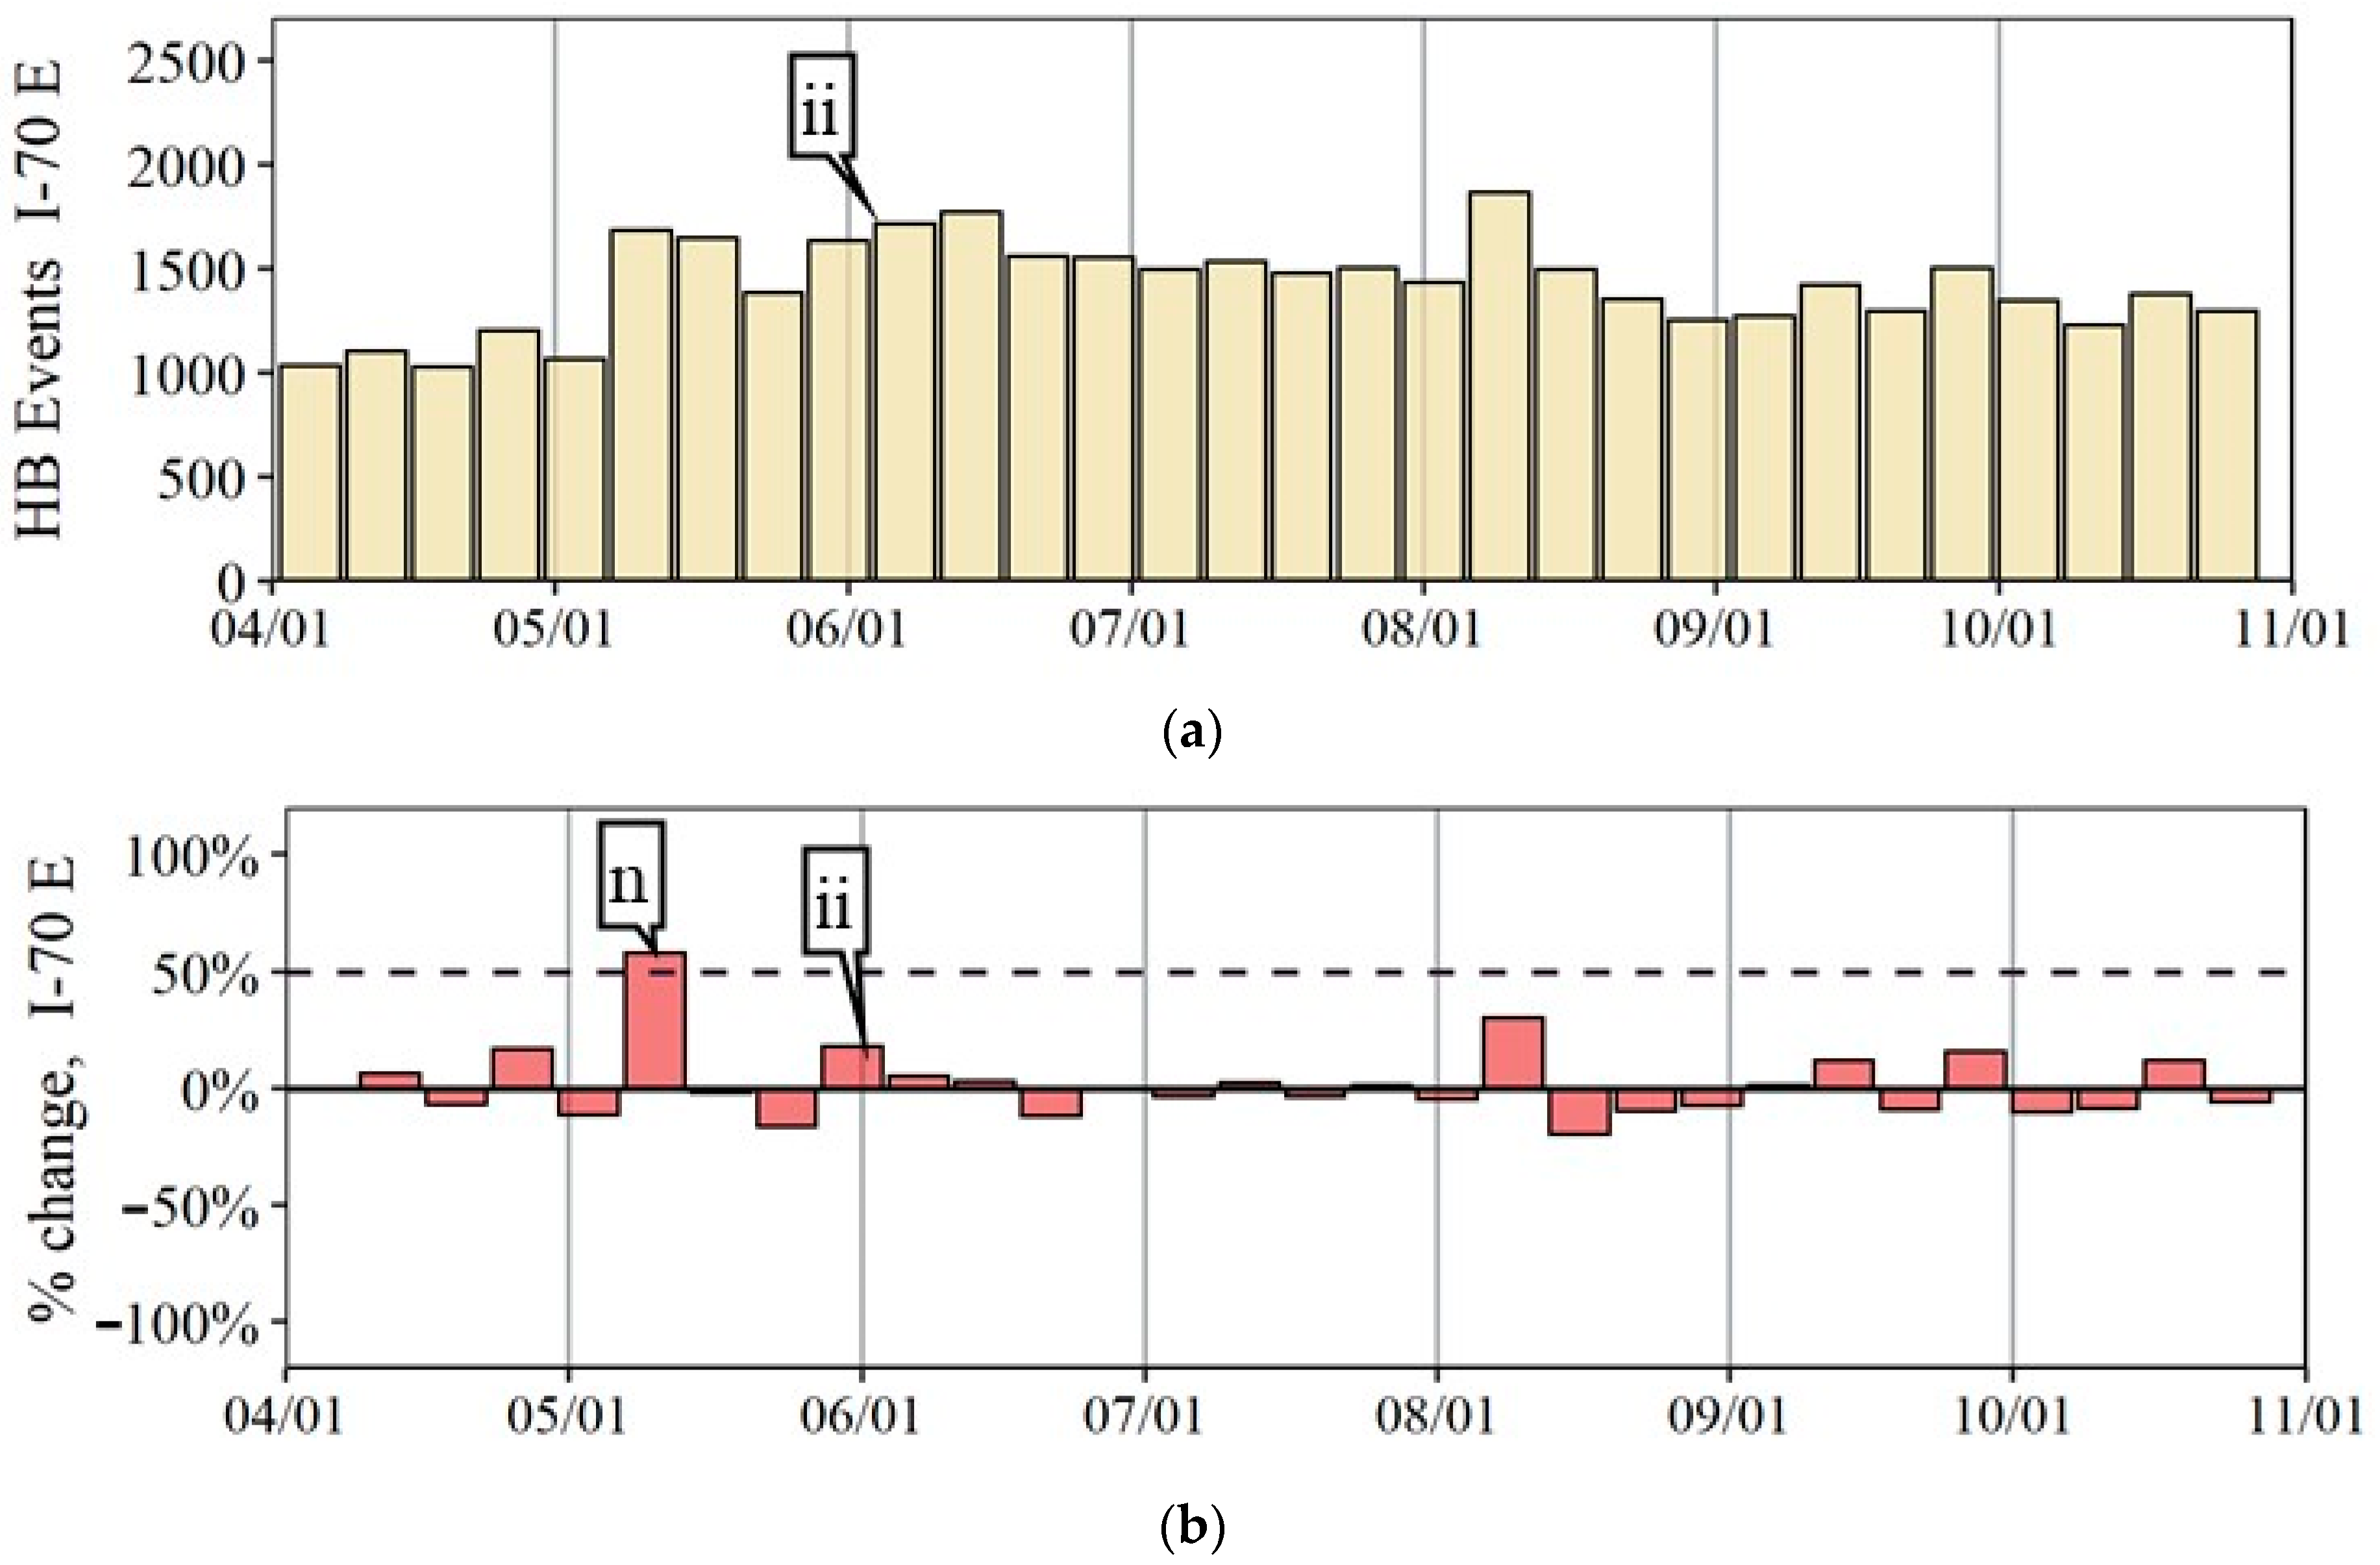
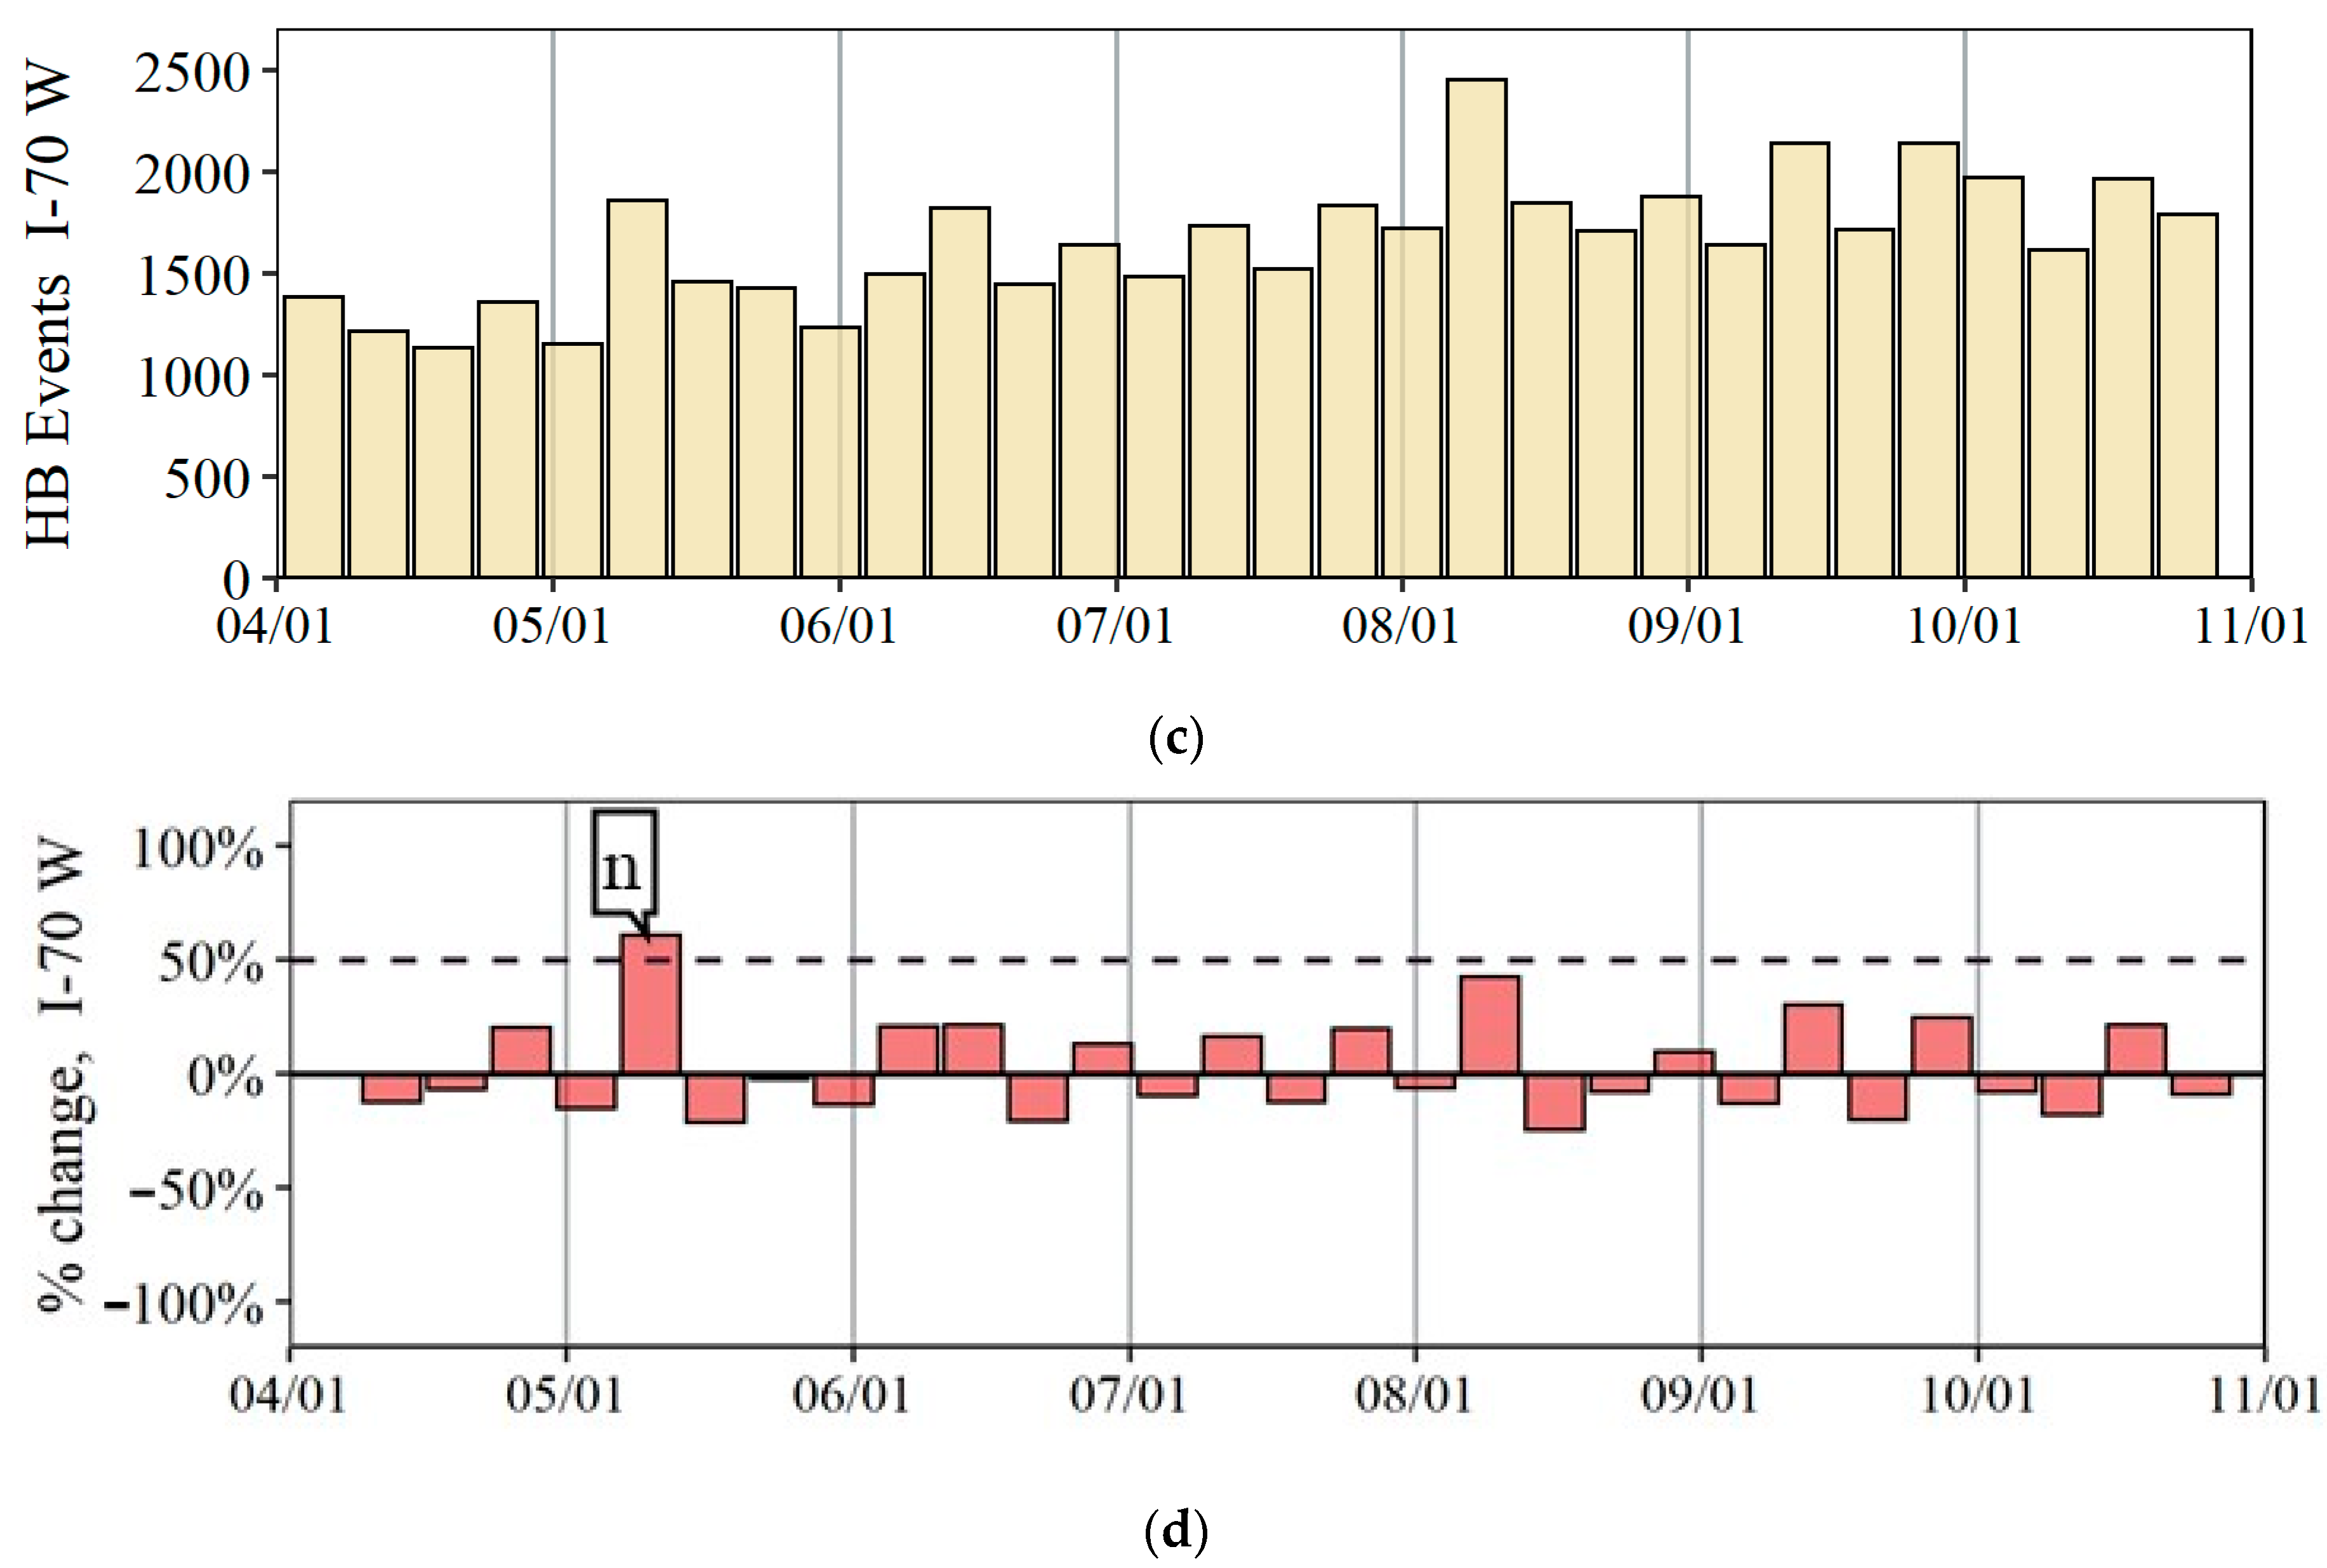
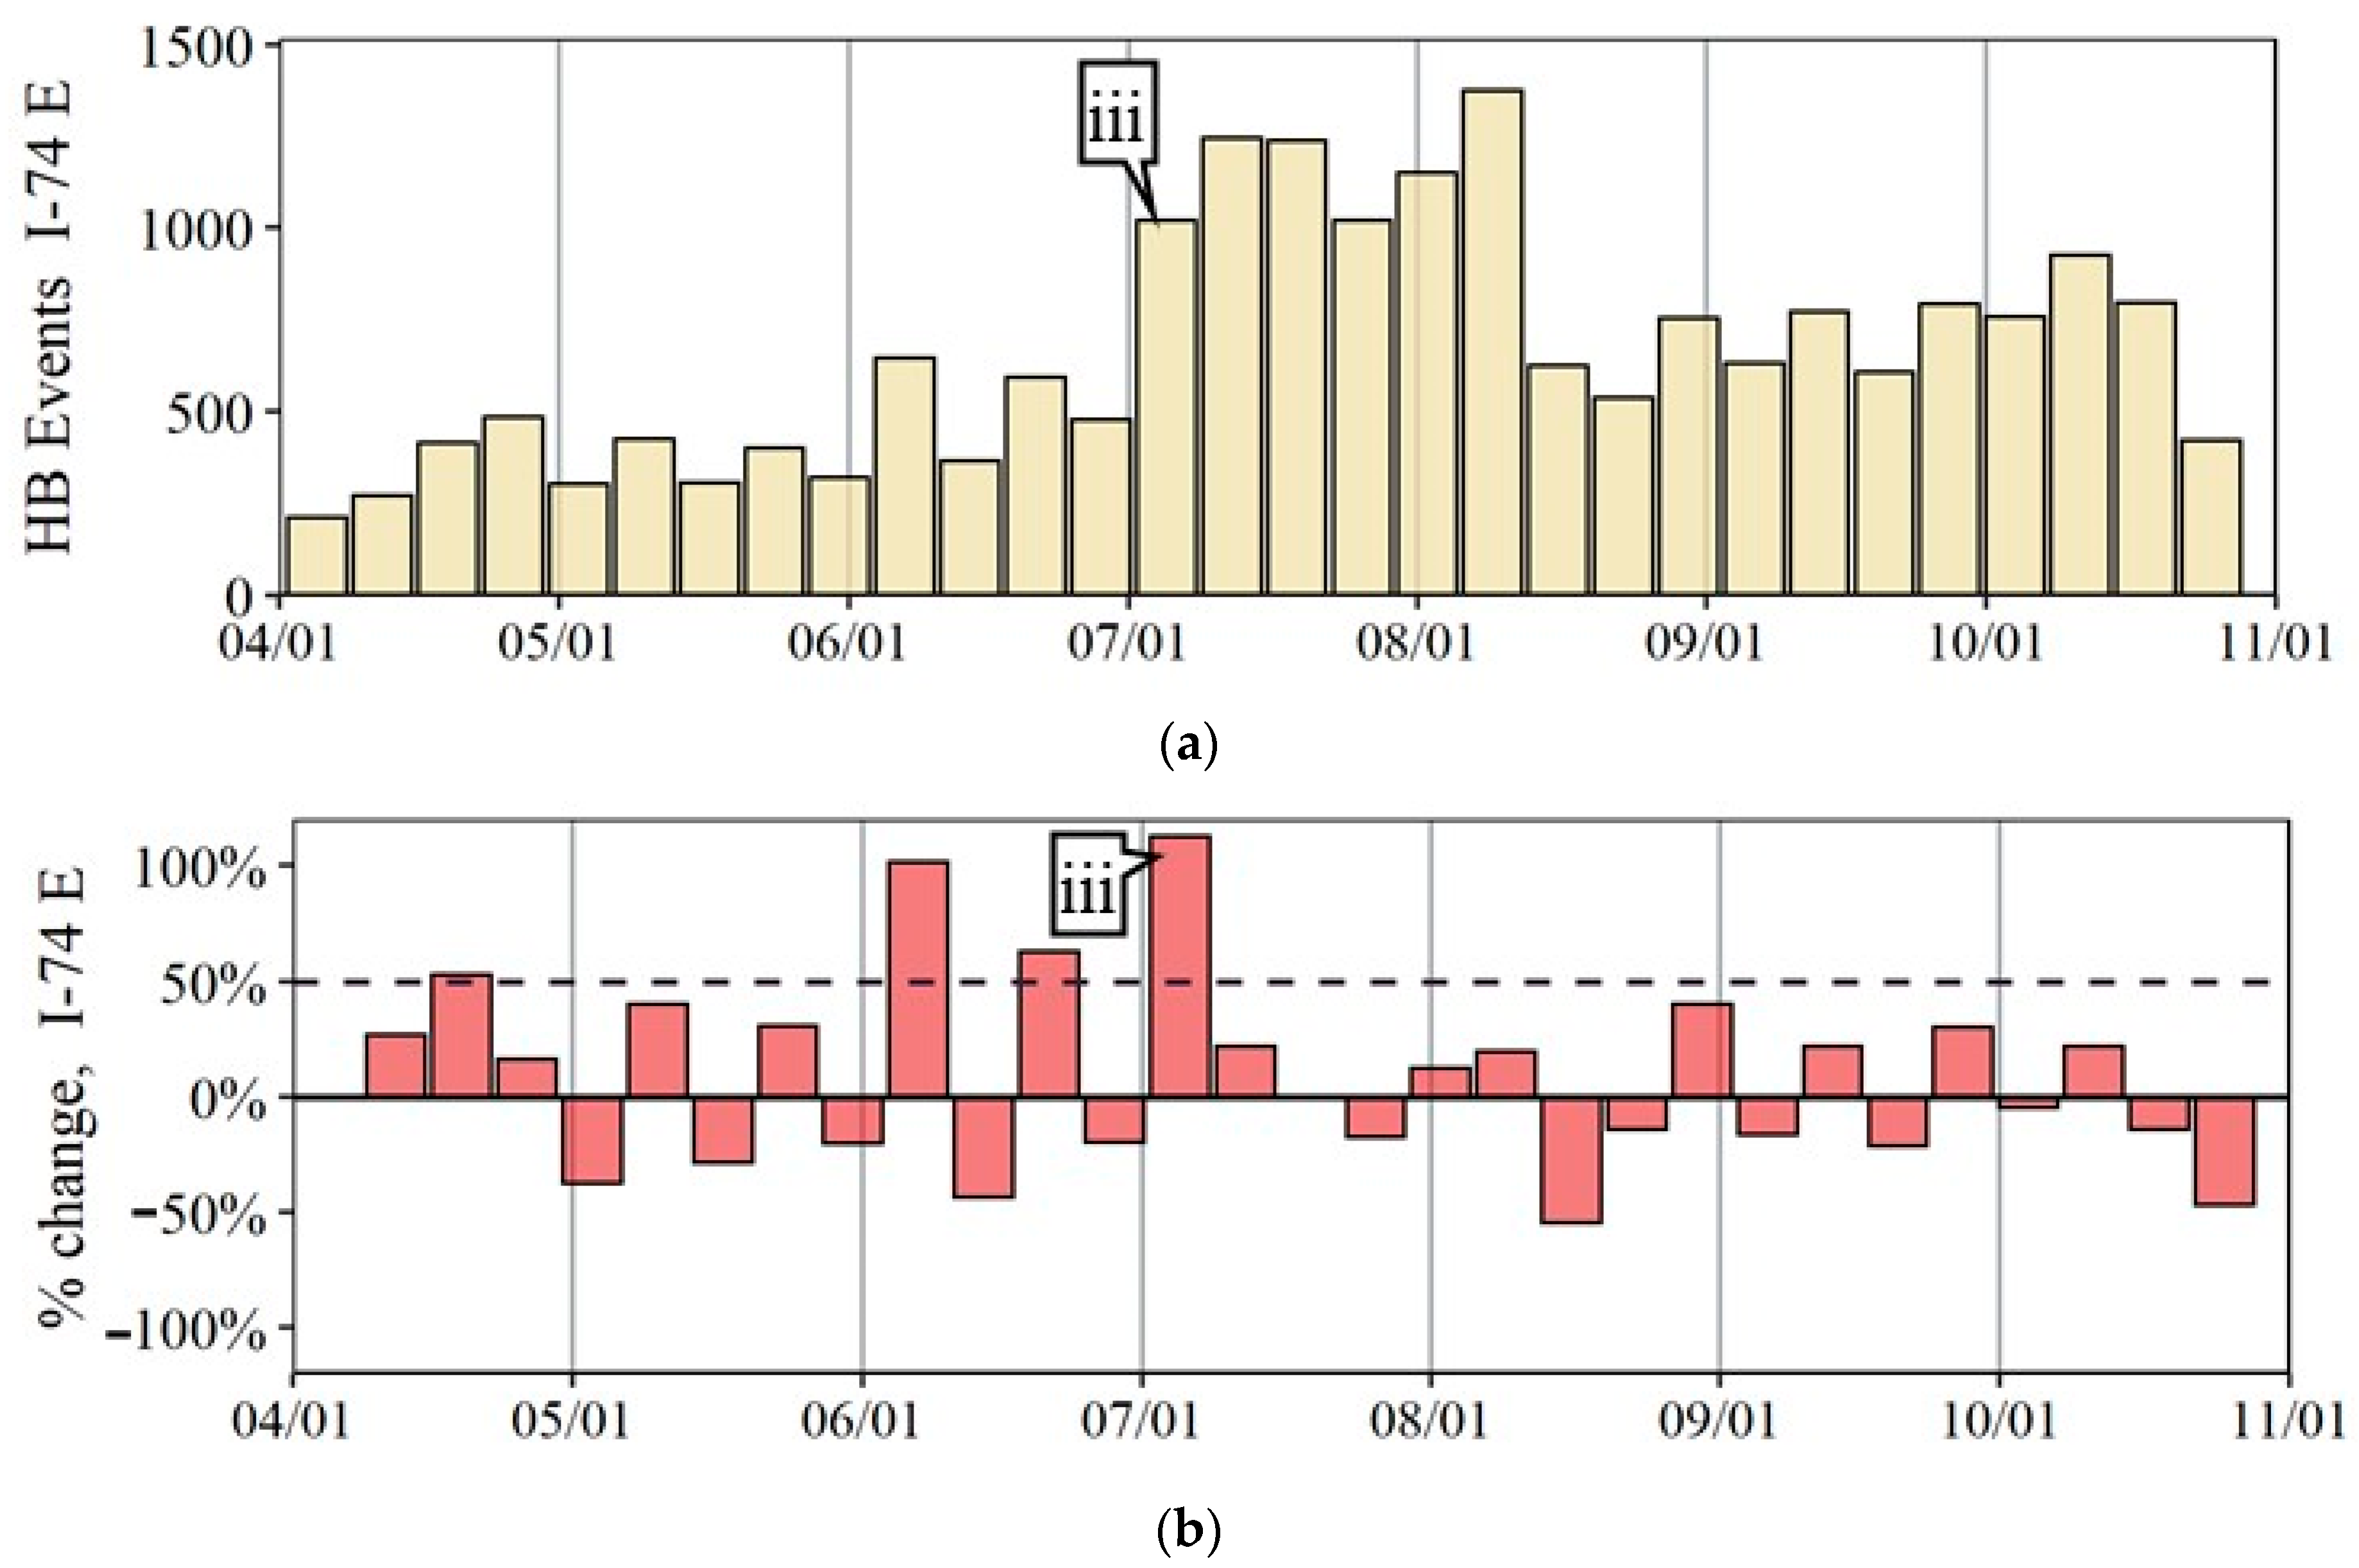
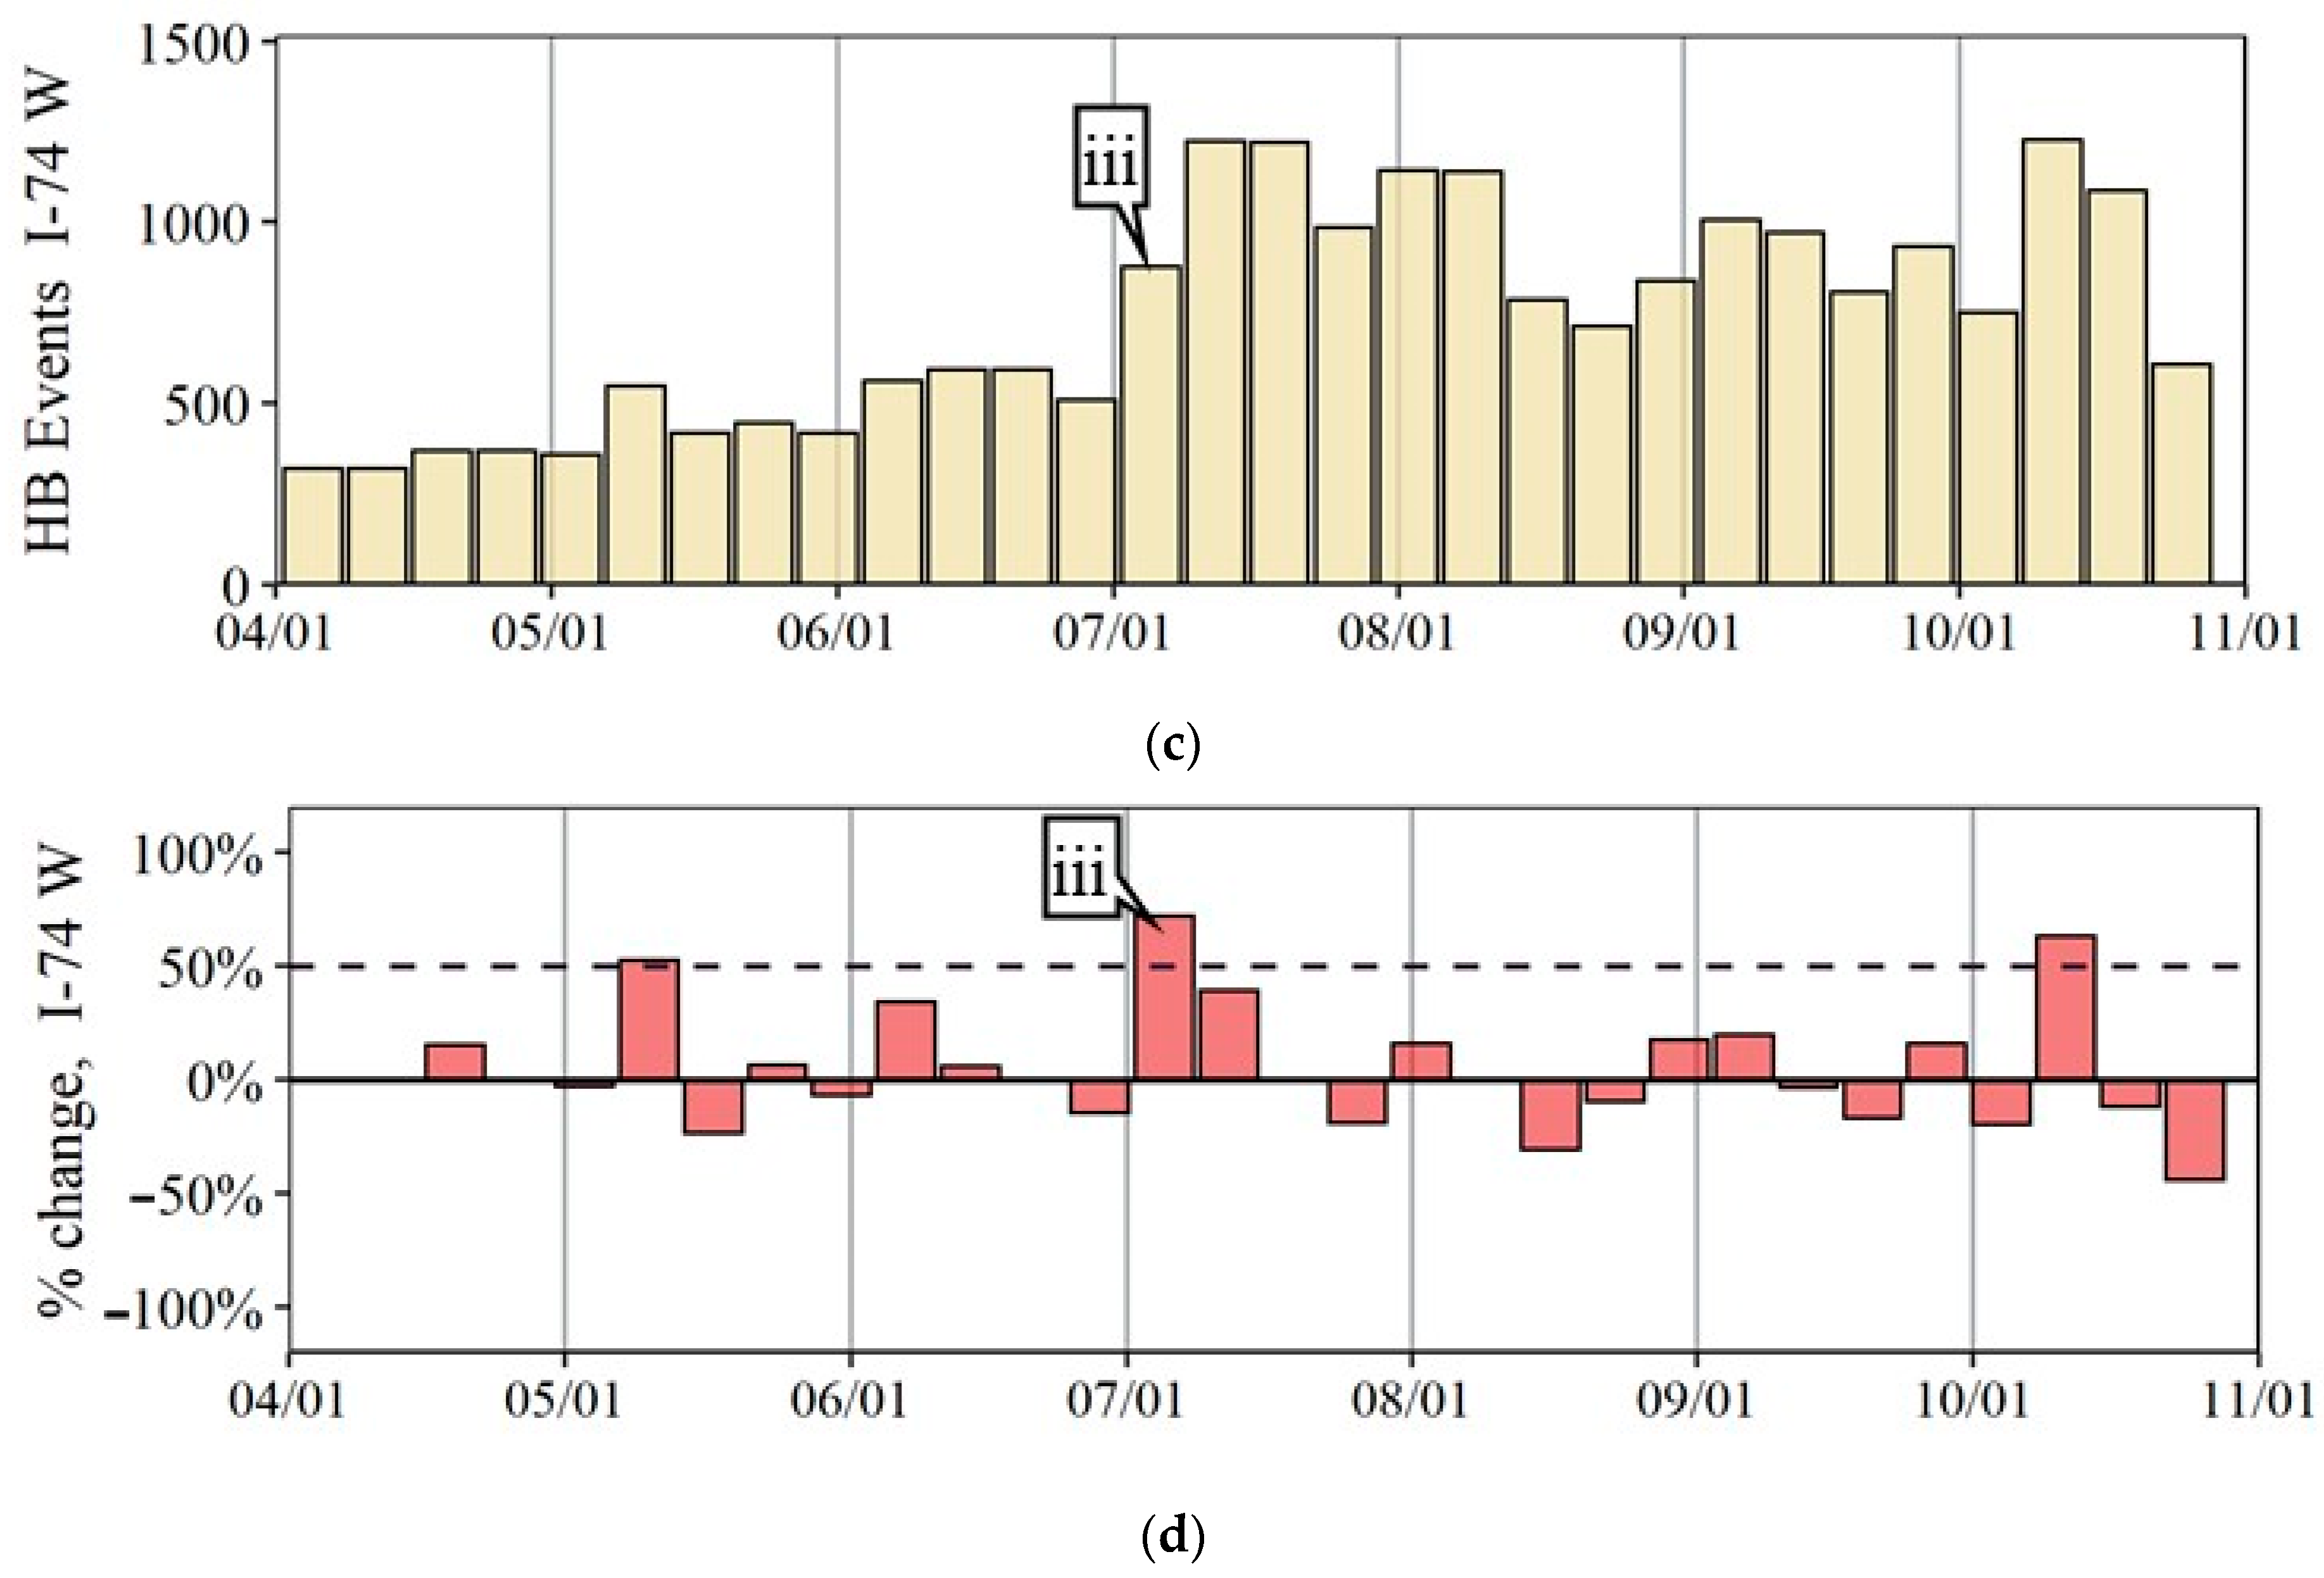
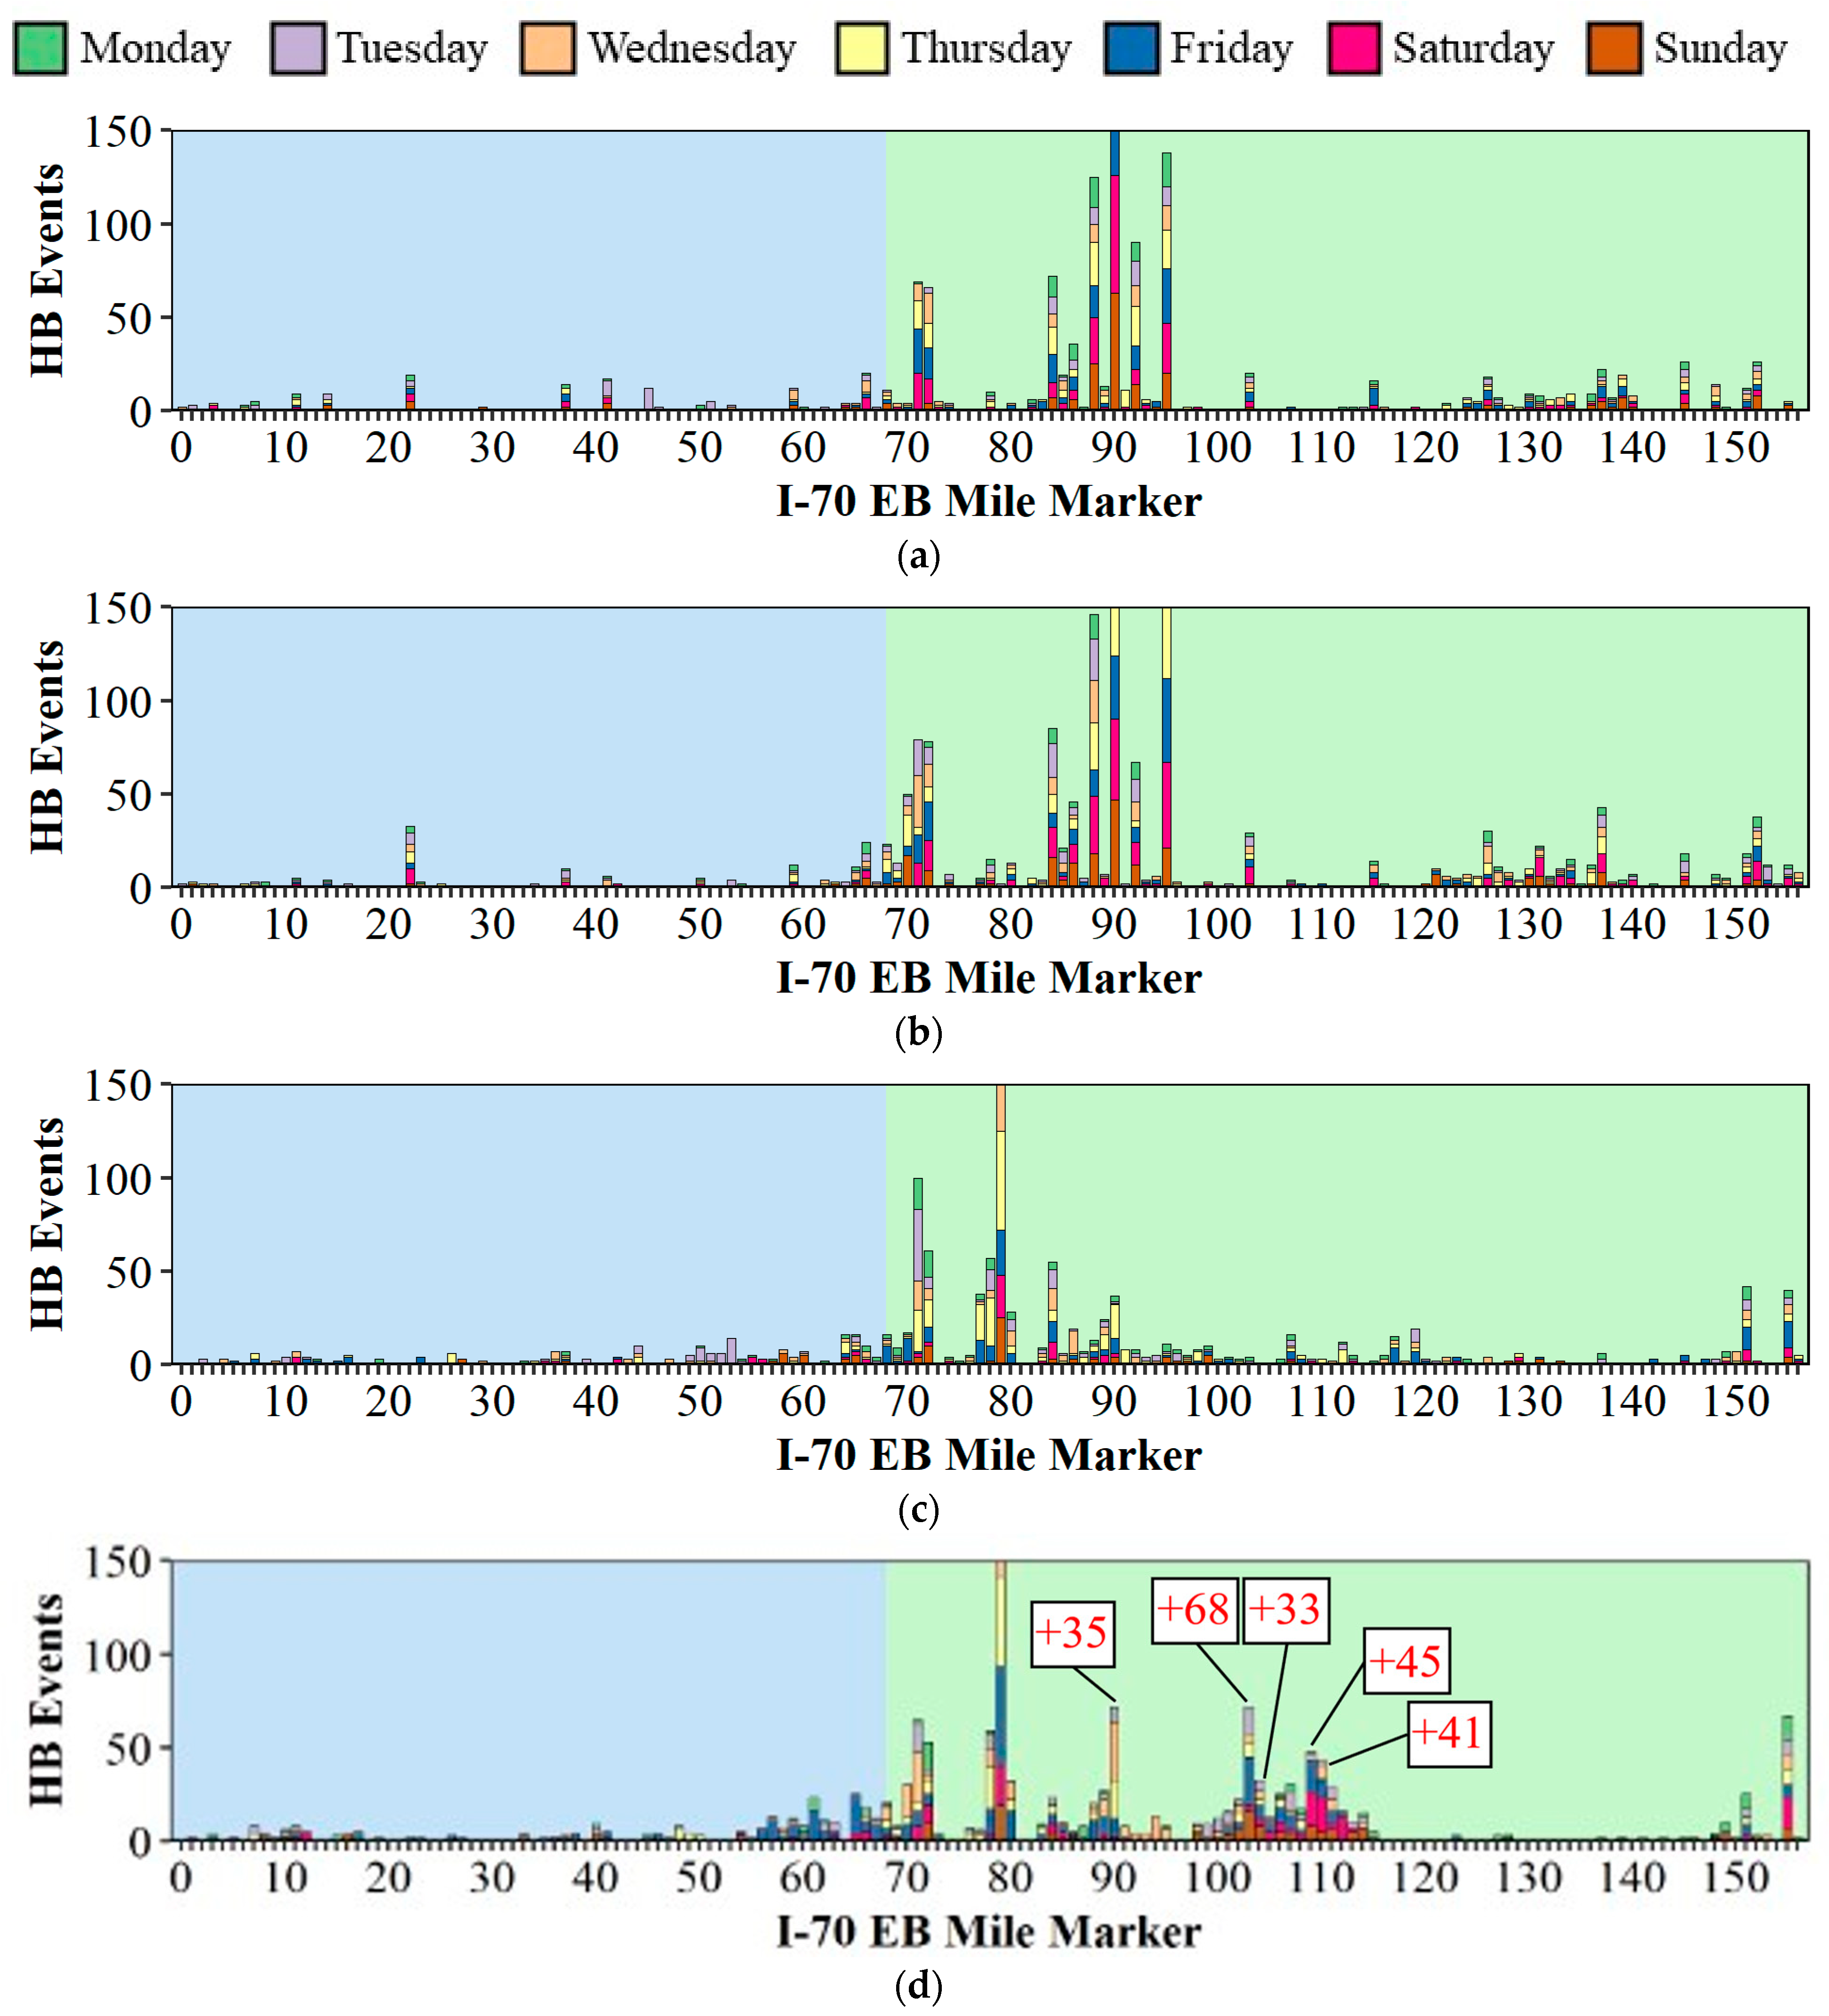
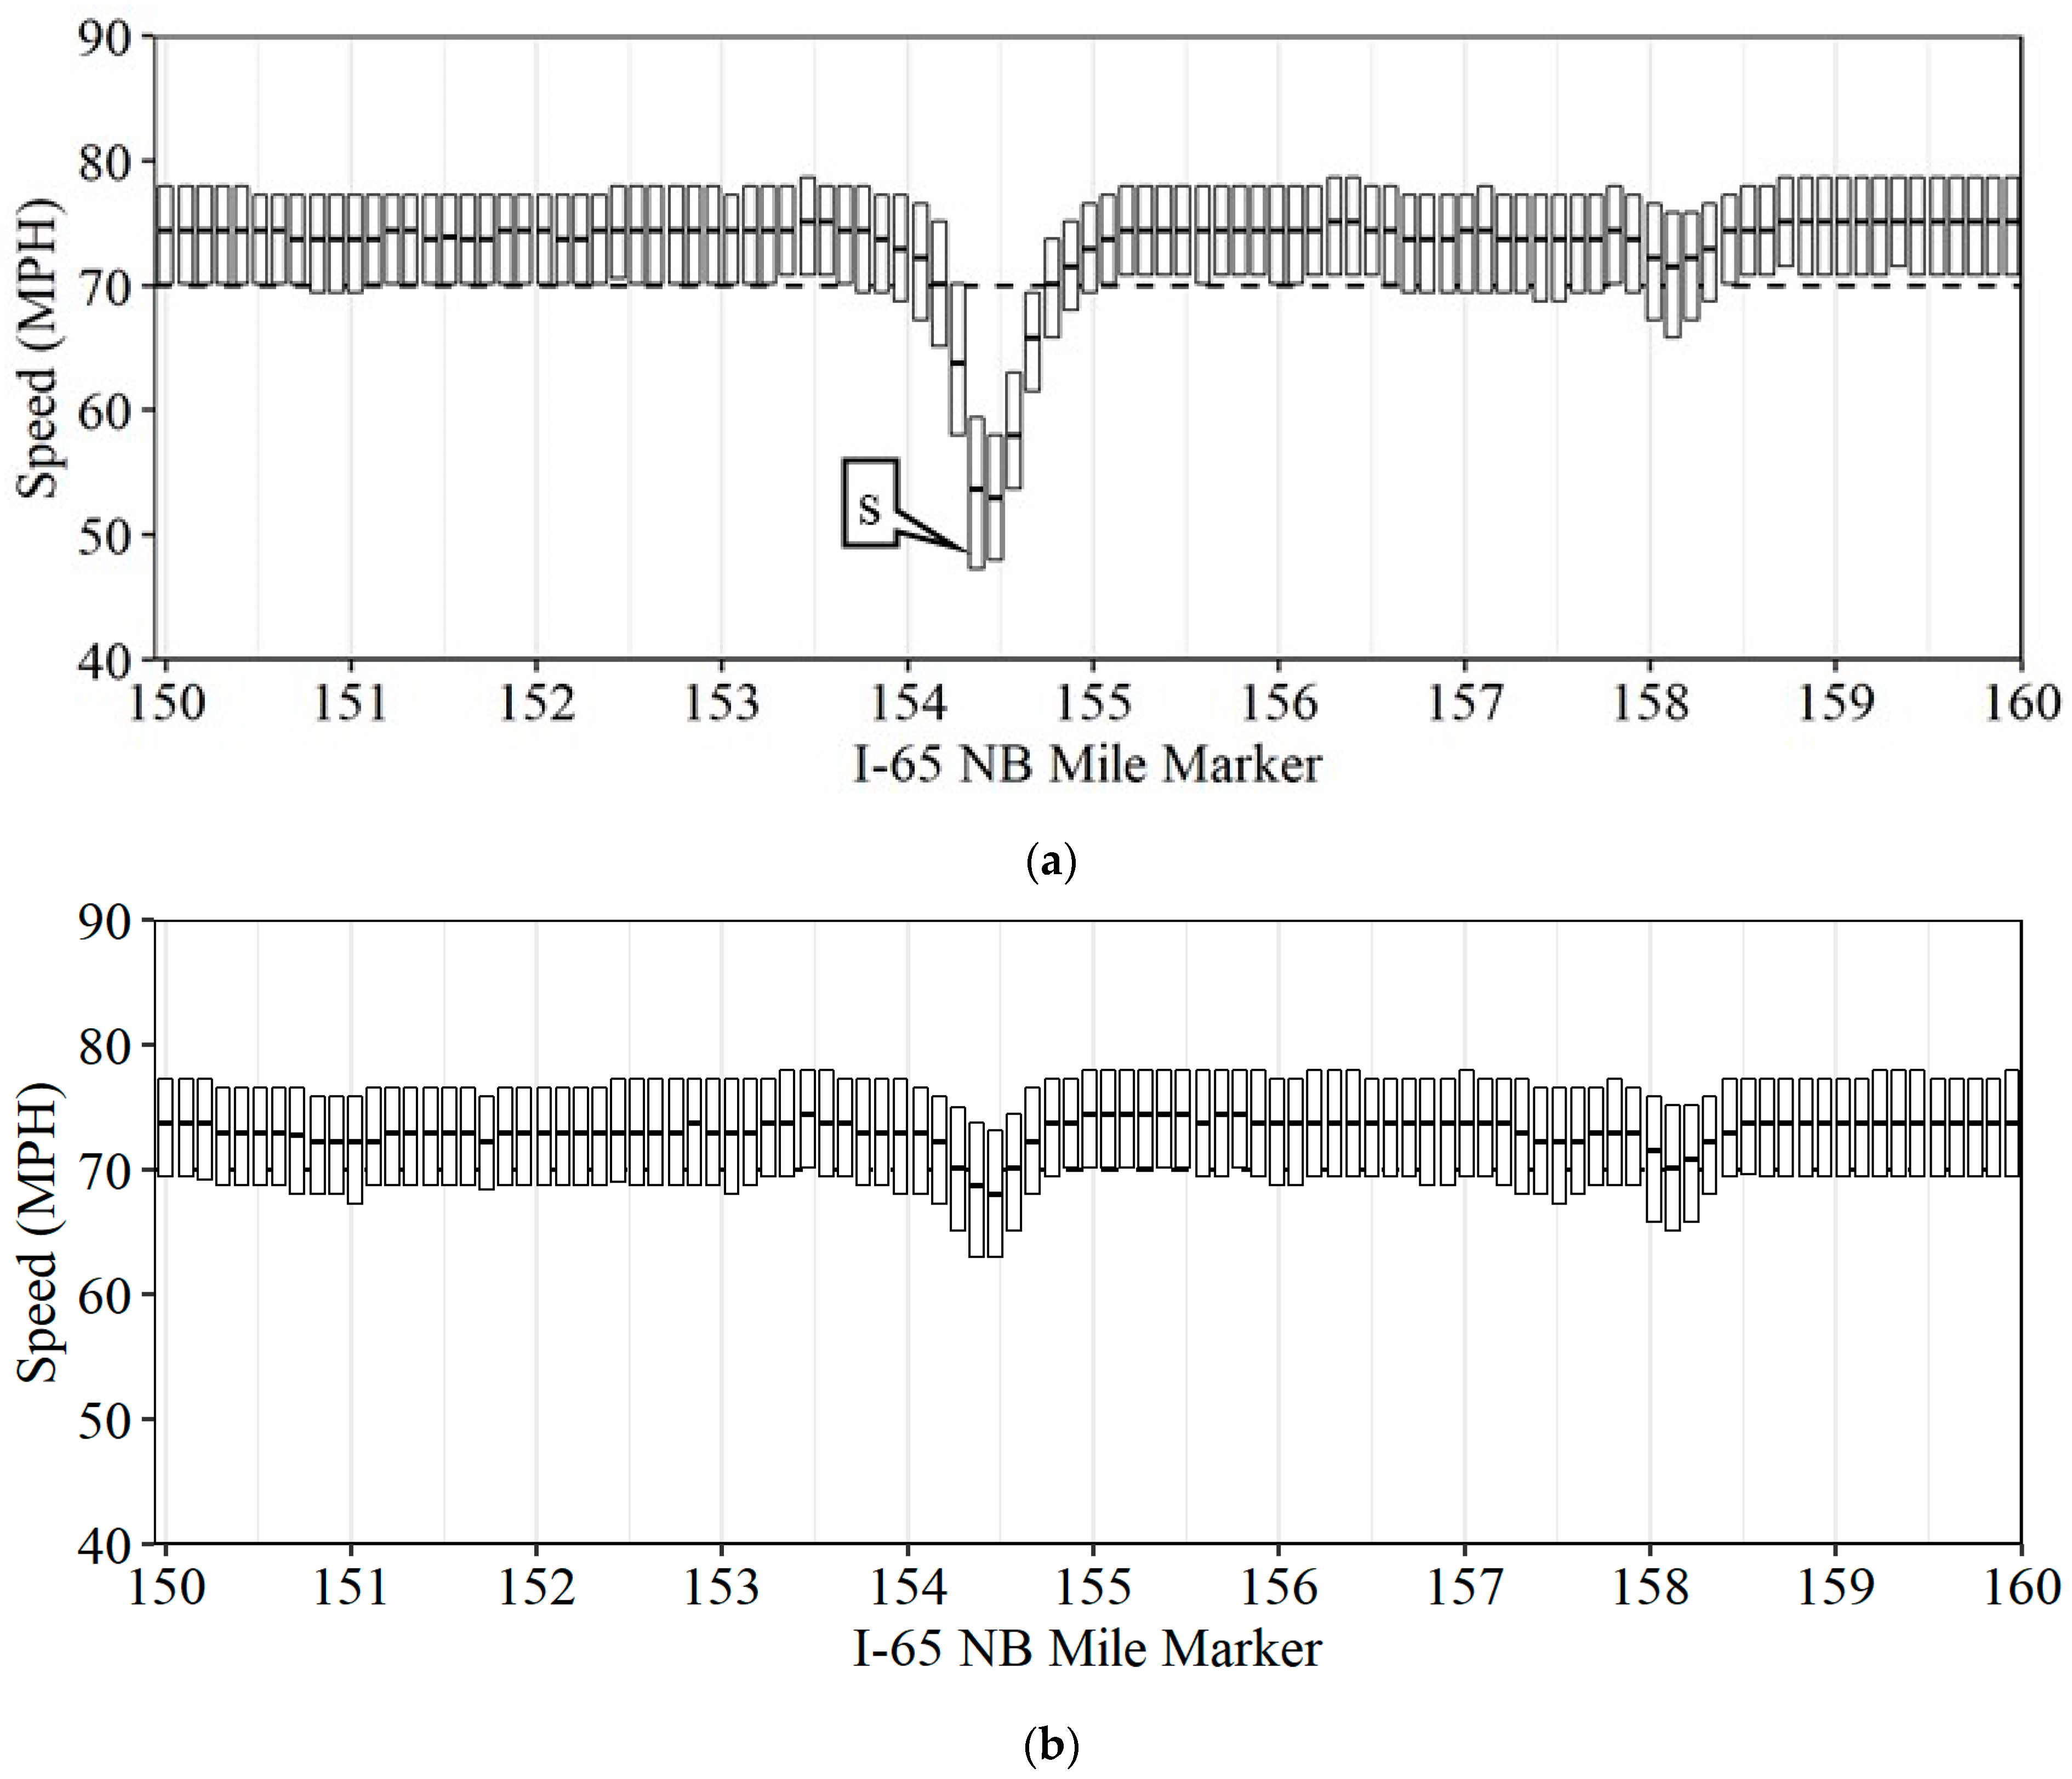
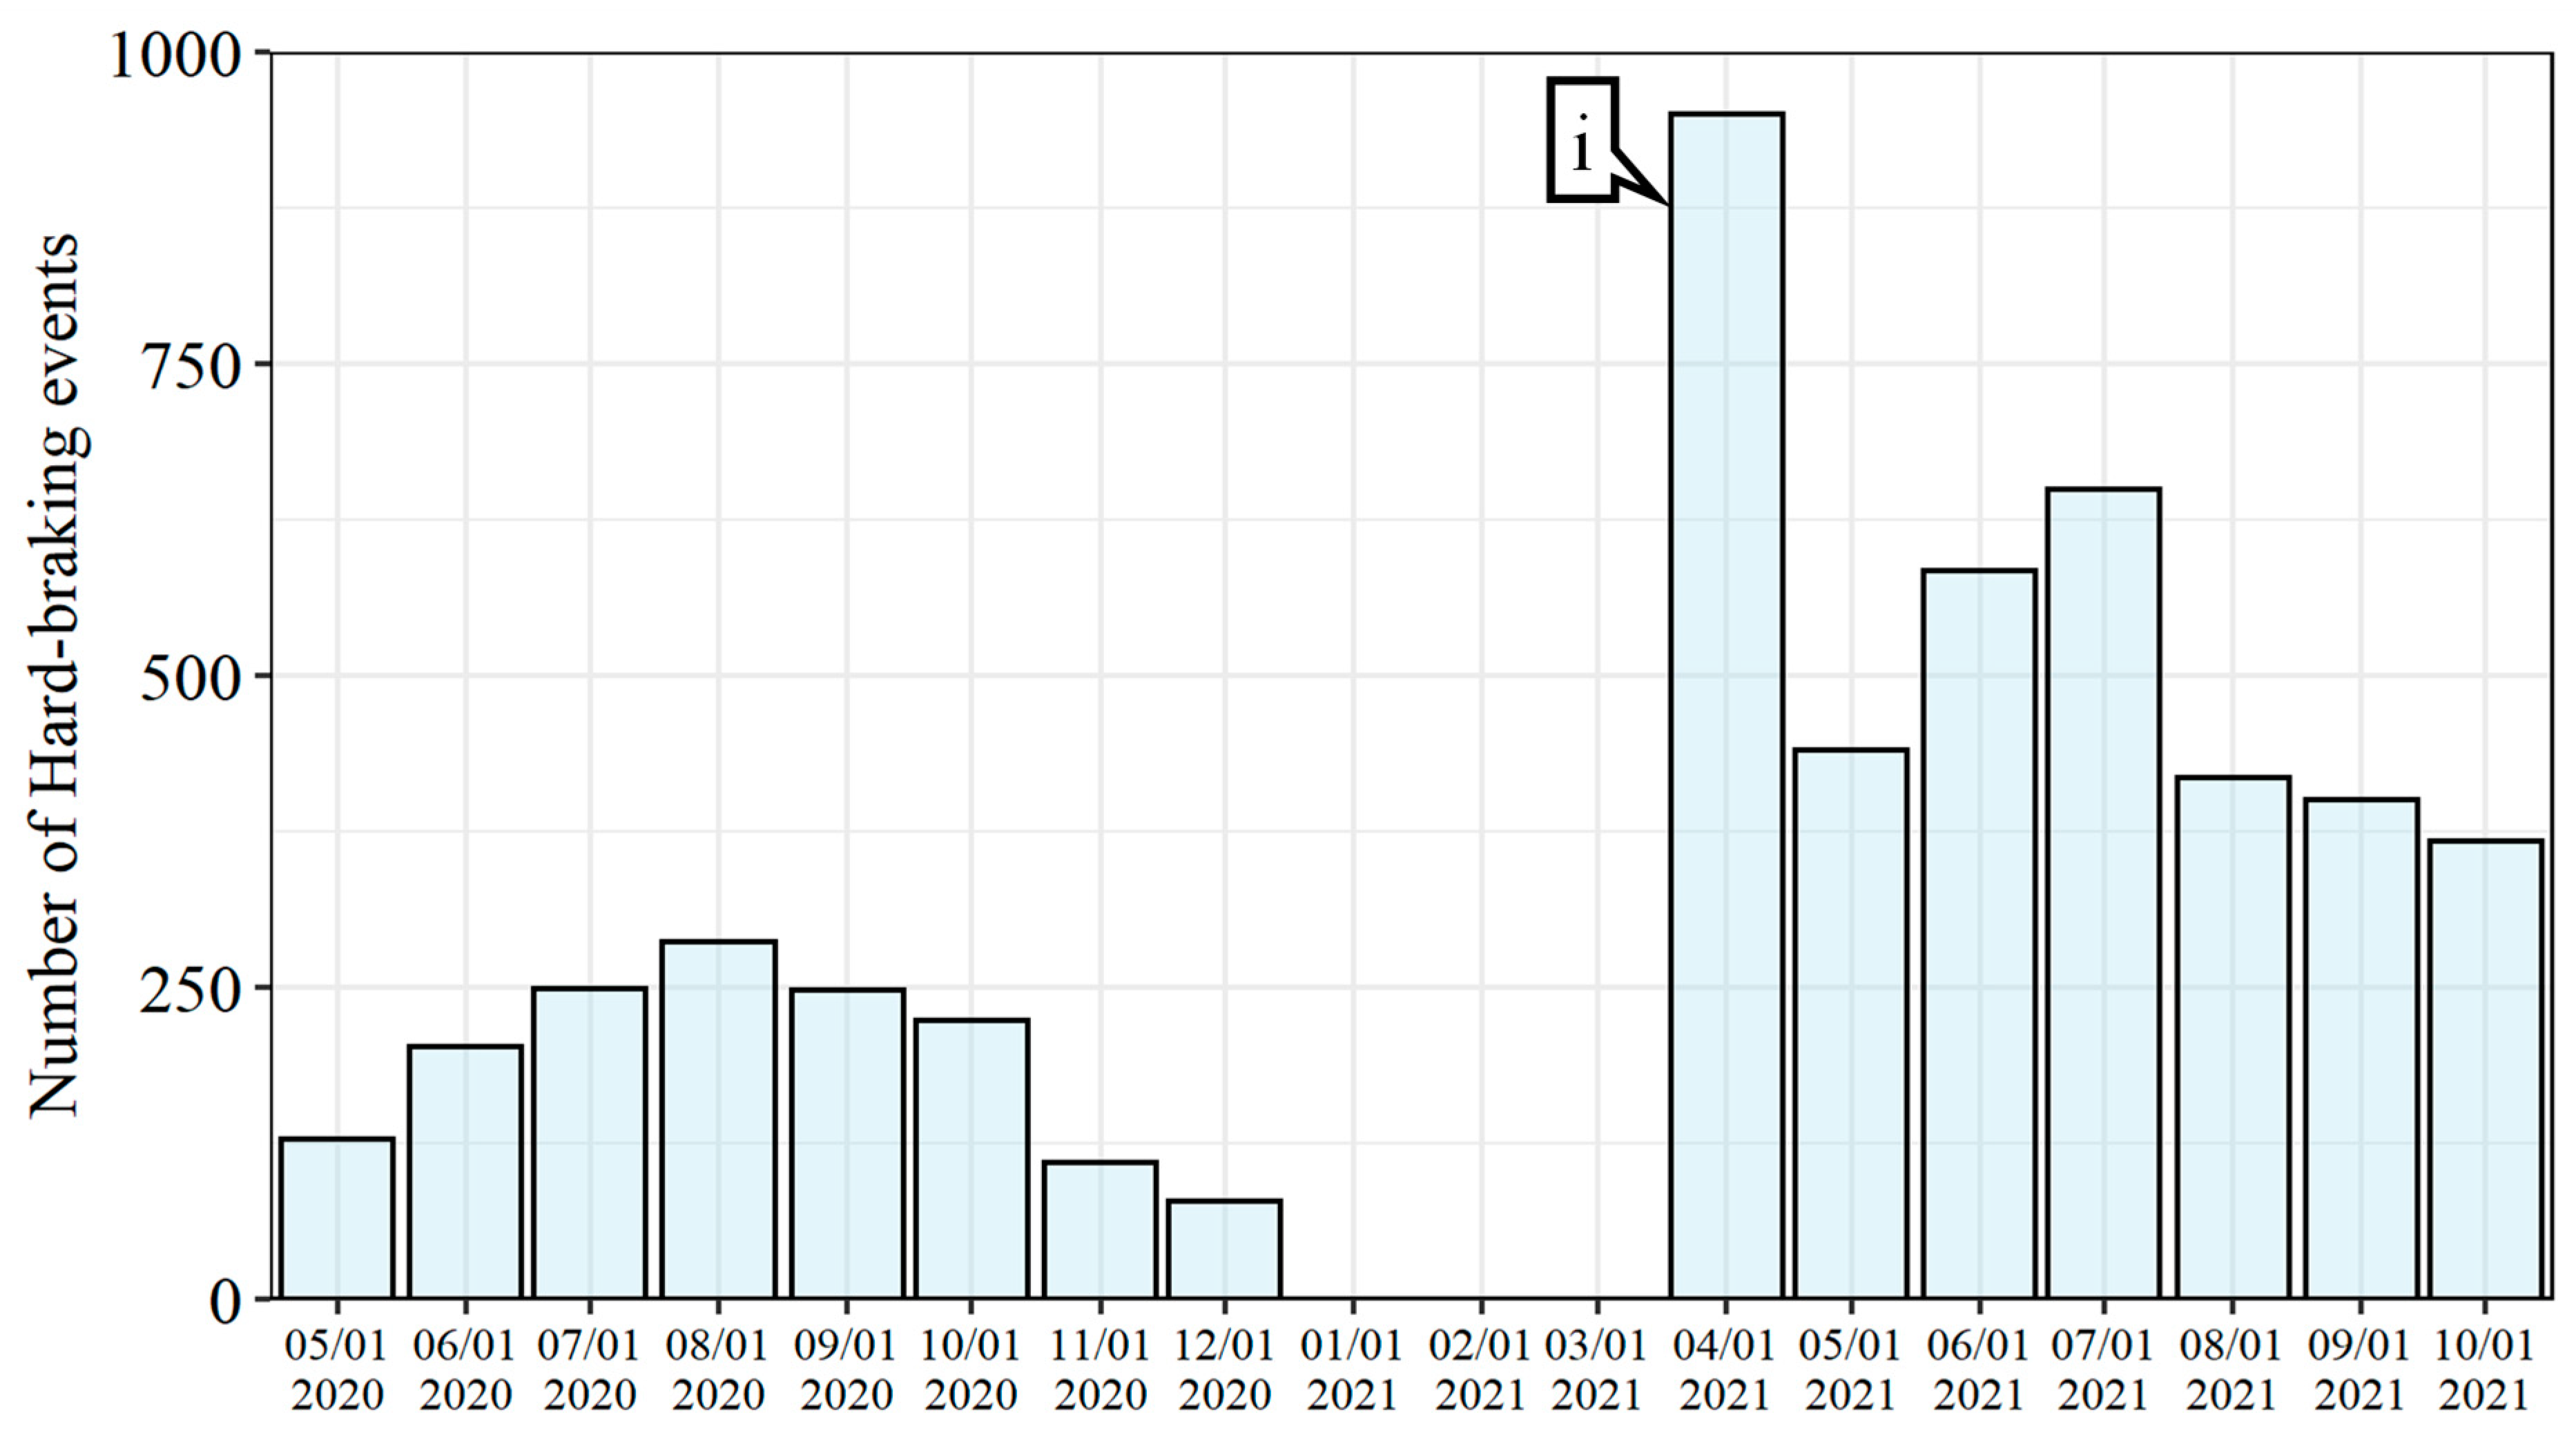
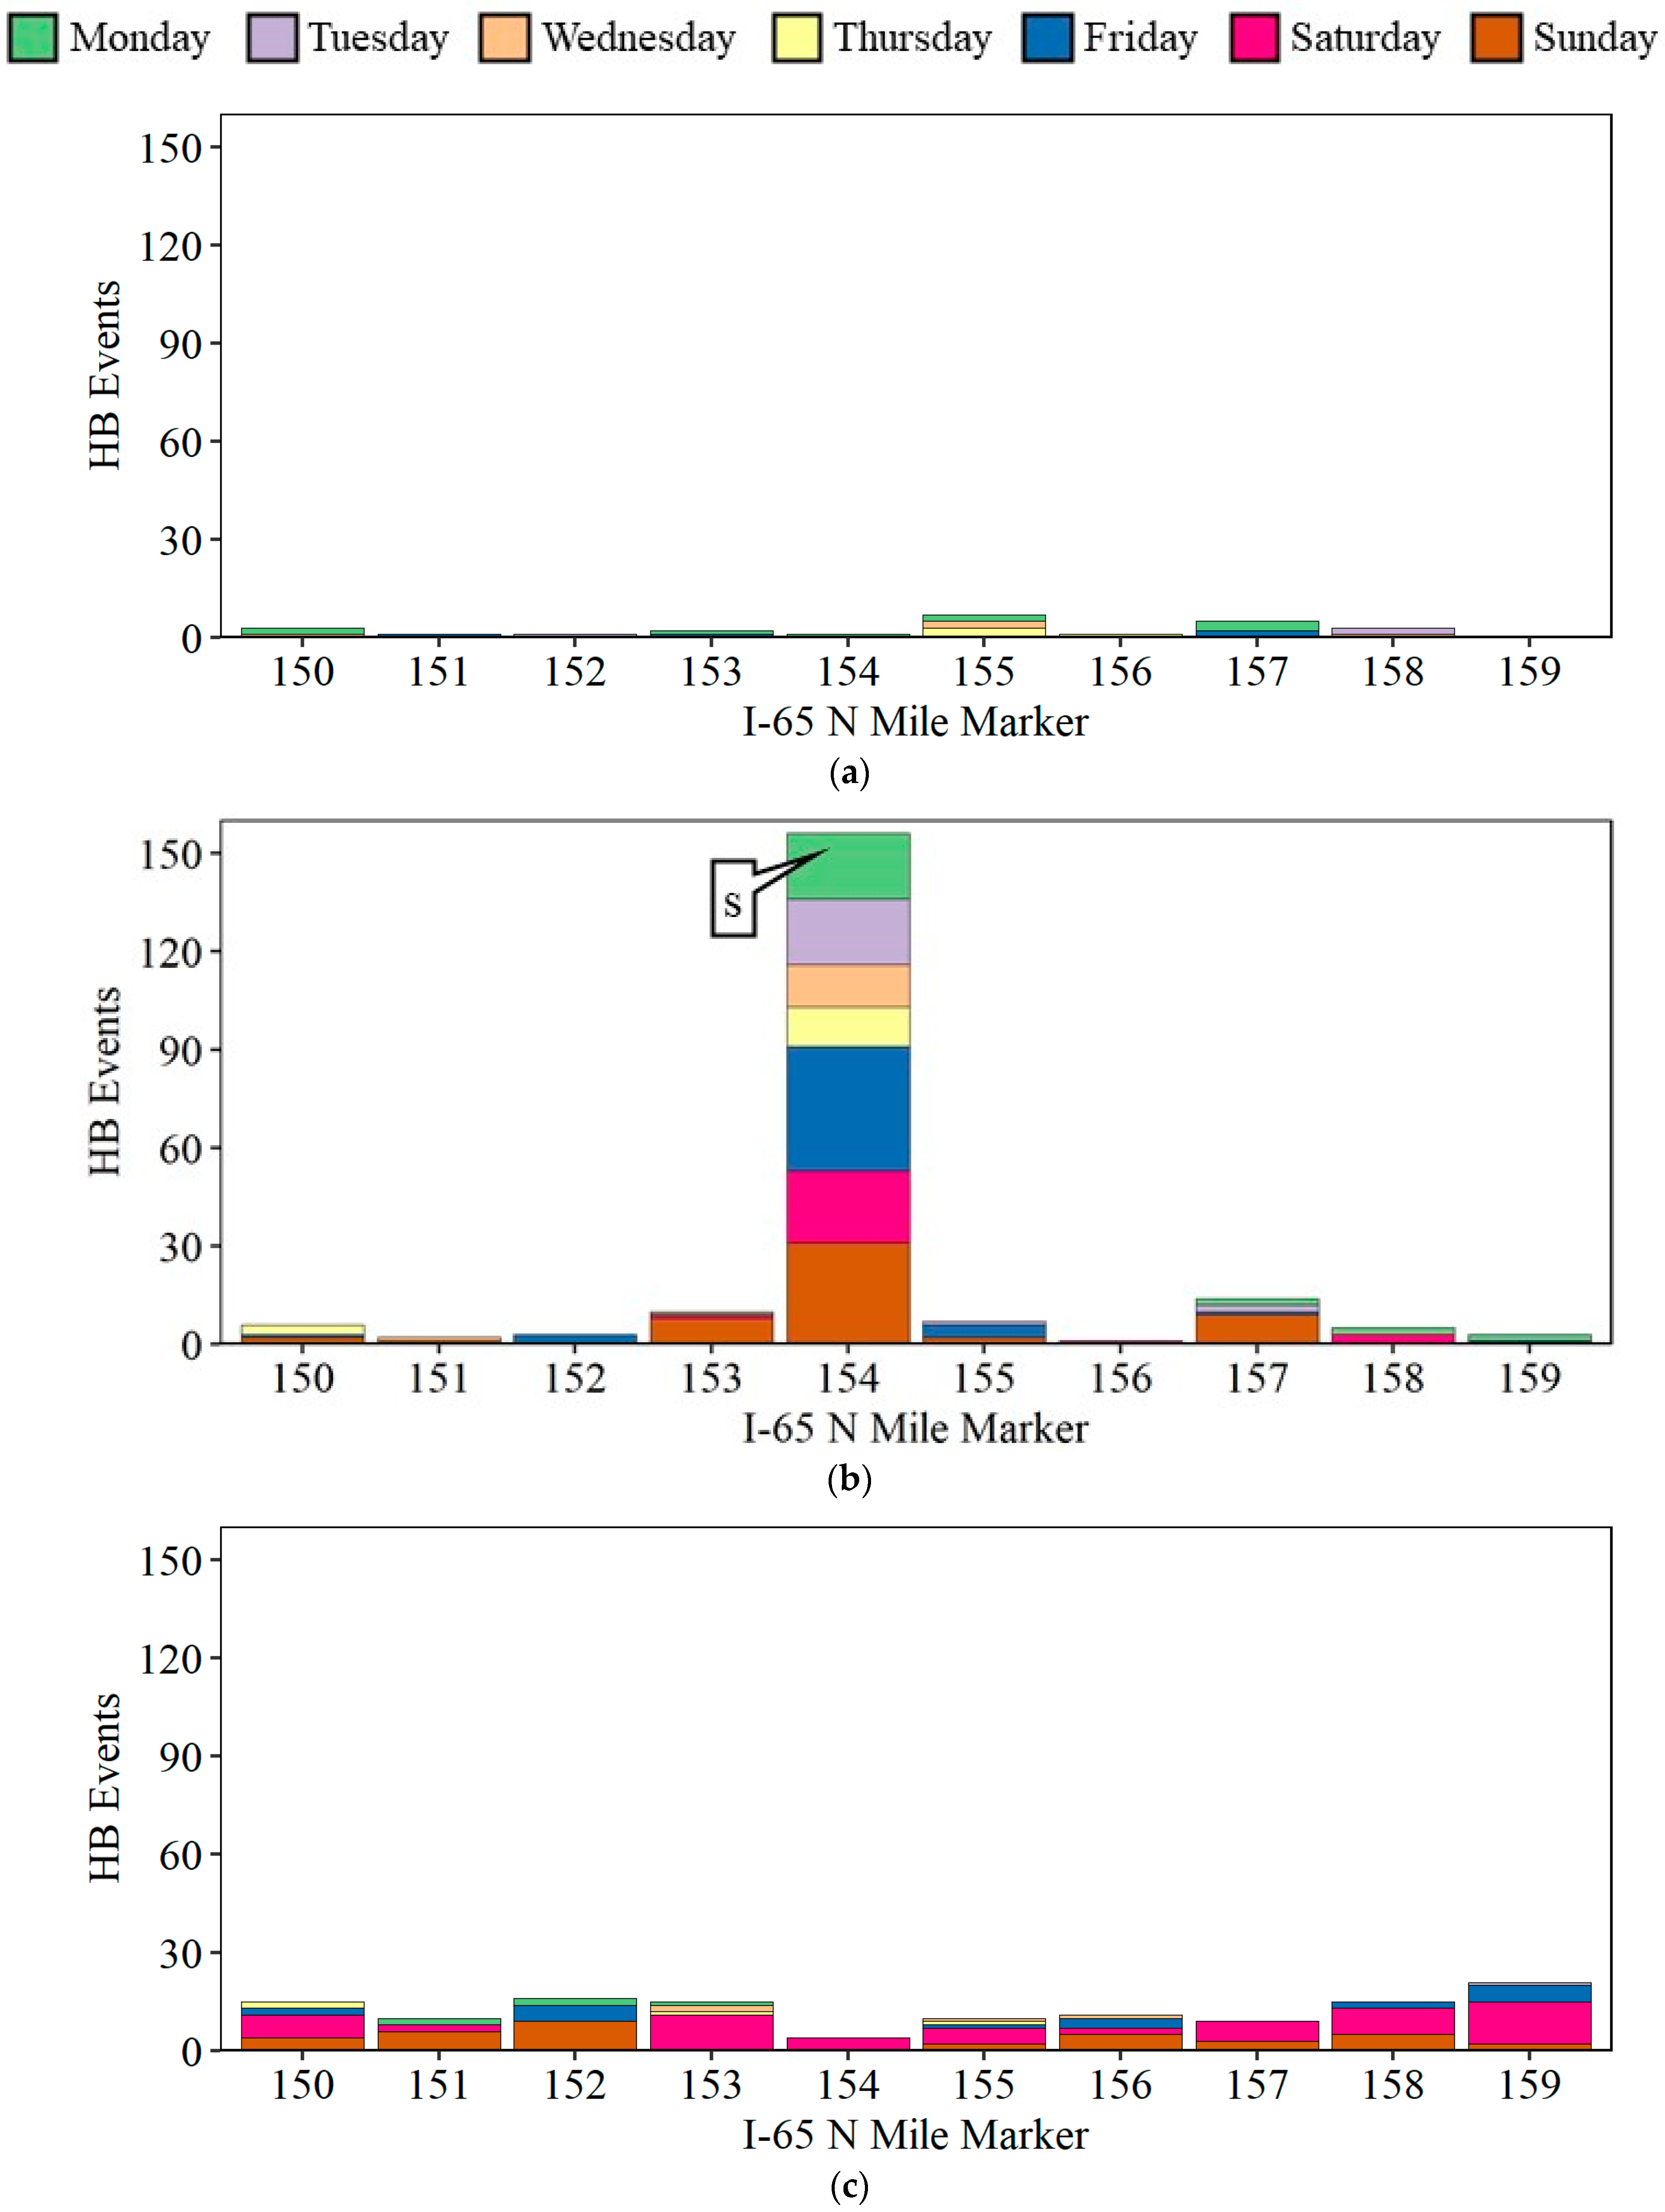
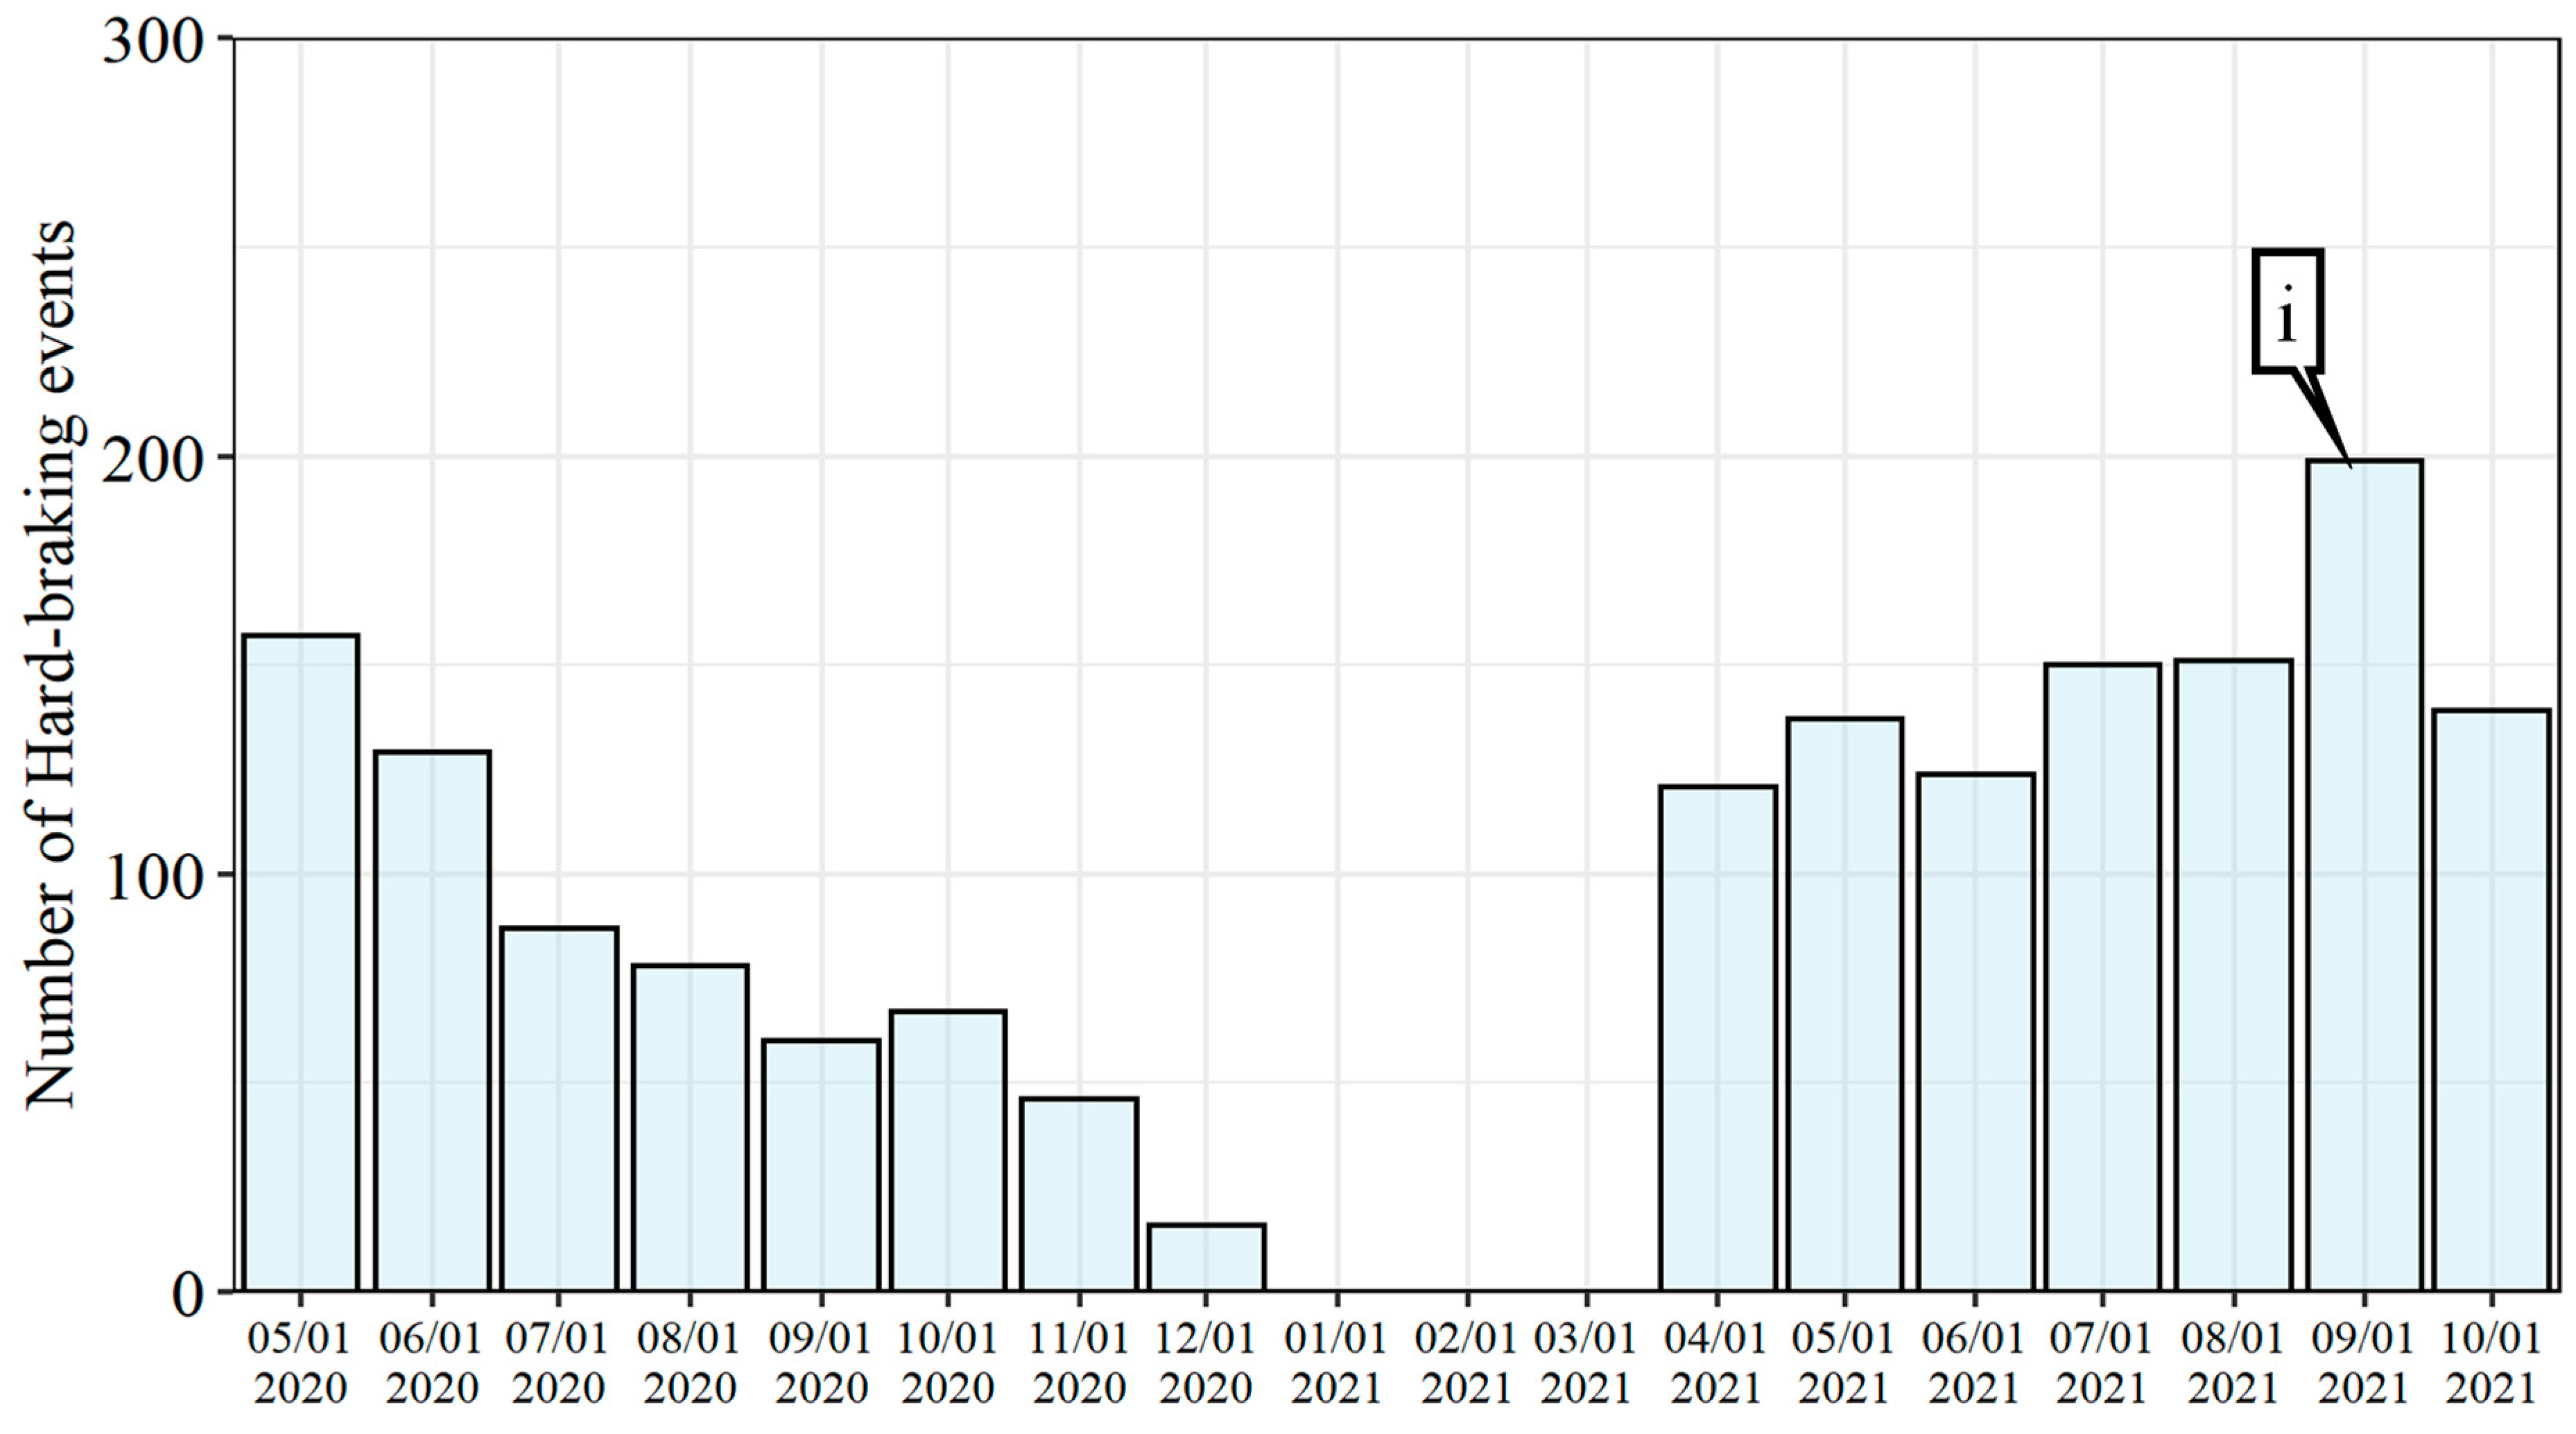
  • Specific projects can then be prioritized for further investigation of changes in hard-braking events for every mile of the project (Figure 11) as well as changes in congestion (Figure 12). These graphics are particularly valuable to correlate with changes in construction stages and prioritize sites for further analysis in the context of the entire interstate system.
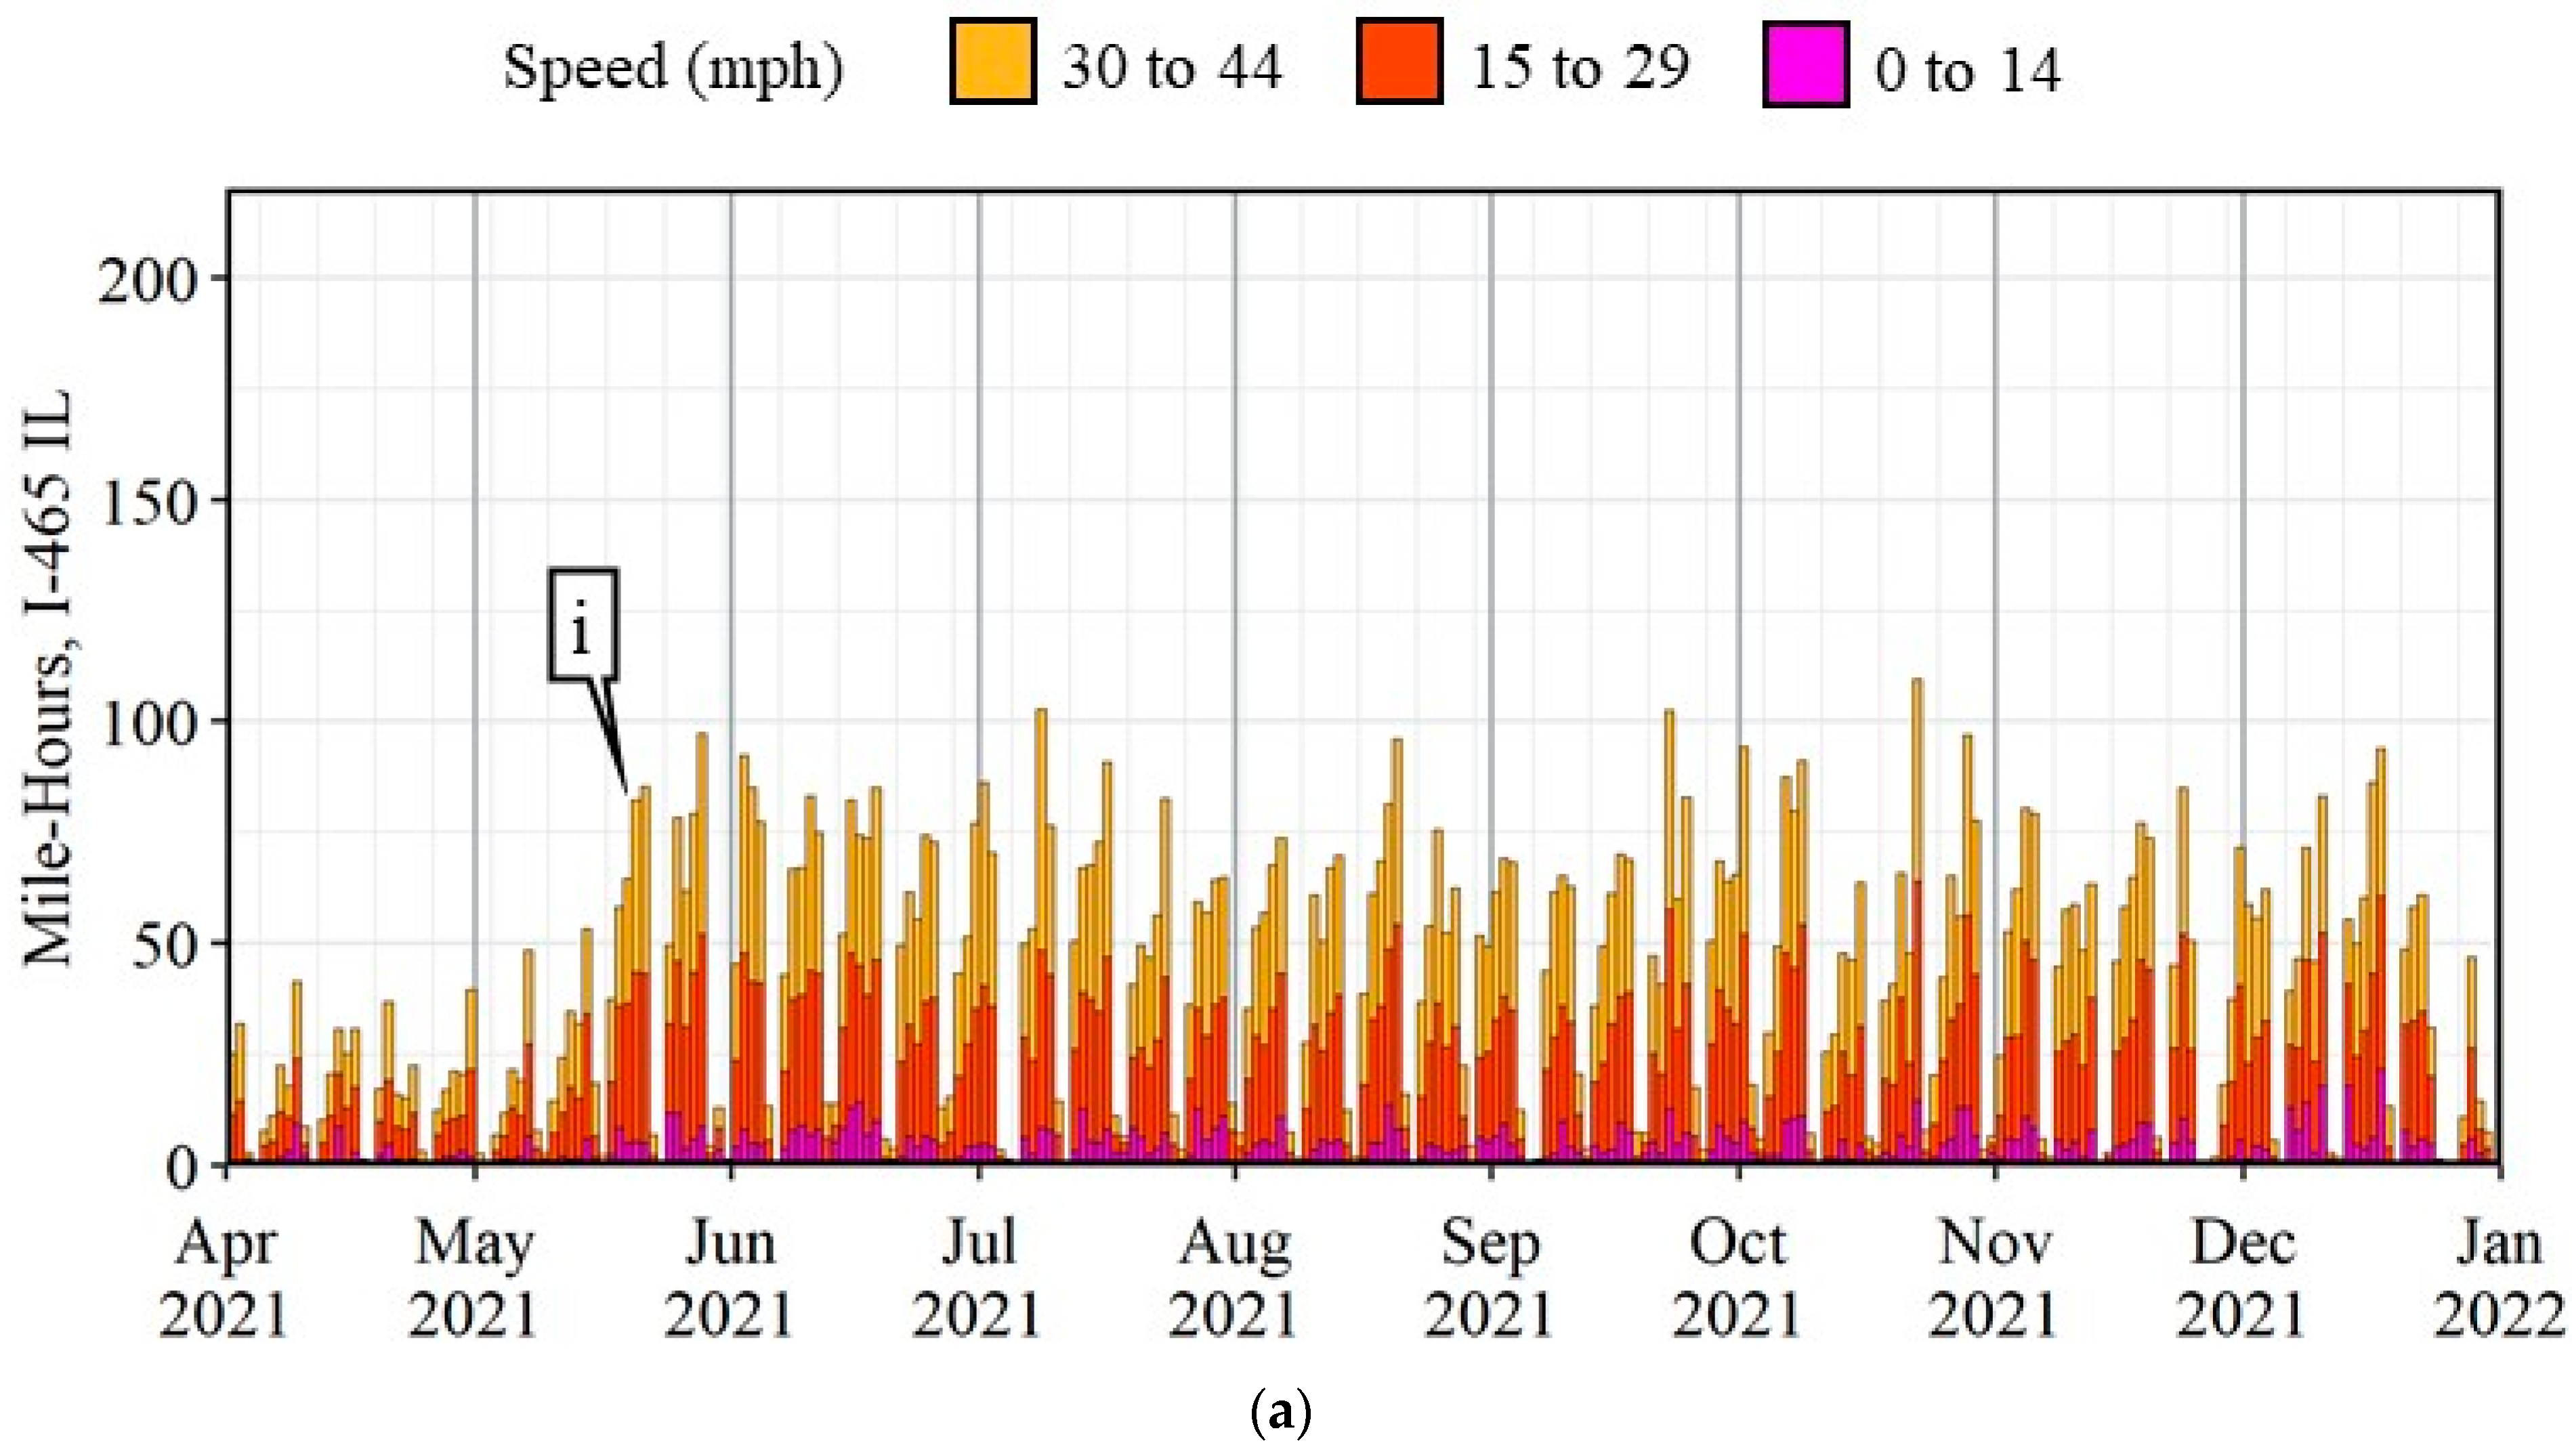
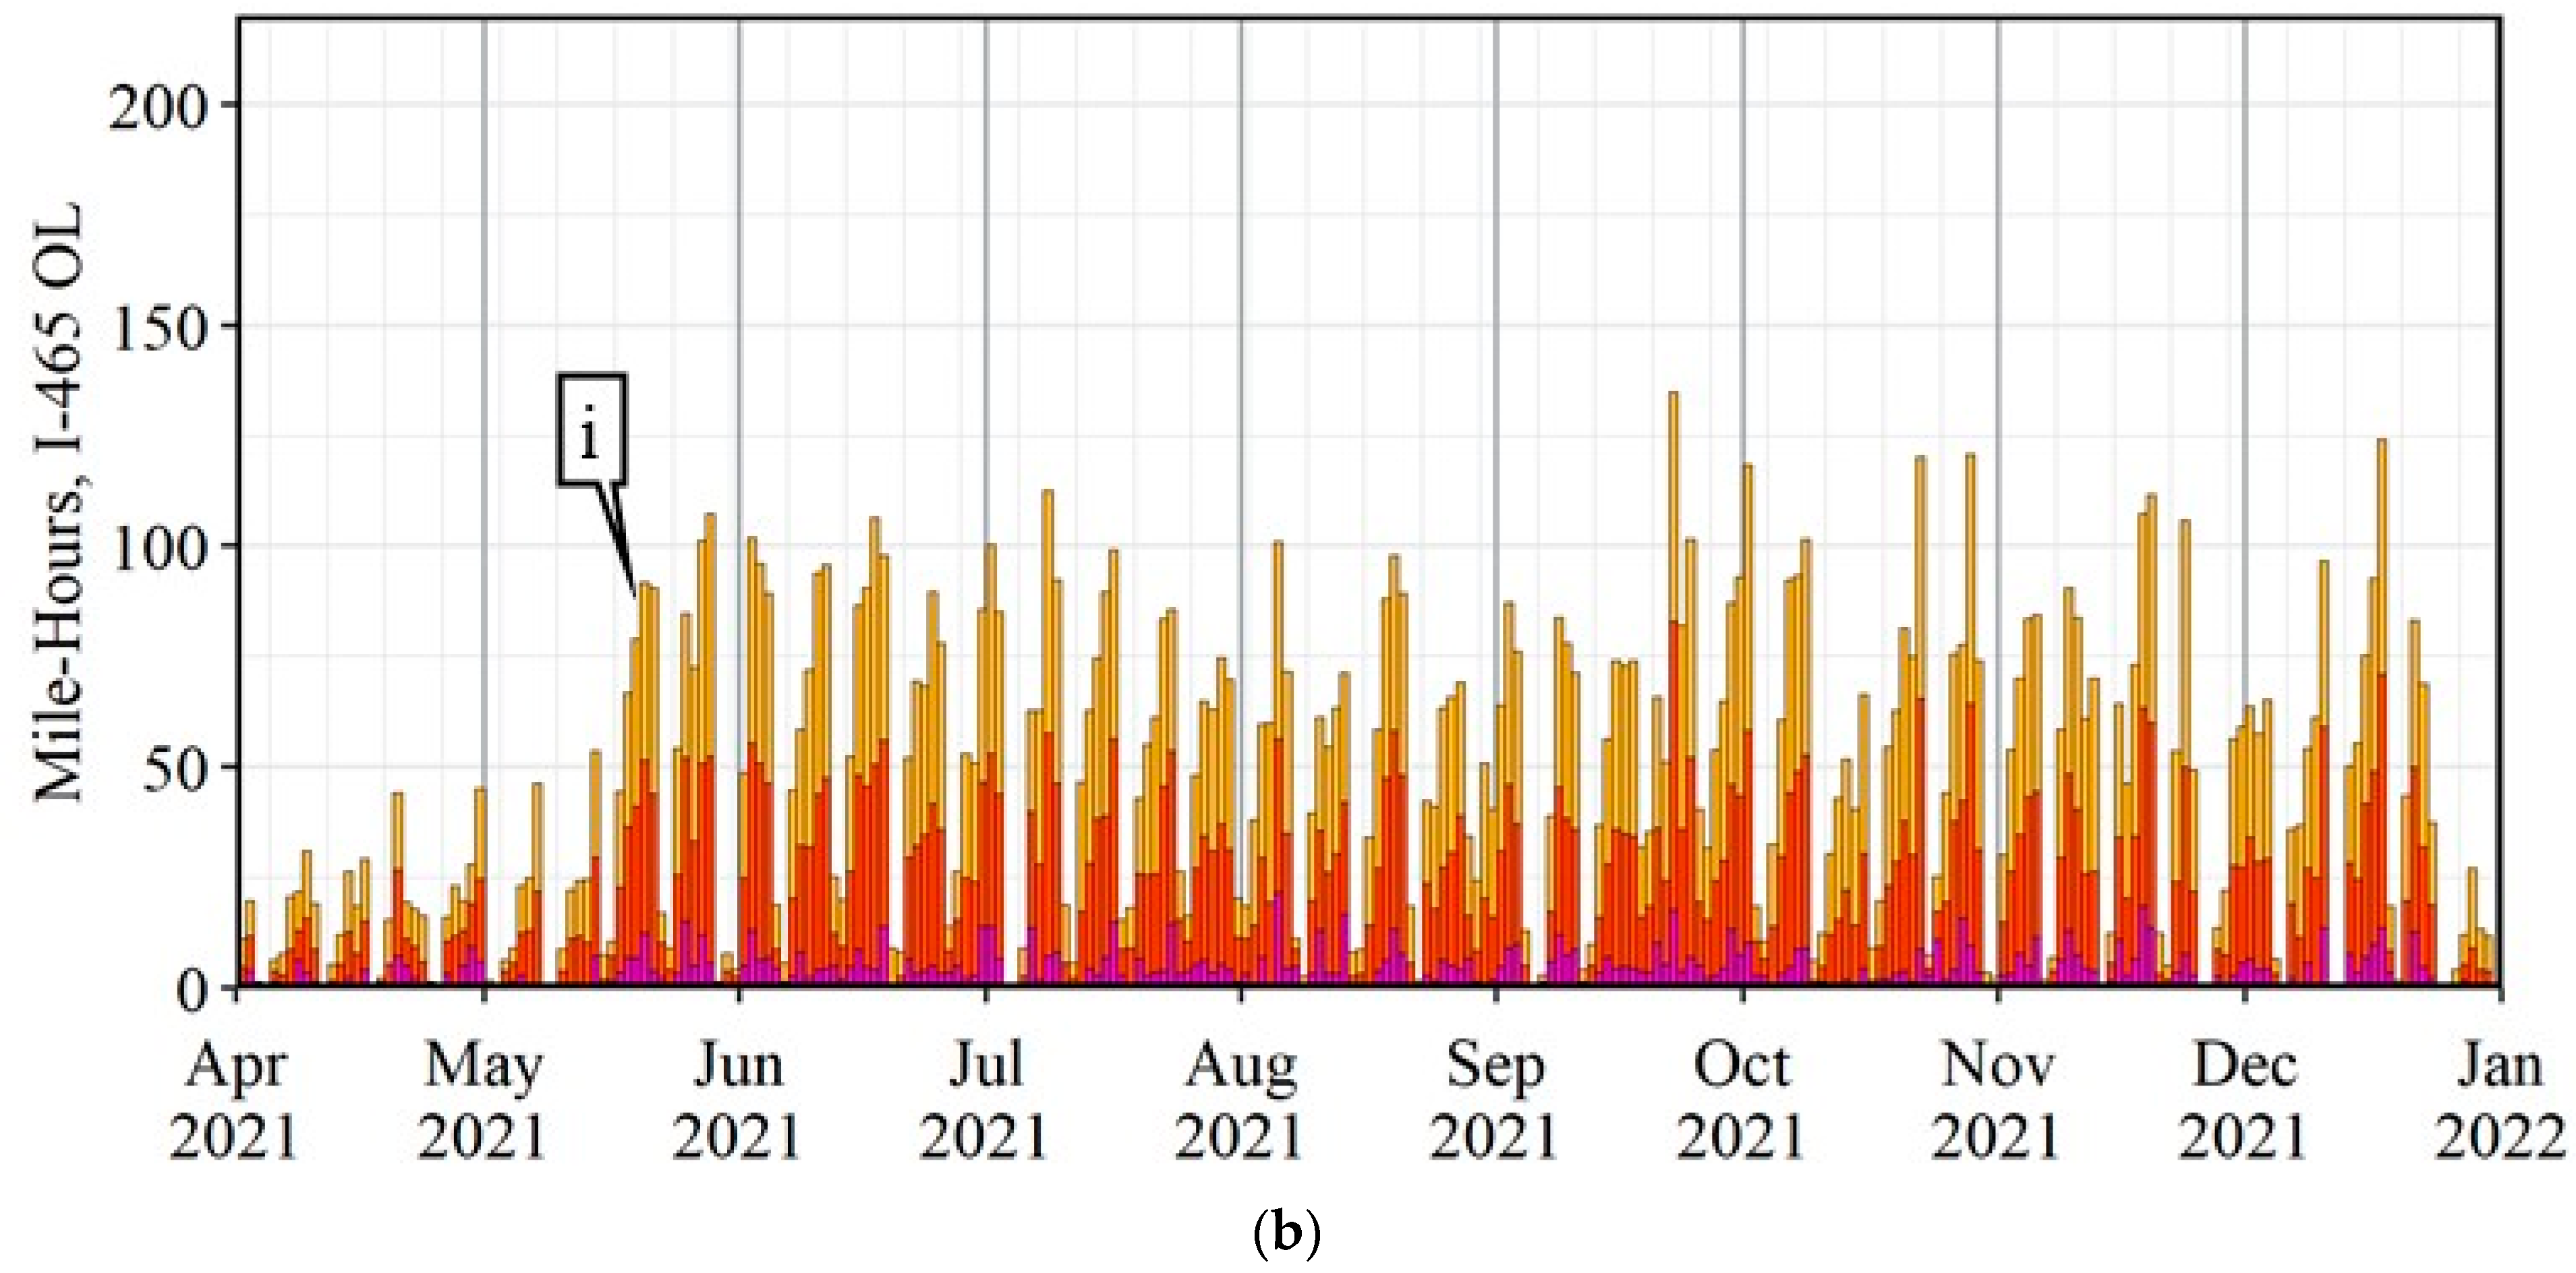
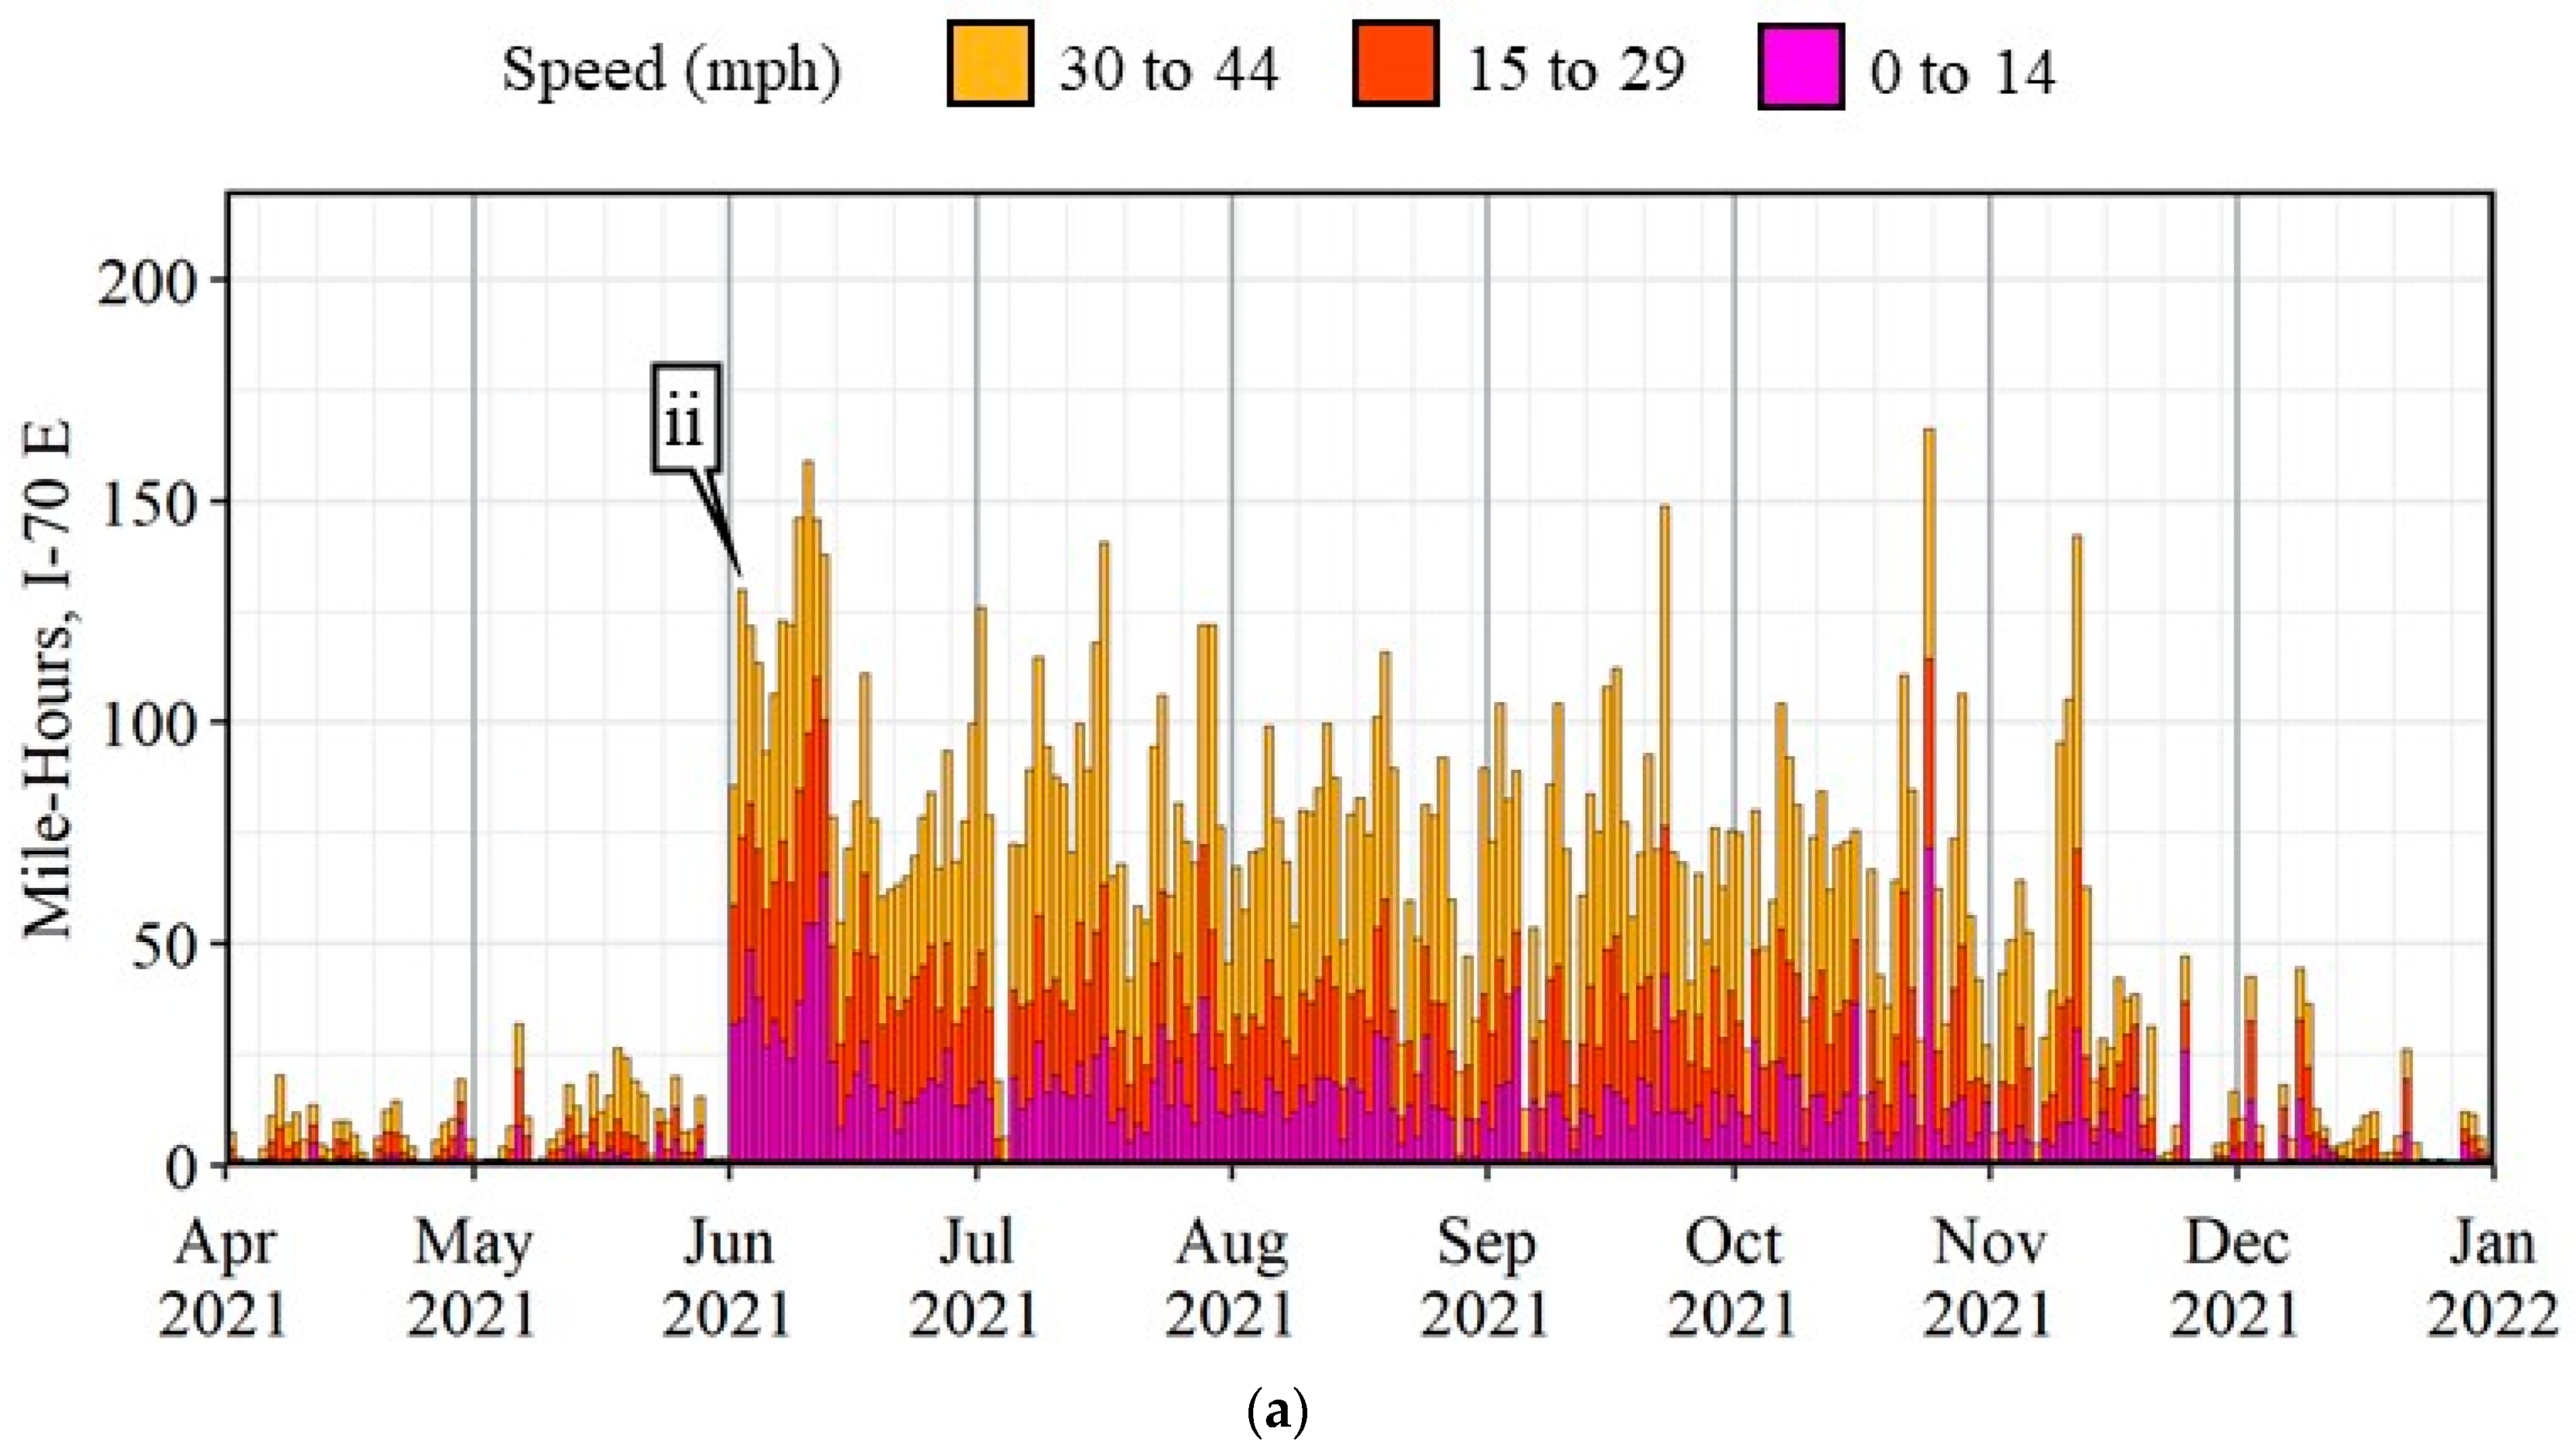
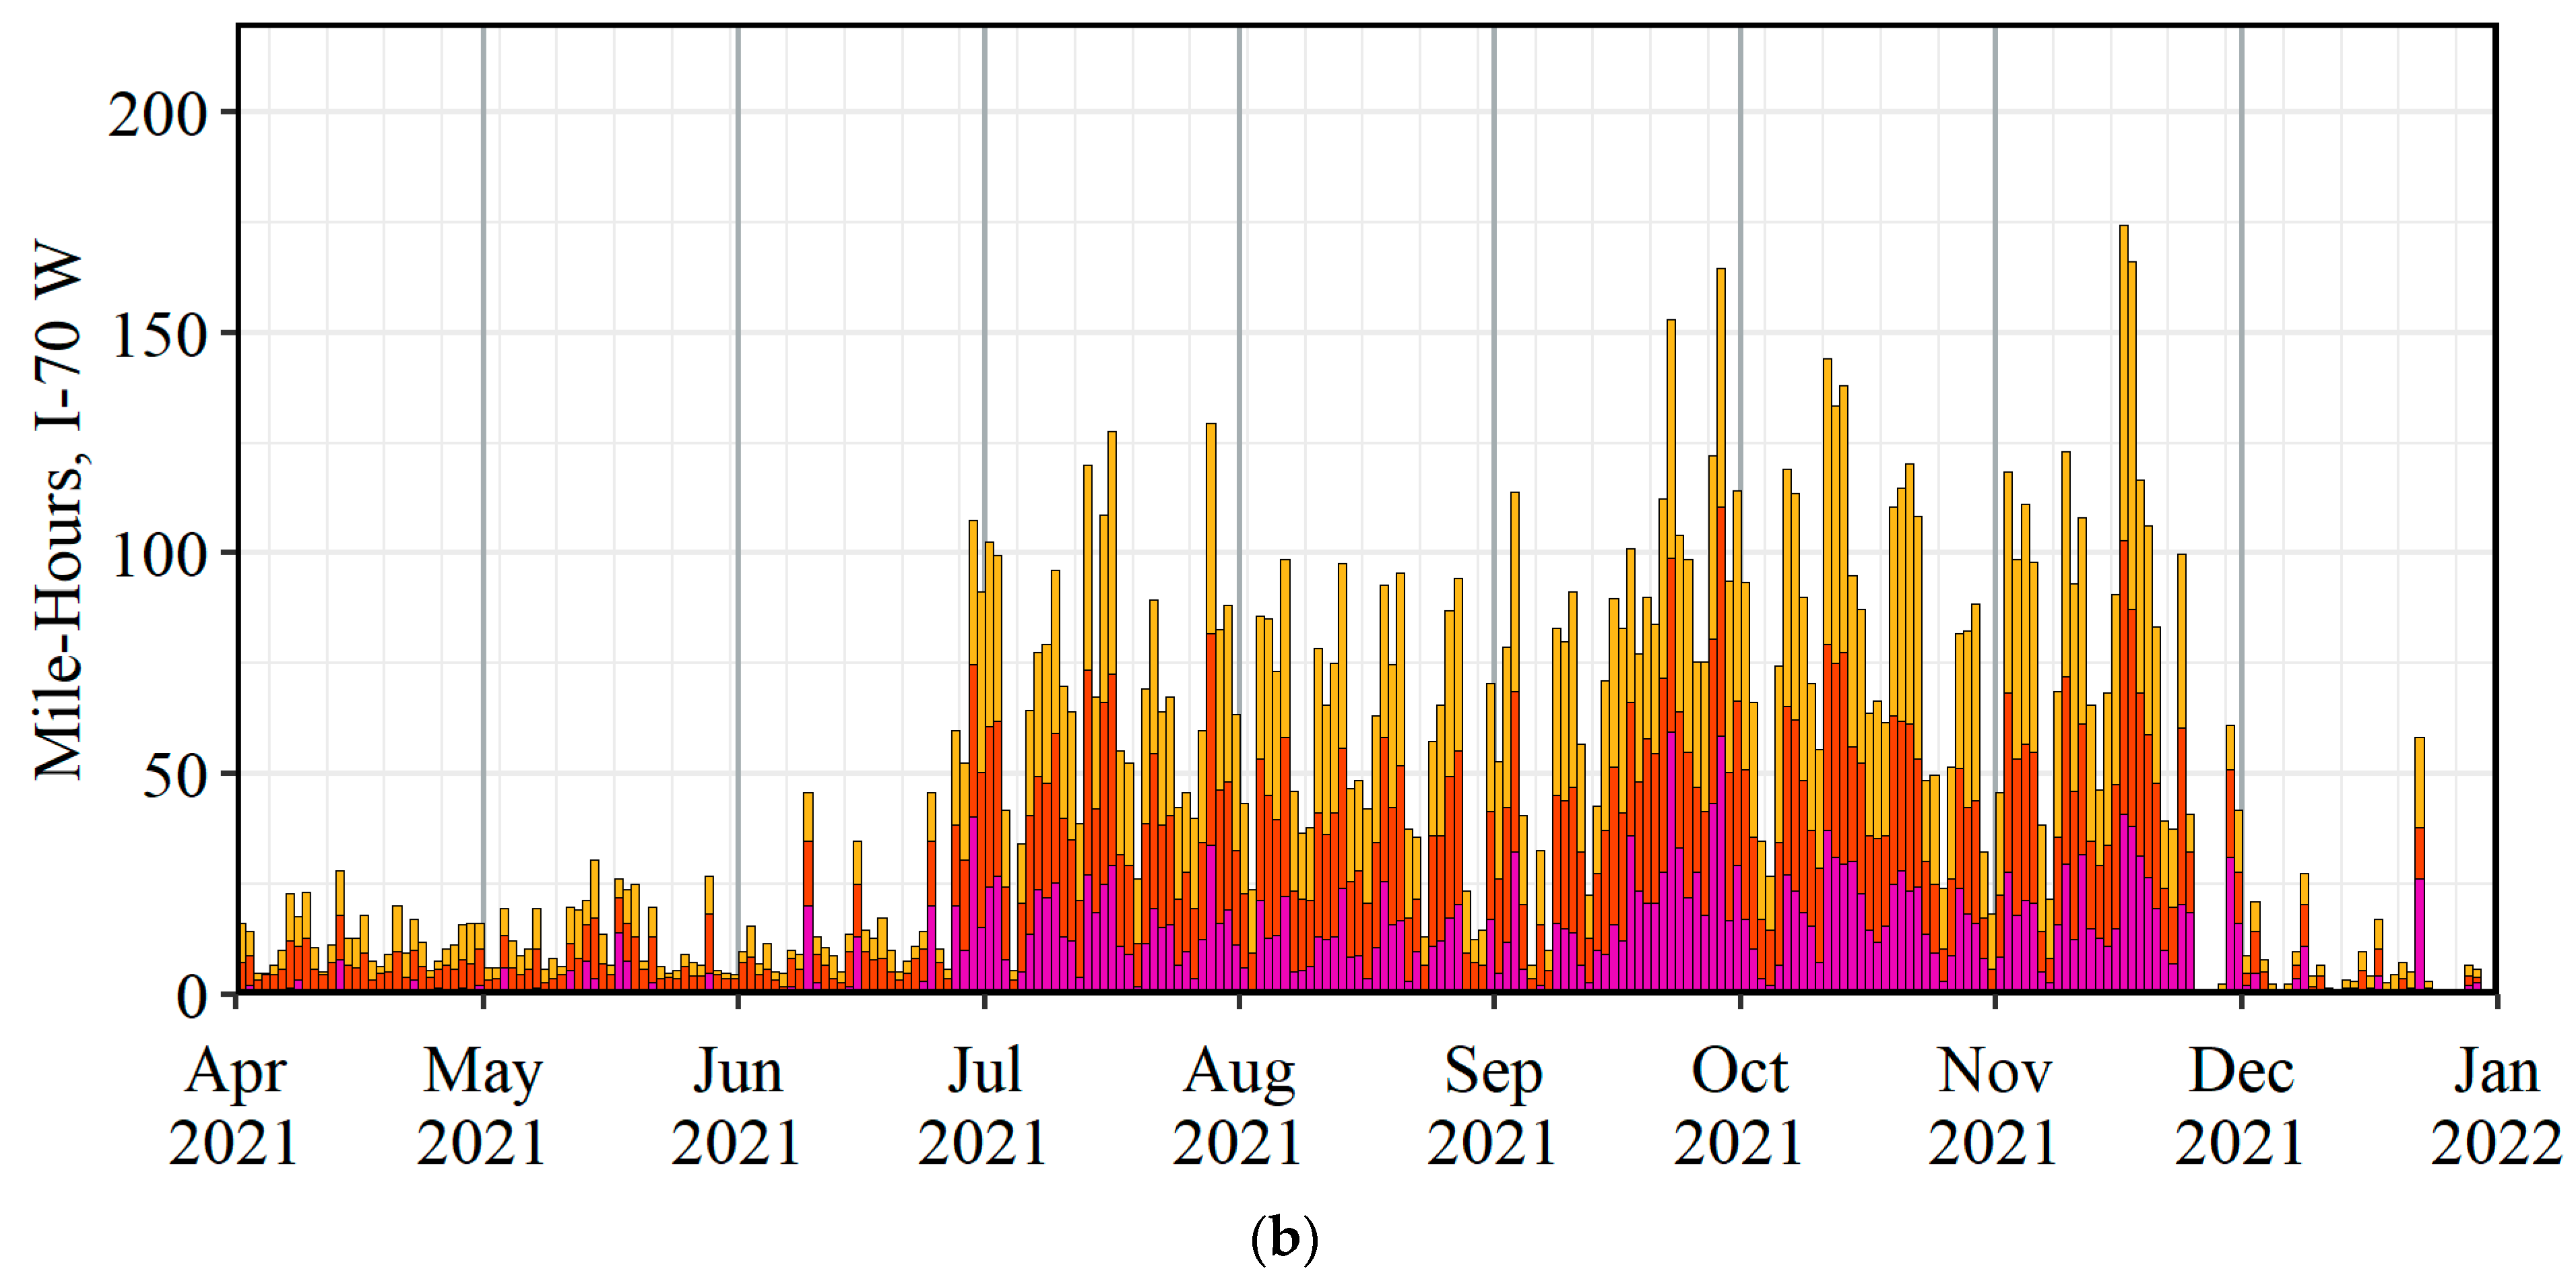
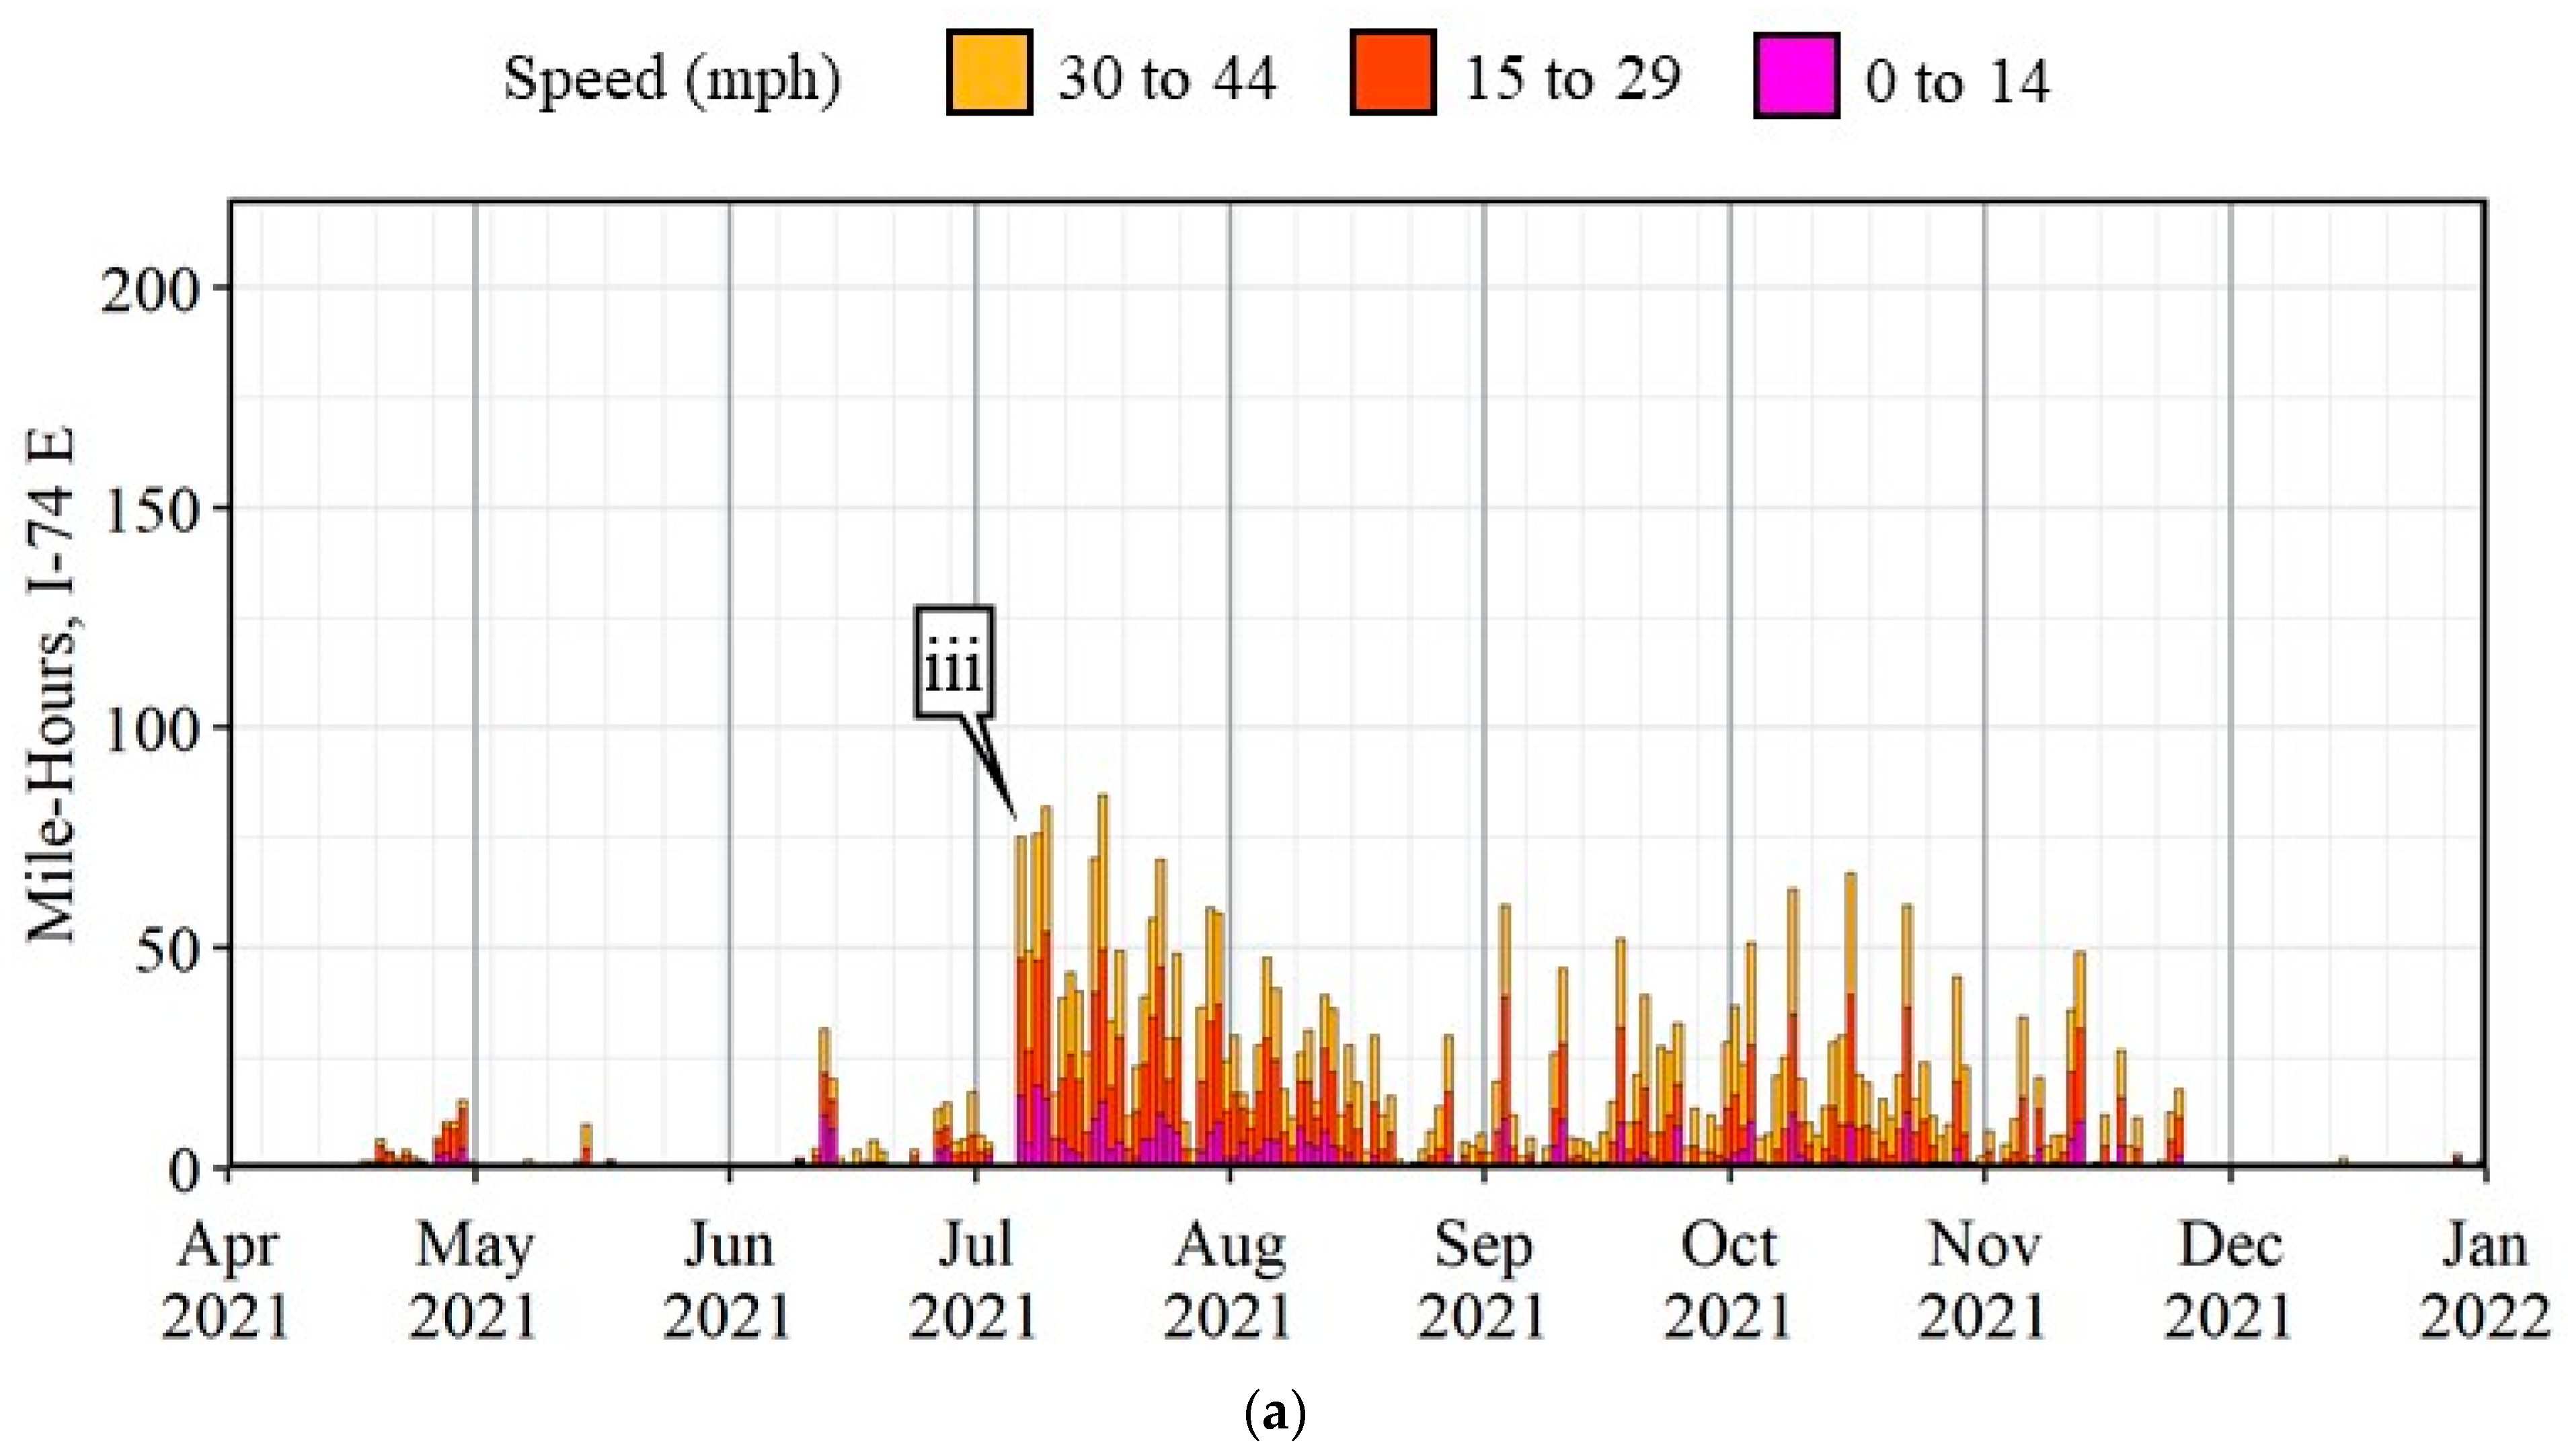
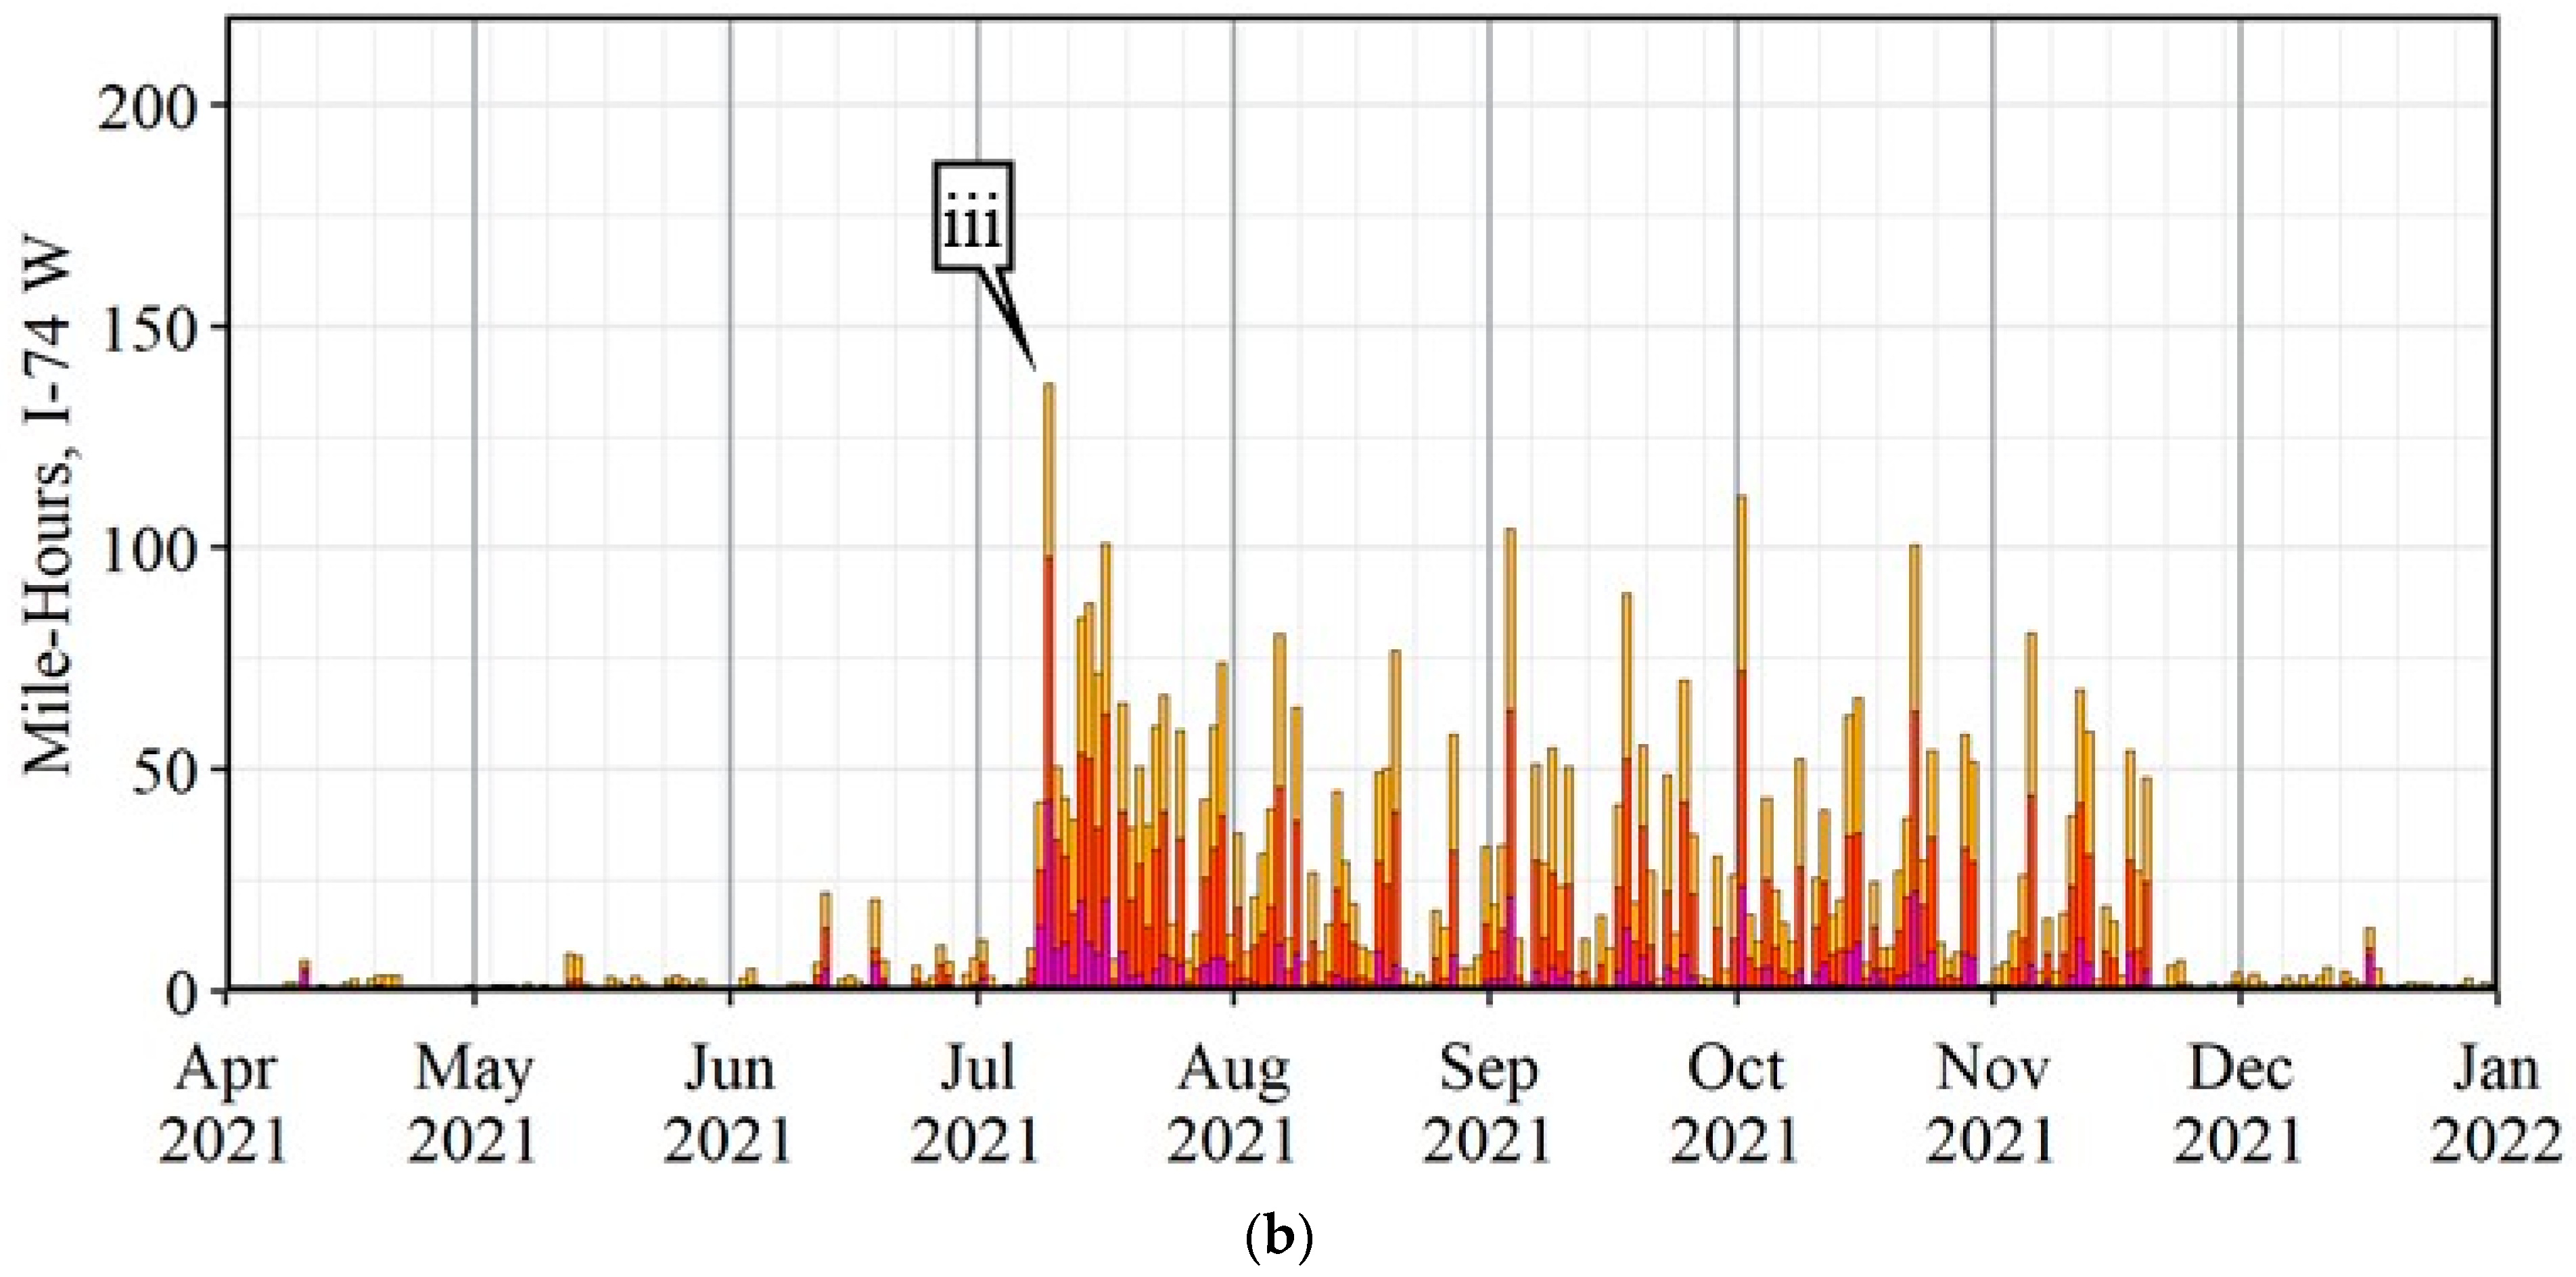
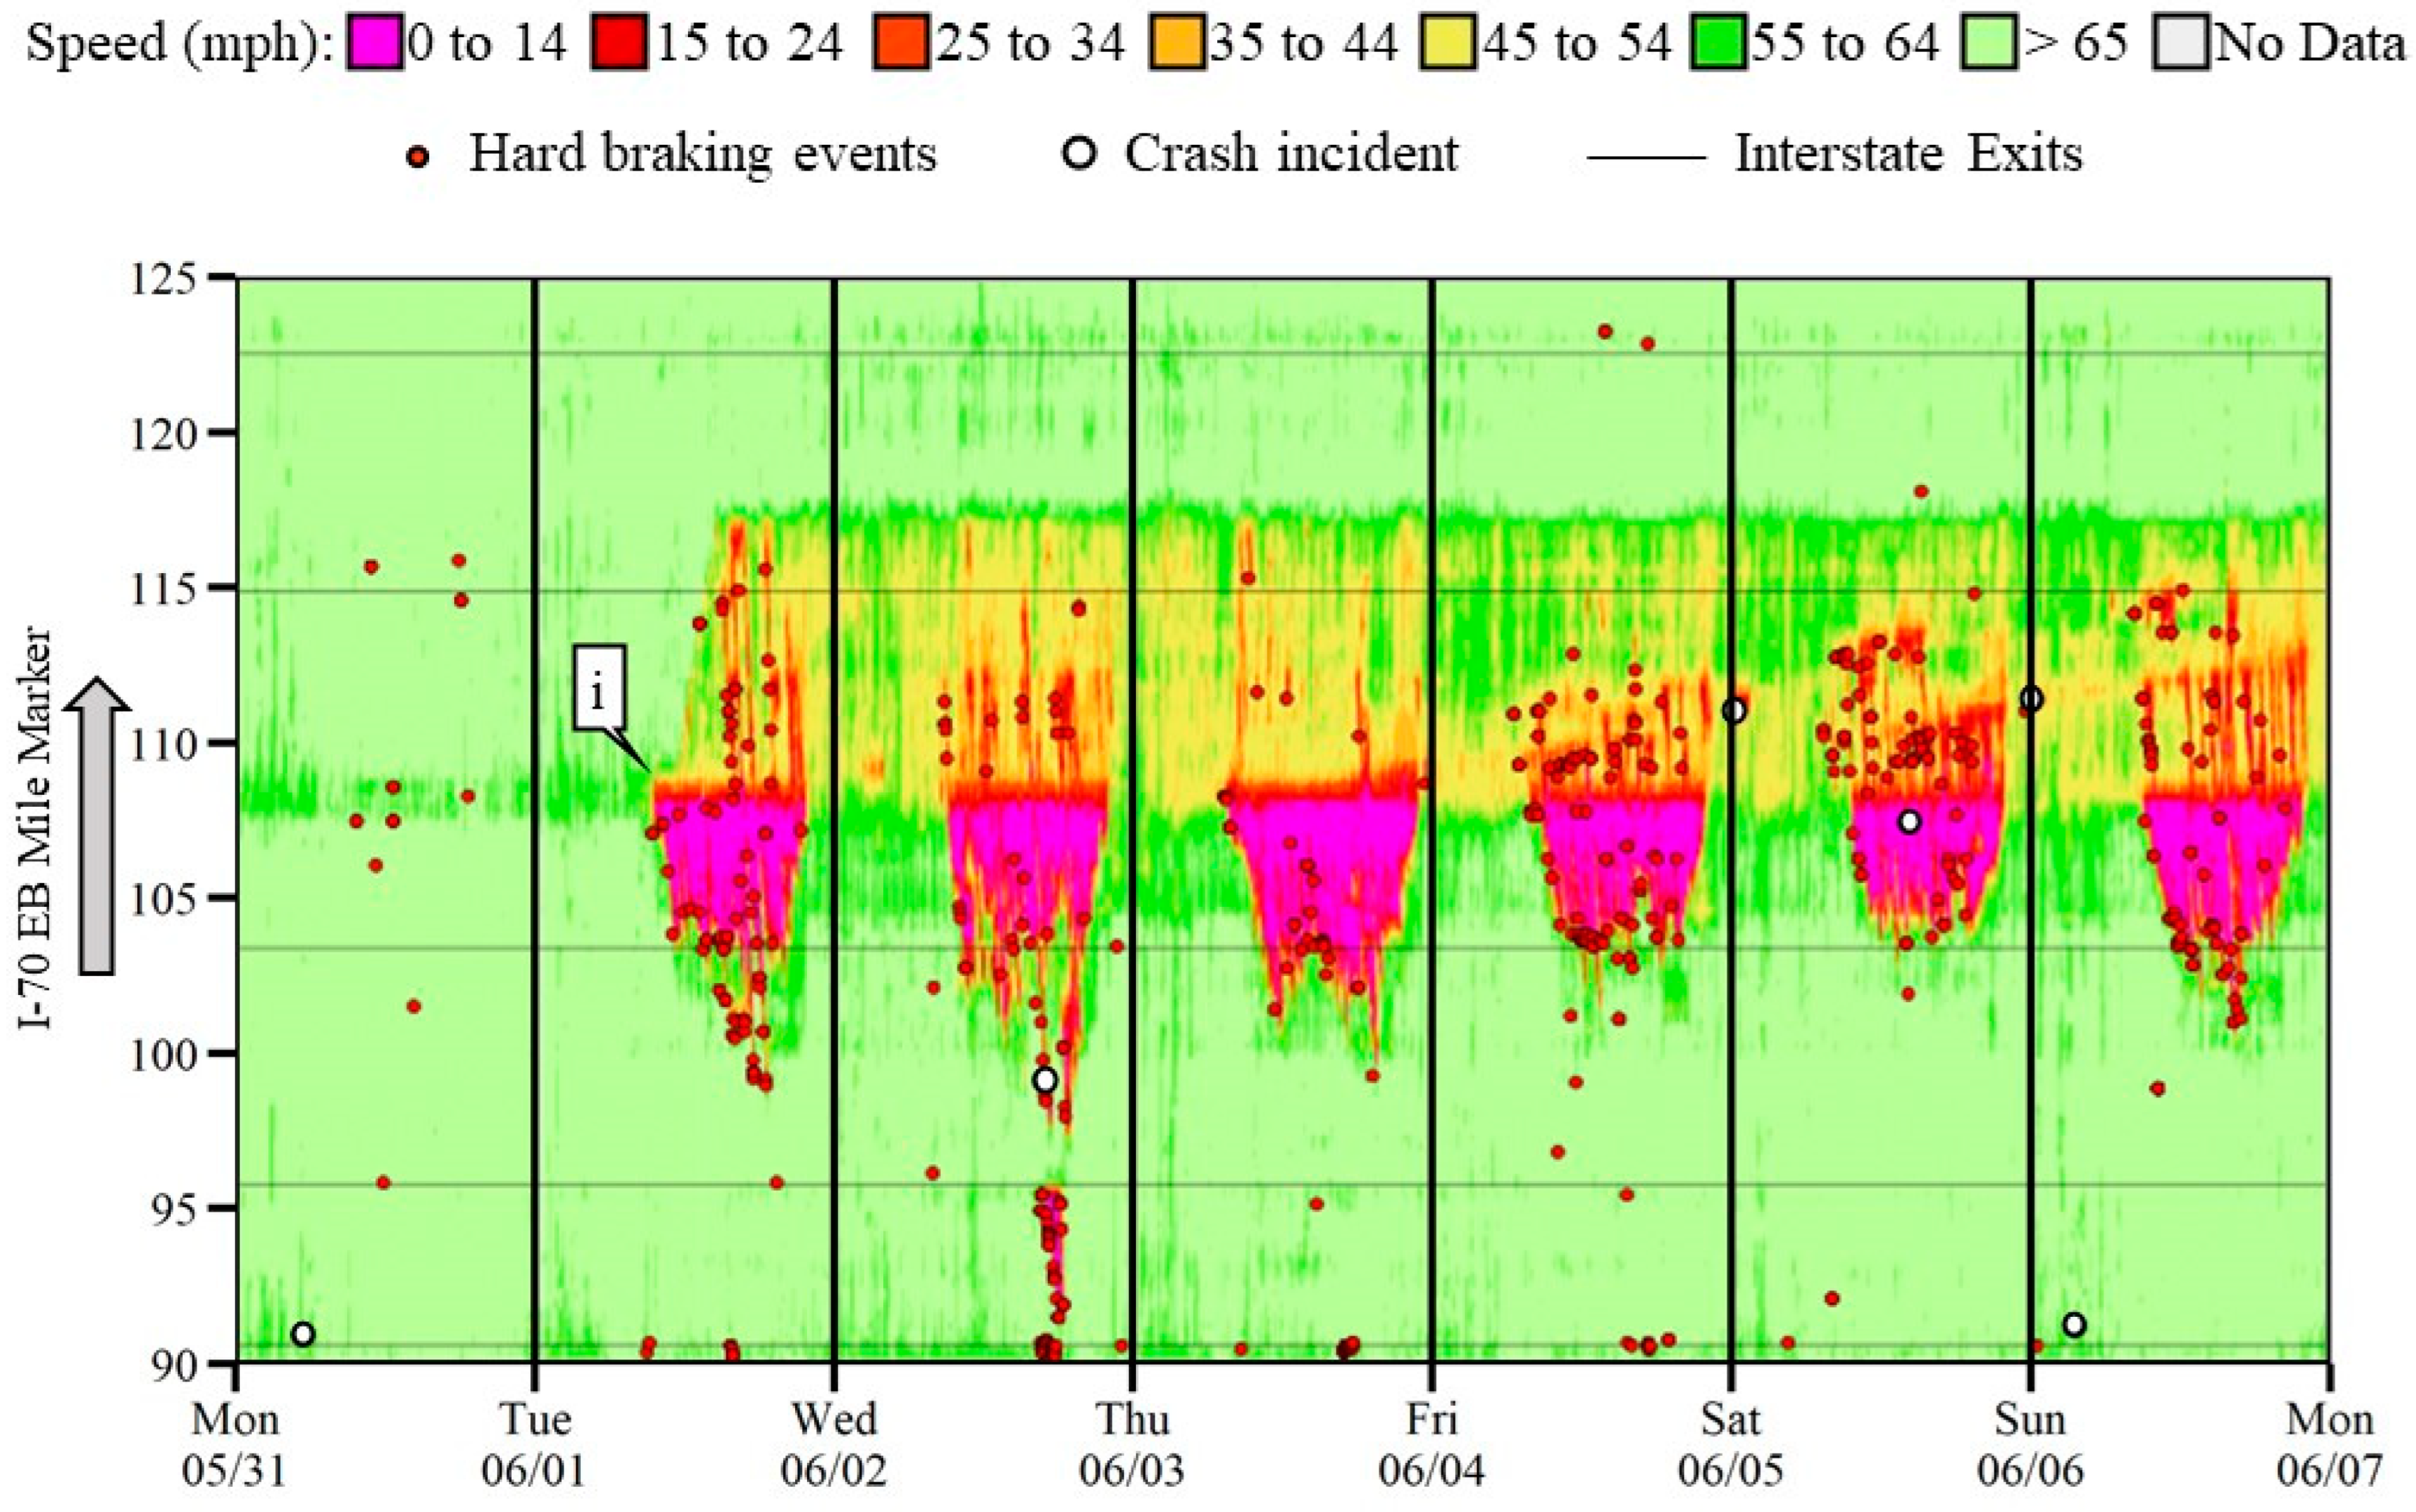
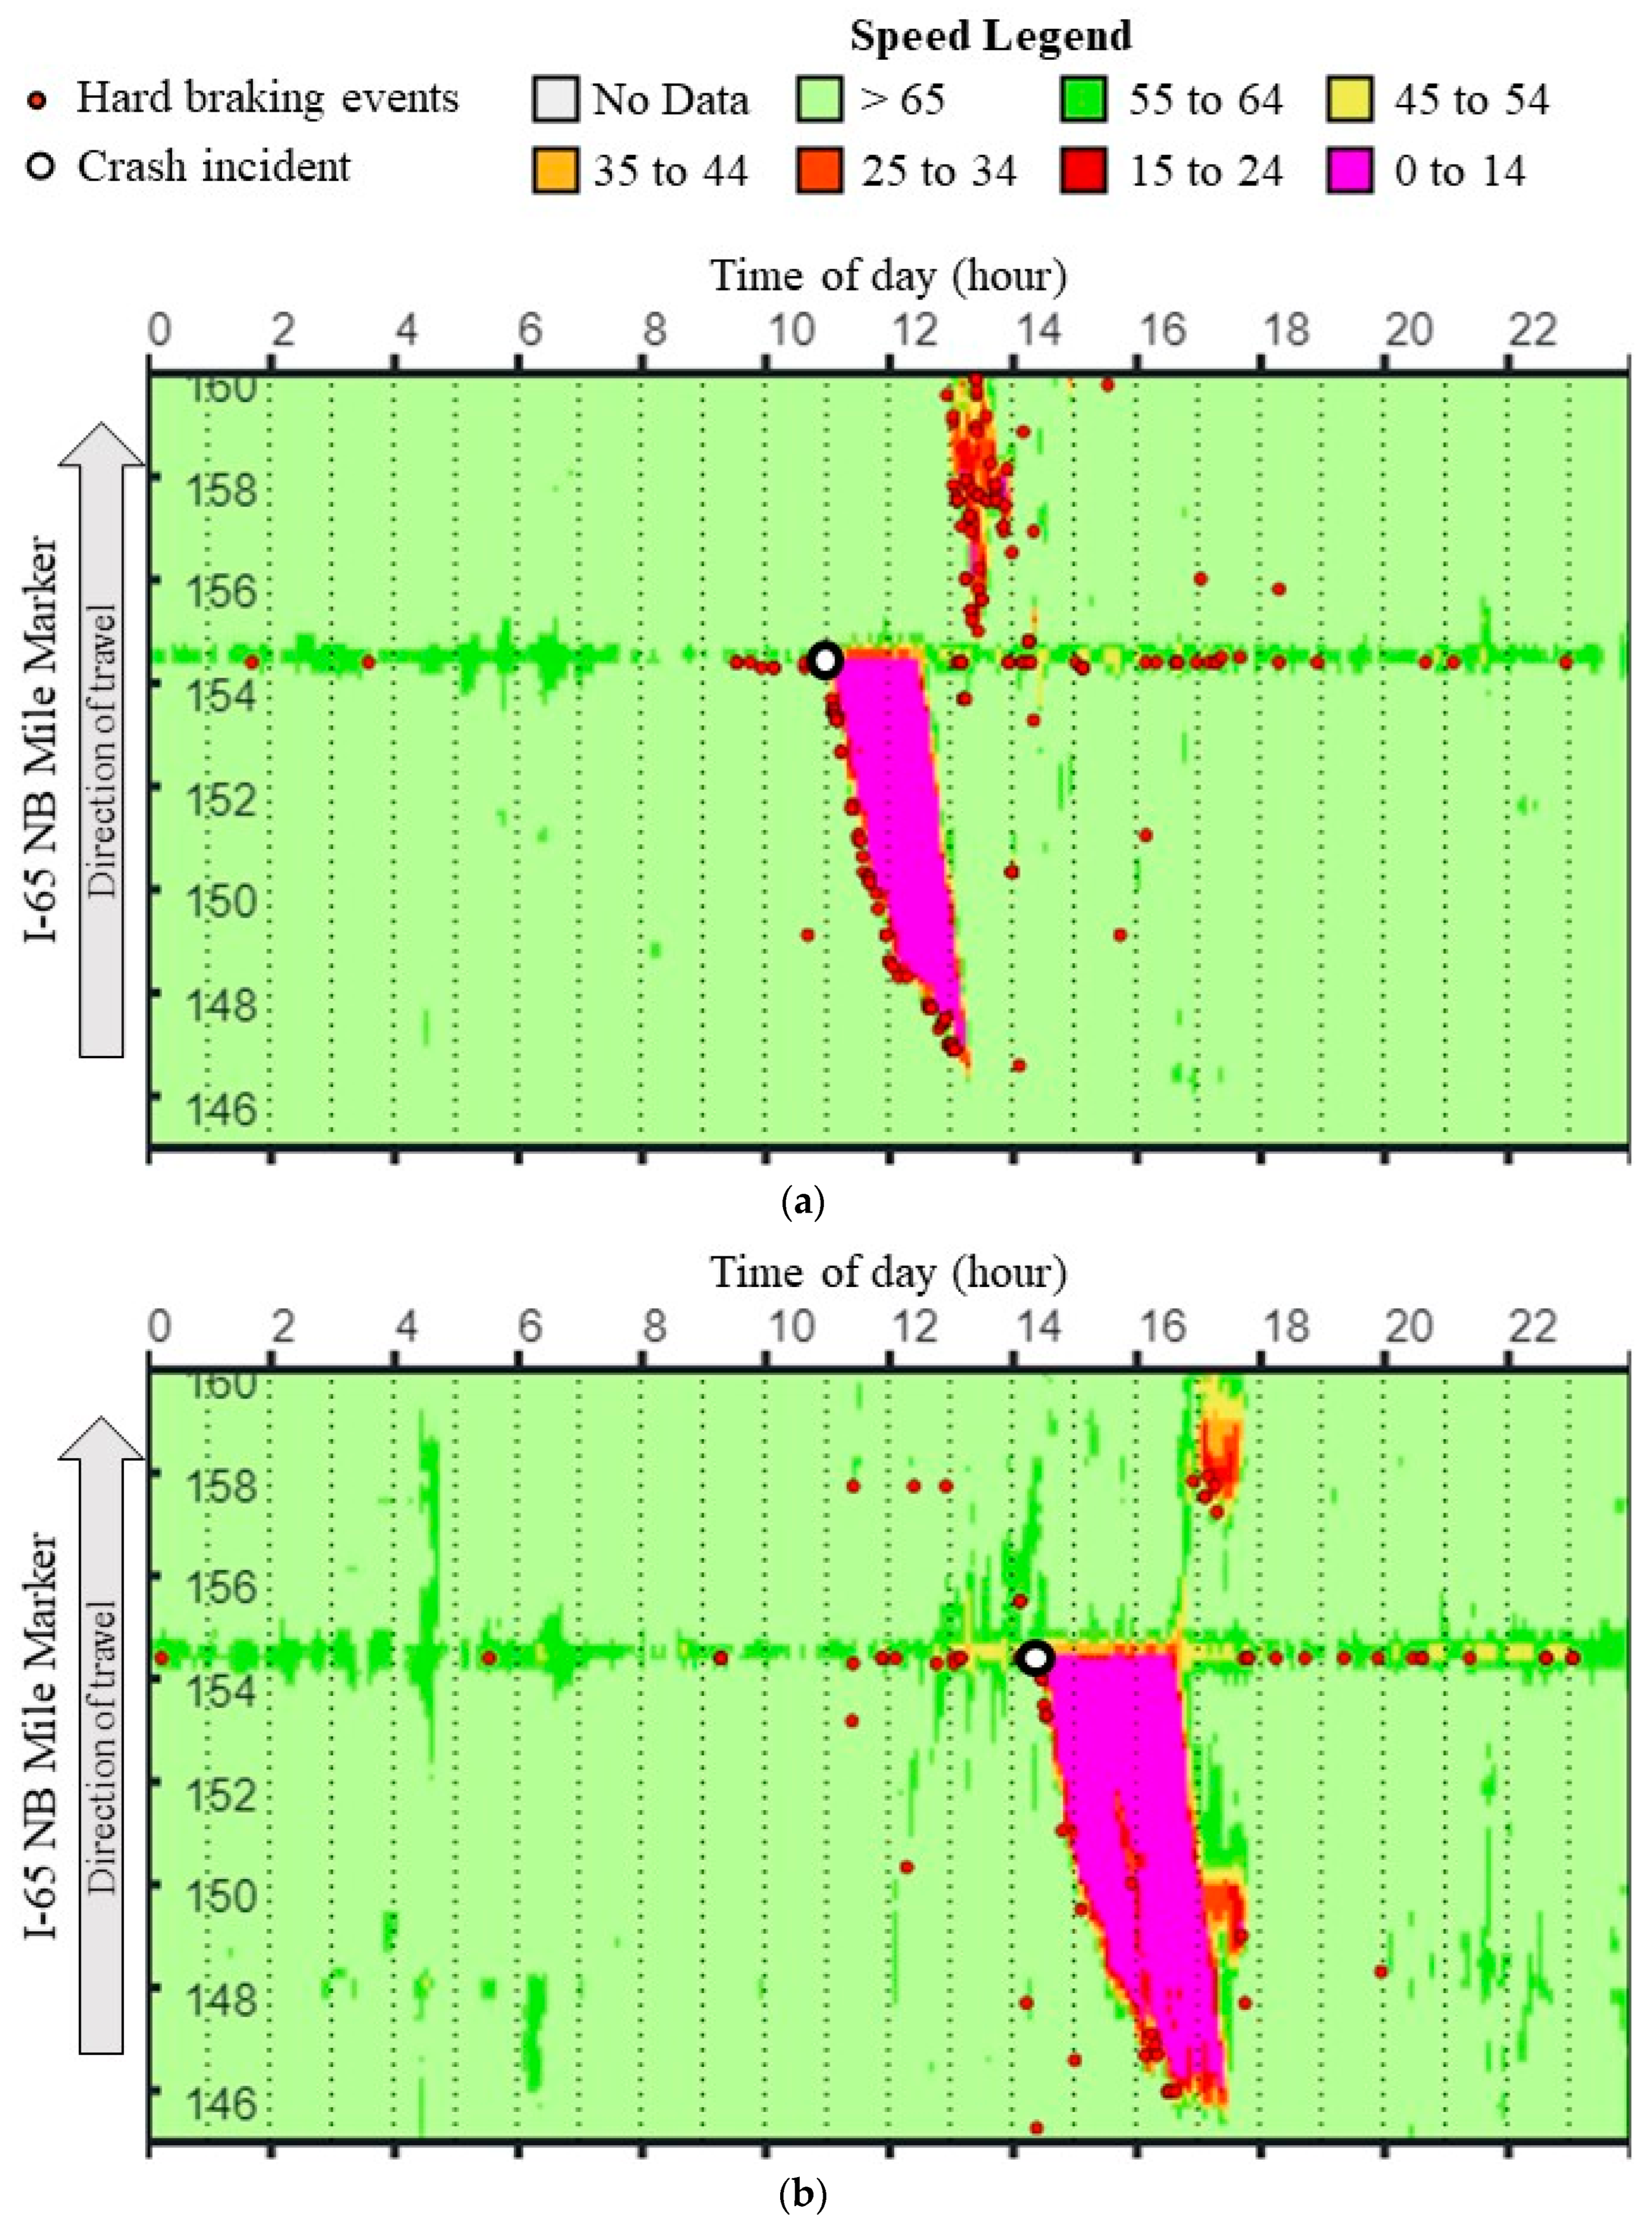
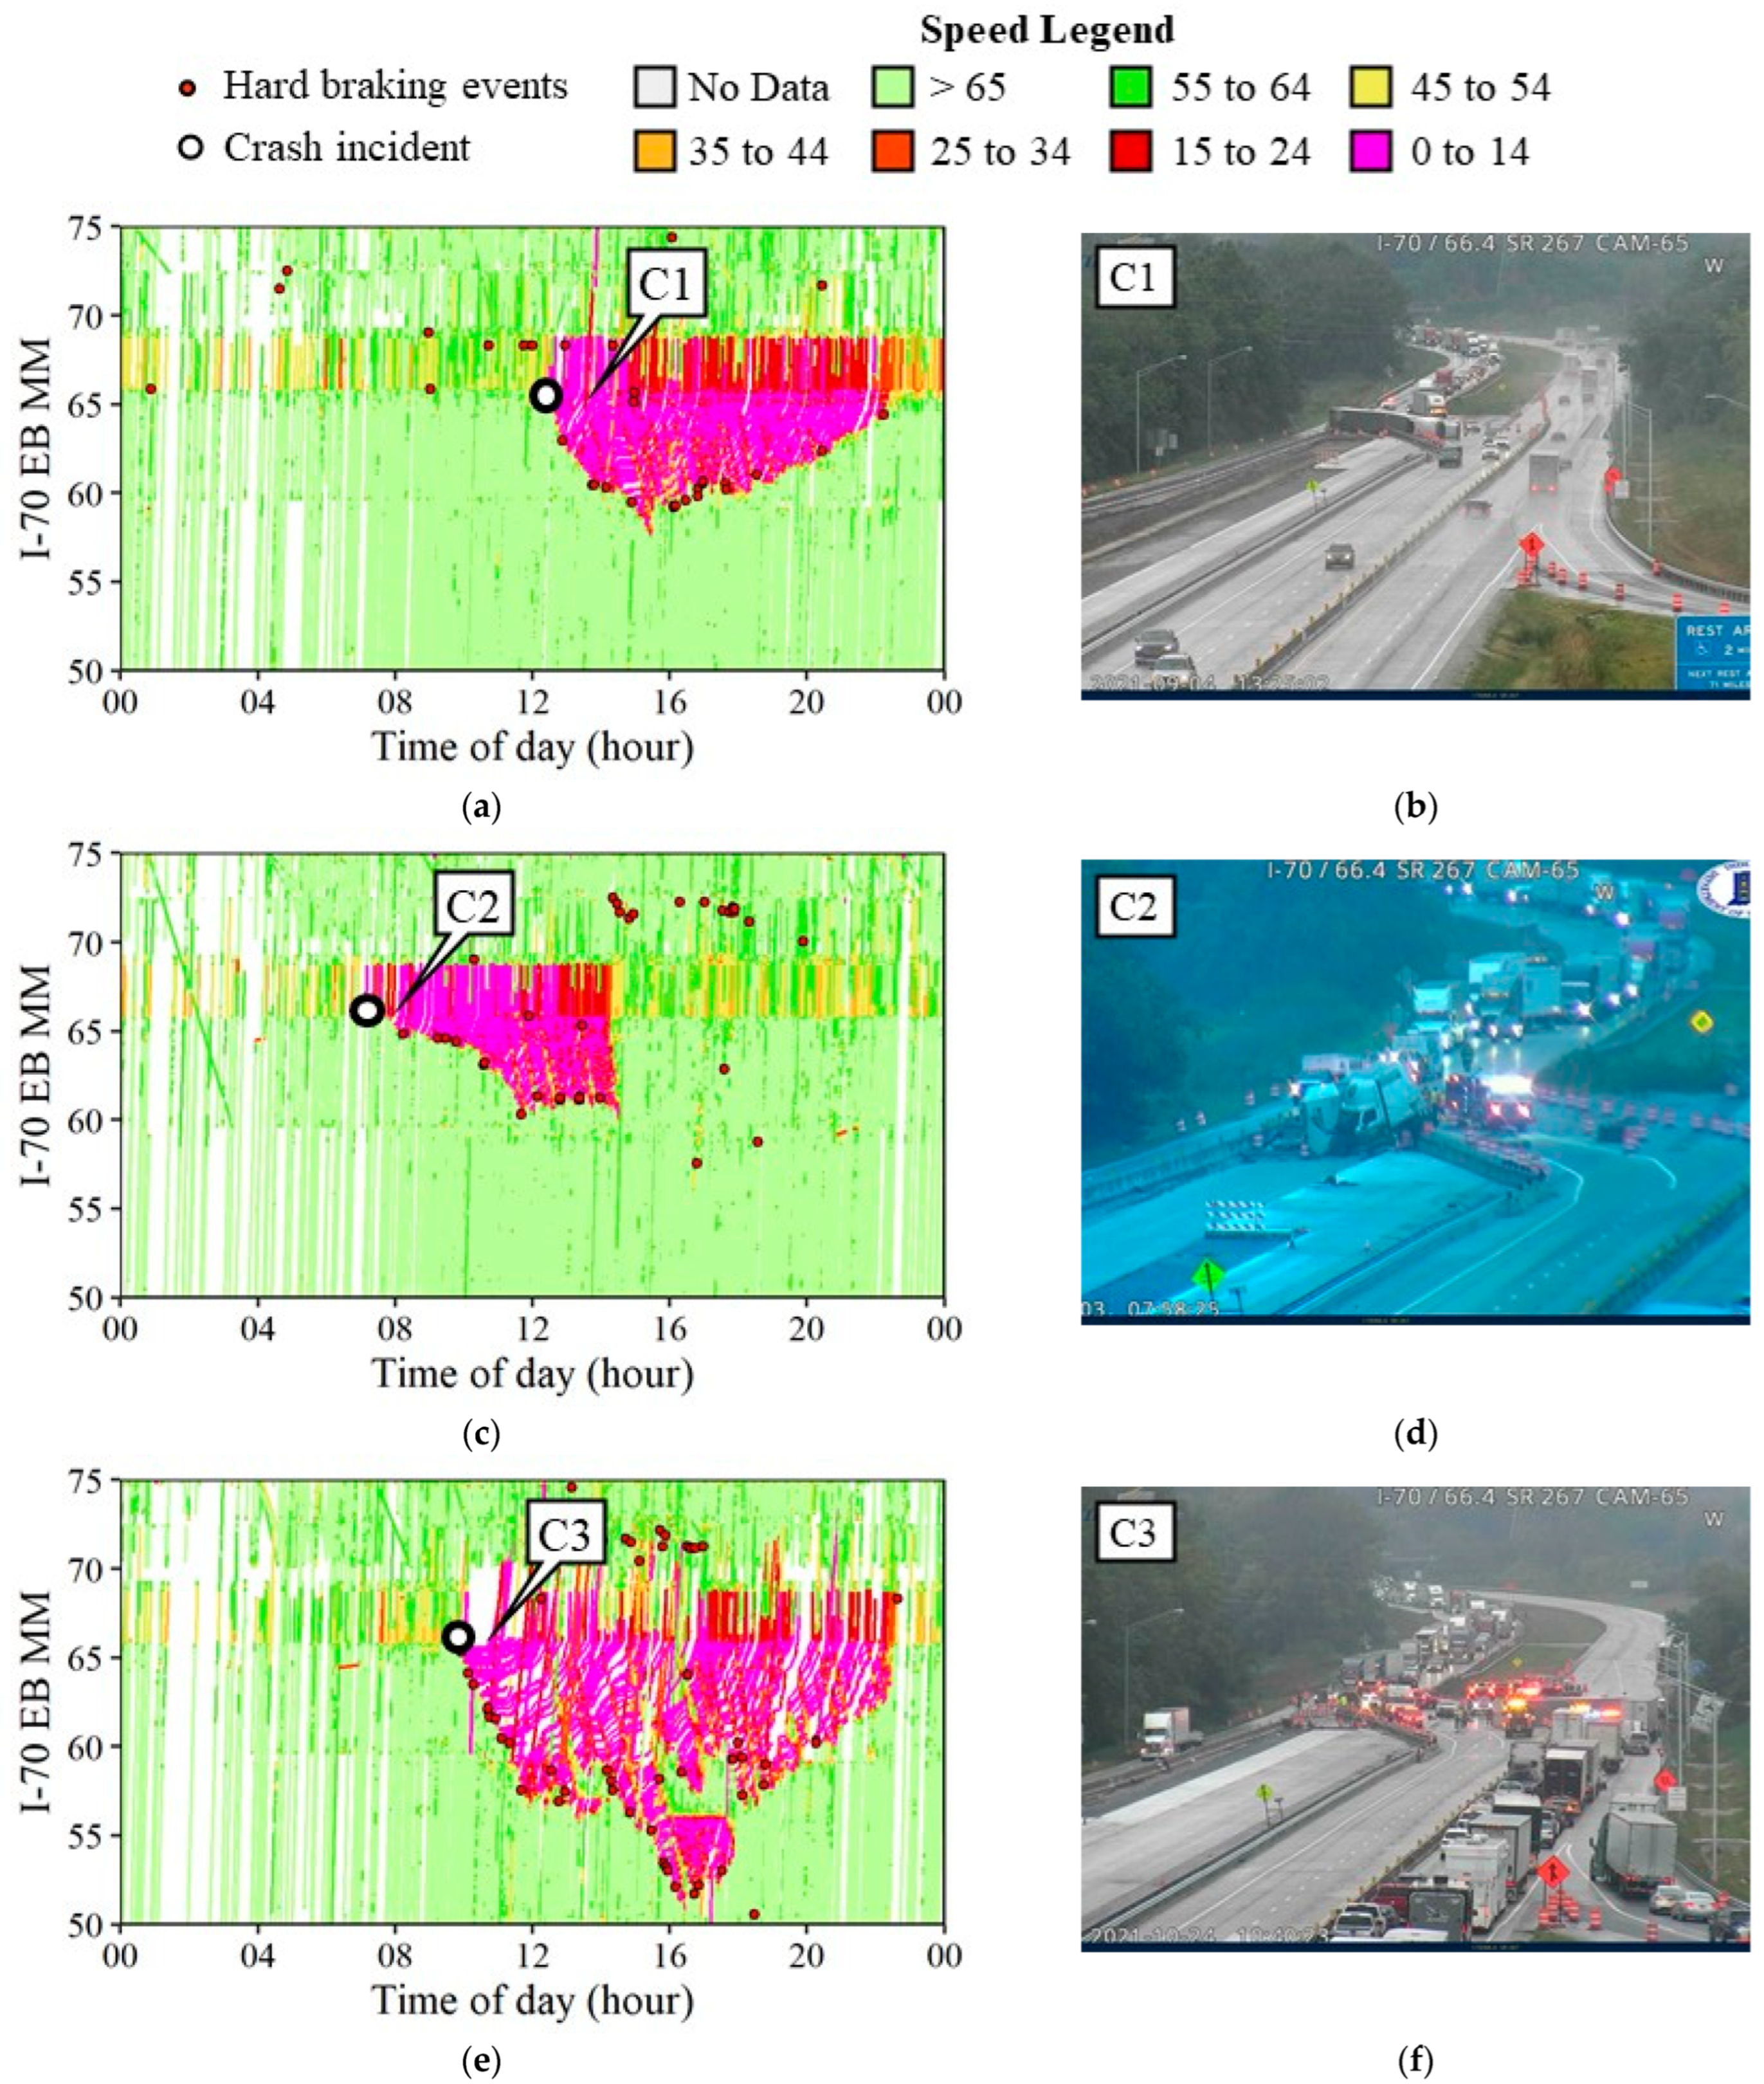
  • Monitor spatial and temporal trends in queueing using heatmaps (Figure 13). These graphics are generated in near real time (approximately a five-minute lag) and are particularly useful for assessing the impact of particular interventions.
  • The visual and quantitative nature of these graphics (Figure 13) provides a rich data source that can be used for informing future work zone designs with quantitative evaluation of how past work zones (Figure 14) operated (Figure 16, Figure 17 and Figure 18).

12. Conclusions

Traditional methods of collecting crash data over several months (Figure 3) are not sufficient for agile monitoring and adjustment of work zone operations due to the long turnaround time to collect sufficient data in order to make an informed decision. This paper demonstrated both quantitatively and qualitatively how CV data provide an opportunity for near real-time operational assessment of work zone operations using metrics such as congestion (Figure 4), location based speed profiles (Figure 13), and hard braking (Figure 11). This systematic methodology for integrating CV data into operational decision making was illustrated using case studies on I-65 (Figure 16) and I-70 (Figure 19) to demonstrate how early warning signs from CV data can be utilized.
The availability of data across different states and ease of scalability makes the methodology implementable on a state or national basis for tracking any highway work zone with little to no infrastructure investment. These techniques can provide a nationwide opportunity in assessing the current guidelines and giving feedback in updating the design procedures to improve the consistency and safety of construction work zones on a national level.

Author Contributions

The authors confirm contribution to the paper as follows: study conception and design: D.M.B. and M.A.K.; data collection: H.L. and J.D.; analysis and interpretation of results: R.S.S., J.D. and H.L.; draft manuscript preparation: R.S.S., J.D. and H.L. All authors have read and agreed to the published version of the manuscript.

Funding

This research was funded by the Indiana Department of Transportation, grant number SPR-4536.

Institutional Review Board Statement

Not applicable.

Informed Consent Statement

Not applicable.

Data Availability Statement

Not applicable.

Acknowledgments

Hard-braking events data and trajectory data between 1 April 2021, and 31 October 2021 used in this study were provided by Wejo Data Services, Inc. Segment-based traffic speeds data since January 2019 used in this study were provided by INRIX. The contents of this study reflect the views of the authors, who are responsible for the facts and the accuracy of the data presented herein and do not necessarily reflect the official views or policies of the sponsoring organizations. These contents do not constitute a standard, specification, or regulation.

Conflicts of Interest

The authors declare no conflict of interest.

References

  1. National Highway Traffic Safety Administration (NHTSA) FARS 2019 Traffic Fatality Data. Available online: https://www.nhtsa.gov/research-data/fatality-analysis-reporting-system-fars (accessed on 8 March 2022).
  2. Federal Highway Administration (FHWA) Work Zone Facts and Statistics 2021. Available online: https://ops.fhwa.dot.gov/wz/resources/facts_stats.htm (accessed on 9 February 2022).
  3. McLoud, D. Ohio DOT Reports string of Work-Zone Crashes Despite Less Traffic. 2020. Available online: https://www.equipmentworld.com/better-roads/article/14972341/ohio-dot-reports-string-of-workzone-crashes-despite-less-traffic (accessed on 16 April 2022).
  4. McLoud, D. Missouri Work zone Crashes double Despite Half the Traffic. 2020. Available online: https://www.equipmentworld.com/better-roads/article/14972527/modot-reports-doubled-work-zone-crashes-year-over-year (accessed on 16 April 2022).
  5. Colorado Department of Transportation (CDOT) and CSP warn that not all Workplaces are Meant to ‘Zoom’. 2020. Available online: https://www.codot.gov/news/2020/november-2020/workzonesafety-zoom (accessed on 16 April 2022).
  6. Despite Fewer Drivers on the Road, Texas work Zone Traffic Deaths Climb During Pandemic. 2020. Available online: https://cbsaustin.com/news/local/despite-fewer-drivers-on-the-road-texas-work-zone-traffic-deaths-climb-during-pandemic (accessed on 16 April 2022).
  7. National Highway Traffic Safety Administration (NHTSA) Early Estimate of Motor Vehicle Traffic Fatalities for the First Half (January–June) of 2021. Available online: https://crashstats.nhtsa.dot.gov/Api/Public/ViewPublication/813199 (accessed on 8 March 2022).
  8. Hunter, M.; Mathew, J.K.; Li, H.; Bullock, D.M. Estimation of Connected Vehicle Penetration on US Roads in Indiana, Ohio, and Pennsylvania. J. Transp. Technol. 2021, 11, 597–610. [Google Scholar] [CrossRef]
  9. Day, C.; McNamara, M.; Li, H.; Sakhare, R.; Desai, J.; Cox, E.; Horton, D.; Bullock, D. 2015 Indiana Mobility Report and Performance Measure Dashboards; Purdue University: West Lafayette, IN, USA, 2016. [Google Scholar]
  10. Mudge, R.; Mahmassani, H.S.; Haas, R.; Talebpour, A.; Carroll, L.; United States Federal Highway Administration Office of Operations. Work Zone Performance Measurement Using Probe Data; United States Federal Highway Administration, Office of Operations: Washington, DC, USA, 2013.
  11. Brennan, T.M.; Remias, S.M.; Grimmer, G.M.; Horton, D.K.; Cox, E.D.; Bullock, D.M. Probe Vehicle–Based Statewide Mobility Performance Measures for Decision Makers. Transp. Res. Rec. J. Transp. Res. Board 2013, 2338, 78–90. [Google Scholar] [CrossRef] [Green Version]
  12. CDay, C.M.; Emtenana, T.; Mahmud, S.; Knickerbocker, S. Data Driven Identification of Candidates for Operational Improvement. No. InTrans Project 19-716, Ames, IA, USA, October 2021. Available online: https://intrans.iastate.edu/ (accessed on 3 March 2022).
  13. Kamyab, M.; Remias, S.; Najmi, E.; Rabinia, S.; Waddell, J.M. Machine learning approach to forecast work zone mobility using probe vehicle data. Transp. Res. Rec. 2020, 2674, 157–167. [Google Scholar] [CrossRef]
  14. Desai, J.; Saldivar-Carranza, E.; Mathew, J.K.; Li, H.; Platte, T.; Bullock, D. Methodology for Applying Connected Vehicle Data to Evaluate Impact of Interstate Construction Work Zone Diversions. In Proceedings of the IEEE International Intelligent Transportation Systems Conference (ITSC), Indianapolis, IN, USA, 19–22 September 2021; pp. 4035–4042. [Google Scholar]
  15. Saldivar-Carranza, E.D.; Hunter, M.; Li, H.; Mathew, J.; Bullock, D.M. Longitudinal Performance Assessment of Traffic Signal System Impacted by Long-Term Interstate Construction Diversion Using Connected Vehicle Data. J. Transp. Technol. 2021, 11, 644–659. [Google Scholar] [CrossRef]
  16. Desai, J.; Li, H.; Mathew, J.K.; Cheng, Y.-T.; Habib, A.; Bullock, D.M. Correlating Hard-Braking Activity with Crash Occurrences on Interstate Construction Projects in Indiana. J. Big Data Anal. Transp. 2021, 3, 27–41. [Google Scholar] [CrossRef]
  17. Desai, J.; Rogers, S.; Kim, W.; Li, H.; Horton, D.; Poturalski, J.; Bullock, D.M. Agile Work Zone Management Based on Connected Vehicle Data. In Proceedings of the IEEE International Intelligent Transportation Systems Conference (ITSC), Indianapolis, IN, USA, 19–22 September 2021; pp. 4051–4056. [Google Scholar] [CrossRef]
  18. Mathew, J.K.; Desai, J.C.; Sakhare, R.S.; Kim, W.; Li, H.; Bullock, D.M. Big data applications for managing roadways. ITE J. Inst. Transp. Eng. 2021, 91, 28–35. [Google Scholar]
  19. Mekker, M.M.; Remias, S.M.; McNamara, M.L.; Bullock, D.M. Characterizing Interstate Crash Rates Based on Traffic Congestion Using Probe Vehicle Data; JTRP Affiliated Reports; Purdue University: West Lafayette, IN, USA, 2020. [Google Scholar] [CrossRef]
  20. Ullman, G.; Lomax, T.; Scriba, T. A Primer on Work Zone Safety and Mobility Performance Measurement; United States Federal Highway Administration, Office of Operations: Washington, DC, USA, 2011. [CrossRef]
  21. Mokhtarimousavi, S.; Anderson, J.C.; Azizinamini, A.; Hadi, M. Improved Support Vector Machine Models for Work Zone Crash Injury Severity Prediction and Analysis. Transp. Res. Rec. 2019, 2673, 680–692. [Google Scholar] [CrossRef]
  22. Hunter, M.; Saldivar-Carranza, E.; Desai, J.; Mathew, J.K.; Li, H.; Bullock, D.M. A Proactive Approach to Evaluating Intersection Safety Using Hard-Braking Data. J. Big Data Anal. Transp. 2021, 3, 81–94. [Google Scholar] [CrossRef]
  23. Sakhare, R.S.; Desai, J.C.; Mathew, J.K.; McGregor, J.D.; Bullock, D.M. Evaluation of the Impact of Presence Lighting and Digital Speed Limit Trailers on Interstate Speeds in Indiana Work Zones. J. Transp. Technol. 2021, 11, 157–167. [Google Scholar] [CrossRef]
  24. Sakhare, R.S.; Desai, J.C.; Mahlberg, J.; Mathew, J.K.; Kim, W.; Li, H.; McGregor, J.D.; Bullock, D.M. Evaluation of the Impact of Queue Trucks with Navigation Alerts Using Connected Vehicle Data. J. Transp. Technol. 2021, 11, 561–576. [Google Scholar] [CrossRef]
  25. Mathew, J.K.; Desai, J.; Li, H.; Bullock, D.M.; Mathew, J.K.; Desai, J.; Li, H.; Bullock, D.M. Using Anonymous Connected Vehicle Data to Evaluate Impact of Speed Feedback Displays, Speed Limit Signs and Roadway Features on Interstate Work Zones Speeds. J. Transp. Technol. 2021, 11, 545–560. [Google Scholar] [CrossRef]
  26. Governor of Indiana. Directive for Hoosiers to Stay at Home. Executive Department Indianapolis, State of Indiana, USA. 2020. Available online: https://www.in.gov/gov/files/Executive_Order_20-08_Stay_at_Home.pdf (accessed on 18 March 2022).
  27. National Weather Service. Winter Storm of 14–16 February 2021. 2021. Available online: https://www.weather.gov/ind/Feb15WinterStorm (accessed on 7 February 2022).
  28. National Weather Service. Overview of 30–31 January Winter Storm. 2021. Available online: https://www.weather.gov/iwx/2021_0131_WinterStorm (accessed on 7 February 2022).
  29. National Weather Service. Winter Storm Summary—15–16 February 2021. 2021. Available online: https://www.weather.gov/iwx/2021021516_winterstorm (accessed on 7 February 2022).
  30. Indiana Department of Transportation. Traffic Count Database System (TCDS) Location ID 990108. 2022. Available online: http://www.ms2soft.com/tcds/?loc=Indot&mod=tcds&local_id=990108 (accessed on 9 March 2022).
  31. Indiana Department of Transportation. Protect the Queue: INDOT’s Queue Awareness Program. Available online: https://www.in.gov/indot/safety/protect-the-queue-indots-queue-awareness-program/ (accessed on 16 February 2022).
  32. Greene, K. North Split Detours Start This Weekend until Late Next Year. Available online: https://www.wthr.com/article/traffic/traffic-news/north-split-closing-may-15-until-late-2022/531-7c721545-b014-4b22-82b3-42fe16c5b375 (accessed on 10 February 2022).
  33. Indiana Department of Transportation. Traffic Count Database System (TCDS) Location ID 991325. 2022. Available online: http://www.ms2soft.com/tcds/?loc=Indot&mod=tcds&local_id=991325 (accessed on 9 March 2022).
  34. Indiana Department of Transportation. I-70/Mt Comfort Road to SR 9. Available online: https://www.in.gov/indot/about-indot/central-office/welcome-to-the-greenfield-district/i-70mt-comfort-road-to-sr-9/ (accessed on 7 February 2022).
  35. Indiana Department of Transportation. INDOT to Close I-70 in both Directions from North Split to I-465 for 30 Days. 2020. Available online: https://content.govdelivery.com/accounts/INDOT/bulletins/2849a1a (accessed on 4 April 2022).
  36. Xie, L.; Wu, C.; Duan, M.; Lyu, N. Analysis of Freeway Safety Influencing Factors on Driving Workload and Performance Based on the Gray Correlation Method. J. Adv. Transp. 2021, 2021, 6566207. [Google Scholar] [CrossRef]
  37. Jeong, H.; Liu, Y. Driver workload and secondary task modality while driving on horizontal curves. Proc. Hum. Factors Ergon. Soc. 2017, 61, 1763–1767. [Google Scholar] [CrossRef]
  38. Cafiso, S.; La Cava, G. Driving performance, alignment consistency, and road safety. Transp. Res. Rec. 2009, 2102, 1–8. [Google Scholar] [CrossRef]
Figure 1. Indiana Interstate System.
Safety 08 00041 g001
Figure 2. Performance metrics over three years across all Indiana interstates. (a) Weekly number of crash incidents; (b) Weekly mile–hours of congestion (<45 mph).
Safety 08 00041 g002
Figure 3. Monthly crash incidents on the Indiana interstate system.
Safety 08 00041 g003
Figure 4. Mile–hours of congestion (<45 mph) during the 2021 construction season. (a) Mile–hours of congestion by Interstates; (b) Mile–hours of congestion by INDOT districts.
Safety 08 00041 g004aSafety 08 00041 g004b
Figure 5. Daily mile–hours of congestion stacked by speed bins across I-465. (a) I-465 Inner Loop; (b) I-465 Outer Loop.
Safety 08 00041 g005aSafety 08 00041 g005b
Figure 6. Comparison of hard-braking events across I-465. (a) Weekly hard-braking events (Inner Loop); (b) Percentage change in hard-braking events from previous week (Inner Loop); (c) Weekly hard-braking events (Outer Loop); (d) Percentage change in hard-braking events from previous week (Outer Loop).
Safety 08 00041 g006aSafety 08 00041 g006b
Figure 7. Daily mile–hours of congestion stacked by speed bins across I-70. (a) I-70 eastbound direction; (b) I-70 westbound direction.
Safety 08 00041 g007aSafety 08 00041 g007b
Figure 8. Comparison of hard-braking events across I-70. (a) Weekly hard-braking events (eastbound); (b) Percentage change in hard-braking events from previous week (eastbound); (c) Weekly hard-braking events (westbound); (d) Percentage change in hard-braking events from previous week (westbound).
Safety 08 00041 g008aSafety 08 00041 g008b
Figure 9. Daily mile–hours of congestion stacked by speed bins across I-74. (a) I-74 eastbound direction; (b) I-74 westbound direction.
Safety 08 00041 g009aSafety 08 00041 g009b
Figure 10. Comparison of hard-braking events across I-74. (a) Weekly hard-braking events (eastbound); (b) Percentage change in hard-braking events from previous week (eastbound); (c) Weekly hard-braking events (westbound); (d) Percentage change in hard-braking events from previous week (westbound).
Safety 08 00041 g010aSafety 08 00041 g010b
Figure 11. Hard-braking events for each 1-mile segment on I-70 EB. (a) Sunday, 24 May—Saturday, 30 May 2020; (b) Sunday, 31 May—Saturday, 6 June 2020; (c) Sunday, 24 May—Saturday, 30 May 2021; (d) Sunday, 31 May—Saturday, 6 June 2021.
Safety 08 00041 g011
Figure 12. Daily mile–hours of congestion and hard-braking events before and during the construction period along I-70 EB (MM 90–MM 125) in Greenfield district. (a) Daily mile–hours of congestion by speed bins; (b) Daily hard-braking events.
Safety 08 00041 g012
Figure 13. Traffic speed heatmap for I-70 EB (MM 90–MM 125) for the week of 31 May.
Safety 08 00041 g013
Figure 14. I-65 NB around MM 154.4 at Manson and Colfax.
Safety 08 00041 g014
Figure 15. Interquartile speeds for 0.1-mile segments during and after the lane shift on I-65 NB. (a) Speeds during the lane shift (Monday, 12 April–Sunday, 18 April 2021); (b) Speeds after the lane shift (Monday, 3 May–Sunday, 9 May 2021).
Safety 08 00041 g015
Figure 16. Monthly hard-braking events I-65 northbound direction from MM 150 to MM 160.
Safety 08 00041 g016
Figure 17. Hard-braking events by 1 mile-segments along I-65 NB between MM 150 and MM 160. (a) Monday, 21 December 2020–Sunday, 27 December 2020 (before); (b) Monday, 5 April 2021–Sunday, 11 April 2021 (during crossover); (c) Monday, 3 May 2021–Sunday, 9 May 2021 (after return to normal).
Safety 08 00041 g017
Figure 18. Crash incidents at during the lane shift on interstate. (a) Sunday, 4 April 2021; (b) Sunday, 11 April 2021.
Safety 08 00041 g018
Figure 19. Monthly hard-braking events along I-70 EB from MM 65 to MM 66.8.
Safety 08 00041 g019
Figure 20. Traffic speed heatmaps and camera images on I-70 EB. (a) Saturday, 4 September 2021; (b) Camera image at 1:25 PM from MM 66.4; (c) Sunday, 3 October 2021; (d) Camera image at 7:58 AM from MM 66.4; (e) Sunday, 24 October 2021; (f) Camera image at 10:40 AM from MM 66.4.
Safety 08 00041 g020
Publisher’s Note: MDPI stays neutral with regard to jurisdictional claims in published maps and institutional affiliations.

