Article

Prioritizing the Potential Smartification Measures by Using an Integrated Decision Support System with Sustainable Development Goals (a Case Study in Southern Italy)

by
Giuseppe Guido
,
Sina Shaffiee Haghshenas
,
Sami Shaffiee Haghshenas
,
Alessandro Vitale
,
Vincenzo Gallelli
* and
Vittorio Astarita
Department of Civil Engineering, University of Calabria, Via Bucci, 87036 Rende, Italy
*
Author to whom correspondence should be addressed.
Safety 2022, 8(2), 35; https://doi.org/10.3390/safety8020035
Submission received: 27 December 2021 / Revised: 13 April 2022 / Accepted: 14 April 2022 / Published: 5 May 2022

Abstract

:
With the increasing population of cities, expanding roads as one of the essential urban infrastructures is a necessary task; therefore, adverse effects such as increased fuel consumption, pollution, noise, and road accidents are inevitable. One of the most efficient ways to mitigate congestion-related adverse effects is to introduce effective intelligent transportation systems (ITS), using advanced technologies and mobile communication protocols to make roads smarter and reduce negative impacts such as improvement in fuel consumption and pollution, and reduction of road accidents, which leads to improving quality of life. Smart roads might play a growing role in the improved safety of road transportation networks. This study aims to evaluate and rank the potential smartification measures for the road network in Calabria, in southern Italy, with sustainable development goals. For this purpose, some potential smartification measures were selected. Experts in the field were consulted using an advanced procedure: four criteria were considered for evaluating these smartification measures. The Integrated fuzzy decision support system (FDSS), namely the fuzzy Delphi analytic hierarchy process (FDAHP) with the fuzzy technique for order performance by similarity to ideal solution (FTOPSIS) were used for evaluating and ranking the potential smartification measures. The results demonstrated that the repetition of signals in the vehicle has the highest rank, and photovoltaic systems spread along the road axis has the lowest rank to use as smartification measures in the roads of the case study.

1. Introduction

Roads always play a very vital role in human life as urban and rural arteries. Unfortunately, first of all, in terms of road safety. To persuade yourself that this is an important issue, just think that road traffic deaths, and traffic injuries represent the leading cause of death for people aged 5–29 years. Together with vehicles and driver behavior, infrastructure is one of the five pillars identified by the World Health Organization (WHO) to be adequately managed to ensure high levels of safety in road traffic. On the other hand, roads are essential elements for economic growth, increasing public welfare, and creating environmental issues such as air pollution. Roads are considered one of the main players in planning for sustainable development. Therefore, more attention to this essential infrastructure can significantly impact safety and sustainable development indicators. With the advancement of technology and various sciences such as artificial intelligence, wireless and mobile communications, and remote sensing, smart roads have received much attention. By smarting roads, not only will passenger safety and well-being increase, but smart roads will also enable us to deal with issues such as maintenance costs, congestion-related time-waste, accidents, pollution, and fuel consumption, helping society achieve sustainable development goals [1,2,3,4]. Despite the novelty of the subject, numerous valuable studies have been conducted on smart roads. Karpiriski et al., (2006) investigated a wireless sensor network of “cat’s eye” augmented with other intelligent capabilities to monitor vehicle behavior in smart roads. They developed the software architecture needed for overcoming the technical challenges [5]. Finogeev et al., (2019) evaluated a smart road environment using an intelligent monitoring system. Their results indicated that parameters become determinants for an unusual change in the traffic condition in measured areas [6]. Sabella et al., (2020) used new technologies for processing massive amount of data in the transportation industry. They employed the multi-access edge computing (MEC) MEC-based infotainment service for smart roads in 5G environments. The obtained results showed improved processing transport network data [7]. Toh et al., (2020) evaluated some advances in smart roads to realize future smart cities. Their results showed that the recent technological advancements in smart roads could be helpful for the sustainable development goals of smart cities [8]. Trubia et al., (2020) investigated the potential advantages and drawbacks of the characteristics of smart roads by considering the global vision of innovations in the automotive and transport industries. Based on their results, they made some recommendations for the characteristics of smart roads [9]. A traffic management system of an intelligent road network was proposed by Di Febbraro et al., (2020). The proposed system can be adapted to diverse smart road networks reserved for self-driving cars [10]. A framework for the development of simulations of smart roads was introduced by Fernández-Isabel et al., (2020). They modeled two different multi-agent systems (MASs). In this framework, the produced model specifications were determined using sensors. The obtained results indicated that satisfactory performance is gained using the proposed framework for developing simulations of smart roads [11].
Reviewing the literature shows that the development of technology and mobile communication protocols and their applications can be used as a reliable system for smart roads to achieve sustainable development goals. Further research is a fundamental and dire need in light of the novelty and importance of the subject. Therefore, the main aim of this study is to study and rank the potential smartification measures using an integrated fuzzy decision support system (FDSS), namely FDAHP-FTOPSIS, for the roads in Calabria, in southern Italy. It should be noted that the novelty of this research is in the evaluation and ranking of the smartification measures using fuzzy concepts and expert judgment and that this kind of analysis has not been applied in previous research.

2. Methodology

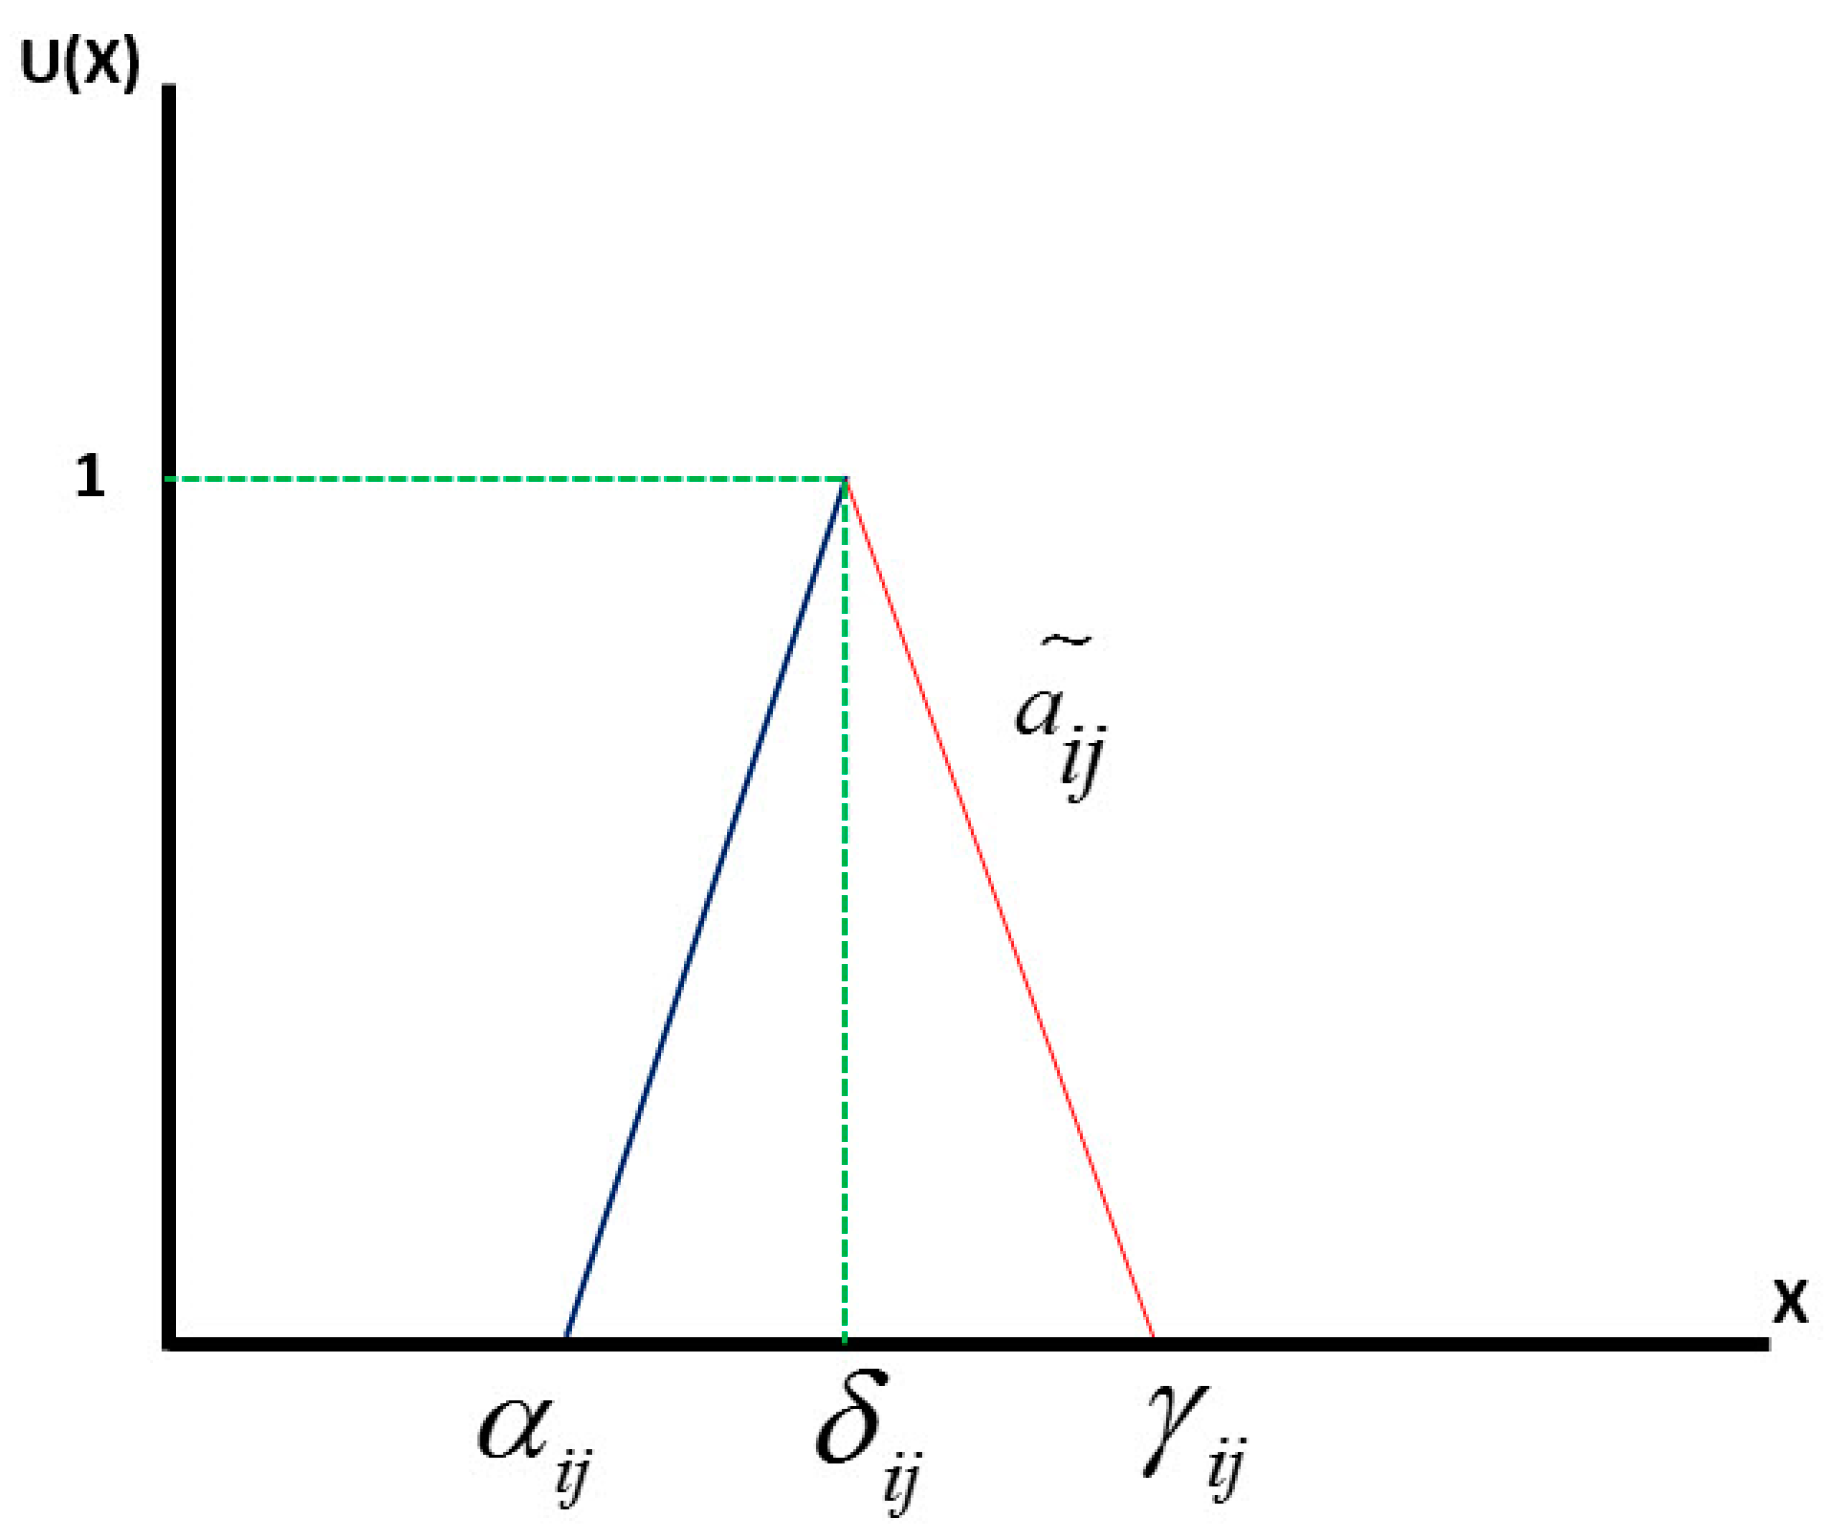
2.1. Fuzzy Delphi Analytic Hierarchy Process (FDAHP)

In recent decades, non-classical methods such as neural networks, meta-heuristic algorithms, machine learning, and fuzzy logic (FL) played a key role in solving theoretical and practical problems [12,13,14,15,16,17,18,19,20,21,22]. Many studies were conducted successfully to model, evaluate, and predict problems under unpredicted and uncertain conditions [23,24,25,26,27,28,29]. Among these approaches, fuzzy logic has a very high ability to adapt to today’s complex needs. Therefore, fuzzy logic as a multi-valued logic is very effective in defining multi-criteria decision problems. The fuzzy Delphi analytic hierarchy process (FDAHP) is one of the effective fuzzy multi-criteria decision-making methods used when there is insufficient information and knowledge about a problem; hence experts’ opinions are used to make decisions and judgments in this case [30,31,32,33,34,35,36]. This method aims to reach the best and most efficient group agreement between experts on a problem. The fuzzy Delphi method was proposed by Kaufman and Gupta, which is an extended model of the Delphi method [37,38]. The steps of FDAHP was introduced by Liu and Chen (2007) as follows [39]:

2.1.1. Survey of Experts and Calculation of Fuzzy Numbers

In the first step, relevant experts conducted a survey on a specific topic. Then the fuzzy numbers are generated directly from the experts’ surveys. Fuzzy numbers can be calculated based on triangular or trapezoidal membership functions. In this study, triangular fuzzy numbers (TFNs) a ~ i j are used, and the membership function is introduced according to Equations (1) to (4) and Figure 1 [40,41].
a ~ i j = ( α i j , δ i j , γ i j )
α i j = M i n ( β i j k ) , k = 1 , , n
δ i j = ( k = 1 n β i j k ) 1 n , k = 1 , , n
γ i j = M a x ( β i j k ) , k = 1 , , n
β i j k presents the relative importance of the ith parameter over the jth parameter from kth expert’s point of view. α i j and γ i j represent the upper and lower bound of experts’ opinions and δ i j is the geometric median of experts’ opinions.

2.1.2. Determining the Fuzzy Pairwise Comparison Matrix

In this step, according to the fuzzy numbers, the fuzzy pairwise comparison matrix is determined based on Equation (5) [40,41].
A ~ = [ a i j ~ ] , a i j ~ × a i j ~ 1 , j = 1 , 2 , 3 , , n   α i j , δ i j , γ i j

2.1.3. Calculating the Relative Fuzzy Weight of Parameters

After determining the fuzzy pairwise comparison matrix, the relative fuzzy weight of each parameter ( W i ~ ) is calculated based on Equations (6) and (7) [42,43].
Z i ~ = [ a i j ~ a i n ~ ] 1 / n , a 1 ~ a 2 ~ = ( α 1 × α 2 , δ 1 × δ 2 , γ 1 × γ 2 )
W i ~ = Z i ~ ( Z i ~ Z n ) ~
where the symbols and are the multiplication of fuzzy numbers and the addition of fuzzy numbers, respectively. W i ~ represents a row vector consisting of the fuzzy weight of the ith factor ( W i ~ = ( w 1 , w 2 , , w n ) , ( i = 1 , 2 , , n ) ).

2.1.4. Defuzzing the Weights of Parameters

In the final step, Equation (8) is used for defuzzing the weight of parameters and determining a nonfuzzy number for the weight of each parameter. The defuzzification is calculated based on the geometric mean technique [44].
W i = ( j = 1 n W i j ) 1 / n

2.2. Fuzzy Technique for Order Performance by Similarity to Ideal Solution (FTOPSIS)

The fuzzy multi-criteria decision-making methods are reliable systems for dealing with uncertainty when making decisions in engineering applications [45,46,47,48]. The fuzzy technique for order performance by similarity to ideal solution (FTOPSIS) has been used as one of the most effective fuzzy multi-criteria decision-making methods in a wide range of studies such as risk assessment of construction projects, logistics services, mining problems, and the quality of airline services [49,50,51,52]. In the FTOPSIS approach, a set of linguistic variables and their corresponding fuzzy numbers are introduced, and the process of evaluation is done by assigning them to the decision-making matrix and solving mathematical equations of FTOPSIS. In general form, eight steps were introduced for TOPSIS by Chen and Hwang (1992) as follows [53]:

2.2.1. Formation of Decision Matrix

The decision matrix is formed as follows:
A ~ = ( x ~ 11 x ~ 12 x ~ 1 j x ~ 21 x ~ 22 x ~ 2 j x ~ i 1 x ~ i 2 x ~ i j )
It is worth mentioning that x ~ i j = (s, l, r) as the fuzzy triangular numbers is used, that x ~ i j is the performance of ith (i = 1, 2, 3,…, N) alternative about jth (j = 1, 2, 3,…, n) criterion. This study indicates linguistic variables and their corresponding triangular fuzzy numbers for ranking alternatives and assessing criteria in Table 1 [40].

2.2.2. Determining the Weight Matrix of Criteria

In this step, each criterion’s weight of importance coefficient is calculated, and the weight matrix criteria are determined based on Equation (9) [53].
W ~ = [ w ~ 1 , w ~ 2 , , w ~ n ]
where w ~ j is the weight of importance coefficient of each criterion and each component of w ~ j is used as w ~ j = ( w 1 , w 2 , w 3 ) .

2.2.3. Normalization of the Fuzzy Decision Matrix

The normalized values are also fuzzy when fuzzy numbers are used in the decision matrix. According to Equations (10) and (11), normalization of the fuzzy triangular number is calculated for positive and negative criteria, respectively [40].
r ~ = [ a i j c j , b i j c j , c i j c j ]
r ~ = [ a j c i j , a j b i j , a j a i j ] c j = max i c i j a j = min i a i j
Then, the normalized fuzzy decision matrix R is molded based on Equation (12) with m criterion and n alternative [40].
R ~ = [ r ~ i j ] m × n i = 1 , 2 , 3 , .. , m j = 1 , 2 , 3 , . , n

2.2.4. Determining of the Weighted Normalized Fuzzy Decision Matrix

In this step, at first, the weight of each criterion is multiplied by the normalized fuzzy decision matrix based on Equation (13) [40].
v i j = r ~ i j · w j
where w j represents the weight of each criterion. Then, the weighted normalized fuzzy decision matrix is formed according to Equation (14) [40].
V ~ = [ v ~ i j ] m × n   i = 1 , 2 , 3 , .. , m j = 1 , 2 , 3 , . , n

2.2.5. Determining of Fuzzy Positive Ideal Solution (FPIS,A*) and Fuzzy Negative Ideal Solution (FPIS,A)

Based on Equations (15) and (16), fuzzy positive ideal solution and fuzzy negative ideal solution are determined [40].
A = ( v ~ 1 , v ~ 2 , , v ~ n )
where v ~ i and v ~ i represent the best and worst values of ith criterion from among all alternatives, respectively. The alternatives that are placed in A and A , represent ultimately better and ultimately worse alternatives, respectively.

2.2.6. Calculating of the Distance from Fuzzy Positive Ideal Solution and Fuzzy Negative Ideal Solution

In this step, the distance of each alternative is gained from the fuzzy positive ideal solution and fuzzy negative ideal solution based on Equations (17) and (18), respectively [40].
S i = j = 1 n d ( v ~ i j , v ~ j ) , j = 1 , 2 , , m
S t = j = 1 n d ( v ~ t j , v ~ j ) , j = 1 , 2 , , m
where d represents the distance between two fuzzy triangular numbers, which is calculated based on Equation (19) [40].
d v ( A ~ 1 , A ~ 2 ) = 1 3 [ ( s 1 s 2 ) 2 + ( l 1 l 2 ) 2 + ( r 1 r 2 ) 2 ]

2.2.7. Determining of the Closeness Coefficient (CC)

According to values of distance from a fuzzy positive ideal solution and a fuzzy negative ideal solution, the closeness coefficient of each alternative is calculated based on Equation (20).
C C i = S i S i + S i i = 1 , 2 , , m

2.2.8. Ranking of Alternatives
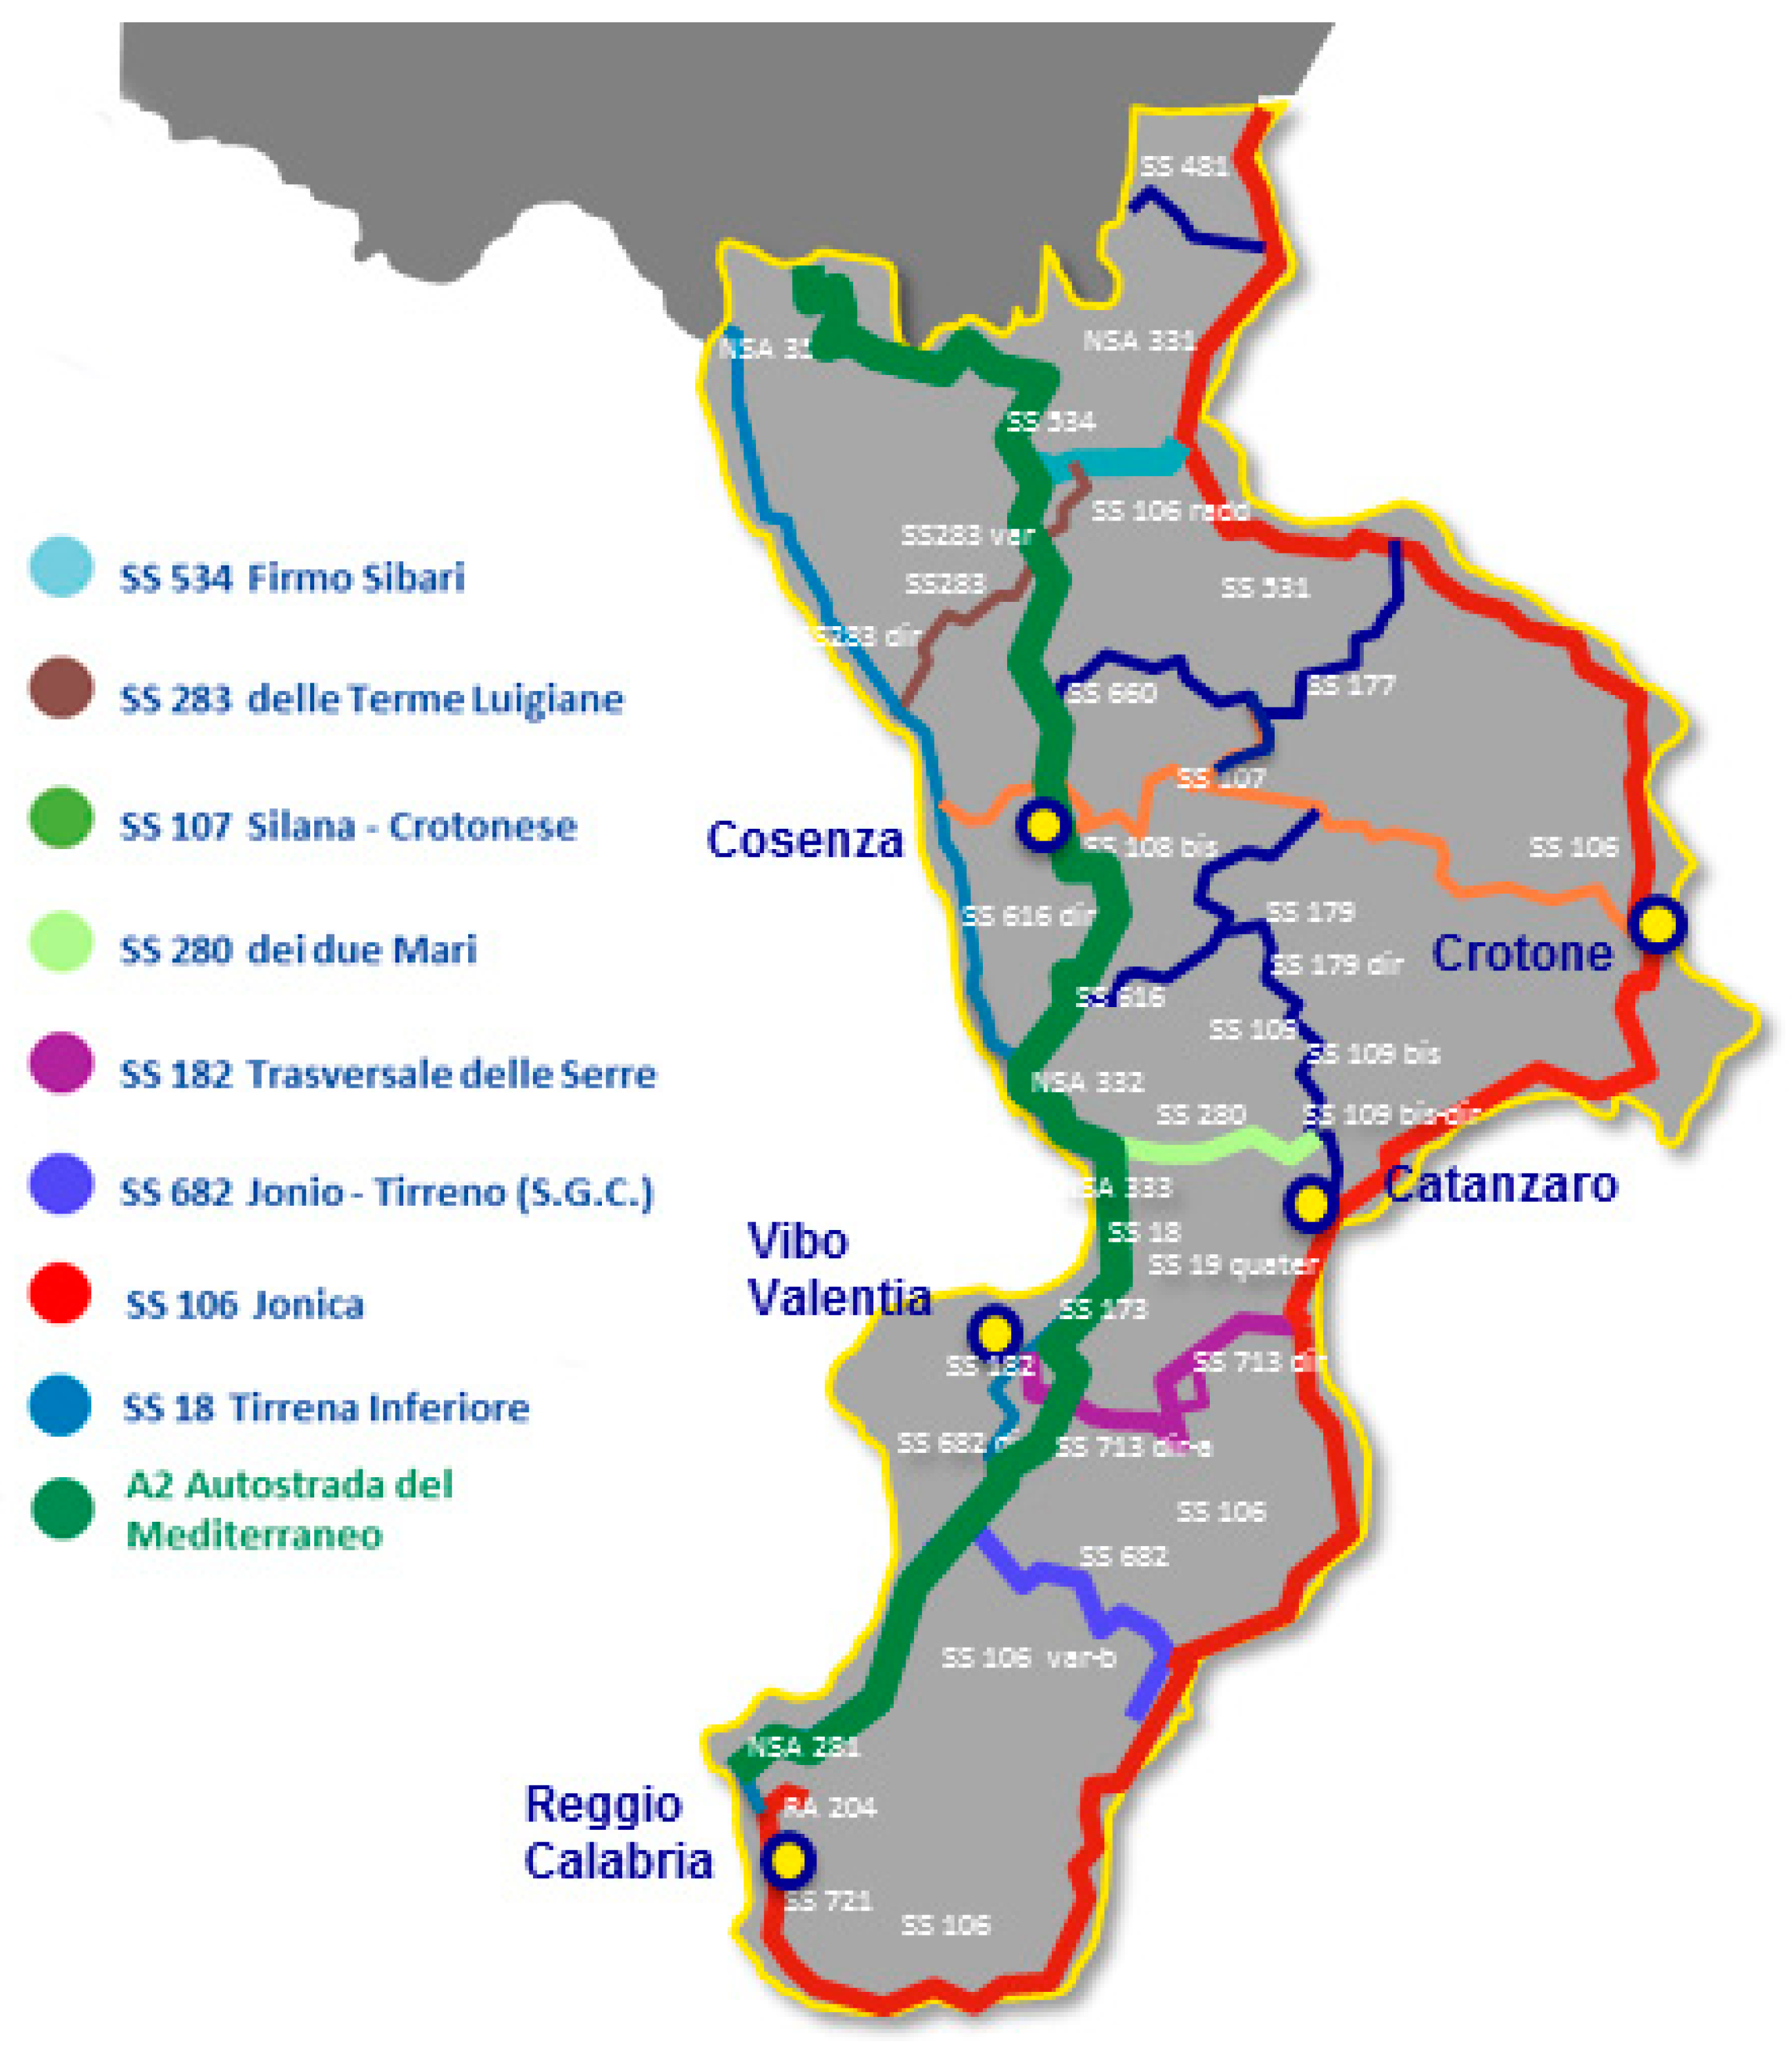
In the last step, the rank of each alternative is determined based on the calculated closeness coefficient for each alternative.

3. Case Study

The main road infrastructures of Calabria can be classified into two separate groups: longitudinal and transversal roads. In the first one, there are the road infrastructures that cross the whole region from north to south, in particular:
  • A2, Mediterranean Highway, which is the only highway realized in Calabria;
  • SS 106, which is the main road along the Ionic coast;
  • SS 18 represents the most significant link between the Tyrrhenian coast’s internal areas and coastal settlements.
The second group is instead composed of all those roads that cross Calabria from west to east:
  • SS 280, a State Road that links Lamezia to Catanzaro;
  • SS 107, a State Road from Paola to Crotone;
  • SS 534, a State Road from Firmo to Sibari;
  • SS 283, from Guardia Piemontese to Spezzano Albanese;
  • SS 182, a State Road from Vibo Valentia to Soverato;
  • SS 682, a State Road from Rosarno to Gioisa Ionica.
As reported in Figure 2, these are the region’s main roads for a total length of about 1.400 km.
Without considering A2, SS 280, SS 534, and roads with two separate carriageways, all the other roads mentioned above are characterized by several safety deficiencies. These are strictly related to the frequent transition from rural to urban sections and the relative changing of operative speeds [54]. Therefore, the road test network was chosen to analyze road infrastructure features concerning safety issues accurately.

4. Modelling by FDAHP-FTOPSIS and Discussion

4.1. Determining Criteria’s Weights Using FDAHP

After determining smartification measures, four decision-making criteria were selected, including environmental sustainability (C1: This criterion refers to the obligation to save natural resources and maintain global ecosystems in order to promote current and future health and welfare), economic sustainability (C2: It refers to policies that promote the nation’s long-term economic growth), safety (C3: It refers to the management of known hazards in order to reach a safe level of risk), and benefit–cost ratio (C4: It refers to the monetary or qualitative link between a project’s relative costs and benefits). These criteria were selected after consultation with experts and by the contribution of experienced technicians to evaluate smartification measures. Moreover, these criteria were selected to achieve the goals of sustainable development in road transport for Calabria in consultation with experts. The decision-making team consisted of university professors and experienced technicians. They were well familiar with the Calabria roads and Intelligent Transportation Systems (ITS). These criteria also play an influential role along with sustainable development goals. It should be noted that all these criteria have positive aspects. These survey forms were prepared (such as Table 2) and completed in several meetings with experts and after explaining the scoring system. Using Saaty’s 1–9 scales, the pairwise comparison is made for each decision-maker (Di). After filling in the questionnaires by the experts’ opinion, Equations (1)–(5) are used, and TFNs are formed with a triangular function according to Figure 1. The values of decision-makers’ pairwise comparison matrix based on TFNs are indicated in Table 2.
Then, using the pairwise comparison matrix obtained in the previous step, the relative fuzzy weights of the criteria are calculated based on Equations (6) and (7). W 1 ~ , W 2 ~ , W 3 ~   and   W 4 ~ are the relative fuzzy weights for environmental sustainability (C1), economic sustainability (C2), safety (C3), and benefit–cost ratio (C4), respectively.
Z 1 ~ = [ a 11 ~ a 12 ~ a 13 ~ a 14 ~ ] 1 / 4 = [ 0.312 , 0.836 , 2.545 ] Z 2 ~ = [ a 21 ~ a 22 ~ a 23 ~ a 24 ~ ] 1 / 4 = [ 0.227 , 0.523 , 1.495 ] Z 3 ~ = [ a 31 ~ a 32 ~ a 33 ~ a 34 ~ ] 1 / 4 = [ 1.158 , 2.5 , 4.583 ] Z 4 ~ = [ a 41 ~ a 42 ~ a 43 ~ a 44 ~ ] 1 / 4 = [ 0.269 , 1.011 , 3.409 ] } Z i ~ = [ 1.966 , 4.87 , 12.032 ] { W 1 ~ = Z 1 ~ [ Z 1 ~ Z 2 ~ Z 3 ~ Z 4 ~ ] 1 = [ 0.026 , 0.172 , 1.294 ] W 2 ~ = Z 2 ~ [ Z 1 ~ Z 2 ~ Z 3 ~ Z 4 ~ ] 1 = [ 0.019 , 0.107 , 0.76 ] W 3 ~ = Z 3 ~ [ Z 1 ~ Z 2 ~ Z 3 ~ Z 4 ~ ] 1 = [ 0.096 , 0.513 , 2.331 ] W 4 ~ = Z 4 ~ [ Z 1 ~ Z 2 ~ Z 3 ~ Z 4 ~ ] 1 = [ 0.022 , 0.208 , 1.734 ]
In the last step, Equation (8) is used for de-fuzzing the weight of the criteria, and the final weights of each criterion are determined. The priorities of weights are indicated for each criterion in Table 3. The results obtained show that safety (C3), from the point of view of experts, plays a vital role in evaluating and ranking the smartification measures of the studied roads. Moreover, benefit–cost ratio (C4), environmental sustainability (C1), and economic sustainability (C2) are next in importance, respectively.

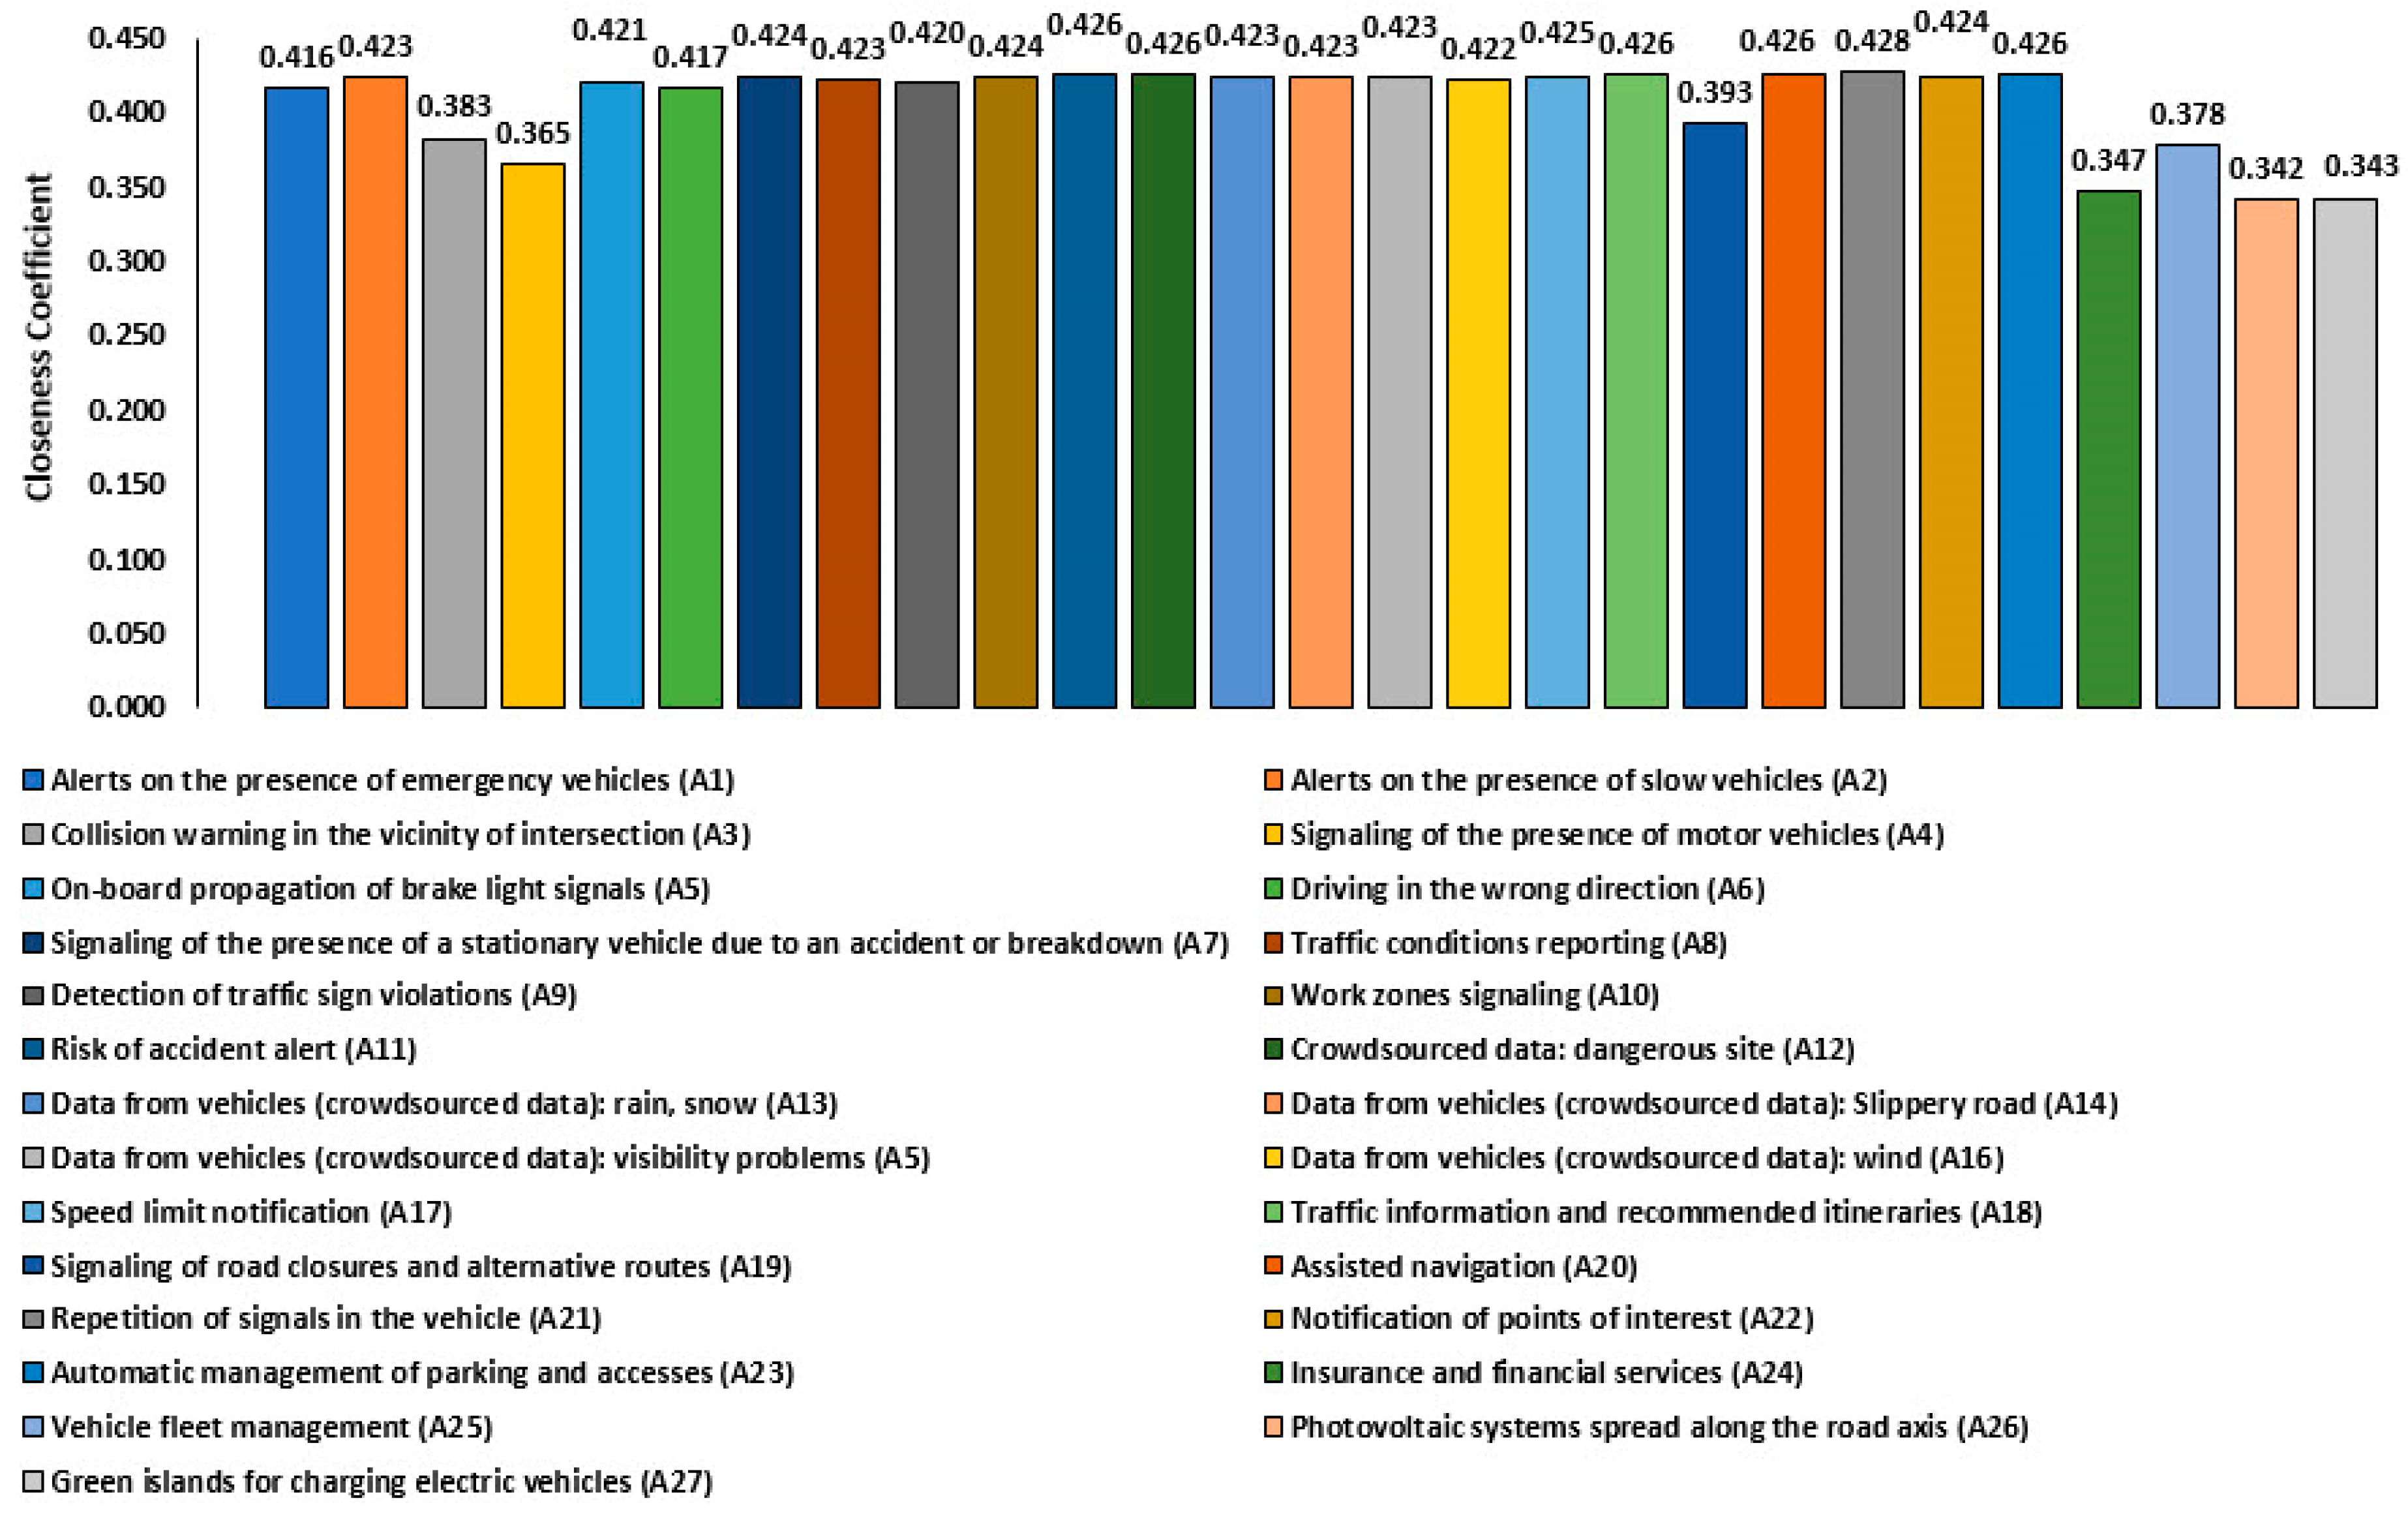
4.2. Ranking of Smartification Measures Using FTOPSIS

To evaluate and prioritize the smartification measures, according to the several conditions in the Calabria area, such as roads and technical conditions, and considering the initial investigation of the existing smartification measures, a list of potential smartification measures was assigned. Then, the 27 smartification measures were determined following a series of discussions and consultations, including expert brainstorming. For this purpose, several meetings were held with the participation of all experts. Then, a questionnaire (such as Table 4) was prepared based on the finalized measures. Finally, another meeting with the experts was arranged to fill out the questionnaire (the fuzzy decision matrix). The experts used the linguistic variables for prioritizing the twenty-seven smartification measures based on Table 1 in this step. After the final summation, all the fuzzy decision matrices were integrated, and the combinatorial fuzzy decision matrix was formed according to Table 4.
After the fuzzy decision matrix was formed, since the decision criteria have a positive aspect, the normalized fuzzy decision matrix is formed based on Equations (10) to (12). Then, by multiplying the weights of each criterion that were calculated from the FDAHP method ( W 1 ~ , W 2 , ~   W 3 ~   and   W 4 ~ ) by their corresponding columns, the normalized weighting fuzzy decision matrix is formed based on Equations (13) and (14). Table 5 indicates the normalized weighting fuzzy decision matrix (NWFDM) for 27 smartification actions.
In the next step, the fuzzy positive ideal solution and fuzzy negative ideal solution are calculated based on Equations (15) and (16), as follows:
A = { ( 1.294 , 1.294 , 1.294 ) , ( 0.76 , 0.76 , 0.76 ) , ( 2.331 , 2.331 , 2.331 ) , ( 1.734 , 1.734 , 1.734 ) } A = { ( 0 , 0 , 0 ) , ( 0 , 0 , 0 ) , ( 0 , 0 , 0 ) , ( 0 , 0 , 0 ) }
In the last step, the distance from the fuzzy positive ideal solution and fuzzy negative ideal solution and the closeness coefficient (CC) for each option are calculated according to Equations (17)–(20). The obtained results are shown in Table 6 and Figure 3. For instance, the distance from the fuzzy positive ideal solution, fuzzy negative ideal, and the CC for the first smartification action (A1) are calculated as follows:
S i = j = 1 n d ( v ~ i j , v ~ j ) S i = j = 1 n d ( v ~ i j , v ~ j ) S 11 = 1 3 [ ( 0 1.294 ) 2 + ( 0 1.294 ) 2 + ( 1.294 1.294 ) 2 ] = 1.057 S 11 = 1 3 [ ( 0 0 ) 2 + ( 0 0 ) 2 + ( 1.294 0 ) 2 ] = 0.747 S 12 = 1 3 [ ( 0 0.76 ) 2 + ( 0.035 0.76 ) 2 + ( 0.532 0.76 ) 2 ] = 0.621 S 12 = 1 3 [ ( 0 0 ) 2 + ( 0.035 0 ) 2 + ( 0.532 0 ) 2 ] = 0.308 S 13 = 1 3 [ ( 0.009 2.331 ) 2 + ( 0.372 2.331 ) 2 + ( 2.331 2.331 ) 2 ] = 1.754 S 13 = 1 3 [ ( 0.009 0 ) 2 + ( 0.372 0 ) 2 + ( 2.331 0 ) 2 ] = 1.363 S 14 = 1 3 [ ( 0 1.734 ) 2 + ( 0.109 1.734 ) 2 + ( 1.734 1.734 ) 2 ] = 1.372 S 14 = 1 3 [ ( 0 0 ) 2 + ( 0.109 0 ) 2 + ( 1.734 0 ) 2 ] = 1.003
S 1 = 1.057 + 0.621 + 1.754 + 1.372 = 4.804 S 1 = 0.747 + 0.308 + 1.363 + 1.003 = 3.421 C C 1 = 3.421 4.804 + 3.421 = 0.416
As shown in Table 6 and Figure 3, there have been dramatic cuts in the importance of two categories, including Internet services and solar and ecological roads with other categories. Hence, photovoltaic systems spread along the road axis (A26), Green islands for charging electric vehicles (A27), and insurance and financial services (A24) have the lowest ranks, correspondingly. The first smartification action was the repetition of signals in the vehicle (A21) with a closeness coefficient equal to 0.428, which belongs to the traffic category. Then, the five smartification actions from three categories including risk of accident alert (A11), crowdsourced data: dangerous site (A12), traffic information and recommended itineraries (A18), assisted navigation (A20), and automatic management of parking and accesses (A23) achieved the second rank with the closeness coefficient equal to 0.426 among the twenty-seven measures. Finally, these calculations, the ranking of smartification measures of the Calabria’s roads with FDAHP-FTOPSIS is (A21 > A23 = A20 = A18 = A12 = A11 > A17 > A7 = A10 = A22 > A82 = A8 = A13 = A14 = A15> A16 > A5> A9 > A6> A1 > A19 > A3 > A25> A4 > A24> A27 > A26). According to this ranking based on experienced experts’ opinion, the repetition of signals in the vehicle (A21) was considered as the most significant action for smarting roads of the case study. Hence, wireless communications, such as vehicle-to-everything (V2X) communications, can be useful for smarting roads, and it is suggested that prioritizing investment and research in future smart plans be considered for V2I (vehicle-to-infrastructure), V2N (vehicle-to-network), and V2D (vehicle-to-device). Moreover, these three vehicular communication systems can be applied as effective tools for the five smartification actions, which had the second rank in terms of importance and priority. For example, in safety messages, the message of a crash report along the route can increase drivers’ awareness of their route by using A21 and A11. Using A18 and 20 allows users to arrange an itinerary, check for amenities along the road, bookmark important sights, and so on. Furthermore, in-car warnings can use data collection and identification of dangerous road sections to slow vehicles in risky zones by using A12. A23 which can help to alleviate traffic congestion and properly manage parking demand in the Calabria road network, also received a positive evaluation.
The car population in Calabria is much older than in other parts of Europe. This is an explanation for the low ranking of A27. The same study in a different geographical area with more new vehicles would have brought different results regarding this specific measure dedicated to electric vehicles.
Many intersections in Calabria are dangerous due to poor design, signalization system, and other local factors, and this might have affected the poor evaluation of an innovative measure, such as A3. In other words, implementing new smart systems might not get a good evaluation when traditional road design and improvement measures are not correctly applied.
Conversely, other specific measures that have been considered essential for Calabria might not be helpful in other geographical areas.
It should be emphasized that the derived values for each smartification measure and their ranking are specific to the roads in Calabria and cannot be applied to other projects. Furthermore, the most significant constraint of this study was assembling the right team of local experts with the required expertise and capacity to diagnose and comprehend local issues and smart road measure effectiveness.

5. Conclusions

In this study, using expert opinions and combining smart road concepts to prioritize smartification actions, twenty-seven smartification measures in five categories are considered. Since smartening is an approach for achieving sustainable development, the four decision-making criteria, including environmental sustainability (C1), economic sustainability (C2), safety (C3), and benefit–cost ratio (C4), are also selected to achieve the goals of safe and sustainable development. Evaluating and priority of smartification measures are determined by the integrated FDSS, namely the FDAHP-FTOPSIS. The present study of the Calabria road network indicates that safety (C3) was identified as the most important contributing decision-making criteria for achieving the goals of safe and sustainable development, with a global weight equal to 0.486. The obtained results from the FDAHP-FTOPSIS technique indicated that the repetition of signals in the vehicle (A21) gained the highest rank with a closeness coefficient equal to 0.428 in the category of traffic. Moreover, the smartification measures of the last category (solar and ecological roads) achieved the lowest ranks among the twenty-seven smartification actions by closeness coefficients equal to 0.342 (A26) and 0.343 (A27). Whereas in this study, there were many options and uncertainty in the issue of decision, the FDAHP-FTOPSIS, which uses the language values and knowledge of experts, can be considered an alternative tool for initial assessments. Therefore, it is suggested to use other types of FDSS to achieve the effectiveness of the FDSS in investigating and prioritizing other case studies in future works.

Author Contributions

Conceptualization, G.G. and S.S.H. (Sina Shaffiee Haghshenas); methodology, S.S.H. (Sina Shaffiee Haghshenas) and S.S.H. (Sami Shaffiee Haghshenas); software, S.S.H. (Sina Shaffiee Haghshenas); formal analysis, S.S.H. (Sina Shaffiee Haghshenas) and S.S.H. (Sami Shaffiee Haghshenas); investigation, S.S.H. (Sina Shaffiee Haghshenas) and S.S.H. (Sami Shaffiee Haghshenas); resources, G.G., V.A., V.G. and A.V.; writing—original draft preparation, S.S.H. (Sina Shaffiee Haghshenas) and V.G.; writing—review and editing, G.G., S.S.H. (Sina Shaffiee Haghshenas) and S.S.H. (Sami Shaffiee Haghshenas), V.A., V.G. and A.V.; supervision, V.A., V.G. and A.V. All authors have read and agreed to the published version of the manuscript.

Funding

This research received no external funding.

Institutional Review Board Statement

The study was conducted in accordance with the Declaration of Helsinki. The Ethics Committee of University of Calabria (Comitato Etico di Ateneo—CEA) which was consulted, found that no harm was caused to anyone with regard to the interviews carried out and the data extracted, and that the research topic does not raise questions of ethical relevance, as the number of people who participated in the study is limited and all subjects gave their informed consent for inclusion before they participated in the study. The Ethics Committee approved the project with this Project Identification Code: n. 2022-UCALPRG-0030052.

Informed Consent Statement

Informed consent was obtained from all subjects involved in the study.

Data Availability Statement

Not applicable.

Acknowledgments

We would like to express our deepest thanks to Mahdi Ghaem for his excellent advice.

Conflicts of Interest

The authors declare no conflict of interest.

References

  1. Hubaux, J.P.; Capkun, S.; Luo, J. The security and privacy of smart vehicles. IEEE Secur. Priv. 2004, 2, 49–55. [Google Scholar] [CrossRef] [Green Version]
  2. Battarra, R.; Zucaro, F.; Tremiterra, M.R. Smart mobility: An evaluation method to audit Italian cities. In Proceedings of the 2017 5th IEEE International Conference on Models and Technologies for Intelligent Transportation Systems (MT-ITS), Naples, Italy, 26–28 June 2017; IEEE: Piscataway, NJ, USA, 2017; pp. 421–426. [Google Scholar] [CrossRef]
  3. Orlowski, A.; Romanowska, P. Smart cities concept: Smart mobility indicator. Cybern. Syst. 2019, 50, 118–131. [Google Scholar] [CrossRef]
  4. Butler, L.; Yigitcanlar, T.; Paz, A. Smart urban mobility innovations. IEEE Access 2020, 8, 196034–196049. [Google Scholar] [CrossRef]
  5. Karpiriski, M.; Senart, A.; Cahill, V. Sensor networks for smart roads. In Proceedings of the Fourth Annual IEEE International Conference on Pervasive Computing and Communications Workshops (PERCOMW’06), Pisa, Italy, 13–17 March 2006; IEEE: Piscataway, NJ, USA, 2006; pp. 310–314. [Google Scholar] [CrossRef] [Green Version]
  6. Finogeev, A.; Finogeev, A.; Fionova, L.; Lyapin, A.; Lychagin, K.A. Intelligent monitoring system for smart road environment. J. Ind. Inf. Integr. 2019, 15, 15–20. [Google Scholar] [CrossRef]
  7. Sabella, D.; Brevi, D.; Bonetto, E.; Ranjan, A.; Manzalini, A.; Salerno, D. MEC-based infotainment services for smart roads in 5G environments. In Proceedings of the 2020 IEEE 91st Vehicular Technology Conference (VTC2020-Spring), Antwerp, Belgium, 25–28 May 2020; IEEE: Piscataway, NJ, USA, 2020; pp. 1–6. [Google Scholar] [CrossRef]
  8. Toh, C.K.; Sanguesa, J.A.; Cano, J.C.; Martinez, F.J. Advances in smart roads for future smart cities. Proc. Math. Phys. 2020, 476, 20190439. [Google Scholar] [CrossRef]
  9. Trubia, S.; Severino, A.; Curto, S.; Arena, F.; Pau, G. Smart Roads: An Overview of What Future Mobility Will Look Like. Infrastructures 2020, 5, 107. [Google Scholar] [CrossRef]
  10. Di Febbraro, A.; Gallo, F.; Giglio, D.; Sacco, N. Traffic management system for smart road networks reserved for self-driving cars. IET Intell. Transp. Syst. 2020, 14, 1013–1024. [Google Scholar] [CrossRef]
  11. Fernández-Isabel, A.; Fuentes-Fernández, R.; de Diego, I.M. Modeling multi-agent systems to simulate sensor-based Smart Roads. Simul. Model. Pract. Theory 2020, 99, 101994. [Google Scholar] [CrossRef]
  12. Rad, M.Y.; Haghshenas, S.S.; Haghshenas, S.S. Mechanostratigraphy of cretaceous rocks by fuzzy logic in East Arak, Iran. In Proceedings of the 4th International Workshop on Computer Science and Engineering-Summer, WCSE, Dubai, United Arab Emirates, 22–23 August 2014. [Google Scholar]
  13. Riaz, F.; Khadim, S.; Rauf, R.; Ahmad, M.; Jabbar, S.; Chaudhry, J. A validated fuzzy logic inspired driver distraction evaluation system for road safety using artificial human driver emotion. Comput. Netw. 2018, 143, 62–73. [Google Scholar] [CrossRef]
  14. Xu, Y.; Liang, X.; Dong, X.; Chen, W. Intelligent Transportation System and Future of Road Safety. In Proceedings of the 2019 IEEE International Conference on Smart Cloud (Smart Cloud), Tokyo, Japan, 10–12 December 2019; IEEE: Piscataway, NJ, USA, 2019; pp. 209–214. [Google Scholar]
  15. Divakarla, K.P.; Wirasingha, S.G.; Emadi, A.; Razavi, S. Artificial neural network based adaptive control for plug-in hybrid electric vehicles. Int. J. Electr. Hybrid Veh. 2019, 11, 127–151. [Google Scholar] [CrossRef]
  16. Abduljabbar, R.; Dia, H.; Liyanage, S.; Bagloee, S.A. Applications of artificial intelligence in transport: An overview. Sustainability 2019, 11, 189. [Google Scholar] [CrossRef] [Green Version]
  17. Mikaeil, R.; Haghshenas, S.S.; Ozcelik, Y.; Gharehgheshlagh, H.H. Performance evaluation of adaptive neuro-fuzzy inference system and group method of data handling-type neural network for estimating wear rate of diamond wire saw. Geotech. Geol. Eng. 2018, 36, 3779–3791. [Google Scholar] [CrossRef]
  18. Hosseini, S.M.; Ataei, M.; Khalokakaei, R.; Mikaeil, R.; Haghshenas, S.S. Investigating the Role of the Cooling and Lubricant Fluids on the Performance of Cutting Disks (Case Study: Hard Rocks). Rud. Geol. Naft. Zb. 2019, 34, 13–25. [Google Scholar]
  19. Silva, P.B.; Andrade, M.; Ferreira, S. Machine learning applied to road safety modeling: A systematic literature review. J. Traffic Transp. Eng. Engl. Ed. 2020, 7, 775–790. [Google Scholar] [CrossRef]
  20. Behnood, A.; Golafshani, E.M. Machine learning study of the mechanical properties of concretes containing waste foundry sand. Constr. Build. Mater. 2020, 243, 118152. [Google Scholar] [CrossRef]
  21. Rezapour, M.; Molan, A.M.; Ksaibati, K. Analyzing injury severity of motorcycle at-fault crashes using machine learning techniques, decision tree and logistic regression models. Int. J. Transp. Sci. Technol. 2020, 9, 89–99. [Google Scholar] [CrossRef]
  22. Amiri, A.M.; Nadimi, N.; Yousefian, A. Comparing the efficiency of different computation intelligence techniques in predicting accident frequency. IATSS Res. 2020, 44, 285–292. [Google Scholar] [CrossRef]
  23. Fiorini Morosini, A.; Shaffiee Haghshenas, S.; Shaffiee Haghshenas, S.; Geem, Z.W. Development of a Binary Model for Evaluating Water Distribution Systems by a Pressure Driven Analysis (PDA) Approach. Appl. Sci. 2020, 10, 3029. [Google Scholar] [CrossRef]
  24. Guido, G.; Haghshenas, S.S.; Haghshenas, S.S.; Vitale, A.; Gallelli, V.; Astarita, V. Development of a Binary Classification Model to Assess Safety in Transportation Systems Using GMDH-Type Neural Network Algorithm. Sustainability 2020, 12, 6735. [Google Scholar] [CrossRef]
  25. Guido, G.; Haghshenas, S.S.; Haghshenas, S.S.; Vitale, A.; Astarita, V.; Haghshenas, A.S. Feasibility of Stochastic Models for Evaluation of Potential Factors for Safety: A Case Study in Southern Italy. Sustainability 2020, 12, 7541. [Google Scholar] [CrossRef]
  26. Singh, R.; Sharma, R.; Akram, S.V.; Gehlot, A.; Buddhi, D.; Malik, P.K.; Arya, R. Highway 4.0: Digitalization of highways for vulnerable road safety development with intelligent IoT sensors and machine learning. Saf. Sci. 2021, 143, 105407. [Google Scholar] [CrossRef]
  27. Naderpour, H.; Rafiean, A.H.; Fakharian, P. Compressive strength prediction of environmentally friendly concrete using artificial neural networks. J. Build. Eng. 2018, 16, 213–219. [Google Scholar] [CrossRef]
  28. Naderpour, H.; Nagai, K.; Fakharian, P.; Haji, M. Innovative models for prediction of compressive strength of FRP-confined circular reinforced concrete columns using soft computing methods. Compos. Struct. 2019, 215, 69–84. [Google Scholar] [CrossRef]
  29. Naderpour, H.; Eidgahee, D.R.; Fakharian, P.; Rafiean, A.H.; Kalantari, S.M. A new proposed approach for moment capacity estimation of ferrocement members using Group Method of Data Handling. Eng. Sci. Technol. Int. 2020, 23, 382–391. [Google Scholar] [CrossRef]
  30. Mikaeil, R.; Ataei, M.; Yousefi, R. Evaluating the power consumption in carbonate rock sawing porocess by using FDAHP and TOPSIS techniques. In Efficient Decision Support Systems—Practice and Challenges in Multidisciplinary Domains; InTechOpen: Rijeka, Croatia, 2011; pp. 413–436. ISBN 978-953-307-441-2. [Google Scholar]
  31. Haghshenas, S.S.; Haghshenas, S.S.; Mikaeil, R.; Ardalan, T.; Sedaghati, Z.; Kazemzadeh Heris, P. Selection of an appropriate tunnel boring machine using TOPSIS-FDAHP method (Case Study: Line 7 of Tehran Subway, East-West Section). Electron. J. Geotech. Eng. 2017, 22, 4047–4062. [Google Scholar]
  32. Arian, A.; Faezipour, M.; Azizi, M.; Vlosky, R.P.; Leavengood, S. Evaluation of challenges of wood imports to Iran using Fuzzy Delphi Analytical Hierarchy Process. IJWP 2017, 8, 159–169. [Google Scholar]
  33. Esmailzadeh, A.; Mikaeil, R.; Sadegheslam, G.; Aryafar, A.; Hosseinzadeh Gharehgheshlagh, H. Selection of an appropriate method to extract the dimensional stones using FDAHP & TOPSIS techniques. J. Soft Comput. Civ. Eng. 2018, 2, 101–116. [Google Scholar]
  34. Nezam, M.H.K. How to identify and prioritise factors affecting the designing of innovative strategies in insurance industry based on the blue ocean approach by FDAHP and SEM. Int. J. Bus. Innov. Res. 2019, 20, 431–464. [Google Scholar] [CrossRef]
  35. Shaffiee Haghshenas, S.; Mikaeil, R.; Abdollahi Kamran, M.; Shaffiee Haghshenas, S.; Hosseinzadeh Gharehgheshlagh, H. Selecting the Suitable Tunnel Supporting System Using an Integrated Decision Support System (Case Study: Dolaei Tunnel of Touyserkan, Iran). J. Soft Comput. Civ. 2019, 3, 51–66. [Google Scholar]
  36. Ghadernejad, S.; Jafarpour, A.; Ahmadi, P. Application of an integrated decision-making approach based on FDAHP and PROMETHEE for selection of optimal coal seam for mechanization; A case study of the Tazareh coal mine complex, Iran. Int. J. Min. Geo-Eng. 2019, 53, 15–23. [Google Scholar]
  37. Kaufmann, A.; Gupta, M.M. Fuzzy Mathematical Models in Engineering and Management Science; Elsevier: Amsterdam, The Netherlands, 1988. [Google Scholar]
  38. Hayaty, M.; Mohammadi, M.T.; Rezaei, A.; Shayestehfar, M.R. Risk assessment and ranking of metals using FDAHP and TOPSIS. Mine Water Environ. 2014, 33, 157–164. [Google Scholar] [CrossRef]
  39. Liu, Y.C.; Chen, C.S. A new approach for application of rock mass classification on rock slope stability assessment. Eng. Geol. 2007, 89, 129–143. [Google Scholar] [CrossRef]
  40. Ataei, M. Fuzzy Multi-Criteria Decision Making; Shahrood University of Technology: Shahrood, Iran, 2010; ISBN 978-9647637-65-7. [Google Scholar]
  41. Honarbakhsh, M.; Jahangiri, M.; Farhadi, P. Effective factors on not using the N95 respirators among health care workers: Application of Fuzzy Delphi and Fuzzy Analytic Hierarchy Process (FAHP). J. Healthc. Risk Manag. 2017, 37, 36–46. [Google Scholar] [CrossRef] [PubMed]
  42. Yang, Z.; Li, W.; He, J.; Liu, Y. An assessment of water yield properties for weathered bedrock zone in Northern Shaanxi Jurassic coalfield: A case study in Jinjitan coal mine, Western China. Arab. J. Geosci. 2019, 12, 1–19. [Google Scholar] [CrossRef]
  43. Hajkazemiha, N.; Shariat, M.; Monavari, M.; Ataei, M. Evaluation of Mine Reclamation Criteria Using Delphi-Fuzzy Approach. J. Min. Environ. JME 2021, 12, 367–384. [Google Scholar]
  44. Rad, M.Y.; Haghshenas, S.S.; Kanafi, P.R.; Haghshenas, S.S. Analysis of Protection of Body Slope in the Rockfill Reservoir Dams on the Basis of Fuzzy Logic. In Proceedings of the IJCCI, 4th International Joint Conference on Computational Intelligence, Barcelona, Spain, 5–7 October 2012; pp. 367–373. [Google Scholar]
  45. Hangshenas, S.; ÖZÇELİK, Y.; Mikaeil, R.; Moghaddam, S. Ranking and Assesment of tunneling projects risks using fuzzy MCDM (Case Study: Toyserkan Doolayi Tunnel). In Proceedings of the IMCET 2017: New Trends in Mining—25th International Mining Congress of Turkey, Antalya, Turkey, 11–14 April 2017. [Google Scholar]
  46. Lyu, H.M.; Shen, S.L.; Zhou, A.; Yang, J. Risk assessment of mega-city infrastructures related to land subsidence using improved trapezoidal FAHP. Sci. Total Environ. 2020, 717, 135310. [Google Scholar] [CrossRef]
  47. Shaffiee Haghshenas, S.; Shaffiee Haghshenas, S.; Abduelrhman, M.A.; Zare, S.; Mikaeil, R. Identifying and Ranking of Mechanized Tunneling Project’s Risks by Using A Fuzzy Multi-Criteria Decision-Making Technique. J. Soft Comput. Civ. 2022, 6, 29–45. [Google Scholar]
  48. Hatamzad, M.; Polanco Pinerez, G.; Casselgren, J. Addressing Uncertainty by Designing an Intelligent Fuzzy System to Help Decision Support Systems for Winter Road Maintenance. Safety 2022, 8, 14. [Google Scholar] [CrossRef]
  49. Wang, T.C.; Chang, T.H. Application of TOPSIS in evaluating initial training aircraft under a fuzzy environment. Expert Syst. Appl. 2007, 33, 870–880. [Google Scholar] [CrossRef]
  50. Haghshenas, S.S.; Neshaei, M.A.L.; Pourkazem, P.; Haghshenas, S.S. The risk assessment of dam construction projects using fuzzy TOPSIS (case study: Alavian Earth Dam). Civ. Eng. J. CEJ 2016, 2, 158–167. [Google Scholar] [CrossRef]
  51. Ali, S.A.; Parvin, F.; Al-Ansari, N.; Pham, Q.B.; Ahmad, A.; Raj, M.S.; Anh, D.T. Sanitary landfill site selection by integrating AHP and FTOPSIS with GIS: A case study of Memari Municipality, India. Environ. Sci. Pollut. Res. 2020, 28, 7528–7550. [Google Scholar] [CrossRef] [PubMed]
  52. Chen, T.C.T.; Lin, Y.C. A FAHP-FTOPSIS approach for bioprinter selection. Health Technol. 2020, 10, 1455–1467. [Google Scholar] [CrossRef]
  53. Chen, S.J.; Hwang, C.L. Fuzzy Multiple Attribute Decision Making Methods. In Fuzzy Multiple Attribute Decision Making; Lecture Notes in Economics and Mathematical Systems; Springer: Berlin/Heidelberg, Germany, 1992; Volume 375, pp. 289–486. ISBN 978-3-540-54998-7. [Google Scholar]
  54. Vaiana, R.; Perri, G.; Iuele, T.; Gallelli, V. A Comprehensive Approach Combining Regulatory Procedures and Accident Data Analysis for Road Safety Management Based on the European Directive 2019/1936/EC. Safety 2021, 7, 6. [Google Scholar] [CrossRef]
Figure 1. Triangular membership function of fuzzy Delphi method.
Safety 08 00035 g001
Figure 2. Main roads of Calabria Region.
Safety 08 00035 g002
Figure 3. Ranking of 27 smartification measures with the integrated fuzzy decision support system (FDAHP-FTOPSIS).
Safety 08 00035 g003
Table 1. Linguistic variables and corresponding fuzzy triangular numbers.
Linguistic Variables for Ranking Alternatives
Linguistic VariableCorresponding Fuzzy Number
Very Low (VL)(0,0,1)
Low (L)(0,1,3)
Medium-Low (ML)(1,3,5)
Medium (M)(3,5,7)
Medium-High (MH)(5,7,9)
High (H)(7,9,10)
Very High (VH)(9,10,10)
Table 2. The results of the expert survey.
CiEnvironmental Sustainability (C1)Economic Sustainability
(C2)
Safety
(C3)
Benefit–Cost Ratio
(C4)
Environmental sustainability (C1)(1,1,1)(0.2,1.377,6)(0.143,0.287,1)(0.333,1.236,7)
Economic
sustainability (C2)
(0.167,0.726,5)(1,1,1)(0.143,0.203,0.333)(0.111,0.508,3)
Safety (C3)(3,5.207,7)(3,4.925,7)(1,1,1)(0.2,1.524,9)
Benefit–cost ratio (C4)(0.143,0.809,3)(0.333,1.967,9)(0.111,0.656,5)(1,1,1)
Table 3. Weights of criteria in order of importance.
CriteriaGlobal Weights
Environmental sustainability (C1)0.179
Economic sustainability (C2)0.116
Safety (C3)0.486
Benefit–cost ratio (C4)0.199
Table 4. The fuzzy decision matrix for 27 smartification measures based on four decision-making criteria.
CategorySmartification MeasuresEnvironmental Sustainability (C1)Economic Sustainability (C2)Safety (C3)Benefit–Cost Ratio (C4)
Active safetyAlerts on the presence of emergency vehicles (A1)(0,0,1)(0,3.25,7)(1,7.25,10)(0,5.25,10)
Alerts on the presence of slow vehicles (A2)(0,4,9)(0,3.75,9)(7,9,10)(0,6.75,10)
Collision warning in the vicinity of intersection (A3)(0,0.25,3)(0,4,9)(5,9.25,10)(1,7.5,10)
Signaling of the presence of motor vehicles (A4)(0,0.25,3)(0,2.25,7)(0,3.5,10)(0,4,10)
On-board propagation of brake light signals (A5)(0,2.25,9)(0,2.75,9)(3,8.25,10)(3,6.75,10)
Driving in the wrong direction (A6)(0,2,9)(0,2.75,7)(7,9.75,10)(3,8,10)
Signaling of the presence of a stationary vehicle due to an accident or breakdown (A7)(0,3.25,9)(0,2.75,9)(7,9.25,10)(3,7.25,10)
Traffic conditions reporting (A8)(3,6.5,9)(1,5.5,9)(3,7.25,10)(5,8.5,10)
Detection of traffic sign violations (A9)(0,3.5,9)(0,2.75,9)(3,7.25,10)(3,6.75,10)
Work zones signaling (A10)(0,4.5,9)(3,6,9)(5,8.75,10)(3,7.25,10)
Risk of accident alert (A11)(0,2.5,9)(0,6,10)(3,8.75,10)(5,9.25,10)
Crowdsourced data: dangerous site (A12)(0,2.5,9)(0,6,10)(3,8.25,10)(5,9,10)
Data from vehicles (crowdsourced data): rain, snow (A13)(0,3,9)(0,5,9)(5,8.75,10)(3,8,10)
Data from vehicles (crowdsourced data): Slippery road (A14)(0,3,9)(0,5,9)(5,8.75,10)(3,8,10)
Data from vehicles (crowdsourced data): visibility problems (A5)(0,3,9)(0,5,9)(5,8.75,10)(3,8,10)
Data from vehicles (crowdsourced data): wind (A16)(0,3,9)(0,5,9)(3,8.25,10)(3,7.5,10)
TrafficSpeed limit notification (A17)(3,5.5,9)(3,7,10)(0,6,10)(7,9.5,10)
Traffic information and recommended itineraries (A18)(3,7,10)(3,7,10)(0,3.75,10)(0,6.25,10)
Signaling of road closures and alternative routes (A19)(3,7,10)(3,7,10)(0,2.75,7)(0,5.25,10)
Assisted navigation (A20)(1,6.5,10)(1,6.5,10)(0,4,10)(5,7.5,10)
Repetition of signals in the vehicle (A21)(0,4.25,10)(0,6,10)(0,6.75,10)(0,5.75,10)
Local cooperative servicesNotification of points of interest (A22)(0,4.75,10)(1,7.25,10)(0,2.5,10)(3,7,10)
Automatic management of parking and accesses (A23)(1,7.25,10)(5,8.25,10)(0,2.75,10)(5,7.5,10)
Internet servicesInsurance and financial services (A24)(0,1,5)(0,5,10)(0,1.5,7)(0,4.75,9)
Vehicle fleet management (A25)(0,4,9)(3,7,10)(0,2.75,7)(3,6.5,9)
Solar and ecological roadsPhotovoltaic systems spread along the road axis (A26)(7,9.75,10)(5,9,10)(0,0.5,3)(5,8.75,10)
Green islands for charging electric vehicles (A27)(9,10,10)(7,9.75,10)(0,0.75,3)(5,9,10)
Table 5. The NWFDM for 27 smartification measures based on four decision-making criteria.
Smartification Measures(C1)(C2)(C3)(C4)
(A1)(0,0,1.294)(0,0.035,0.532)(0.009,0.372,2.331)(0,0.109,1.734)
(A2)(0,0.068,1.165)(0,0.04,0.684)(0.067,0.462,2.331)(0,0.14, 1.734)
(A3)(0,0.004,0.388)(0,0.043,0.684)(0.048,0.475,2.331)(0.002,0.156,1.734)
(A4)(0,0.004,0.388)(0,0.024,0.532)(0,0.179,2.331)(0,0.083,1.734)
(A5)(0,0.039,1.165)(0,0.029,0.684)(0.029,0.423,2.331)(0.007,0.14,1.734)
(A6)(0,0.034,1.165)(0,0.029,0.532)(0.067,0.5,2.331)(0.007,0.166,1.734)
(A7)(0,0.056,1.165)(0,0.029,0.684)(0.067,0.475,2.331)(0.007,0.151,1.734)
(A8)(0.0078,0.112,1.165)(0.0019,0.059,0.684)(0.029,0.372,2.331)(0.011,0.177,1.734)
(A9)(0,0.06,1.165)(0,0.029,0.684)(0.029,0.372,2.331)(0.007,0.14,1.734)
(A10)(0,0.077,1.165)(0.006,0.064,0.684)(0.048,0.449,2.331)(0.007,0.151,1.734)
(A11)(0,0.043,1.165)(0,0.064,0.76)(0.029,0.449,2.331)(0.011,0.177,1.734)
(A12)(0,0.043,1.165)(0,0.064,0.76)(0.029,0.423,2.331)(0.011,0.177,1.734)
(A13)(0,0.052,1.165)(0,0.053,0.684)(0.048,0.449,2.331)(0.007,0.166,1.734)
(A14)(0,0.052,1.165)(0,0.053,0.684)(0.048,0.449,2.331)(0.007,0.166,1.734)
(A5)(0,0.052,1.165)(0,0.053,0.684)(0.048,0.449,2.331)(0.007,0.166,1.734)
(A16)(0,0.052,1.165)(0,0.053,0.684)(0.029,0.423,2.331)(0.007,0.156,1.734)
(A17)(0.0078,0.095,1.165)(0.006,0.075,0.76)(0,0.309,2.331)(0.015,0.197,1.734)
(A18)(0.0078,0.12,1.294)(0.006,0.075,0.76)(0,0.192,2.331)(0,0.13,1.734)
(A19)(0.0078,0.12,1.294)(0.006,0.075,0.76)(0,0.141,1.632)(0,0.109,1.734)
(A20)(0.0026,0.112,1.294)(0.0019,0.069,0.76)(0,0.205,2.331)(0.011,0.156,1.734)
(A21)(0,0.073,1.294)(0,0.064,0.76)(0,0.346,2.331)(0,0.119,1.734)
(A22)(0,0.082,1.294)(0.0019,0.078,0.76)(0,0.128, 2.331)(0.007,0.146,1.734)
(A23)(0.0026,0.123,1.294)(0.009,0.088,0.76)(0,0.141,2.331)(0.011,0.156,1.734)
(A24)(0,0.017,0.647)(0,0.054,0.76)(0,0.077,1.632)(0,0.099,1.561)
(A25)(0,0.069,1.165)(0.006,0.075,0.76)(0,0.141,1.632)(0.007,0.135,1.561)
(A26)(0.0182,0.168,1.294)(0.009,0.096,0.76)(0,0.026,0.699)(0.011,0.182,1.734)
(A27)(0.0234,0.172, 1.294)(0.013,0.104,0.76)(0,0.038,0.699)(0.011,0.187,1.734)
Table 6. Distance of positive and negative ideal solution and closeness coefficient for each smartification measure.
Smartification MeasuresDistance of Positive Ideal
Solution   ( S i )
Distance of Negative Ideal
Solution   ( S i )
Closeness Coefficient (CCi)
(A1)4.8043.4210.416
(A2)4.6933.4470.423
(A3)4.8352.9990.383
(A4)5.0172.8830.365
(A5)4.7363.440.421
(A6)4.6963.3630.417
(A7)4.693.4470.424
(A8)4.6953.4410.423
(A9)4.7473.4360.420
(A10)4.6833.4470.424
(A11)4.6953.490.426
(A12)4.7043.4870.426
(A13)4.6943.4460.423
(A14)4.6943.4460.423
(A5)4.6943.4460.423
(A16)4.7163.4420.422
(A17)4.7193.4820.425
(A18)4.7843.5450.426
(A19)4.8553.140.393
(A20)4.7743.5470.426
(A21)4.7583.5530.428
(A22)4.823.5430.424
(A23)4.7843.5450.426
(A24)5.0082.660.347
(A25)4.8732.9660.378
(A26)5.0152.6060.342
(A27)52.6080.343
Publisher’s Note: MDPI stays neutral with regard to jurisdictional claims in published maps and institutional affiliations.

