
Effects of Automation and Fatigue on Drivers from Various Age Groups


Abstract
:1. Introduction
1.1. Motivation
1.2. Effects of Human Factors in Driver Drowsiness
1.2.1. Effects of Automation, Age, and Gender
1.2.2. Effects of Fatigue, Age, and Gender
2. Research Questions
3. Materials and Methods
3.1. Participants
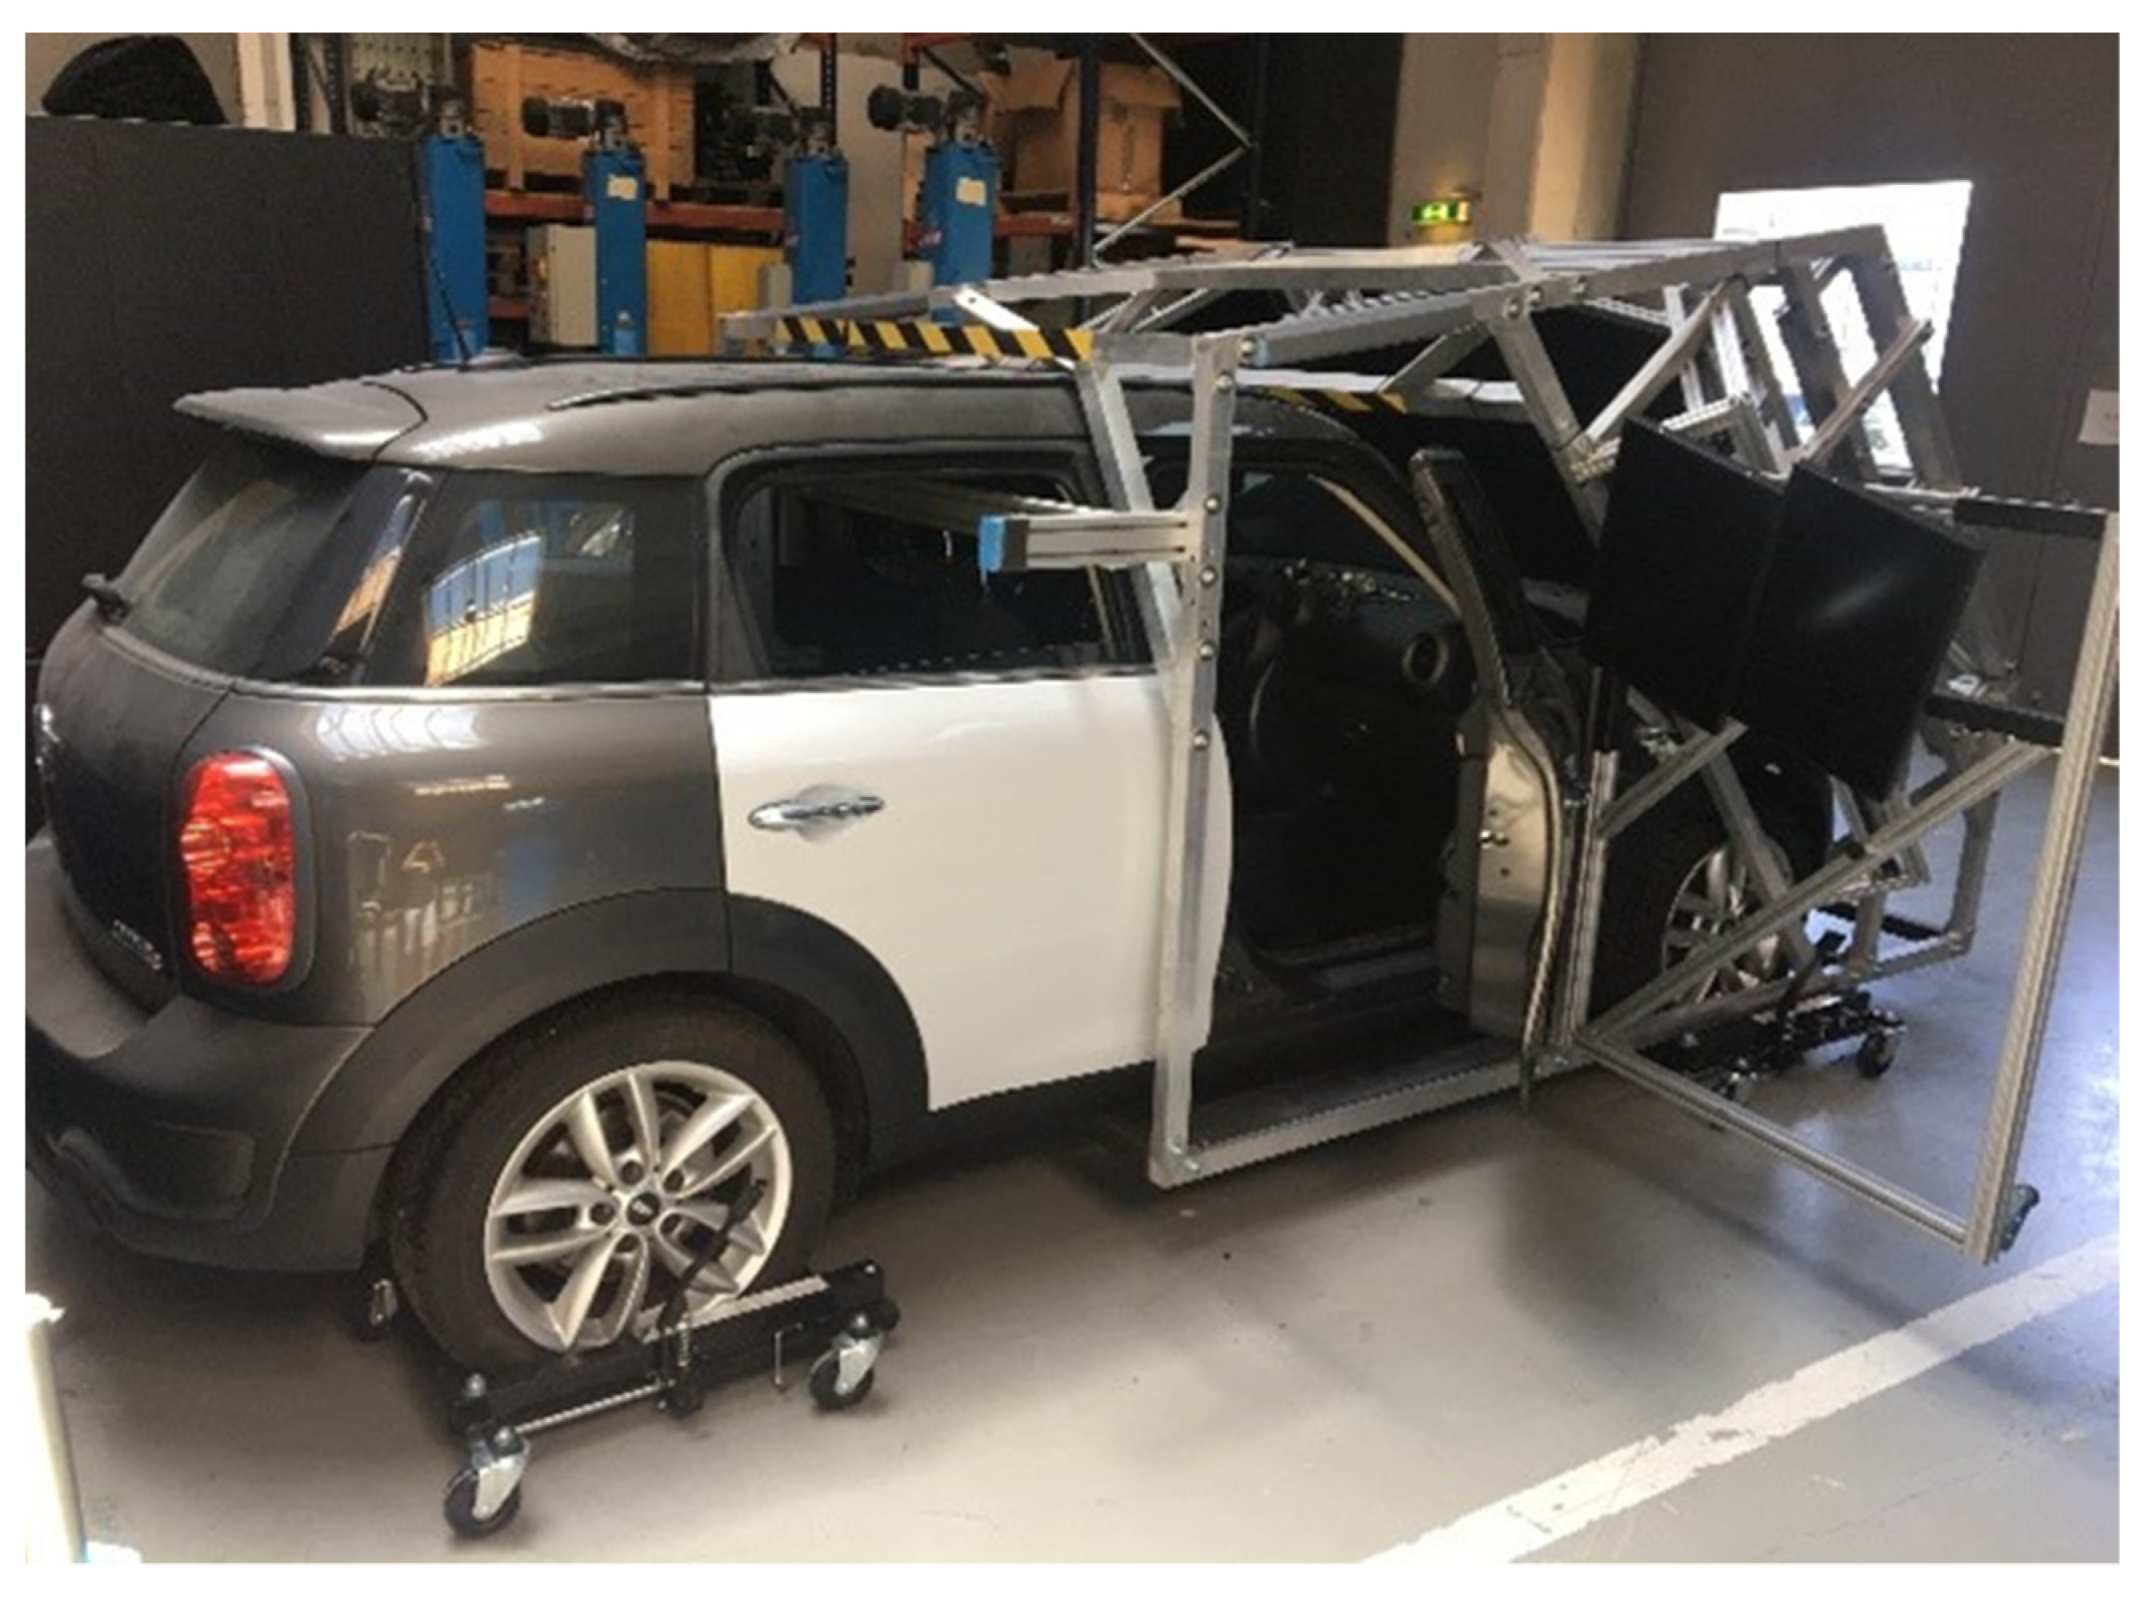
3.2. Equipment
3.3. Dependent and Independent Variables
3.4. Experimental Procedure
3.5. Data Analysis
4. Results
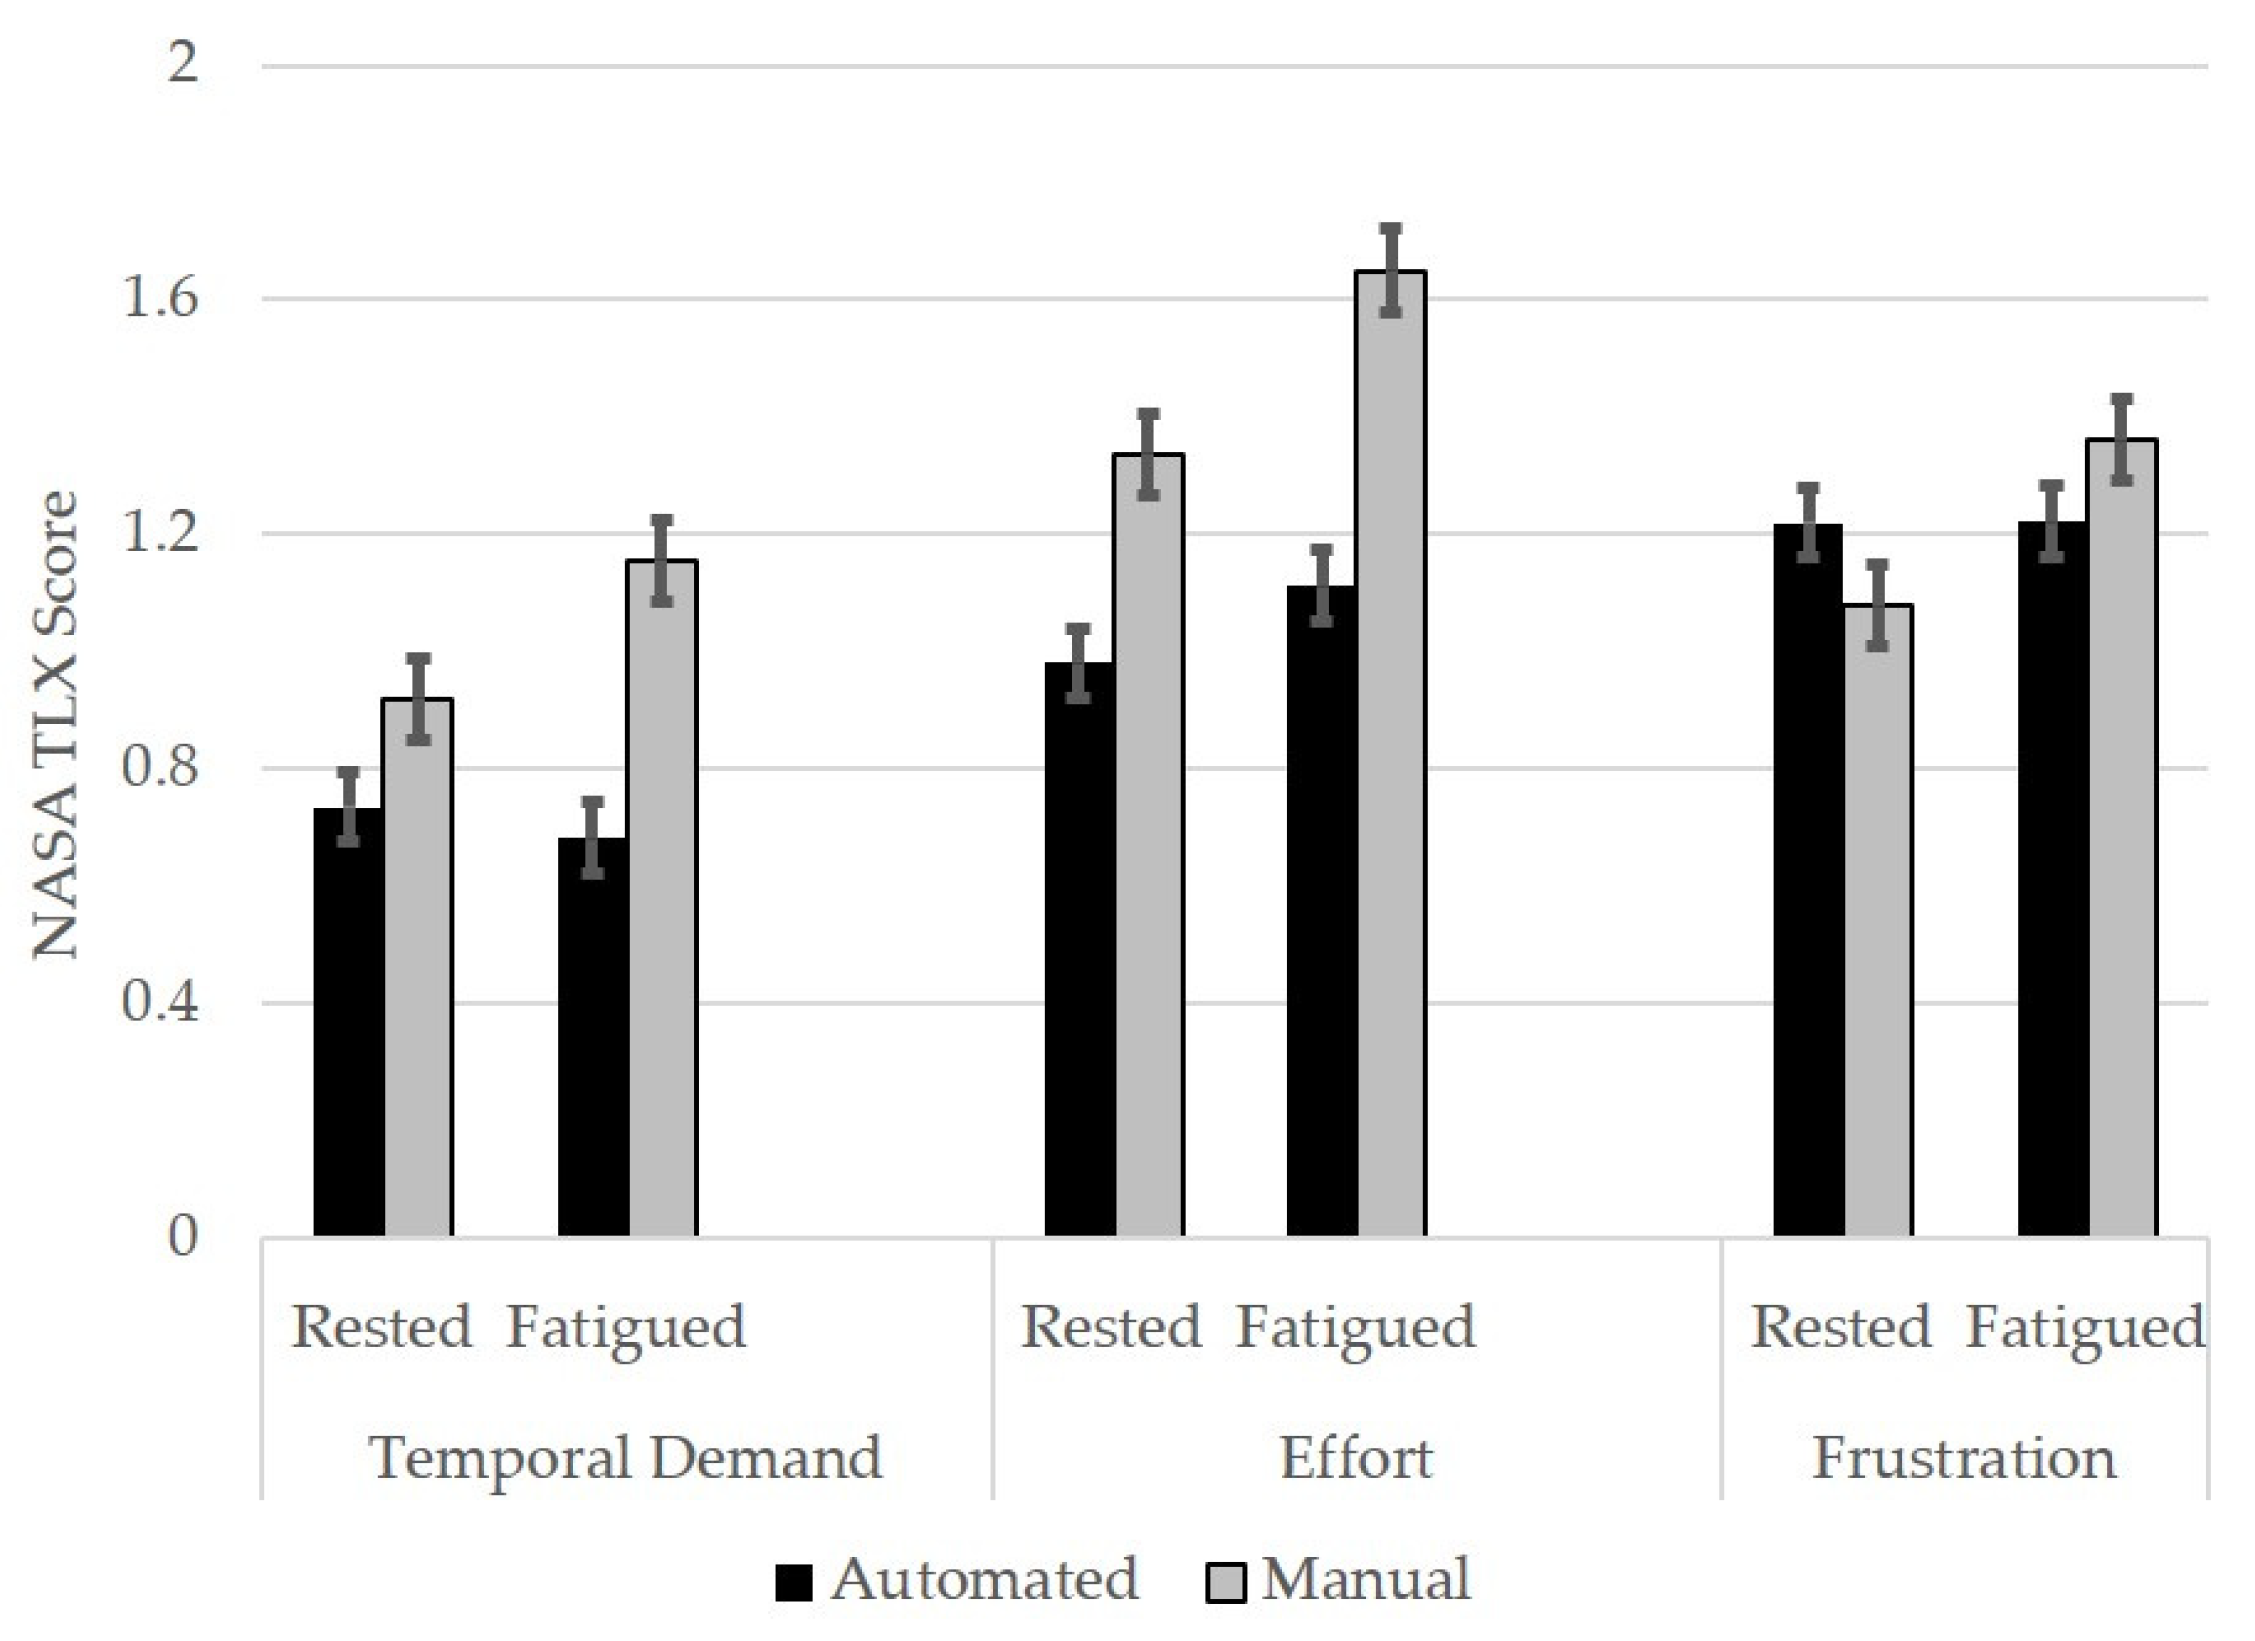
4.1. Automation Effects on Drivers’ Workload
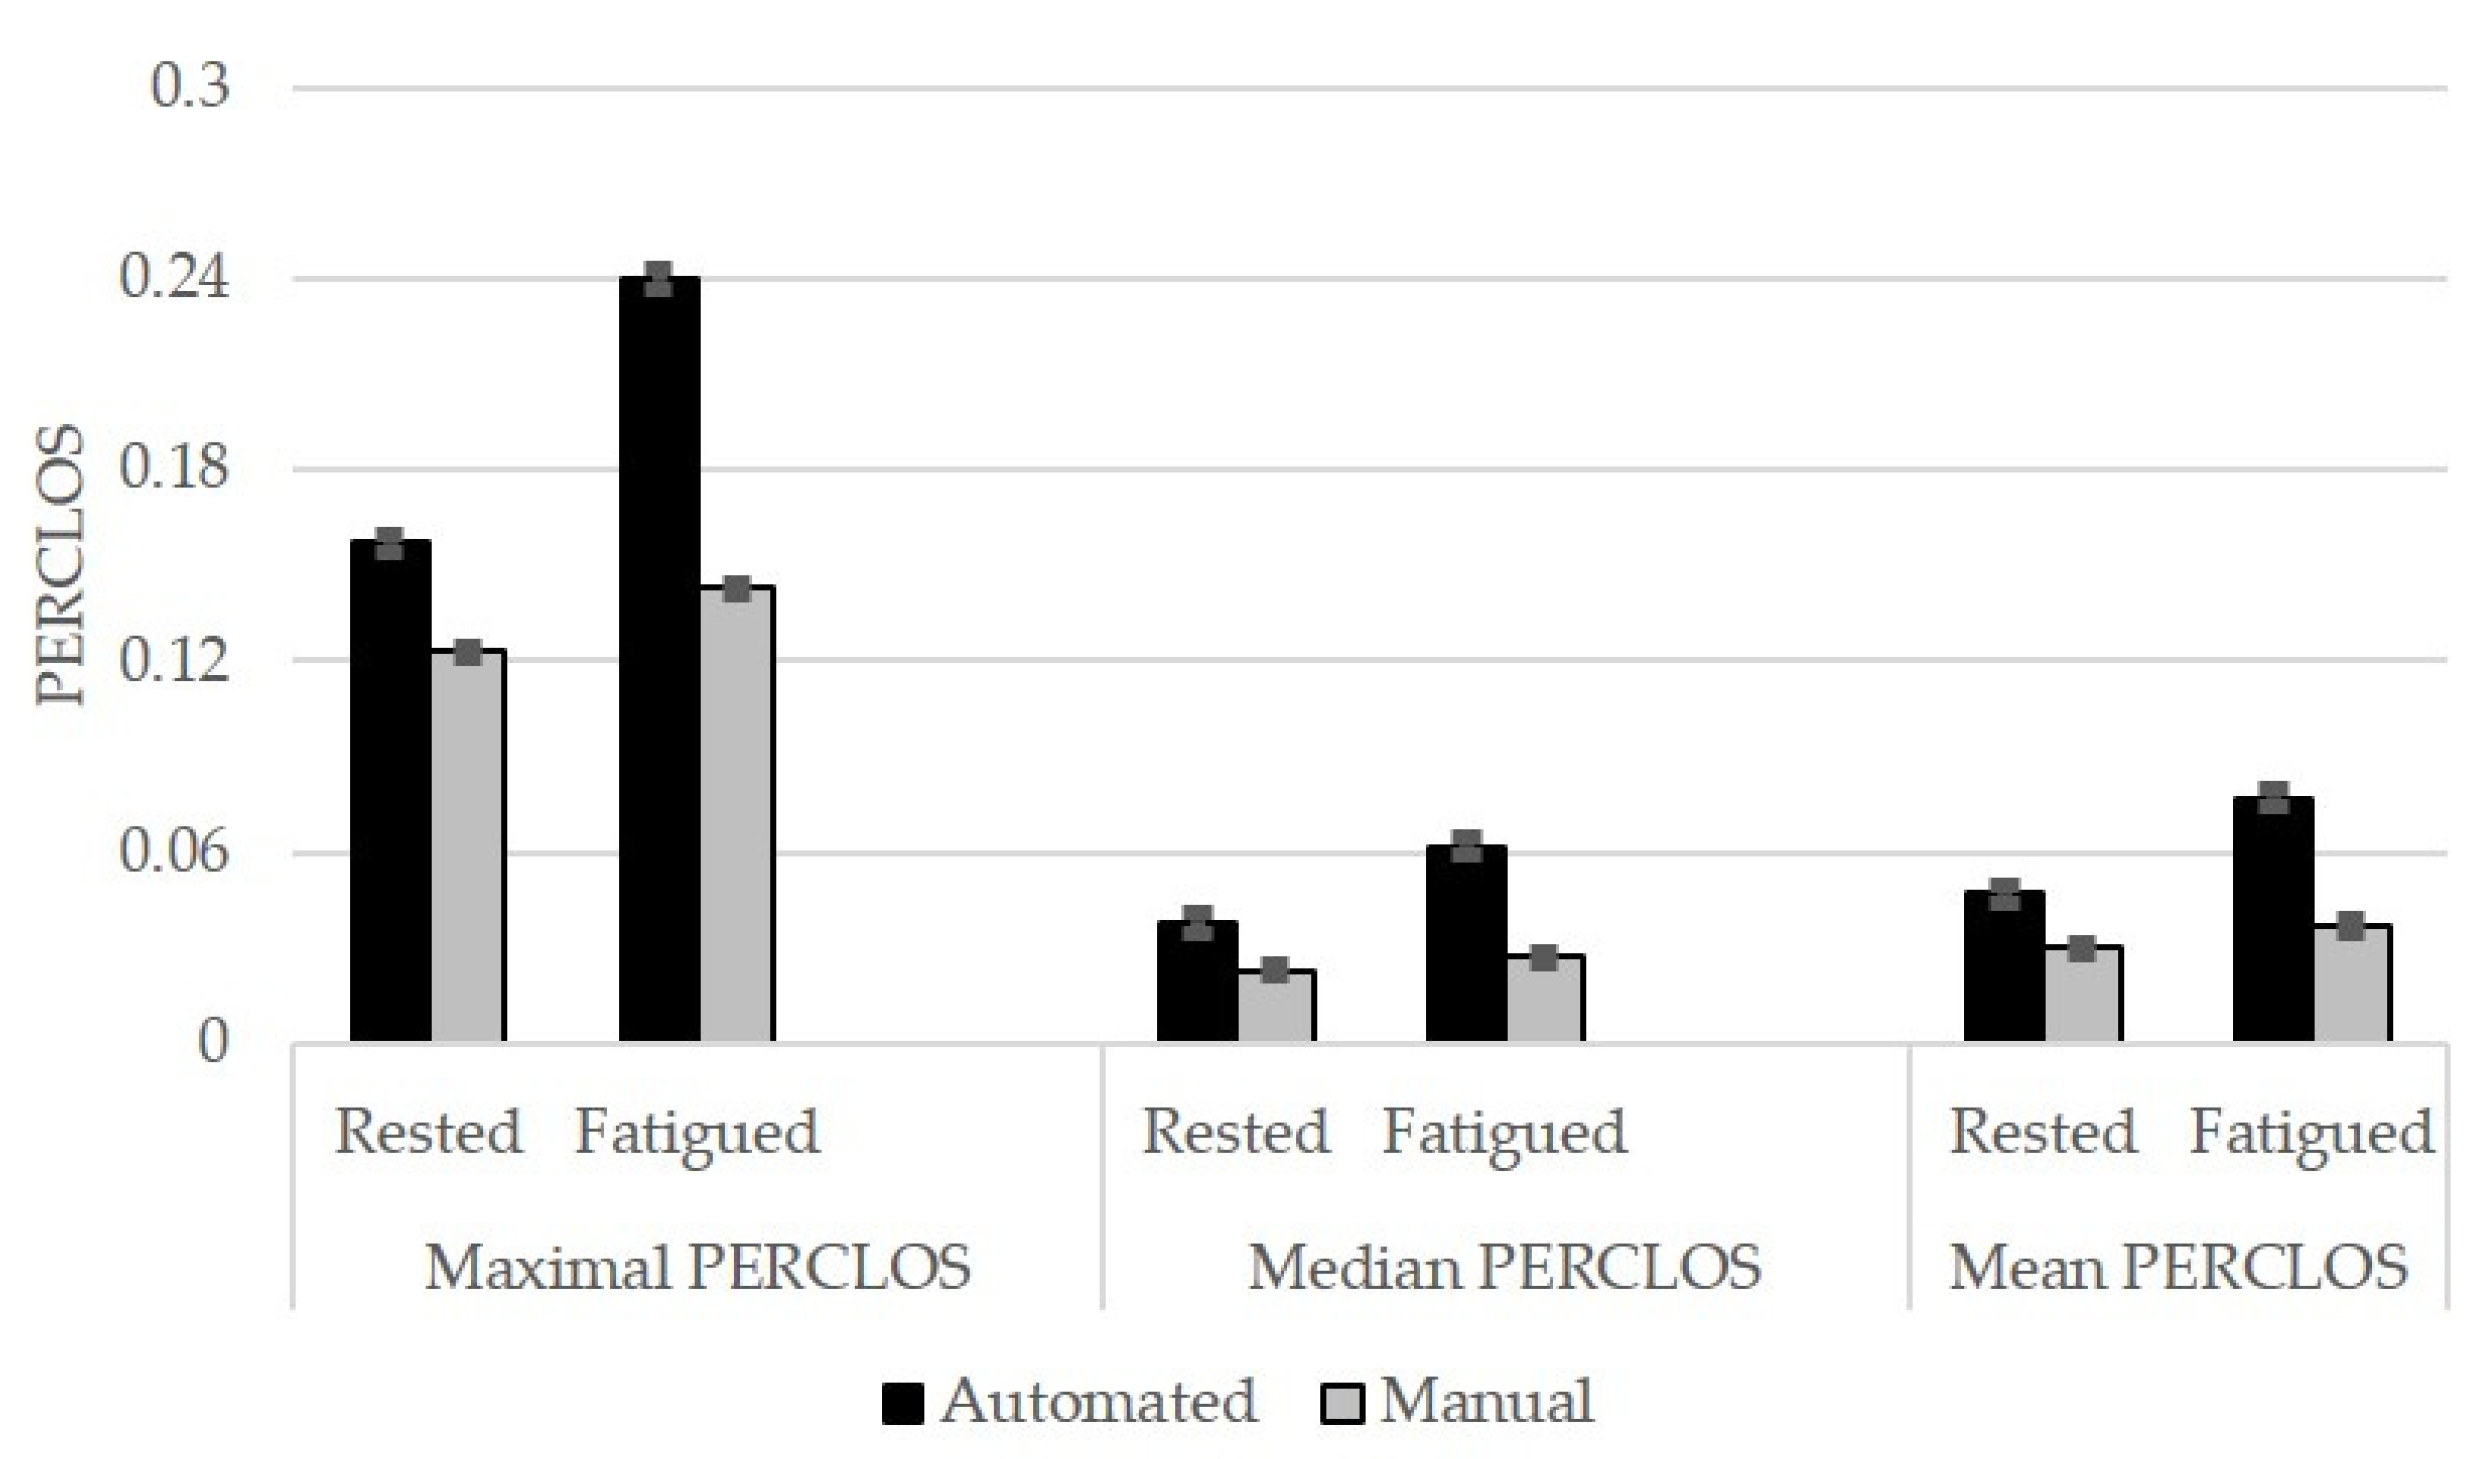
4.2. Automation Effects on Drivers’ PERCLOS
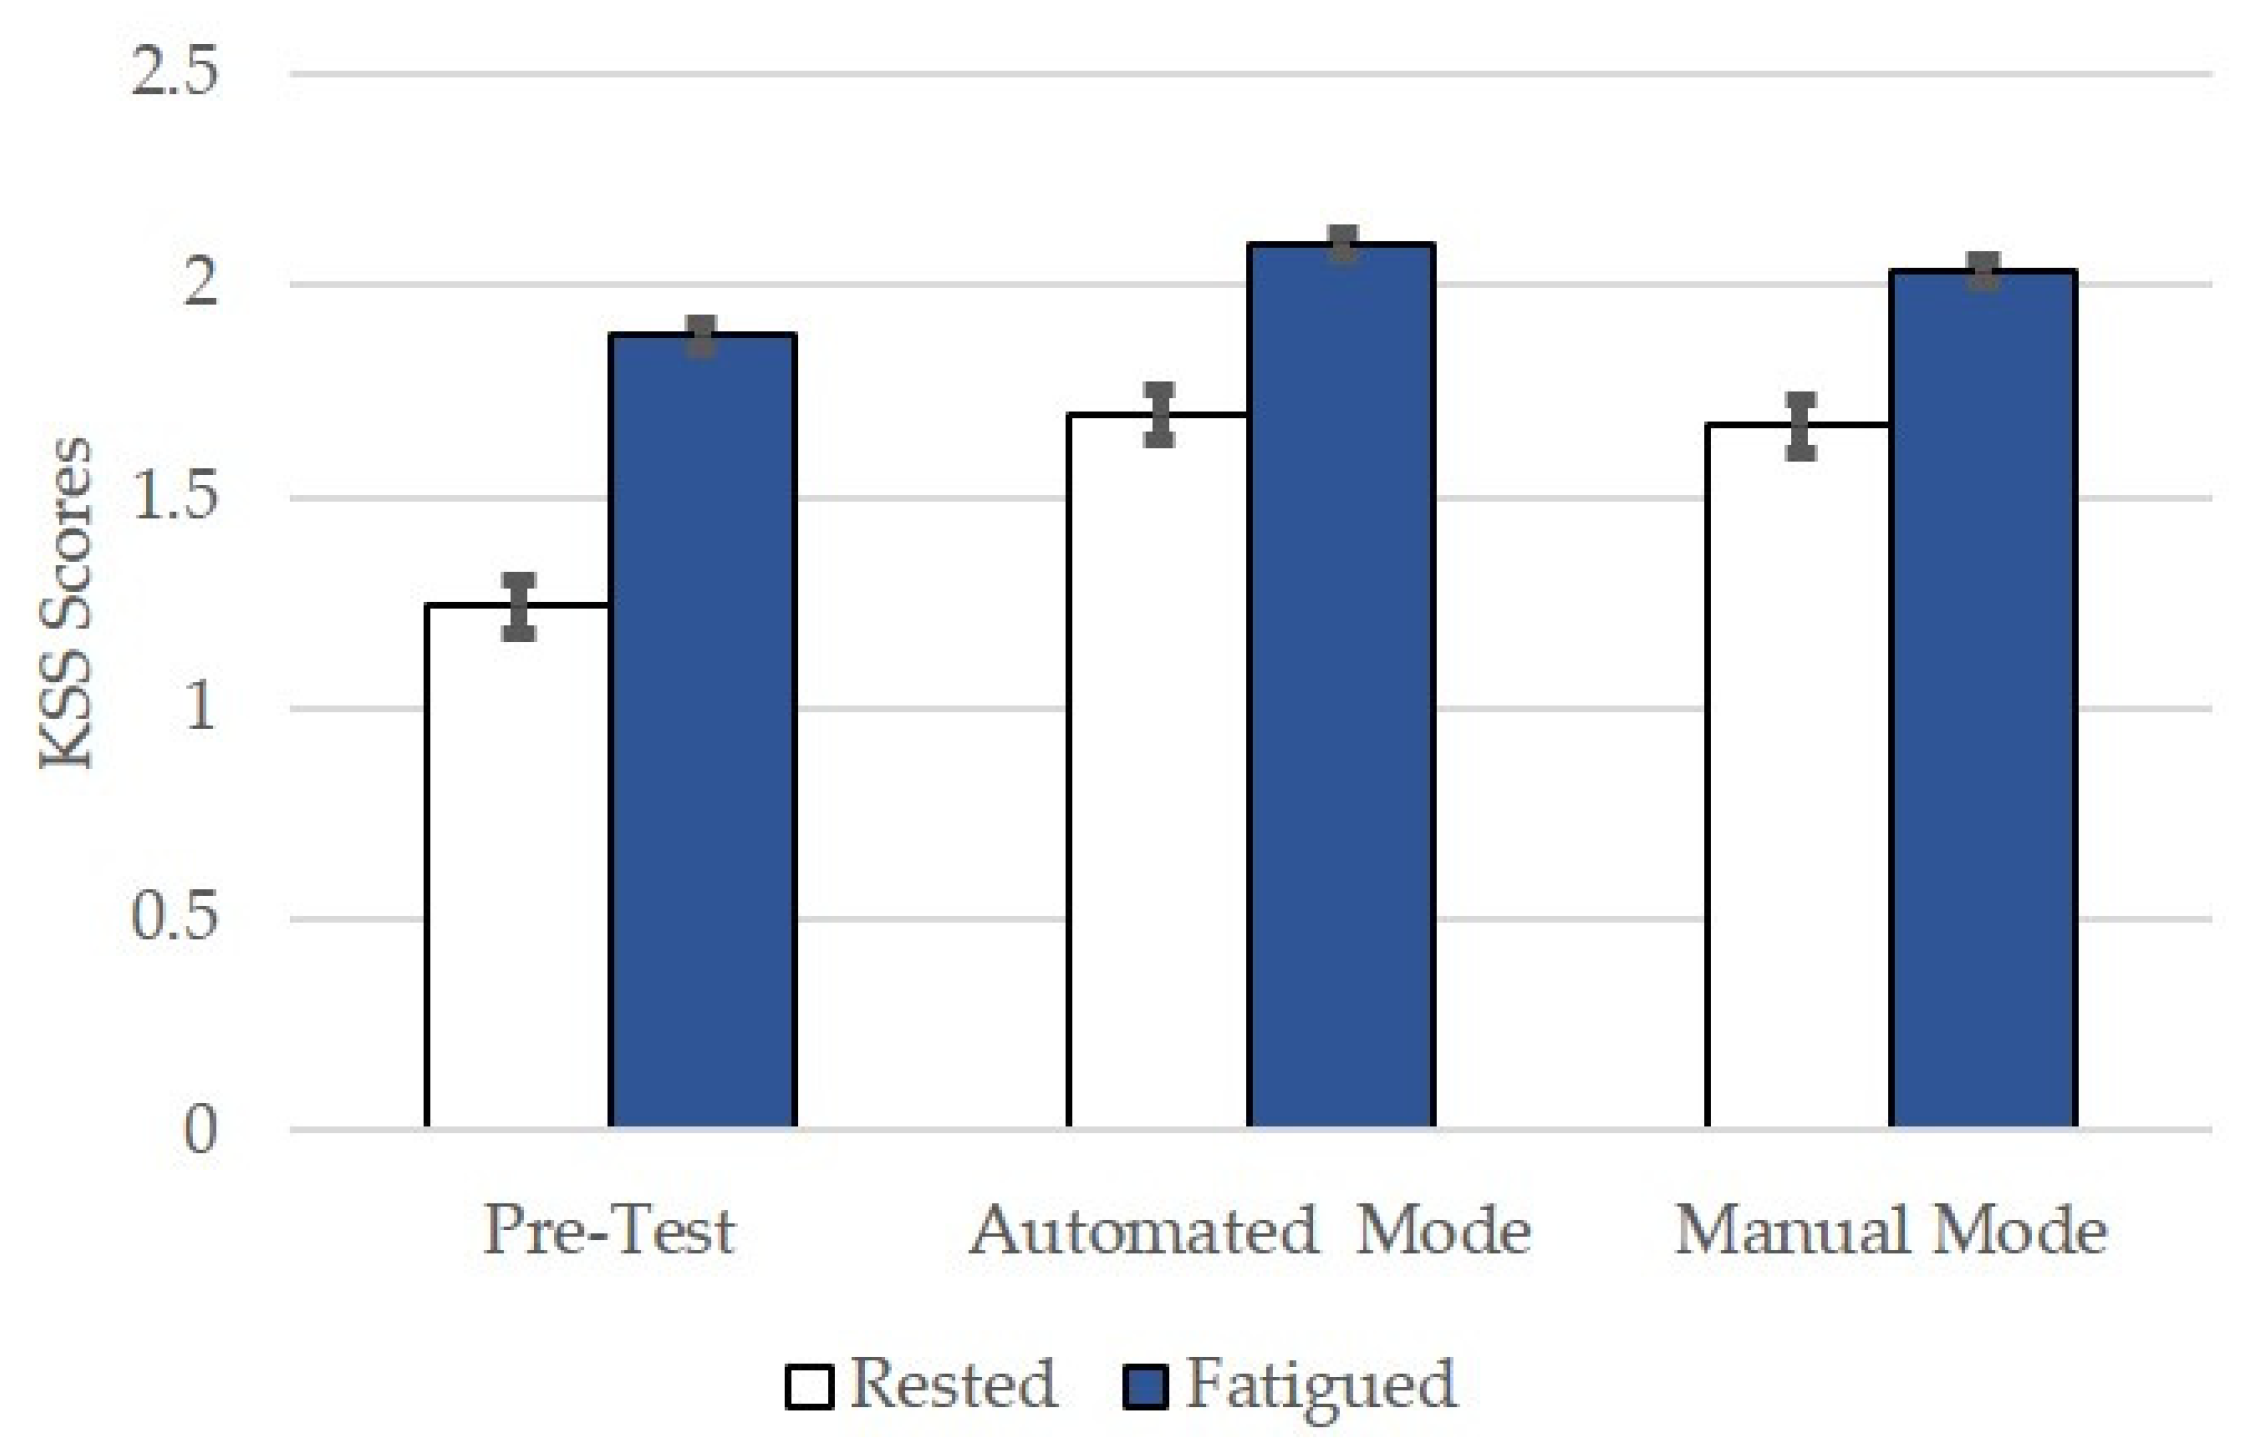
4.3. Automation Effects on Drivers’ Subjective Fatigue
4.4. Automation Effects on Drivers’ Reaction Time
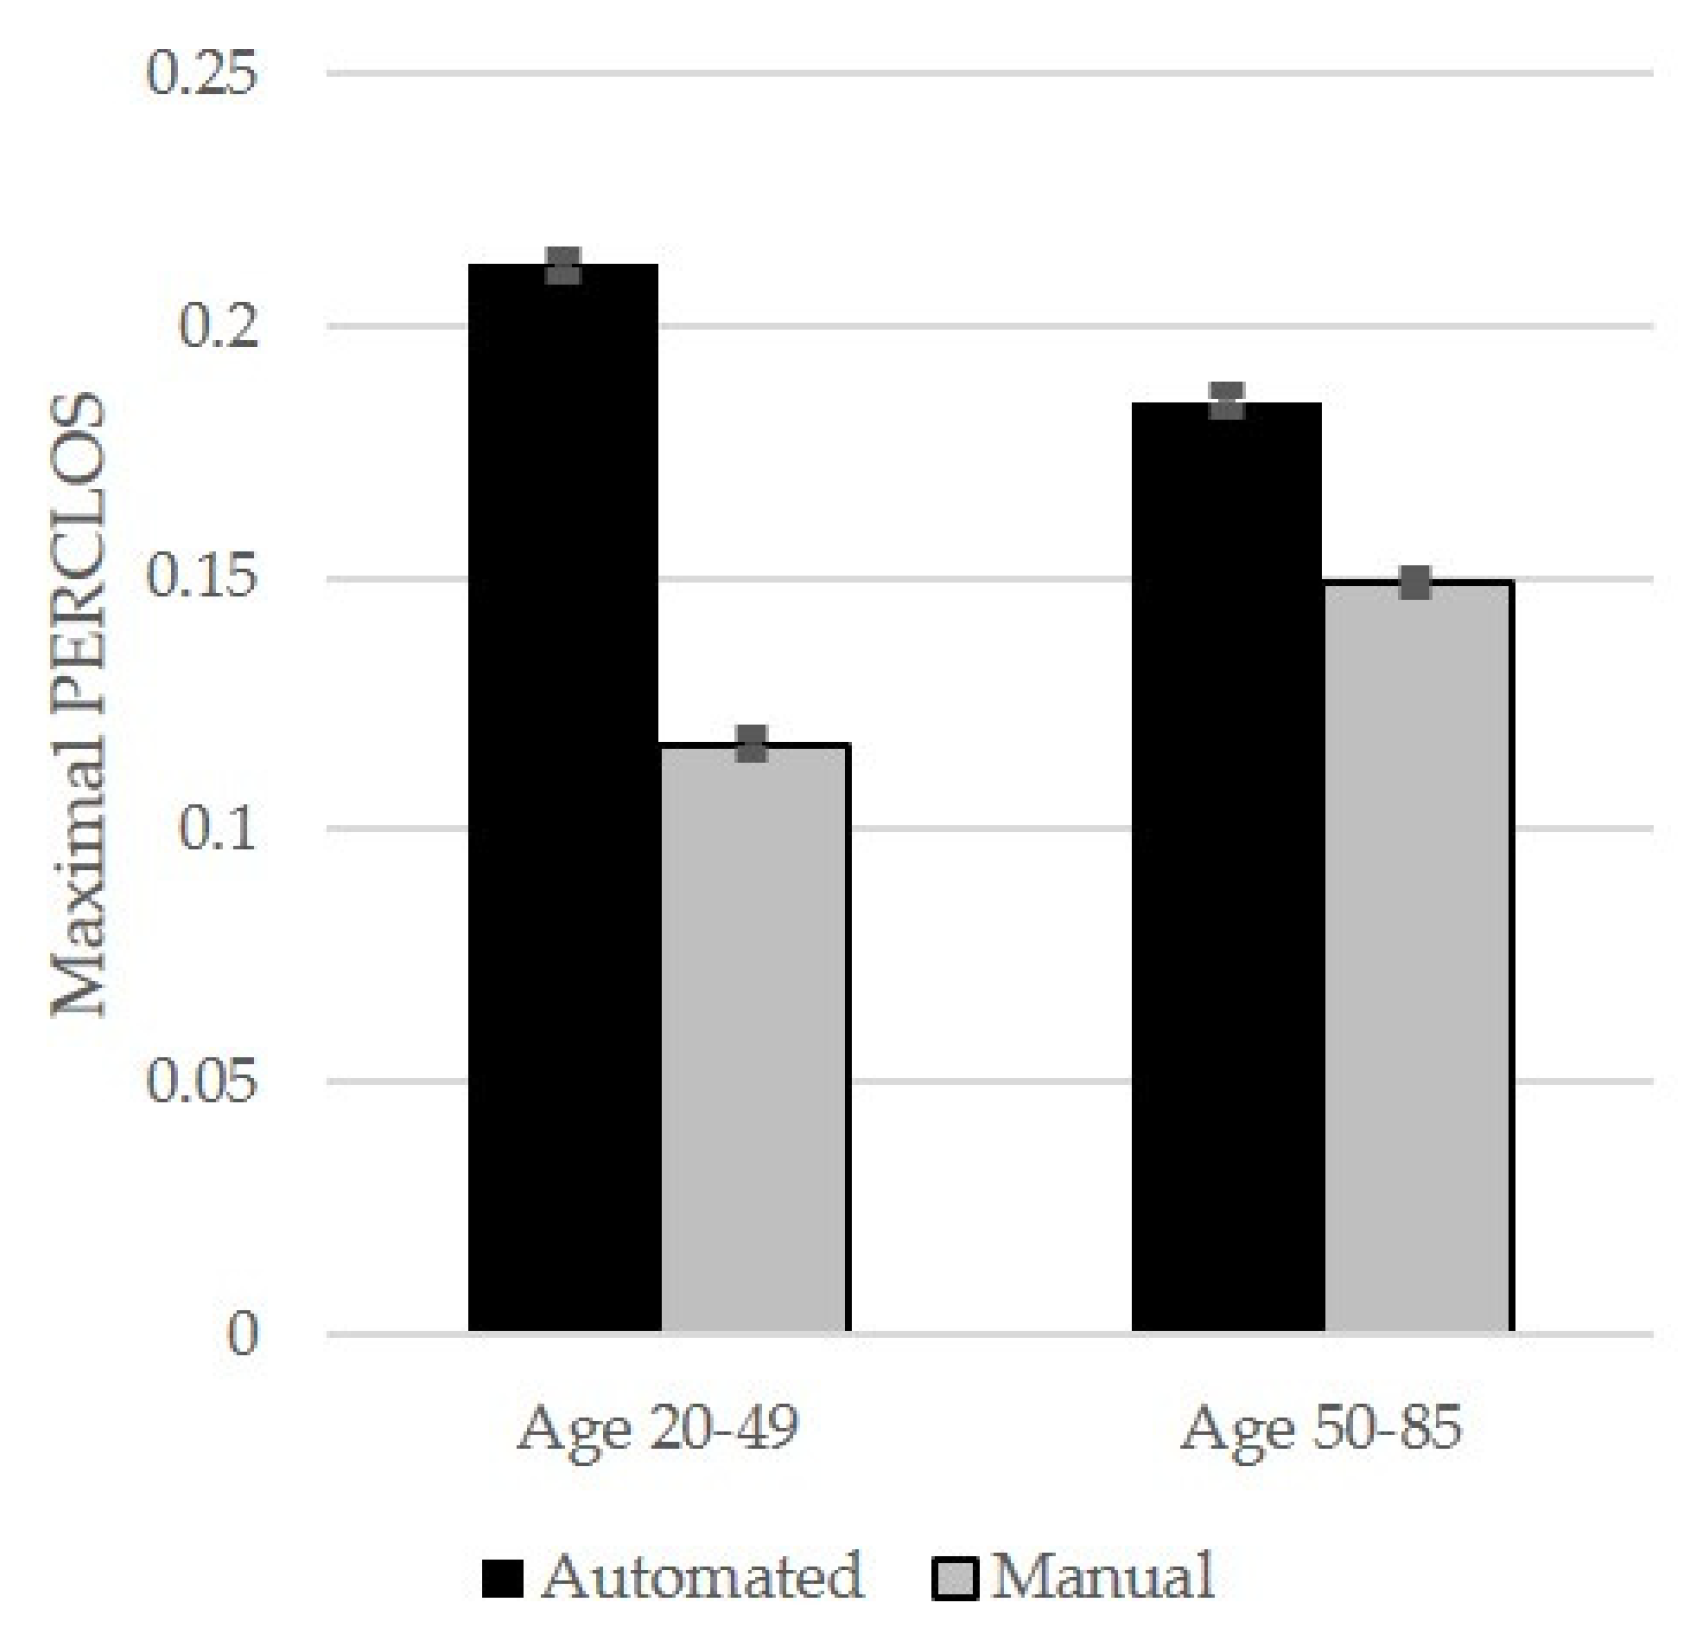
4.5. Effects of Drivers’ Age and Gender
4.6. Correlations between Age, Effort, and Fatigue
5. Discussion
6. Conclusions
Supplementary Materials
Author Contributions
Funding
Informed Consent Statement
Acknowledgments
Conflicts of Interest
References
- Tefft, B.C. Prevalence of Motor Vehicle Crashes Involving Drowsy Drivers, United States, 2009–2013; AAA Foundation for Traffic Safety: Washington, DC, USA, 2014; Available online: http://citeseerx.ist.psu.edu/viewdoc/download?doi=10.1.1.684.6347&rep=rep1&type=pdf (accessed on 31 October 2021).
- National Highway Traffic Safety Administration. Drowsy Driving 2015 DOT HS 812 446; U.S. Department of Transportation: Washington, DC, USA, 2017. Available online: https://crashstats.nhtsa.dot.gov/Api/Public/ViewPublication/812446 (accessed on 31 October 2021).
- Tefft, B.C. The Prevalence and Impact of Drowsy Driving; AAA Foundation for Traffic Safety: Washington, DC, USA, 2010; Available online: https://aaafoundation.org/wp-content/uploads/2018/02/2010DrowsyDrivingReport.pdf (accessed on 31 October 2021).
- Dingus, T.A.; Neale, V.L.; Garness, S.A.; Hanowski, R.J.; Keisler, A.S.; Lee, S.E.; Perez, M.A.; Robinson, G.S.; Belz, S.M.; Casali, J.G.; et al. Impact of Sleeper Berth Usage on Driver Fatigue; Final Project Report; Virginia Tech Transportation Institute: Blacksburg, VA, USA, 2001; Available online: https://vtechworks.lib.vt.edu/bitstream/handle/10919/55096/PB2002107930.pdf?sequence=1&isAllowed=y (accessed on 31 October 2021).
- Hecht, T.; Feldhütter, A.; Radlmayr, J.; Nakano, Y.; Miki, Y.; Henle, C.; Bengler, K. A Review of Driver State Monitoring Systems in the Context of Automated Driving. In Proceedings of the 20th Congress of the International Ergonomics Association (IEA 2018), Volume VI, Transport ergonomics and Human Factors (TEHF), Aerospace Human Factors and Ergonomics, Florence, Italy, 26–30 August 2018; Bagnara, S., Tartaglia, R., Albolino, S., Alexander, T., Fujita, Y., Eds.; Springer: Cham, Switzerland, 2018; pp. 398–408, ISBN 978-3-319-96073-9. [Google Scholar]
- Serban, A.; Poll, E.; Visser, J. A Standard Driven Software Architecture for Fully Autonomous Vehicles. In Proceedings of the 2018 IEEE International Conference on Software Architecture Companion (ICSA-C), Seattle, WA, USA, 30 April–4 May 2018. [Google Scholar] [CrossRef] [Green Version]
- Hirz, M.; Walzel, B. Sensor and object recognition technologies for self-driving cars. Comput.-Aided Des. Appl. 2018, 15, 501–508. [Google Scholar] [CrossRef] [Green Version]
- Kreuzmair, C.; Gold, C.; Meyer, M.-L. The influence of driver fatigue on take-over performance in highly automated vehicles. In Proceedings of the 25th International Technical Conference on the Enhanced Safety of Vehicles (ESV), Detroit, MI, USA, 6 June 2017. [Google Scholar]
- Guo, M.; Li, S.; Wang, L.; Chai, M.; Chen, F.; Wei, Y. Research on the Relationship between Reaction Ability and Mental State for Online Assessment of Driving Fatigue. Int. J. Environ. Res. Public Health 2016, 13, 1174. [Google Scholar] [CrossRef] [PubMed]
- Corfitsen, M. Tiredness and visual reaction time among young male nighttime drivers: A roadside survey. Accid. Anal. Prev. 1994, 26, 617–624. [Google Scholar] [CrossRef]
- Philip, P.; Sagaspe, P.; Moore, N.; Taillard, J.; Charles, A.; Guilleminault, C.; Bioulac, B. Fatigue, sleep restriction and driving performance. Accid. Anal. Prev. 2005, 37, 473–478. [Google Scholar] [CrossRef]
- De Winter, J.C.; Happee, R.; Martens, M.H.; Stanton, N.A. Effects of adaptive cruise control and highly automated driving on workload and situation awareness: A review of the empirical evidence. Transp. Res. Part F Traffic Psychol. Behav. 2014, 27, 196–217. [Google Scholar] [CrossRef] [Green Version]
- Vollrath, M.; Krems, J.F. Verkehrspsychologie: Ein Lehrbuch für Psychologen, Ingenieure und Informatiker, 1. Auflage Transportation Psycholgy: A Manual for Psychologists, Engineers and Computer Scientists, 1st ed.; Kohlhammer Verlag: Stuttgart, Germany, 2011; ISBN 9783170295612. [Google Scholar]
- Hoedemaeker, M.; Brookhuis, K.A. Behavioural adaptation to driving with an adaptive cruise control (ACC). Transp. Res. Part F Traffic Psychol. Behav. 1998, 1, 95–106. [Google Scholar] [CrossRef]
- Stanton, N.A.; Marsden, P. From fly-by-wire to drive-by-wire: Safety implications of automation in vehicles. Saf. Sci. 1996, 24, 35–49. [Google Scholar] [CrossRef] [Green Version]
- Dijksterhuis, C.; Stuiver, A.; Mulder, B.; Brookhuis, K.A.; de Waard, D. An adaptive driver support system: User experiences and driving performance in a simulator. Hum. Factors 2012, 54, 772–785. [Google Scholar] [CrossRef]
- Koglbauer, I.; Braunstingl, R. Applications of Cardiac and Electrodermal Activity Assessment in Aviation. In Aviation Psychology: Applied Methods and Techniques; Koglbauer, I., Biede-Straussberger, S., Eds.; Hogrefe: Boston, MA, USA, 2021; pp. 141–162. ISBN 9780889375888. [Google Scholar]
- Hockey, G.R.J.E.; Gaillard, A.W.K.E.; Burov, O. Operator Functional State: The Assessment and Prediction of Human Performance Degradation in Complex Tasks; IOS Press: Amsterdam, The Netherlands, 2003; ISBN 9781586033620. [Google Scholar]
- Prinzel III, L.J.; Parasuraman, R.; Freeman, F.G.; Scerbo, M.W.; Mikulka, P.J.; Pope, A.T. Effects of a Psychophysiological System for Adaptive Automation on Performance, Workload, and the Event-Related Potential P300 Component. Human Factors 2003, 45, 601–614. [Google Scholar] [CrossRef]
- Fan, J.; Smith, A.P. The Impact of Workload and Fatigue on Performance. In International Symposium on Human Mental Workload: Models and Applications; Longo, L., Leva, M., Eds.; Springer: Cham, Switzerland, 2017. [Google Scholar] [CrossRef]
- Koglbauer, I.; Holzinger, J.; Eichberger, A.; Lex, C. Autonomous emergency braking systems adapted to snowy road conditions improve drivers’ perceived safety and trust. Traffic Inj. Prev. 2018, 19, 332–337. [Google Scholar] [CrossRef] [Green Version]
- Koglbauer, I.; Holzinger, J.; Eichberger, A.; Lex, C. Drivers’ Interaction with Adaptive Cruise Control on Dry and Snowy Roads with Various Tire-Road Grip Potentials. J. Adv. Transp. 2017, 2017, 5496837. [Google Scholar] [CrossRef] [Green Version]
- Muslim, H.; Itoh, M.; Liang, C.K.; Antona-Makoshi, J.; Uchida, N. Effects of gender, age, experience, and practice on driver reaction and acceptance of traffic jam chauffeur systems. Sci. Rep. 2021, 11, 17874. [Google Scholar] [CrossRef] [PubMed]
- Koglbauer, I.V.; Eichberger, A.; Lex, C.; Holzinger, J.; Schinko, C.; Ullrich, T. A model for subjective evaluation of automated vehicle control. In Proceedings of the 18th International Symposium on Aviation Psychology (ISAP 2015), Dayton, OH, USA, 4–7 May 2015. Wright State University Conferences and Events. [Google Scholar]
- Koglbauer, I.; Eichberger, A.; Lex, C.; Bliem, N.; Sternat, A.; Holzinger, J.; Schinko, C.; Battel, M. Bewertung von Fahrerassistenzsystemen von Nicht Professionellen Fahrerinnen und Fahrern im Realversuch [Assessment of Driver Assistance Systems with Amateur Drivers in Real Driving Tests]. In Humanwissenschaftliche Beiträge zur Sicherheit und Ökologie des Verkehrs. [Human Scientific Contributions to the Safety and Ecology of Transportation]; Chaloupka-Risser, C., Ed.; INFAR: Salzburg, Austria, 2015; pp. 59–70. [Google Scholar]
- Obst, P.; Armstrong, K.; Smith, S.; Banks, T. Age and gender comparisons of driving while sleepy: Behaviours and risk perceptions. Transp. Res. Part F Traffic Psychol. Behav. 2011, 14, 539–542. [Google Scholar] [CrossRef] [Green Version]
- Akerstedt, T.; Kecklund, G. Age, gender and early morning highway accidents. J. Sleep Res. 2001, 10, 105–110. [Google Scholar] [CrossRef]
- Soares, S.; Monteiro, T.; Lobo, A.; Couto, A.; Cunha, L.; Ferreira, S. Analyzing Driver Drowsiness: From Causes to Effects. Sustainability 2020, 12, 1971. [Google Scholar] [CrossRef] [Green Version]
- Lowden, A.; ANUND, A.; Kecklund, G.; Peters, B.; Akerstedt, T. Wakefulness in young and elderly subjects driving at night in a car simulator. Accid. Anal. Prev. 2009, 41, 1001–1007. [Google Scholar] [CrossRef]
- Akerstedt, T.; Peters, B.; ANUND, A.; Kecklund, G. Impaired alertness and performance driving home from the night shift: A driving simulator study. J. Sleep Res. 2005, 14, 17–20. [Google Scholar] [CrossRef]
- Hargutt, V.; Hoffmann, S.; Vollrath, M.; Krüger, H. Compensation for drowsiness & fatigue-a driving simulation study. In Proceedings of the International Conference on Traffic and Transport Psychology ICTTP, Bern, Switzerland, 4–7 September 2000. [Google Scholar]
- Ahlström, C.; Zemblys, R.; Jansson, H.; Forsberg, C.; Karlsson, J.; ANUND, A. Effects of partially automated driving on the development of driver sleepiness. Accid. Anal. Prev. 2021, 153, 106058. [Google Scholar] [CrossRef]
- Schömig, N.; Hargutt, V.; Neukum, A.; Petermann-Stock, I.; Othersen, I. The Interaction Between Highly Automated Driving and the Development of Drowsiness. Procedia Manuf. 2015, 3, 6652–6659. [Google Scholar] [CrossRef] [Green Version]
- Scarpelli, S.; Alfonsi, V.; Gorgoni, M.; Camaioni, M.; Giannini, A.M.; de Gennaro, L. Age-Related Effect of Sleepiness on Driving Performance: A Systematic-Review. Brain Sci. 2021, 11, 1090. [Google Scholar] [CrossRef]
- Campagne, A.; Pebayle, T.; Muzet, A. Correlation between driving errors and vigilance level: Influence of the driver’s age. Physiol. Behav. 2004, 80, 515–524. [Google Scholar] [CrossRef] [PubMed]
- Schinko, C.; Peer, M.; Hammer, D.; Pirstinger, M.; Lex, C.; Koglbauer, I.; Eichberger, A.; Holzinger, J.; Eggeling, E.; Fellner, D.W.; et al. Building a Driving Simulator with Parallax Barrier Displays. In Proceedings of the 11th Joint Conference on Computer Vision, Imaging and Computer Graphics Theory and Applications. International Conference on Computer Graphics Theory and Applications, Rome, Italy, 27–29 February 2016; pp. 281–289, ISBN 978-989-758-175-5. [Google Scholar]
- Lex, C.; Hammer, D.; Pirstinger, M.; Peer, M.; Samiee, S.; Schinko, C.; Ullrich, T.; Battel, M.; Holzinger, J.; Koglbauer, I.; et al. Multidisciplinary Development of a Driving Simulator with Autostereoscopic Visualization for the Integrated Development of Driver Assistance Systems. In Proceedings of the Conference for Combustion, Emissions, Particulates and Testing, Dresden, Germany, 26–27 November 2015. [Google Scholar]
- Arefnezhad, S.; Eichberger, A.; Frühwirth, M.; Kaufmann, C.; Moser, M.; Koglbauer, I.V. Driver Monitoring of Automated Vehicles by Classification of Driver Drowsiness Using a Deep Convolutional Neural Network Trained by Scalograms of ECG Signals. Energies 2022, 15, 480. [Google Scholar] [CrossRef]
- Hart, S.G.; Staveland, L.E. Development of NASA-TLX (Task Load Index): Results of Empirical and Theoretical Research. In Human Mental Workload; Hancock, P.A., Meshkati, N., Eds.; North-Holland: Amsterdam, The Netherlands, 1988; pp. 139–183. ISBN 9780444703880. [Google Scholar]
- Akerstedt, T.; Gillberg, M. Subjective and objective sleepiness in the active individual. Int. J. Neurosci. 1990, 52, 29–37. [Google Scholar] [CrossRef] [PubMed]
- Dinges, D.; Grace, R. PERCLOS: A Valid Psychophysiological Measure of Alertness as Assessed by Psychomotor Vigilance; Federal Highway Administration, Office of Motor Carriers: Washington, DC, USA, 1998; Report No. FHWA-MCRT-98-006. [Google Scholar] [CrossRef]
- Sommer, D.; Golz, M. Evaluation of PERCLOS based current fatigue monitoring technologies. In Proceedings of the 2010 Annual International Conference of the IEEE Engineering in Medicine and Biology, Buenos Aire, Argentina, 31 August–4 September 2010; pp. 4456–4459. [Google Scholar] [CrossRef]
- Junaedi, S.; Akbar, H. Driver Drowsiness Detection Based on Face Feature and PERCLOS. J. Phys. Conf. Ser. 2018, 1090, 12037. [Google Scholar] [CrossRef]
- Chaput, J.P.; Dutil, C.; Sampasa-Kanyinga, H. Sleeping hours: What is the ideal number and how does age impact this? Nat. Sci. Sleep 2018, 10, 421–430. [Google Scholar] [CrossRef] [Green Version]
- Schiebinger, L. Gendered innovations: Harnessing the creative power of sex and gender analysis to discover new ideas and develop new technologies. Triple Helix 2014, 1, 1–17. [Google Scholar] [CrossRef] [Green Version]
- Ohayon, M.M.; Carskadon, M.A.; Guilleminault, C.; Vitiello, M.V. Meta analysis of quantitative sleep parameters from childhood to old age in healthy individuals: Developing normative sleep values across the human lifespan. Sleep 2004, 27, 1255–1273. [Google Scholar] [CrossRef]


| Group | Group Size | Age (Years) | Driving Activity in the Past 12 Months (Thousand Kilometers) | ||
|---|---|---|---|---|---|
| Data | N | Mean | SD | Mean | SD |
| Women 20–49 years | 23 | 31.26 | 10.46 | 14.043 | 13.645 |
| Men 20–49 years | 18 | 29.44 | 9.94 | 15.244 | 14.843 |
| Both genders 20–49 years | 41 | 30.46 | 10.15 | 14.571 | 14.015 |
| Women 50–85 years | 21 | 60.29 | 7.13 | 13.019 | 17.449 |
| Men 50–85 years | 27 | 62.52 | 9.01 | 17.814 | 11.021 |
| Both genders 50–85 years | 48 | 61.54 | 8.23 | 15.717 | 14.232 |
| Women total | 44 | 49.29 | 18.83 | 16.787 | 12.591 |
| Men total | 45 | 45.11 | 17.17 | 13.554 | 15.400 |
| Driving Mode | Automated Driving | Manual Driving | ||
|---|---|---|---|---|
| Dependent Measure | Mean | SD | Mean | SD |
| Mental Demand | 0.950 | 0.062 | 1.373 | 0.060 |
| Physical Demand | 0.670 | 0.060 | 1.130 | 0.055 |
| Temporal Demand | 0.709 | 0.058 | 1.038 | 0.060 |
| Performance | 1.343 | 0.076 | 1.747 | 0.046 |
| Effort | 1.047 | 0.071 | 1.494 | 0.058 |
| Frustration | 1.221 | 0.075 | 1.220 | 0.068 |
| Minimal PERCLOS | 0.008 | 0.002 | 0.005 | 0.001 |
| Maximal PERCLOS | 0.198 | 0.014 | 0.133 | 0.010 |
| Median PERCLOS | 0.050 | 0.007 | 0.025 | 0.004 |
| Mean PERCLOS | 0.062 | 0.007 | 0.034 | 0.004 |
| Variance PERCLOS | 0.005 | 0.001 | 0.003 | 0.001 |
| Minimal RT | 0.940 | 0.043 | 0.814 | 0.038 |
| Maximal RT | 1.322 | 0.084 | 1.101 | 0.058 |
| Median RT | 1.083 | 0.055 | 0.932 | 0.040 |
| Mean RT | 1.154 | 0.066 | 0.970 | 0.046 |
| Variance RT | 0.626 | 0.167 | 0.352 | 0.105 |
Publisher’s Note: MDPI stays neutral with regard to jurisdictional claims in published maps and institutional affiliations. |
© 2022 by the authors. Licensee MDPI, Basel, Switzerland. This article is an open access article distributed under the terms and conditions of the Creative Commons Attribution (CC BY) license (https://creativecommons.org/licenses/by/4.0/).
Share and Cite
Arefnezhad, S.; Eichberger, A.; Koglbauer, I.V. Effects of Automation and Fatigue on Drivers from Various Age Groups. Safety 2022, 8, 30. https://doi.org/10.3390/safety8020030
Arefnezhad S, Eichberger A, Koglbauer IV. Effects of Automation and Fatigue on Drivers from Various Age Groups. Safety. 2022; 8(2):30. https://doi.org/10.3390/safety8020030
Chicago/Turabian StyleArefnezhad, Sadegh, Arno Eichberger, and Ioana Victoria Koglbauer. 2022. "Effects of Automation and Fatigue on Drivers from Various Age Groups" Safety 8, no. 2: 30. https://doi.org/10.3390/safety8020030