
Evaluation of STIR Library Adapted for PET Scanners with Non-Cylindrical Geometry

 , , , and
Abstract
:1. Introduction
- Diagnose the “BlocksOnCylindrical” class using various phantoms (measured or simulated) as test objects for the BPET scanner;
- Improve the “BlocksOnCylindrical” class for more accurate reconstructions;
- Incorporate various features (single scatter simulation, attenuation correction, forward projection), previously only available in the “Cylindrical”class, into the “BlocksOnCylindrical” class;
- Perform quantitative measurements using various phantoms, such as a point source (spatial resolution), a uniform cylinder (uniformity), and an image quality phantom as proposed by Moliner et al. [11].
2. Materials and Methods
2.1. Materials
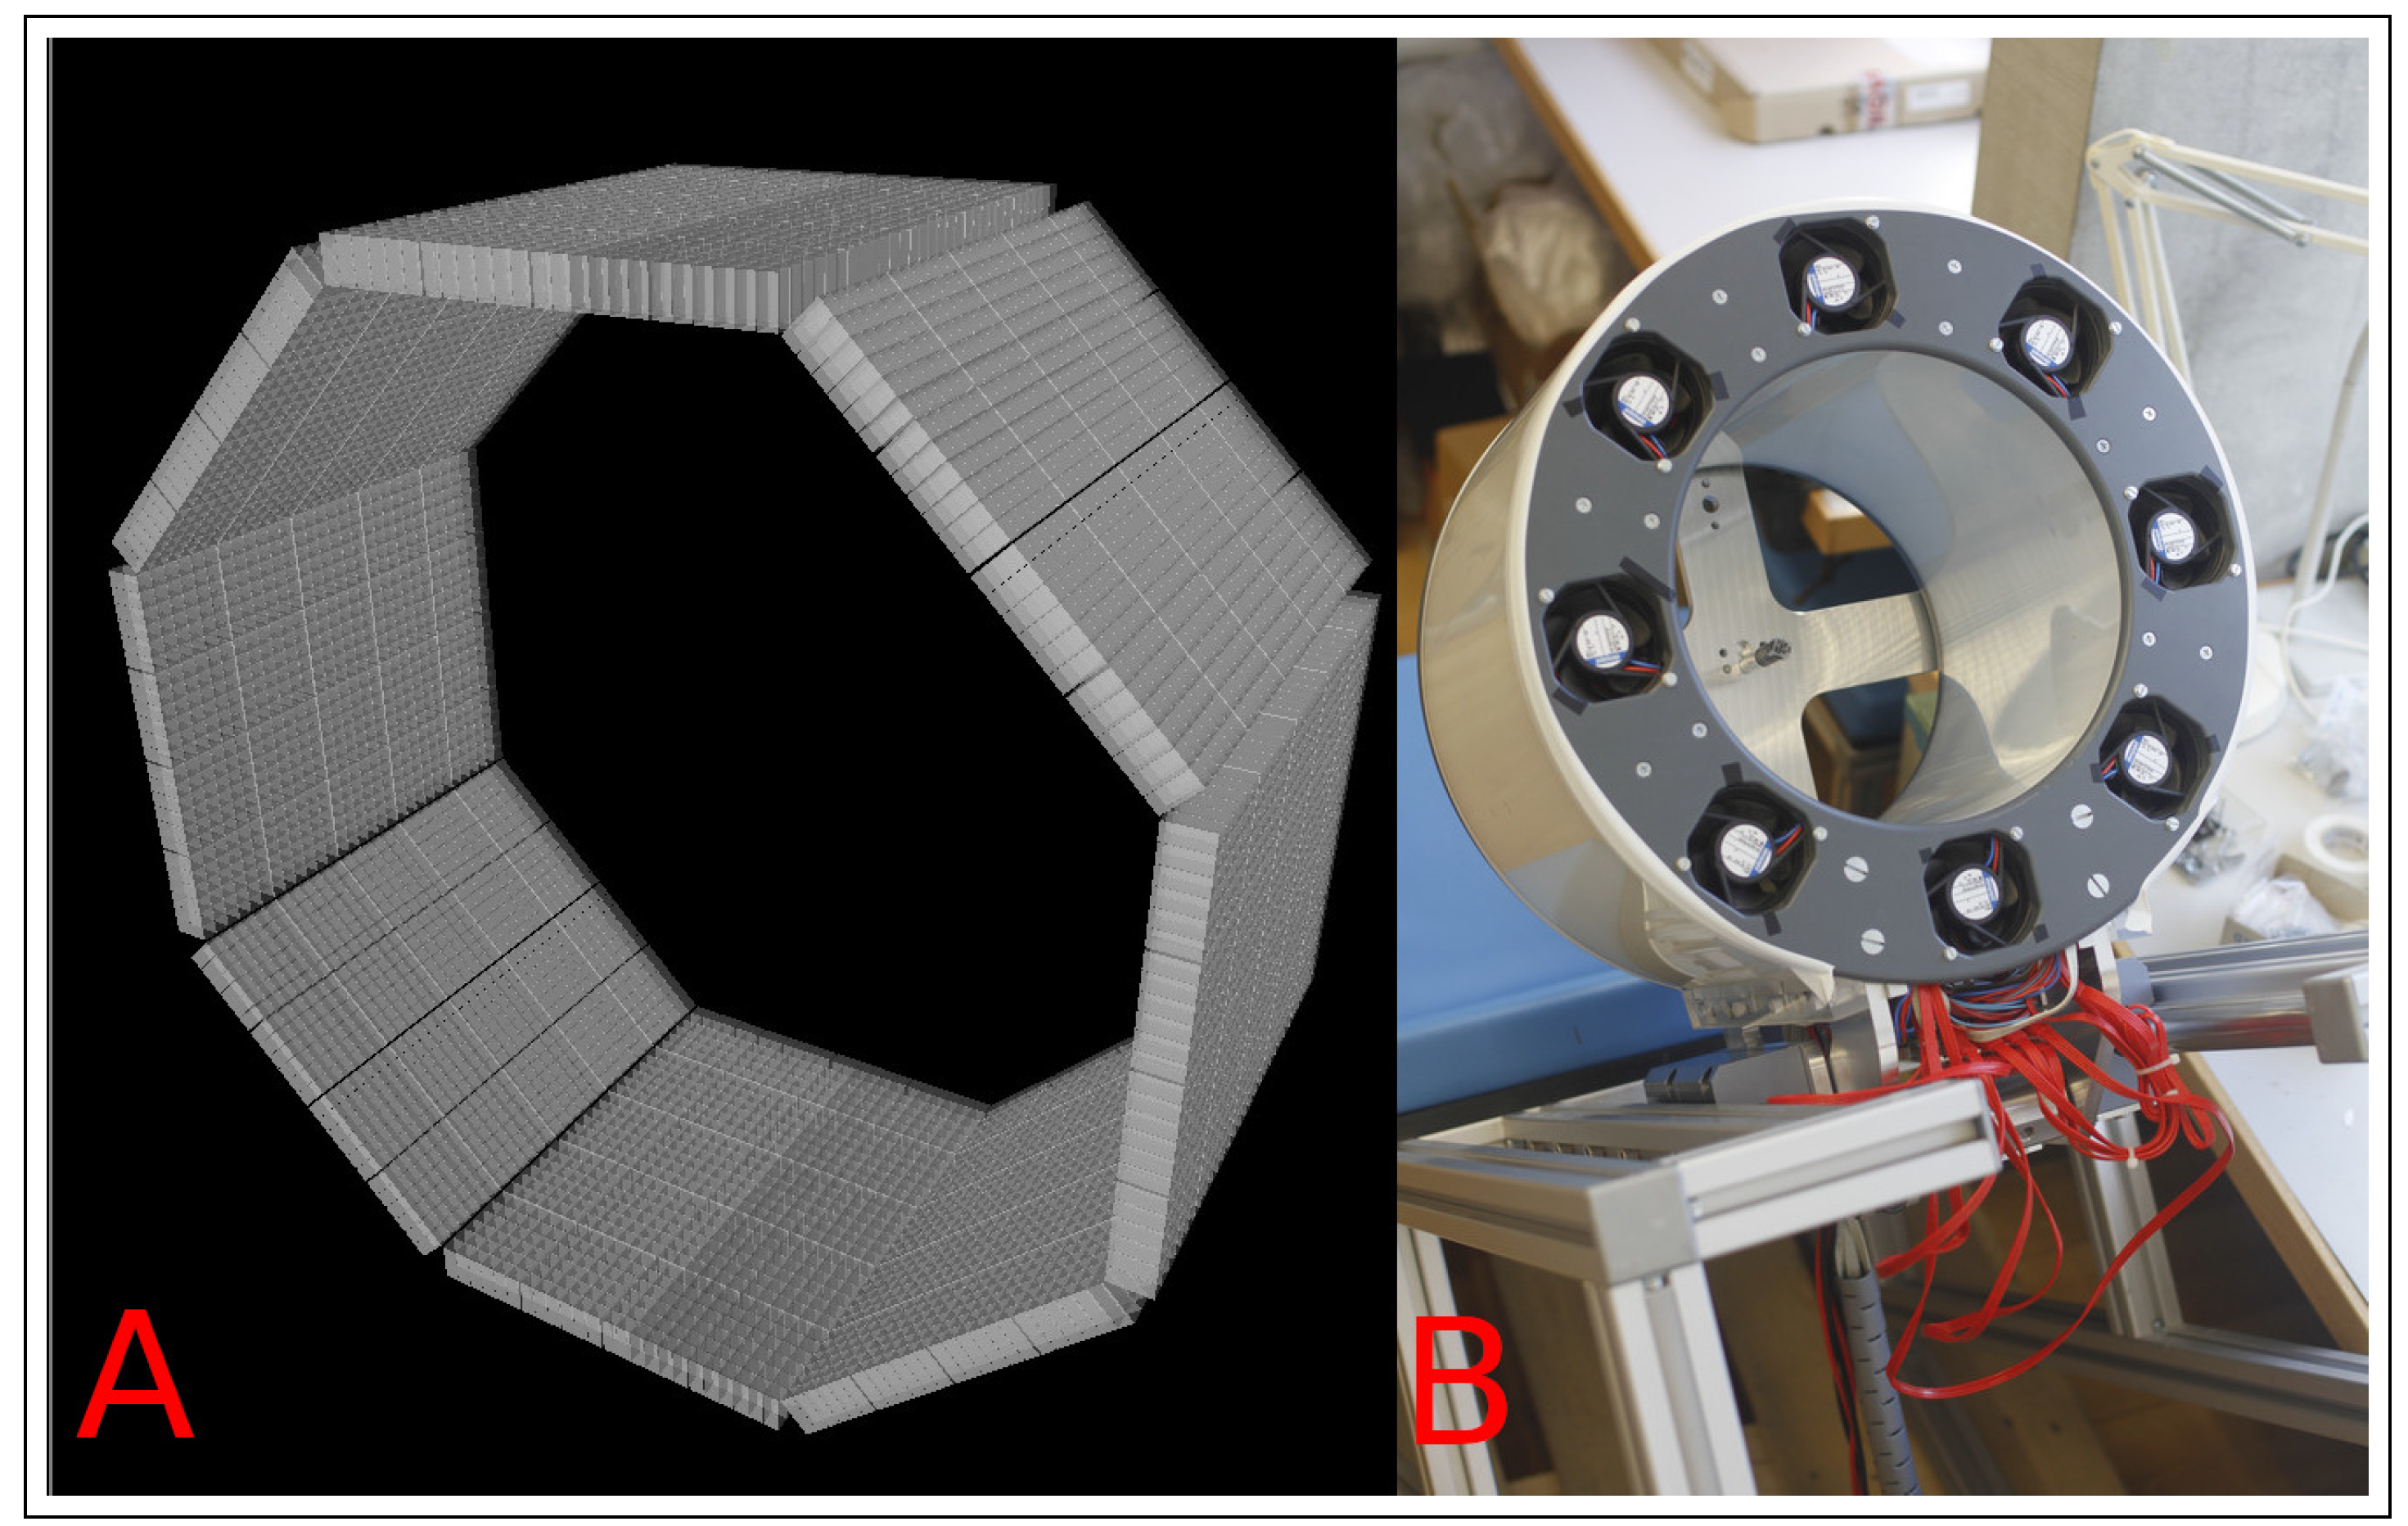
2.1.1. PET Scanner
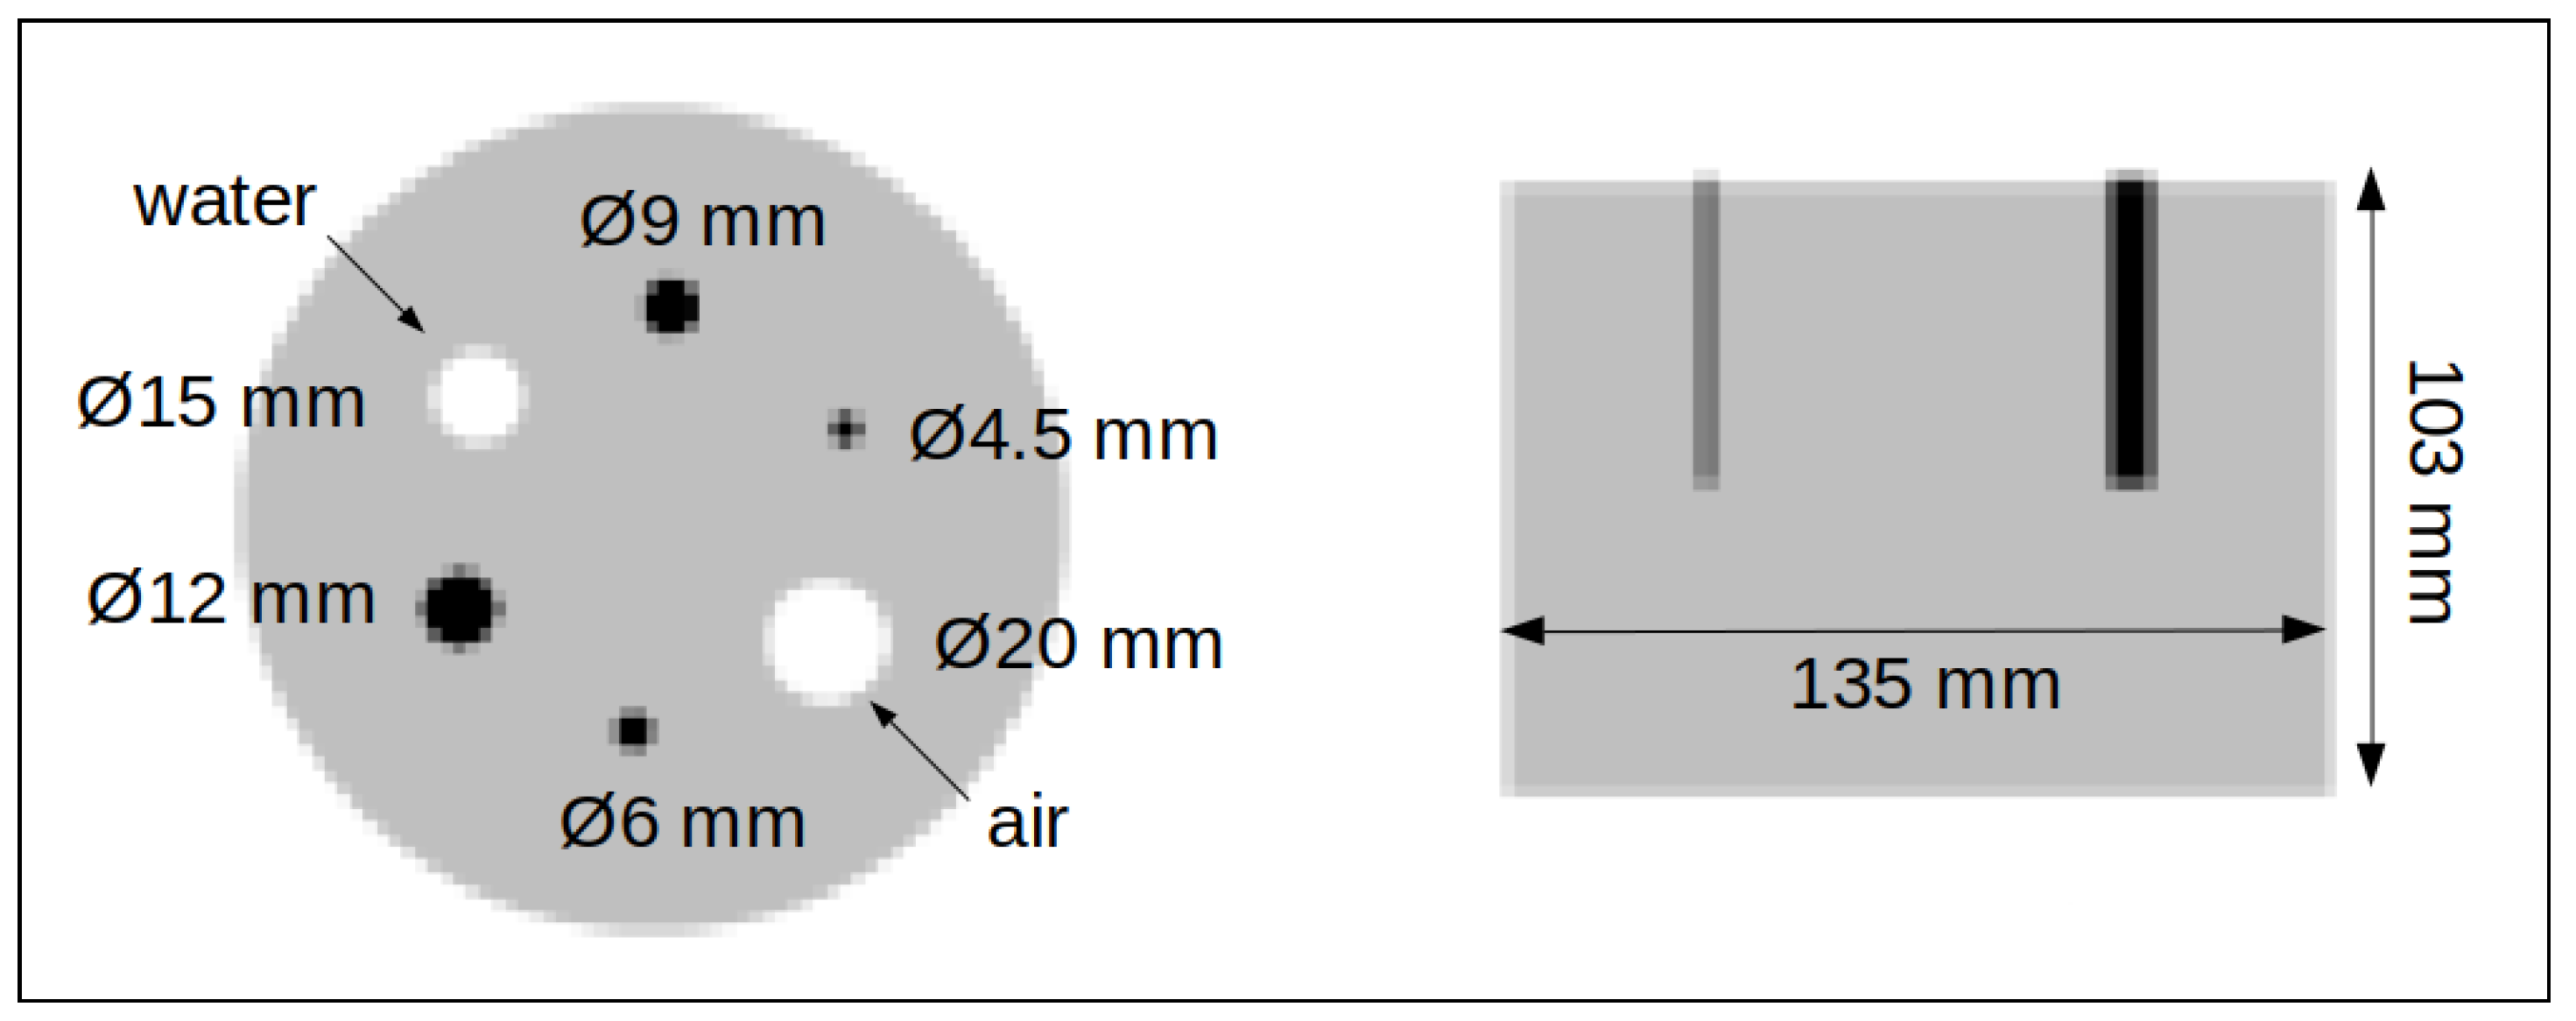
2.1.2. Phantoms
2.1.3. Metrics
2.2. Methods
2.2.1. Monte Carlo Simulations
2.2.2. Iterative Reconstruction Pipeline
2.3. STIR Development
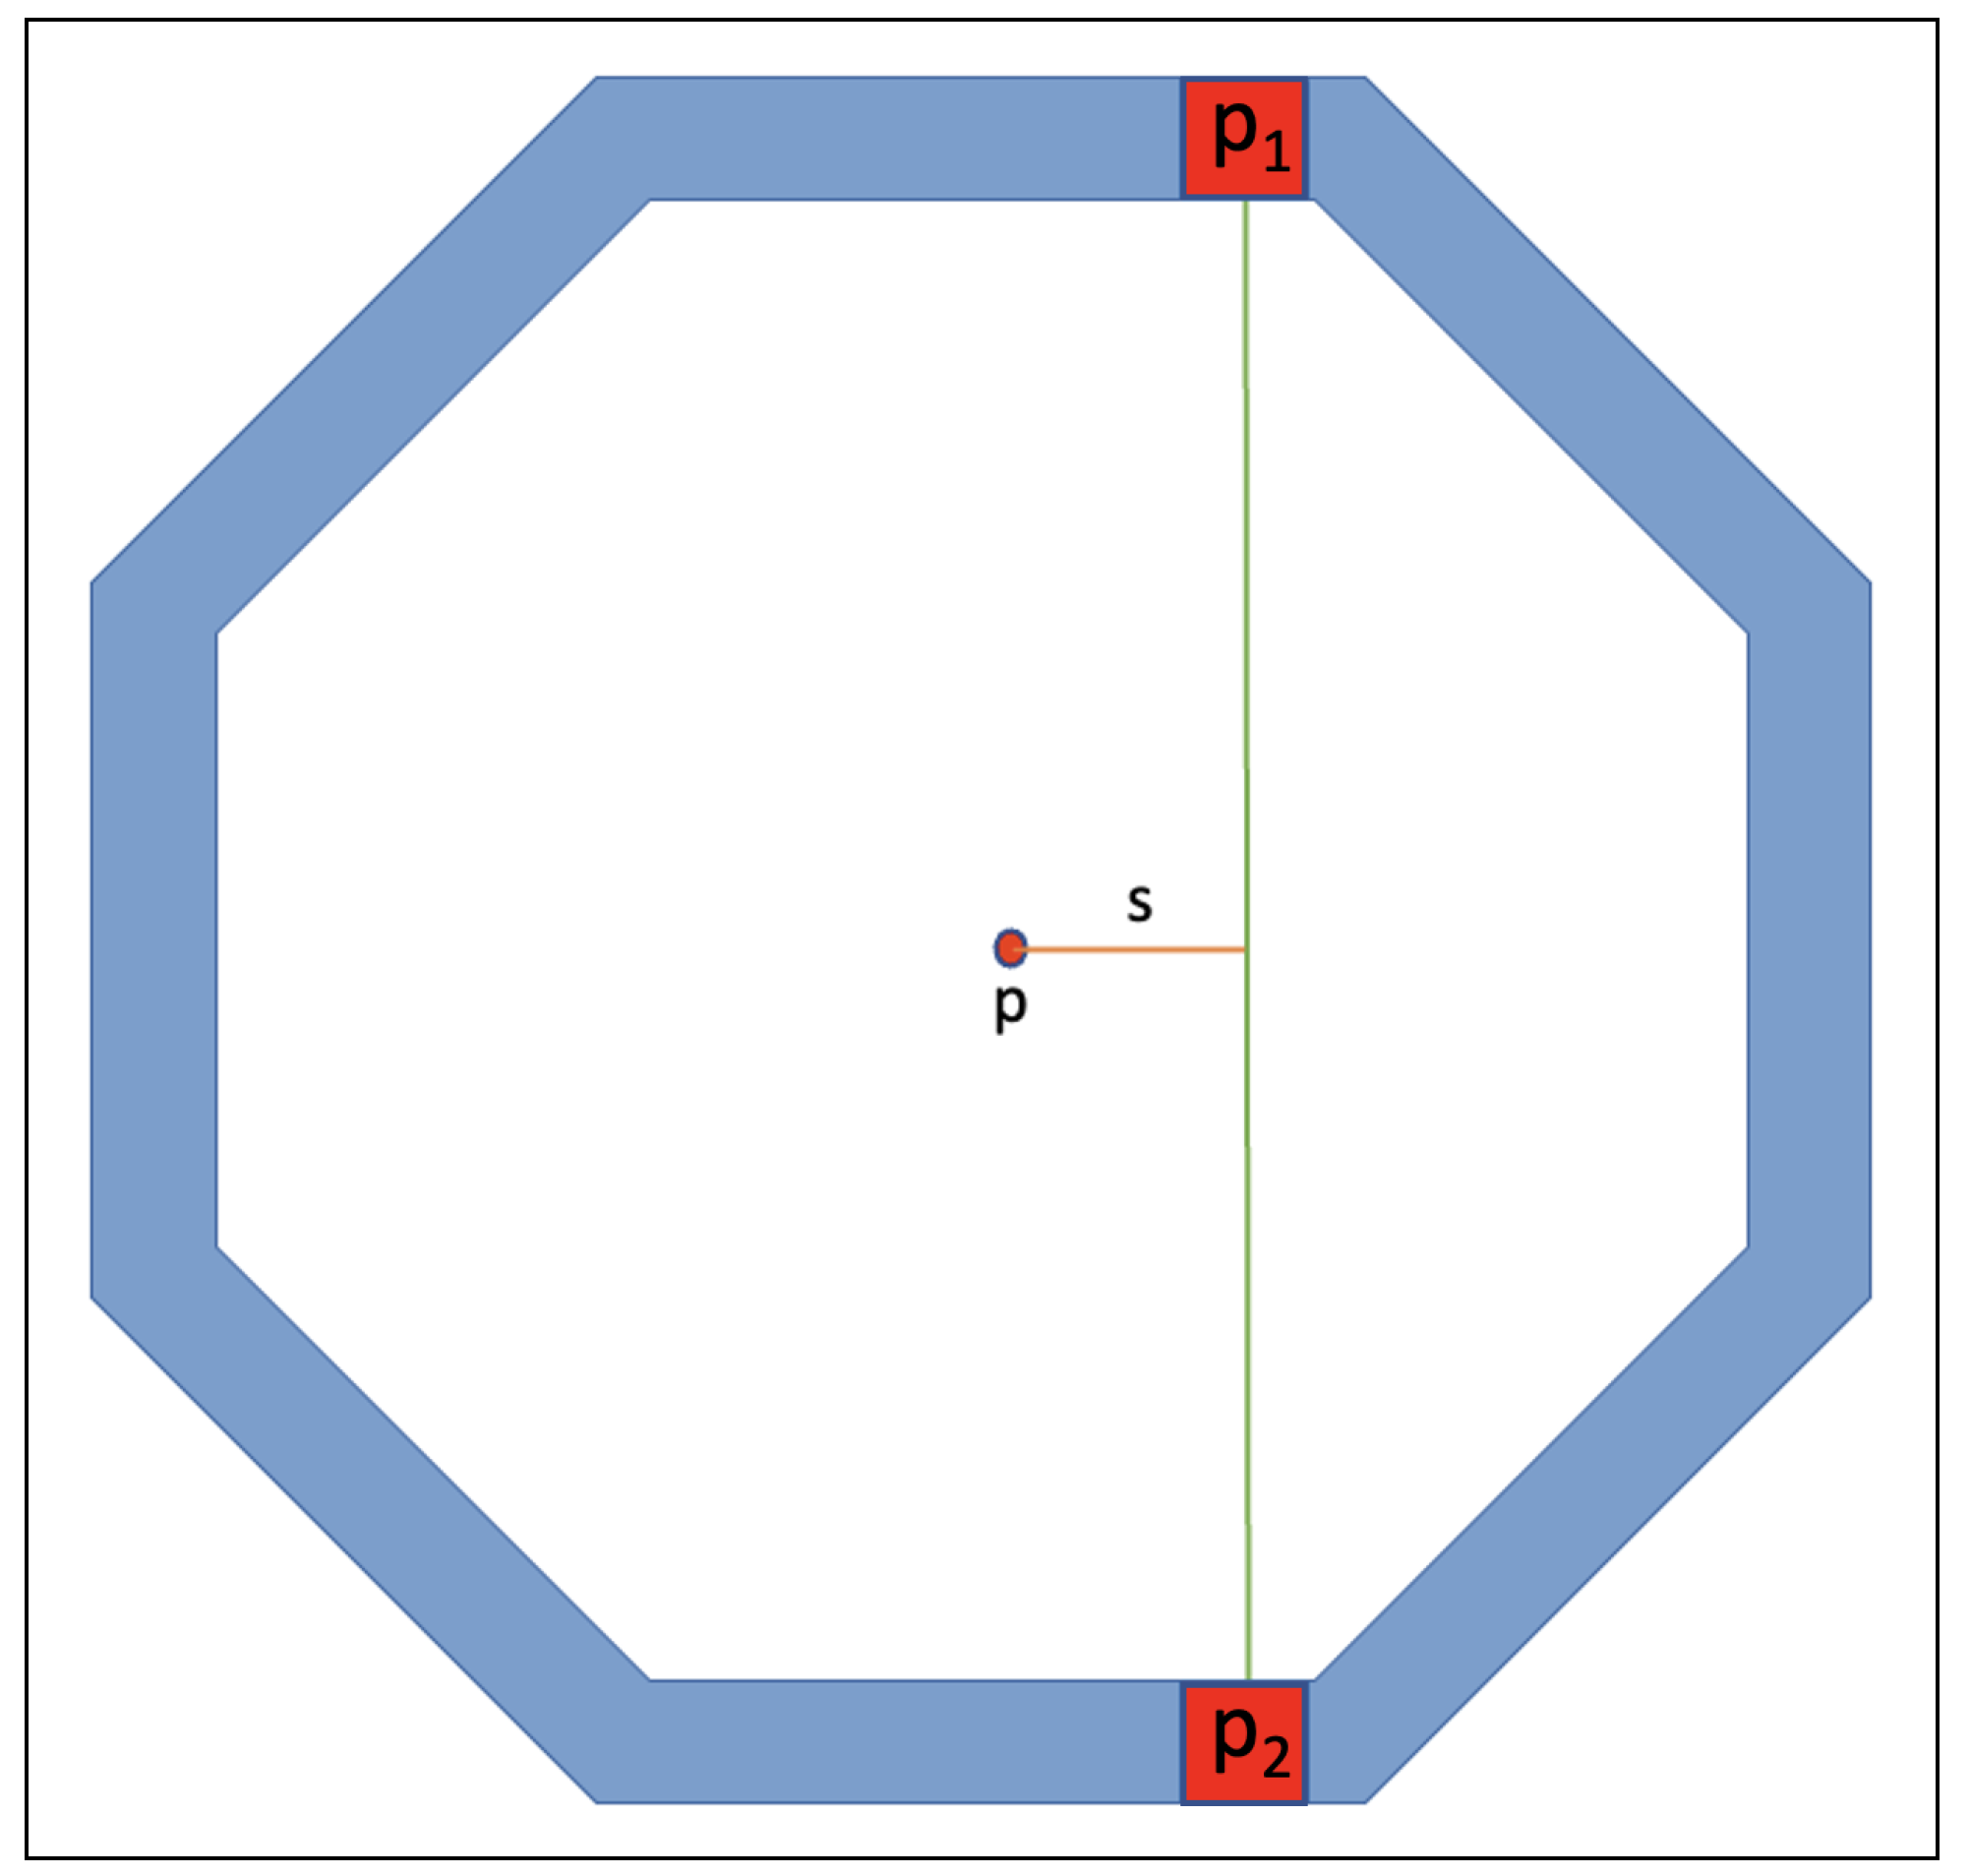
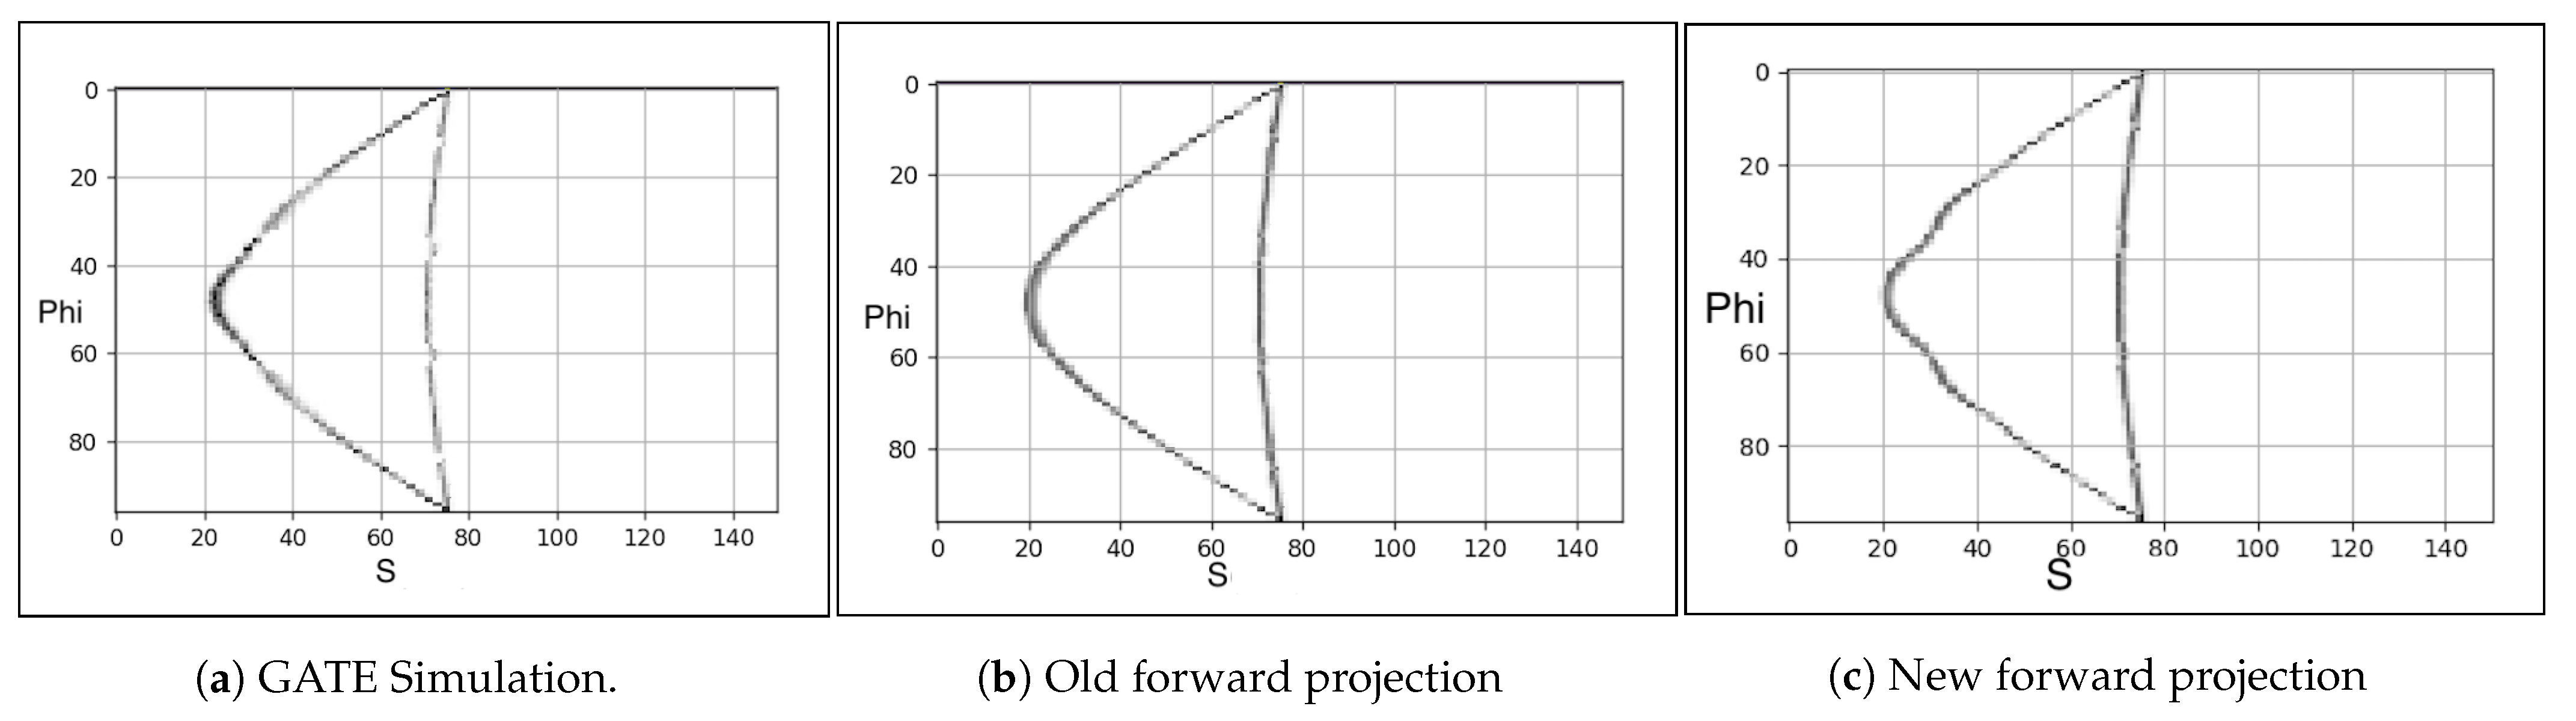
2.3.1. Forward Projection
- The coordinates of two endpoints of LOR;
- The origin of the coordinate system to be set to the centre of the scanner, i.e., origin is at , where l is scanner length.
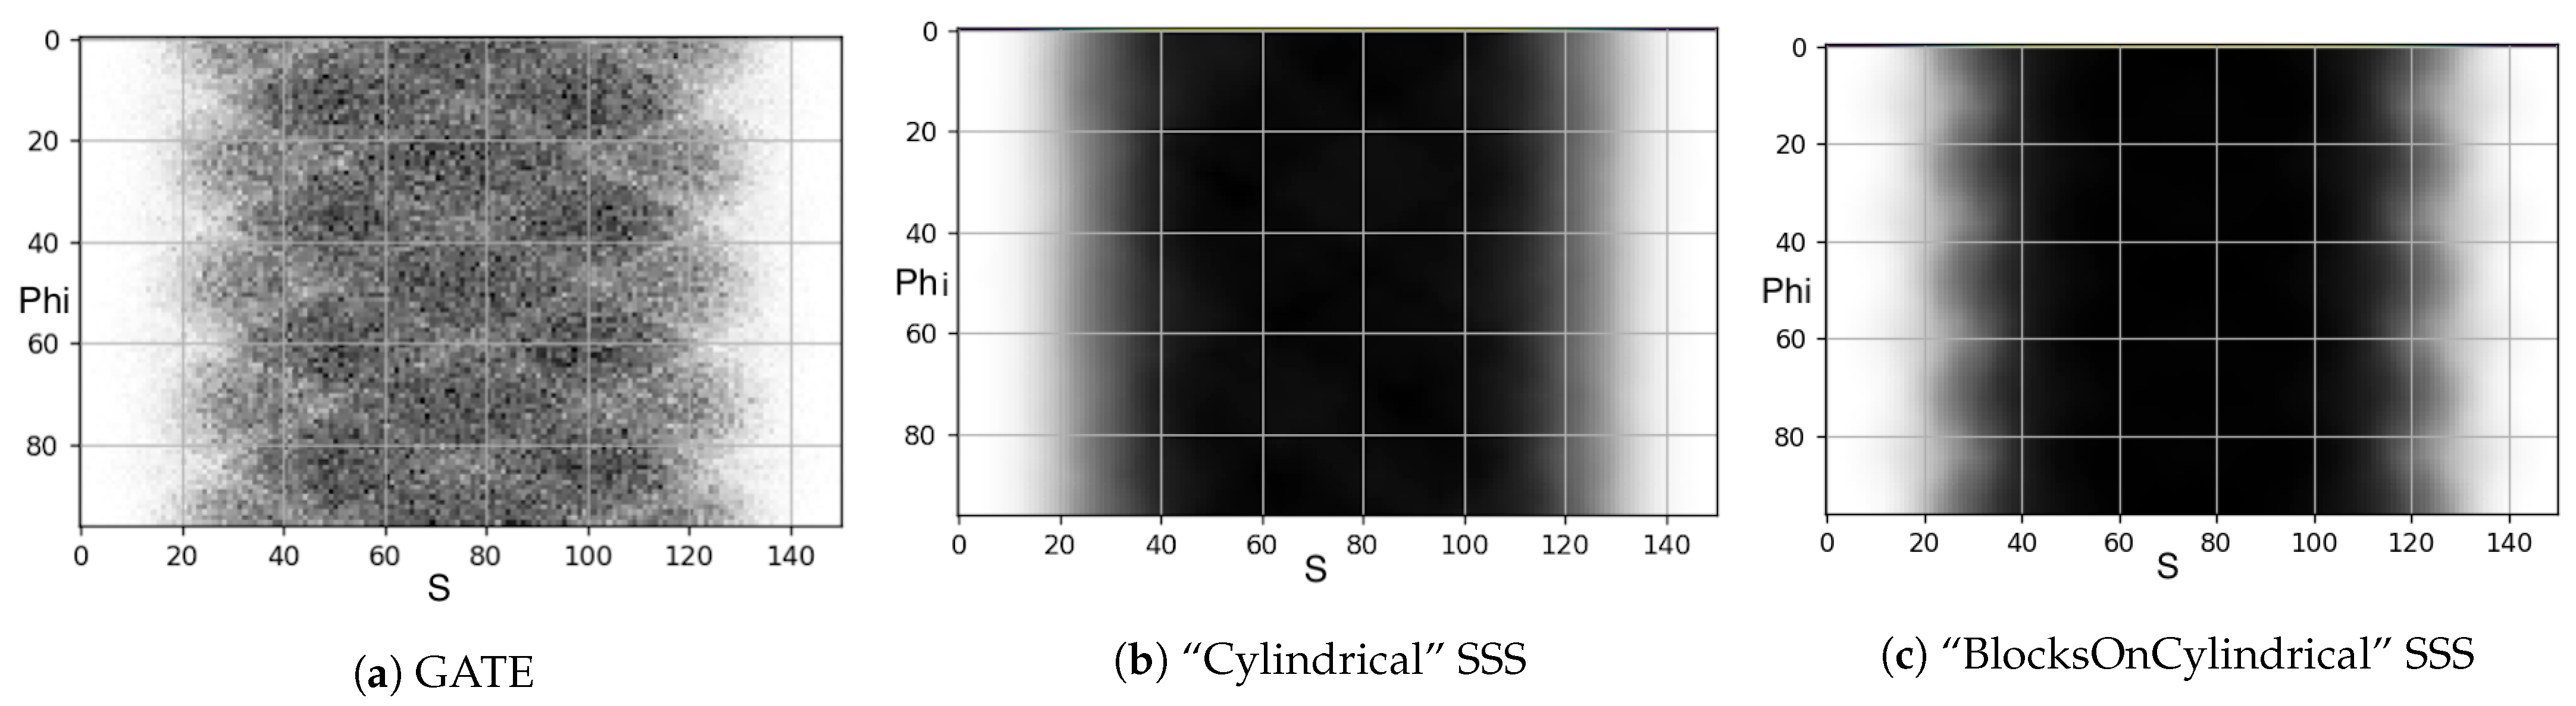
2.3.2. Single Scatter Simulation
3. Results and Discussion
3.1. Forward Projection
3.2. Single Scatter Simulation
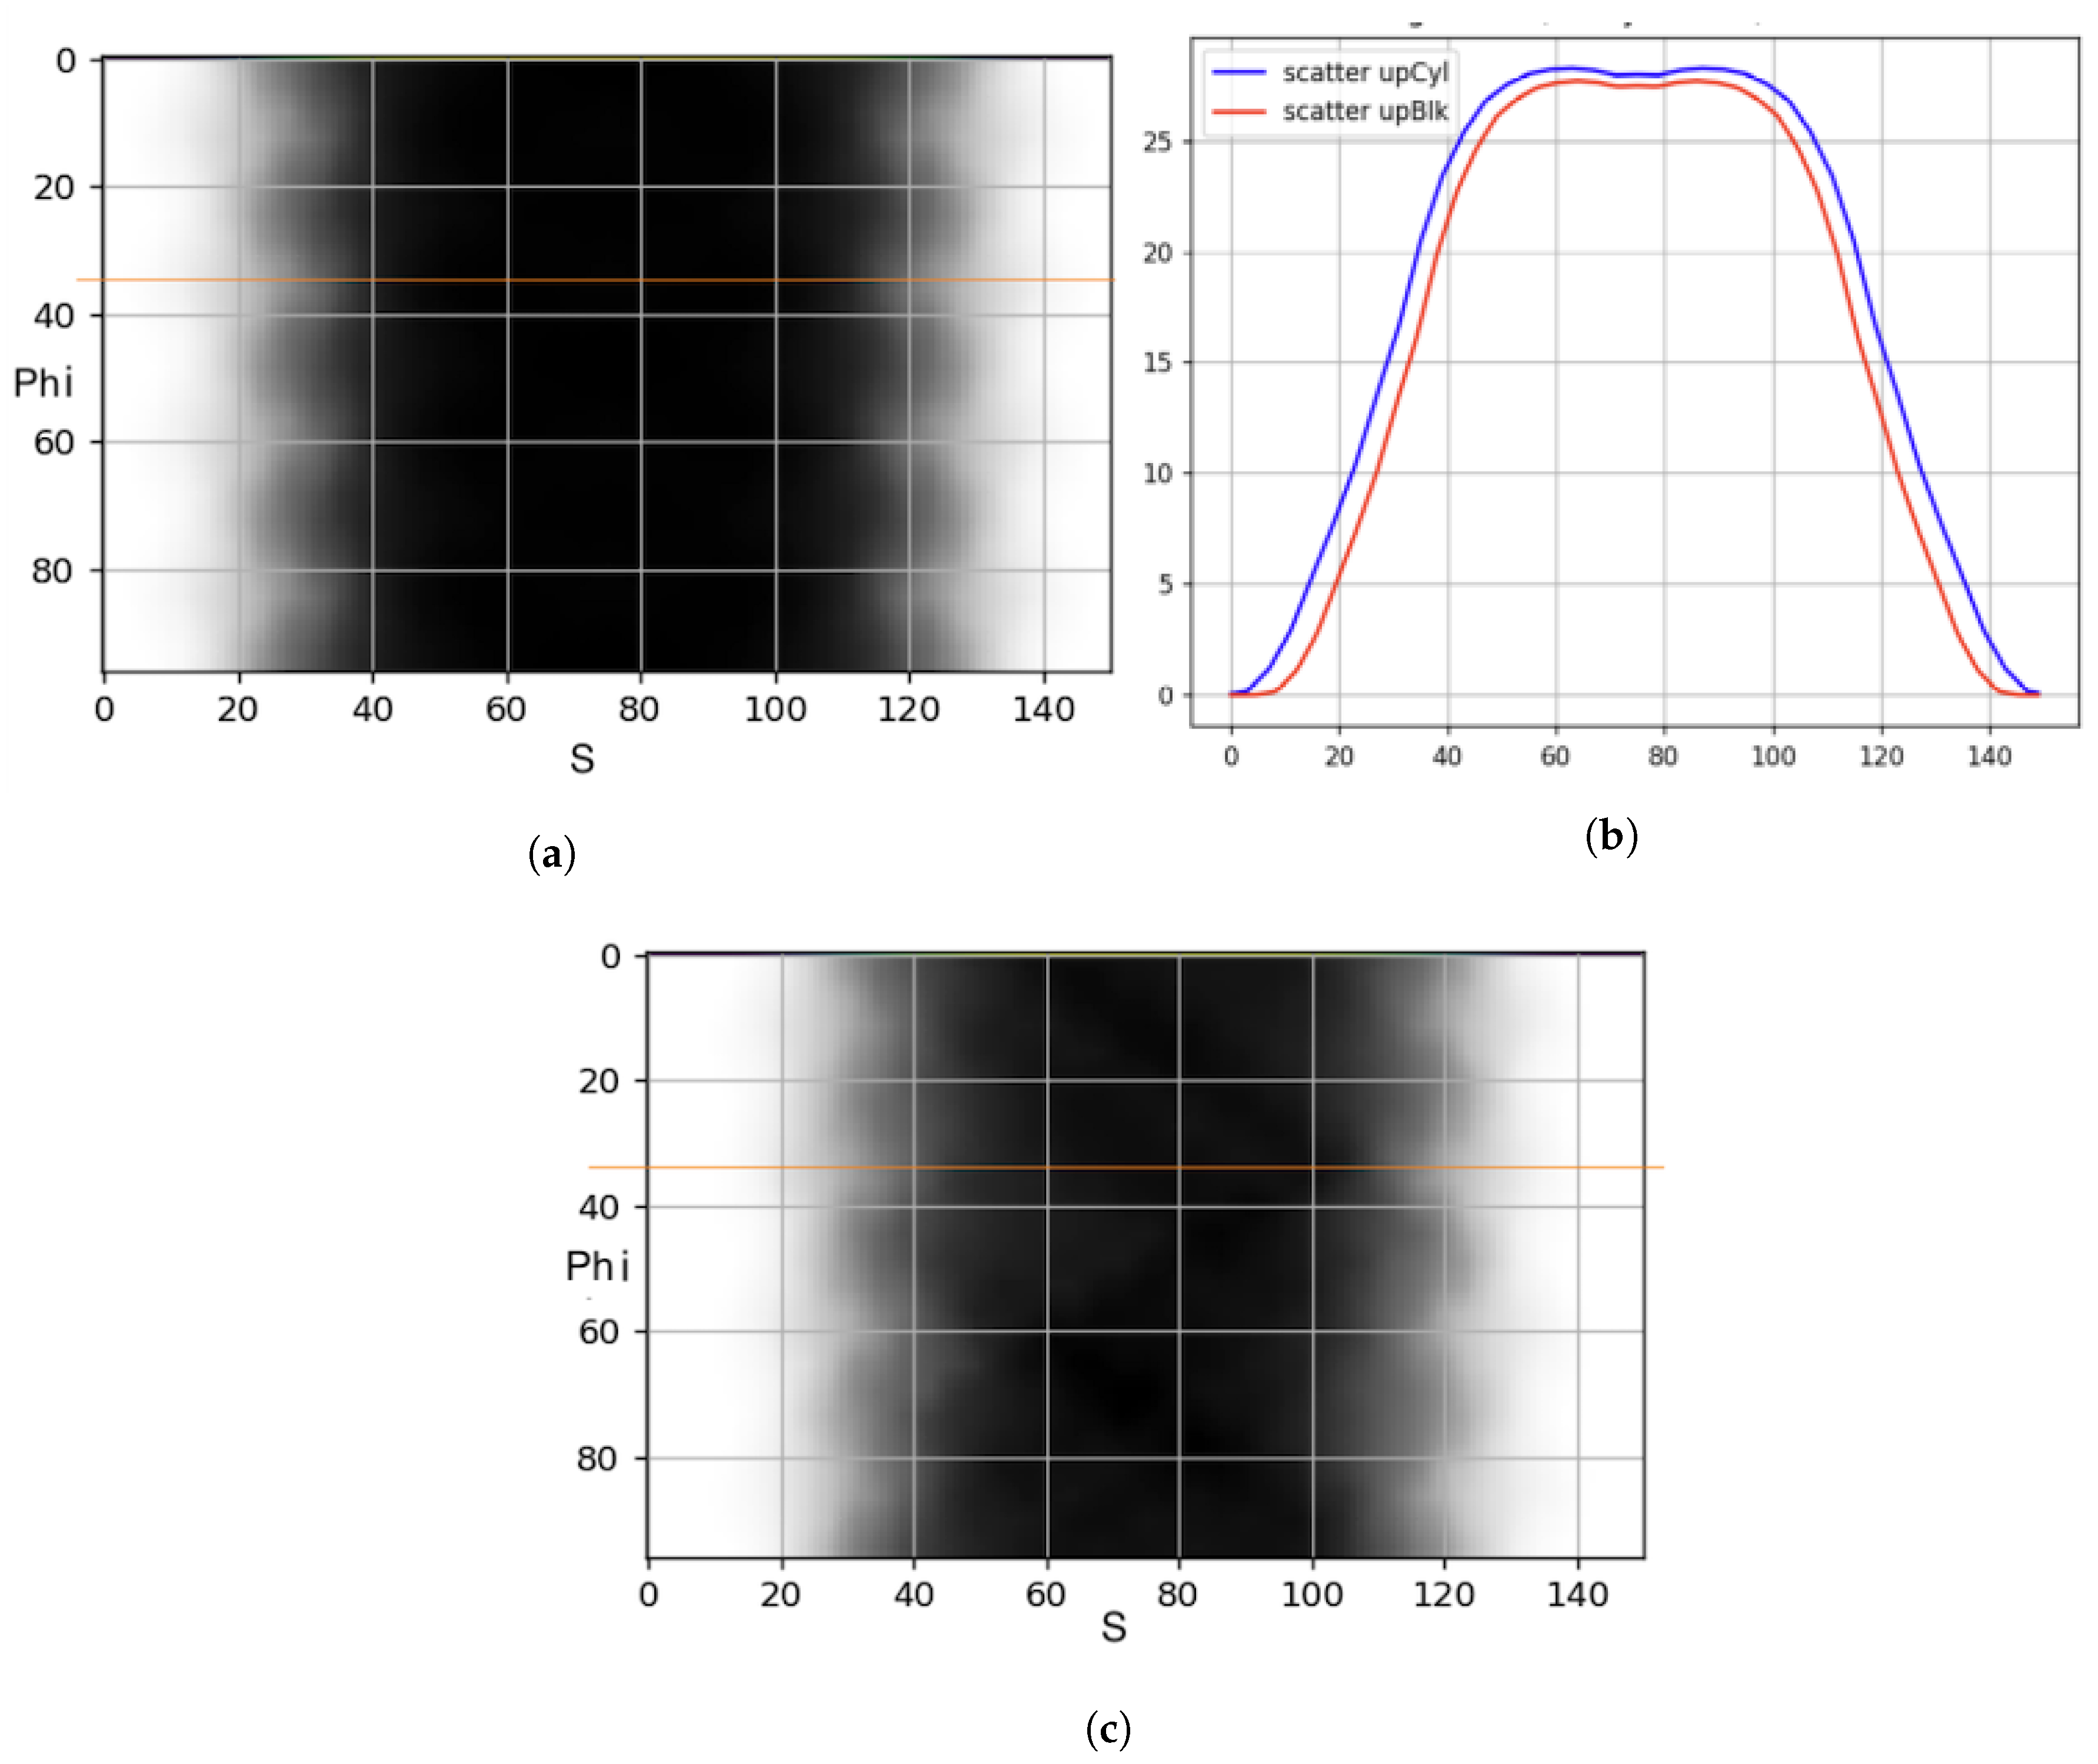
3.3. Up-Sampling of Single Scatter Simulation
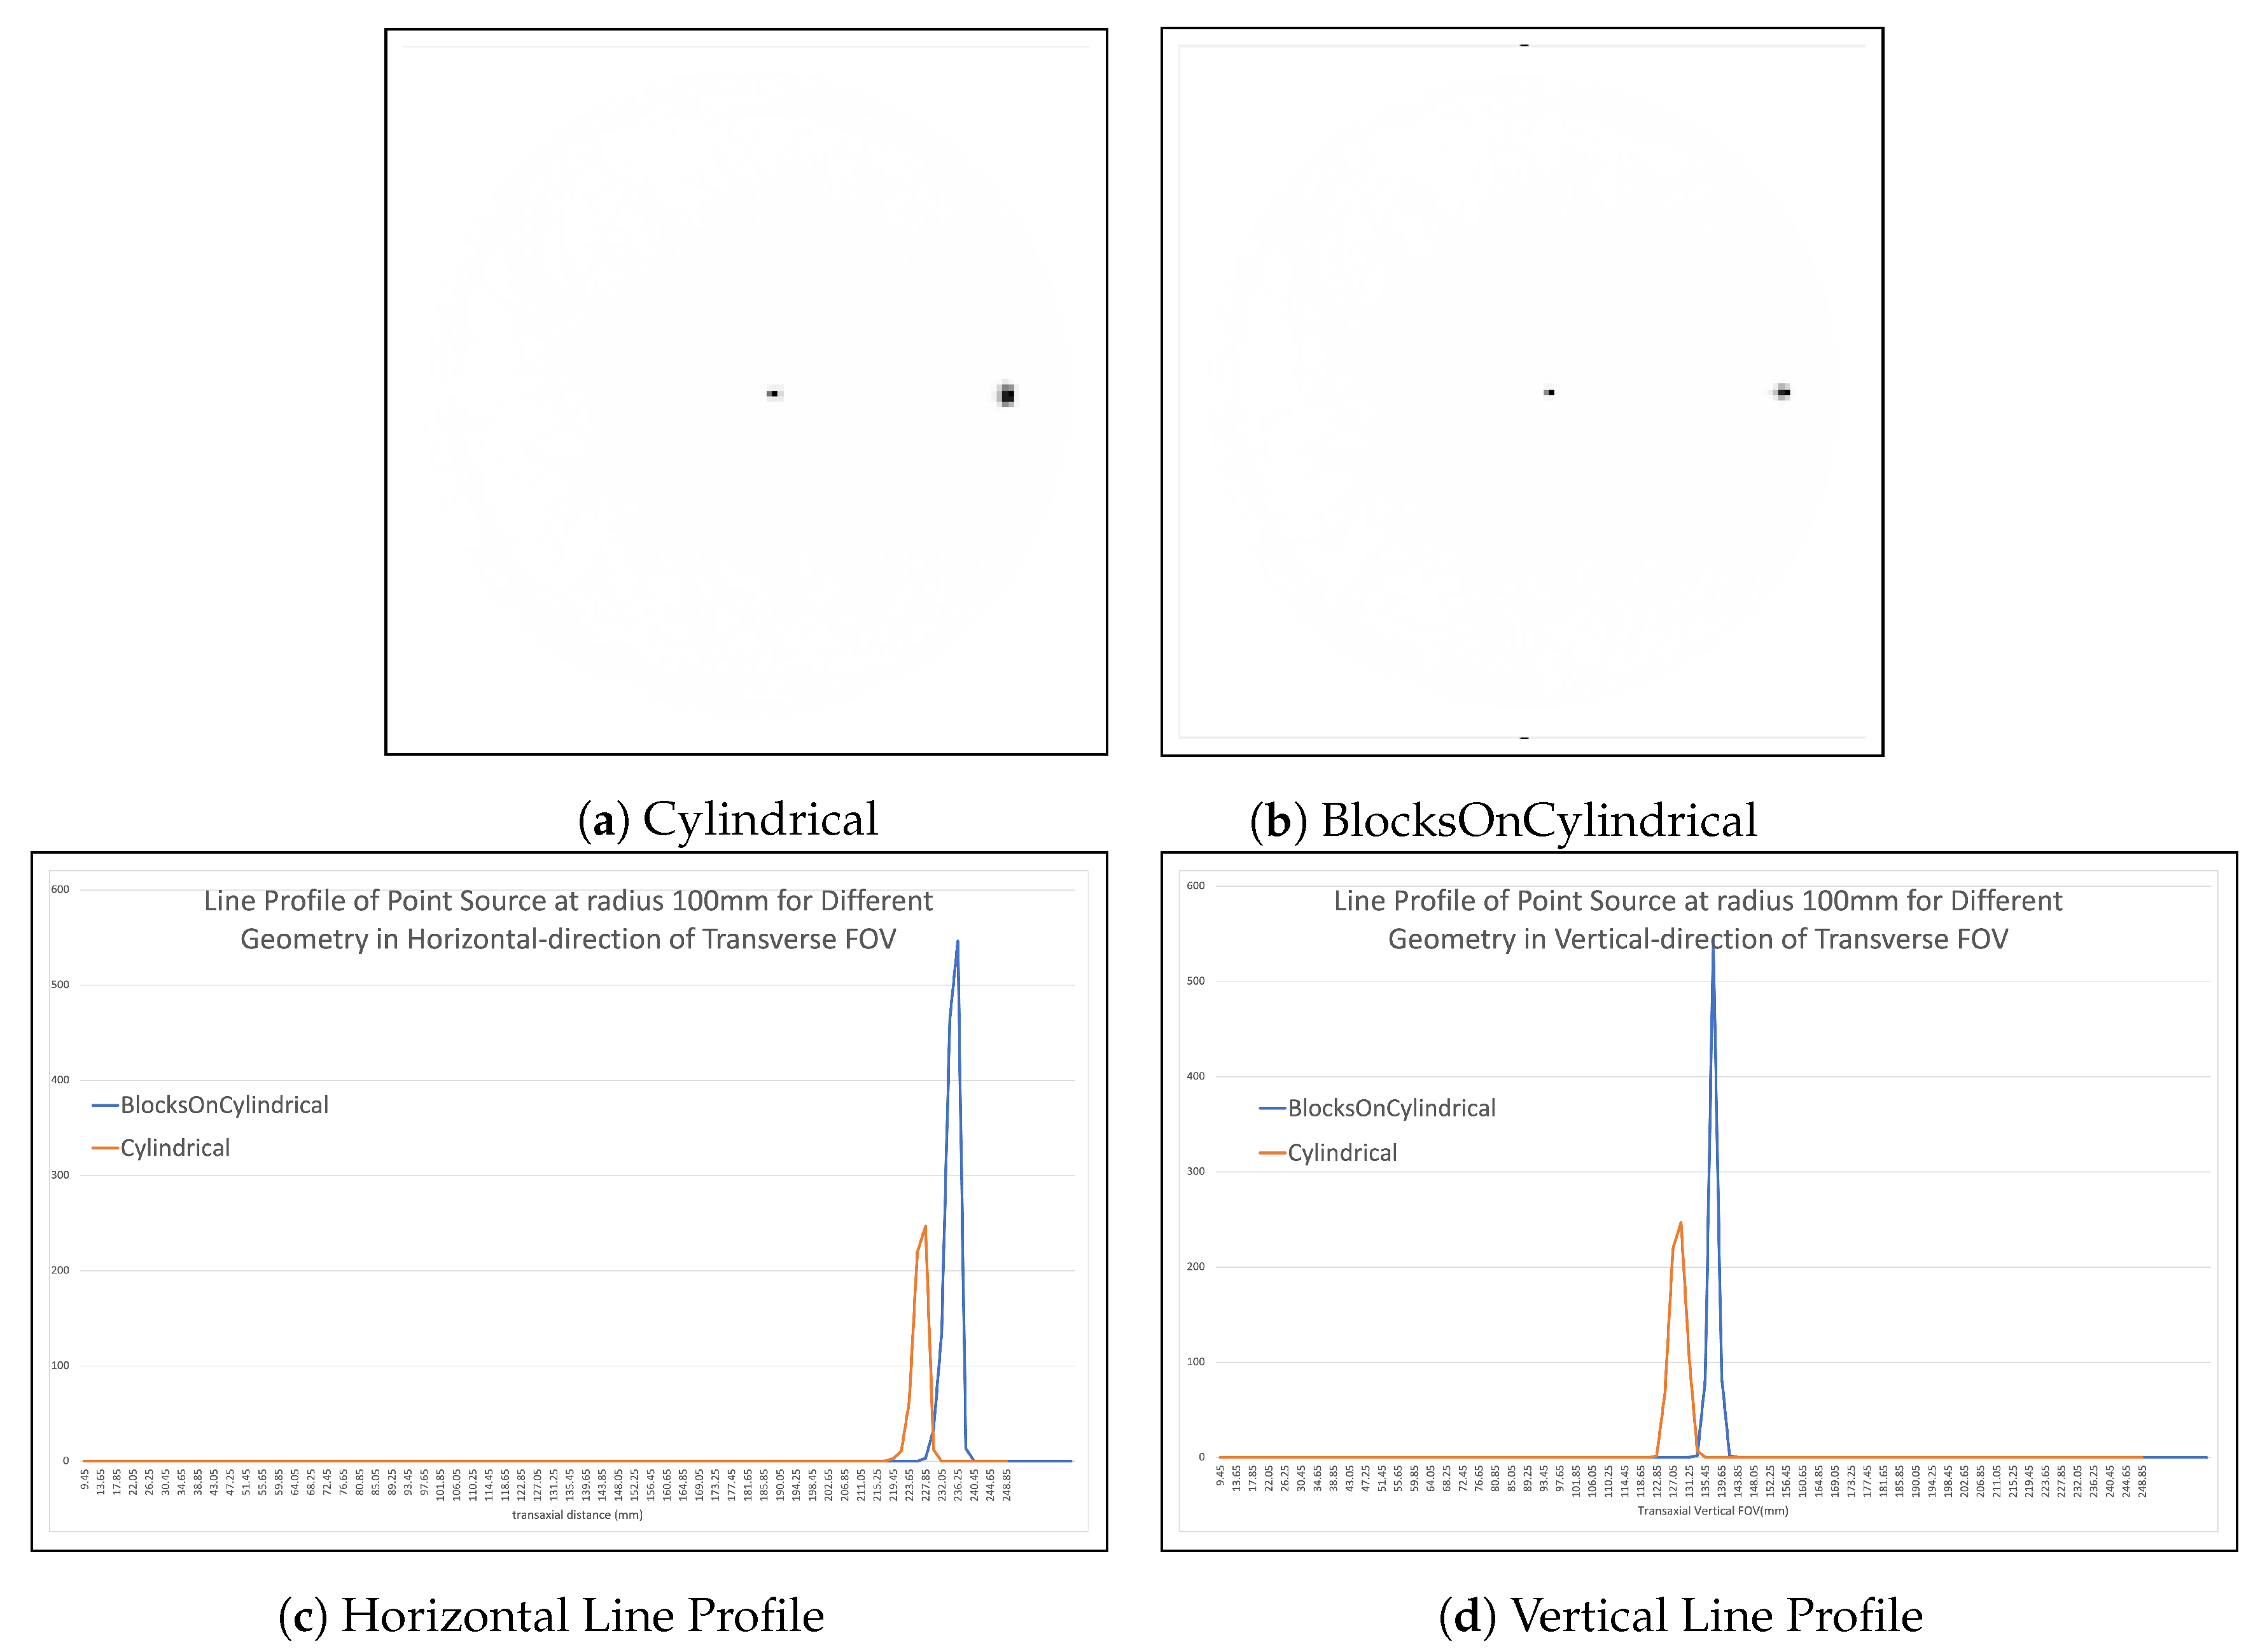
3.4. Spatial Resolution
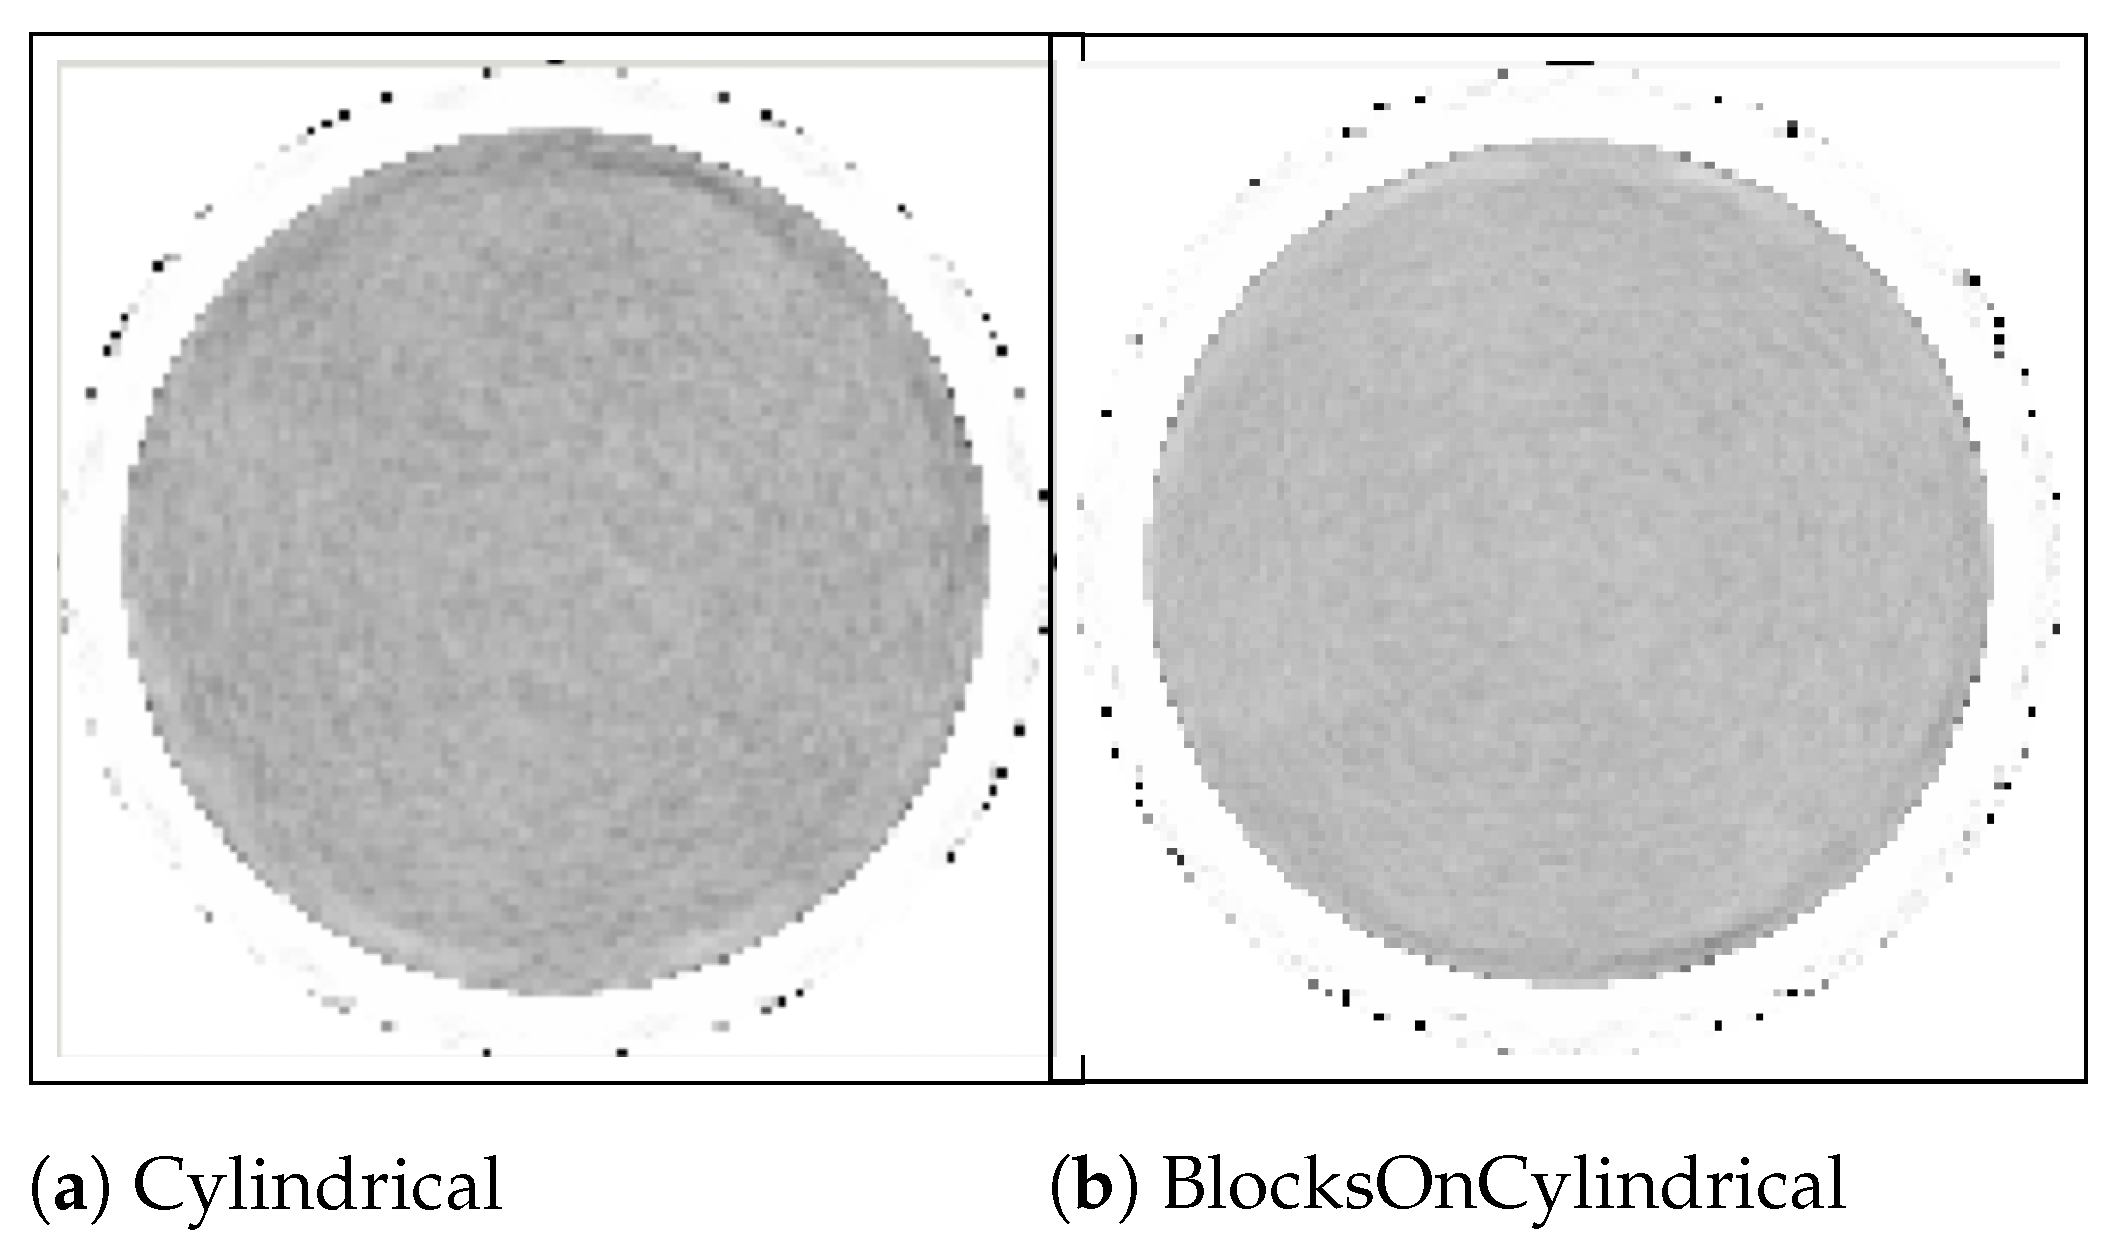
3.5. Uniformity Measurements
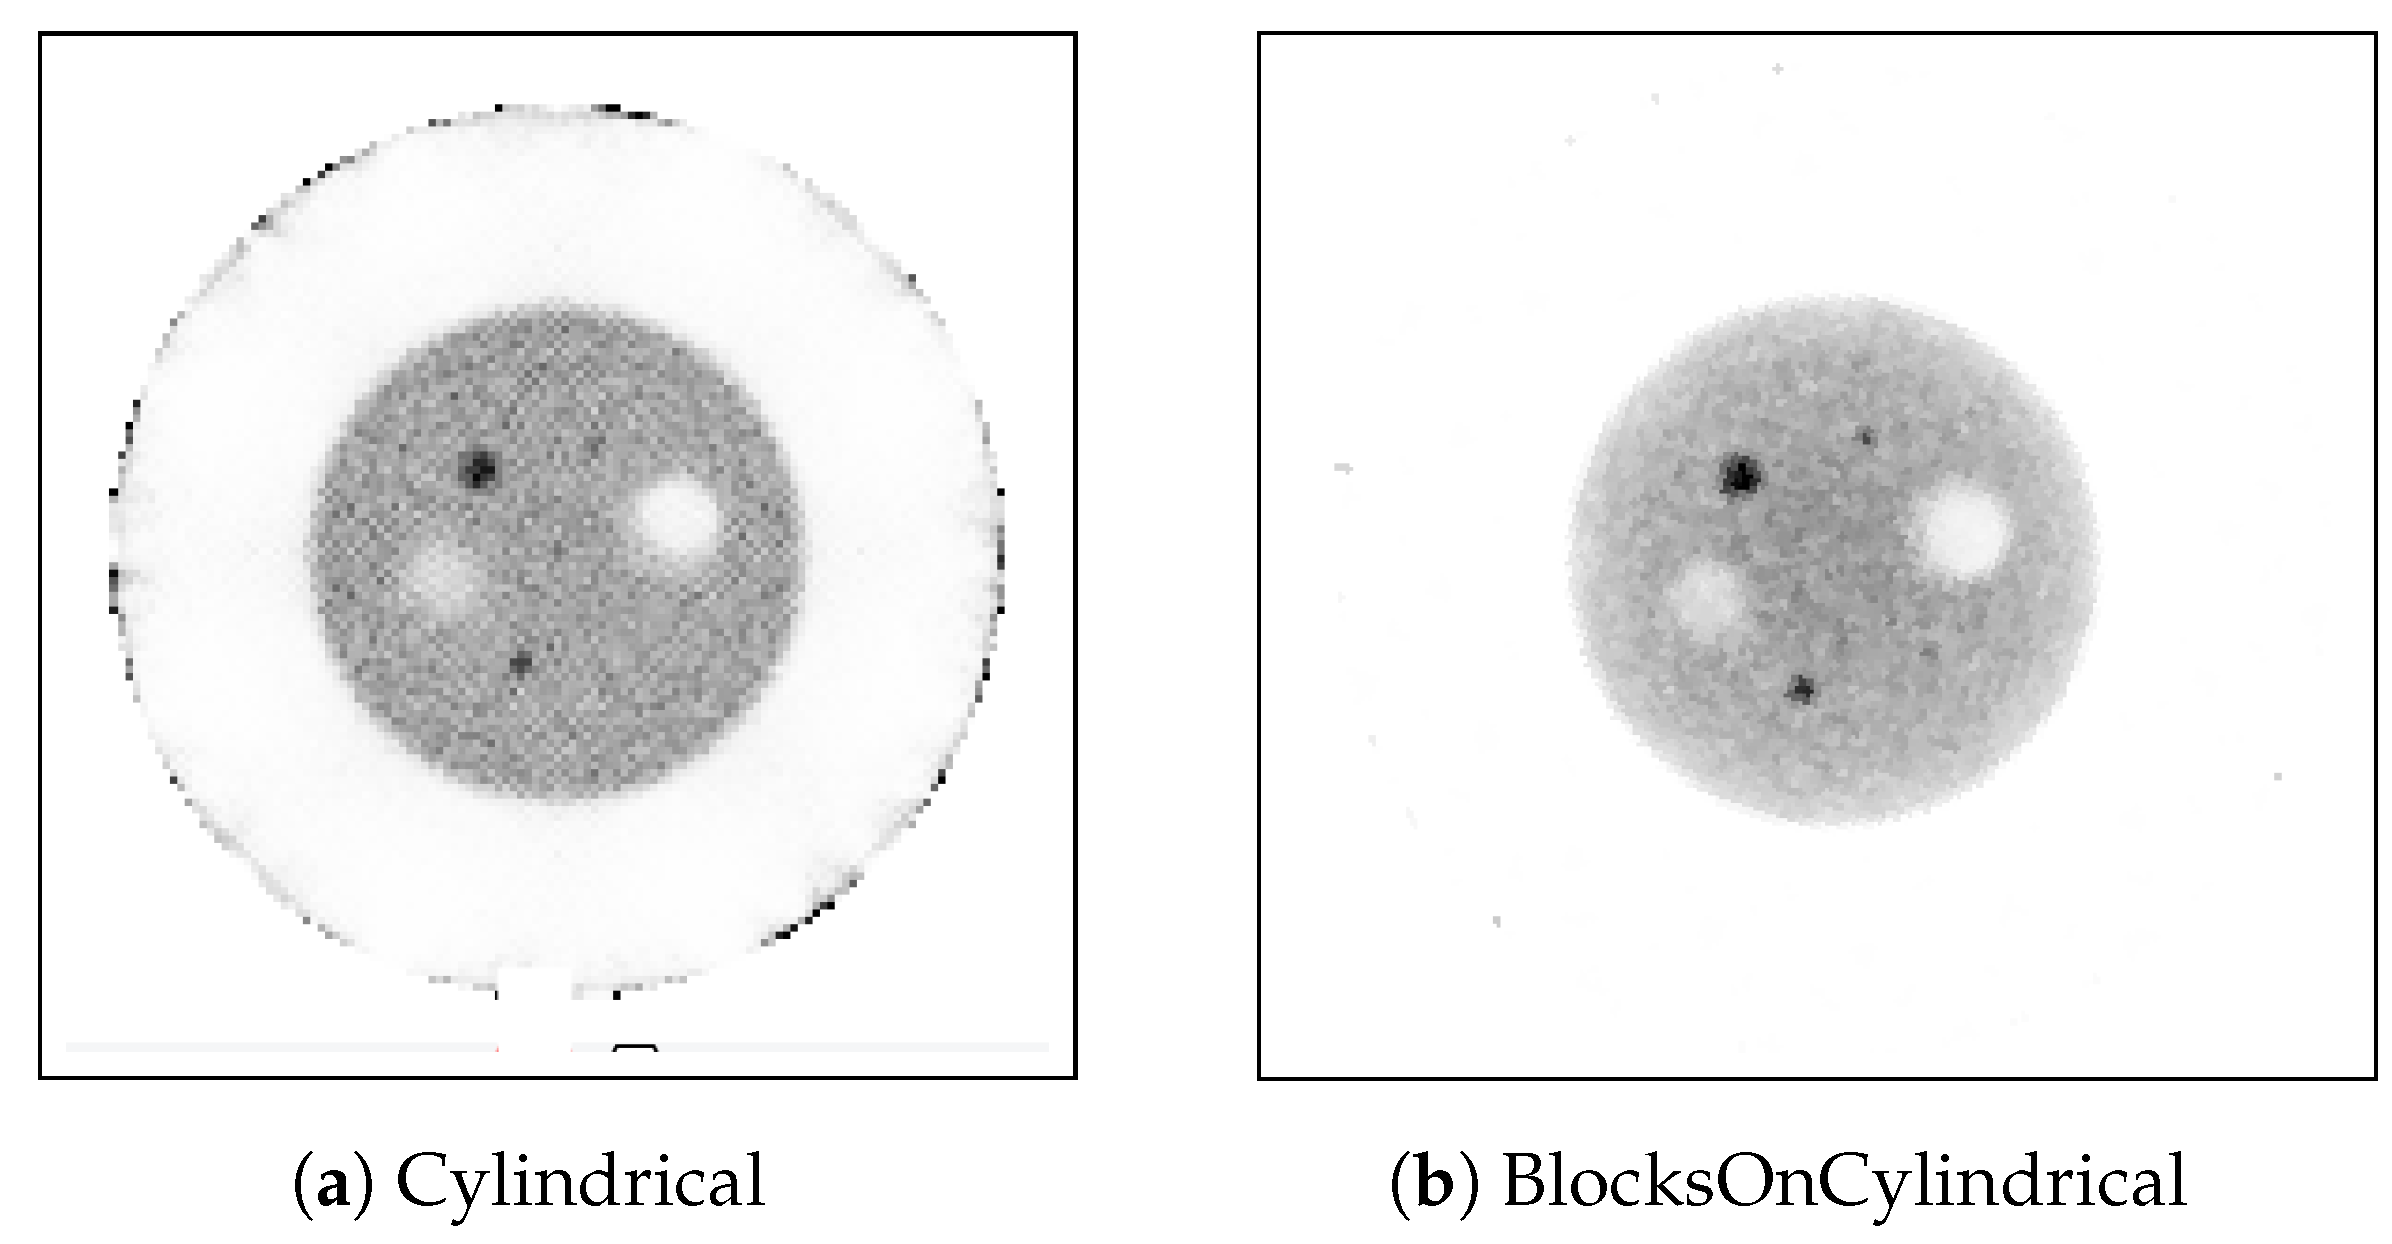
3.6. Contrast Measurements
3.7. Outlook
4. Conclusions
Author Contributions
Funding
Data Availability Statement
Acknowledgments
Conflicts of Interest
References
- Catana, C. Development of Dedicated Brain PET Imaging Devices: Recent Advances and Future Perspectives. J. Nucl. Med. 2019, 60, 1044–1052. [Google Scholar] [CrossRef] [PubMed]
- Rahmim, A.; Tang, J.; Lodge, M.A.; Lashkari, S.; Ay, M.R.; Lautamäki, R.; Tsui, B.M.W.; Bengel, F.M. Analytic System Matrix Resolution Modeling in PET: An Application to Rb-82 Cardiac Imaging. Phys. Med. Biol. 2008, 53, 5947–5965. [Google Scholar] [CrossRef] [PubMed]
- Scheins, J.J.; Herzog, H.; Shah, N.J. “Fully-3D PET Image Reconstruction Using Scanner-Independent, Adaptive Projection Data and Highly Rotation-Symmetric Voxel Assemblies. IEEE Trans. Med. Imaging 2011, 30, 879–892. [Google Scholar] [CrossRef] [PubMed]
- Merlin, T.; Stute, S.; Benoit, D.; Bert, J.; Carlier, T.; Comtat, C.; Filipovic, M.; Lamare, F.; Visvikis, D. CASToR: A generic data organization and processing code framework for multi-modal and multi-dimensional tomographic reconstruction. Phys. Med. Biol. 2018, 63, 5505. [Google Scholar] [CrossRef] [PubMed] [Green Version]
- Thielemans, K.; Tsoumpas, C.; Mustafovic, S.; Beisel, T.; Aguiar, P.; Dikaios, N.; Jacobson, M.W. STIR: Software for Tomographic Image Reconstruction Release 2. Phys. Med. Biol. 2012, 57, 867–883. [Google Scholar] [CrossRef] [PubMed] [Green Version]
- Agostinelli, S.; Allison, J.; Amako, K.; Apostolakis, J.; Araujo, H.; Arce, P.; Asai, M.; Axen, D.; Banerjee, S.; Barrand, G.; et al. Geant4—A Simulation Toolkit. Nucl. Instrum. Methods Phys. Res. Sect. Accel. Spectromet. Detect. Assoc. Equip. 2003, 506, 250–303. [Google Scholar] [CrossRef] [Green Version]
- Iriarte, A.; Marabini, R.; Matej, S.; Sorzano, C.O.S.; Lewitt, R.M. System Models for PET Statistical Iterative Reconstruction: A Review. Comput. Med. Imaging Graph. 2016, 48, 30–48. [Google Scholar] [CrossRef] [PubMed]
- Siddon, R.L. Fast Calculation of the Exact Radiological Path for a Three-Dimensional CT Array. Med. Phys. 1985, 12, 252–255. [Google Scholar] [CrossRef] [PubMed]
- Khateri, P.; Fischer, J.; Lustermann, W.; Tsoumpas, C.; Dissertori, G. Implementation of Cylindrical PET Scanners with Block Detector Geometry in STIR. EJNMMI Phys. 2019, 6, 15. [Google Scholar] [CrossRef] [PubMed] [Green Version]
- Ahnen, M.L.; Fischer, J.; Kuegler, N.; Mikhaylova, E.; Becker, R.; Lustermann, W.; Soerensen, J.; Buck, A.; Weber, B.; Sabri, O.; et al. Performance of the ultra-compact fully integrated brain PET system BPET. In Proceedings of the 2020 IEEE Nuclear Science Symposium and Medical Imaging Conference (NSS/MIC), Boston, MA, USA, 31 October–7 November 2020. [Google Scholar]
- Moliner, L.; Rodríguez-Alvarez, M.J.; Catret, J.V.; González, A.; Ilisie, V.; Benlloch, J.M. NEMA Performance Evaluation of CareMiBrain dedicated brain PET and Comparison with the whole-body and dedicated brain PET systems. Sci. Rep. 2019, 9, 15484. [Google Scholar] [CrossRef] [PubMed] [Green Version]
- NEMA Standards Publication NU 2-2012; Performance Measurements of Positron Emission Tomographs: Rosslyn. National Electrical Manufacturers Association: Arlington, VA, USA, 2013.
- Jan, S.; Santin, G.; Strul, D.; Staelens, S.; Assié, K.; Autret, D.; Avner, S.; Barbier, R.; Bardies, M.; Bloomfield, P.M.; et al. GATE: A simulation toolkit for PET and SPECT. Phys. Med. Biol. 2004, 49, 4543–4561. [Google Scholar] [CrossRef] [PubMed]
- Niknejad, T.; Tavernier, S.; Varela, J.; Thielemans, K. Validation of 3D Model-Based Maximum-Likelihood Estimation of Normalisation Factors for Partial Ring Positron Emission Tomography. In Proceedings of the 2016 IEEE Nuclear Science Symposium, Medical Imaging Conference and Room-Temperature Semiconductor Detector Workshop (NSS/MIC/RTSD), Strasbourg, France, 29 October–6 November 2016. [Google Scholar]
- Meikle, S.R.; Badawi, R.D. Quantitative Techniques in PET. In Positron Emission Tomography: Basic Sciences; Bailey, D.L., Townsend, D.W., Valk, P.E., Maisey, M.N., Eds.; Springer: London, UK, 2005; pp. 99–126. [Google Scholar] [CrossRef]
- Tsoumpas, C.; Aguiar, P.; Nikita, K.S.; Ros, D.; Thielemans, K. Evaluation of the Single Scatter Simulation Algorithm Implemented in the STIR Library. In Proceedings of the IEEE Symposium Conference Record Nuclear Science 2004, Rome, Italy, 16–22 October 2004; Volume 6, pp. 3361–3365. [Google Scholar]
- Thielemans, K.; Manjeshwar, R.M.; Tsoumpas, C.; Jansen, F.P. A New Algorithm for Scaling of PET Scatter Estimates Using All Coincidence Events. In Proceedings of the 2007 IEEE Nuclear Science Symposium Conference Record, Honolulu, HI, USA, 26 October–3 November 2007; Volume 5, pp. 3586–3590. [Google Scholar] [CrossRef]


| Source Location | Cylindrical | BlocksOnCylindrical | ||||
|---|---|---|---|---|---|---|
| in mm | FWHM | FWHM | FWHM | FWHM | FWHM | FWHM |
| X | Y | Z | X | Y | Z | |
| (mm) | (mm) | (mm) | (mm) | (mm) | (mm) | |
| a: 0, t: 10 mm | 2.21 | 2.24 | 3.43 | 2.15 | 2.18 | 2.96 |
| a: 0, t: 100 mm | 2.22 | 5.10 | 4.26 | 2.14 | 2.48 | 4.18 |
| Measurement | Cylindrical | BlocksOnCylindrical |
|---|---|---|
| Mean | 1.75 | 1.78 |
| SD | 0.26 | 0.23 |
| COV | 0.15 | 0.13 |
| Rod | Cylindrical | BlocksOnCylindrical | ||
|---|---|---|---|---|
| Diameter, mm | Contrast, % | Background Variability, % | Contrast, % | Background Variability, % |
| 20 a | 78 | 4.9 | 75 | 4.8 |
| 15 a | 52 | 2.2 | 71 | 2.2 |
| 12 b | 35 | 2.2 | 54 | 2.2 |
| 9 b | 24 | 2.2 | 28 | 2.2 |
| 6 b | 13 | 2.2 | 16 | 2.2 |
Publisher’s Note: MDPI stays neutral with regard to jurisdictional claims in published maps and institutional affiliations. |
© 2022 by the authors. Licensee MDPI, Basel, Switzerland. This article is an open access article distributed under the terms and conditions of the Creative Commons Attribution (CC BY) license (https://creativecommons.org/licenses/by/4.0/).
Share and Cite
Dao, V.; Mikhaylova, E.; Ahnen, M.L.; Fischer, J.; Thielemans, K.; Tsoumpas, C. Evaluation of STIR Library Adapted for PET Scanners with Non-Cylindrical Geometry. J. Imaging 2022, 8, 172. https://doi.org/10.3390/jimaging8060172
Dao V, Mikhaylova E, Ahnen ML, Fischer J, Thielemans K, Tsoumpas C. Evaluation of STIR Library Adapted for PET Scanners with Non-Cylindrical Geometry. Journal of Imaging. 2022; 8(6):172. https://doi.org/10.3390/jimaging8060172
Chicago/Turabian StyleDao, Viet, Ekaterina Mikhaylova, Max L. Ahnen, Jannis Fischer, Kris Thielemans, and Charalampos Tsoumpas. 2022. "Evaluation of STIR Library Adapted for PET Scanners with Non-Cylindrical Geometry" Journal of Imaging 8, no. 6: 172. https://doi.org/10.3390/jimaging8060172