
Effect of Virgin PP Substitution with Recycled Plastic Caps in the Manufacture of a Product for the Telephony Sector
 , , ,
, , ,
Abstract
:1. Introduction
2. Material and Methods
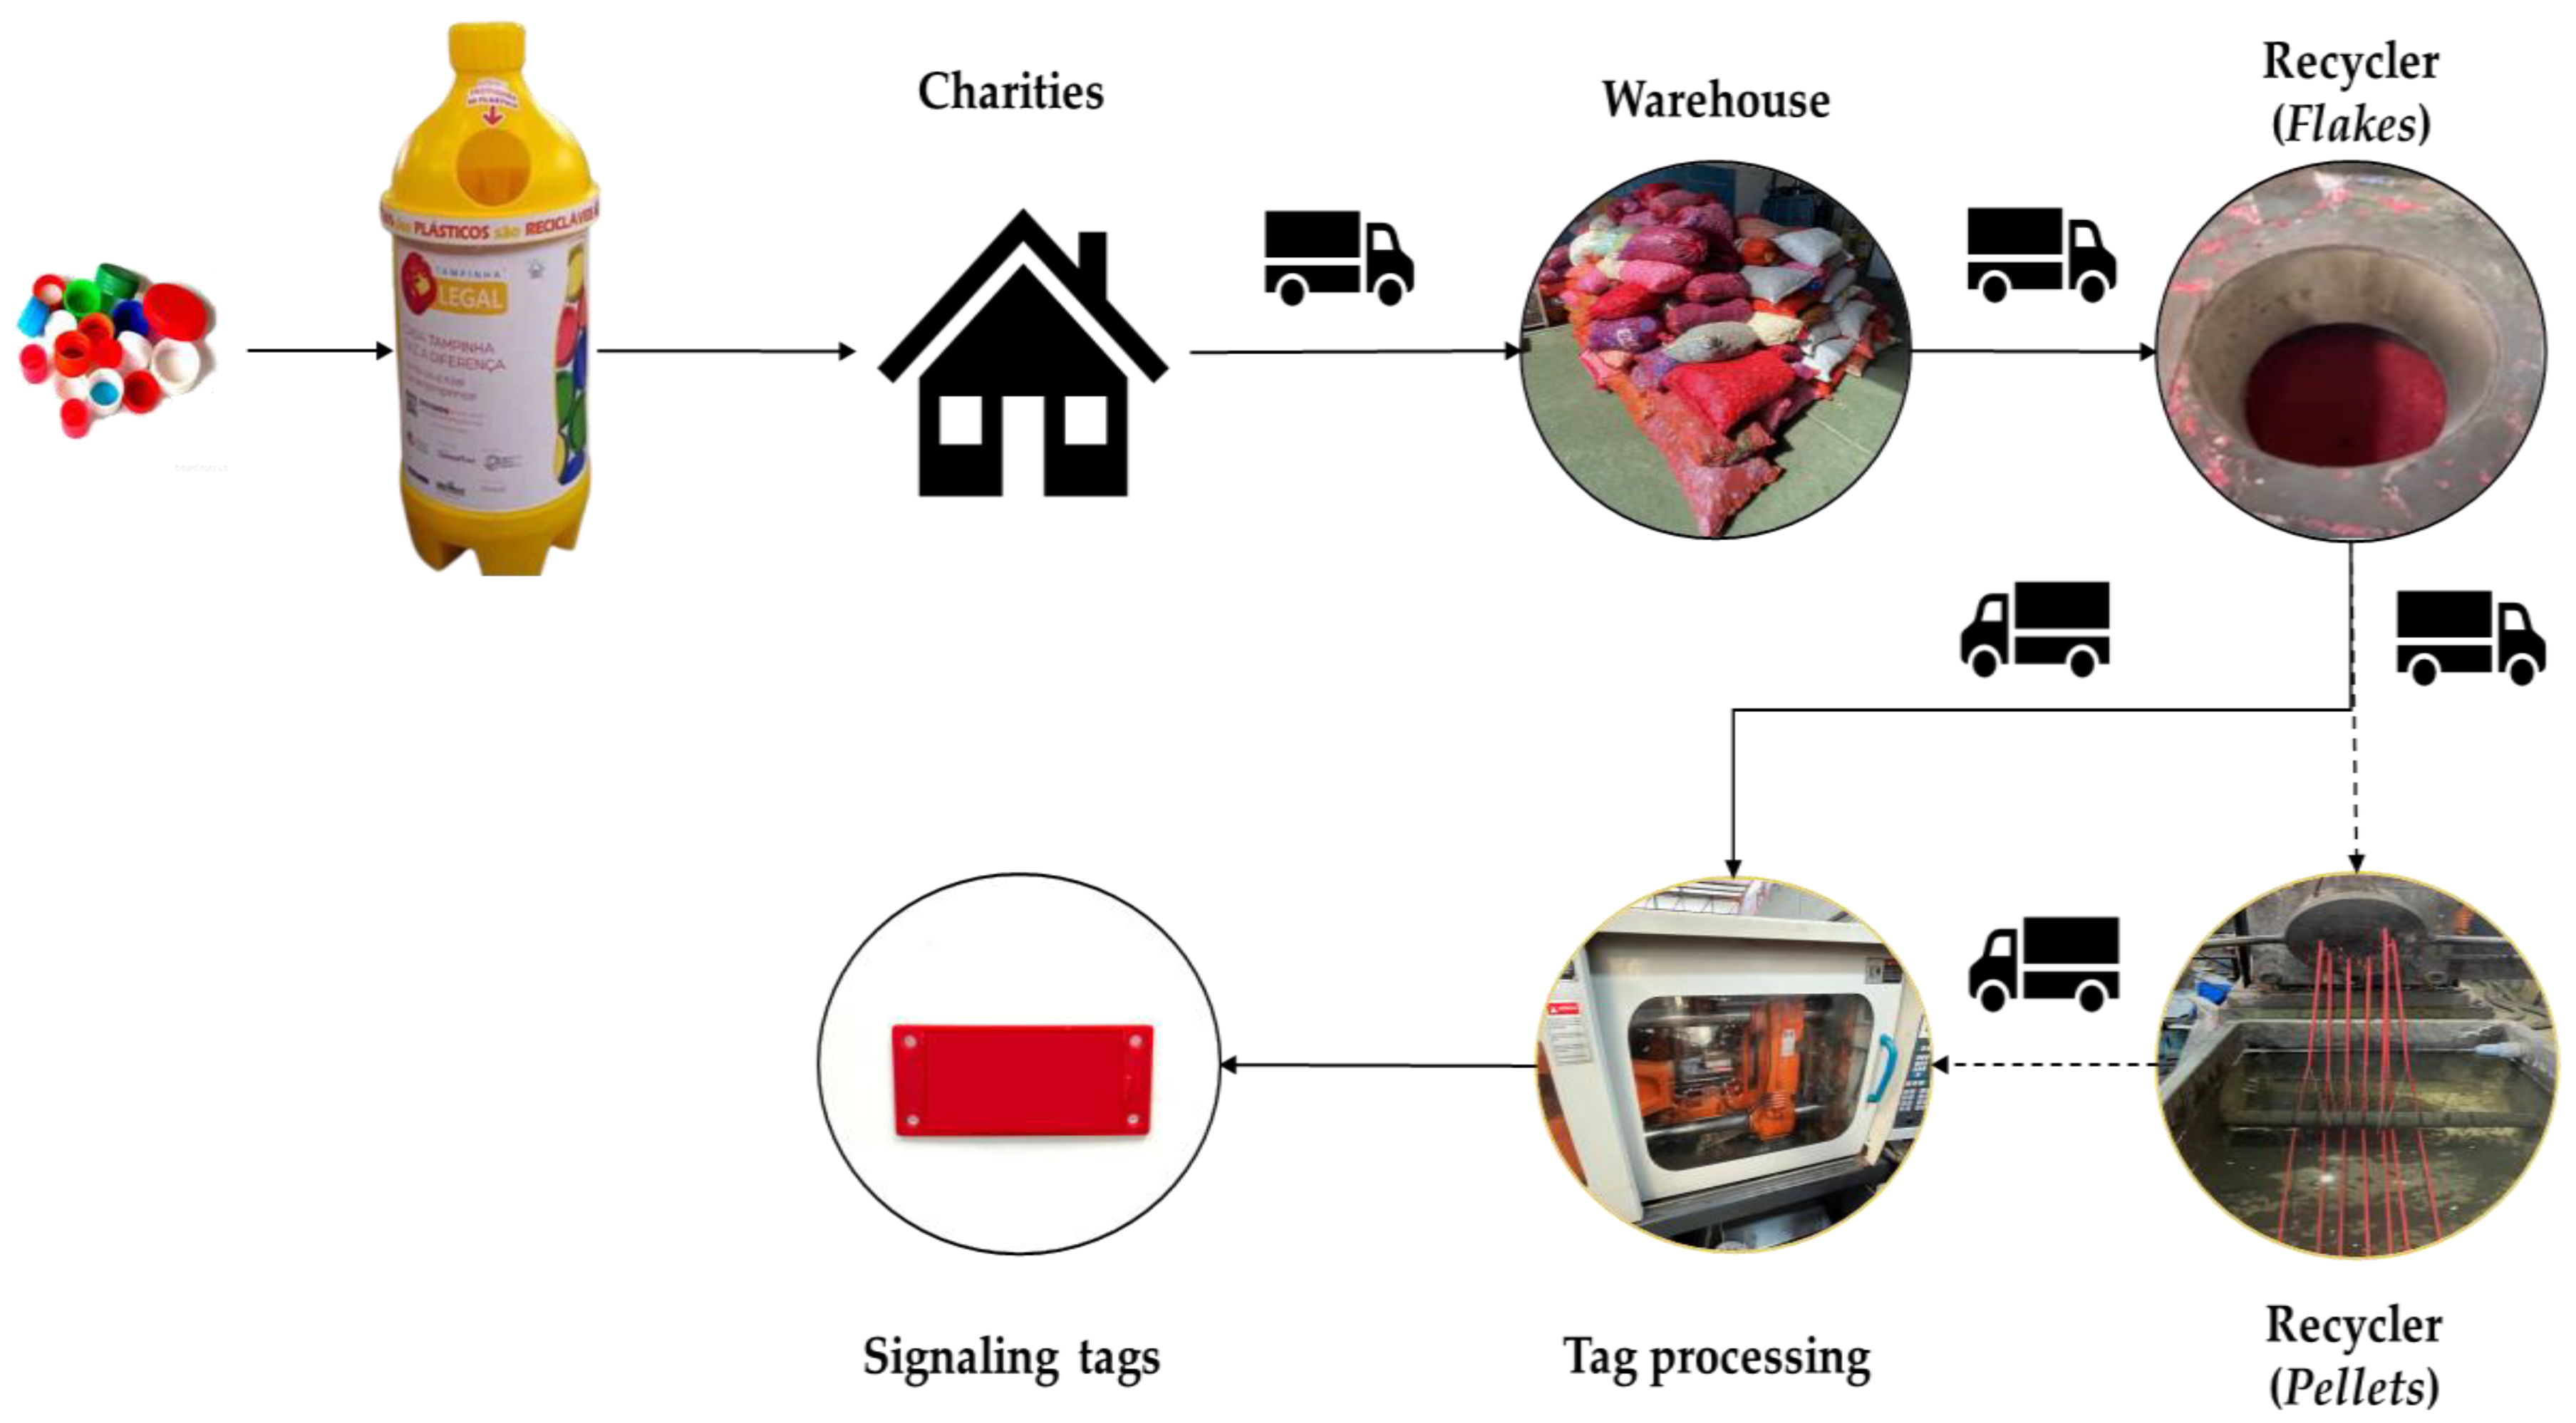
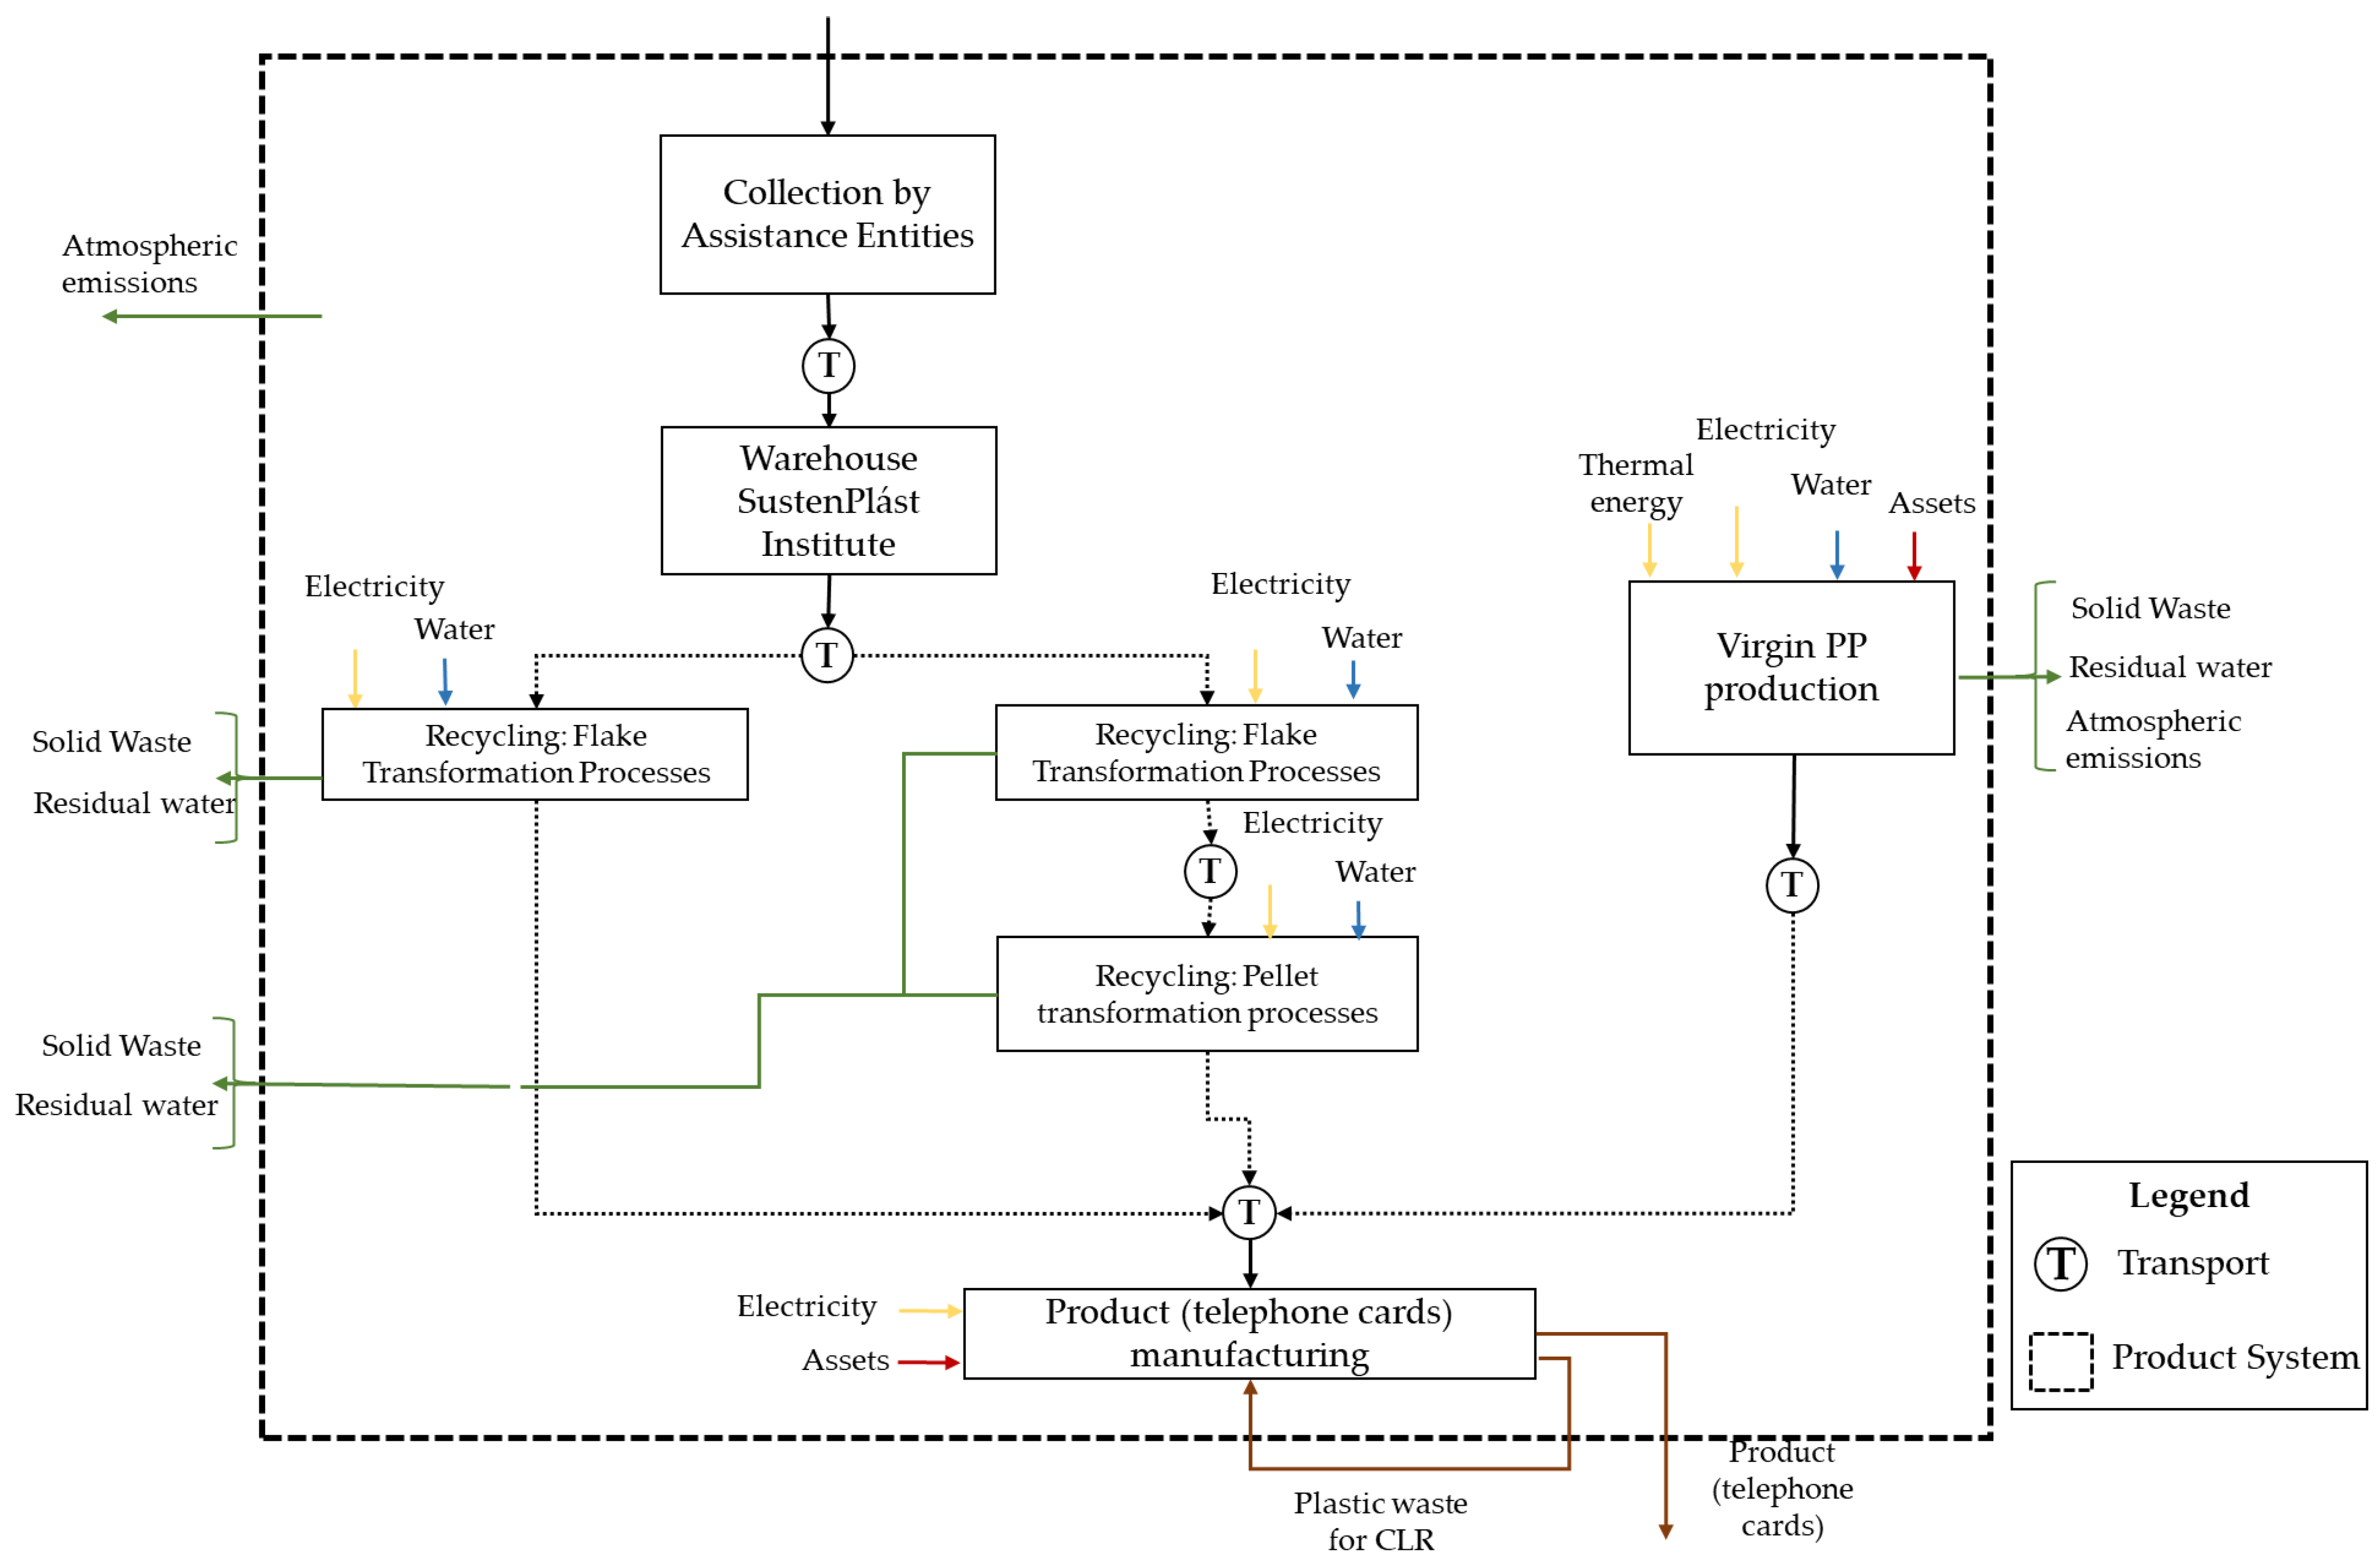
2.1. Specification of Production Routes and Characterization of Scenarios
2.2. Analysis Dimensions
2.2.1. Environmental Performance Based on LCA Diagnosis
2.2.2. Circularity Performance: MCI Index
2.2.3. Technical Performance
3. Results and Discussion
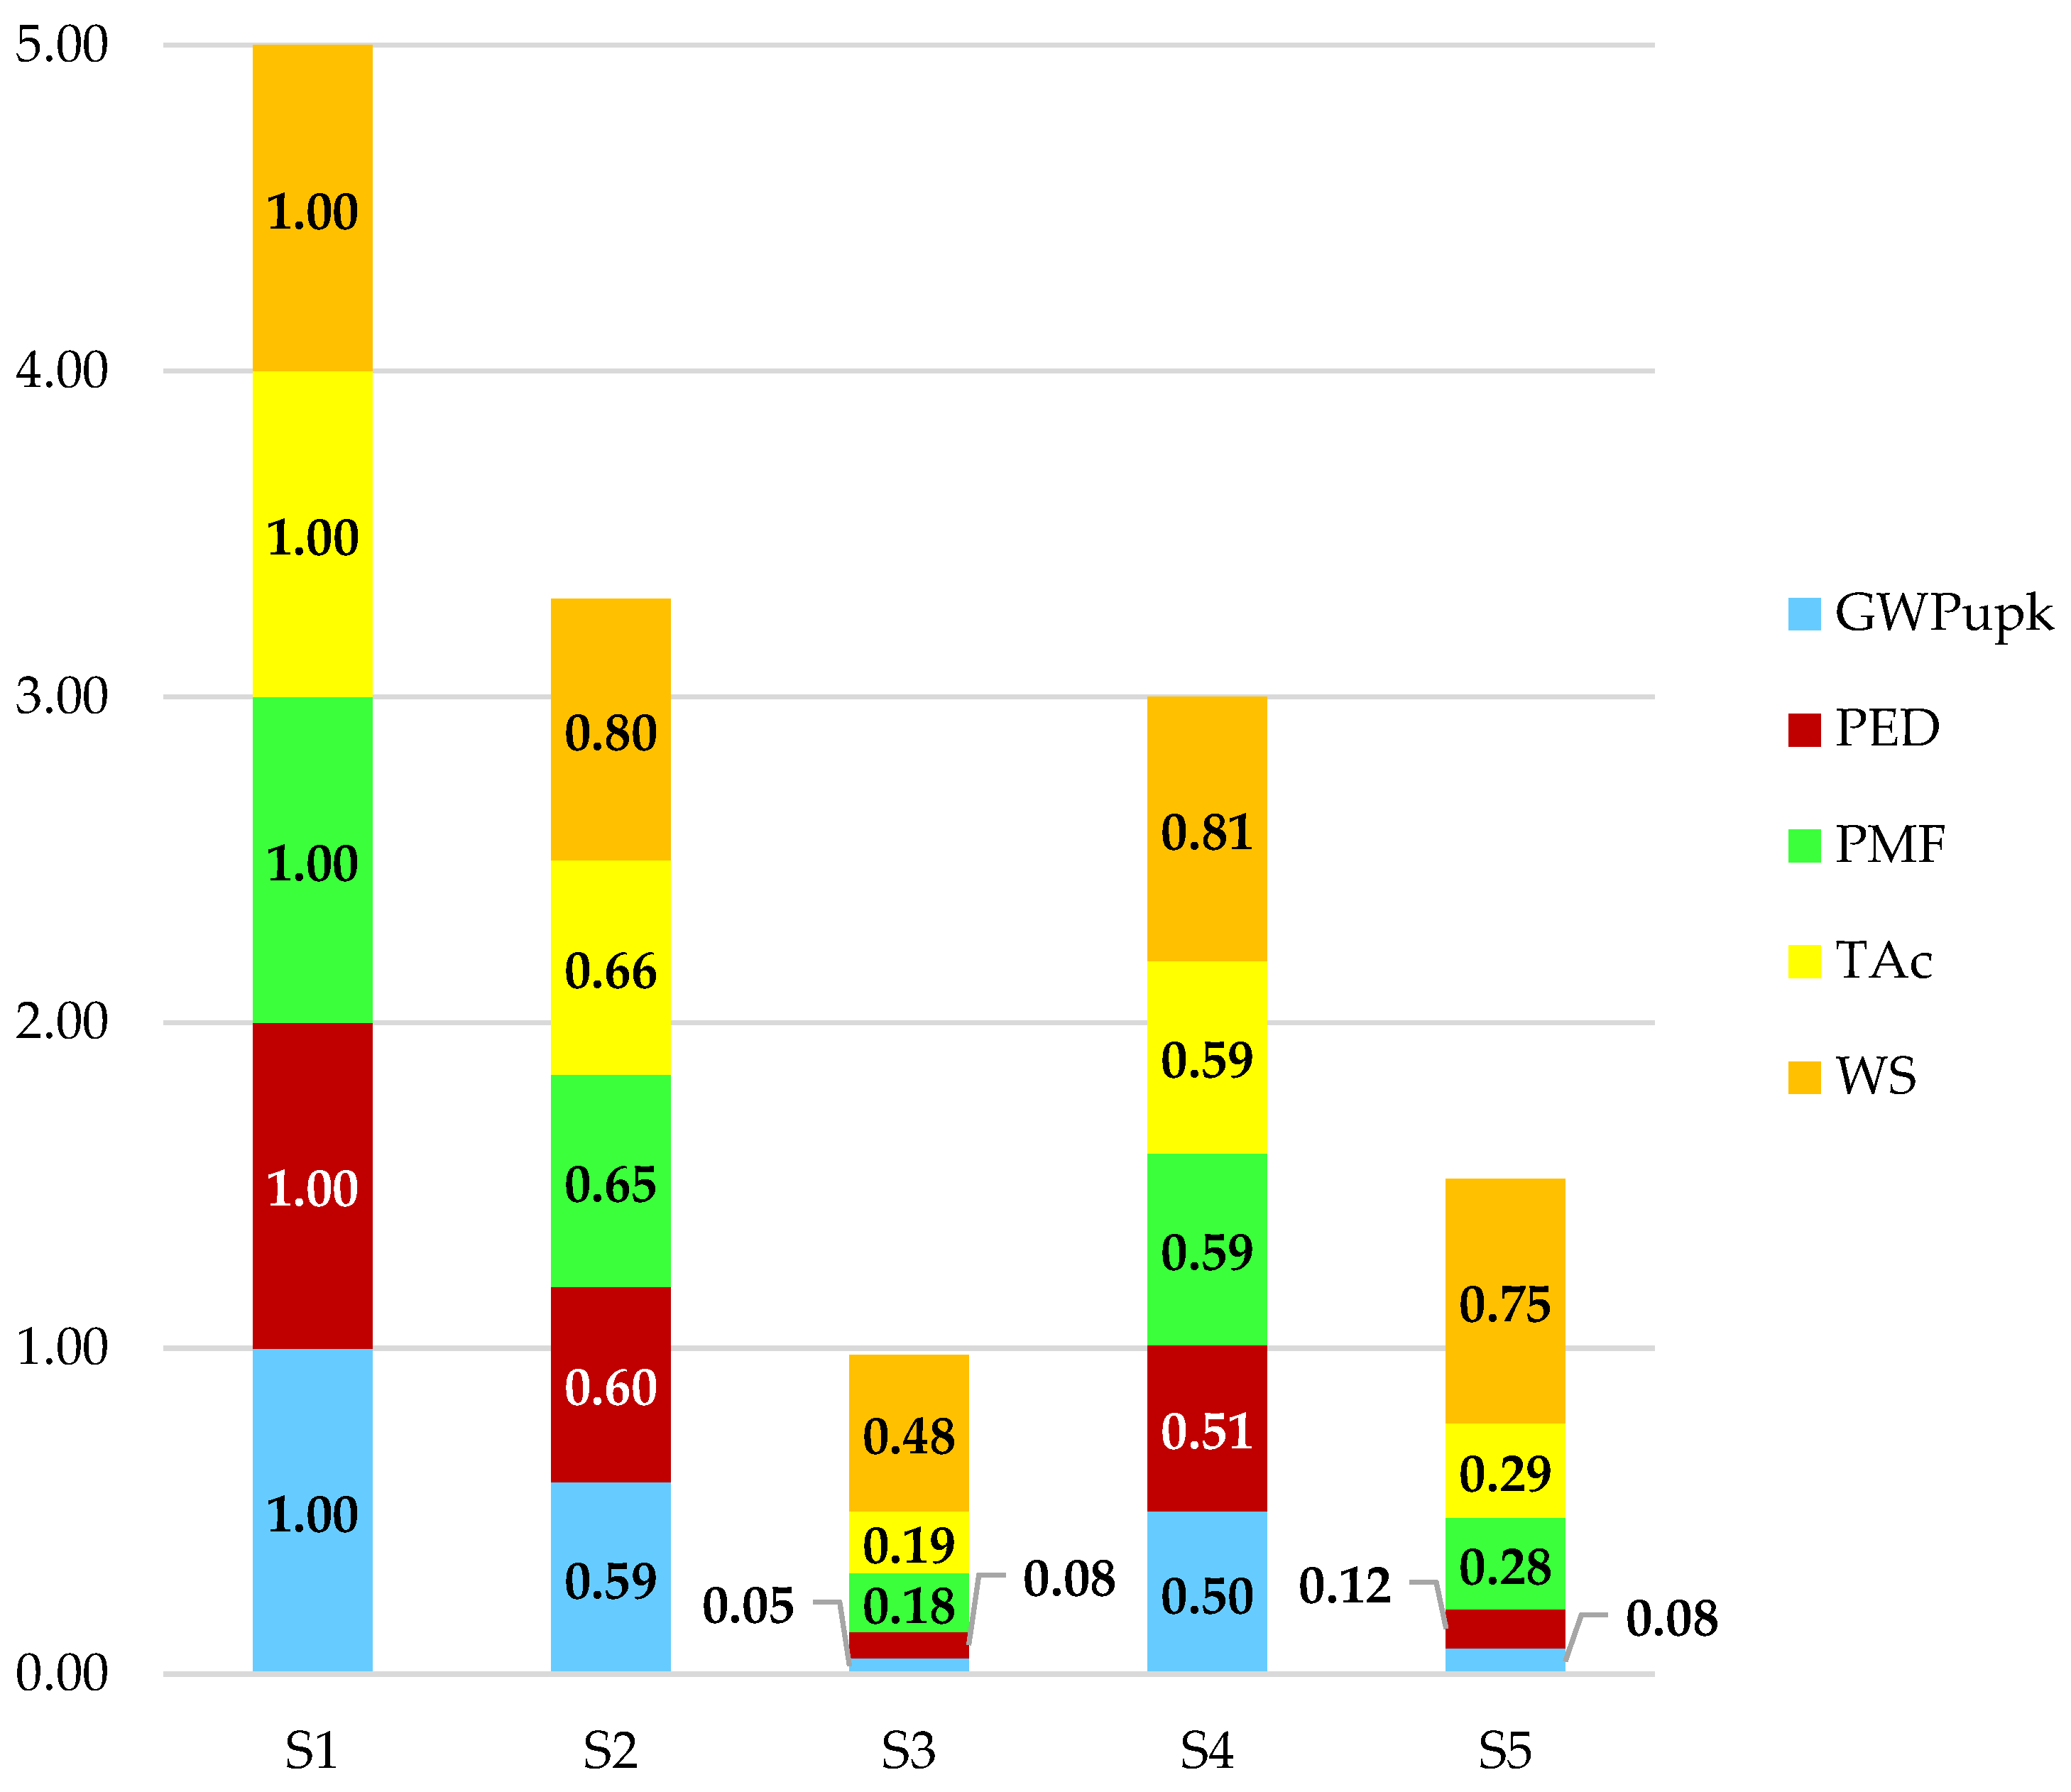
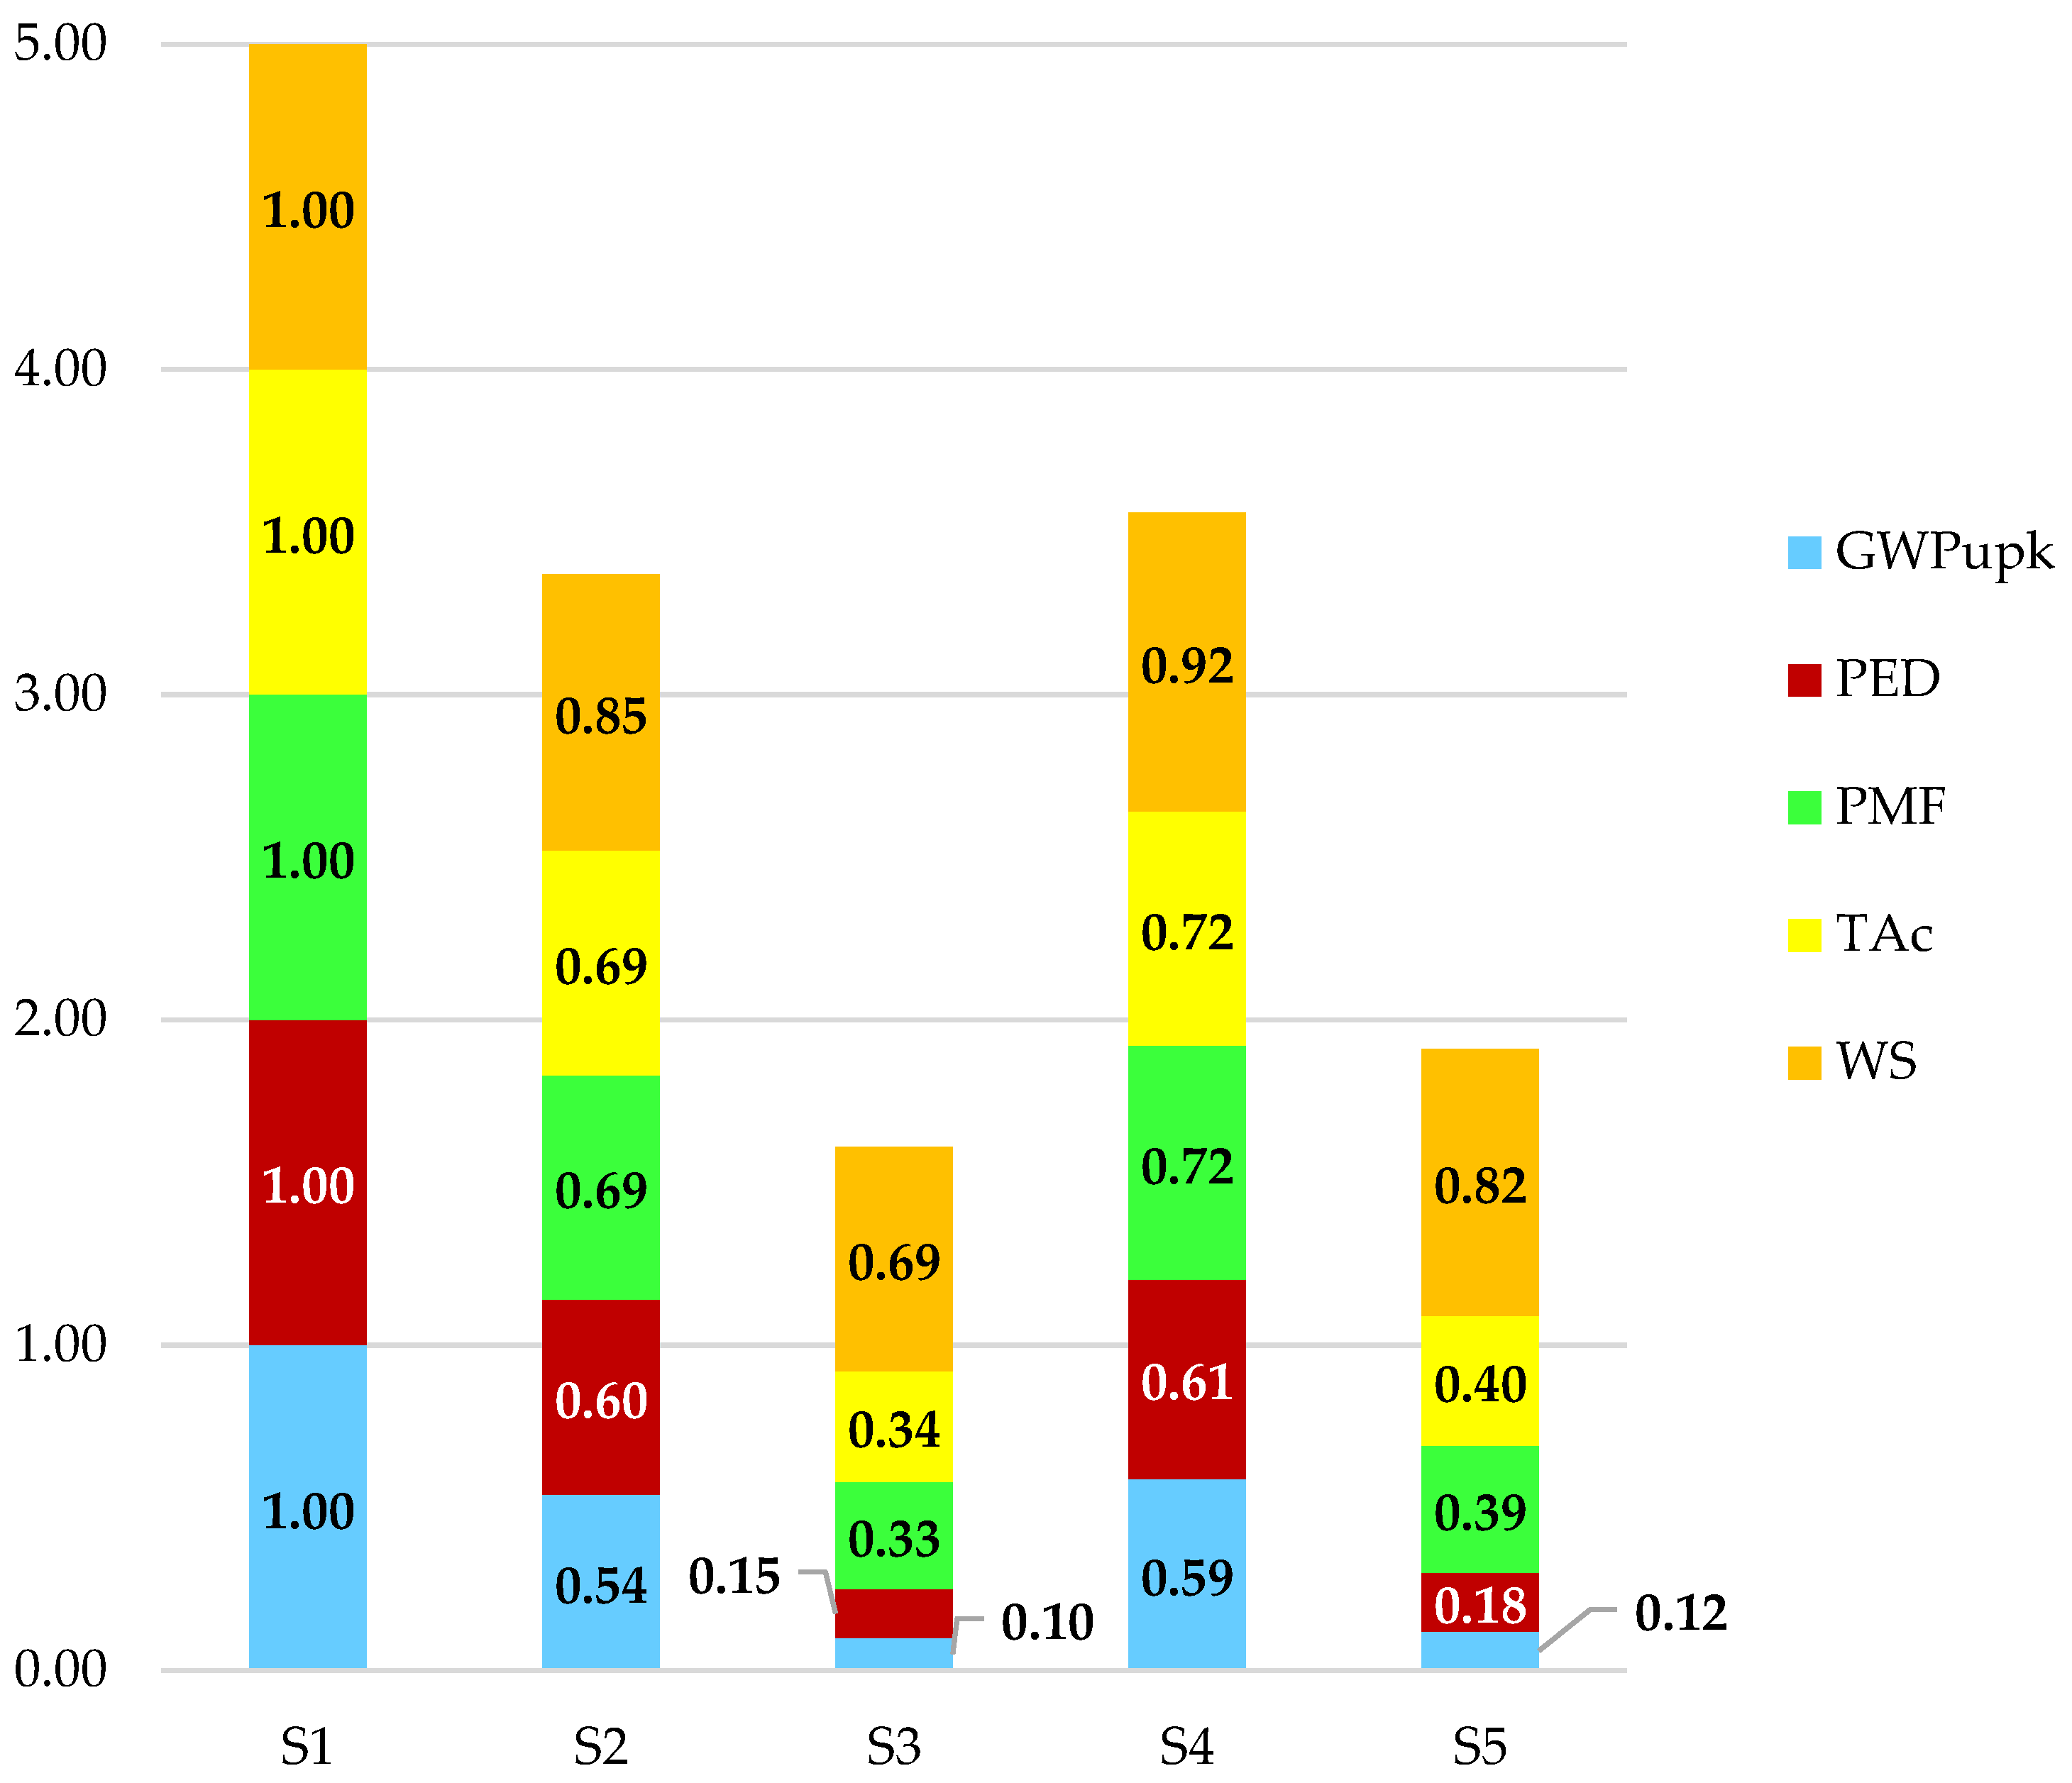
3.1. Environmental Performance
3.2. Circularity Performance
3.3. Technical Performance
3.4. Integration between Environmental (Based on Environmental Performance and Circularity) and Technical Dimensions
4. Conclusions
Author Contributions
Funding
Data Availability Statement
Acknowledgments
Conflicts of Interest
Appendix A

References
- Ilhan, I.; Turan, D.; Gibson, I.; ten Klooster, R. Understanding the factors affecting the seal integrity in heat sealed flexible food packages: A review. Package Technol. Sci. 2021, 34, 321–337. [Google Scholar] [CrossRef]
- Robertson, G. Food Packaging: Principles and Practice, 3rd ed.; CRC Press: Boca Raton, FL, USA, 2016; p. 733. [Google Scholar]
- Yam, K.L. The Wiley Encyclopedia of Packaging Technology, 3rd ed.; John Wiley & Sons: Hoboken, NJ, USA, 2009; p. 1353. [Google Scholar]
- Gall, M.; Schweighuber, A.; Buchberger, W.; Lang, R.W. Plastic bottle cap recycling—Characterization of recyclate composition and opportunities for design for circularity. Sustainability 2020, 12, 10378. [Google Scholar] [CrossRef]
- Future Market Insights. Plastic Caps and Closures Market: Global Industry Analysis, Size and Forecast Outlook 2022–2029. Available online: https://www.futuremarketinsights.com/reports/plastic-caps-and-closures-market (accessed on 15 December 2022).
- Elliot, T.; Gillie, H.; Thomson, A. Chapter 24: European Union’s plastic strategy and an impact assessment of the proposed directive on tackling single-use plastic items. Plast. Waste Recycl. 2020, 1, 601–633. [Google Scholar] [CrossRef]
- Kumar, R.; Verma, A.; Shome, A.; Sinha, R.; Sinha, S.; Jha, P.K.; Kumar, R.; Kumar, P.; Shubham; Das, S.; et al. Impacts of plastic pollution on ecosystem services, sustainable development goals, and need to focus on circular economy and policy interventions. Sustainability 2021, 13, 9963. [Google Scholar] [CrossRef]
- Shen, M.; Huang, W.; Chen, M.; Song, B.; Zeng, G.; Zhang, Y. (Micro)plastic crisis: Un-ignorable contribution to global greenhouse gas emissions and climate change. J. Clean. Prod. 2020, 254, 120138. [Google Scholar] [CrossRef]
- Pflugmacher, S.; Tallinen, S.; Mitrovic, S.M.; Penttinen, O.-P.; Kim, Y.-J.; Kim, S.; Esterhuizen, M. Case study comparing effects of microplastic derived from bottle caps collected in two cities on Triticum aestivum (wheat). Environments 2021, 8, 64. [Google Scholar] [CrossRef]
- Boonstra, M.; Van Hest, F. The Plastic Bottle Cap Report: Findings of the First Survey into Plastic Bottle Cap Pollution on Beaches in the Netherlands; North Sea Foundation: Utrecht, The Netherlands, 2017. Available online: https://www.noordzee.nl/project/userfiles//SDN_Doppenrapport_EN_2017_DEF_small_2.pdf (accessed on 15 December 2022).
- Schyns, Z.O.G.; Shaver, M.P. Mechanical recycling of packaging plastics: A review. Macromol. Rapid Commun. 2020, 42, 2000415. [Google Scholar] [CrossRef]
- Lange, J.P. Managing plastic waste: Sorting, recycling, disposal, and product redesign. ACS Sustain. Chem. Eng. 2021, 9, 15722–15738. [Google Scholar] [CrossRef]
- Paiva, R.; Veroneze, I.B.; Wrona, M.; Nerín, C.; Cruz, S.A. The role of residual contaminants and recycling steps on rheological properties of recycled polypropylene. J. Polym. Environ. 2022, 30, 494–503. [Google Scholar] [CrossRef]
- Freitas, A.S.M.; Rodrigues, J.S.; Botaro, V.R.; Lemes, A.P.; Cruz, S.A.; Waldman, W.R. Formation of craze-like pattern in polypropylene UV-induced surface cracking. J. Polym. Res. 2022, 29, 506. [Google Scholar] [CrossRef]
- Yao, H.; Zuo, Y.; Song, Y.; Huang, W.; Joang, Q.; Xue, X.; Jiang, L.; Xu, J.; Yang, H.; Jiang, B. Precisely tailoring and renewing polymers: An efficient strategy for polymer recycling. Macromol. Chem. Phys. 2022, 223, 2200117. [Google Scholar] [CrossRef]
- Ladhari, A.; Kucukpinar, E.; Stoll, H.; Sängerlaub, S. Comparison of properties with relevance for the automotive sector in mechanically recycled and virgin polypropylene. Recycling 2021, 6, 76. [Google Scholar] [CrossRef]
- Barletta, M.; Aversa, C.; Puopolo, M.; Vesco, S. Extrusion blow molding of environmentally friendly bottles in biodegradable polyesters blends. Polym. Test. 2019, 77, 105885. [Google Scholar] [CrossRef]
- Martinez -Lopez, M.; Martínez-Barrera, G.; Salgado-Delgado, R.; Gencel, O. Recycling polypropylene and polyethylene wastes in production of polyester based polymer mortars. Constr. Build. Mater. 2021, 274, 121487. [Google Scholar] [CrossRef]
- White, C.C.; White, K.M.; Pickett, J.E. Service Life Prediction of Polymers and Plastics Exposed to Outdoor Weathering; William Andrew Publishing: Norwich, NY, USA, 2017. [Google Scholar]
- Al-Salem, S.M.; Abraham, G.; Al-Qabandi, O.A.; Dashti, A.M. Investigating the effect of accelerated weathering on the mechanical and physical properties of high content plastic solid waste (PSW) blends with virgin linear low-density polyethylene (LLDPE). Polym. Test. 2015, 46, 116–121. [Google Scholar] [CrossRef]
- Bakshi, P.; Pappu, A.; Bharti, D.K.; Patidar, R. Accelerated weathering performance of injection moulded PP and LDPE composites reinforced with calcium rich waste resources. Polym. Degrad. Stab. 2021, 192, 109694. [Google Scholar] [CrossRef]
- Velenturf, A.P.M.; Purnell, P. Principles for a sustainable circular economy. Sustain. Prod. Consum. 2021, 27, 1437–1457. [Google Scholar] [CrossRef]
- UNEP. United Nations Environment Assembly of the United Nations Environment Programme. End Plastic Pollution: Towards an International Legally Binding Instrument. Available online: https://wedocs.unep.org/bitstream/handle/20.500.11822/38522/k2200647_-_unep-ea-5-l-23-rev-1_-_advance.pdf?sequence=1&isAllowed=y (accessed on 15 December 2022).
- Plastics Europe. Plastics: The Facts 2022. An analysis of European Plastics Production, Demand, and Waste Data. Available online: https://plasticseurope.org/knowledge-hub/plastics-the-facts-2022/ (accessed on 15 December 2022).
- Market Research Future. Recycled Polypropylene Market: Information by Process (Mechanical, Chemical), Source (Bottles, Films, Bags, Industrial and Agricultural Waste), Application (Packaging, Automotive, Building and Construction, Textiles), and Region Forecast Till 2030. Available online: https://www.marketresearchfuture.com/reports/recycled-polypropylene-market-7502 (accessed on 15 December 2022).
- Bassi, S.A.; Tonini, D.; Saveyn, H.; Astrup, T.F. Environmental and Socioeconomic Impacts of Poly (ethylene terephthalate) (PET) Packaging Management Strategies in the EU. Environ. Sci. Technol. 2022, 56, 501–511. [Google Scholar] [CrossRef]
- Saidani, M.; Yannou, B.; Leroy, Y.; Cluzel, F.; Kendall, A. A taxonomy of circular economy indicators. J. Clean. Prod. 2019, 207, 542–559. [Google Scholar] [CrossRef] [Green Version]
- Ellen Macarthur Foundation. Circularity Indicators: An Approach to Measuring Circularity–Methodology; Ellen McArthur Foundation: Isle of Wight, UK, 2015; Available online: https://emf.thirdlight.com/link/3jtevhlkbukz-9of4s4/@/preview/1?o. (accessed on 18 December 2022).
- Vadoudi, K.; Deckers, P.; Demuytere, C.; Askanian, H.; Verney, V. Comparing a material circularity indicator to life cycle assessment: The case of a three-layer plastic packaging. Sustain. Prod. Consum. 2022, 33, 820–830. [Google Scholar] [CrossRef]
- Niero, M.; Kalbar, P.P. Coupling material circularity indicators and life cycle-based indicators: A proposal to advance the assessment of circular economy strategies at the product level. Resour. Conserv. Recycl. 2019, 140, 305–312. [Google Scholar] [CrossRef]
- Moore, C.C.S.; Kulay, L. Effect of the implementation of carbon capture systems on the environmental, energy, and economic performance of the Brazilian electricity matrix. Energies 2019, 12, 331. [Google Scholar] [CrossRef] [Green Version]
- ISO 14044:2006; Environmental Management-Life Cycle Assessment: Requirements and Guidelines. 1st ed. International Organization for Standardization (ISO): Geneva, Switzerland, 2006.
- Galve, J.E.; Elduque, D.; Pina, C.; Javierre, C. Life Cycle Assessment of a plastic part injected with recycled polypropylene: A comparison with alternative virgin materials. Int. J. Precis. Eng. Manuf. 2022, 9, 919–932. [Google Scholar] [CrossRef]
- Agarski, B.; Vukelic, D.; Micunovic, M.I.; Budak, I. Evaluation of the environmental impact of plastic cap production, packaging, and disposal. J. Environ. Manag. 2019, 245, 55–65. [Google Scholar] [CrossRef]
- Istrate, I.-R.; Juan, R.; Martin-Gamboa, M.; Domínguez, C.; García-Muñoz, R.A.; Dufor, J. Environmental life cycle assessment of the incorporation of recycled high-density polyethylene to polyethylene pipe grade resins. J. Clean. Prod. 2021, 319, 128580. [Google Scholar] [CrossRef]
- Instituto SustentPlást. Programa Tampinha Legal. 2023. Available online: https://tampinhalegal.com.br/ (accessed on 21 March 2023).
- ERE. Energy Research Enterprise. Ministry of Mines and Energy. Brazilian Energy Balance 2022 Year 2021. Available online: https://www.epe.gov.br/pt/publicacoes-dados-abertos/publicacoes/balanco-energetico-nacional-2022 (accessed on 19 March 2023).
- Moreno Ruiz, E.; FitzGerald, D.; Symeonidis, A.; Ioannidou, D.; Müller, J.; Valsasina, L.; Vadenbo, C.; Minas, N.; Sonderegger, T.; Dellenbach, D. Documentation of Changes Implemented in Ecoinvent Database v3.8; Ecoinvent: Zürich, Switzerland, 2021. [Google Scholar]
- Baumann, H.; Tillman, A.M. The Hitchhiker’s Guide to LCA: An Orientation in Life Cycle Assessment Methodology and Application; Studentlitteratur: Lund, Sweden, 2004. [Google Scholar]
- Curran, M.A. Life Cycle Assessment Handbook: A Guide for Environmentally Sustainable Products; Wiley: Cincinnati, OH, USA, 2012; p. 611. [Google Scholar]
- Masson-Delmotte, V.P.; Zhai, A.; Pirani, S.L.; Connors, C.; Péan, S.; Berger, N.; Caud, Y.; Chen, L.; Goldfarb, M.I.; Gomis, M.; et al. (Eds.) Climate Change 2021: The Physical Science Basis. Contribution of Working Group I to the Sixth Assessment Report of the Intergovernmental Panel on Climate Change; Cambridge University Press: Cambridge, UK, 2021; Available online: https://www.ipcc.ch/report/sixth-assessment-report-working-group-i (accessed on 11 March 2023).
- ISO 14067:2018; Greenhouse Gases: Carbon Footprint of Products. Requirements and Guidelines for Quantification. International Organization for Standardization (ISO): Geneva, Switzerland, 2018.
- Huijbregts, M.A.J.; Hellweg, S.; Frischknecht, R.; Hendriks, H.W.M.; Hungerbühler, K.; Hendriks, A.J. Cumulative Energy Demand As Predictor for the Environmental Burden of Commodity Production. Environ. Sci. Technol. 2010, 44, 2189–2196. [Google Scholar] [CrossRef] [Green Version]
- Frischknecht, R.; Editors, N.J.; Althaus, H.-J.; Bauer, C.; Doka, G.; Dones, R.; Hischier, R.; Hellweg, S.; Köllner, T.; Loerincik, Y.; et al. Implementation of Life Cycle Impact Assessment Methods; Swiss Centre for Life Cycle Inventories: Dübendorf, Switzerland, 2007. [Google Scholar]
- Boulay, A.-M.; Bulle, C.; Bayart, J.-B.; Deschenes, L.; Margni, M. Regional characterization of freshwater use in LCA: Modeling direct impacts on human health. Environ. Sci. Technol. 2011, 45, 8948–8957. [Google Scholar] [CrossRef]
- Huijbregts, M.A.J.; Steinmann, Z.J.N.; Elshout, P.M.F.; Stam, G.; Verones, F.; Vieira, M.; Zijp, M.; Hollander, A.; van Zelm, R. ReCiPe2016: A harmonized life cycle impact assessment method at midpoint and endpoint level. Int. J. Life Cycle Assess. 2017, 22, 138–147. [Google Scholar] [CrossRef]
- van Zelm, R.; Preiss, P.; van Goethem, T.; Van Dingenen, R.; Huijbregts, M. Regionalized life cycle impact assessment of air pollution on the global scale: Damage to human health and vegetation. Atmospheric Environ. 2016, 134, 129–137. [Google Scholar] [CrossRef] [Green Version]
- Azevedo, L.B.; van Zelm, R.; Hendriks, A.J.; Bobbink, R.; Huijbregts, M.A. Global assessment of the effects of terrestrial acidification on plant species richness. Environ. Pollut. 2013, 174, 10–15. [Google Scholar] [CrossRef] [Green Version]
- Ellen Macarthur Foundation. A Circular Economy for Plastic in Which It Never Becomes Waste; New Plastics Economy: Isle of Wight, UK, 2017. [Google Scholar]
- Lonca, G.; Lesage, P.; Majeau-Bettez, G.; Bernard, S.; Margni, M. Assessing scaling effects of circular economy strategies: A case study on plastic bottle closed-loop recycling in the USA PET market. Resour. Conserv. Recycl. 2020, 162, 105013. [Google Scholar] [CrossRef]
- Rigamonti, L.; Mancini, E. Life Cycle Assessment and circularity indicators. Int. J. LCA 2021, 26, 1937–1942. [Google Scholar] [CrossRef]
- Braskem, S.A. Ficha Técnica-Polipropileno H 301. Available online: https//www.braskem.com.br (accessed on 31 March 2023).
- D638-14; Standard Test Method for Tensile Properties of Plastics. ASTM International: West Conshohocken, PA, USA, 2014.
- D256-10; Standard Test Methods for Determining the Izod Pendulum Impact Resistance of Plastics. ASTM International: West Conshohocken, PA, USA, 2018.
- G154-16; Standard Practice for Operating Fluorescent Ultraviolet (UV) Lamp Apparatus for Exposure of Nonmetallic Materials. ASTM International: West Conshohocken, PA, USA, 2016.
- Guinée, J.B.; Gorrée, M.; Heijungs, R.; Huppes, G.; Kleijn, R.; van Oers, L.; Wegener Sleeswijk, A.; Suh, S.; Udo de Haes, H.A.; Bruijn, H.; et al. Life Cycle Assessment: An Operational Guide to the ISO Standards; Kluwer Academic Publishers: Dordrecht, The Netherlands, 2002. [Google Scholar]
- Morita, A.M.; Moore, C.C.S.; Nogueira, A.R.; Kulay, L.; Ravagnani, M.A.S.S. Assessment of potential alternatives for improving environmental trouser jeans manufacturing performance in Brazil. J. Clean. Prod. 2020, 247, 119156. [Google Scholar] [CrossRef]
- Sakamoto, H.; Ronquim, F.M.; Seckler, M.M.; Kulay, L. Environmental performance of effluent conditioning systems for reuse in oil refining plants: A case study in Brazil. Energies 2019, 12, 326. [Google Scholar] [CrossRef] [Green Version]
- Paes, M.X.; Donnini, S.M.; De Medeiros, G.A.; Bortoleto, A.P.; Kulay, L. Life cycle assessment as a diagnostic and planning tool for waste management-a case study in a Brazilian municipality. J. Solid Waste Technol. Manag. 2018, 44, 259–269. [Google Scholar] [CrossRef]
- Fechine, G.J.M.; Santos, J.A.B.; Rabello, M.S. Avaliação da fotodegradação de poliolefinas através de exposição natural e artificial. Quim. Nova. 2006, 29, 674–680. [Google Scholar] [CrossRef] [Green Version]


| Scenario | Material Utilization Rate (%) | Material Appearance | |
|---|---|---|---|
| Recycled Plastic Caps | Virgin PP Resin | ||
| S1 | 0 | 100 | Virgin PP |
| S2 | 50 | 50 | Flake Recycled PP/Virgin PP |
| S3 | 100 | 0 | Recycled PP flake |
| S4 | 50 | 50 | Recycled PP pellet/Virgin PP |
| S5 | 100 | 0 | Recycled PP pellet |
| Scenario | GWPupk (kg CO2 eq/RF) | PED (MJ/RF) | PMF (g PM2.5 eq/RF) | TAc (g SO2 eq/RF) | WS (L/RF) |
|---|---|---|---|---|---|
| S1 | 2.21 | 98.1 | 2.14 | 6.27 | 45.4 |
| S2 | 1.30 | 58.9 | 1.40 | 4.11 | 36.2 |
| S3 | 0.11 | 7.40 | 0.38 | 1.16 | 21.8 |
| S4 | 1.10 | 50.3 | 1.26 | 3.73 | 36.9 |
| S5 | 0.19 | 11.3 | 0.61 | 1.83 | 33.9 |
| Scenario | GWPupk (kg CO2 eq/RF) | PED (MJ/RF) | PMF (g PM2.5 eq/RF) | TAc (g SO2 eq/RF) | WS (L/RF) |
|---|---|---|---|---|---|
| S1 | 1.00 | 45.8 | 1.10 | 3.26 | 30.3 |
| S2 | 0.54 | 27.4 | 0.76 | 2.25 | 25.9 |
| S3 | 0.10 | 6.81 | 0.37 | 1.11 | 21.0 |
| S4 | 0.59 | 28.1 | 0.79 | 2.35 | 27.9 |
| S5 | 0.12 | 8.04 | 0.43 | 1.31 | 24.8 |
| Scenario | MCI-A | MCI-B |
|---|---|---|
| S1 | 0.10 | 0.52 |
| S2 | 0.33 | 0.74 |
| S3 | 0.55 | 0.96 |
| S4 | 0.33 | 0.74 |
| S5 | 0.55 | 0.96 |
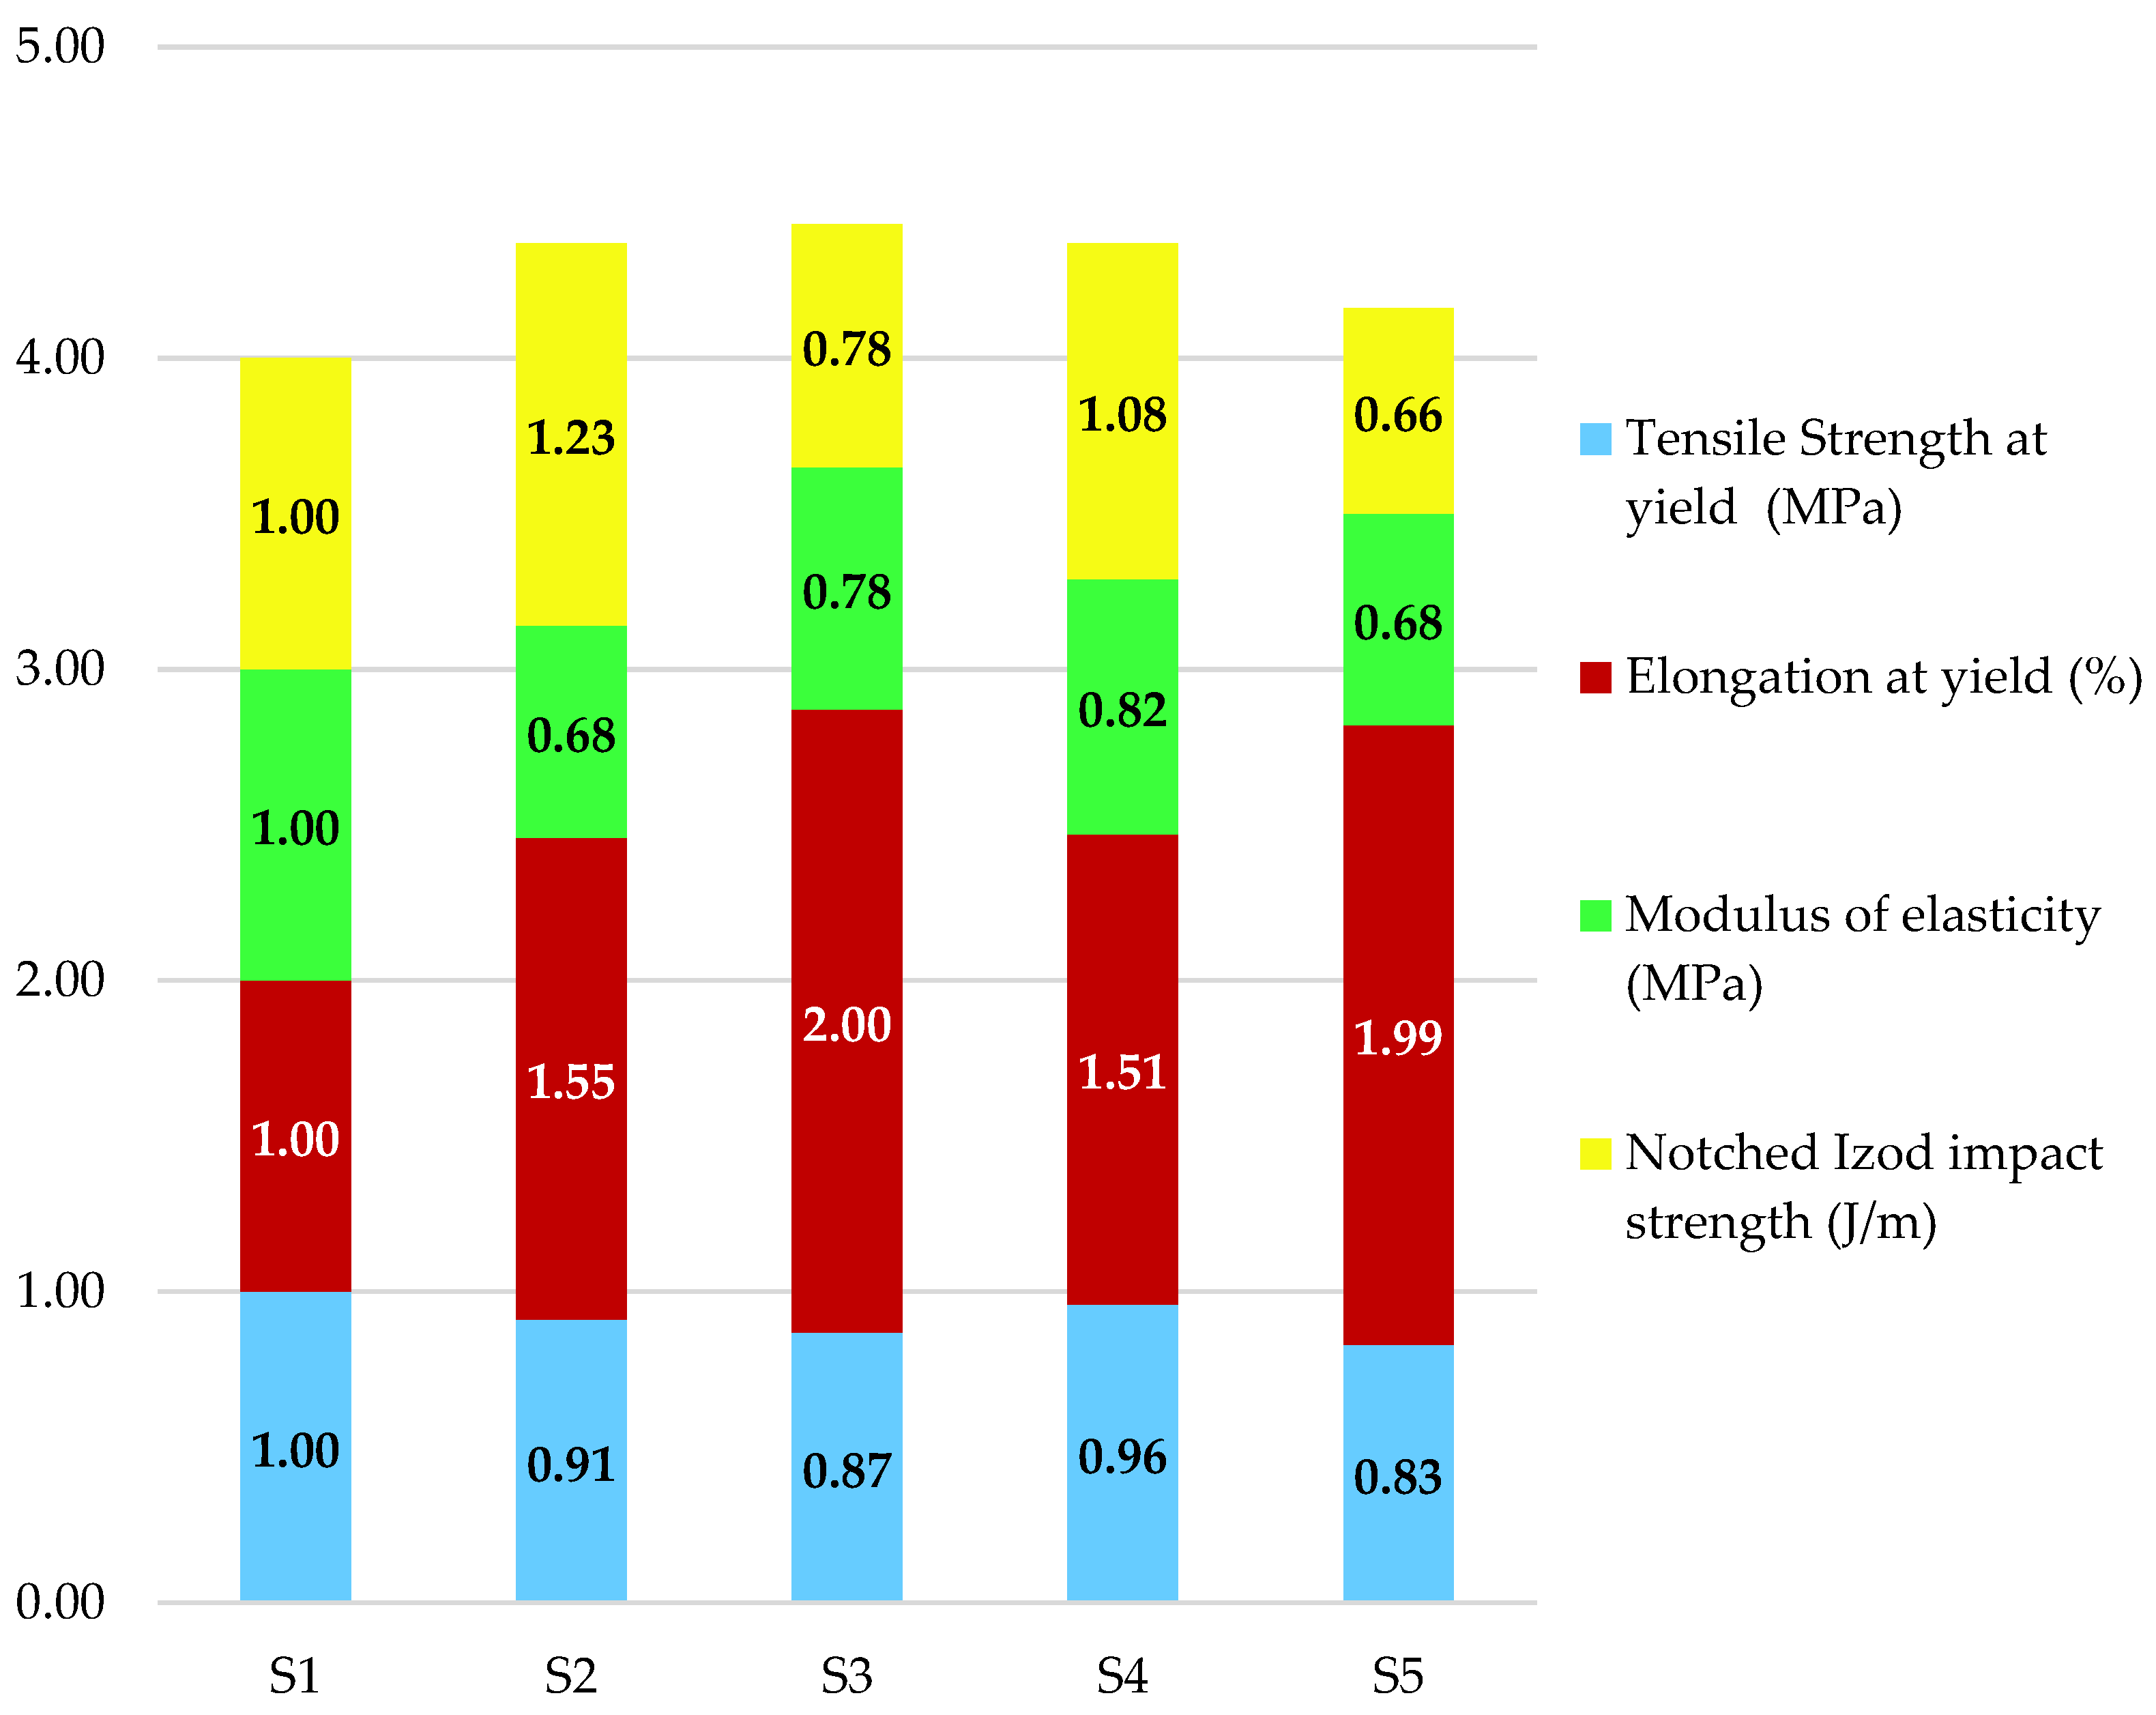
| Scenario | Tensile Strength at Yield (MPa) | Elongation at Yield (%) | Modulus of Elasticity (MPa) | Notched Izod Impact Strength (J/m) |
|---|---|---|---|---|
| S1 | 26 ± 1.0 | 6.75 ± 0.11 | 1262 ± 222 | 86.2 ± 6.20 |
| S2 | 24 ± 1.0 | 10.1 ± 0.12 | 1013 ± 201 | 91.4 ± 15.9 |
| S3 | 23 ± 1.4 | 11.6 ± 0.20 | 917 ± 109 | 72.9 ± 7.40 |
| S4 | 25 ± 1.0 | 9.73 ± 0.15 | 1030 ± 156 | 76.6 ± 8.00 |
| S5 | 21 ± 1.0 | 11.4 ± 0.26 | 770 ± 113 | 68.2 ± 7.80 |
| Scenario | Tensile Strength at Yield (MPa) | Elongation at Yield (%) | Modulus of Elasticity (MPa) | Notched Izod Impact Strength (J/m) |
|---|---|---|---|---|
| S1 | 23 ± 0.5 (−11.5%) | 5.95 ± 0.2 (−11.9%) | 836 ± 75.0 (−33.8%) | 74.7 ± 6.70 (−13.3%) |
| S2 | 21 ± 1.0 (−12.5%) | 9.21 ± 0.3 (−8.4%) | 565 ± 44.0 (−44.2%) | 91.6 ± 14.8 (+0.16) |
| S3 | 20 ± 0.8 (−13.0%) | 11.9 ± 0.3 (−2.7%) | 650 ± 75.0 (−29.1%) | 57.9 ± 11.4 (−20.5%) |
| S4 | 22 ± 0.9 (−12.0%) | 8.96 ± 0.4 (−7.9%) | 685 ± 155 (−33.5%) | 80.5 ± 10.6 (+5.0%) |
| S5 | 19 ± 1.0 (−9.52%) | 11.82 ± 0.4 (+4.0%) | 572 ± 41.0 (−25.7%) | 49.2 ± 7.20 (−27.9%) |
| Scenario | EPI | MCI–A | TPI | Global Performance Indicator |
|---|---|---|---|---|
| S1 | 5.00 | 0.10 | 4.00 | 12.5 |
| S2 | 3.30 | 0.33 | 4.36 | 2.29 |
| S3 | 0.97 | 0.55 | 4.42 | 0.40 |
| S4 | 3.01 | 0.33 | 4.36 | 2.09 |
| S5 | 1.52 | 0.55 | 4.16 | 0.67 |
Disclaimer/Publisher’s Note: The statements, opinions and data contained in all publications are solely those of the individual author(s) and contributor(s) and not of MDPI and/or the editor(s). MDPI and/or the editor(s) disclaim responsibility for any injury to people or property resulting from any ideas, methods, instructions or products referred to in the content. |
© 2023 by the authors. Licensee MDPI, Basel, Switzerland. This article is an open access article distributed under the terms and conditions of the Creative Commons Attribution (CC BY) license (https://creativecommons.org/licenses/by/4.0/).
Share and Cite
de Sá Teles, B.A.; Cunha, I.L.C.; da Silva Neto, M.L.; Wiebeck, H.; Valera, T.S.; de Souza, S.S.; de Oliveira Schmitt, A.F.; Oliveira, V.; Kulay, L. Effect of Virgin PP Substitution with Recycled Plastic Caps in the Manufacture of a Product for the Telephony Sector. Recycling 2023, 8, 51. https://doi.org/10.3390/recycling8030051
de Sá Teles BA, Cunha ILC, da Silva Neto ML, Wiebeck H, Valera TS, de Souza SS, de Oliveira Schmitt AF, Oliveira V, Kulay L. Effect of Virgin PP Substitution with Recycled Plastic Caps in the Manufacture of a Product for the Telephony Sector. Recycling. 2023; 8(3):51. https://doi.org/10.3390/recycling8030051
Chicago/Turabian Stylede Sá Teles, Beatriz Arioli, Isadora Luiza Clímaco Cunha, Manoel Lisboa da Silva Neto, Hélio Wiebeck, Ticiane Sanches Valera, Simara Silveira de Souza, Alfredo Felipe de Oliveira Schmitt, Vinicius Oliveira, and Luiz Kulay. 2023. "Effect of Virgin PP Substitution with Recycled Plastic Caps in the Manufacture of a Product for the Telephony Sector" Recycling 8, no. 3: 51. https://doi.org/10.3390/recycling8030051