1. Introduction
Plastics, over time, have assumed increasing importance in numerous fields of application. Polymeric materials are present in many sectors, such as appliances, medical, food and beverage, industrial, packaging, and automotive applications. They are used all over the world, both as base resins and in various compounds able to satisfy the most varied characteristics and performance requests.
High-density polyethylene (HDPE), Light-density polyethylene (LDPE), Polyvinyl chloride (PVC), Polyethylene terephthalate (PET), Polystyrene (PS), and Polypropylene (PP) are widely used in various sectors but above all in packaging, which are the objects that are most often used only once and then thrown away as household waste. Around the world, an estimated 1 billion plastic bags are used and thrown away every year [
1].
Despite the new creation of biodegradable resins, however, new materials cannot always replace traditional ones, and even in the case of biodegradability, the biotransformation time of the waste is long. This inevitably leads to the accumulation of a large amount of plastic in landfills. It is estimated that 10% of the world’s total municipal solid waste is made up of a mix of plastics and that the production of waste plastics is set to increase to 3.4 billion tons in 2050 worldwide [
2].
For this reason, various recycling methods have been studied [
3].
Mechanical recycling is an important solution that has been enhanced in recent decades, but it has some limits since not all plastics can be easily mechanically separated. Moreover, only a fraction of the regrind can be used within the virgin plastic production process due to the degradation that would occur on the mechanical and thermal characteristics of the product.
According to COREPLA’s (the Italian National Consortium for the collection, recycling and recovery of plastic packaging) annual report for 2021 [
4], the annual production of waste plastic coming from packaging in Italy is about 1,180,078 (t y
−1).
Along the three years 2019–2021, the plastic wastes sent to the thermal treatment decreased from 1,013,322 t in 2019 to 314,964 t in 2021 [
4,
5,
6]. In 2021, the amount of plastic sent to recycling treatment was about 63% of the total amount collected by COREPLA, while 27% was sent to thermal treatment.
Thermal treatment is a chemical conversion of plastics obtained by directly incinerating the waste plastics, thus directly obtaining thermal energy.
The waste plastic converted to energy by controlled combustion generates volatile organic compounds (VOCs), heavy metals adhered to the particulate, dioxins, PCBDFs, and polycyclic aromatic hydrocarbons (PAHs) [
7,
8,
9]. The main environmental risks are associated with possible toxic and carcinogenic effects, bioaccumulation in aquatic organisms, and contamination of the food chain.
Chemical recycling has recently gained interest as an alternative to thermal treatment that promises to be effective for all those materials that are poly-assembled or that cannot be recycled mechanically. Chemical recycling is intended as the reverse process from that of producing plastic material, i.e., to come back to the basic reagents. This allows for the transformation of plastic waste into gas and liquid fuels.
As the waste plastic is normally composed of a mix of base resins and additives such as cross-linking agents, UV stabilizers, antistatic agents, thermal stabilizers, and plasticizers as well as coloring agents from different processes that are hardly compatible with each other [
10], by chemical transformation, a variety of chemical components such as chlorinated groups and vinyl groups and other reaction products could inevitably be contained within the final converted products.
Since catalytic pyrolysis allows carrying out the conversion at lower temperatures than those adopted by thermal pyrolysis, in order to implement a selective reaction towards the desired products, lower dioxin emissions are obtained if compared to those of thermal pyrolysis and classical combustion. Moreover, since the reaction is carried out in the absence of oxygen, carbon dioxide emissions are also reduced [
11].
Even if pollutant emissions from pyrolysis plants are generally lower and of different composition compared to those exiting from controlled combustion [
12], the environmental problems linked to dioxins and other pollutants released into the atmosphere by pyrolysis plants are still significant.
Methodologies such as Hazard Identification and Human Health Risk Assessment (HHRA) are indispensable for analyzing the toxic and carcinogenic issues associated with the pollutants released into the atmosphere and can play an important role as decision tools relating to the installation of a new plant based on its impact on the population [
13].
The aim of this work is to conduct a HHRA Tier-1/Tier-2 study for both industrial catalytic pyrolysis and controlled combustion of a mix of plastic materials that can be helpful in deciding between the two different chemical recycling treatments.
The case study is the installation of the future plant on the heights of the city of Genoa and, more precisely, on the site of the Scarpino landfill.
Due to the particular geographic location of the site, the contamination of many different environmental matrices is possible, like surficial water, groundwater, and seawater, so a complete food chain can be taken into consideration.
2. Results
2.1. Processes
The results here reported refer to the following processes for the treatment of waste plastics:
Catalytic conversion of polyolefin from waste plastic: A pyrolysis power plant continuously operated for the production of liquid fuel and syngas. HHRA is carried out for dioxins and PCBDls. VOCs can be emitted from this process during accidents or in unsteady-state conditions, typical of uncontrolled start-ups.
Controlled combustion of waste plastic: a continuously fed incinerator with direct energy production. HHRA is carried out for heavy metals and PAHs. In addition, dioxins, PCBDls, and VOCs can be emitted, but we suppose the Best Available Technology is chosen in order to keep their concentrations below the threshold levels.
Waste plastic fed into the pyrolysis plant into the incinerator named “plasmix,” and it is a mix of polyolefins.
Plasmix is defined as a “set of heterogeneous plastics included in post-consumer packaging and not recovered as individual polymers” [
14]. The quantity of individual plastics in the mixture is representative of the typical mix of waste plastics that cannot be recycled by mechanical treatments. Polyolefins such as polyethylene, polypropylene, PET, and polystyrene are its main constituents.
In the Liguria Region, the production of waste plastic per inhabitant is about 26.1 kg. The municipality of Genoa has about 800,000 inhabitants, so the total annual production for year 2021 was about 20,880 (t y
−1). According to data reported by COREPLA for the year 2021 (27% of the total collected plastic is sent for thermal treatment), a total quantity of 5,638 (t y
−1) of plasmix would need to be treated in Genoa Municipality (as an alternative to landfill disposal). This leads to about 18.8 (t d
−1), i.e., 783 (kg h
−1), to be treated in a continuous plant. Since the trend reported by COREPLA for the last three years shows a good capability to increase the percentage of recycled plastic with respect to the residual plasmix in Italy, the plasmix flow rate input to the plants that are the object of this study is estimated at 500 (kg h
−1) ([
4,
5,
6]).
The plasmix composition is reported in
Table 1, and it is an average of the plasmix collected at the waste treatment plants present throughout the Ligurian territory.
2.1.1. Pyrolysis Plant
In this study, the proposed scenario for the catalytic pyrolysis plant provides for continuous operation at industrial scale. Details about the plant, already investigated when operated at pilot scale in order to design the optimal operating conditions, are reported in [
15].
The catalytic reactor here considered is a continuous stirred tank reactor, and the process analyzed is similar to STRs technologies proposed by Cynar Plc, Smuda, Polymer-Engineering Process (Nanofuel), Royco, Reentech Process, Hitachi Zosen Process, and Chiyoda Process [
16], with plastic waste processed in a melted state. Mixing is also provided, even if the reactor is a rotary kiln reactor (as in the Faulkner Process, the Conrad Recycling Process, and the Toshiba/Sappro process) [
16] or a rotary split reactor (as in the Donghe Pyrolysis Plant) [
17]. Processes using catalytic beds [
18] in which plastics can react in the gas phase are an interesting option, but they could require higher energy consumption.
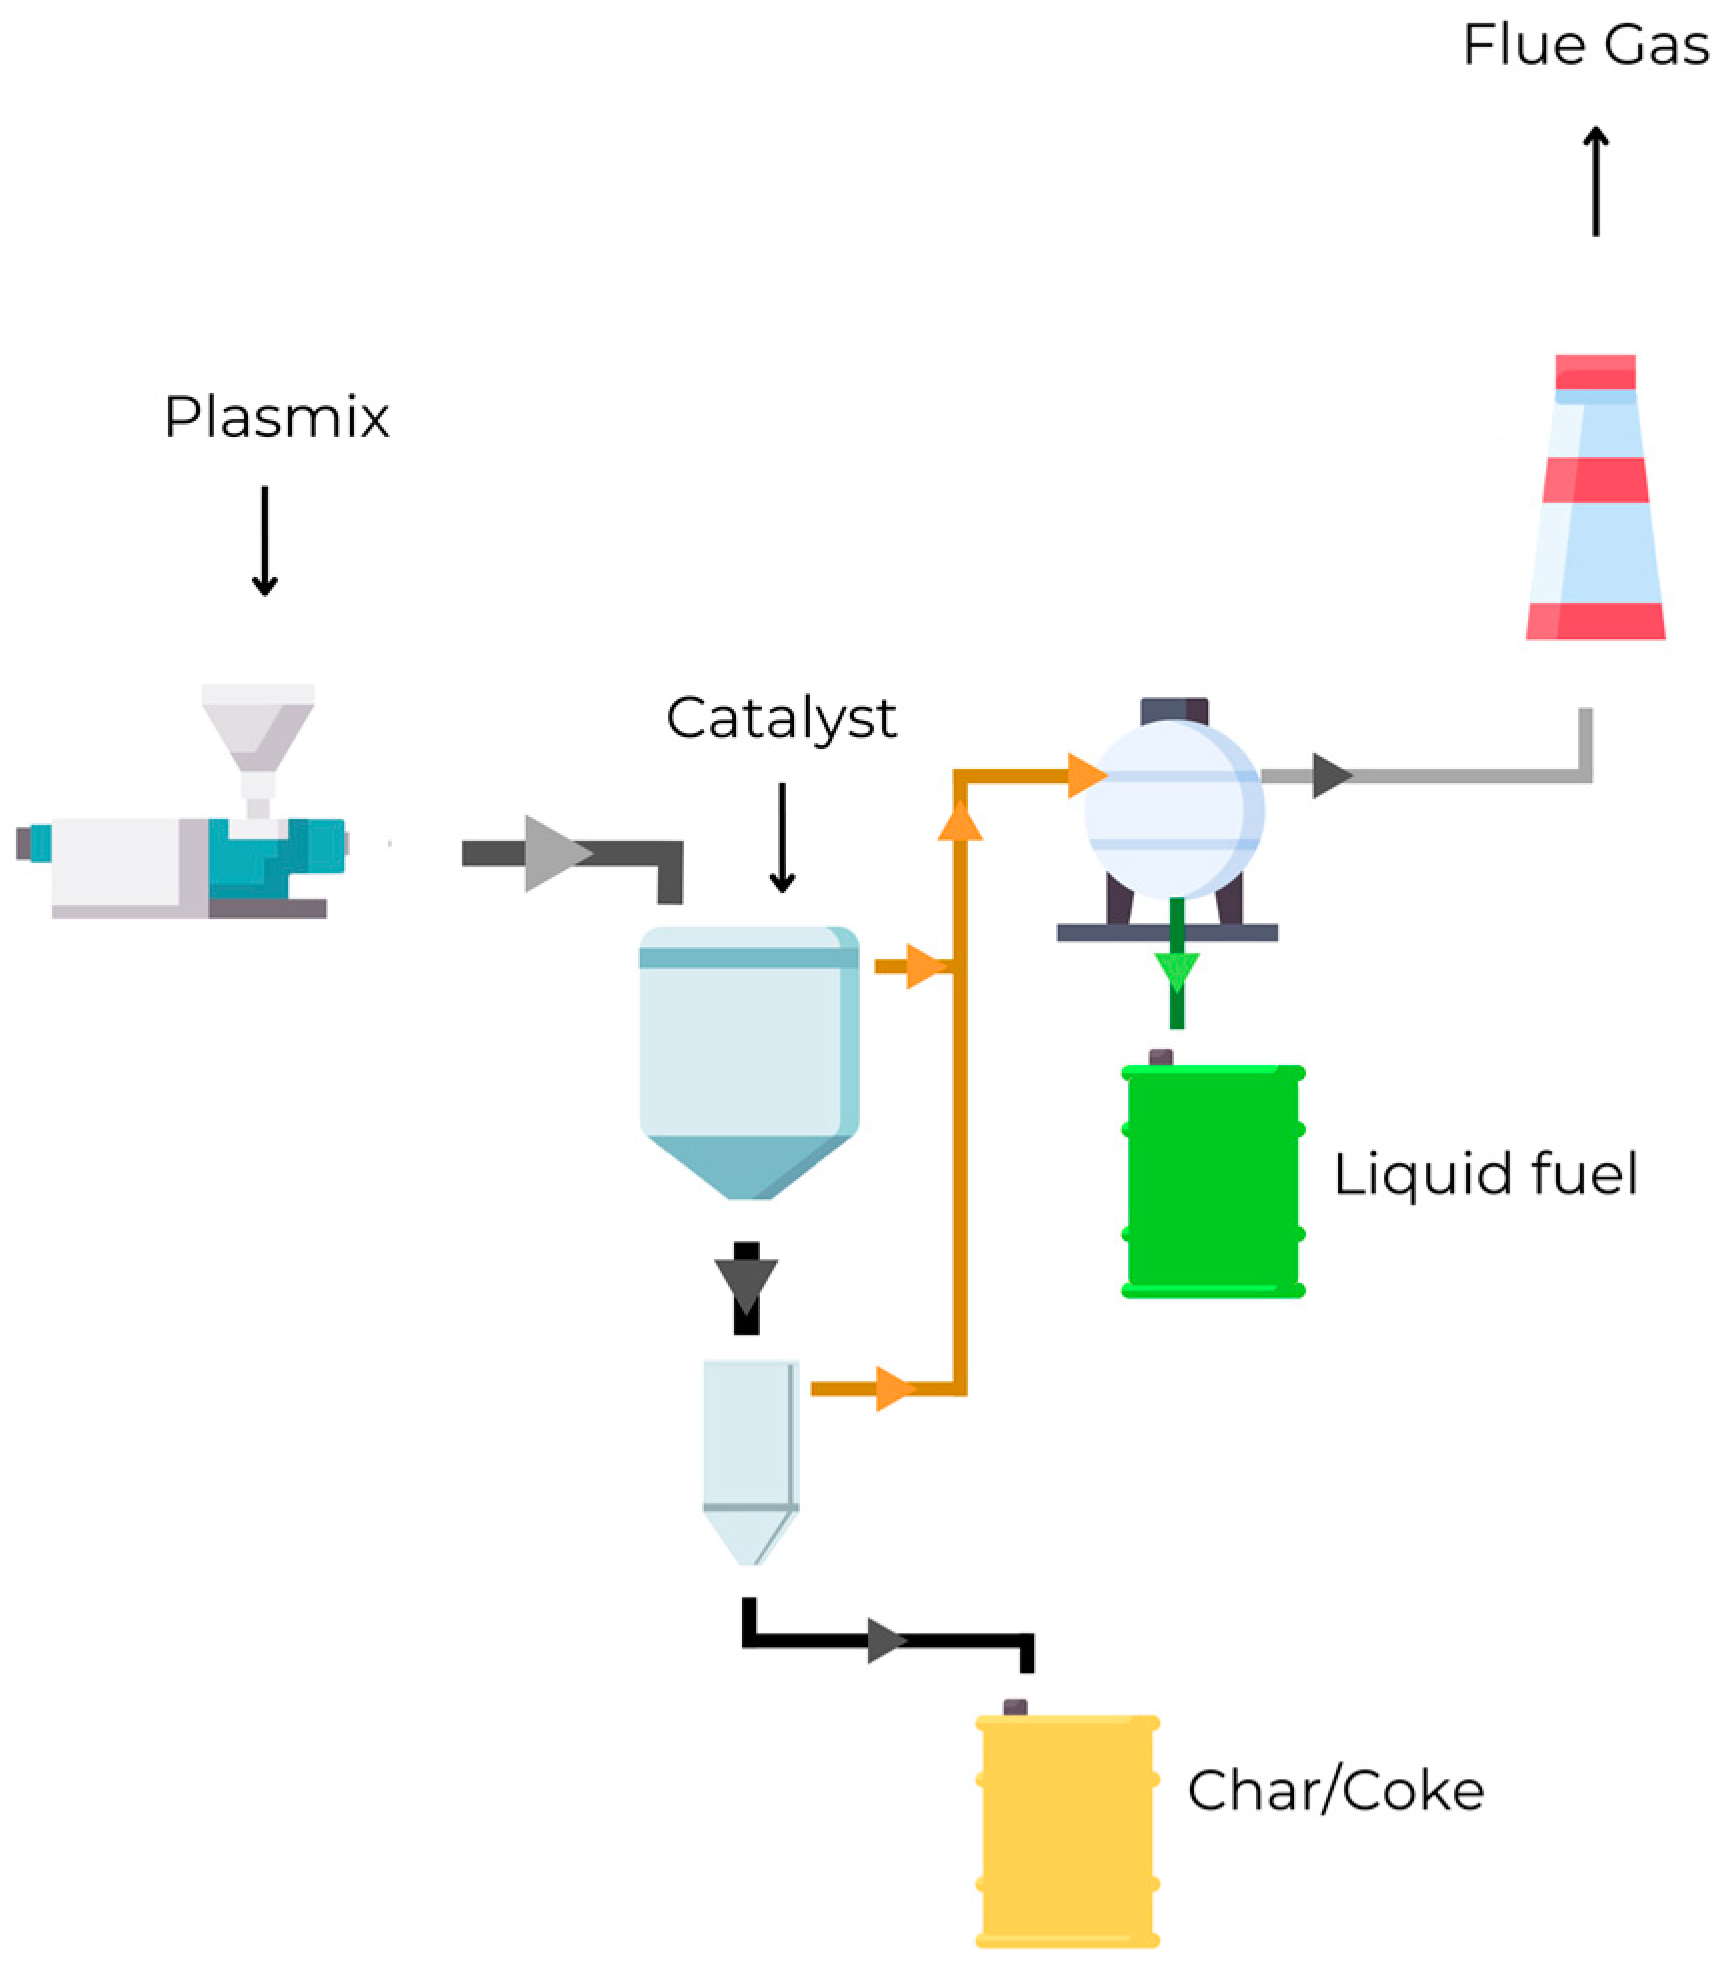
The waste plastic, in flakes, is fed into the reactor by a plastic extruder, and the catalyst is directly added in the reactor. The product in the vapor phase is condensed and stored in a liquid state. Char is extracted at regular intervals from the reactor; by evaporation, a part of the product is recovered in the vapor phase and mixed with the primary flow exiting from the reactor to the condenser.
With a processed plastic of about 500 (kg h−1), a 3–5% w/w% of catalyst is required; the process yield is about 80% w/w% of fuel oil, 10–15% w/w% of un-condensable gas, and 5–10% w/w% of solid residue.
A scheme of the process is shown in
Figure 1. Supposed operating conditions are: process temperature from 380 °C to 450 °C; extraction time from 12 to 48 h.
Operating conditions, main input and output flow rates, and parameters are reported in
Table 2.
2.1.2. Incinerator Plant
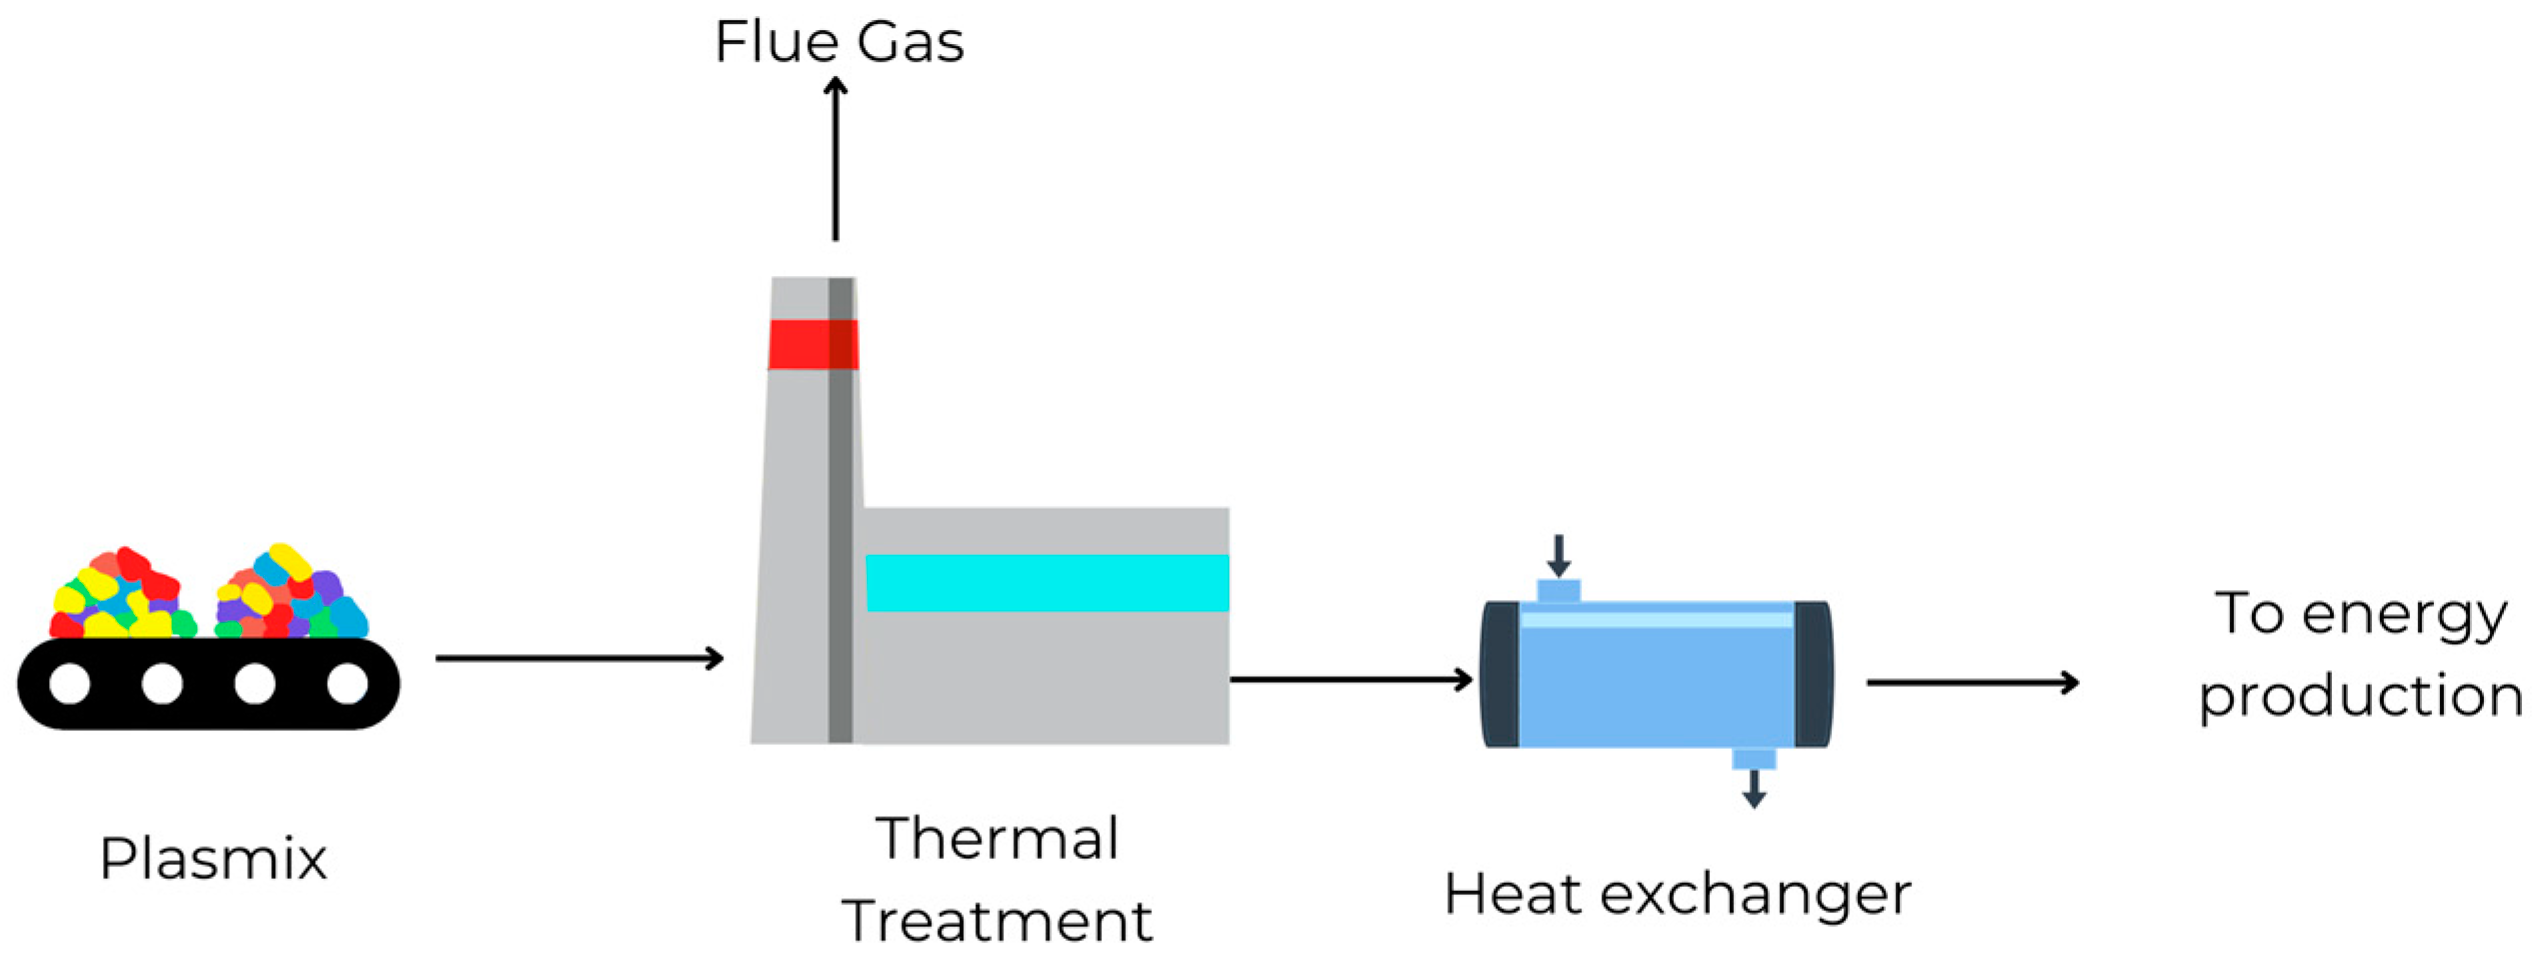
The incinerator is supposed to be fed continuously by plasmix flakes placed on a stainless steel tray. The tray is inserted into a horizontal chamber furnace. The mix of polymers first melts to burn with luminous envelope flames. The temperature range is about 600–750 °C (see
Figure 2).
The processed plastic weighs about 500 kg h−1, and the diameter and height of the stack are respectively 0.5 m and 20 m. The flow rate exiting from the stack is about 1500 (Nm3 h−1).
2.1.3. Scenarios
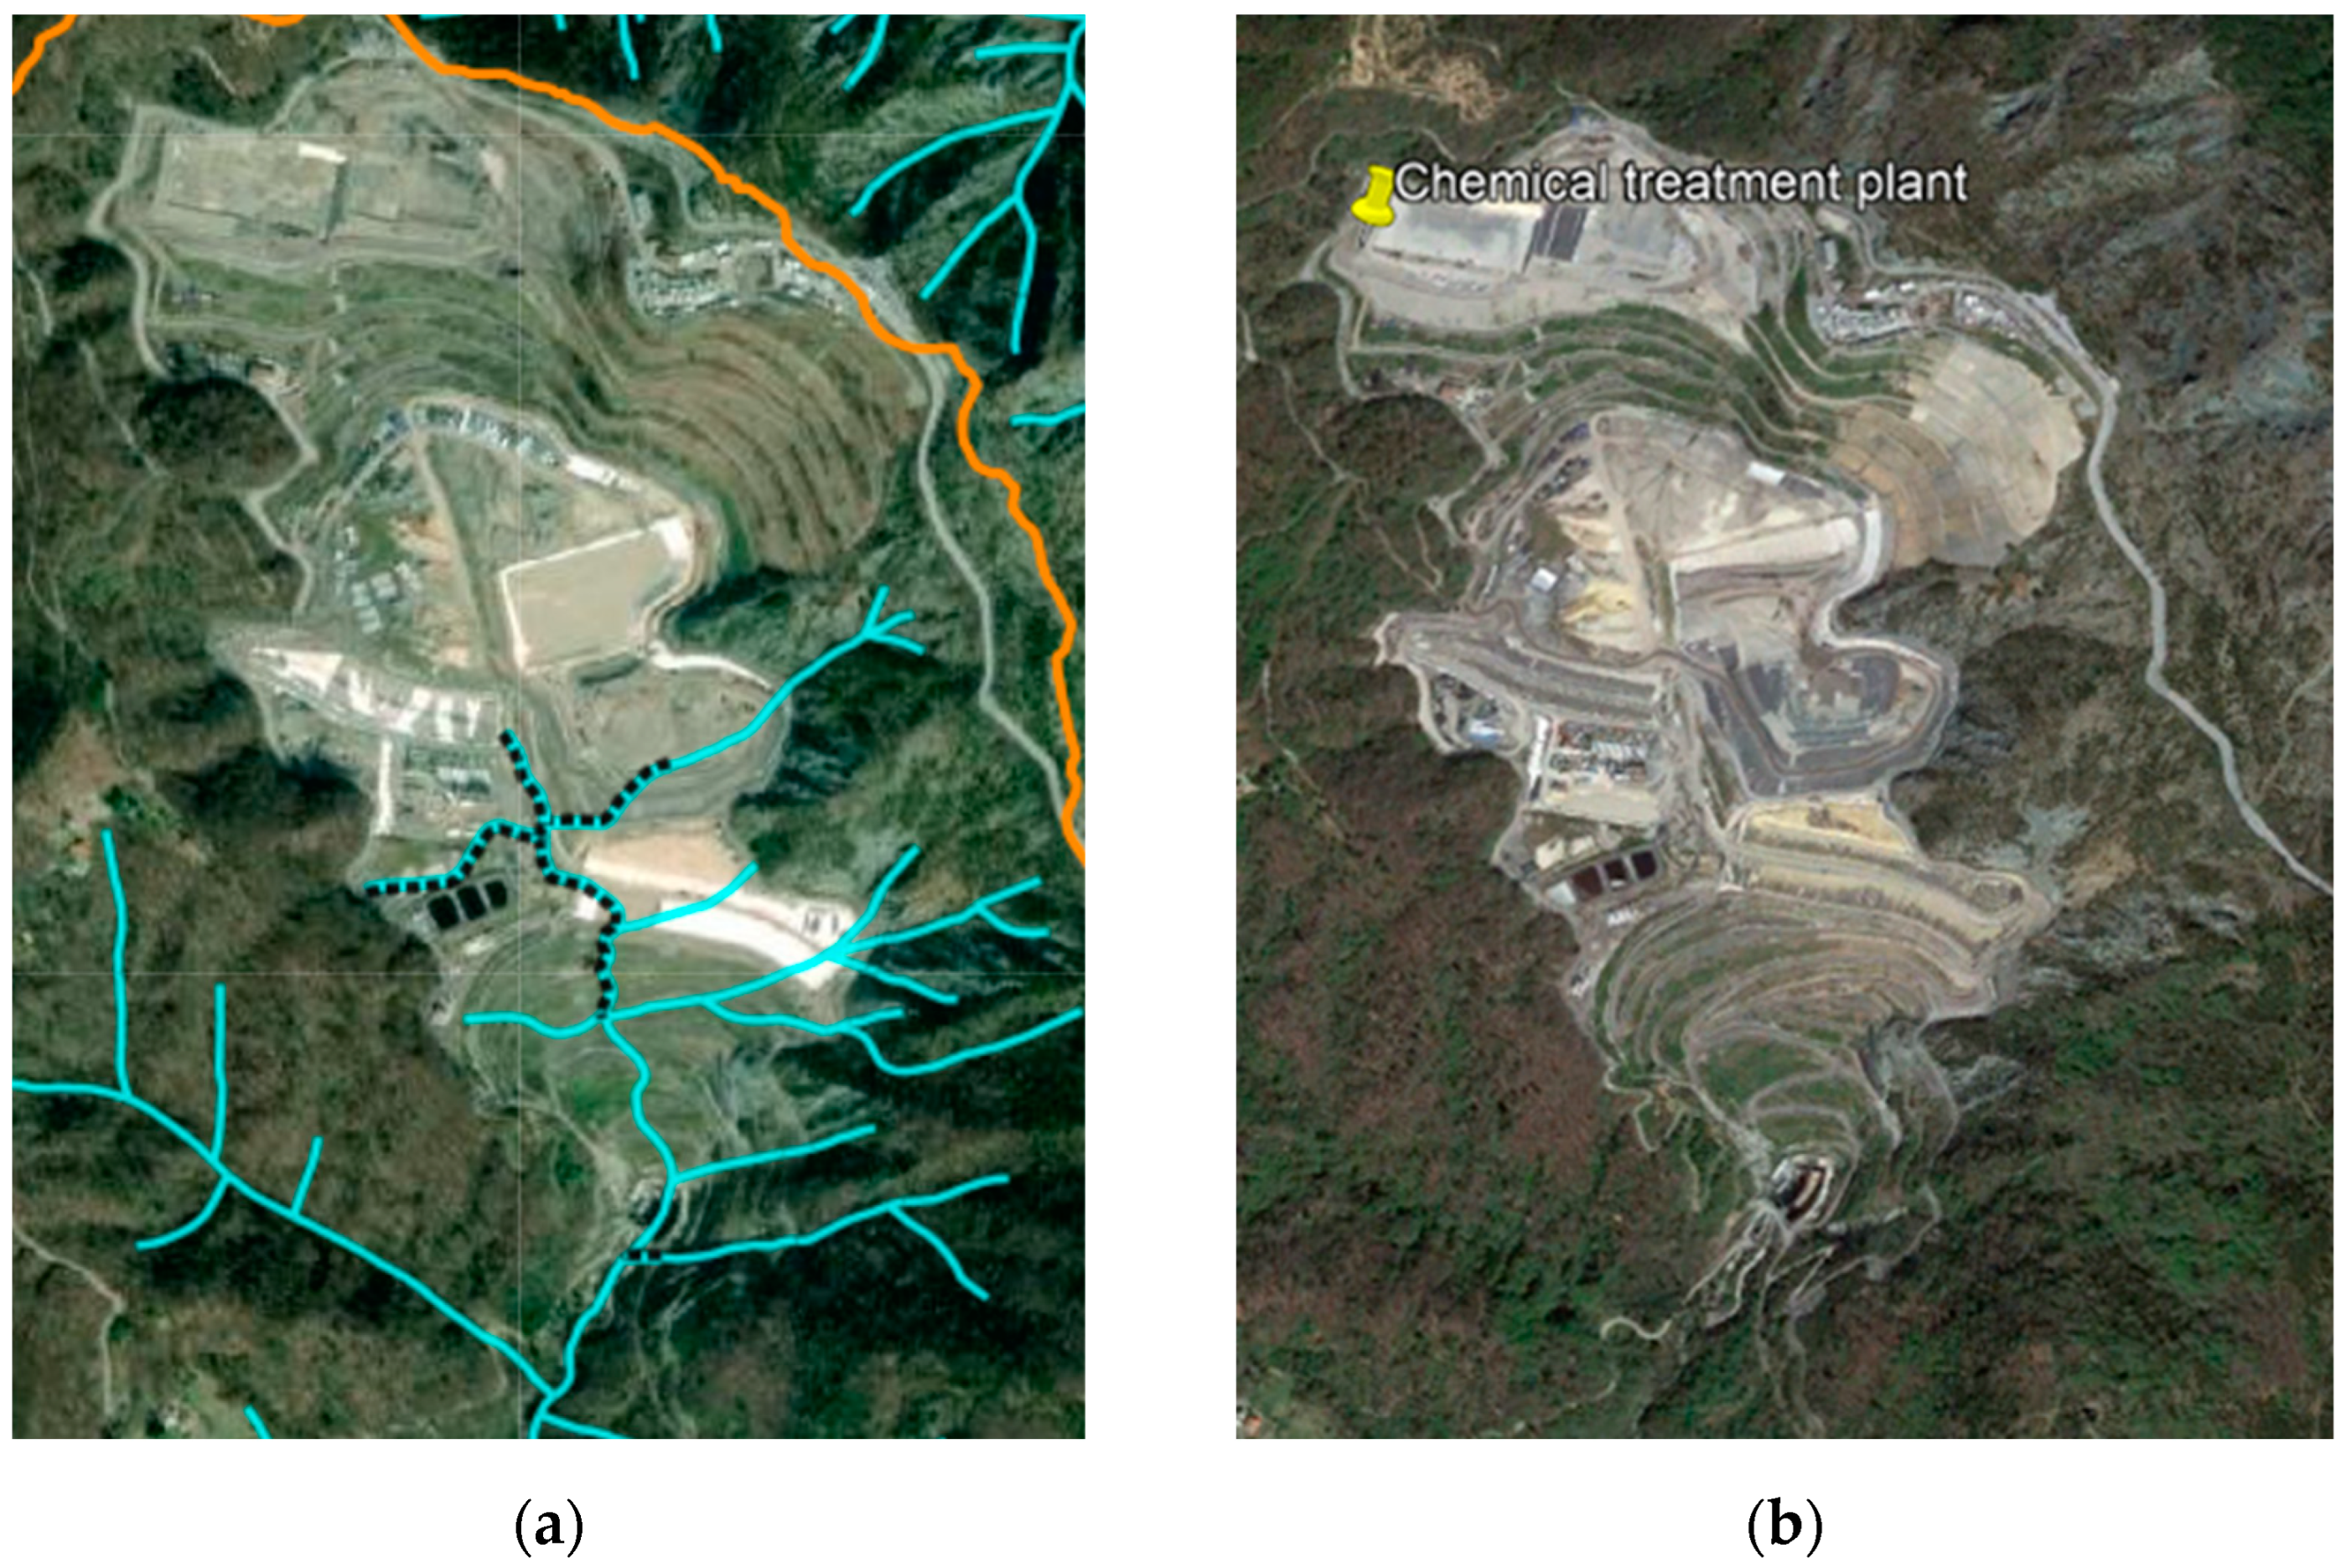
In order to compare the two proposed technologies to treat waste plastic, we are supposed to install the new plant near the site of the Scarpino non-hazardous waste disposal landfill, located in the Chiaravagna basin, Municipality of Genoa, Liguria Region, Italy (
Figure 3). It is located near the Rio Cassinelle, a small creek (18 km in length) flowing to the port area. Rio Cassinelle is also connected to another torrent named Rio Secco. The existing landfill is connected to the Rio Cassinelle through an aquifer and extends for about 60 hectares at an altitude between 350 and 600 m above sea level, at a distance of about 5 km from the coast.
Water bodies are sometimes used for irrigation of surrounding fields.
The simulated position of the new plant is shown in
Figure 3b, and the results refer to the Human Health Risk Assessment methodology applied to evaluate the risk of controlled combustion and catalytic pyrolysis.
Concentration emission data used in this study for catalytic pyrolysis come from the experimental campaigns carried out on a pilot plant installed in the northern part of Italy and were previously discussed by the authors in [
15]. Concentration data for the combustion process are taken from the literature [
19] and are in agreement with emission factors related to this kind of process.
The following three scenarios are considered to assess how the two technologies can affect human health:
- A.
Catalytic pyrolysis plant—Emission under continuous controlled operation (pollutants considered: dioxins and PCBs);
- B.
Incineration plant—Emissions under continuous controlled operations (pollutants considered: PAHs and heavy metals), soot emissions under law limits [
20]
- C.
Incinerator plant—Emissions under controlled continuous operations (pollutants considered: PAHs and heavy metals), soot emissions over law limits
PAHs can be produced during catalytic pyrolysis, but they are almost totally contained in the liquid phase (pyrolysis oil), as reported by [
21]. Moreover, the choice of selected operating conditions and catalysts [
22] can reduce the quantity of PAHs produced, and, in the case of end-of-life vehicles (ELVs), it can assure small released quantities in the gas phase [
23].
For these reasons, they are not considered in this study. However, during accidents, PAHs could be released, as well as VOCs in the vapor phase (leakage before the condenser).
In regards to controlled combustion, only the pollutants produced with particulate are here considered within the HHRA procedure. Data about dioxins and PCBs released by combustion can be directly calculated for BAT (EU emission factors) and compared with those produced by catalytic pyrolysis.
Wind directions and speed used to simulate the one year plant operation are summarized in
Table 3 and refer to the year 2021 [
24]. Data are divided into 16 directions and 6 velocity classes, with an average annual temperature of 15.8 °C. Annual average precipitation height is 1065 mm, calculated as the mean of rainfall data from 2004–2020. The daily solar radiation is about 13.9 (MJ m
−2) [
25,
26].
Simulations are conducted for all wind directions and velocity classes throughout the year 2021. The analysis takes into account the frequency to find a certain wind velocity along a certain direction during an entire year. In this way, it is possible to evaluate the dispersion of the pollutant in each direction, weighted by the probability, to find a certain velocity class.
2.2. Risk for Inhalation
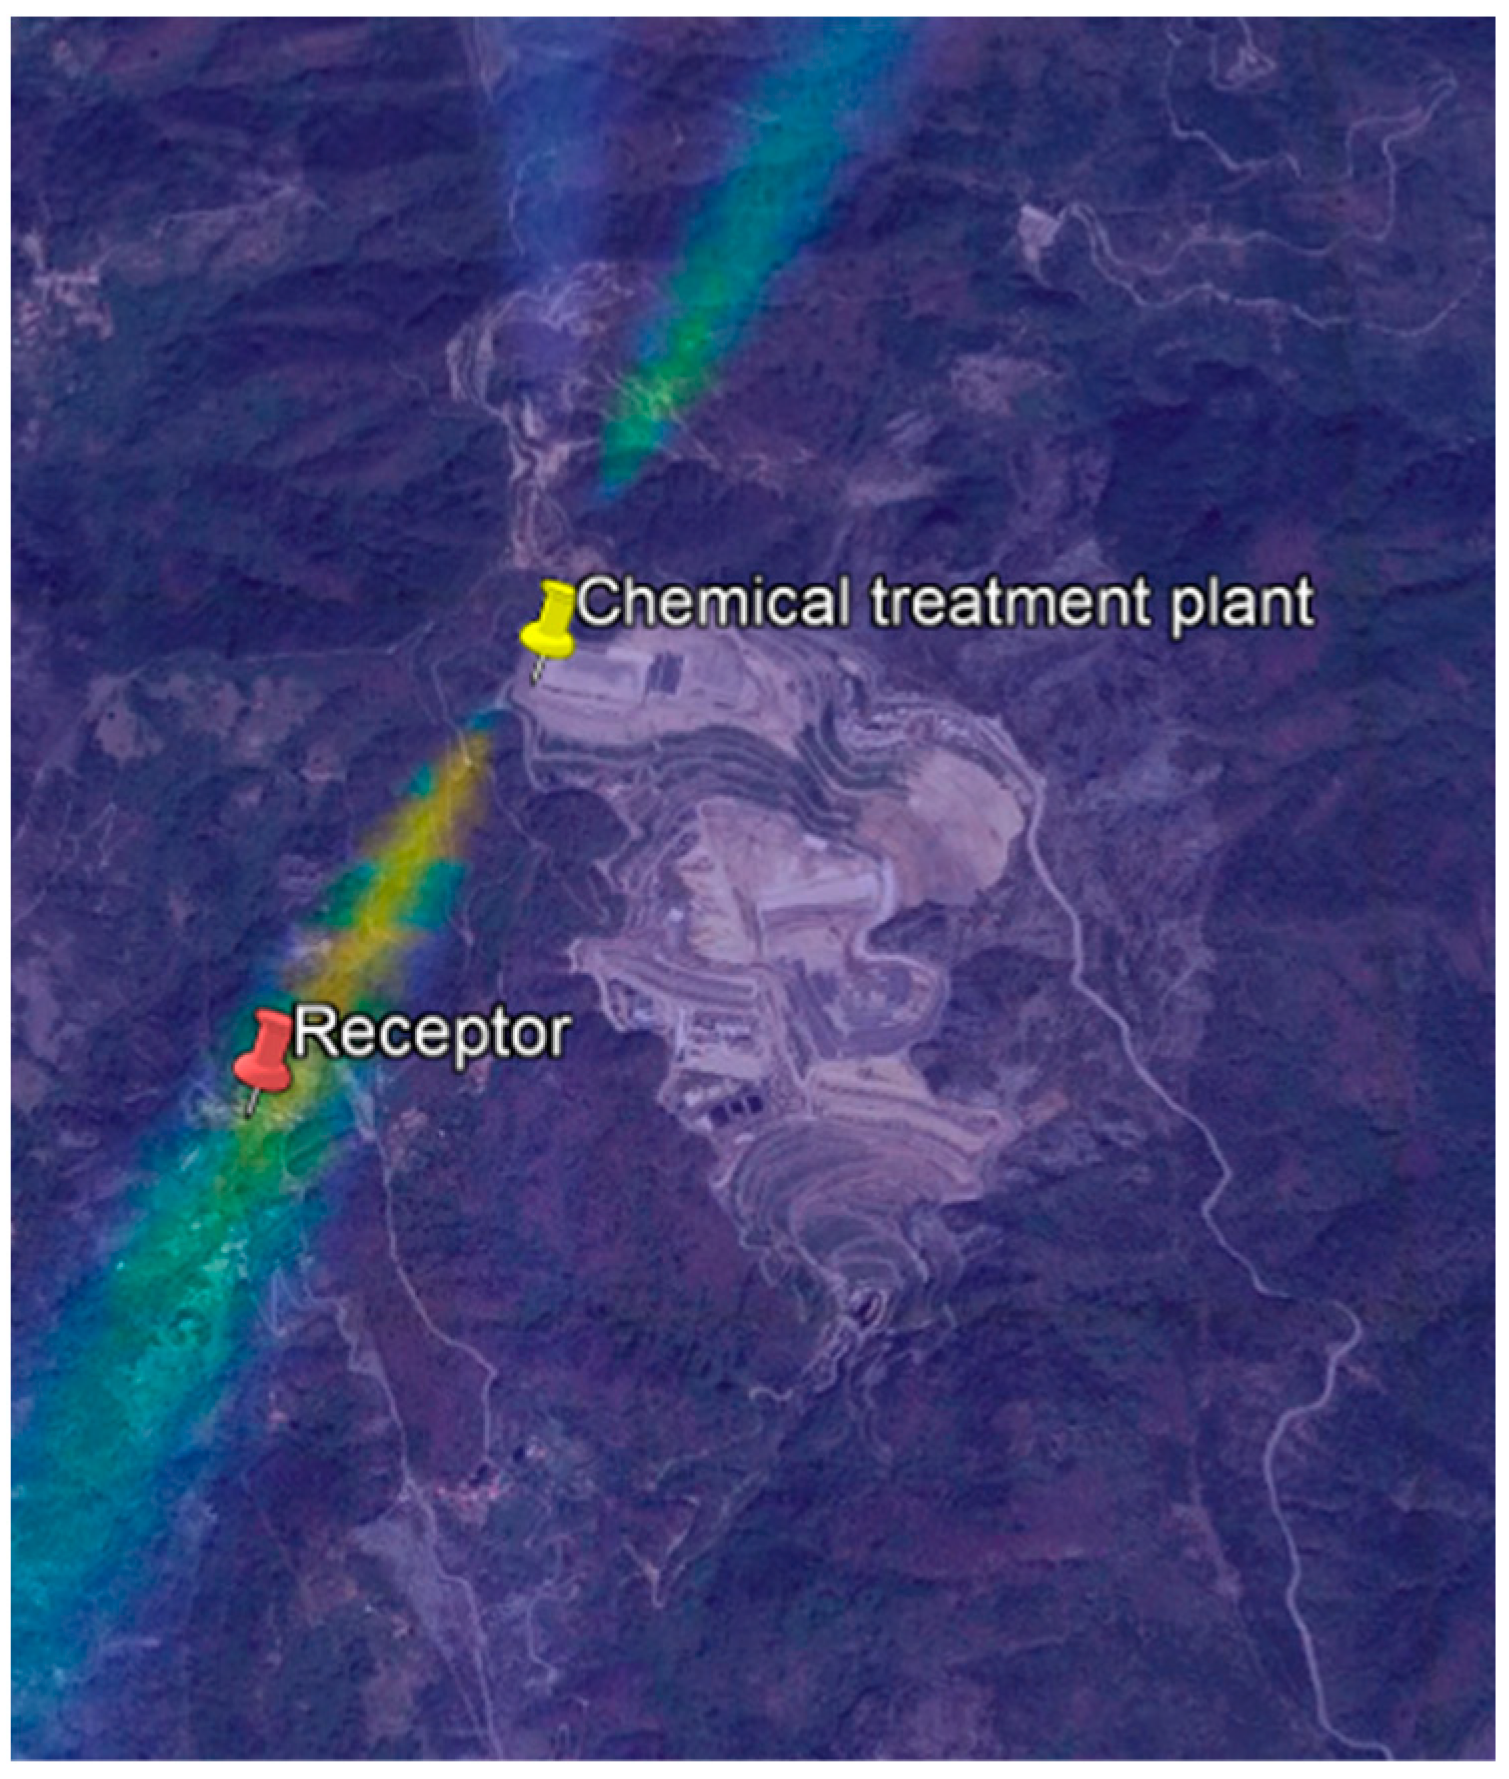
The results here reported for toxic and cancer risk due to inhalation are evaluated by computing the concentration (in the atmosphere) at different receptors around the area; the one reported in
Figure 4 is the receptor at which the risk indices are estimated. This receptor has coordinates 44°27′56.46″ N, 8°50′42.08″ E, and it is about 1 km distant from the chimney. It is the first district near the site, and it is also situated in an area more affected by wind during the entire year (see
Table 3).
2.2.1. Risk for Inhalation Scenario A
The risk evaluated for the pyrolysis process in the case of inhalation takes into account the flue gas exiting from the stack.
Flow rate exiting is 270 (m3 h−1), and the diameter is 0.3 m.
The volumetric flow rate Vs (m
3 s
−1) and the TEQ calculated for each pollutant as in
Table 4 and
Table 5 let us compute the specific mass flow rate Q = V
s TEQ.
A RfC of 4.0 × 10
−8 (mg m
−3) [
27] is considered to estimate the potential toxic risk (in terms of HQ) due to dioxins inhalation.
Average dioxin concentration (calculated on the basis of flue gas emission over an entire year of operation) at the receptor is 1.93 10−15 mg m−3, so the calculated HQD is equal to 4.83 × 10⁻⁸.
For PCBDl, a RfC of 0.04 (mg m
−3) and an UF = 1000 were used [
28]. The concentration at the receptor is 1.91 × 10
−16 (mg m
−3) and the HQ
D = 4.77 × 10
−15.
HQ values are below the threshold if the UF is considered.
To figure the cancer risk slope factors, 2 (mg kg
−1 d
−1)
−1 and 1.5 × 10
5 (mg kg
−1 d
−1)
−1 for PCBDls and dioxins, respectively, [
29,
30] are considered. An intake rate IR of 11.5 (m
3 d
−1) is considered to compute exposure with Equation (6). The CR evaluated for dioxin inhalation is 6.81 × 10
−13, while the CR for PCBDl inhalation is 8.97 × 10
−19.
Even after considering the continuous operation of the pyrolysis plant for a duration of 20 years, cancer risk remains below the threshold.
2.2.2. Risk for Inhalation Scenarios B and C
The human health risk for inhalation of pollutants released from controlled combustion for different receptors was estimated for PAHs and lead in scenarios B and C (emission of soot under the law limit of 10 (mg m−3) as a daily average and over the limit, respectively).
Concentrations exiting from the chimney were computed by taking into account a volumetric flow rate of 1500 (m3 h−1) and a chimney diameter of 0.5 m.
Potential toxicological risk for PAHs was evaluated on the basis of a RfC = 2 × 10
−6 (mg m
−3) [
31] (the limit for air quality defined by EU 2004/107/EC is 1 × 10
−6 mg m
−3).
The evaluation of toxic risk due to inhalation of Pb cannot be performed on the basis of RfC or RfD since no data are provided. The U.S. EPA considers this heavy metal a special case since it is difficult to set a threshold [
32,
33]. The calculation of HQ for Pb is then not feasible, but for screening purposes, the N.A.A.Q.S. (National Ambient Air Quality Standard) of 15 (µg m
−3) can be used as a reference [
32] in this work (it is a conservative value).
Results of toxic risk by inhalation for soot emission 8–15 (mg m
−3) are summarized in
Table 4. Concentration values of PAHs (TEQ) at the receptor are highly below the legal limits. It must be observed that the considered receptor is about 1 km from the stack, and that the concentration of PAHs (TEQ) inside the flue gas in the worst case is 1377 (ng m
−3) (slightly over the limit for air quality defined by EU 2004/107/EC). This means that only workers at the plant could be at risk for long exposure (toxic risk for inhalation of PAHs evaluated by HQ).
Cancer risk is studied by considering slope factors of 3.9 (mg kg
−1 d
−1)
−1 and 4.2 × 10
−2 (mg kg
−1 d
−1)
−1, respectively, for PAHs and lead [
34,
35].
Concentrations and total CR are reported in
Table 5.
They are under the threshold for both pollutants. Cancer risk remains below the threshold even when considering the continuous operation of the plant for a duration of 20 years.
2.3. Risk for Ingestion
Ingestion risk was considered for both the pyrolysis and combustion of plastic wastes.
Different pathways were considered, and pollution was calculated in different matrices: soil and dust, fish coming from near rivers and seawater, fruit, vegetables, grain cultivated near the plant, milk, dairy food, and meat produced in local farms.
2.3.1. Risk for Ingestion Scenario A
Intake rates for different foods referred to by adults and children are taken from [
36].
Toxic risk for dioxins and PCBDls was estimated by using the chronic oral RfD of 7 × 10
−10 mg kg
−1 d
−1 with UF = 30 for dioxins and the chronic oral RfD of 2 × 10
−5 mg kg
−1 d
−1 for PCBDls [
27,
37]. TRI computed for adults and children are 9.18 × 10
−5 and 2.46 × 10
−4 for dioxins (that remain anyway below the value of 1 also considering UF). TRI values computed for adults and children are 1.7 × 10
−9 and 4.43 × 10
−9 for PCBDls, respectively. By considering the contribution of the entire diet (intake rates reported in
Table 6), there is no toxic risk for the ingestion of both dioxins and PCBD1s (also considering the UF and the continuous operation of the plant for 20 years).
To estimate the cancer risk due to ingestion, a SF of 1.3 × 10
5 (mg kg
−1 d
−1)
−1 for dioxins and a SF of 2 (mg kg
−1 d
−1)
−1 were used [
27,
38]. The results are summarized in
Table 6.
Considering the daily intake rate of the different foods, the total cancer risk for dioxins is 1.19 × 10⁻¹⁰ and 3.20 × 10⁻¹⁰ for adults and children, respectively. Considering the daily intake rate of the different foods, the total cancer risk for PCBDls is 9.70 × 10⁻¹⁶ and 2.53 × 10⁻¹⁵ for adults and children, respectively. By considering a continuous operation of 20 years, CR remains below the threshold.
2.3.2. Risk for Ingestion Scenarios B and C
Toxic Risk Indexes for PAHs and lead were estimated for both scenarios B and C by assuming a RfD of 3 × 10
−4 (mg kg
−1 d
−1) for PAHs [
39] and 4 × 10
−3 (mg kg
−1 d
−1) for Pb [
40].
Intake rates used are taken from [
36]. The total LADD calculated is the average of the intake rates for each food class for adults and children, respectively. Results are listed in
Table 7.
TRIs are below the threshold for both PAHs and Pb. If we consider a combustion plant operating for 20 years, TRI is still below the threshold, also in the case of 15 (mg m−3), daily average soot emissions.
Cancer risk related to ingestion was computed for PAHs and lead for scenarios B and C. SF equal to 2.9 (mg kg
−1 d
−1)
−1 and 8.5 10
−3 (mg kg
−1 d
−1)
−1 were considered for PAHs and Pb, respectively [
34,
35]. Intake rates used are taken from [
36]. Results are detailed in
Table 8 and
Table 9.
Considering the daily intake rates of the different foods, the total cancer risk due to PAHs is in the range of 2.88 × 10⁻⁹–5.51 × 10⁻⁹ for adults and 8.63 × 10⁻⁹–1.65 × 10⁻⁸ for children. Considering the daily intake rates of the different foods, the total cancer risk for Pb is in the range of 2.36 × 10⁻¹⁴–4.48 × 10⁻¹⁴ and 5.96 × 10⁻¹⁴–1.13 × 10⁻¹³ for adults and children, respectively.
By considering a plant continuously operating for a 20-year-period, the CR due to PAHs is below the threshold with a value of 3.3 × 10⁻⁷ for children in the case of soot emissions of 15 mg m−3. If UFs are considered, cancer risk can be present.
3. Discussion
The human health risk assessment study carried out in this work highlighted that there is a low risk for the residing population due to dioxins and PCBs in the event that a plant for the treatment of mixed waste plastic by catalytic pyrolysis is installed at the chosen site and correctly operated. The case study considers a zone where many environmental matrices can be polluted, so almost all the possible pathways are considered. Both toxic and cancer risks are evaluated at a receptor 1 km from the site.
The hazards of the catalytic pyrolysis of plasmix, operating continuously, are mainly due to dioxins and PCBs, even if other contaminants can be released, such as PAHs and VOCs.
CO
2-assisted catalytic pyrolysis and selected catalysts must be considered to reduce the production of PAHs, as discussed in [
22,
41].
For the two main pollutants, dioxins and PCBs, both toxicities and cancer risk due to inhalation and ingestion are below the threshold, also considering uncertainty factors and adjustment indices for children. This seems to be true for a long operation period, too. Results are obtained by using real measured data of concentrations that exit from a pilot plant.
It is very interesting to notice that, even though the plant analyzed in this work is larger than the pilot plant studied by the same authors in [
15], the calculated risk for the industrial plant is lower than that of the pilot. The main reasons are related to the considered scenarios: the operating conditions of a pilot plant are not optimal, and the number of startups and shut-downs is high during pilot operation, producing higher quantities of pollutants. Moreover, considering accidental releases in the pilot HHRA study means taking into account different pollutants that are not usually emitted by an identical plant that operates continuously.
The hazards of the controlled combustion of mixed waste plastic are mainly due to dioxins, PCBs, VOCs, and particulate containing PAHs and heavy metals.
We did not assess the risk of dioxins, PCBs, VOCs, and PAHs in the gas phase for the combustion plant in this work since we assumed that the Best Available Technologies were chosen, according to EU regulations for a new installation, where both toxic and cancer risk indices must be below the respective thresholds.
Conversely, for this technology, we carried out the risk assessment in detail for some single components of the particulate, since often only concentration values for soot emissions limits are considered. We reported the results obtained using, in our simulations, some experimental measures taken from the literature, in which both PAHs and heavy metals were present in soot emissions. Both toxicity and cancer risk due to inhalation and ingestion of PAHs and Pb are below the threshold (and it is the same for other heavy metals), and we are also considering adjustment indices for children. These values remain below the threshold even in the case of a plant operating for 20 years. Attention must be paid to some of these results since, with a UF = 10, cancer risk due to PAHs can result in exceeding the threshold.
In this work, the HHRA methodology is applied by considering the classical scenarios of 300 d/y of operation with plants continuously operating at the design conditions. This is the minimum required by actual EU regulation for HHRA studies on waste treatment plants.
Nevertheless, it is the opinion of the authors that at least two other scenarios should always be considered for a new plant installation: (1) maintenance stops and related shut-downs and start-ups; and (2) accidental releases.
In regards to point 1, the authors demonstrated in [
15] that pilot plants operated with many start-ups (and shut-downs) and evolving at operating conditions far from optimal ones can be at risk, even for plants of small dimensions. In the case of catalytic pyrolysis, some VOCs can be emitted during start-ups even if they are not released during controlled continuous operation. This is probably also true for combustion plants, where VOCs, PAHs, and probably also dioxins and PCB concentrations can reach high levels during start-ups.
Finally, scenarios that consider accidental releases of short duration (days to weeks) that do not require shut-downs but can be managed by activation of a torch or by changing some operating conditions must also be considered in HHRA since the probability of their occurrence is high.
4. Materials and Methods
4.1. Main Pollutants
PCBs, dioxins, and furans are a series of toxic and carcinogenic compounds. PCBs identify a group of bicyclic aromatic organic compounds that are very stable and poorly soluble in water but easily soluble in oils and organic solvents. They are compounds characterized by low volatility and resistance to photo-degradation. This category includes 209 compounds, of which, however, only 12 congeners have toxicological and physico-chemical characteristics comparable to dioxins and furans. These 12 congeners are called “dioxin-like” and are abbreviated as PCBDls. These are carcinogenic to humans.
Dioxins are a group of 210 polychlorinated aromatic chemical compounds. They are divided into dibenzo-p-dioxins (PCDDs) and dibenzo-p-furans (PCDFs). They are stable and persistent chlorinated aromatic hydrocarbons in the environment. They are toxic to humans and animals.
Dioxins and furans have been included among the persistent organic pollutants by UNEP. There are 75 species of dioxins and 135 of furans. The toxicity of dioxins varies according to the chemical structure and strongly depends on the position of the chlorine atoms on the chain; the most toxic have 4 chlorine atoms bonded to the β carbon atoms of the aromatic ring and few or no chlorine atoms bonded to the α carbon atoms of the aromatic ring. Of the most toxic is 2,3,7,8-tetrachloro-dibenzo-p-dioxin (TCDD), and is the only known carcinogen for humans. Dioxins are resistant to biodegradation and chemical degradation; they are semi-volatile, heat-stable, and highly fat-soluble substances. In the soil, they bind to the organic fraction, and, due to their insolubility in water, they do not tend to migrate in depth. Dioxins and furans are substances easily transportable by atmospheric currents, rivers, and sea currents, thus making possible the contamination of places far from the emission sources. Dioxins tend to accumulate in the tissues and organs of living organisms. Going up the trophic chain, we witness the phenomenon of biomagnification, reaching the point of exposing the top of this chain to greater risk [
42].
Polycyclic aromatic hydrocarbons consist of two or more aromatic rings.
They are highly polluting, and they are identified in significant quantities as combustion products of fossil fuels and organic compounds. They are classified as mutagenic and carcinogenic.
PAHs are either relatively poorly soluble or completely insoluble in water, highly lipophilic, and have a tendency to bioaccumulate. They are stable compounds, and therefore they are found in the environment in soil, oily sediments, water, or in the air as aerosols. They present high chronic toxicity for aquatic life and accumulate very easily in the soil by contaminating agricultural crops.
Benzo[a]pyrene was reclassified in 2008 as a “carcinogen for humans” [
43], while other compounds are classified as “possible or probable carcinogens” for humans. PAHs commonly found in environmental matrices include benzo[a]pyrene, benzo[b]fluoranthene, benzo[k]fluoranthene, indeno[1,2,3-c,d]pyrene, benzo[a]anthracene, benzo[j]fluoranthene, and dibenzo[a,h] anthracene. Acenaphthene, acenaphthylene, anthracene, benzo[a]anthracene, dibenzo[a,h]anthracene, chrysene, pyrene, benzo[a]pyrene, indeno[1,2,3-c,d]pyrene, phenanthrene, fluoranthene, benzo[b]fluoranthene, benzo[k]fluoranthene, benzo[g,h,i]perylene, and fluorene are among the most hazardous PAHs. Synergistic action of several of these compounds can increase the carcinogenicity.
4.2. Flue Gases—Catalytic Pyrolysis
Flue gas flow rate and its composition from catalytic pyrolysis were measured within experimental campaigns conducted on the pilot plant. The procedures, the instruments, and the methodologies adopted to collect samples and carry out the chemical analysis are fully described in [
15]. Here we focus on PCBDls and dioxins contained in the flue gas emitted during the continuous operation of the plant. Some VOCs can be emitted with un-condensable gas releases during start-ups and/or accidents. We did not carry out the HHRA study of VOCs for the catalytic pyrolysis in this study since VOCs are not released in continuous operating conditions (if accidents need to be considered as a possible scenario, risk can be calculated with the same procedure adopted in [
15]).
To carry out a risk analysis on human health for these types of pollutants, it is necessary to use the equivalent toxicity factor (TEF) as defined by the WHO since each congener has a different level of toxicity and carcinogenicity.
The total equivalent toxicity is then expressed as the sum of the products of each pollutant concentration and TEF, as in Equation (1).
For PCBDls, concentrations, TEF, and calculated TEQ are summarized in
Table 10.
In regards to dioxins and furans, the measured concentration in the flue gas was always under the value of 0.0015 (ng m
−3) (sensitivity of the adopted instrumentation), so we considered for all the congeners the threshold value of 0.0015 (ng m
−3), as suggested by guidelines on HHRA methodology. TEF and calculated TGEQ are reported in
Table 11.
4.3. Flue Gas—Controlled Combustion
The main pollutants contained in the flue gas that exit from controlled combustion plants are PCBs, dioxins, and furans, VOCs, PAHs, and some of the most significant heavy metals such as lead, chromium, cadmium, zinc.
We did not carry out the HHRA study for PCBs, dioxins, and VOCs for the controlled combustion in this study since we suppose they respect limit laws (risk can be calculated with the same procedure adopted for catalytic pyrolysis).
Conversely, the types of pollutants and their concentrations in particulate matter are calculated from the experimental data reported in [
19].
The 12 PAHs that can be found in particulate soot emissions and residue solid ash from waste plastic combustion (types of plastics contained in the “plasmix”) are those shown in
Table 12. Their concentrations are calculated from the data reported in [
19] as follows: Since the limit for daily average soot emission for combustion of solid waste is set at 10 (mg m
−3) by Italian law [
20], in this work two sub-scenarios regarding soot emissions are investigated. The former is the hypothesis of soot emissions below the threshold (plant designed in order to fulfill the Best Available Techniques, ref. [
44]), whose flue gas contains 8 mg m
−3; the latter considers emissions of 50% over the law limit, i.e., 15 (mg m
−3) of soot emissions in the flue gas. TEQ is calculated on the basis of TEF and by taking into account the composition of the feed (plasmix) at the inlet.
The particulate matter emitted as a product of the combustion of plastic materials contains the majority of known heavy metals: Pb, Cd, Cr, Cu, Ni, and Zn. However, their concentrations are relatively low. Depending on the type of plastic burned, there will be different heavy metals with different concentrations.
The soot emitted by PS, PE, PP, and PET contains very low concentrations of Pb, Ni, Cr, Al, and Cu compared to the soot produced by PVC combustion, which contains higher concentrations of all the heavy metals [
19].
The concentration data adopted in this study are summarized in
Table 13 and calculated as previously discussed. The equivalent concentration is computed by taking into account the composition of the Plasmix, as follows:
4.4. Exposure Assessment
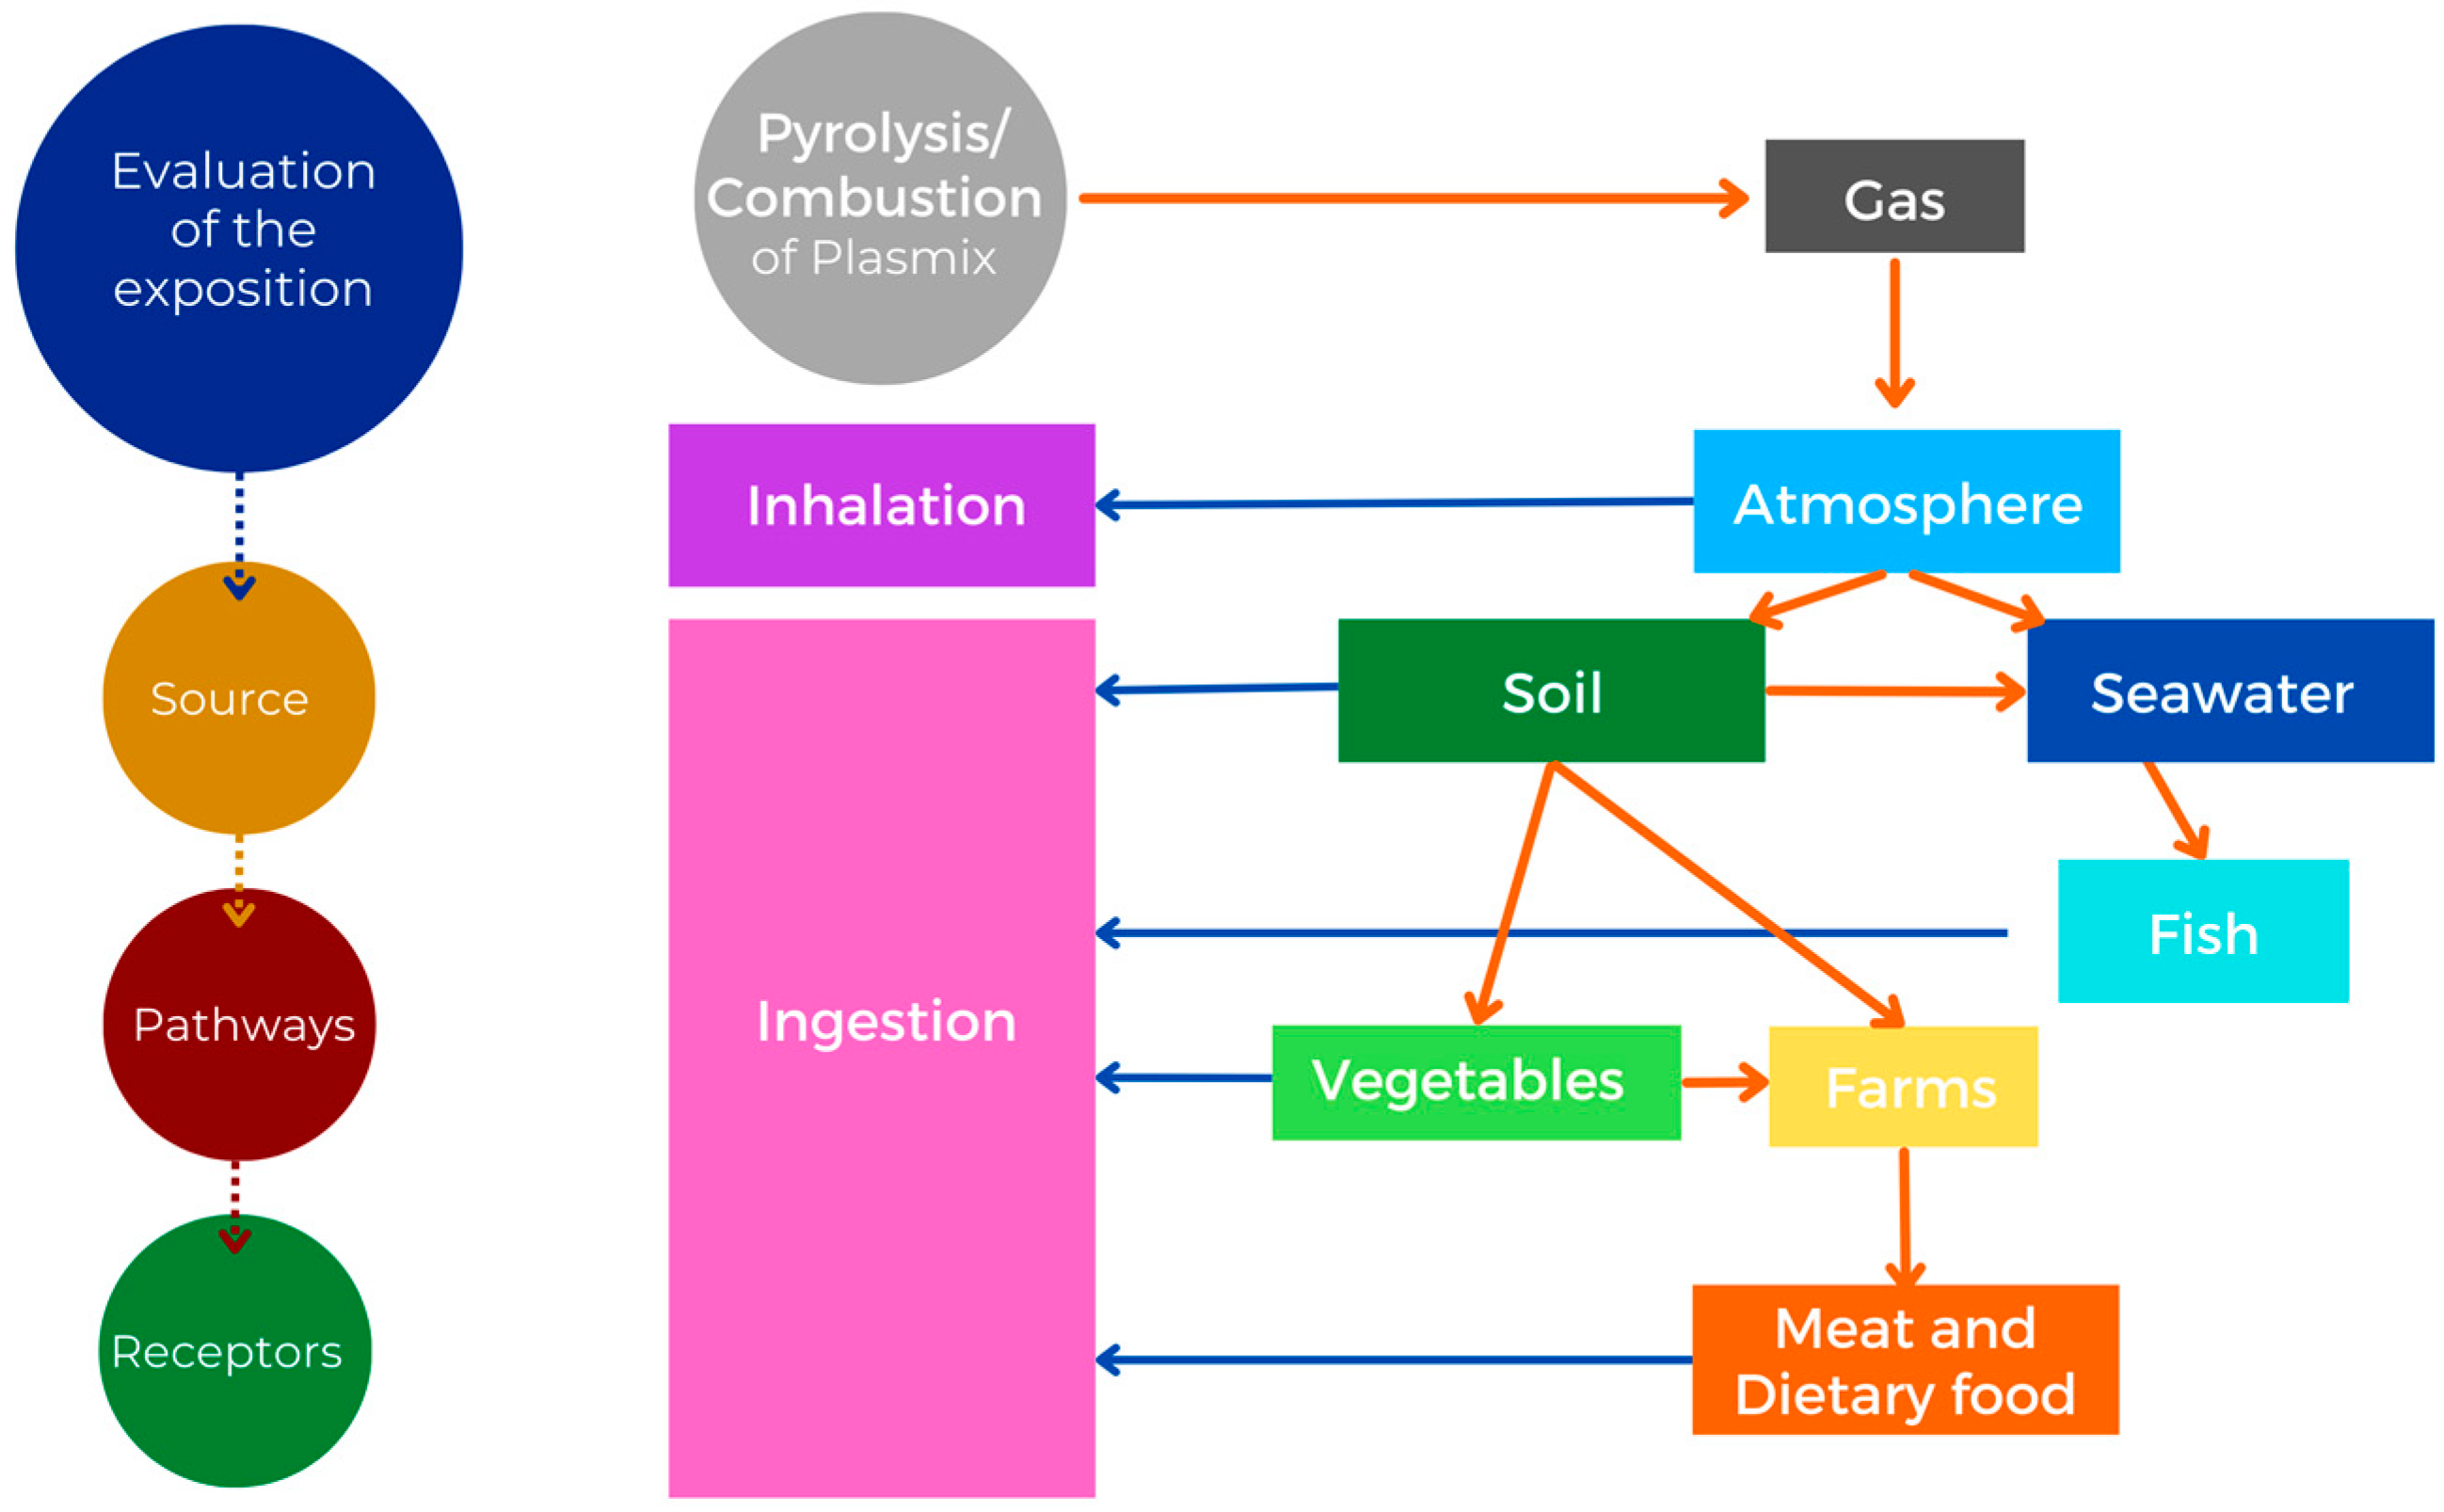
4.4.1. Exposure Pathways
On the basis of the scenarios chosen to conduct the risk assessment study, the following routes are taken into account in this work for both technologies:
inhalation;
ingestion of soil and dust; ingestion of vegetables, grain, and fruit cultivated in the fields near the site; ingestion of fish coming from rivers/seawater near the site; and ingestion of milk, cheese, and meat coming from farms located near the site.
The exposure pathway scheme takes into account the contamination due to flue gases exiting from the two plants, as shown in
Figure 5.
4.4.2. Transport Models
In order to model the different pathways, we used a Gaussian model embedded in the Dewetra platform [
45] for atmospheric dispersion and MERLIN Expo for modelling rivers, seawater, and soil contamination [
46]. Some models embedded in MERLIN are also used to compute pollutant concentrations in food.
The transport of pollutants in the atmosphere was estimated using CHESMR (Chemical Spill Risk Mapper). This application is embedded in the DEWETRA Platform [
45]. Thanks to this Web-GIS platform, CHESMR can apply Gauss and Lagrange dispersion models to real and precise meteorological data [
15]. The reflection contribution at z = −h is considered in the Gaussian model.
To compute concentrations in food matrices, MERLIN Expo was used [
46]. It is software suitable for defining different exposure pathways for a receptor up to a significant sample of the population.
MERLIN Expo has rich libraries by which it is possible to simulate different pathways by the use of blocks containing models of different matrices like soil, vegetables, fruit trees, fish, soil dust, surface water, the muscle of mammals, blood, milk, etc.
Each block is dedicated to a model, and the synergic use of blocks allows for an estimation of the concentration through each pathway. The connection of each block respects the conceptual model of the site defined by the user (as shown in
Figure 5). Parameters can be directly inserted by the user (if they are known) or chosen among the proposed ones (Tier 1 study, [
47]). The user can also estimate uncertainty for the chosen parameters by running the models as a Monte Carlo study. In this case, HHRA results are considered a Tier 2 study [
48].
We provided MERLIN Expo models with the pollutant concentrations in air and at ground level, calculated as the output of the CHESMR model. We also provided site data about rainfall.
Groundwater pollution was not simulated, even if some models proposed by the authors in [
49,
50] have been calibrated for this site since intermittent subsurface water bodies are present and general models can generate results with high uncertainty. Regardless, the contribution of groundwater pollution has little relevance if compared to that of rainfall, as correctly considered in this study.
In this work, we did not use MERLIN EXPO to assess the risk, but we only used the concentrations calculated by each single block to assess the risk using Equations (4)–(7) and the Reference Doses (RfD) and slope factors (SF) reported in
Section 2 for each considered pollutant.
The results reported in this study are mixed Tier 1 (concentrations calculated by the fish model and the mammal model for meat and milk, in which we adopted the parameters proposed by MERLIN EXPO) and Tier 2 (inhalation route, using specific detailed information about wind conditions, and partially ingestion route, using some specific information on soil and uncertainty).
4.5. Toxic and Cancer Risk Assessment
Human Health Risk Assessment is a specific method useful to compute risk in a specific exposure scenario. The concept at the base of this procedure is related to the adverse effects that a pollutant can have on human health. This concept is defined in different ways for toxic chemicals and carcinogenic ones.
To compute toxic effects on human health, the Toxic Risk Index (sometimes called the Hazard Index) and the Hazard Quotient can be used as follows:
ADD is the Average Daily Dose; it represents the chemical exposure. RfD (mg kg
−1 d
−1) is defined for each pollutant, and it represents the threshold intake dose below which no adverse effects are observed. According to [
51], if TRI is less than 1, the toxic risk is tolerable.
ADD is calculated by Equation (6), as follows:
C is the pollutant concentration in the environmental matrix (mg kg−1 or m L−1), IR represents the intake rate (mg d−1 or L d−1), EF is the exposure frequency (d y−1), ED represents the exposure duration (y), BW is the body weight (kg), AT is the average days (d) on which to compute risk, and ADAF is an adjustment factor depending on the age [-].
To evaluate the risk along the entire life it is possible to evaluate the Lifetime Average Daily Dose LADD by replacing AT in Equation (6) with the lifetime LT expressed in days. It is usually set at 70 years, i.e., 25,550 days.
The Hazard Quotient HQ can be computed when both the concentration measures and threshold for the specific contaminant inside a particular environmental matrix are available. In this case, it is possible to directly compare the measured or simulated pollutant concentration with the limit given by the regulation. HQ is not a variable related to risk, but it is only a measure of the hazards since it does not take into account the pathways and routes.
Unlike toxic risk, in which the probability of being affected by adverse effects depends on the quantity of pollutants and duration of exposure to the dose, cancer risk represents the incremental probability of being affected by cancer because of the specific exposure to a carcinogen agent [
52].
It can be evaluated through the expression:
The Slope Factor SF is the excess risk per unit of dose (mg kg−1 d−1)−1. If CR is less than 1 × 10⁶, the cancer risk is considered acceptable.
5. Conclusions
This work compared two different technologies for the treatment of waste plastic using the HHRA approach. The two processes, catalytic pyrolysis and controlled combustion, are supposed to be of industrial scale and operate continuously for a maximum of twenty years.
The catalytic pyrolysis, operated in a mixed reactor in which waste plastic reacts in the melted phase at 380–450 °C, presents a lower risk profile than controlled combustion in terms of both toxic and carcinogenic risk due to inhalation and ingestion.
The approach here proposed is a valid technique that can help to choose among different plants. The main strengths of the HHRA study used as a decision tool are: (i) different scenarios can be analyzed, such as continuous operations, maintenance stops, accidental releases, or accidents; (ii) many hazardous pollutants can be inserted into the study; and (iii) the obtained results are site-dependent. Moreover, HHRA allows a more in-depth analysis of the possible effects on population based on the risk at the receptor and not on the hazards of the pollutants calculated in terms of exceeding law limits in samples from the single environmental compartment.
The main limitations of the proposed approach are as follows: (i) The lack of availability of specific site data (such as soil conductivity, dispersion parameters, and tillage management) imposes the use of values taken from datasets of similar environmental compartments, leading to appreciable uncertainty. (ii) The results about the risk of food contamination are valid only if the resident population consumes the food produced by itself. Unfortunately, food produced at a contaminated site can be consumed very far from the zone of production.


