
Evaluating the Eco-Intensity Dynamics of the Mining Industry in Russia: Towards a Circular Economy

 ,
, 
Abstract
:1. Introduction
- RQ1: What are the characteristics of impact decoupling and resource decoupling and the color of industrial production growth in the mining sector in Russia?
- RQ2: What are the most significant factors affecting the dynamics of the eco-intensity indicators of the mining industry?
- RQ3: What are the potential uses of the proposed indicators and models for assessing the movement of the mining industry towards a circular economy for application at macro-, meso- and micro-levels?
2. Materials and Methods
3. Result
3.1. Evaluation of Decoupling and Color of the Economic Growth in the Mining Industry in Russia
3.2. Results of OLS Estimation
3.3. Assessment of the Environmental and Economic Characteristics of the Project Using the Decoupling Model and the P. Victor Model
4. Discussions and Future Research Perspectives
- Firstly, in assessing the degree of circularity (environmental friendliness) of the economic development of the mining sector in Russia (both from the position of entry—resource consumption and from the position of exit—the burden on the environment);
- Secondly, in the use of a synthesis of various methodological and instrumental approaches that logically complement each other and allow one to obtain a more complete picture of the subject of research;
- Thirdly, in the adaptation of the methodology traditionally applied at the macro-level to the micro-level and its approbation on a specific project (implementation of a new technology) of a mining sector enterprise.
5. Conclusions
Author Contributions
Funding
Data Availability Statement
Acknowledgments
Conflicts of Interest
References
- Vargas-Merino, J.A.; Rios-Lama, C.A.; Panez-Bendezú, M.H. Circular Economy: Approaches and Perspectives of a Variable with a Growing Trend in the Scientific World—A Systematic Review of the Last 5 Years. Sustainability 2022, 14, 14682. [Google Scholar] [CrossRef]
- Victor, P. The Kenneth E. Boulding Memorial Award 2014: Ecological economics: A personal journey. Ecol. Econ. 2015, 109, 93–100. [Google Scholar] [CrossRef]
- OECD (Organization for Economic Co-Operation and Development). Indicators to Measure Decoupling of Environmental Pressure from Economic Growth. Sustainable Development. 2002. Available online: http://www.oecd.org/env/indicators-modelling-outlooks/1933638.pdf (accessed on 10 December 2022).
- Samarina, V. Green economy of Russia: Some issues of theory and methodology. Natl. Interests Priorities Secur. 2015, 2, 2–9. [Google Scholar]
- Tapio, P. Towards a theory of decoupling: Degrees of decoupling in the EU and the case of road traffic in Finland between 1970 and 2001. Transp. Policy 2005, 12, 137–151. [Google Scholar] [CrossRef] [Green Version]
- Andreoni, V.; Galmarini, S. Decoupling economic growth from carbon dioxide emissions: A decomposition analysis of Italian energy consumption. Energy 2021, 44, 682–691. [Google Scholar] [CrossRef]
- Roinioti, A.; Koroneos, C. The decomposition of CO2 emissions from energy use in Greece before and during the economic crisis and their decoupling from economic growth. Renew. Sustain. Energy Rev. 2017, 76, 448–459. [Google Scholar] [CrossRef]
- Zhou, P.; Li, H. Carbon Emissions from Manufacturing Sector in Jiangsu Province: Regional Differences and Decomposition of Driving Factors. Sustainability 2022, 14, 9123. [Google Scholar] [CrossRef]
- Liu, J.; Li, H.; Liu, T. Decoupling Regional Economic Growth from Industrial CO2 Emissions: Empirical Evidence from the 13 Prefecture-Level Cities in Jiangsu Province. Sustainability 2022, 14, 2733. [Google Scholar] [CrossRef]
- Ohlan, R.P. The impact of population density, energy consumption, economic growth and trade openness on CO2 emissions in India. Nat. Hazards 2015, 79, 1409–1428. [Google Scholar] [CrossRef]
- Alam, M.J.; Begum, I.A.; Buysse, J.; Rahman, S.; Van Huylenbroeck, G. Dynamic modeling of causal relationship between energy consumption, CO2 emissions and economic growth in India. Renew. Sustain. Energy Rev. 2011, 15, 3243–3251. [Google Scholar] [CrossRef]
- Alkhathlan Kh Javid, M. Energy consumption, carbon emissions and economic growth in Saudi Arabia: An aggregate and disaggregate analysis. Energy Policy 2013, 62, 1525–1532. [Google Scholar] [CrossRef]
- Ayinde, A.R.; Celik, B.; Gylych, J. Effect of Economic Growth, Industrialization, and Urbanization on Energy Consumption in Nigeria: A Vector Error Correction Model Analysis. Int. J. Energy Econ. Policy 2019, 9, 409–418. Available online: https://www.econjournals.com/index.php/ijeep/article/view/8175 (accessed on 10 December 2022). [CrossRef] [Green Version]
- Liu, H.; Wong, W.-K.; Cong, P.T.; Nassani, A.A.; Haffar, M.; Abu-Rumman, A. Linkage among Urbanization, energy Consumption, economic growth and carbon Emissions. Panel data analysis for China using ARDL model. Fuel 2023, 332, 126122. [Google Scholar] [CrossRef]
- Huang, J.C.; Na, Y.; Guo, Y. Spatiotemporal characteristics and driving mechanism of the coupling coordination degree of urbanization and ecological environment in Kazakhstan. J. Geogr. Sci. 2020, 30, 1802–1824. [Google Scholar] [CrossRef]
- Ji, Y.; Xue, J.; Fu, Z. Sustainable Development of Economic Growth, Energy-Intensive Industries and Energy Consumption: Empirical Evidence from China’s Provinces. Sustainability 2022, 14, 7009. [Google Scholar] [CrossRef]
- Wang, H.; Zhao, A.; Cao, Y.; Xie, Y.; Guo, L. Interaction between Urbanization and Eco-Environment in Hebei Province, China. Sustainability 2022, 14, 9214. [Google Scholar] [CrossRef]
- Wang, N.; Ullah, A.; Lin, X.; Zhang, T.; Mao, J. Dynamic Influence of Urbanization on Inclusive Green Growth in Belt and Road Countries: The Moderating Role of Governance. Sustainability 2022, 14, 11623. [Google Scholar] [CrossRef]
- Chu, Y.; Wang, Y.; Zhang, Z.; Dai, S. Decoupling of Economic Growth and Industrial Water Use in Hubei Province: From an Ecological–Economic Interaction Perspective. Sustainability 2022, 14, 13338. [Google Scholar] [CrossRef]
- Dogan, E.; Seker, F. The influence of real output, renewable and non-renewable energy, trade and financial development on carbon emissions in the top renewable energy countries. Renew. Sustain. Energy Rev. 2016, 60, 1074–1085. [Google Scholar] [CrossRef]
- Ito, K. CO2 emissions, renewable and non-renewable energy consumption, and economic growth: Evidence from panel data for developing countries. Int. Econ. 2017, 151, 1–6. [Google Scholar] [CrossRef]
- Sane, M.; Hajek, M.; Phiri, J.; Babangida, J.S.; Nwaogu, C. Application of Decoupling Approach to Evaluate Electricity Consumption, Agriculture, GDP, Crude Oil Production, and CO2 Emission Nexus in Support of Economic Instrument in Nigeria. Sustainability 2022, 14, 3226. [Google Scholar] [CrossRef]
- Yu, Y.; Zhou, L.; Zhou, W.; Ren, H.; Kharrazi, A.; Ma, T.; Zhu, B. Decoupling environmental pressure from economic growth on city level: The Case Study of Chongqing in China. Ecol. Indic. 2017, 75, 27–35. [Google Scholar] [CrossRef]
- Zhang, Y.; Song, B.; Su, X. Decomposing the decoupling indicator between the economic growth and energy consumption in China. Energy Effic. 2015, 8, 1231–1239. [Google Scholar] [CrossRef]
- Ibrahim, R.L.; Al-Mulali, U.; Ajide, K.B.; Mohammed, A.; Bolarinwa, F.O. Investigating the Mediating Roles of Income Level and Technological Innovation in Africa’s Sustainability Pathways Amidst Energy Transition, Resource Abundance, and Financial Inclusion. Sustainability 2022, 14, 12212. [Google Scholar] [CrossRef]
- Shen, H.; Liu, Y. Can Circular Economy Legislation Promote Pollution Reduction? Evidence from Urban Mining Pilot Cities in China. Sustainability 2022, 14, 14700. [Google Scholar] [CrossRef]
- Jiang, Y.; Deng, F. Multi-Dimensional Threshold Effects of the Digital Economy on Green Economic Growth?—New Evidence from China. Sustainability 2022, 14, 12888. [Google Scholar] [CrossRef]
- Ruan, T.; Gu, Y.; Li, X.; Qu, R. Research on the Practical Path of Resource-Based Enterprises to Improve Environmental Efficiency in Digital Transformation. Sustainability 2022, 14, 13974. [Google Scholar] [CrossRef]
- Kasman, A.; Duman, Y.S. CO2 emissions, economic growth, energy consumption, trade and urbanization in new EU member and candidate countries: A panel data analysis. Econ. Model. 2015, 44, 97–103. [Google Scholar] [CrossRef]
- Liddle, B. What are the carbon emissions elasticities for income and population? Bridging STIRPAT and EKC via robust het-erogeneous panel estimates. Glob. Environ. Chang. 2015, 31, 62–73. [Google Scholar] [CrossRef] [Green Version]
- Qian, C.; Madni, G.R. Encirclement of Natural Resources, Green Investment, and Economic Complexity for Mitigation of Ecological Footprints in BRI Countries. Sustainability 2022, 14, 15269. [Google Scholar] [CrossRef]
- Shen, H.; Yang, Z.; Bao, Y.; Xia, X.; Wang, D. Impact of Urban Mining on Energy Efficiency: Evidence from China. Sustainability 2022, 14, 15039. [Google Scholar] [CrossRef]
- Vasylieva, T.; Lyulyov, O.; Bilan, Y.; Streimikiene, D. Sustainable Economic Development and Greenhouse Gas Emissions: The Dynamic Impact of Renewable Energy Consumption, GDP, and Corruption. Energies 2019, 12, 3289. [Google Scholar] [CrossRef] [Green Version]
- Xu, X.; Yi, B. New Insights into the Impact of Local Corruption on China’s Regional Carbon Emissions Performance Based on the Spatial Spillover Effects. Sustainability 2022, 14, 15310. [Google Scholar] [CrossRef]
- Zhou, A.; Li, J. Impact of anti-corruption and environmental regulation on the green development of China’s manufacturing industry. Sustain. Prod. Consum. 2021, 27, 1944–1960. [Google Scholar] [CrossRef]
- Shi, X.; Chen, Y.; Cheng, Q. Environmental Regulation, Environmental Knowledge Spillover, and Regional Economic Growth in China: An Empirical Test Based on the Spatial Durbin Model. Sustainability 2022, 14, 14260. [Google Scholar] [CrossRef]
- Prokopyev, M.G. The relationship of emissions into the air and the level of GDP (decoupling effect). Mark. Econ. Probl. 2020, 2, 76–84. [Google Scholar] [CrossRef]
- Anikina, I.D.; Anikin, A.A. Assessment of the Decoupling Effect Based on the Regions of the Southern Federal District. Regional Economy. South Russia 2019, 7, 138–147. [Google Scholar] [CrossRef]
- Zabeline, I.A. Decoupling in environmental and economic development of regions-participants of crossborder cooperation. Econ. Soc. Chang. Facts Trends Forecast 2019, 12, 241–255. [Google Scholar] [CrossRef]
- Kirillov, S.; Pakina, A.; Tulskaya, N. Evaluation of development sustainability at the regional level: The case of Tatarstan republic. Science Journal of VolSU. Glob. Econ. Syst. 2017, 19, 127–137. [Google Scholar] [CrossRef]
- Kozhevnikov, S.A.; Lebedeva, M.A. Problems of transition to green economy in the region (based on materials of the European North of Russia). Probl. Territ. Dev. 2019, 4, 72–88. [Google Scholar] [CrossRef]
- Lubsanova, N.B.; Maksanova, L.B.-Z.; Eremko, Z.S.; Bardakhanova, T.B.; Mikheeva, A.S. The Eco-Efficiency of Russian Regions in North Asia: Their Green Direction of Regional Development. Sustainability 2022, 14, 12776. [Google Scholar] [CrossRef]
- Green Growth Course. Resume for decision makers. In Organisation for Economic Co-Operation and Development; 2011; Available online: https://www.oecd.org/greengrowth/48634082.pdf (accessed on 10 November 2021).
- International Resource Panel; United Nations Environmental Programme. Global Resources Outlook 2019: Natural Resources for the Future We Want: A Report of the International Resource Panel; International Resource Panel: Nairobi, Kenya, 2019. [Google Scholar]
- ITS 16-2016; Mining Industry. General Processes and Methods/Information and Technical Guide to Best Available Techniques. 2016; Volume 16, pp. 110–111. Available online: https://docs.cntd.ru/document/1200143287 (accessed on 10 December 2022).
- Industrial Production in Russia. 2021: Statistical Compendium. Rosstat. 2021. Available online: https://rosstat.gov.ru/storage/mediabank/Prom_proiz-vo_2021.pdf (accessed on 10 December 2022).
- Kirchherr, J.; Reike, D.; Hekkert, M. Conceptualizing the circular economy: An analysis of 114 definitions. Resour. Conserv. Recycl. 2017, 127, 221–232. [Google Scholar] [CrossRef]
- Tretyakov, O.V.; Mazein, I.I.; Usenkov, A.V.; Mazein, N.I.; Tretyakov, A.V.; Ilyushin, P.Y.; Lekomtsev, A.V.; Stepanenko, I.B.; Burtsev, A.S.; Zhigarev, D.B.; et al. Block-Type Cluster Separation. No. 2741296. 25 January 2021. Available online: https://www.fips.ru/iiss/document.xhtml?faces-redirect=true&id=89cfd963a6b2ab9abc834053d3bb17b9 (accessed on 24 February 2023).
- Borisov, G.K.; Shayakberov, V.F.; Gazimov, M.K.; Borisov, K.B.; Mostoboev, A.V. Substantiation of the possibility of using the cluster water discharge technology at the Novo-Kievskoye field. Oilfield Bus. 2011, 12, 46–51. [Google Scholar]
- Liu, H.; Gao, Y.; Pei, X.; Zheng, G.; Zheng, L. Progress and prospect of downhole cyclone oil-water separation with single-well injectionproduction technology. Shiyou Xuebao/Acta Pet. Sin. 2018, 39, 463–471. [Google Scholar]
- Lu, Y.; Li, Z.; Hailu, G.; Xu, D.; Wu, H.; Kang, W. Study on the oil/water separation performance of a superhydrophobic copper mesh under downhole conditions. J. Ind. Eng. Chem. 2019, 72, 310–318. [Google Scholar] [CrossRef]
- Tikhonova, T.V. Environmental assessment of economic growth in the northern region. Econ. Soc. Chang. Facts Trends Forecast 2018, 11, 162–178. [Google Scholar] [CrossRef]


| Designation | Indicators | Applied Assessment Methods |
|---|---|---|
| E1 | Generated production and consumption waste by type of economic activity “Mining”, million tons. | Impact decoupling, modified model of “color” of economic growth |
| E2 | Discharge of polluted wastewater into surface water bodies by type of economic activity “Mining”, million cubic meters. | |
| E3 | Emissions into the atmosphere of pollutants from stationary sources by type of economic activity “Mining”, thousand tons. | |
| E4 | Electricity consumption by type of economic activity “Mining”, million kilowatt-hours. | Resource decoupling, modified model of “color” of economic growth |
| E5 | Water intake from natural water bodies by type of economic activity “Mining”, million cubic meters. |
| Designation | Indicators | Applied Assessment Methods |
|---|---|---|
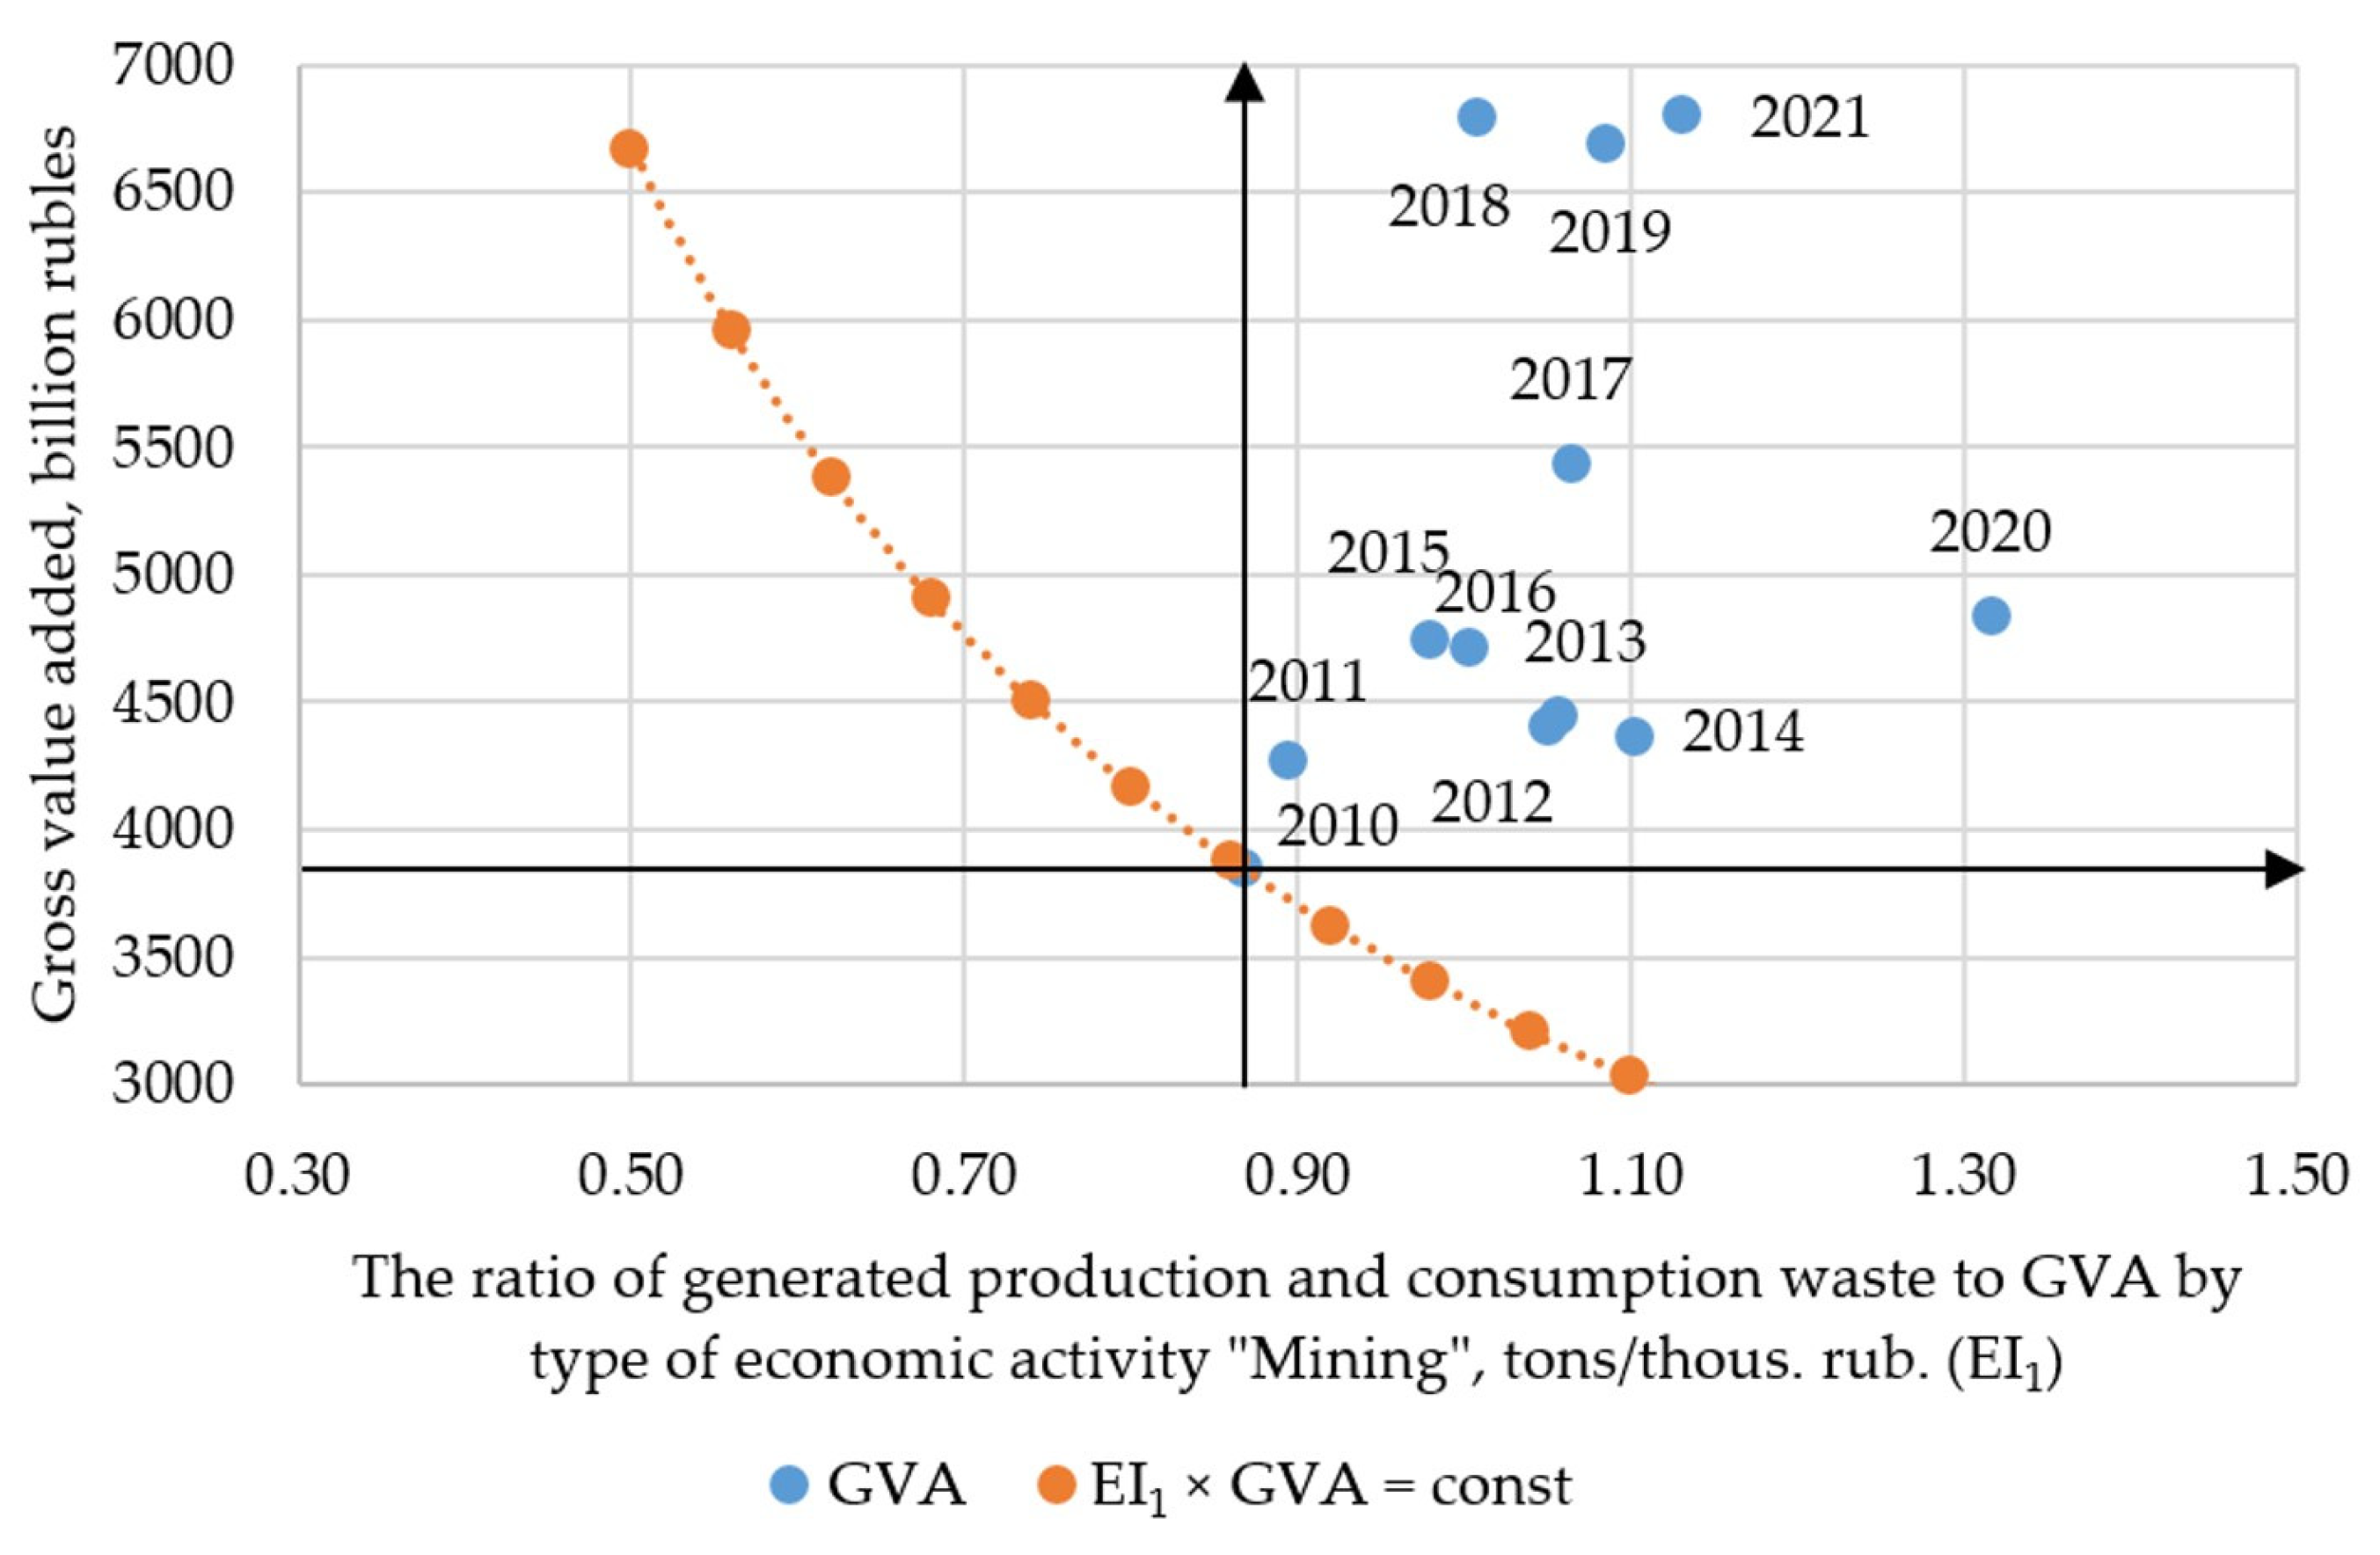
| EI1 | The ratio of generated production and consumption waste by type of economic activity “Mining” to GVA in this industry, tons/RUB 1000. | Impact decoupling, modified model of “color” of economic growth |
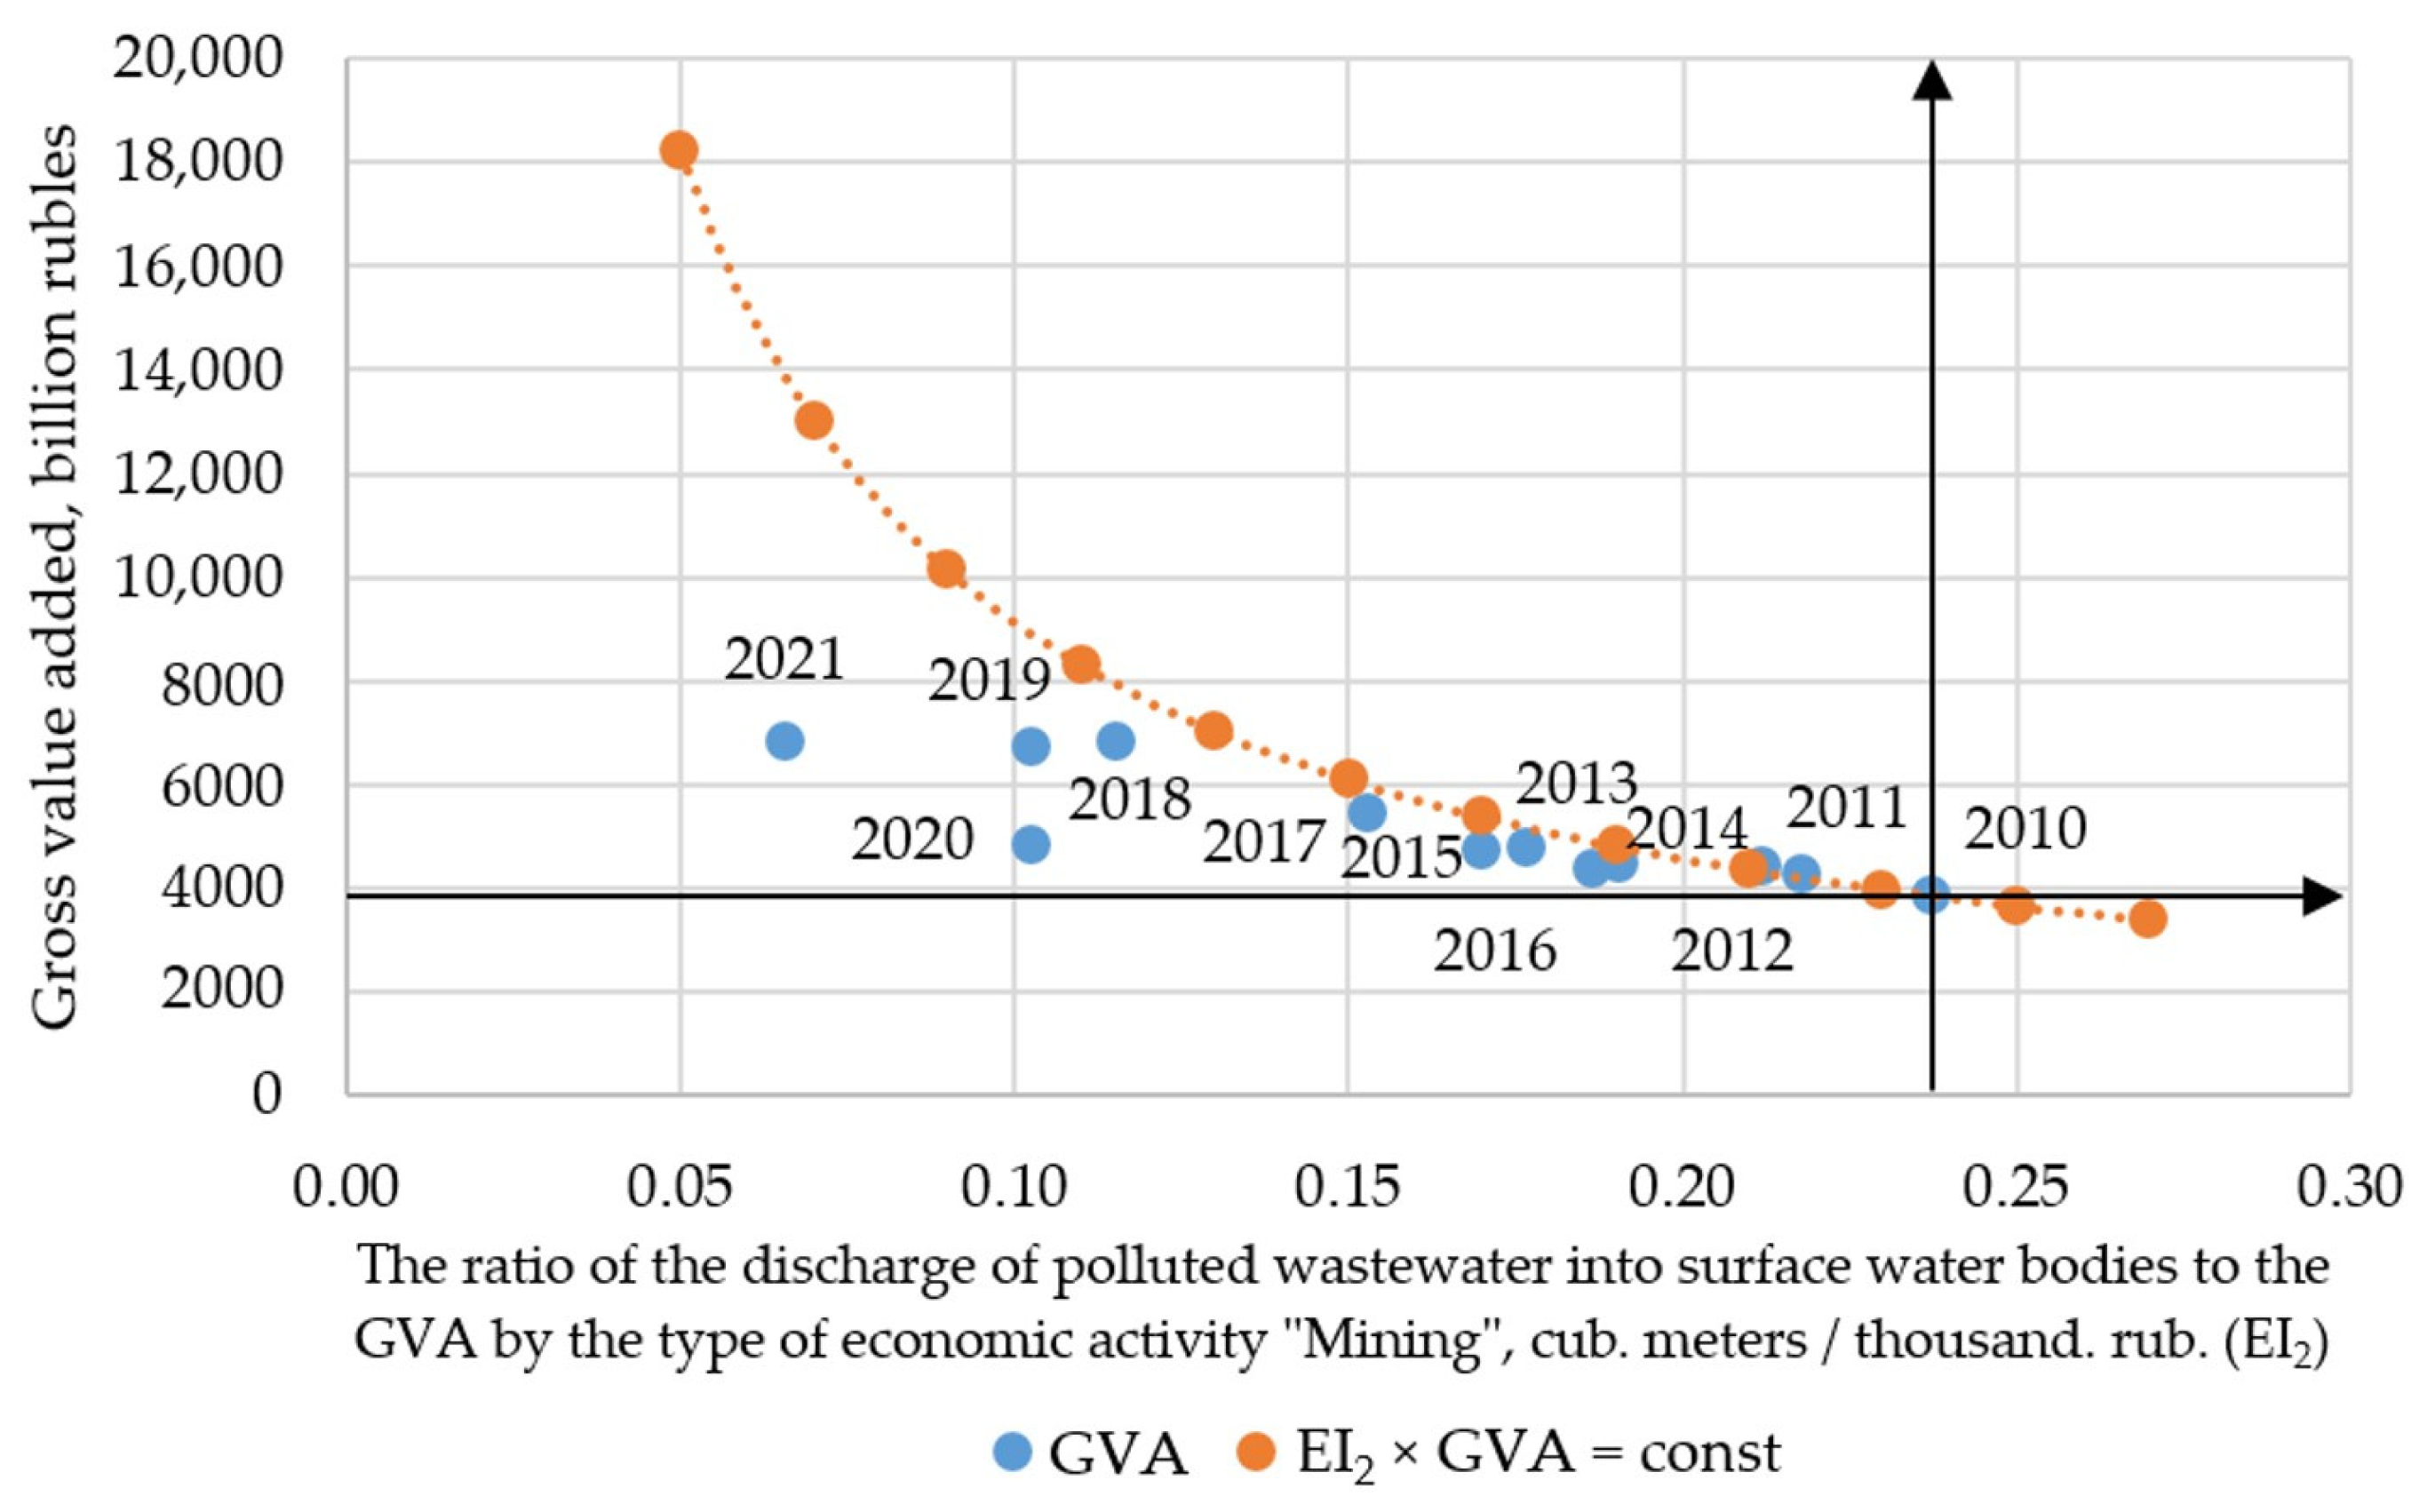
| EI2 | The ratio of the discharge of polluted wastewater into surface water bodies by type of economic activity “Mining” to the GVA in this industry, cubic meters/RUB 1000. | |
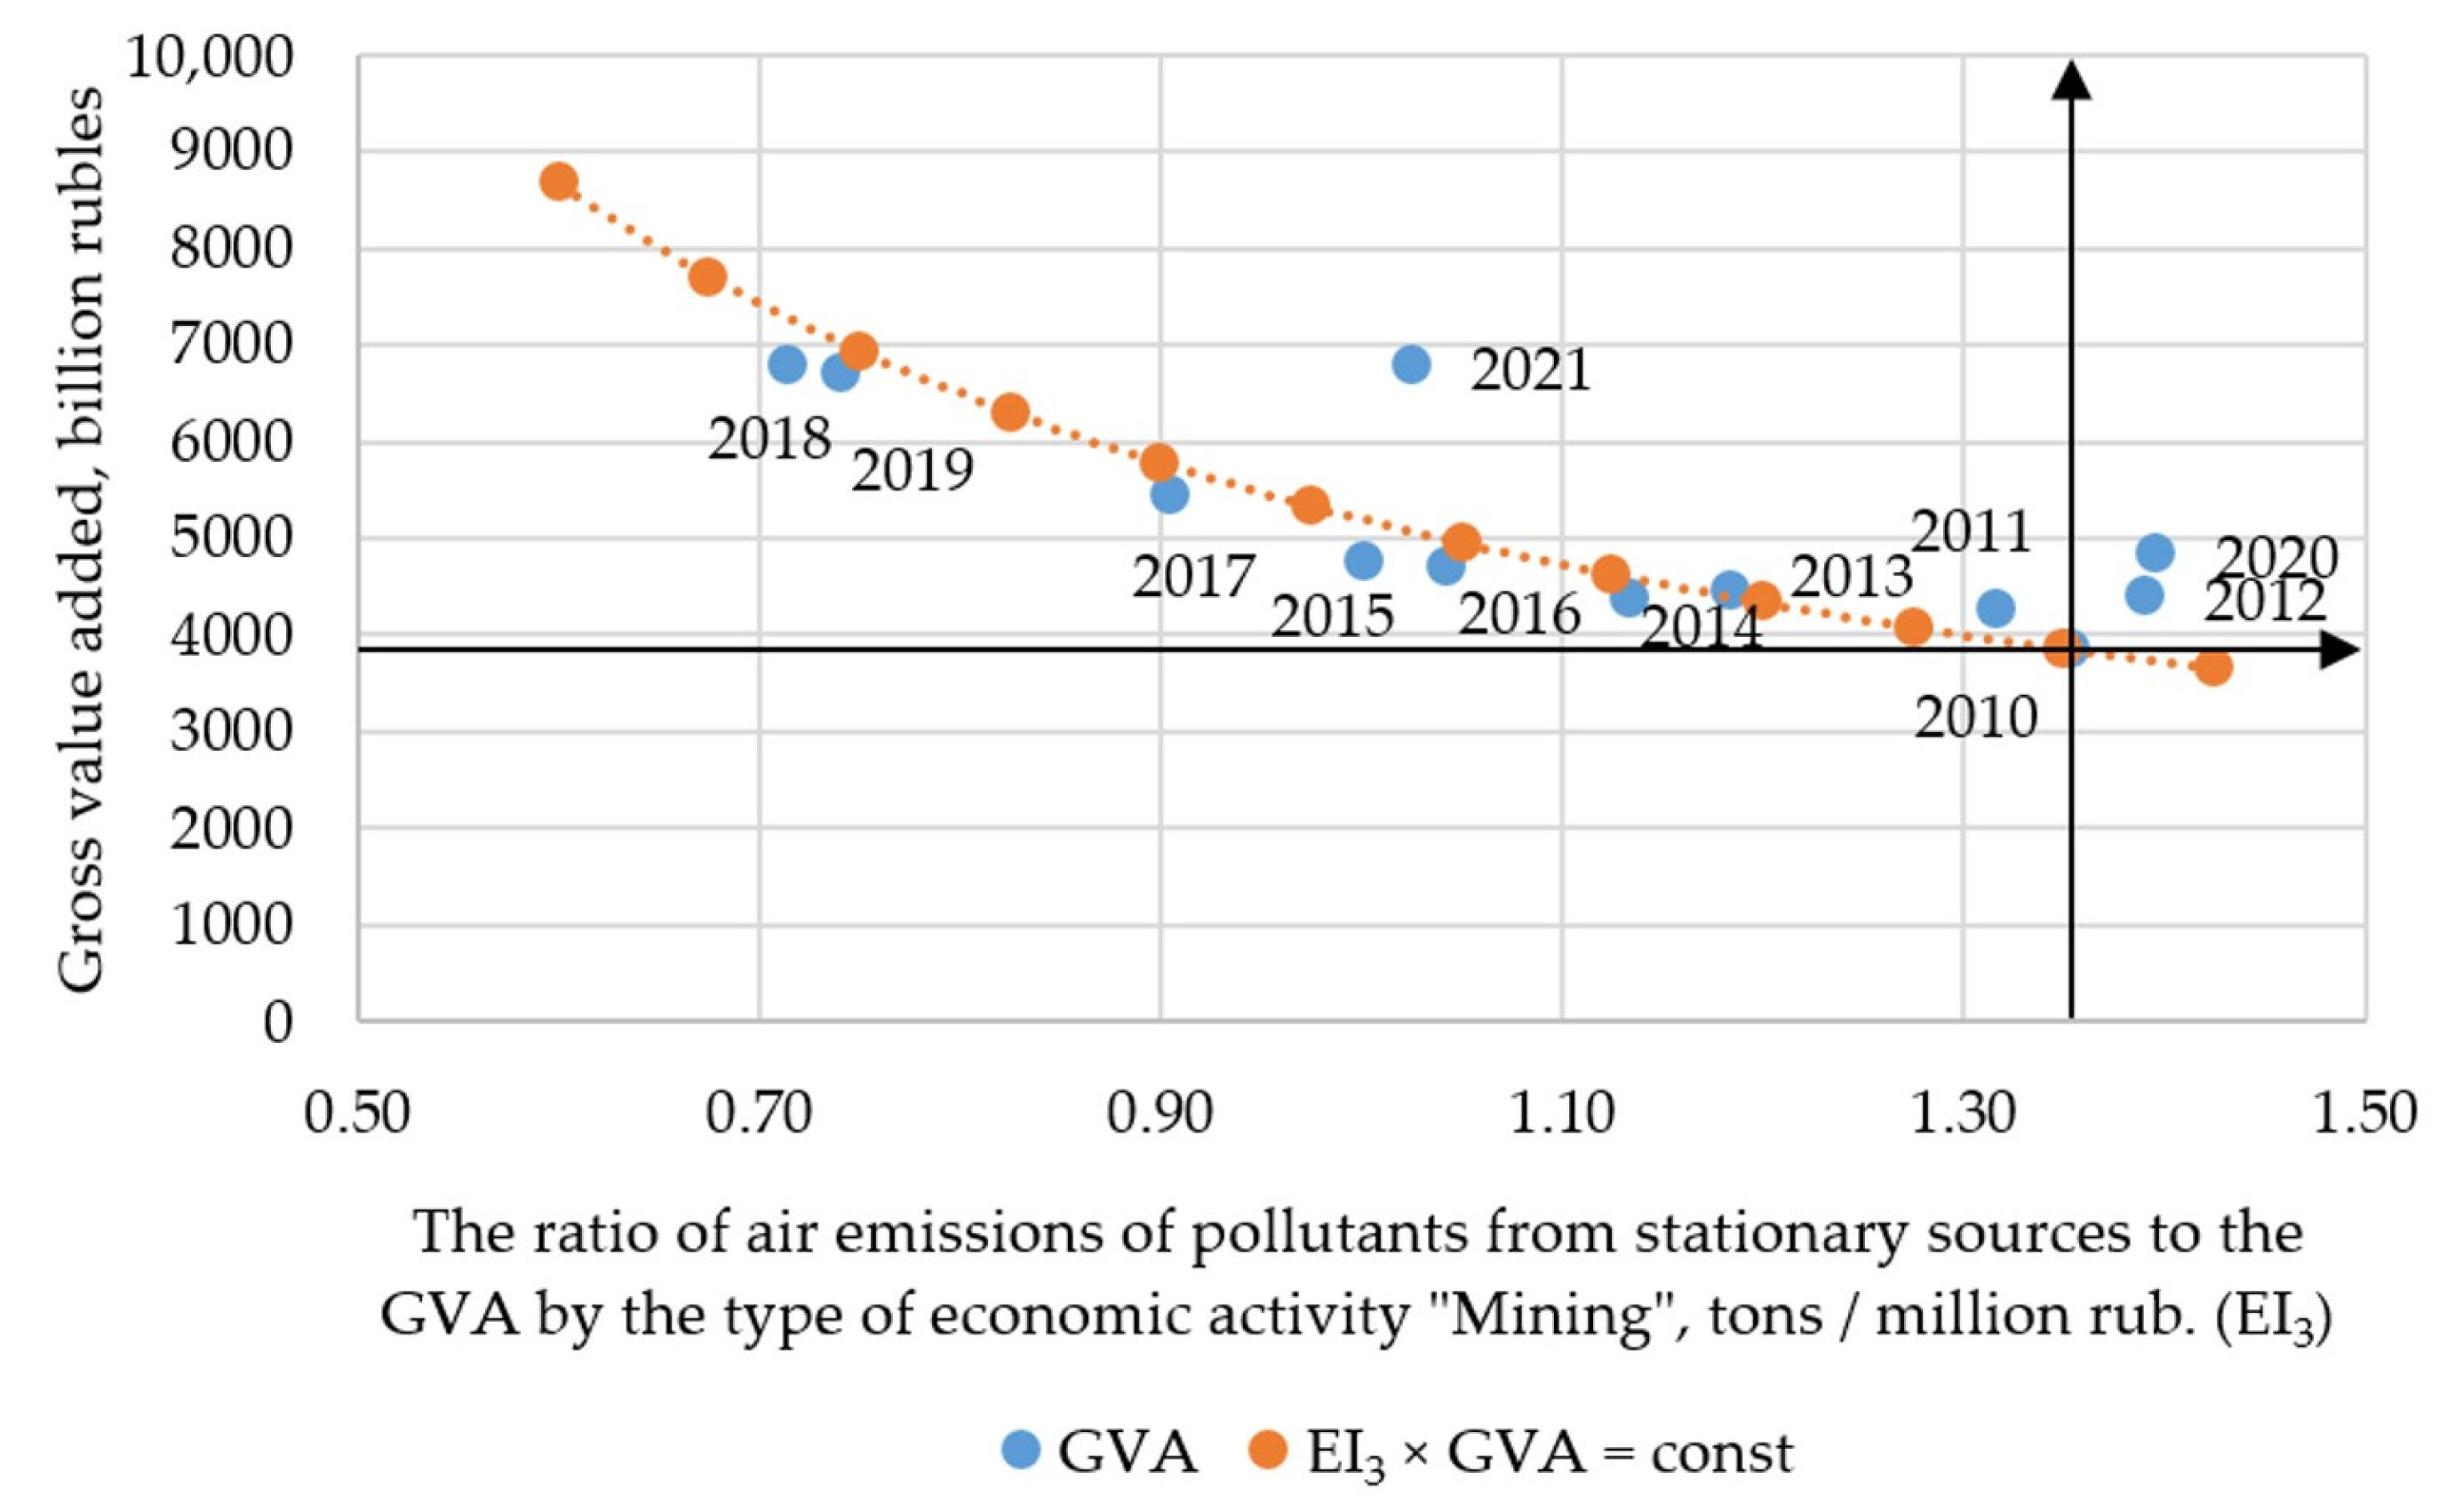
| EI3 | The ratio of air emissions of pollutants from stationary sources by type of economic activity “Mining” to the GVA in this industry, tons/RUB 1,000,000. | |
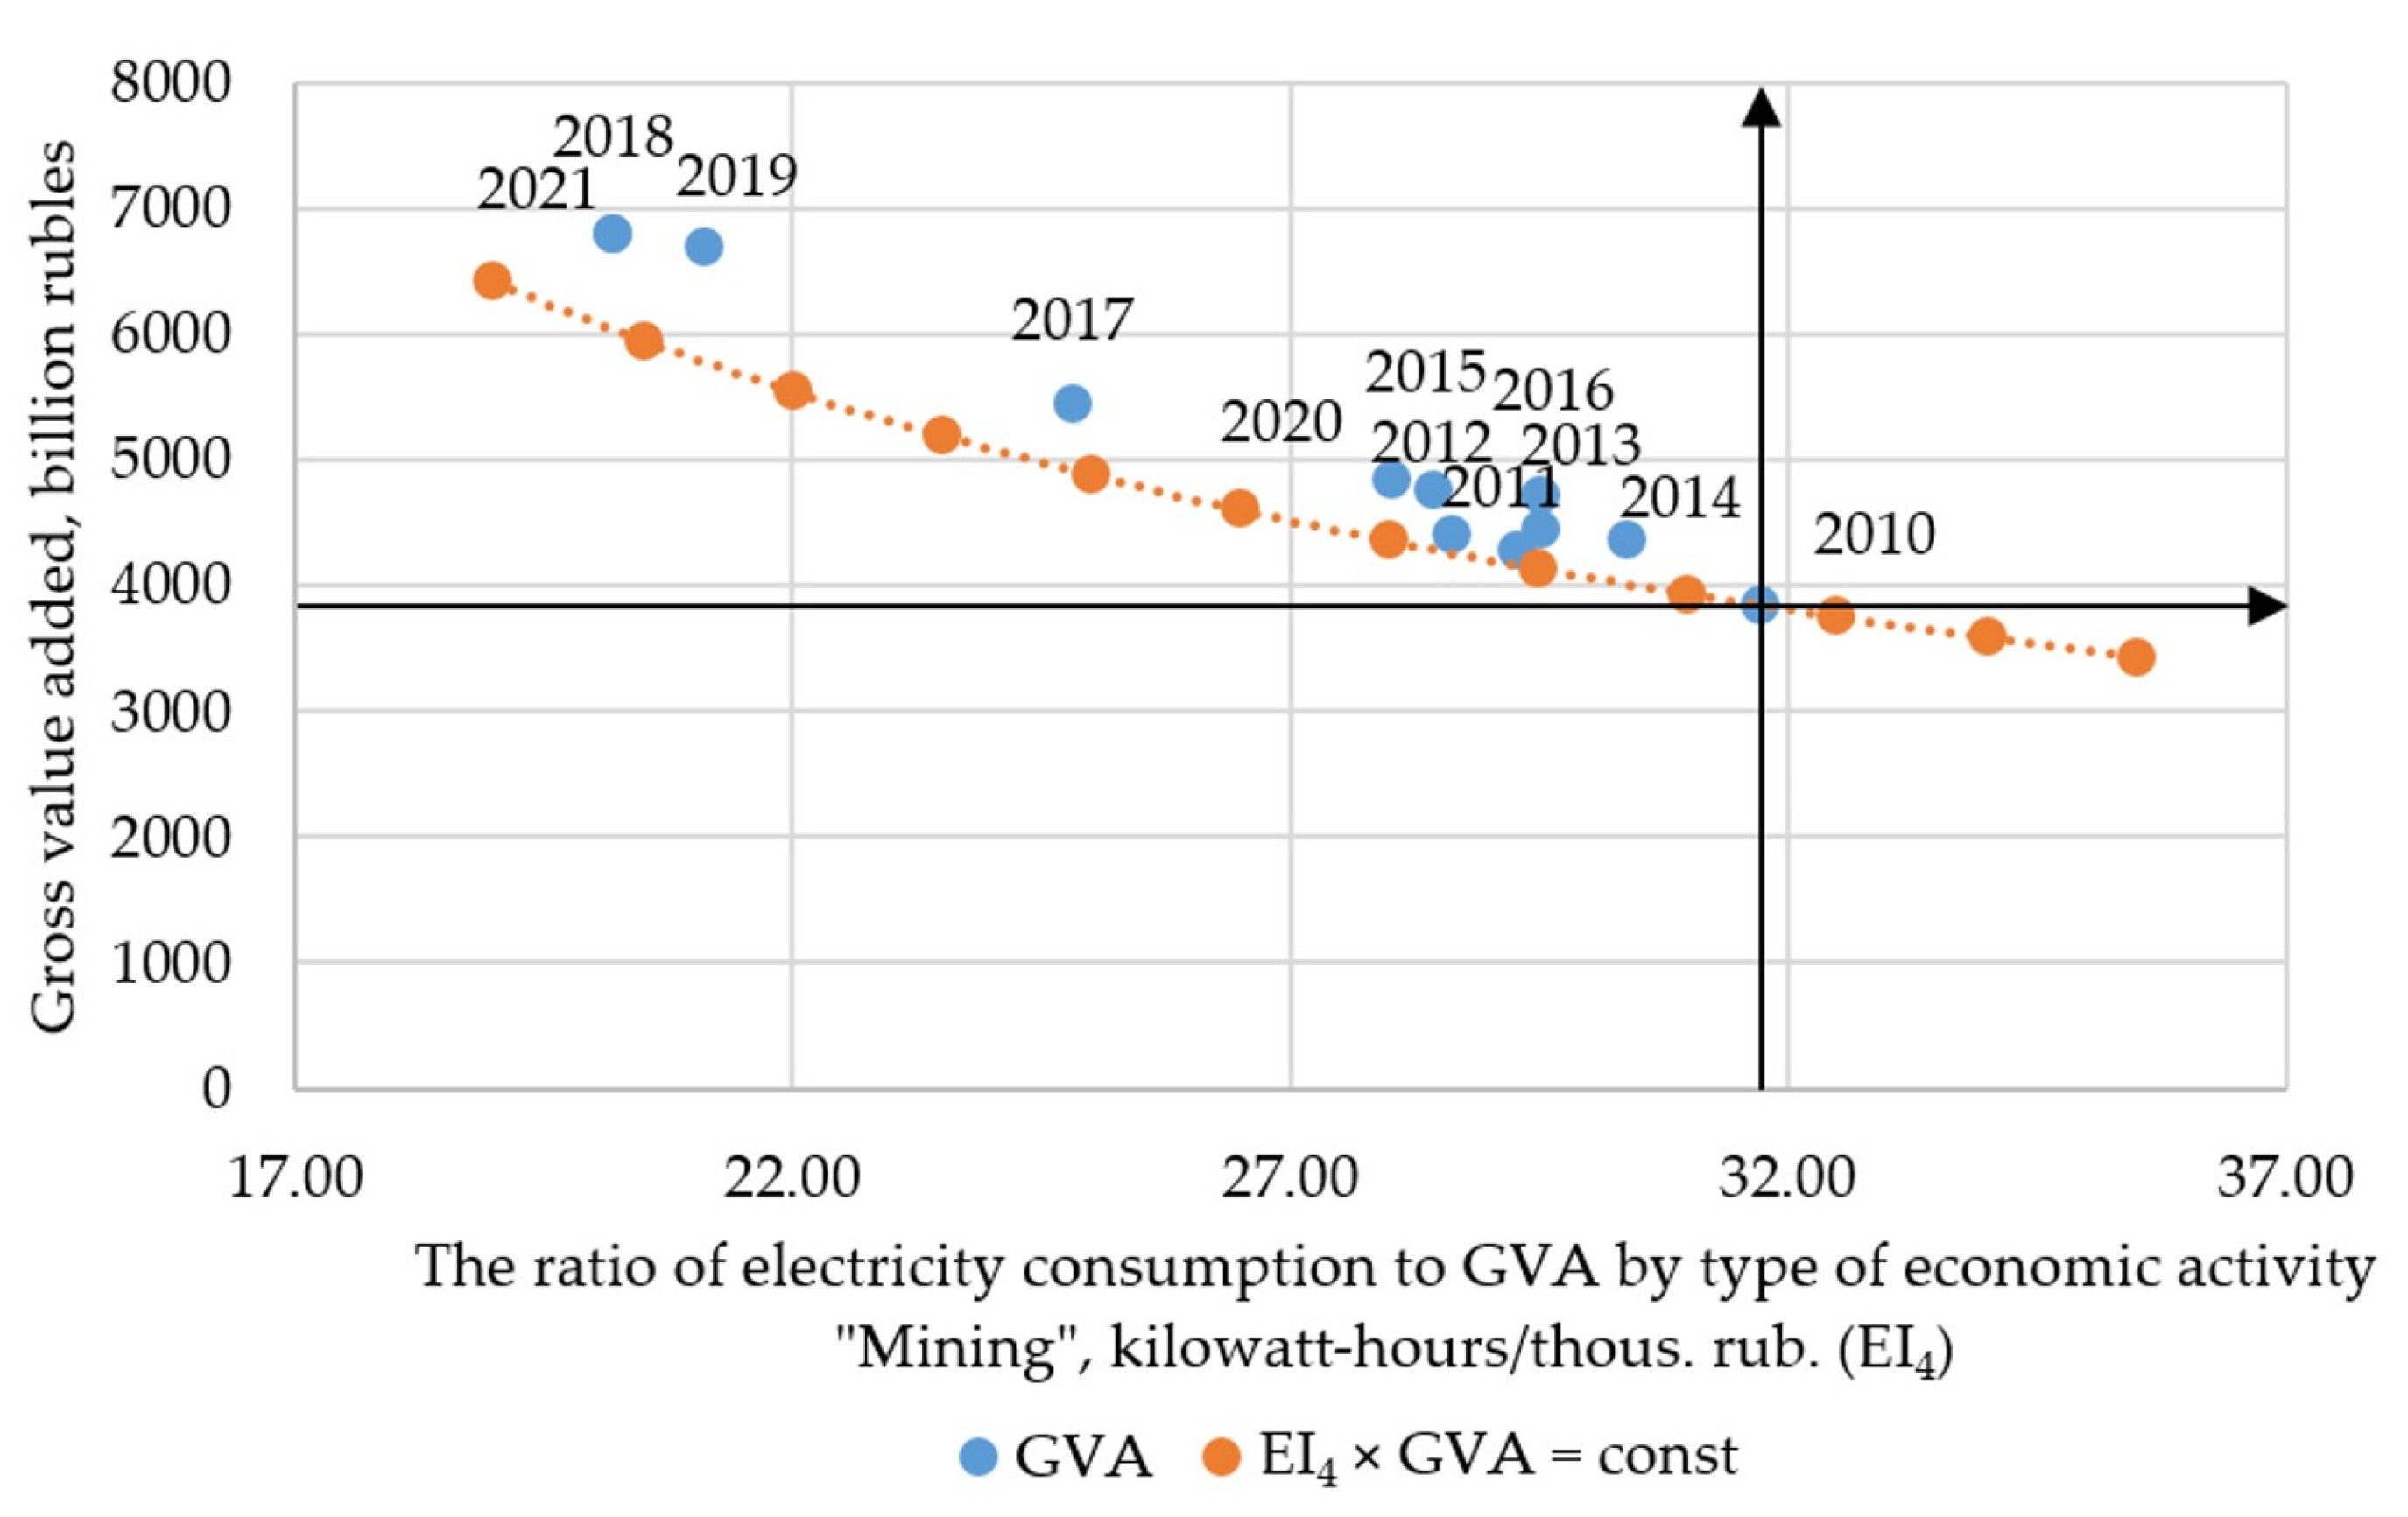
| EI4 | The ratio of electricity consumption by type of economic activity “Mining” to the GVA in this industry, kilowatt-hours/RUB 1000. | Resource decoupling, modified model of “color” of economic growth |
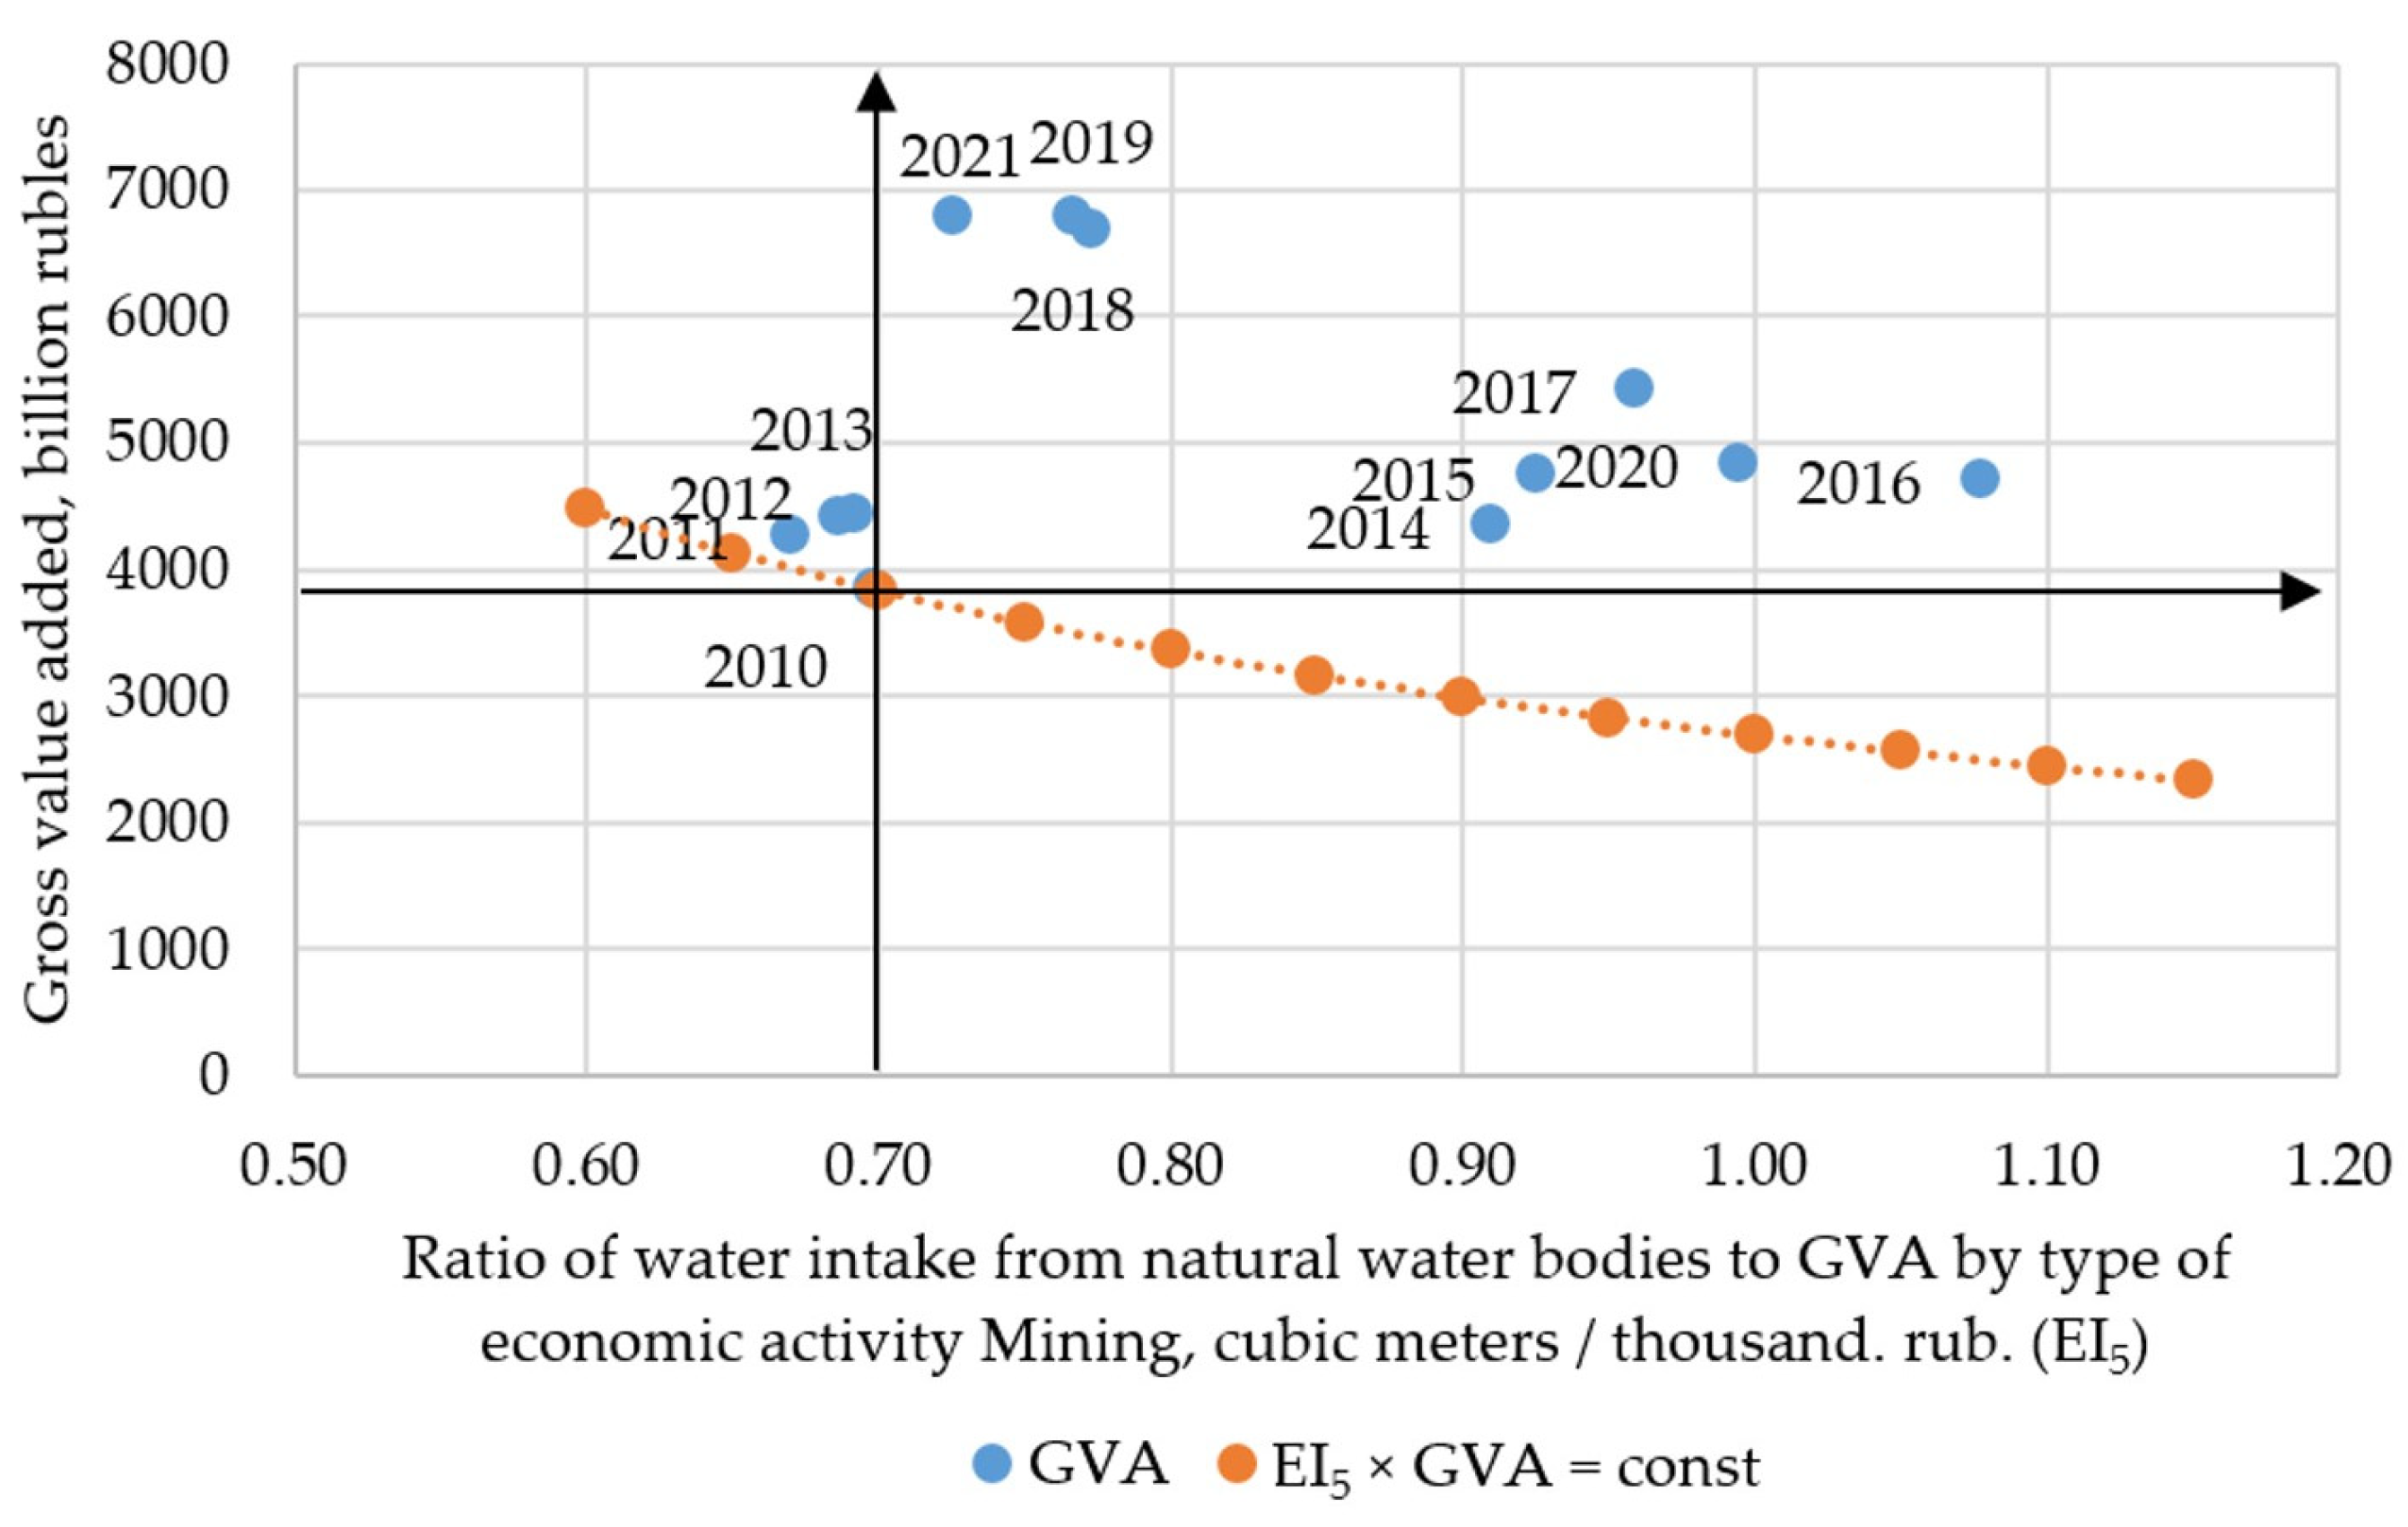
| EI5 | Ratio of water intake from natural water bodies by type of economic activity “Mining” to the GVA in this industry, cubic meters/RUB 1000. |
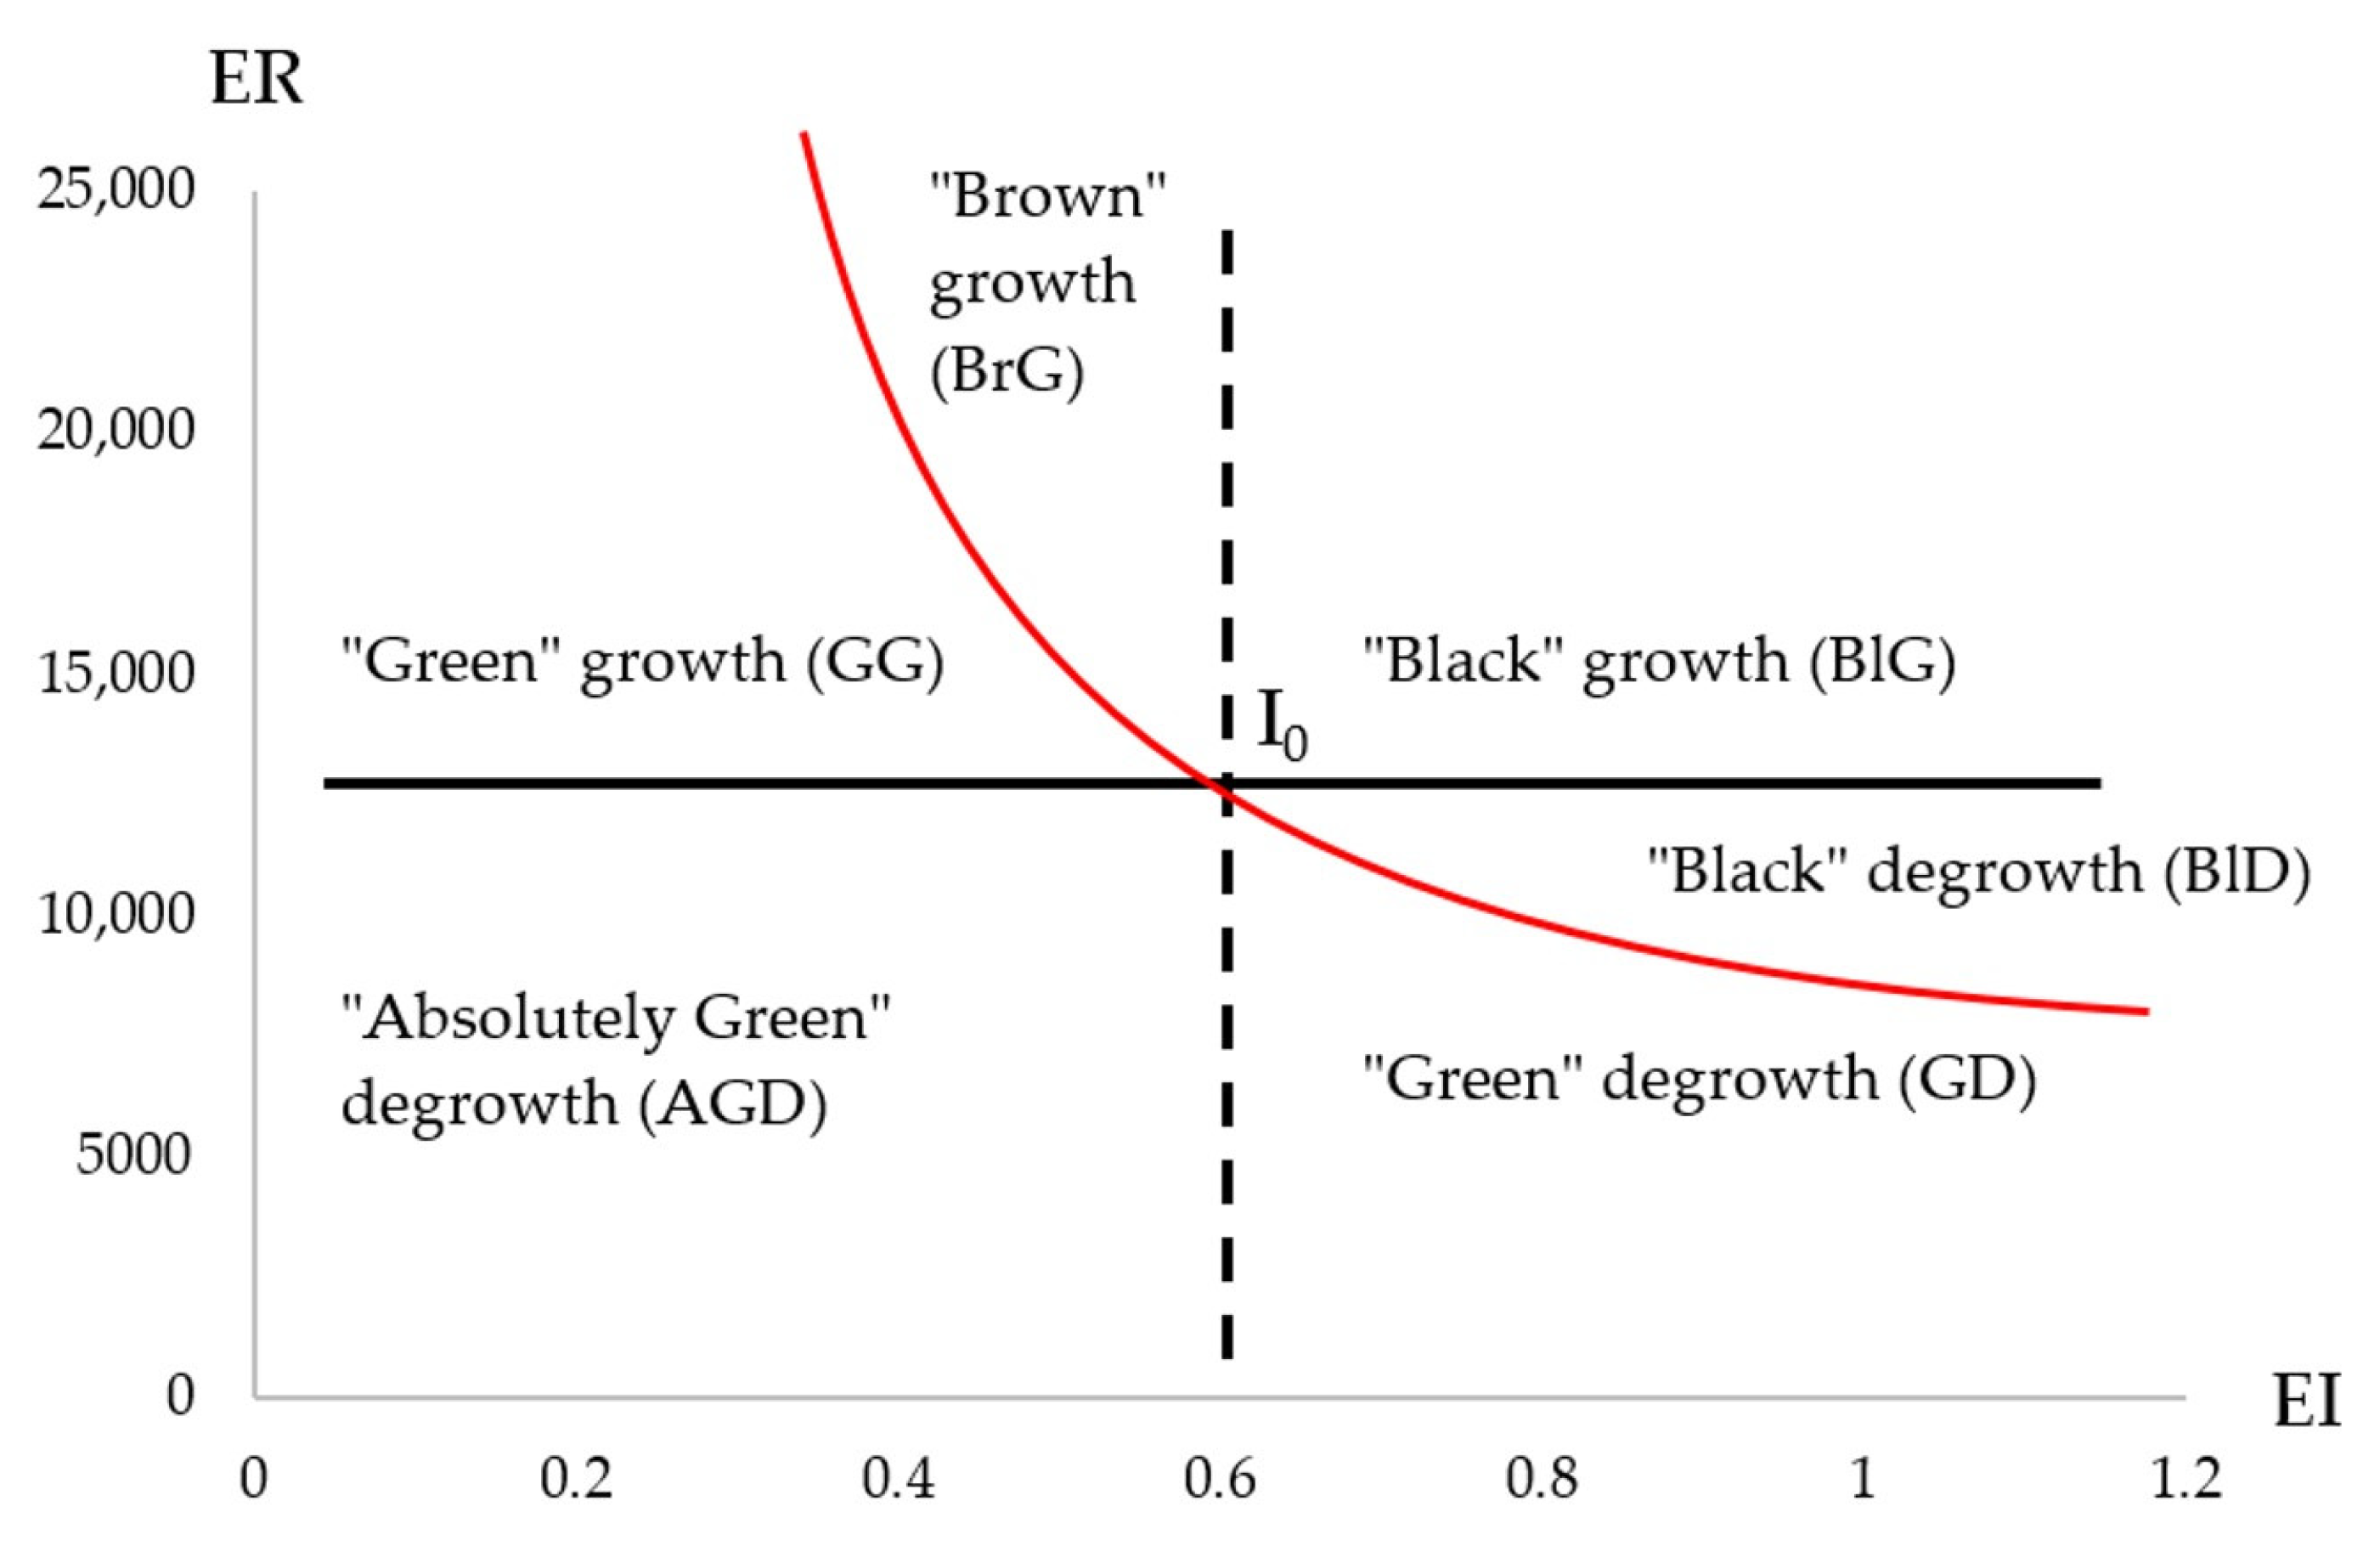
| Eco-Economic Zones in the Concept of “Green Growth” | Change of Indicator ER | Change of Indicator Ei | Change of Indicator EIi |
|---|---|---|---|
| “Green” growth (GG) | increase | decline | decline |
| “Green” degrowth (GD) | decline | decline | increase |
| “Absolutely Green” degrowth (AGD) | decline | decline | decline |
| “Brown” growth (BrG) | increase | increase | decline |
| “Black” growth (BlG) | increase | increase | increase |
| “Black” degrowth (BlD) | decline | increase | increase |
| Groups of Factors | Independent Variable | Definition |
|---|---|---|
| Financing of environmental measures | OpexWater | Operating costs for wastewater collection and treatment, RUB 1,000,000. |
| CapexWater | Investments in fixed assets aimed at the protection and rational use of water resources, RUB 1,000,000. | |
| CapexProtect | Investments in fixed assets aimed at environmental protection and rational use of natural resources, RUB 1,000,000,000. | |
| Innovative activity level of mining industry | Innov | The share of organizations implementing technological innovations. |
| AdvTechn | The number of advanced production technologies. | |
| RND | Research and development costs, RUB 1,000,000. | |
| Quality of management | Right | The imperfection of the regulatory framework, the proportion of respondents who noted this factor as limiting the activities of the mining organization. |
| Worker | The lack of skilled workers, the proportion of respondents who noted this factor as limiting the activities of the mining organization. | |
| Salary | Average monthly salary of mining industry workers, in RUB. | |
| Cirlul | The volume of circulating and re-sequential water supply, billion cubic meters. | |
| Quality of the fixed assets | AgeEq | Average age of machinery and equipment, years. |
| Capex | Investments in fixed assets, RUB 1,000,000. |
| Designation | Indicators | Applied Assessment Methods |
|---|---|---|
| E6 | Electricity consumption costs, RUB 1000. | Resource decoupling, modified model of “color” of economic growth |
| E7 | The cost of collecting and transporting water, RUB 1000. | |
| EI6 | Electricity consumption costs per unit of economic result (EBITDA), in RUB. | |
| EI7 | Water collection and transportation costs per unit of economic result (EBITDA), in RUB. |
| Year | DI1 | Decoupling Type | DI2 | Decoupling Type | DI3 | Decoupling Type |
|---|---|---|---|---|---|---|
| 2011 | 1.32 | Negative Expansion Decoupling | 0.17 | Weak decoupling | 0.73 | Weak Decoupling |
| 2012 | 2.64 | Negative Expansion Decoupling | 0.17 | Weak decoupling | 1.22 | Negative Expansion Decoupling |
| 2013 | 2.61 | Negative Expansion Decoupling | −0.44 | Strong Decoupling | 0.08 | Weak Decoupling |
| 2014 | 3.28 | Negative Expansion Decoupling | −0.80 | Strong Decoupling | −0.37 | Strong Decoupling |
| 2015 | 1.68 | Negative Expansion Decoupling | −0.34 | Strong Decoupling | −0.36 | Strong Decoupling |
| 2016 | 1.85 | Negative Expansion Decoupling | −0.54 | Strong Decoupling | −0.25 | Strong Decoupling |
| 2017 | 1.77 | Negative Expansion Decoupling | −0.21 | Strong Decoupling | −0.13 | Strong Decoupling |
| 2018 | 1.37 | Negative Expansion Decoupling | −0.18 | Strong Decoupling | −0.09 | Strong Decoupling |
| 2019 | 1.59 | Negative Expansion Decoupling | −0.33 | Strong Decoupling | −0.06 | Strong Decoupling |
| 2020 | 3.51 | Negative Expansion Decoupling | −1.76 | Strong Decoupling | 1.15 | Negative Expansion Decoupling |
| 2021 | 1.70 | Negative Expansion Decoupling | −0.66 | Strong Decoupling | 0.44 | Weak Decoupling |
| Year | DI4 | Decoupling Type | DI5 | Decoupling Type |
|---|---|---|---|---|
| 2011 | 0.22 | Weak Decoupling | 0.59 | Weak Decoupling |
| 2012 | 0.24 | Weak Decoupling | 0.87 | Expansion Coupling |
| 2013 | 0.49 | Weak Decoupling | 0.93 | Expansion Coupling |
| 2014 | 0.64 | Weak Decoupling | 3.54 | Negative Expansion Decoupling |
| 2015 | 0.46 | Weak Decoupling | 2.70 | Negative Expansion Decoupling |
| 2016 | 0.62 | Weak Decoupling | 3.95 | Negative Expansion Decoupling |
| 2017 | 0.26 | Weak Decoupling | 2.27 | Negative Expansion Decoupling |
| 2018 | 0.16 | Weak Decoupling | 1.22 | Negative Expansion Decoupling |
| 2019 | 0.21 | Weak Decoupling | 1.25 | Negative Expansion Decoupling |
| 2020 | 0.43 | Weak Decoupling | 3.06 | Negative Expansion Decoupling |
| 2021 | 0.16 | Weak Decoupling | 1.09 | Expansion Coupling |
| Variables | Mean | Median | Minimum | Maximum | Std. Dev. | Variation | Skewness | Kurtosis |
|---|---|---|---|---|---|---|---|---|
| EI4 | 26.818 | 28.536 | 20.20 | 31.716 | 4.143 | 0.154 | −0.727 | −1.044 |
| EI5 | 0.823 | 0.770 | 0.670 | 1.077 | 0.141 | 0.172 | 0.473 | −1.248 |
| OpexWater | 11,883.0 | 10,276.0 | 8787.6 | 17,441.0 | 3361.8 | 0.283 | 0.973 | −0.807 |
| CapexWater | 5210.5 | 5233.0 | 4076.1 | 6118.4 | 582.8 | 0.112 | −0.447 | −0.384 |
| CapexProtect | 21.453 | 20.190 | 15.602 | 40.629 | 6.920 | 0.323 | 1.968 | 3.076 |
| Innov | 10.949 | 10.574 | 9.000 | 13.088 | 1.432 | 0.131 | 0.153 | −1.497 |
| AdvTechn | 9997.9 | 9758.0 | 7914.0 | 13,062.0 | 1465.4 | 0.147 | 0.582 | −0.359 |
| RND | 0.330 | 0.054 | 0.023 | 1.216 | 0.493 | 1.495 | 1.143 | −0.640 |
| Right | 5.681 | 5.750 | 2.500 | 7.583 | 1.309 | 0.230 | −0.977 | 1.113 |
| Worker | 15.167 | 14.500 | 10.000 | 21.500 | 3.737 | 0.246 | 0.350 | −1.030 |
| Salary | 69,001 | 66,816 | 39,895 | 103,473 | 20,540 | 0.298 | 0.237 | −1.145 |
| Cirlul | 140.14 | 140.55 | 126.98 | 145.720 | 4.902 | 0.035 | −1.565 | 2.478 |
| AgeEq | 8.058 | 8.050 | 7.200 | 8.900 | 0.425 | 0.053 | −0.046 | 0.433 |
| Capex | 1581.6 | 1568.5 | 1264.0 | 1820.5 | 178.060 | 0.113 | −0.367 | −0.960 |
| Variables | Coefficient | t-Statistics | p-Value |
|---|---|---|---|
| EI4 | |||
| Constant | 46.0675 | 17.640 | 0.000000109 *** |
| CapexProtect | −0.2009 | −2.678 | 0.0280 ** |
| AdvTechn | −0.0014 | −4.289 | 0.0027 *** |
| RND (Science) | −5.3455 | −3.354 | 0.0100 ** |
| R-squared (R2) | 0.8752 | F-Statistic | 63.3452 |
| Adjusted R-squared | 0.8284 | p-Value (F) | 6.45 × 10⁻⁶ |
| EI5 | |||
| Constant | 4.68010 | 6.602 | 0.0000991 *** |
| Innov | −0.0865 | −3.938 | 0.0034 *** |
| RND (Science) | −0.28590 | −2.523 | 0.0326 *** |
| R-squared (R2) | 0.4453 | F-Statistic | 7.8026 |
| Adjusted R-squared | 0.3220 | p-Value (F) | 1.08 × 10⁻² |
| Indicators | Before Project Implementation | After Project Implementation |
|---|---|---|
| Electricity costs, total, RUB 1000/month (E6) | 1181 | 742 |
| including: | ||
| electricity costs for the collection and transportation of liquid, RUB 1000/month | 982 | 727 |
| electricity costs for oil preparation, RUB 1000/month | 21 | 15 |
| electricity costs for artificial reservoir stimulation, RUB 1000/month | 178 | 0 |
| Pumping volume (oil and ballast water), m3/day | 439.7 | 325.7 |
| The volume of water to be injected into the formation | 114 | preparation at the well cluster |
| Water collection and transportation costs, RUB 1000/month (E7) | 976.13 | 723.05 |
| Indicators | Before Project Implementation | After Project Implementation |
|---|---|---|
| EI6, rub/rub | 0.022 | 0.014 |
| EI7, rub/rub | 0.0177 | 0.0128 |
| DI6 and (Decoupling Type) | - | −20.55 (Strong Decoupling) |
| DI7 and (Decoupling Type) | - | −14.44 (Strong Decoupling) |
| Color according to EI6 | - | «Green» growth (GG) |
| Color according to EI7 | - | «Green» growth (GG) |
Disclaimer/Publisher’s Note: The statements, opinions and data contained in all publications are solely those of the individual author(s) and contributor(s) and not of MDPI and/or the editor(s). MDPI and/or the editor(s) disclaim responsibility for any injury to people or property resulting from any ideas, methods, instructions or products referred to in the content. |
© 2023 by the authors. Licensee MDPI, Basel, Switzerland. This article is an open access article distributed under the terms and conditions of the Creative Commons Attribution (CC BY) license (https://creativecommons.org/licenses/by/4.0/).
Share and Cite
Elokhova, I.; Vyatkin, K.; Ilyushin, P.; Krutova, A.; Pepelyaeva, A.; Sliusar, N. Evaluating the Eco-Intensity Dynamics of the Mining Industry in Russia: Towards a Circular Economy. Recycling 2023, 8, 31. https://doi.org/10.3390/recycling8020031
Elokhova I, Vyatkin K, Ilyushin P, Krutova A, Pepelyaeva A, Sliusar N. Evaluating the Eco-Intensity Dynamics of the Mining Industry in Russia: Towards a Circular Economy. Recycling. 2023; 8(2):31. https://doi.org/10.3390/recycling8020031
Chicago/Turabian StyleElokhova, Irina, Kirill Vyatkin, Pavel Ilyushin, Aleksandra Krutova, Anna Pepelyaeva, and Natalia Sliusar. 2023. "Evaluating the Eco-Intensity Dynamics of the Mining Industry in Russia: Towards a Circular Economy" Recycling 8, no. 2: 31. https://doi.org/10.3390/recycling8020031