
Mineral Carbonation of Basic Oxygen Furnace Slags


1
Chair of Waste Processing Technology and Waste Management, Montanuniversität Leoben, 8700 Leoben, Austria
2
Chair of Resource and Chemical Engineering, Augsburg University, 86135 Augsburg, Germany
3
Voestalpine Stahl Donawitz GmbH, 8700 Leoben, Austria
*
Author to whom correspondence should be addressed.
Recycling 2022, 7(6), 84; https://doi.org/10.3390/recycling7060084
Submission received: 30 September 2022
/
Revised: 31 October 2022
/
Accepted: 4 November 2022
/
Published: 7 November 2022
(This article belongs to the Special Issue Feature Papers in Recycling 2022)
Abstract
:Mineral carbonation is a method in carbon capture and utilization (CCU) in which carbon dioxide reacts with natural or synthetic mineral phases to form carbonates. In this study, BOF slag consisting of alite, Ca3SiO5, belite, Ca2SiO4, melilite, (Ca,Na)2(Mg,Al)[4][Si2O7], brownmillerite, Ca(Fe,Al)2O5, calcium ferrite, Ca2FeO4 and Ca-, Mg- and Mn-bearing wuestite, (Mg,Ca,Mn,Fe)O, was crushed into different particle size fractions and exposed over various durations (1 d, 3 d, 9 d, 14 d, 24 d) at a grate to 120 °C hot off-gas with a CO2 content of 25%. However, the total inorganic carbon (TIC) content never increases above the detection limit of 0.5% throughout the experimental duration. The determination of the carbonation depth using phenolphthalein does not reveal a homogeneous carbonation front, but an irregular carbonation. This observation was confirmed by microprobe analyses using elemental mapping. The solubility of the slag increases with increasing carbonation, e.g., the leachability of sulfate increases from 7.8 to 8270 mg/kg dry matter (DM), and of calcium from 940 to 3860 mg/kg DM. The leaching of environmentally relevant element varies: the leachable concentration of molybdenum increases from 0.017 mg/kg DM to 0.089 mg/kg DM, that of chromium remains constant (ca. 0.05 mg/kg DM) whereas that of vanadium decreases from 1.1 to 0.45 mg/kg. In summary, the chosen carbonation technology must be improved to enhance carbonate yield.
1. Introduction
The iron and steel industry faces the challenge of climate crisis by decreasing its CO2 emissions resulting from carbon-containing reduction agents and carbonate ores. Mineral carbonation removes CO2 from the atmosphere and traps it sustainably in stable mineral phases. If secondary resources are used for mineral carbonation which occur as wastes or by-products in industrial processes, this contributes to resource efficiency and decreases CO2 emissions which would result from the mining of primary resources. Carbonation of metallurgical slags has been investigated intensely [1]. Indirect processes allow for a higher yield but require a lot of effort [2]. Direct carbonation by a solid–gas reaction can be an alternative and yields a maximum CO2 binding of 88.5 kg CO2 per ton slag [3]. However, the actual carbonation yield depends on the experimental setup, since carbonates precipitate mainly at the grain boundaries and in the pores, and not in the bulk volume [4]. Flow-through reactors using CO2-H2O mixtures have been demonstrated to perform better than bulk reactors [5]. Using carbonated slag as construction material leads to the question of if carbonation influences the leaching of environmentally relevant elements. It has been shown that the dissolution of calcium vanadates due to carbonation increases the leachability of vanadium [6]. However, it is not clear if this process takes place in every slag and for every carbonation process. Therefore, the purpose of this work is to determine the carbonation degree as a function of reaction time and to reveal the effects of carbonation on leachability.
The suggested approach is highly interesting from a waste management and resource efficiency perspective: A solid residue, the steel slag, is used to react with a gaseous residue, the flue gas, to form a secondary raw material, calcium carbonate. Resource efficiency and climate production could be improved simultaneously, and complex equipment which would be required for indirect carbonation routes could be avoided. However, it is still under discussion if these benefits outweigh the disadvantages resulting from surface passivation. In this context, it has to be mentioned that the subsequent utilization of the slag for construction purposes is a key factor for the economic and ecological feasibility of the process. Therefore, the novelty of this study is to investigate in detail the carbonation progress in such a setup and to assess the effect of carbonation not only on carbon capture, but also on the mobility of contaminants.
2. Materials and Methods
2.1. Materials
Basic oxygen furnace (BOF) slag produced at voestalpine Stahl Donawitz GmbH were used for subsequent experiments. The chemical and mineralogical composition of BOF slags has been studied before by X-ray fluorescence analyses (XRF) and X-ray diffraction (XRD), respectively (Table 1 and Table 2).
Table 1 shows that CaO (36 wt.%), Fe2O3 (34 wt.%), SiO2 (15 wt.%), MnO (12 wt.%) and MgO (3 wt.%) are the main components of BOF slags which occur as larnite (β-Ca2SiO4), magnesiowuestite ((Fe,Mg,Mn,Ca)O), and brownmillerite (Ca(Al,Fe)2O5) according to Table 2. Compared to the chemical compositions given by a review publication [9], the Austrian BOF slags are slightly poorer in CaO and MgO, but richer in Fe2O3 and MnO. The differences result in the case of MnO from the different mixture of ores, in the case of MgO from different approaches balancing converter lifetime and resource efficiency, and in the case of CaO from different dephosphorization strategies. The FeO content results from the other factors. This means that chemical and mineralogical literature data from literature are consistent. Regarding carbonation, especially larnite, and eventually also the CaO and MgO bound to other mineral phases are significant. It remains unclear if the investigated samples contain free lime (CaO) or portlandite (Ca(OH)2) which have been found in BOF slags of the Linz plant [8].
2.2. Methods
2.2.1. Mineral Carbonation
The BOF slag was crushed and 4 kg of the fraction 10–80 mm was exposed to a 120 °C flue gas flow with a CO2 content of 25% over different durations (1 d, 3 d, 9 d, 14 d, 24 d). The flue gas used is the off-gas of the incineration of blast furnace gas from the same integrated plant which also produced the steel. The original material as well as samples taken after the given reaction times were characterized further.
2.2.2. Mineralogical Characterization
Representative pieces of individual samples were used for the production of polished sections at the Chair of Resource Mineralogy of Montanuniversität Leoben, Austria. The samples were embedded in epoxy resin, polished without water, and sputtered with carbon. The mineralogical analyses were conducted using the electron microprobe Superprobe JXA 8200 (JEOL, Freising, Germany) in the Eugen F. Stumpfl laboratory of the Chair of Resource Mineralogy. Areas of about 1 mm2 were selected for elemental mapping of carbon, aluminum, calcium, chromium, iron, oxygen, magnesium vanadium, phosphorous, manganese, silicon, sulfur, tungsten, and titanium to reveal the progress of carbonation and to determine the phase composition. Furthermore, energy-dispersive X-ray spectroscopy (EDX) was used for single-spot analyses of selected phases.
2.2.3. Chemical Characterization
The samples remaining after the removal of hand specimens for mineralogical analyses were processed for chemical analyses according to ÖNORM EN 15002 [10]. Processing included coarse comminution using a jaw crusher and fine comminution using a ball mill with a zirconium oxide container. The particle size after processing was <10 mm for the preparation of leaching tests and <0.5 mm for the chemical analyses. Homogenization was conducted using a hand shovel, and sample division by coning and quartering. The dry substance was determined according to ÖNORM EN 14346 (procedure A) [11], and the total inorganic carbon (TIC) by the Scheibler method according to ÖNORM L 1084 [12]. The carbonation depth was conducted using phenolphthalein according to ÖNORM EN 14360 [13]. Leaching tests were conducted according to ÖNORM EN 12457-4 [14] (100 g slag per 1 kg water, t = 24 h, solid–liquid separation by decanting for 15 min, centrifugation at 5500 min−1, filtration at 0.45 µm). The chemical composition of the leachate was determined based on ÖNORM EN ISO 17294 [15] semi-quantitatively. Additionally, anions in the leachate were determined according to DIN EN ISOI 10304-1 [16] and hexavalent chromium according to DIN 38405-24 [17].
3. Results and Discussion
3.1. Mineralogical Analyses
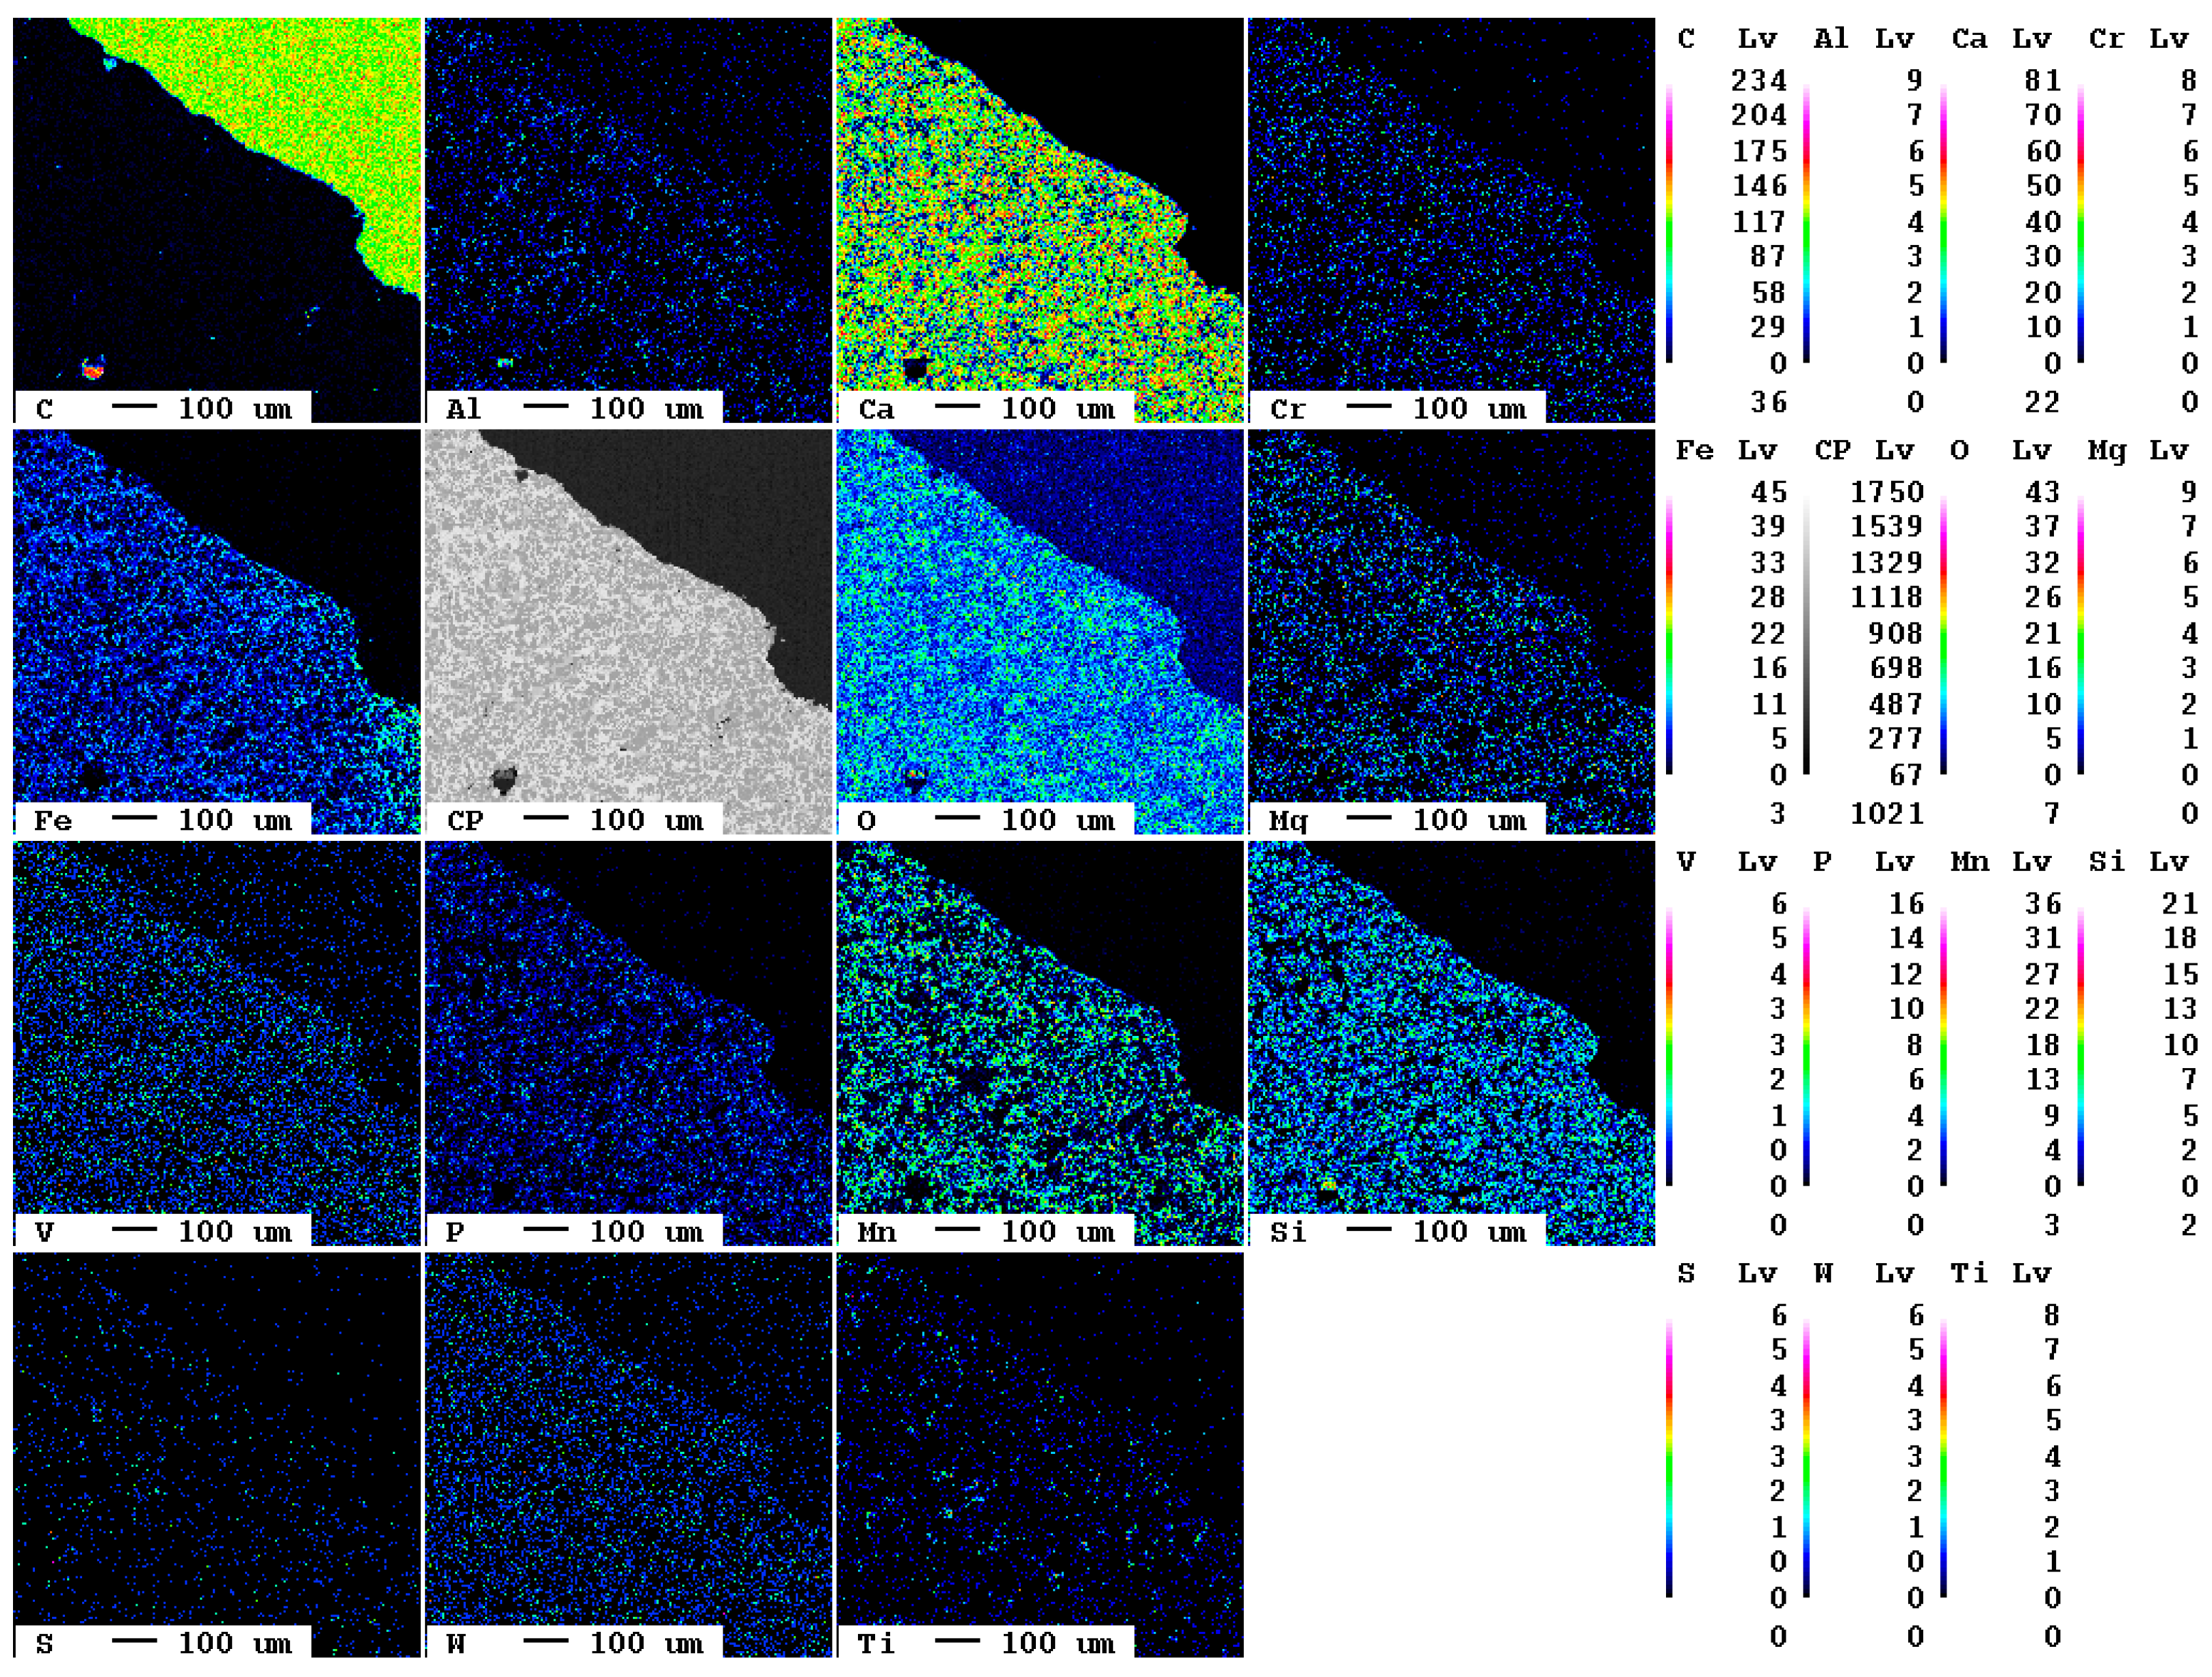
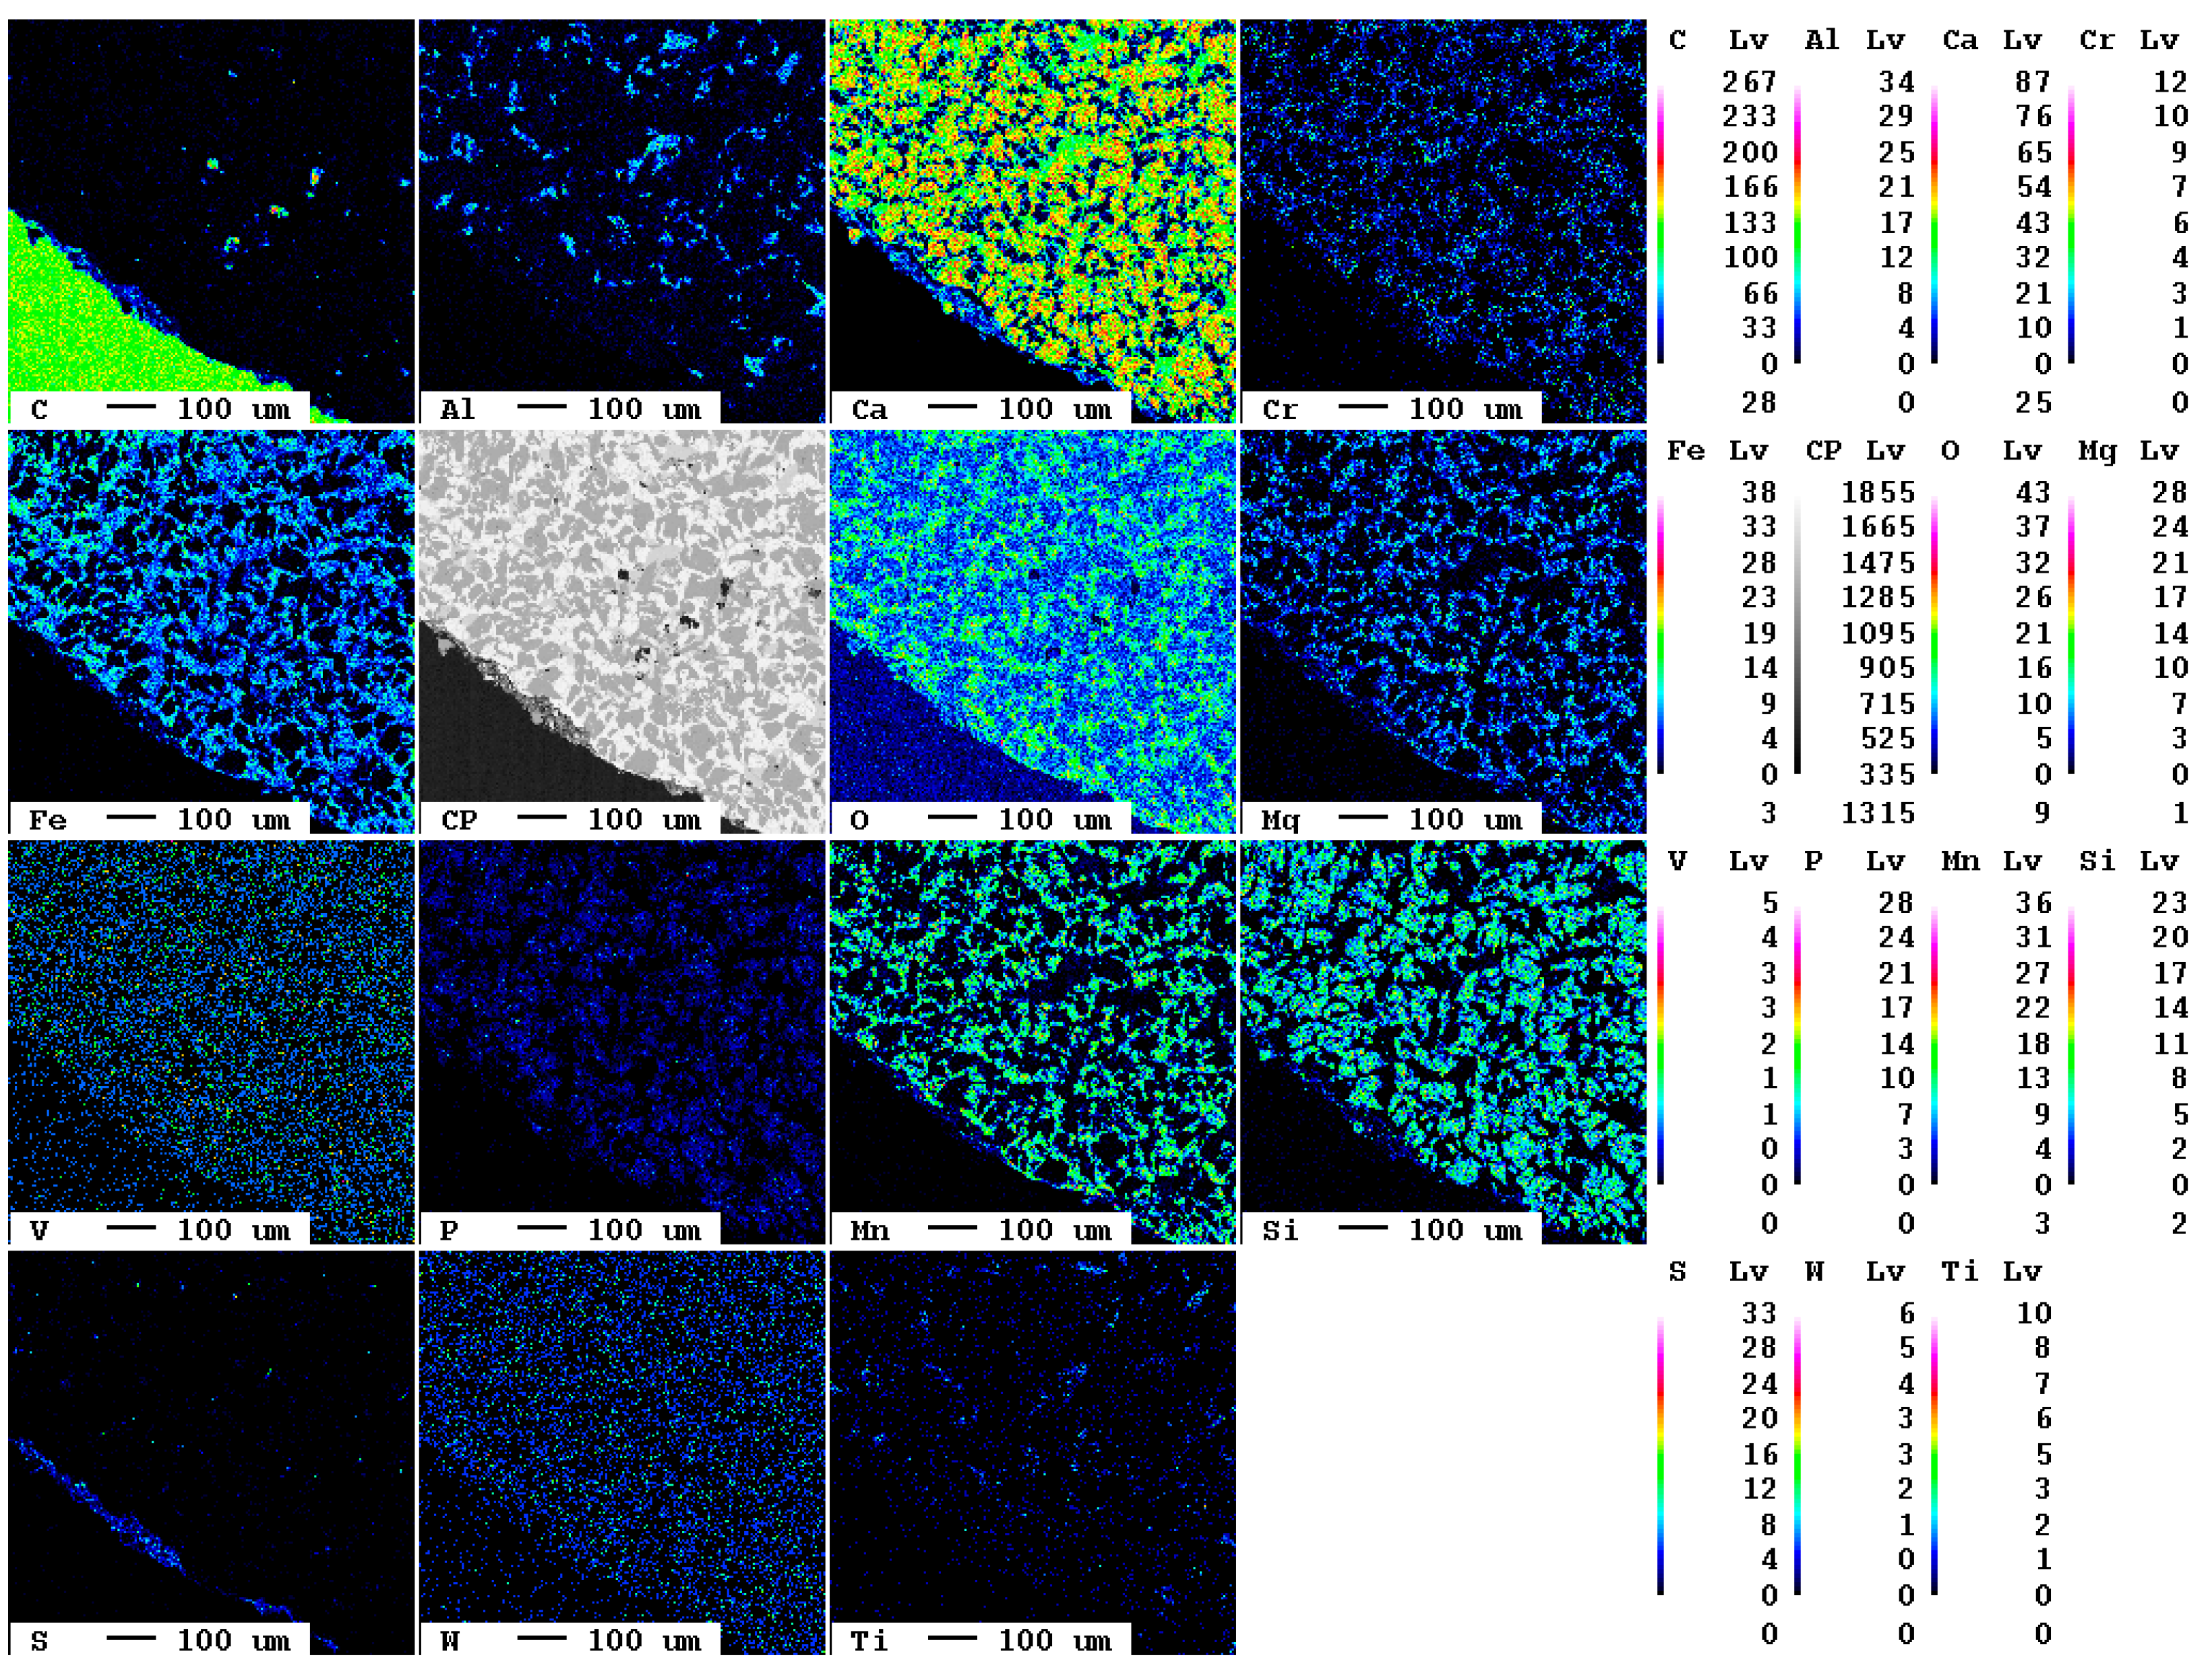
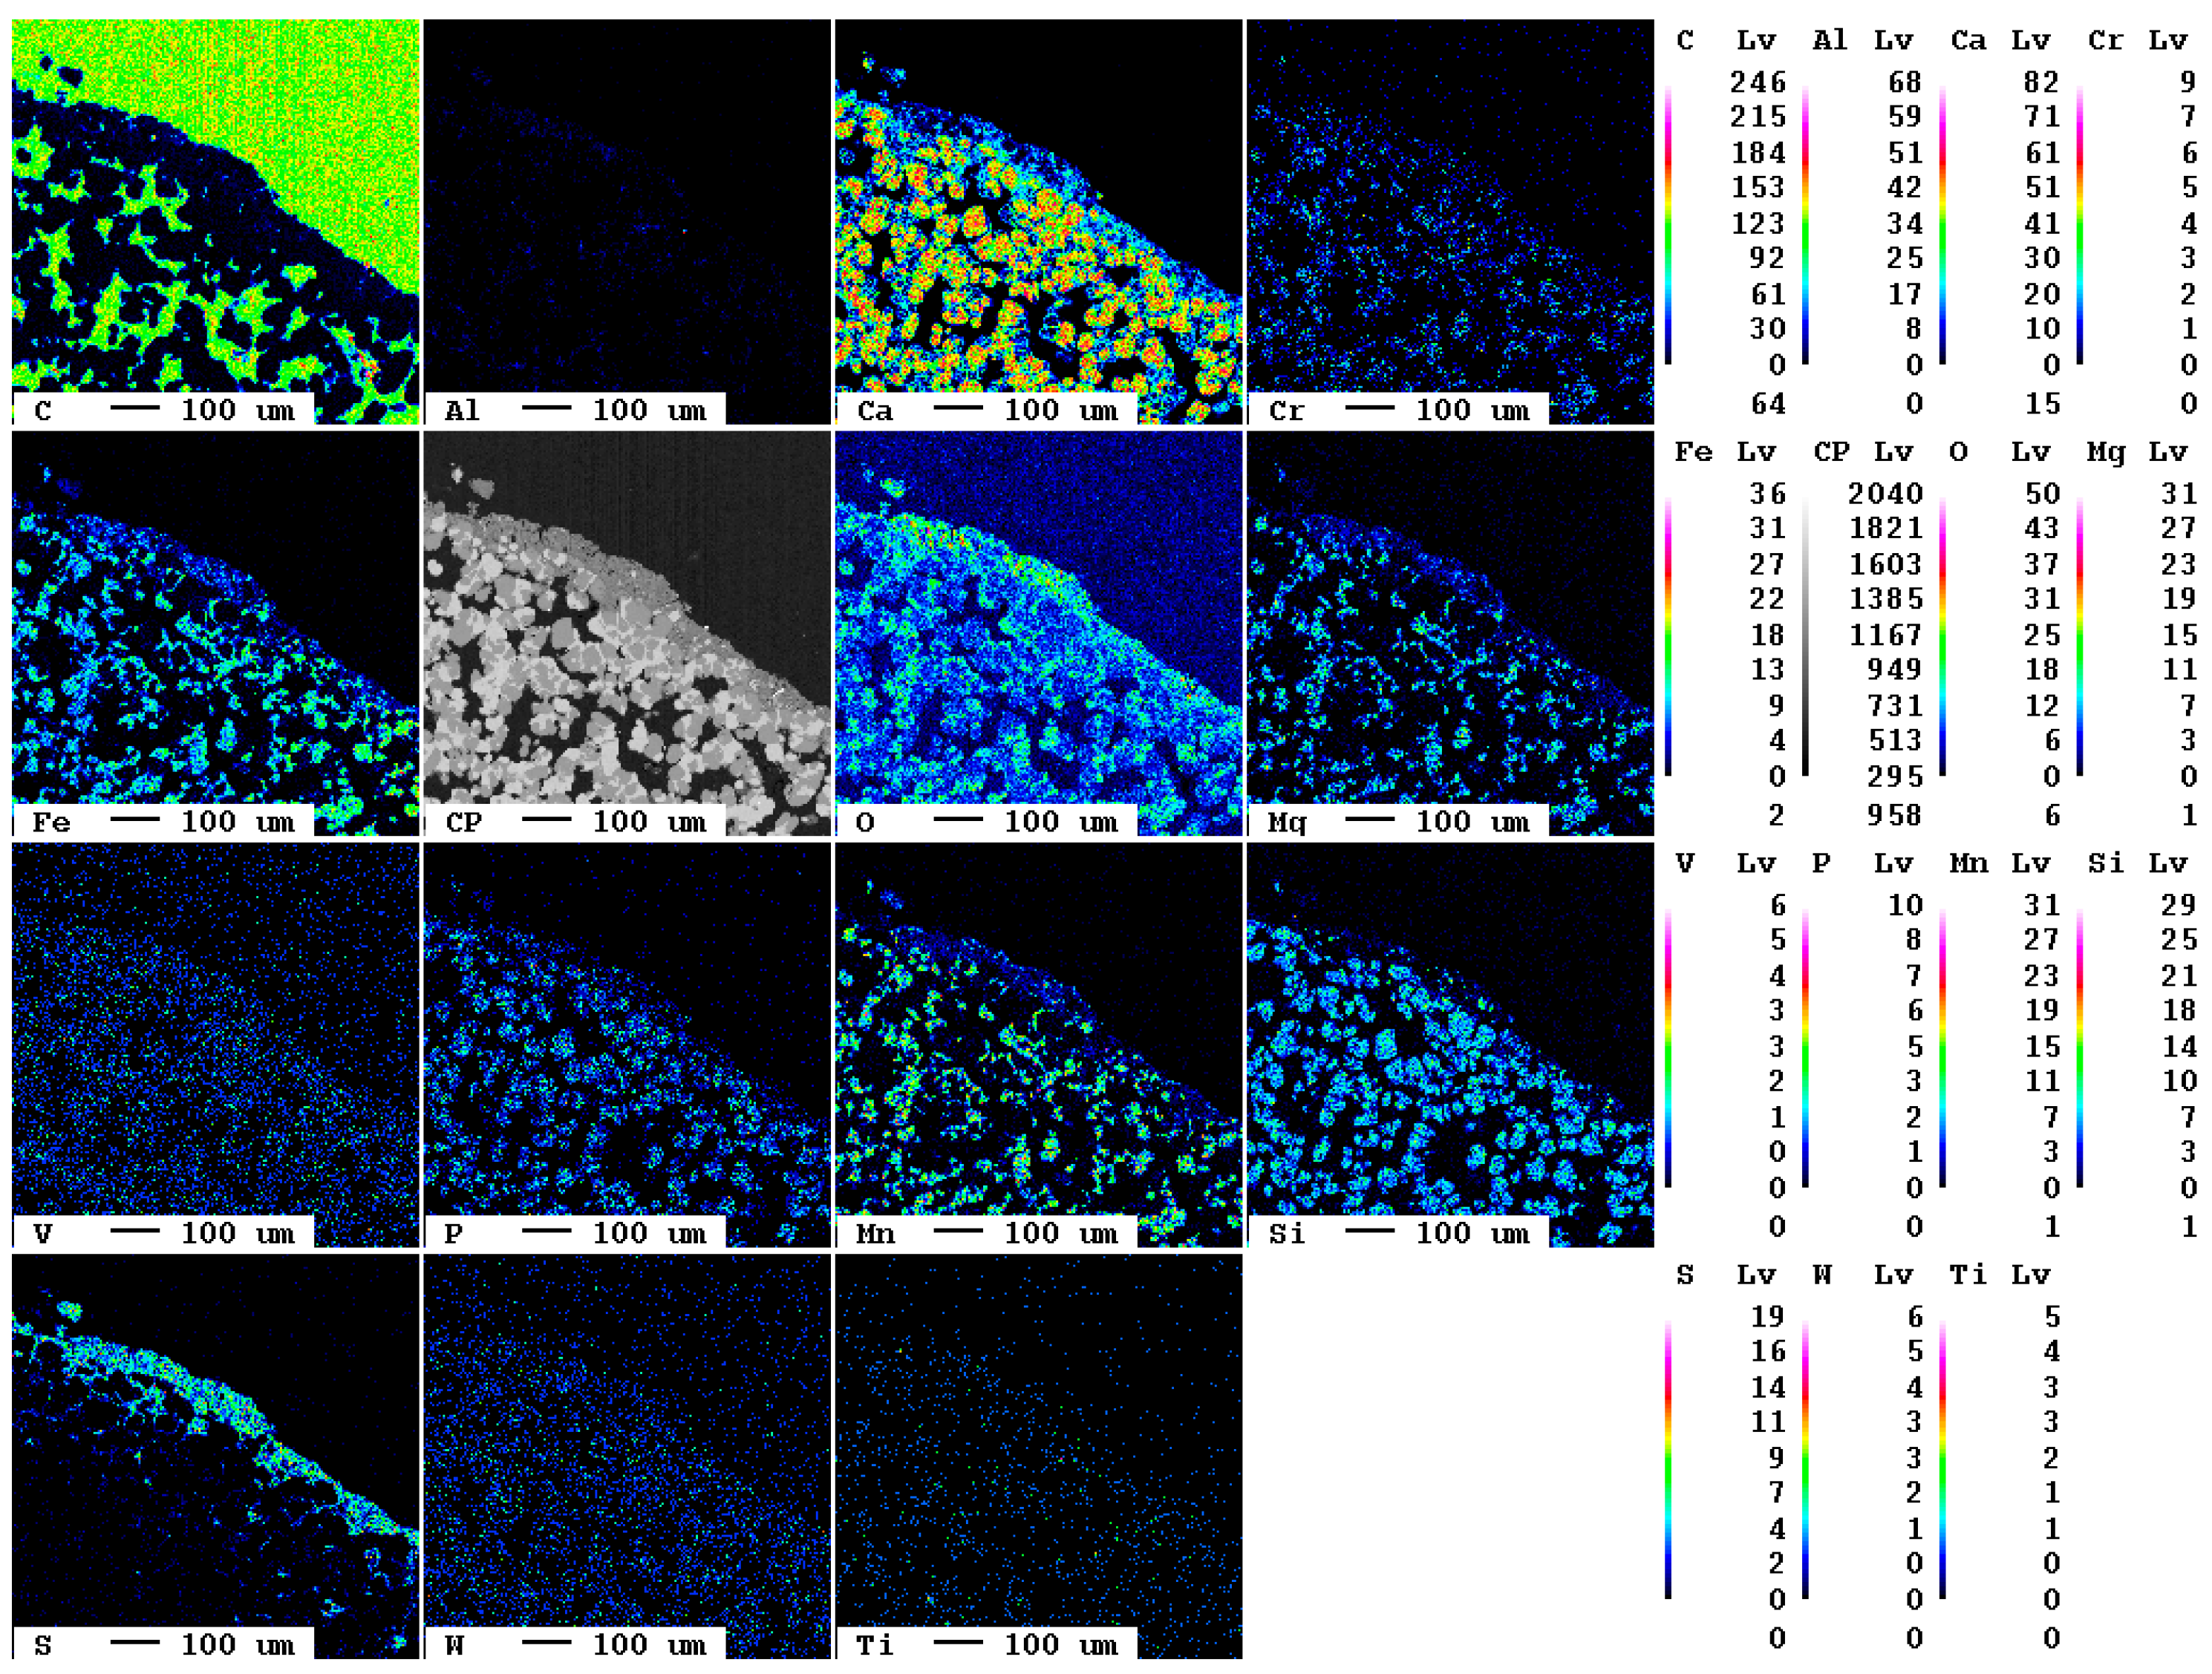
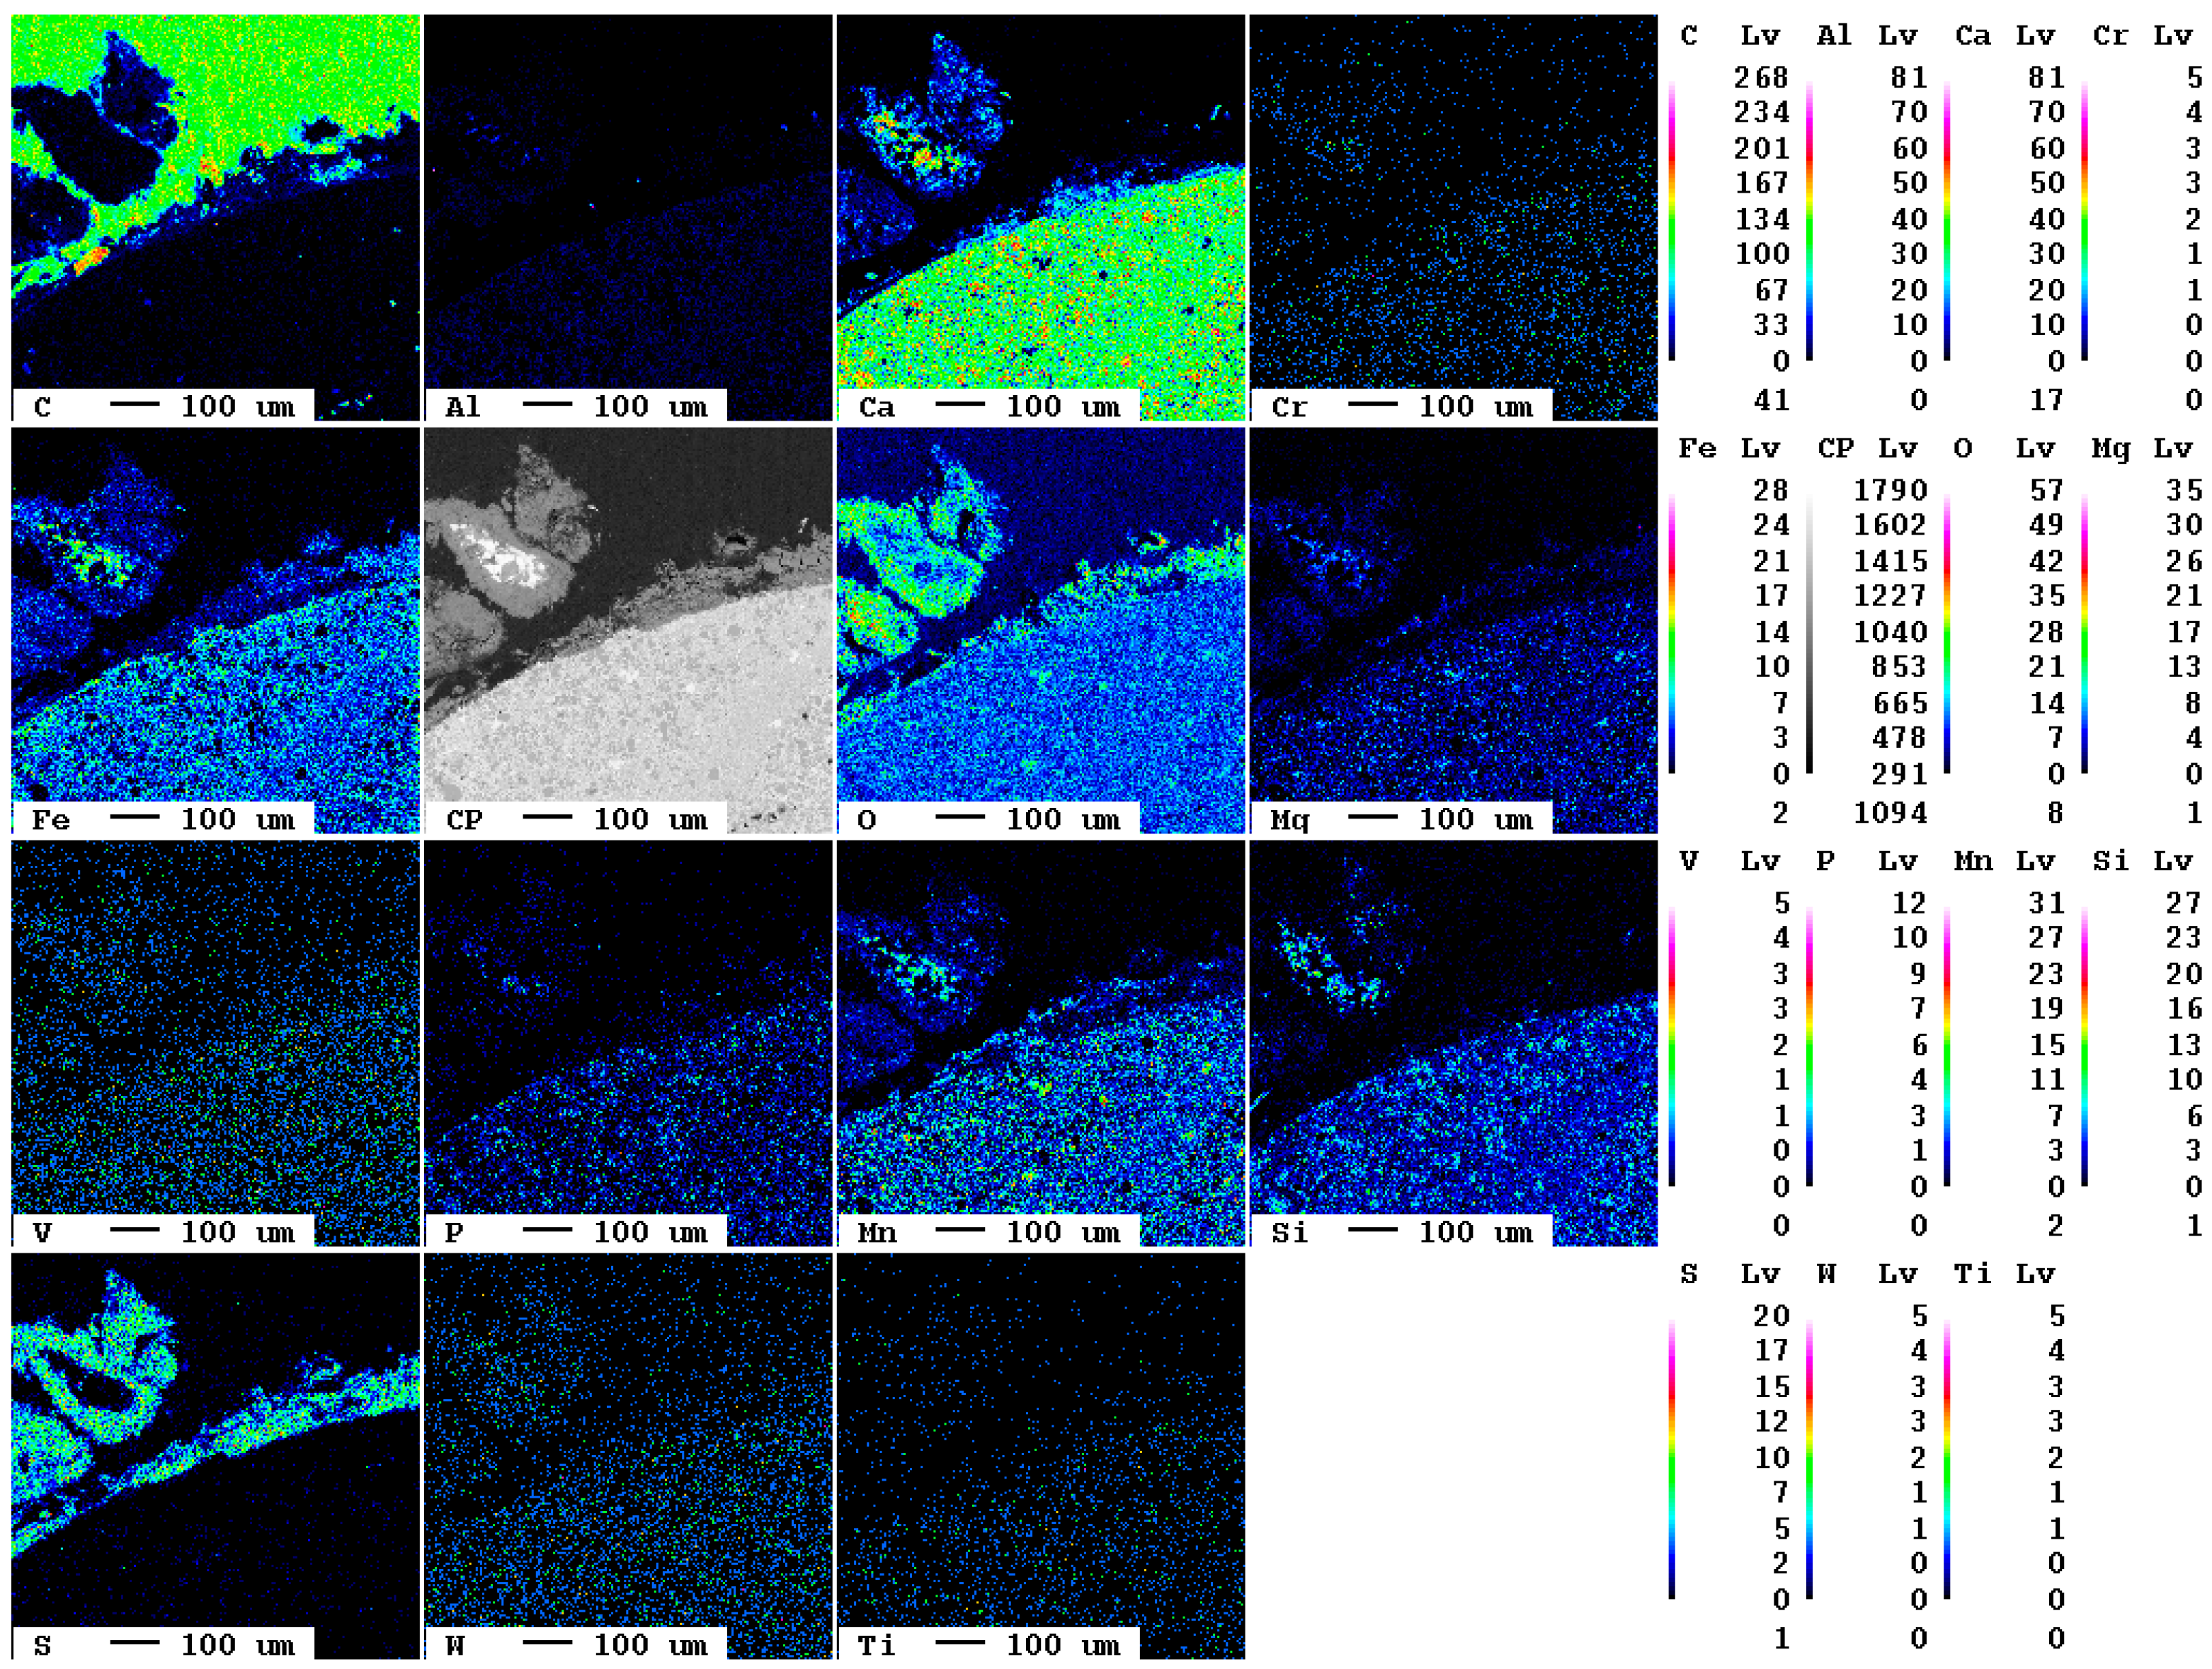
The elemental distribution maps of the original slag sample are displayed in Figure 1.
At the bottom left of the selected area, a slag particle is visible whereas at the top right of the area, the epoxy resin is present. The fabric of the slag is characterized by fine crystallites of about 10 µm diameter. The main elements present in the slag according to Table 1, Ca, O, Fe, Mn, and Si, are clearly visible also in the elemental distribution map. The slag itself is—in contrast to the epoxy resin—almost free of carbon. The contact between resin and slag is very sharp in the elemental distribution map of carbon, i.e., the original slag is also superficially not carbonated.
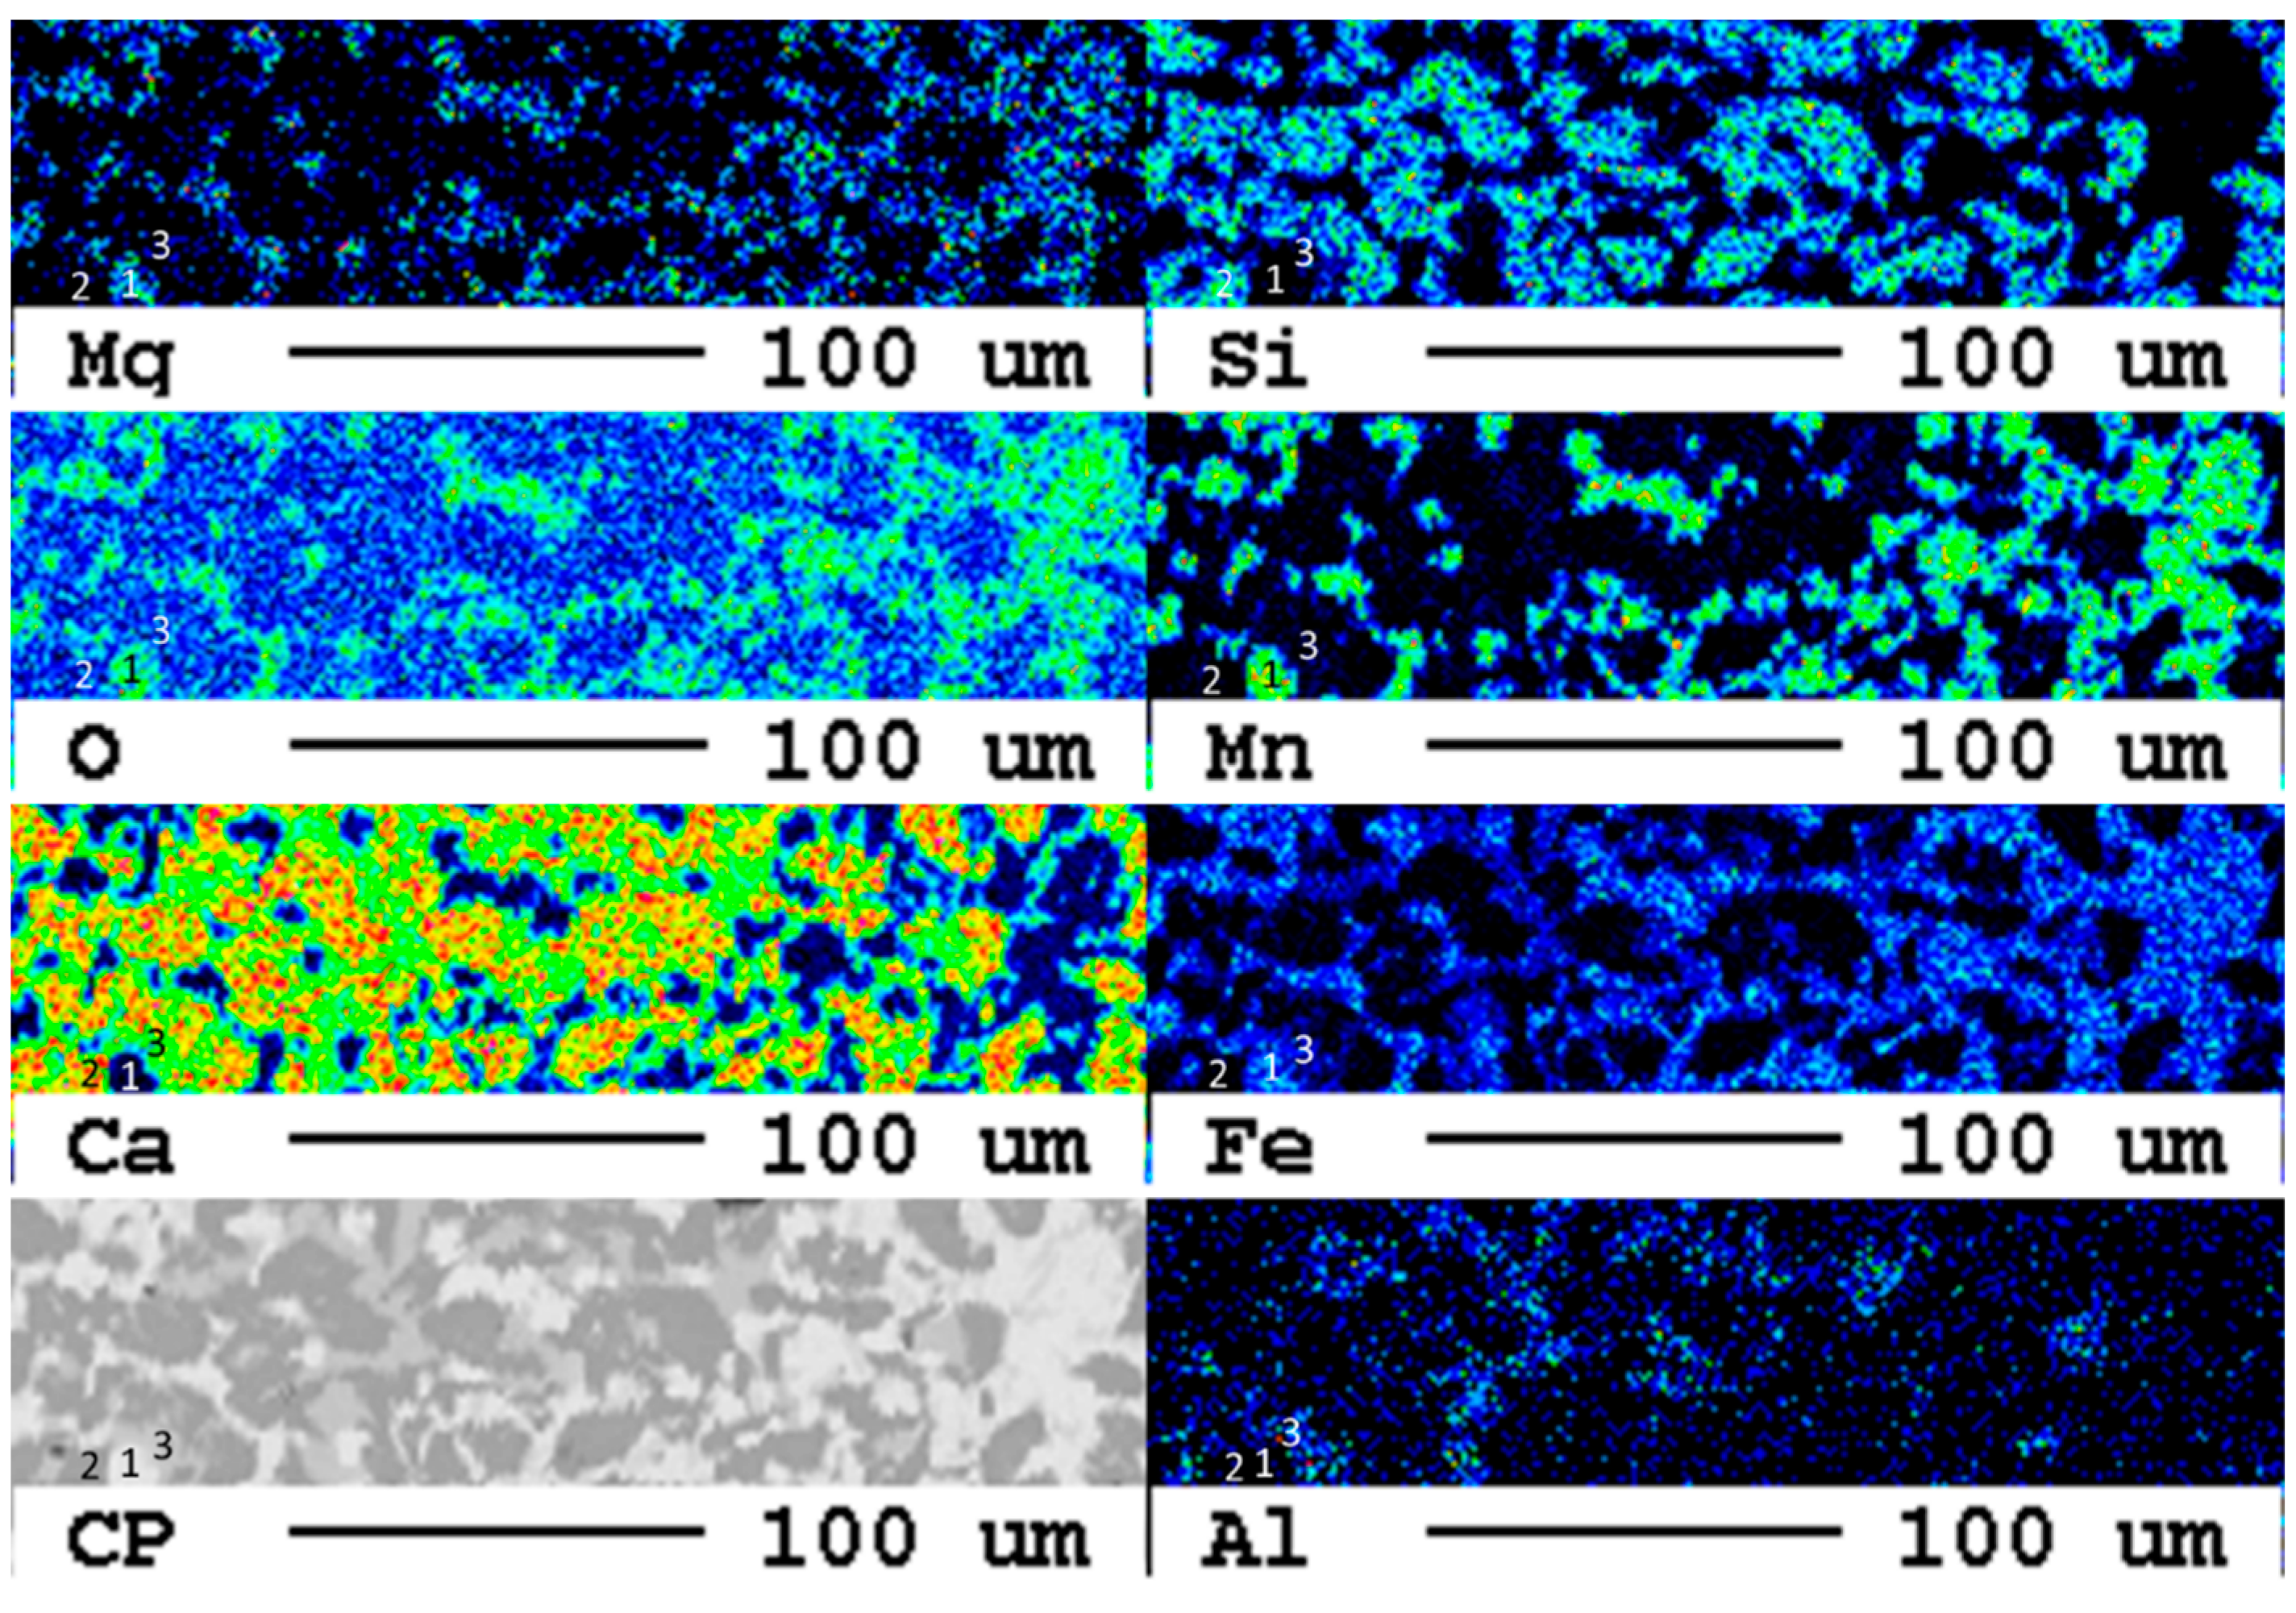
A magnification of the area at the bottom left in Figure 1 shows the individual mineral phases (Figure 2).
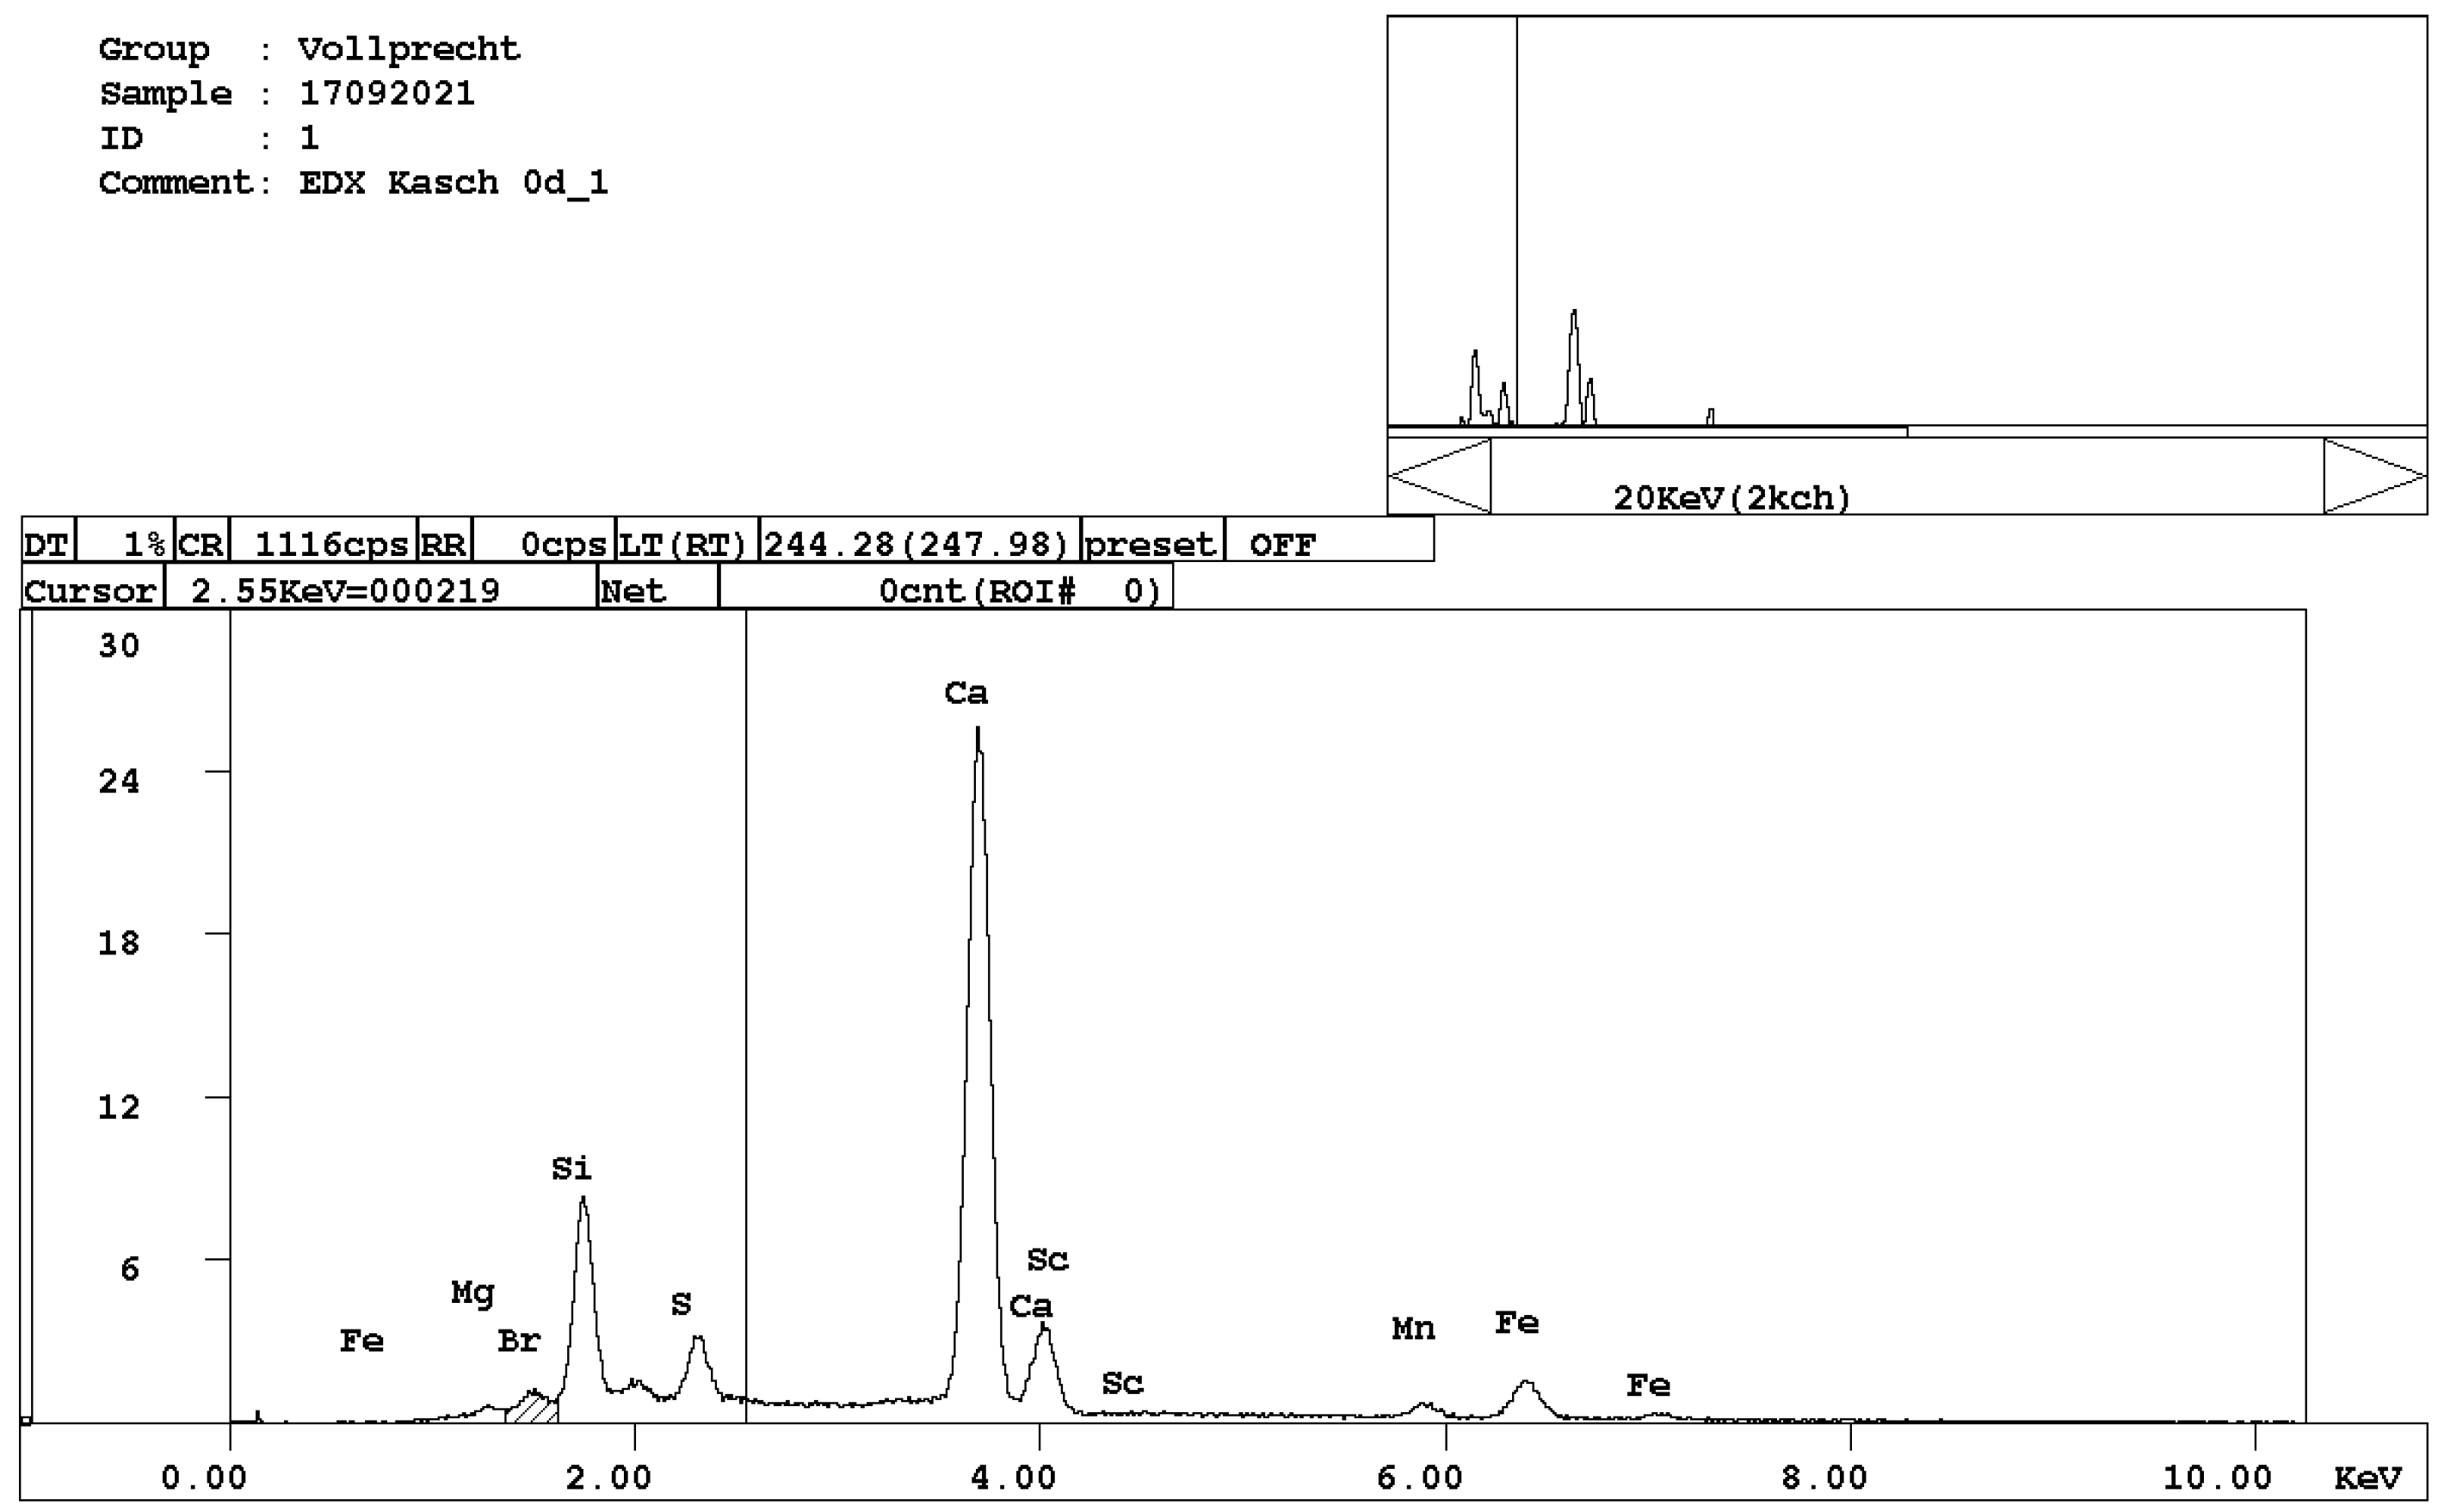
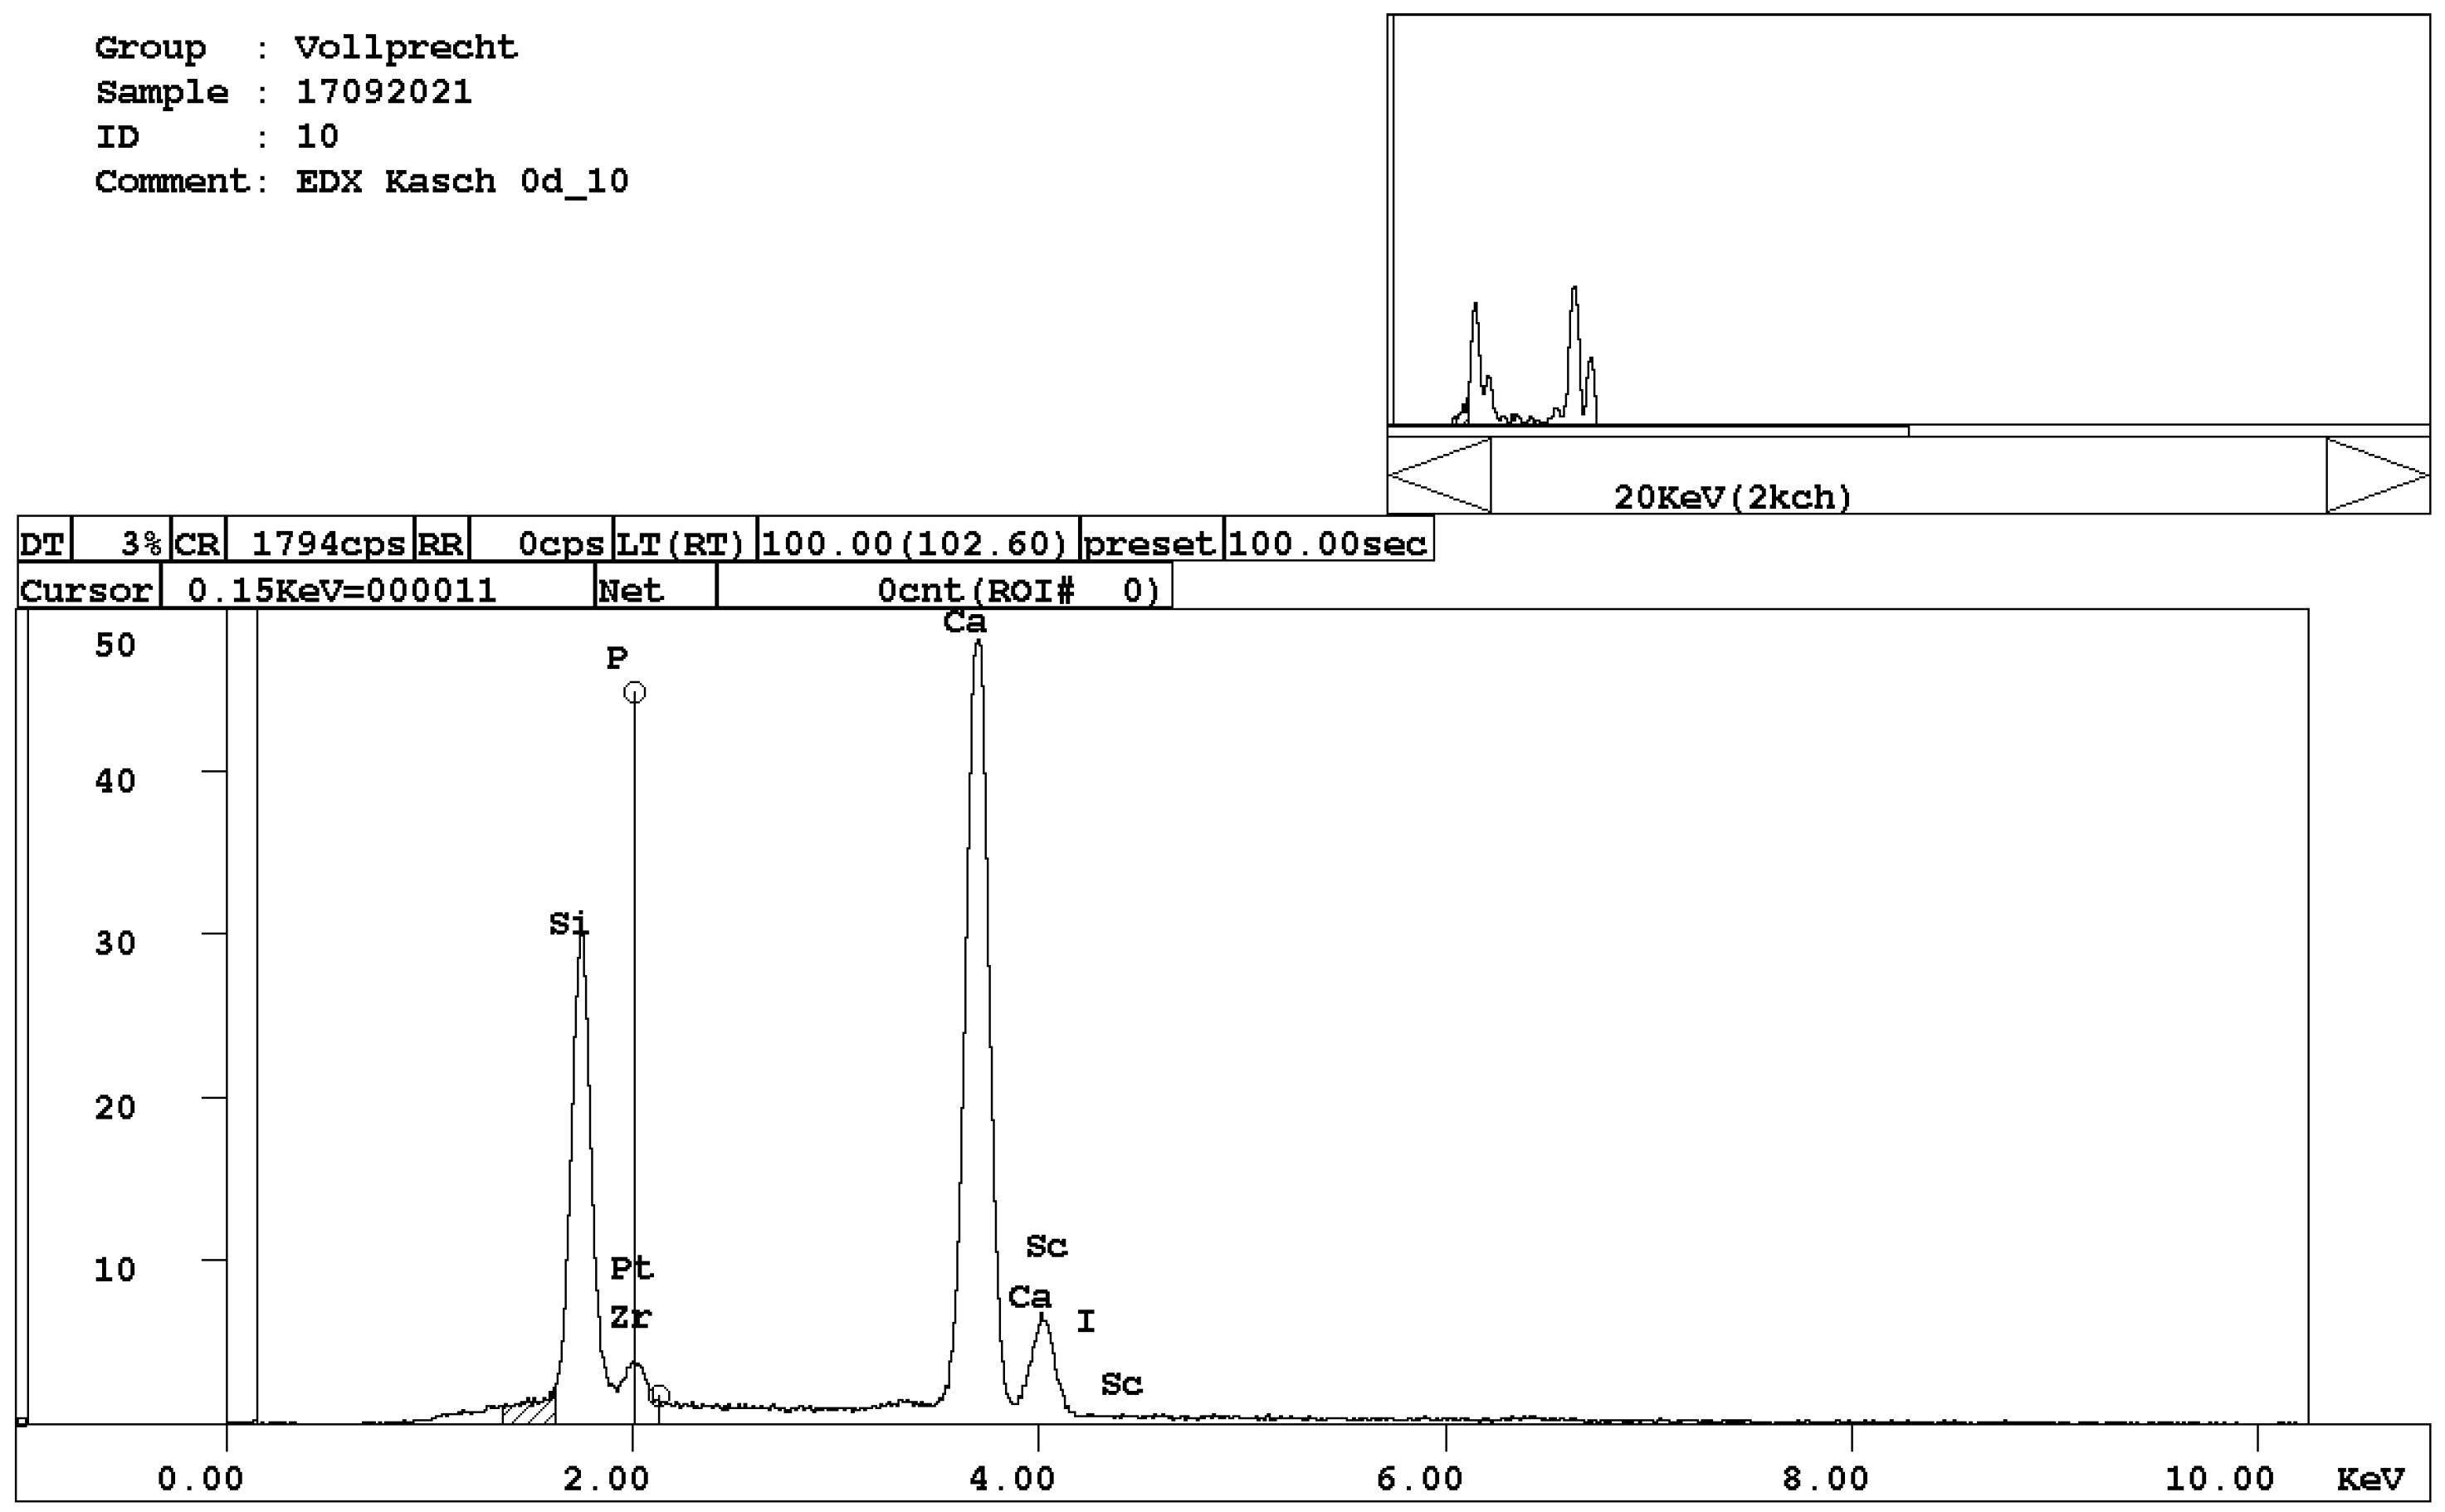
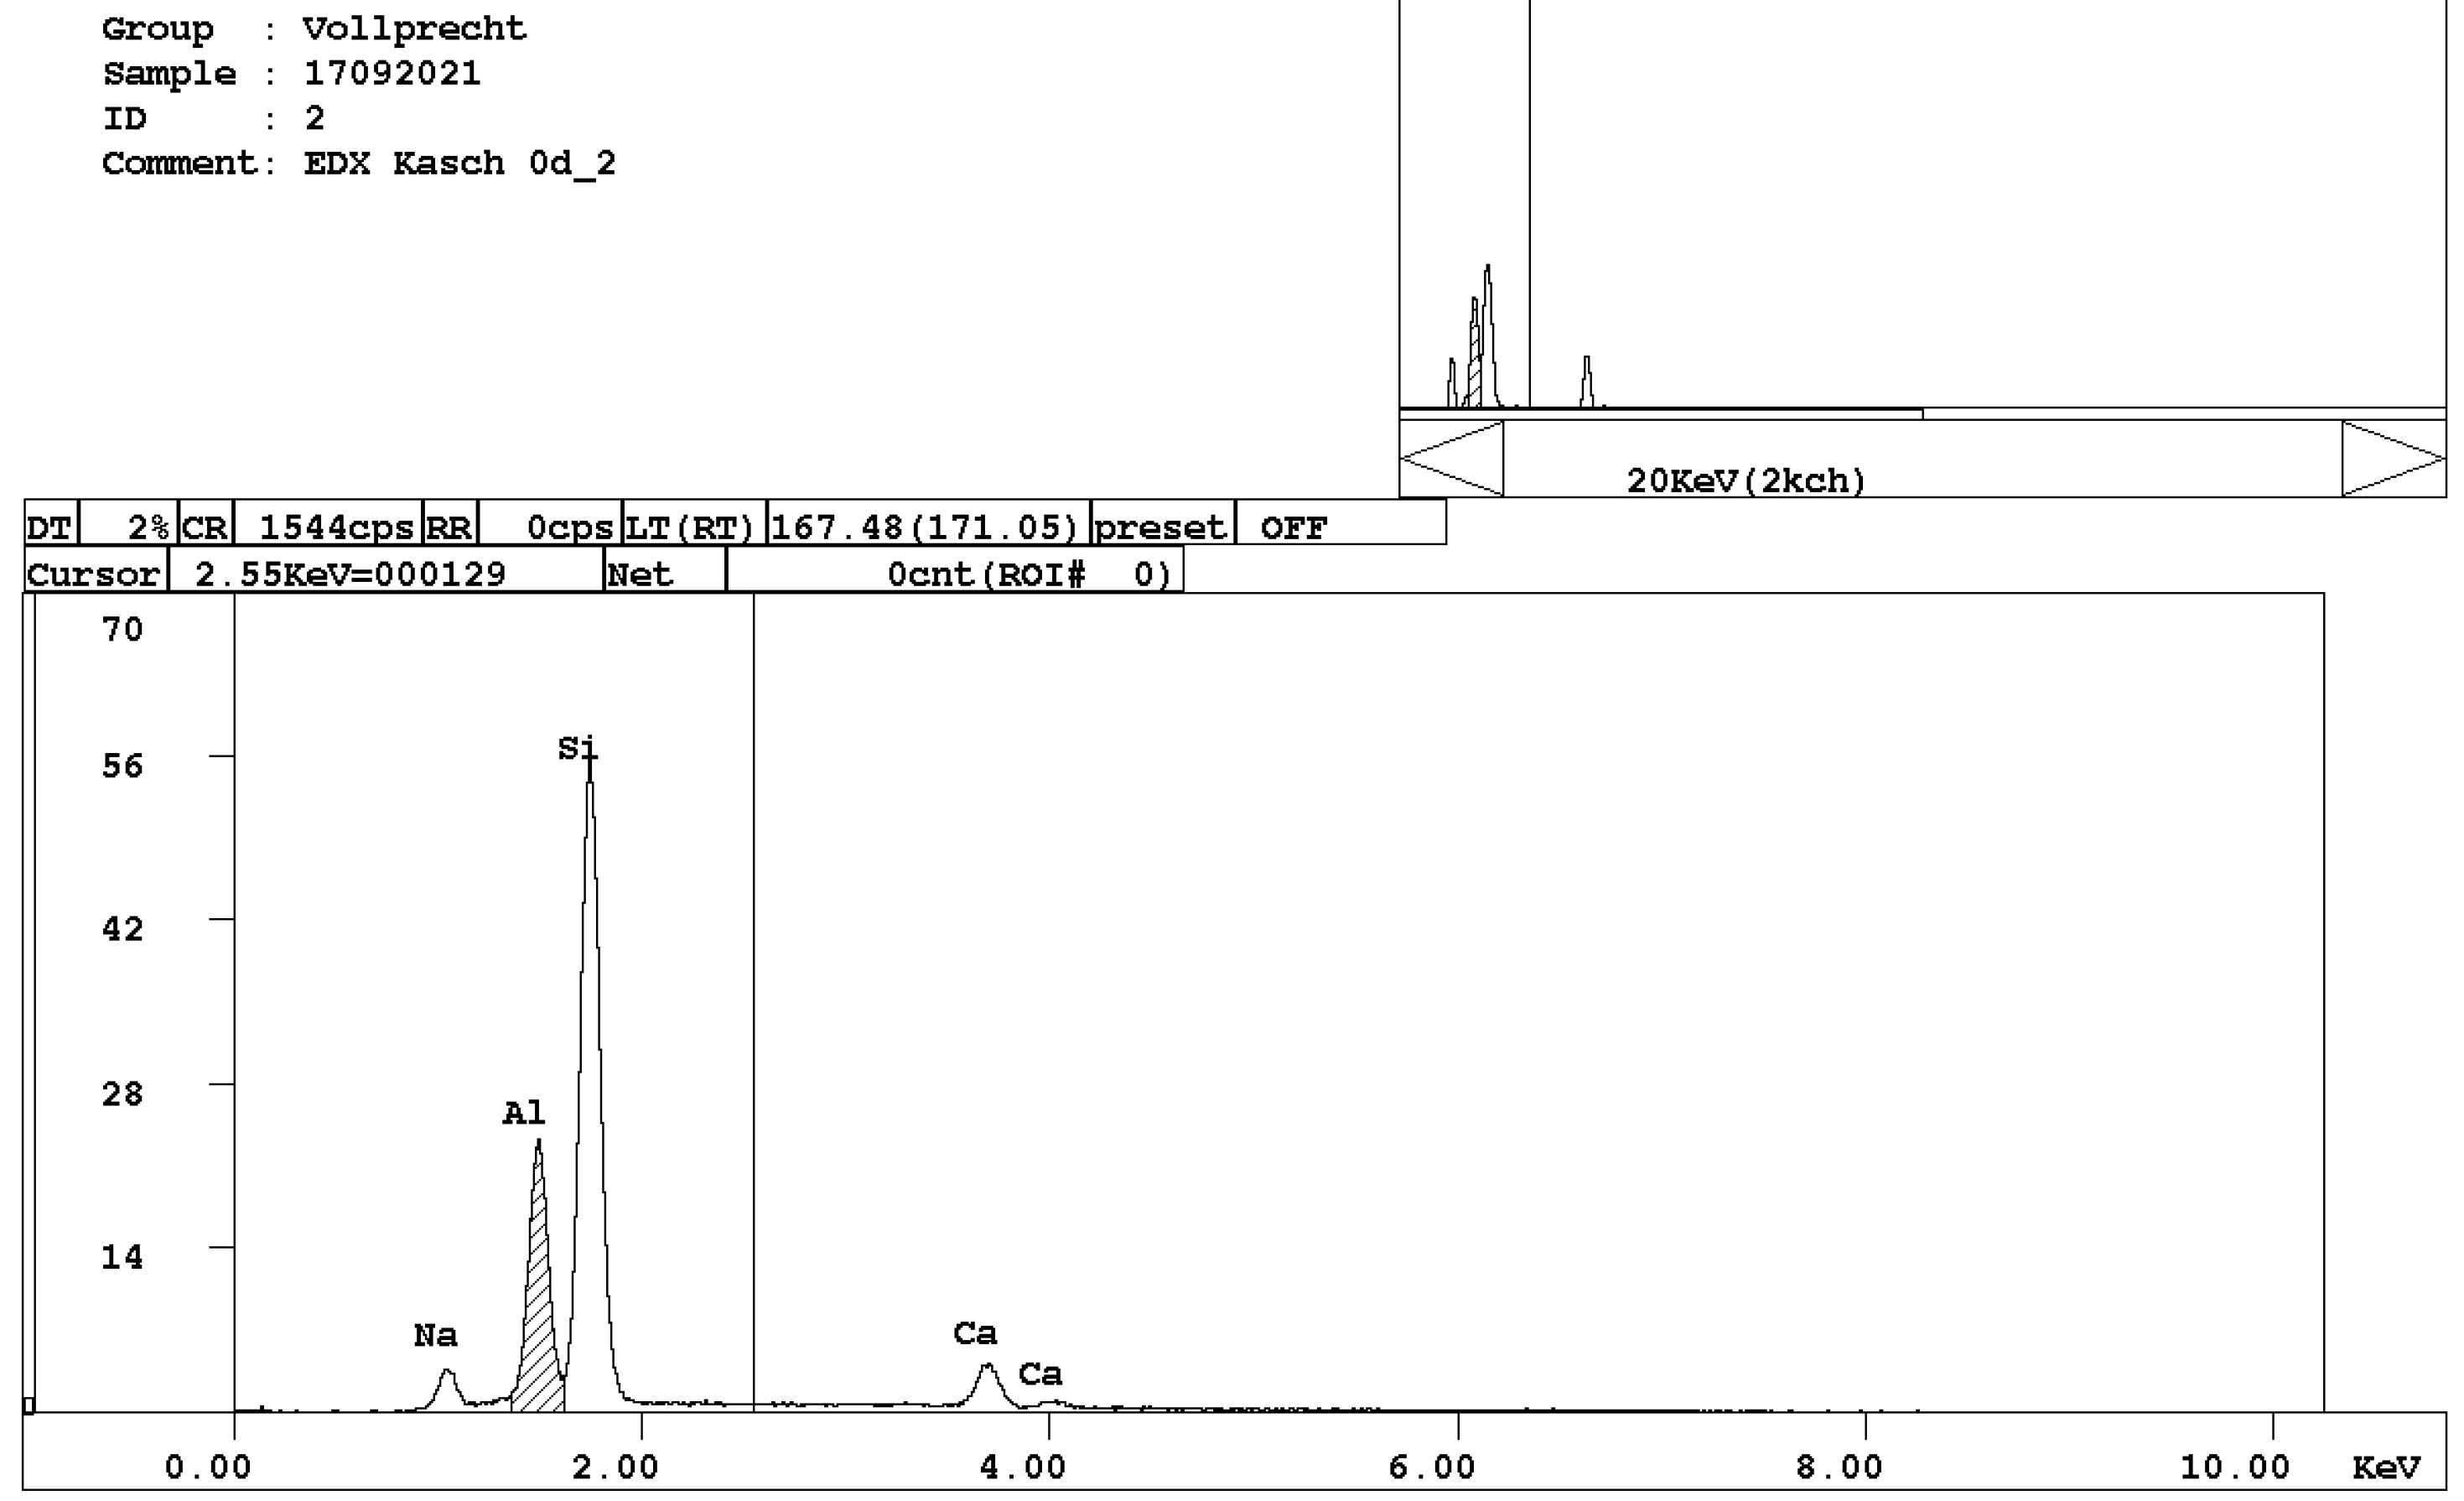
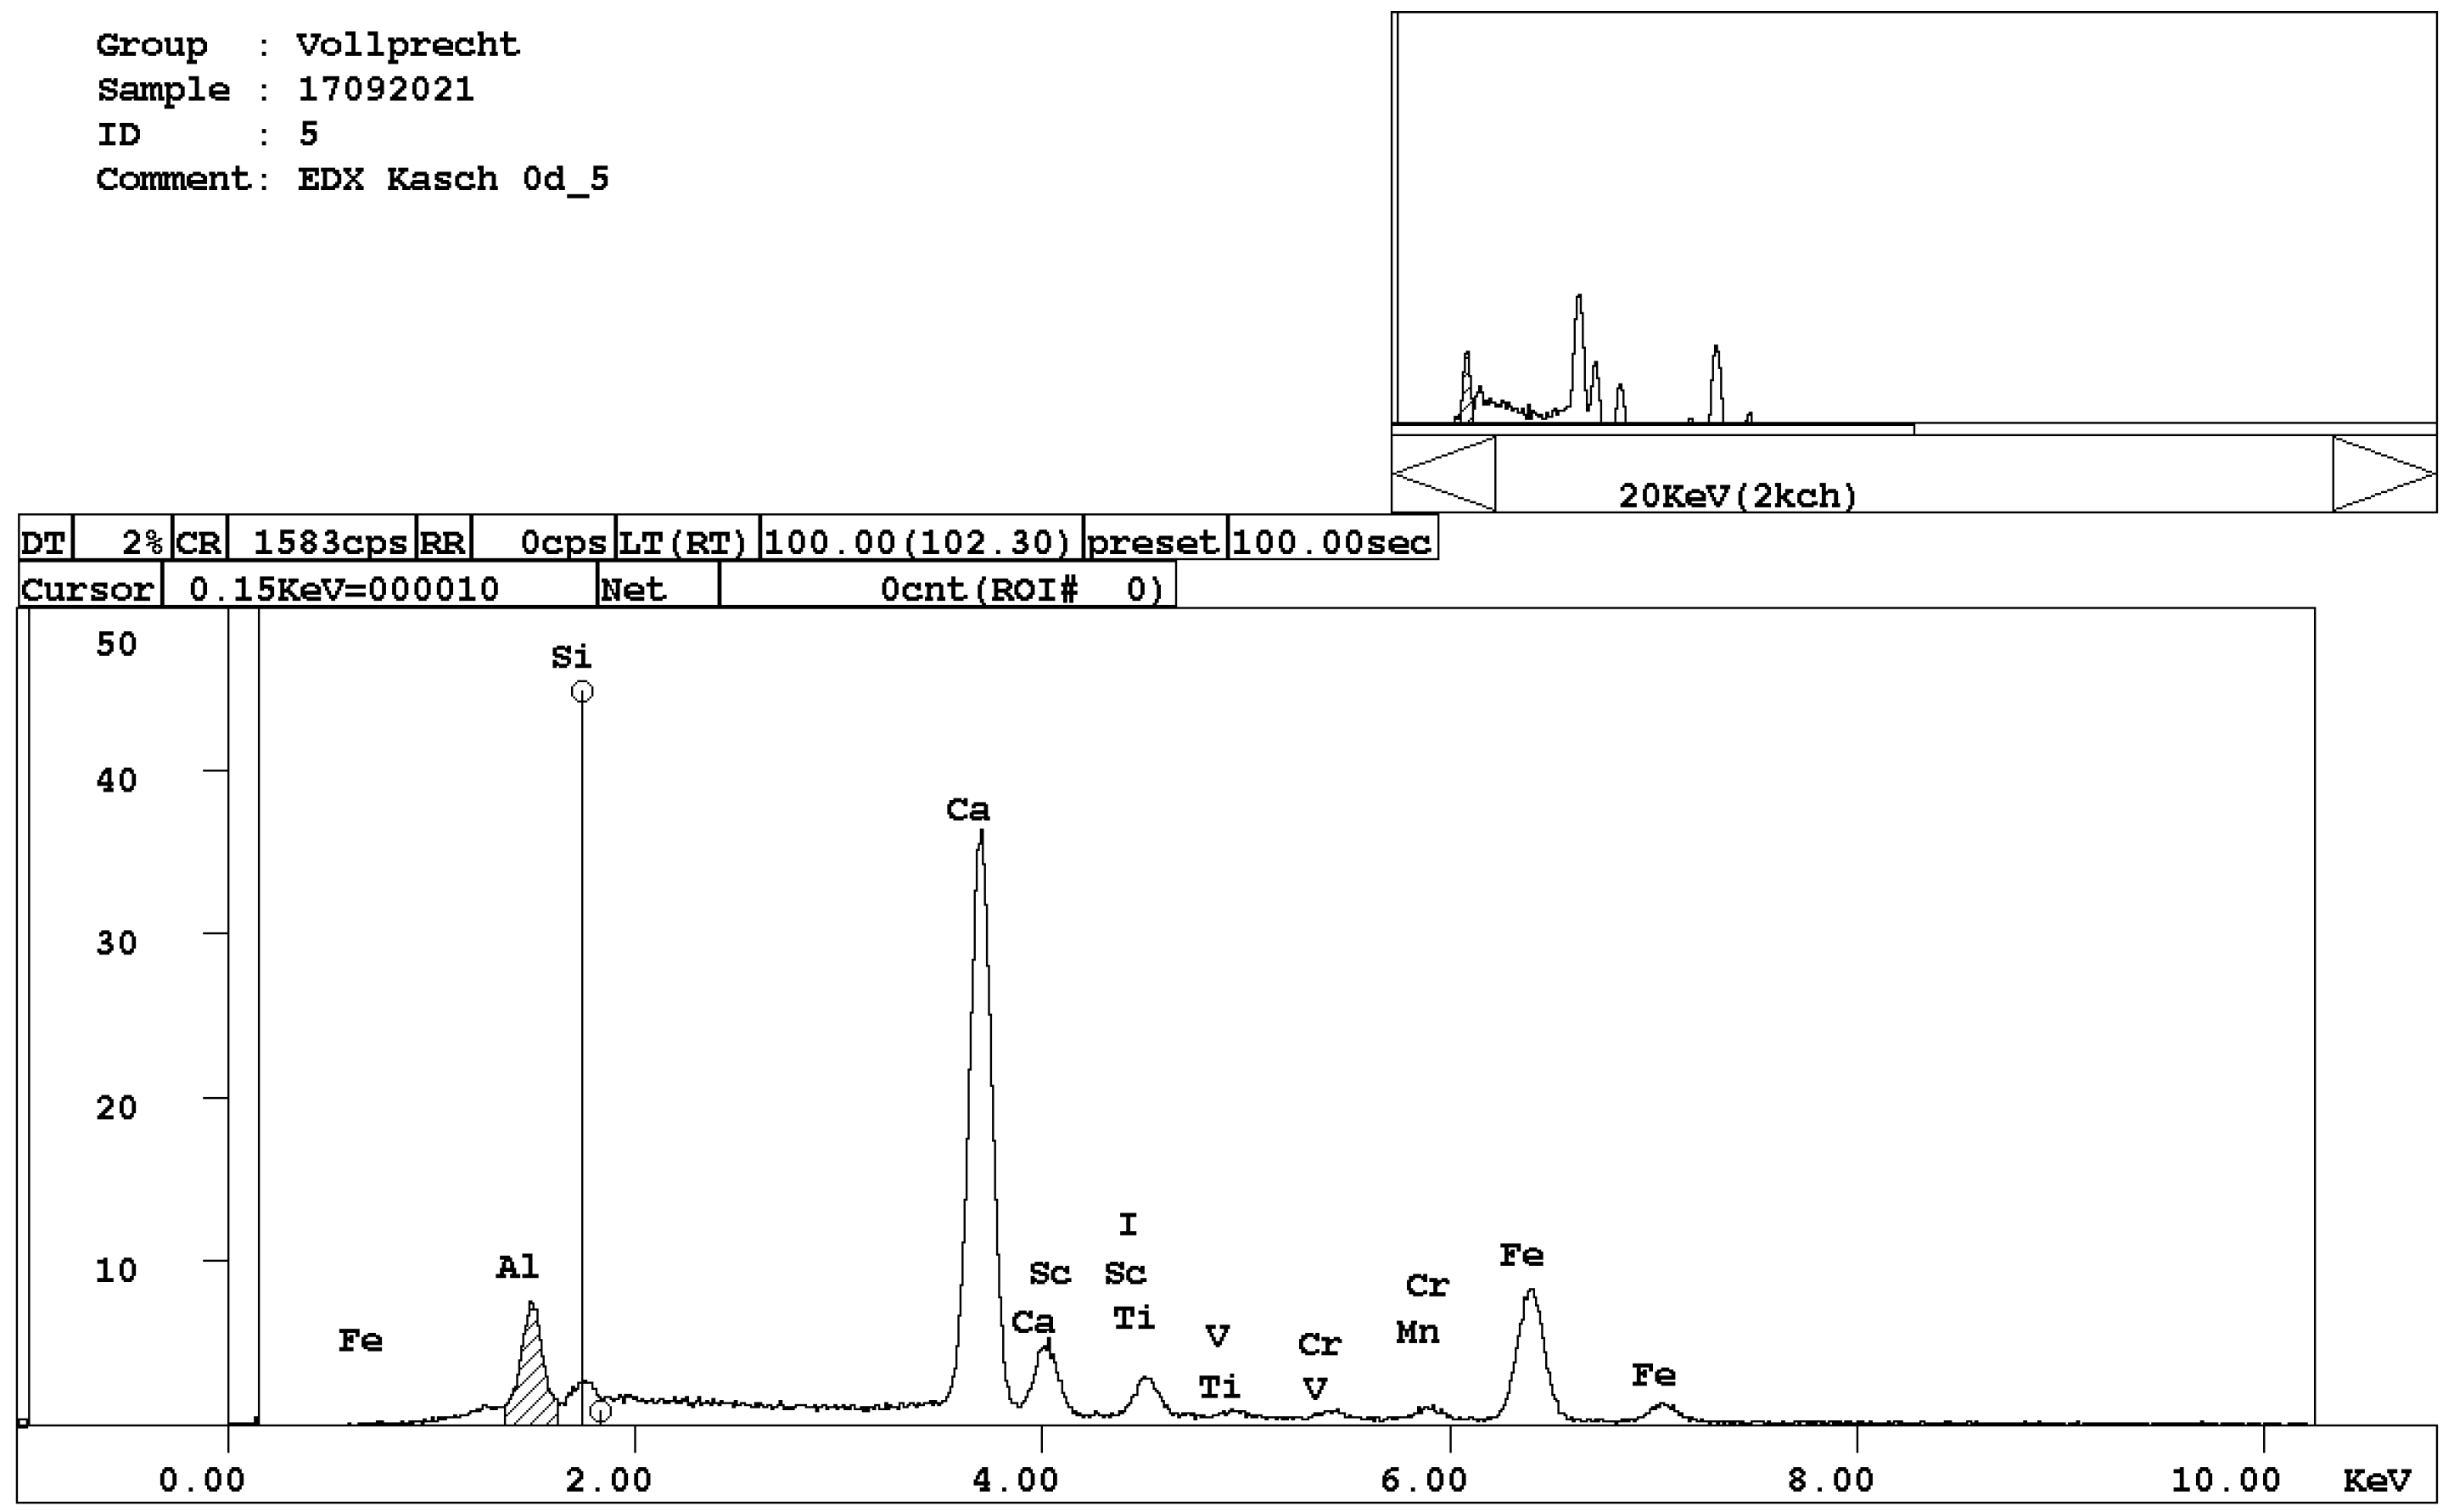
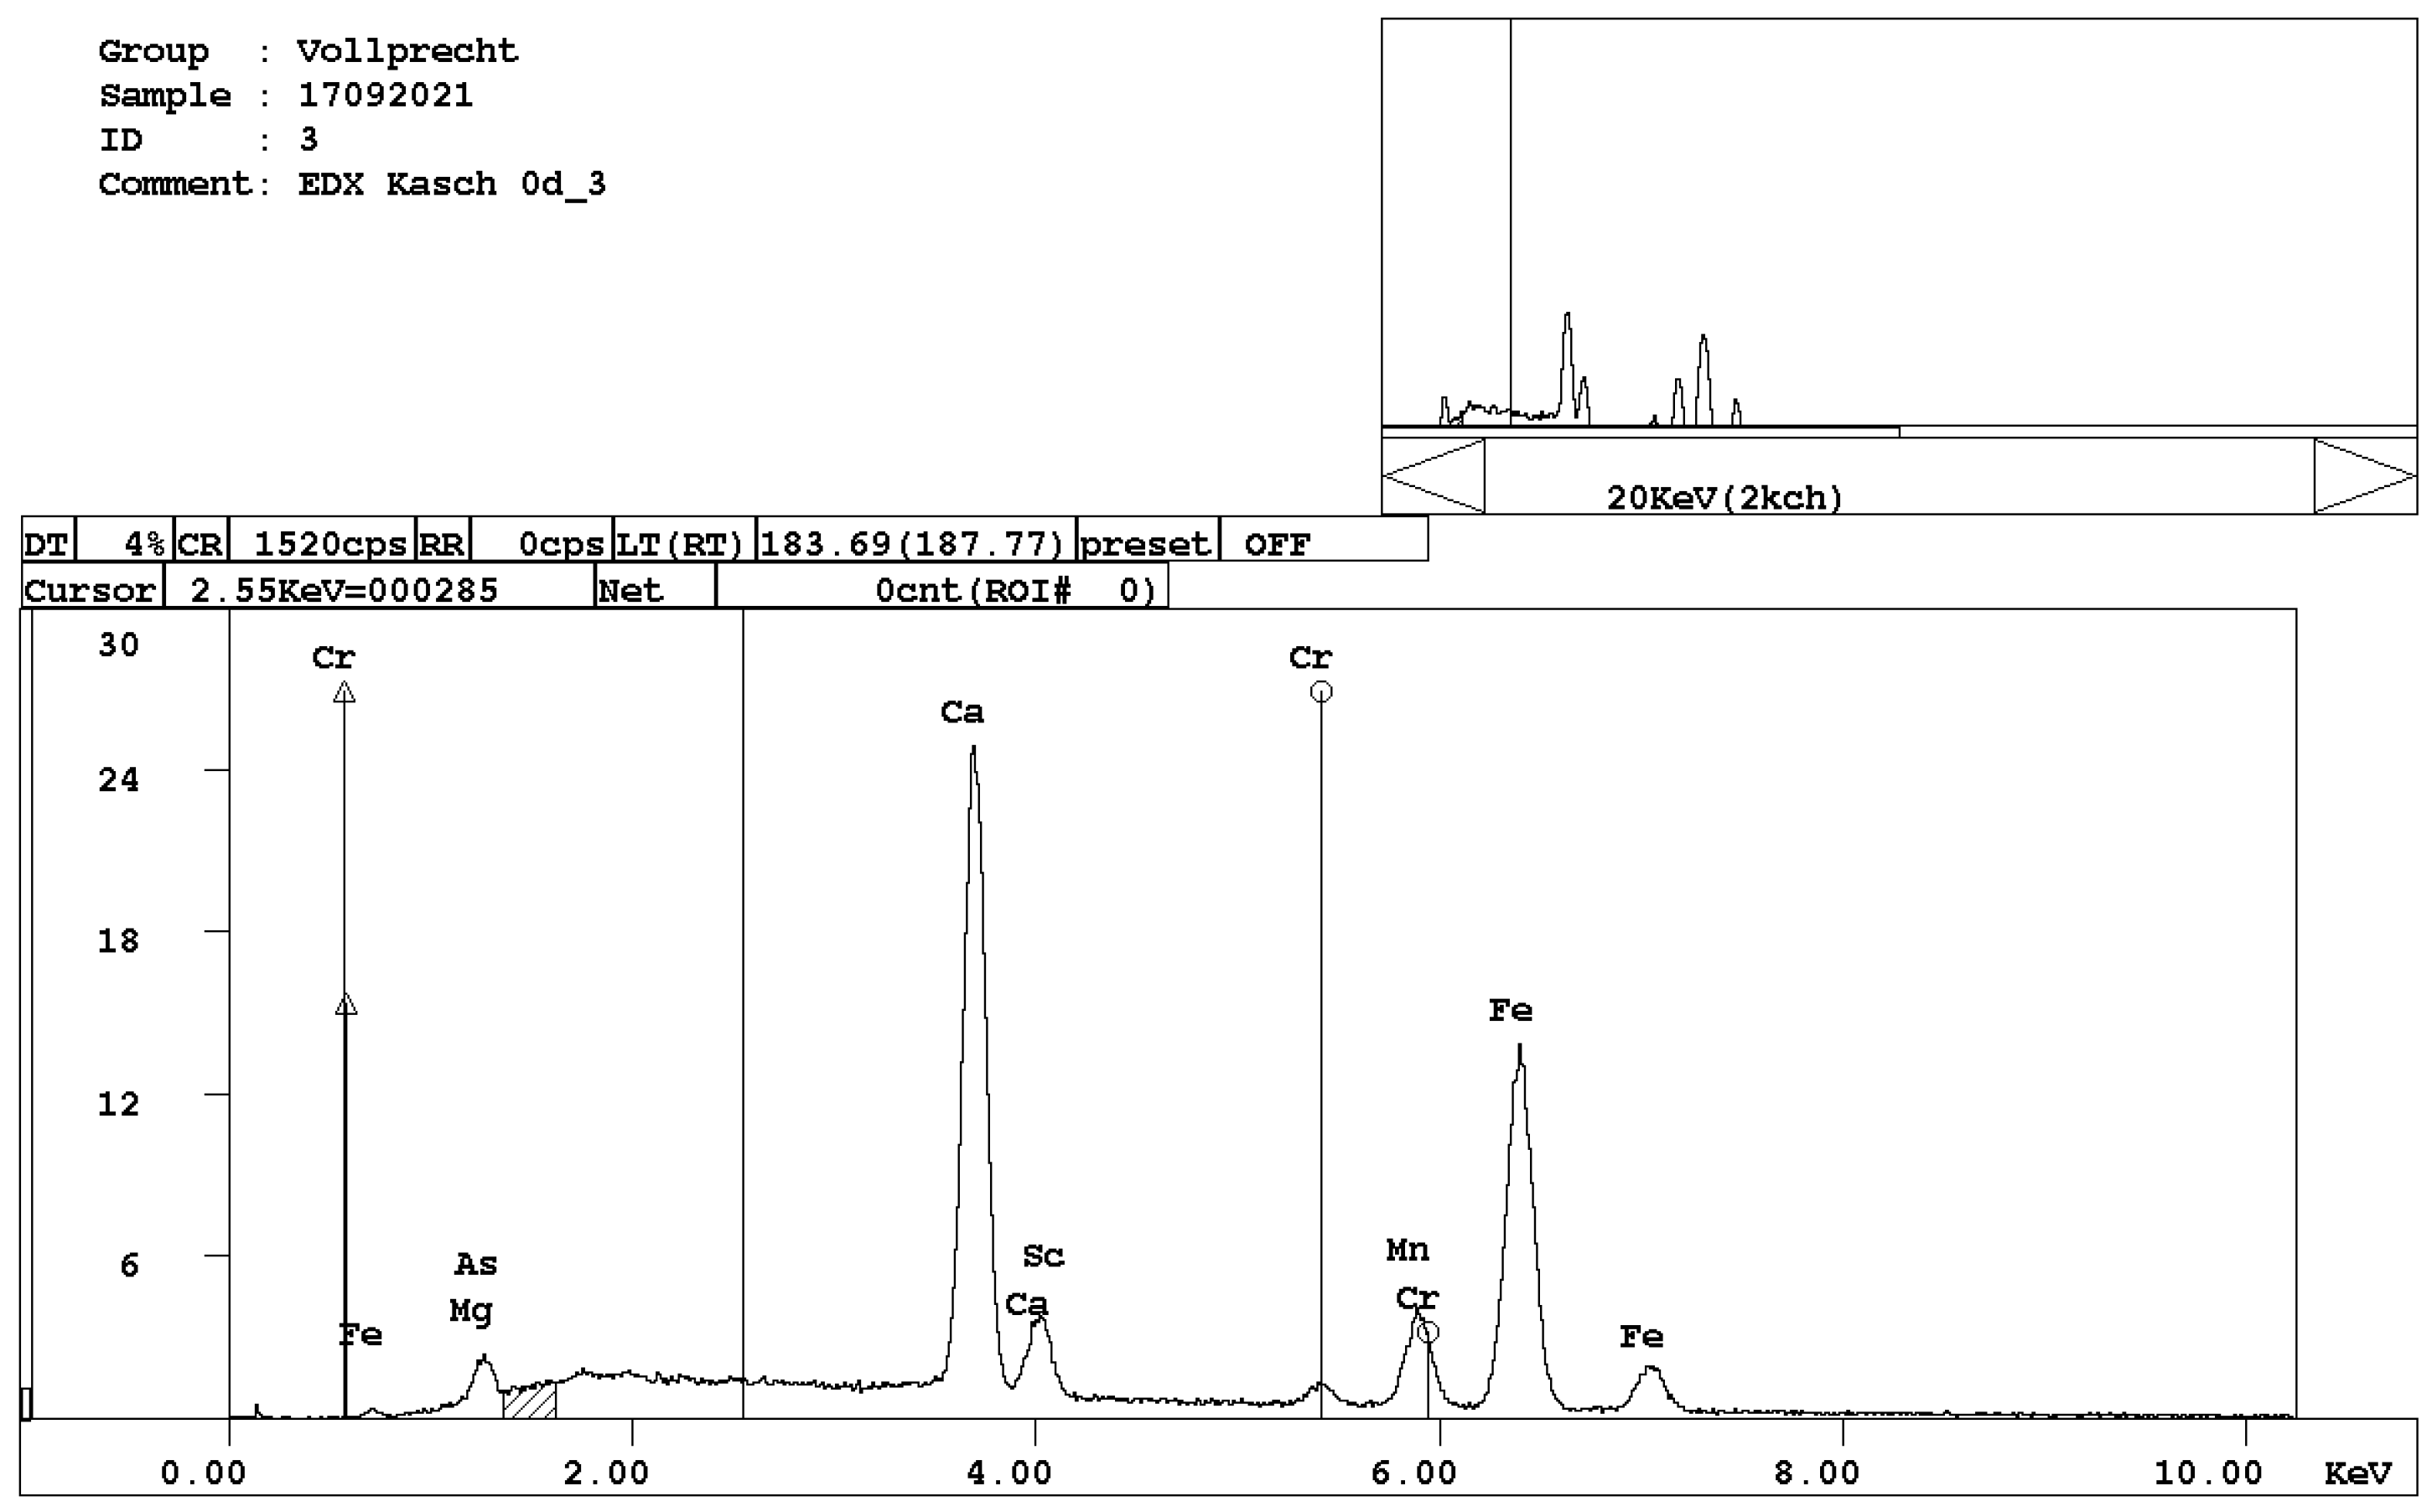
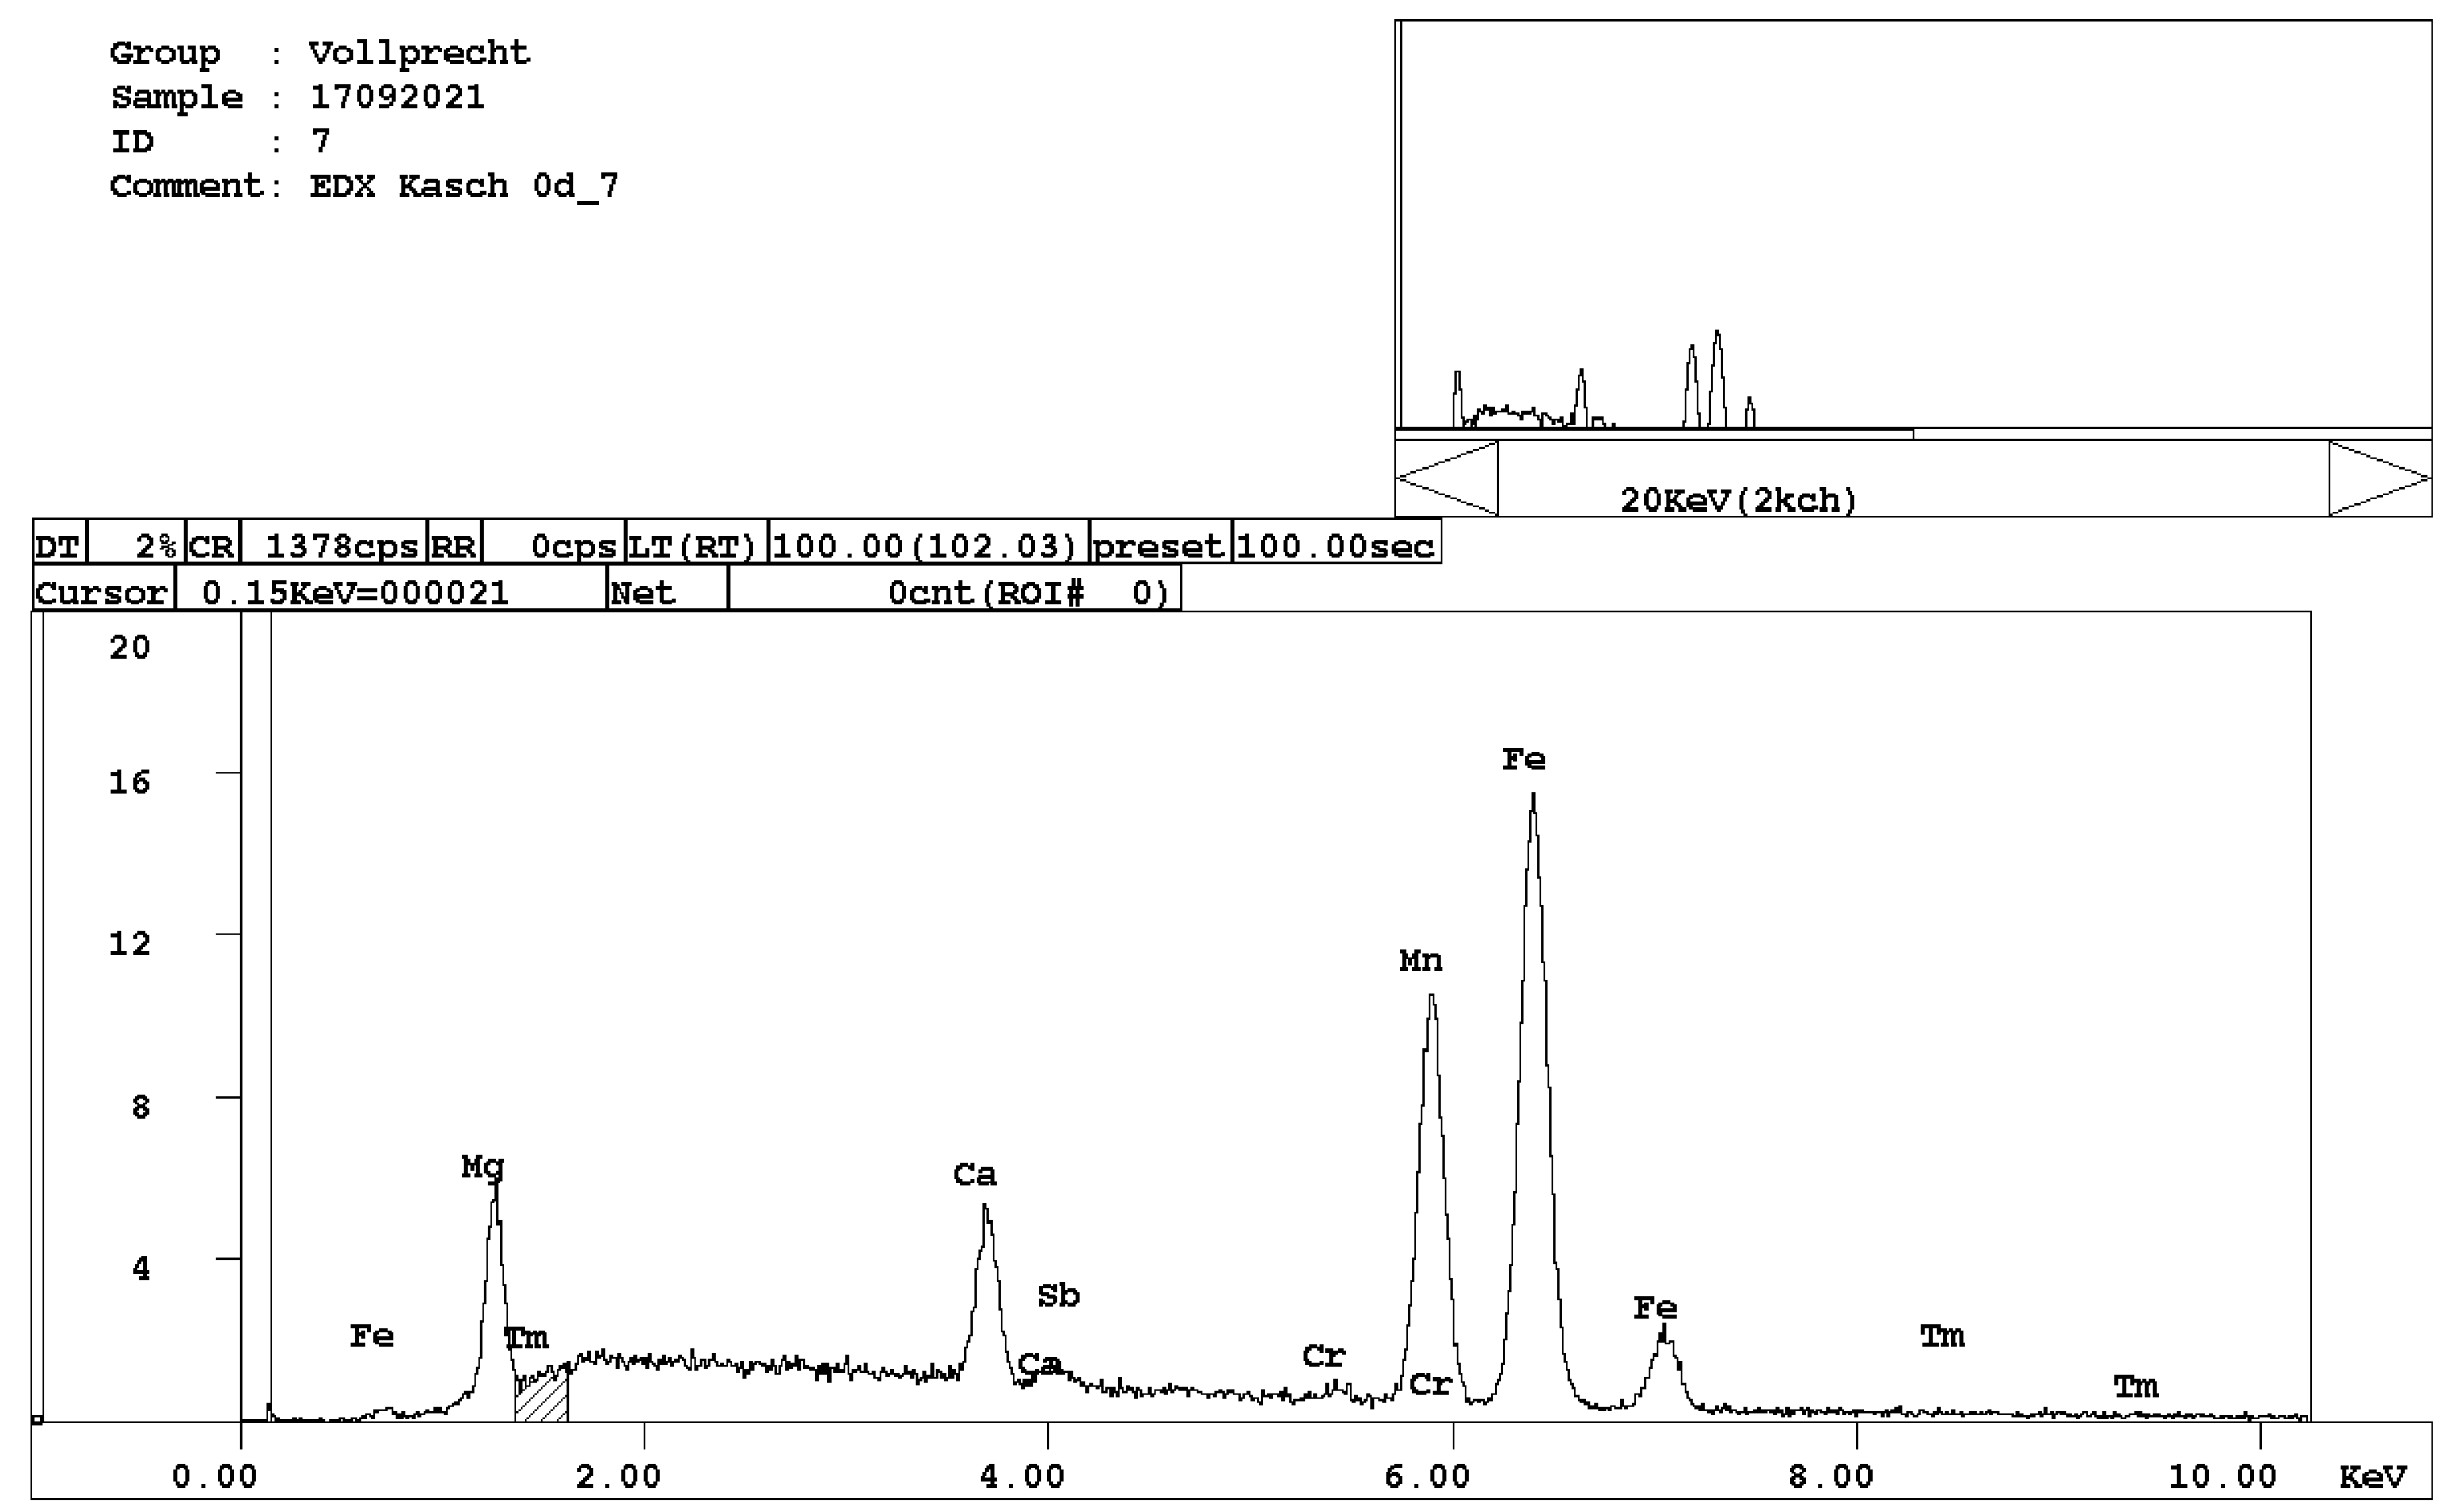
At least three phases, wuestite, brownmillerite, and a calcium silicate phase, can clearly be recognized which is in good agreement with previous investigations [7]. EDX spectra of selected measuring spots indicate that, in reality, six distinct mineral phases occur in the slag:
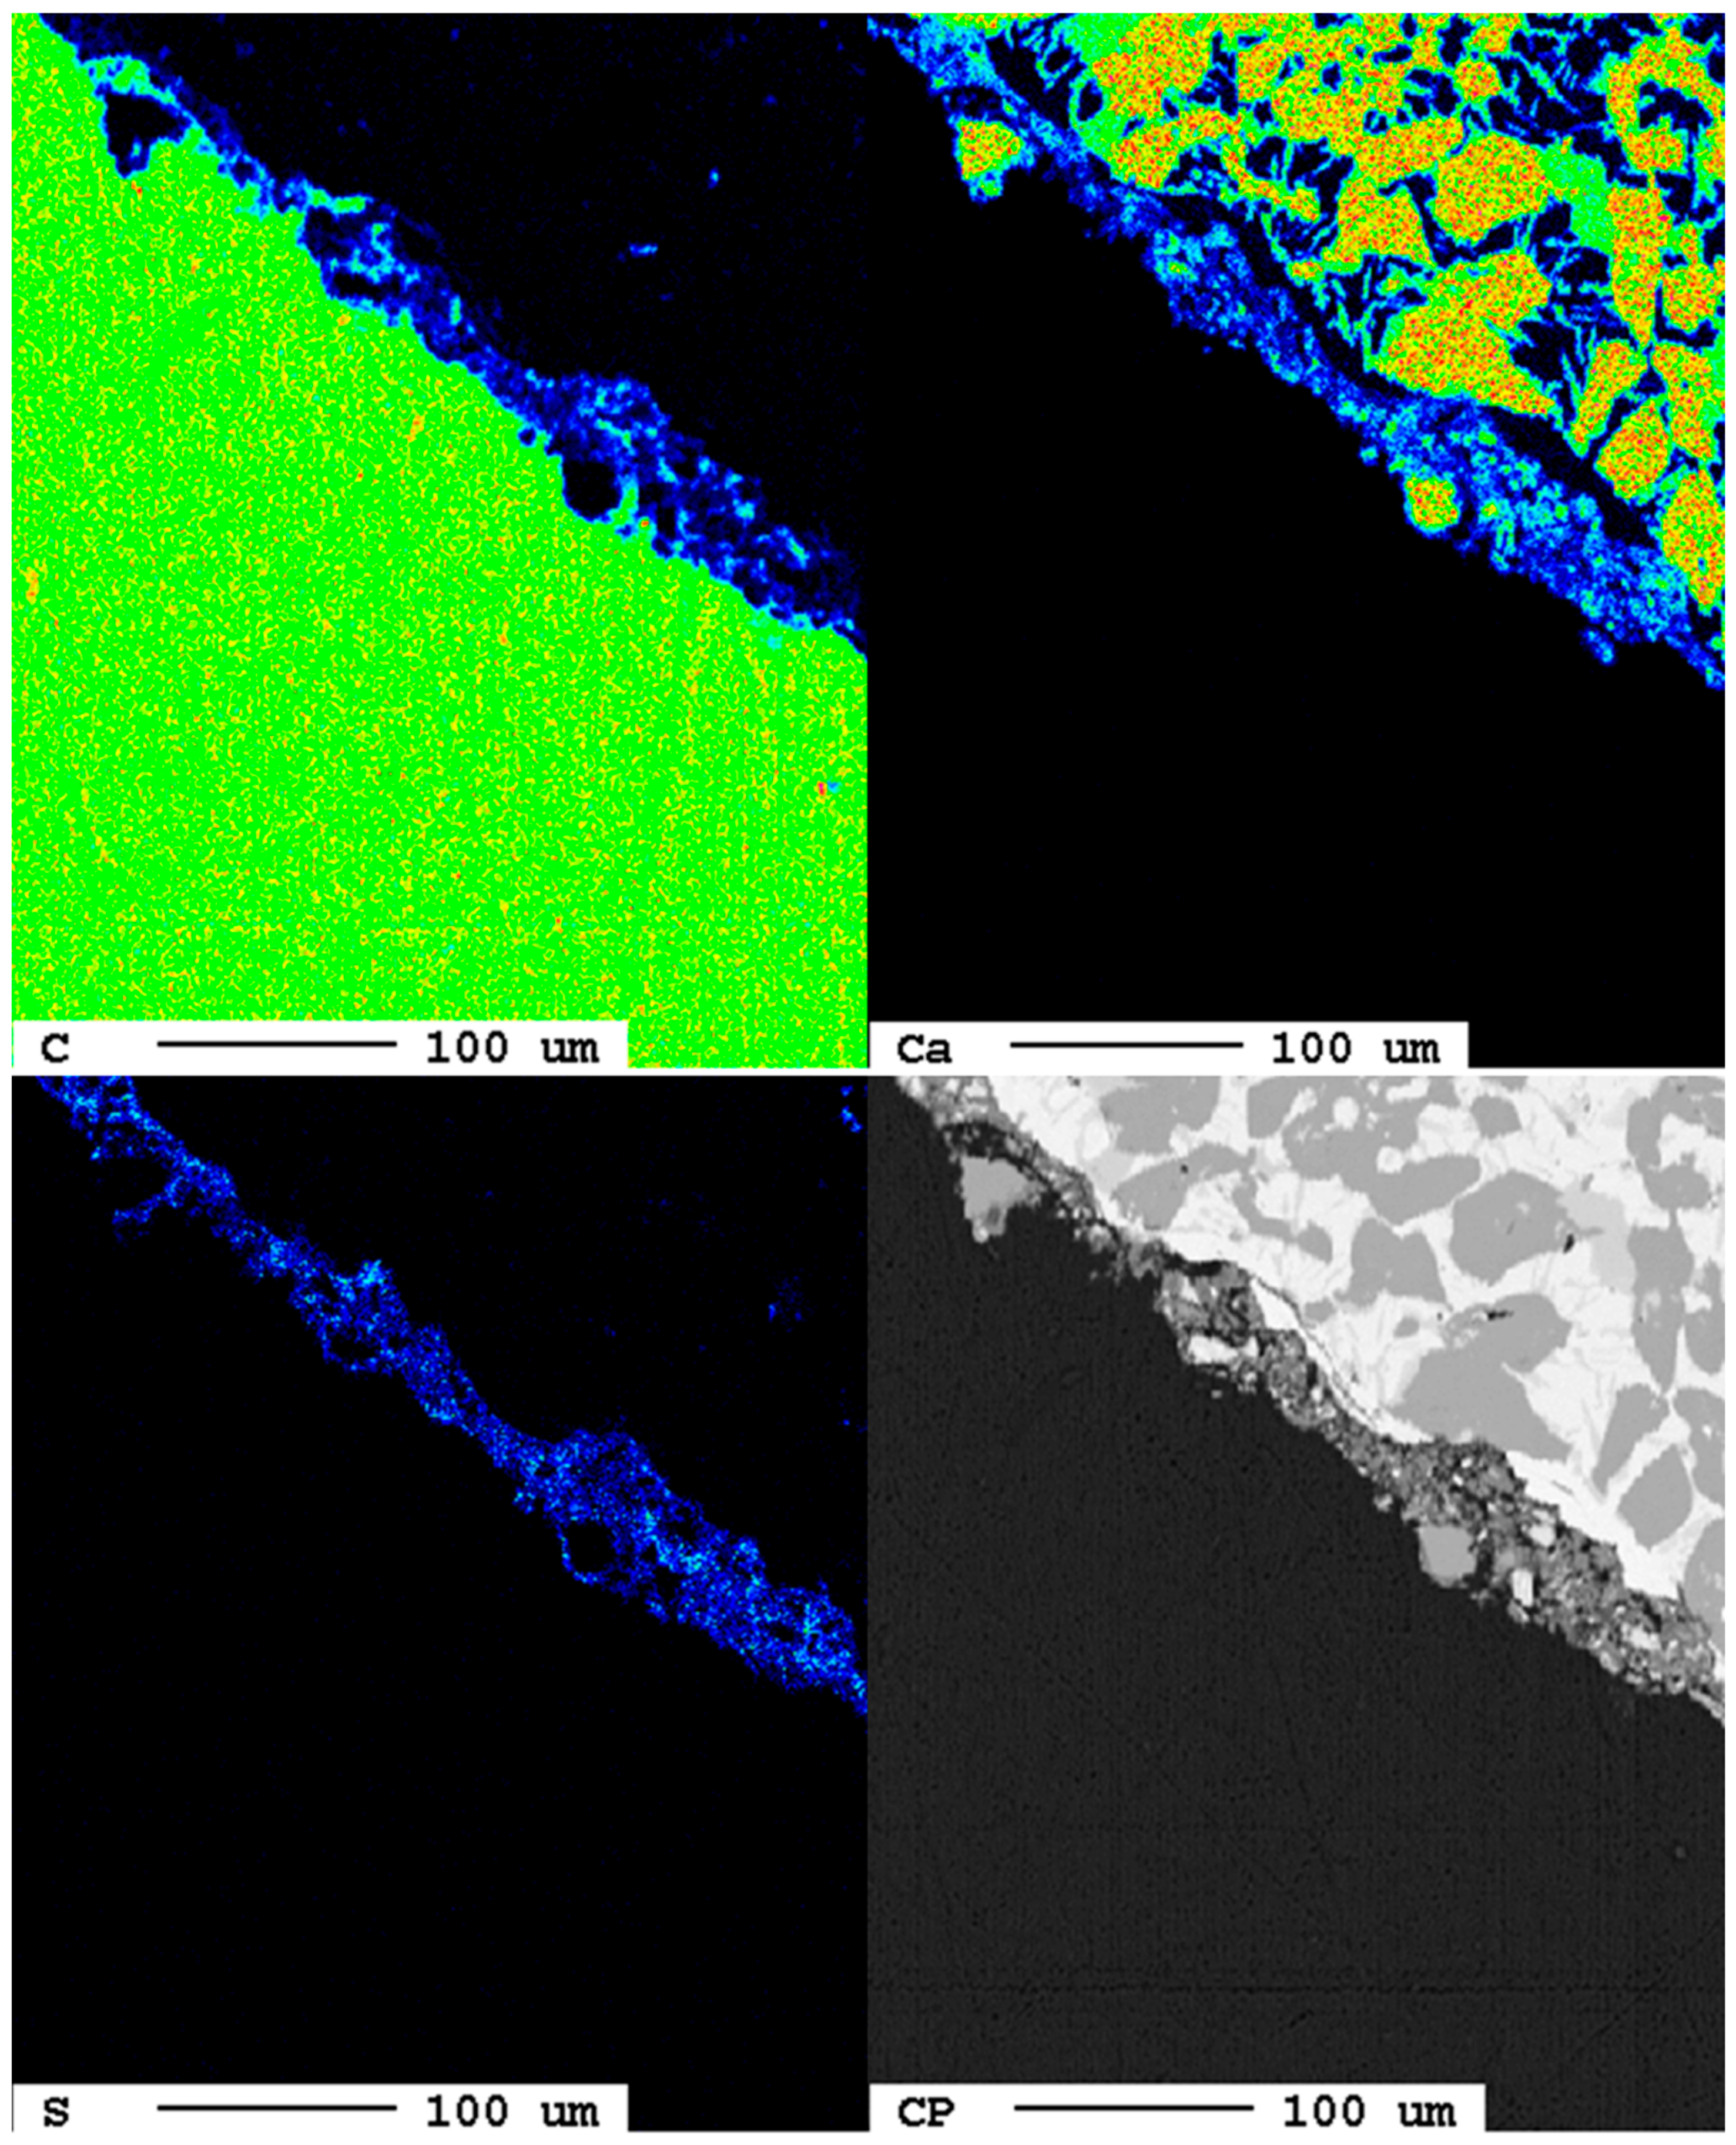
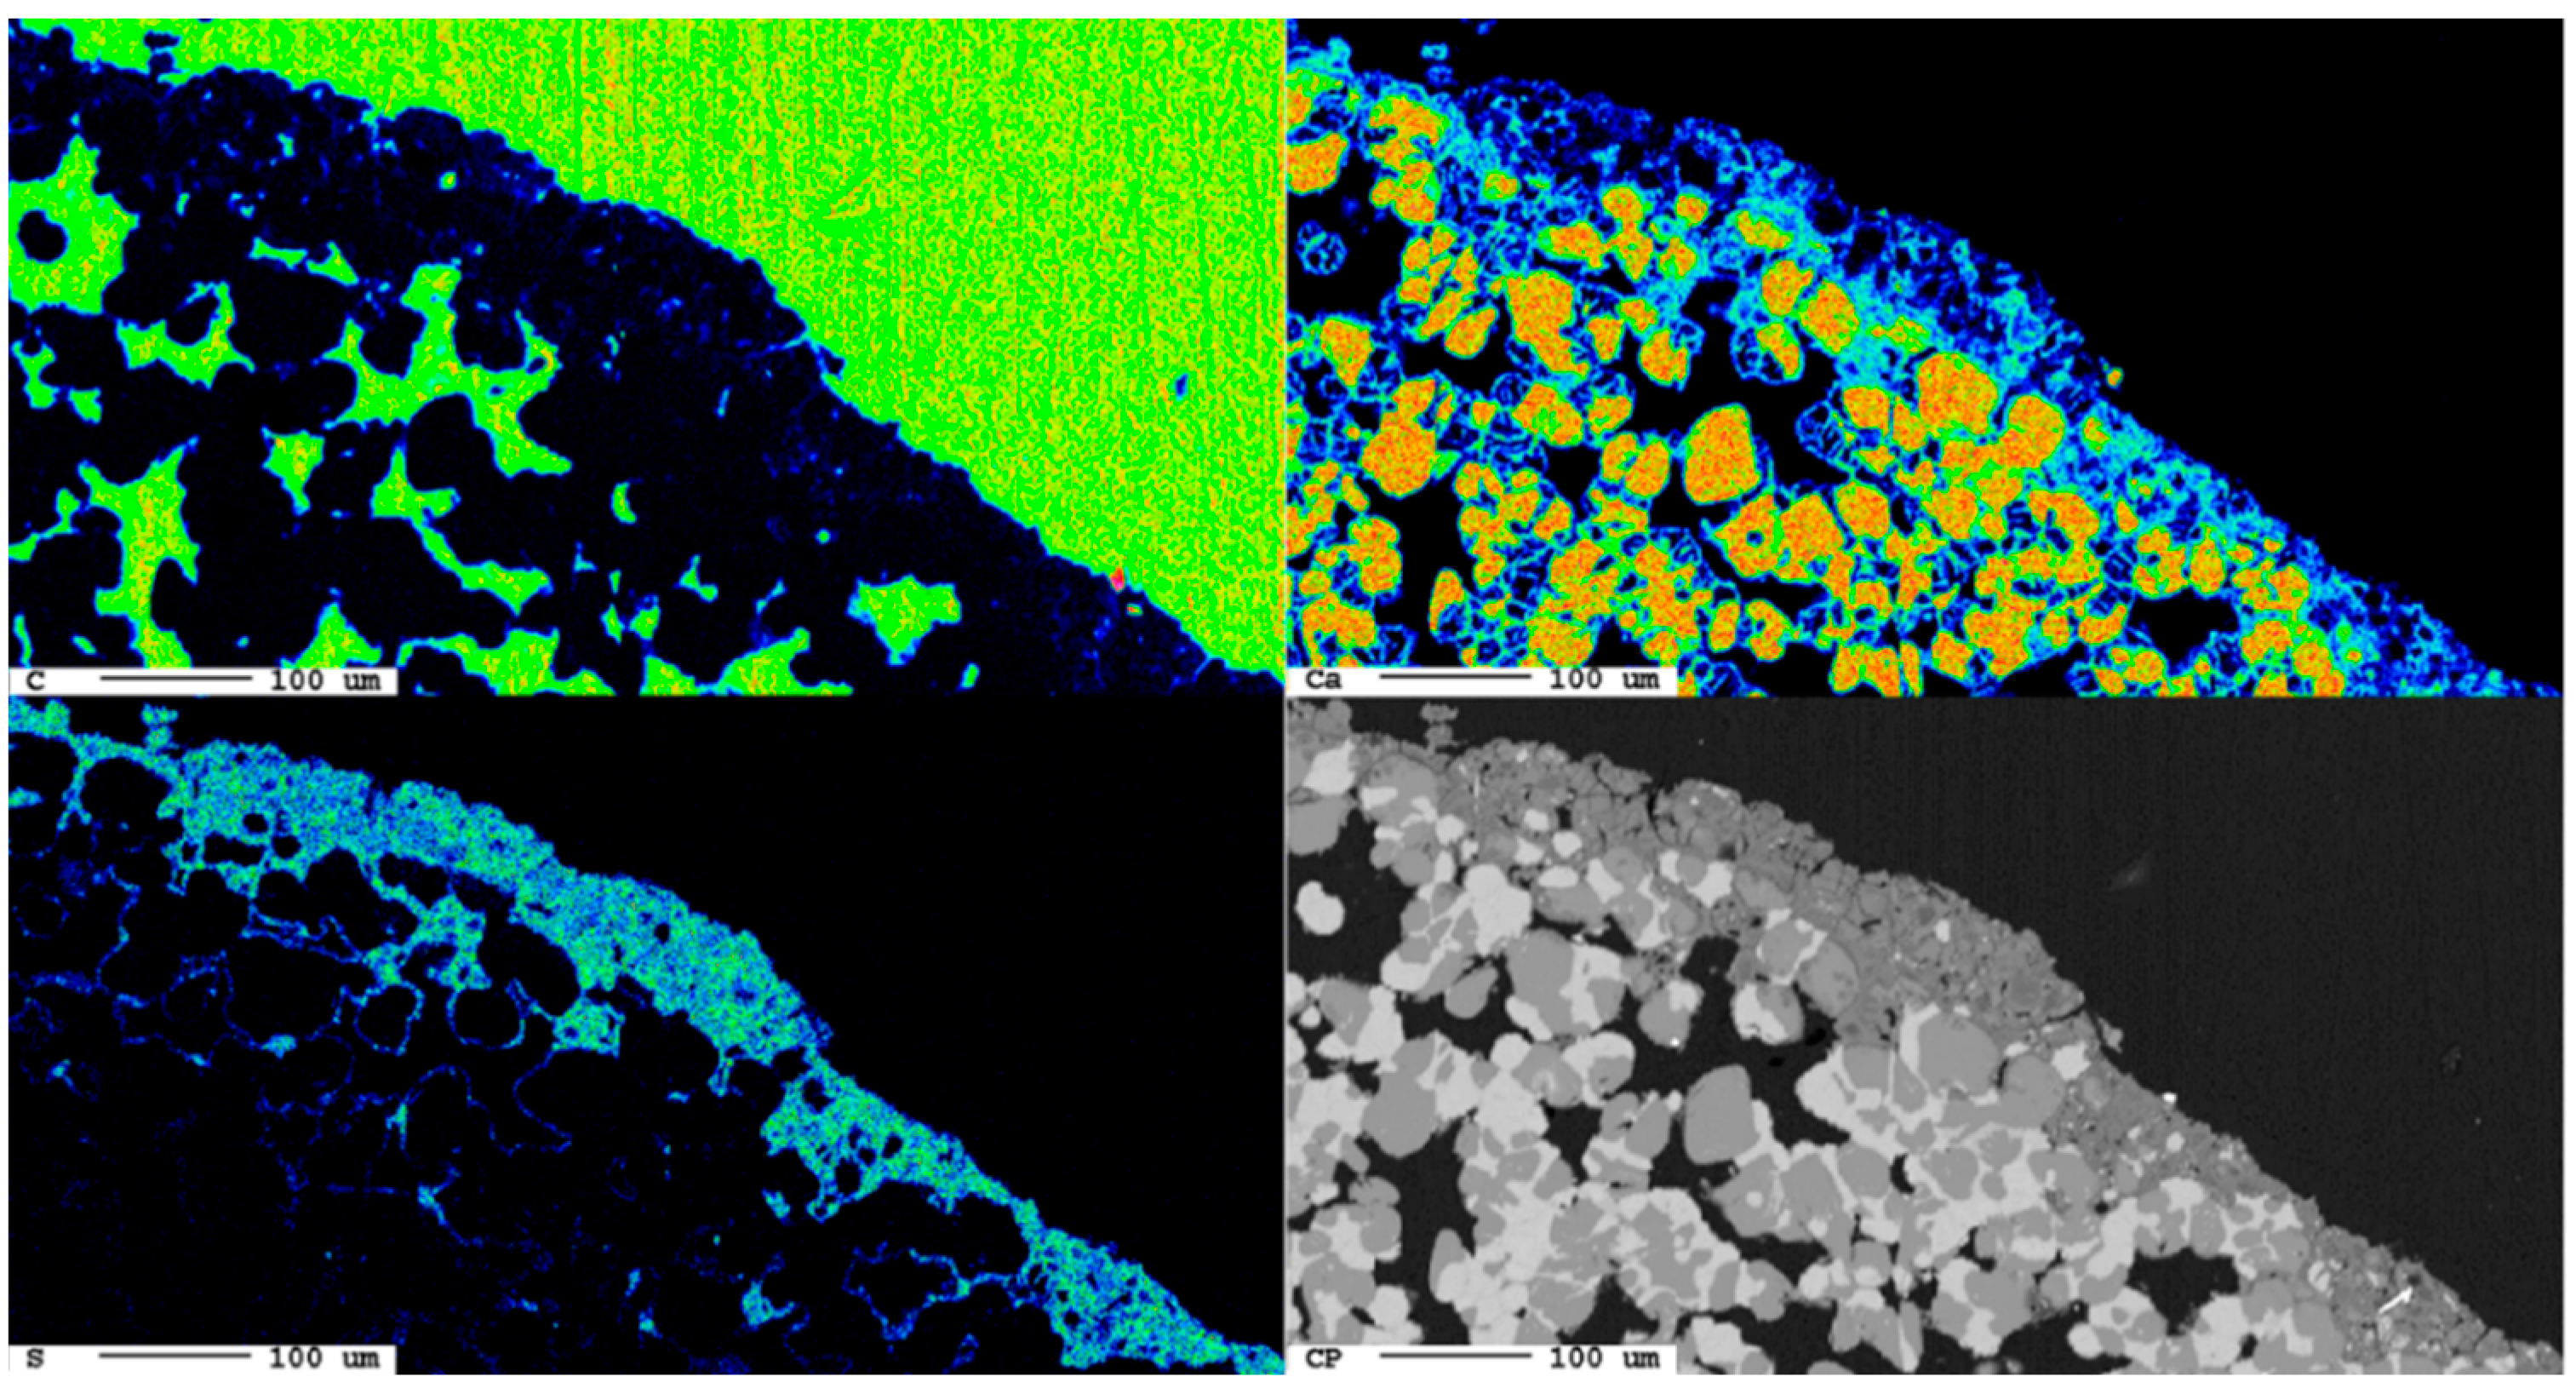
Already after one day of carbonation, single spots at the grain surface show carbonation features first. In the elemental distribution maps of carbon, these are visible as a blueish reaction rim at the surface. Furthermore, calcium and, interestingly, also sulfur are present. In the backscattered electron image, this reaction rim appears in dark gray due to the lower mass number of the chemical elements present (Figure 9).
The reaction rim is displayed in detail in Figure 10. The association of carbon calcium indicates the formation of calcium carbonate, CaCO3. However, the increased sulfur contents hint to the presence of dispersed sulfide or sulfate phases. It is suggested that the flue gas might also have contained SO2 which could have reacted with the slag. The reaction rim is only 20 µm thick and only locally evolved.
After three days of reaction, a similar result is obtained (Figure 11).
Again, in the upper part of the sample, the epoxy resin is visible. At the top right, a reaction rim occurs which is displayed in more detail in Figure 12. Compared to the sample after 1 d, neither with respect to the share of carbonated surface nor regarding the thickness of the carbonate layer, a significant difference can be seen. As in the sample after 1 d, after 3 d, significant concentrations of sulfur also occur.
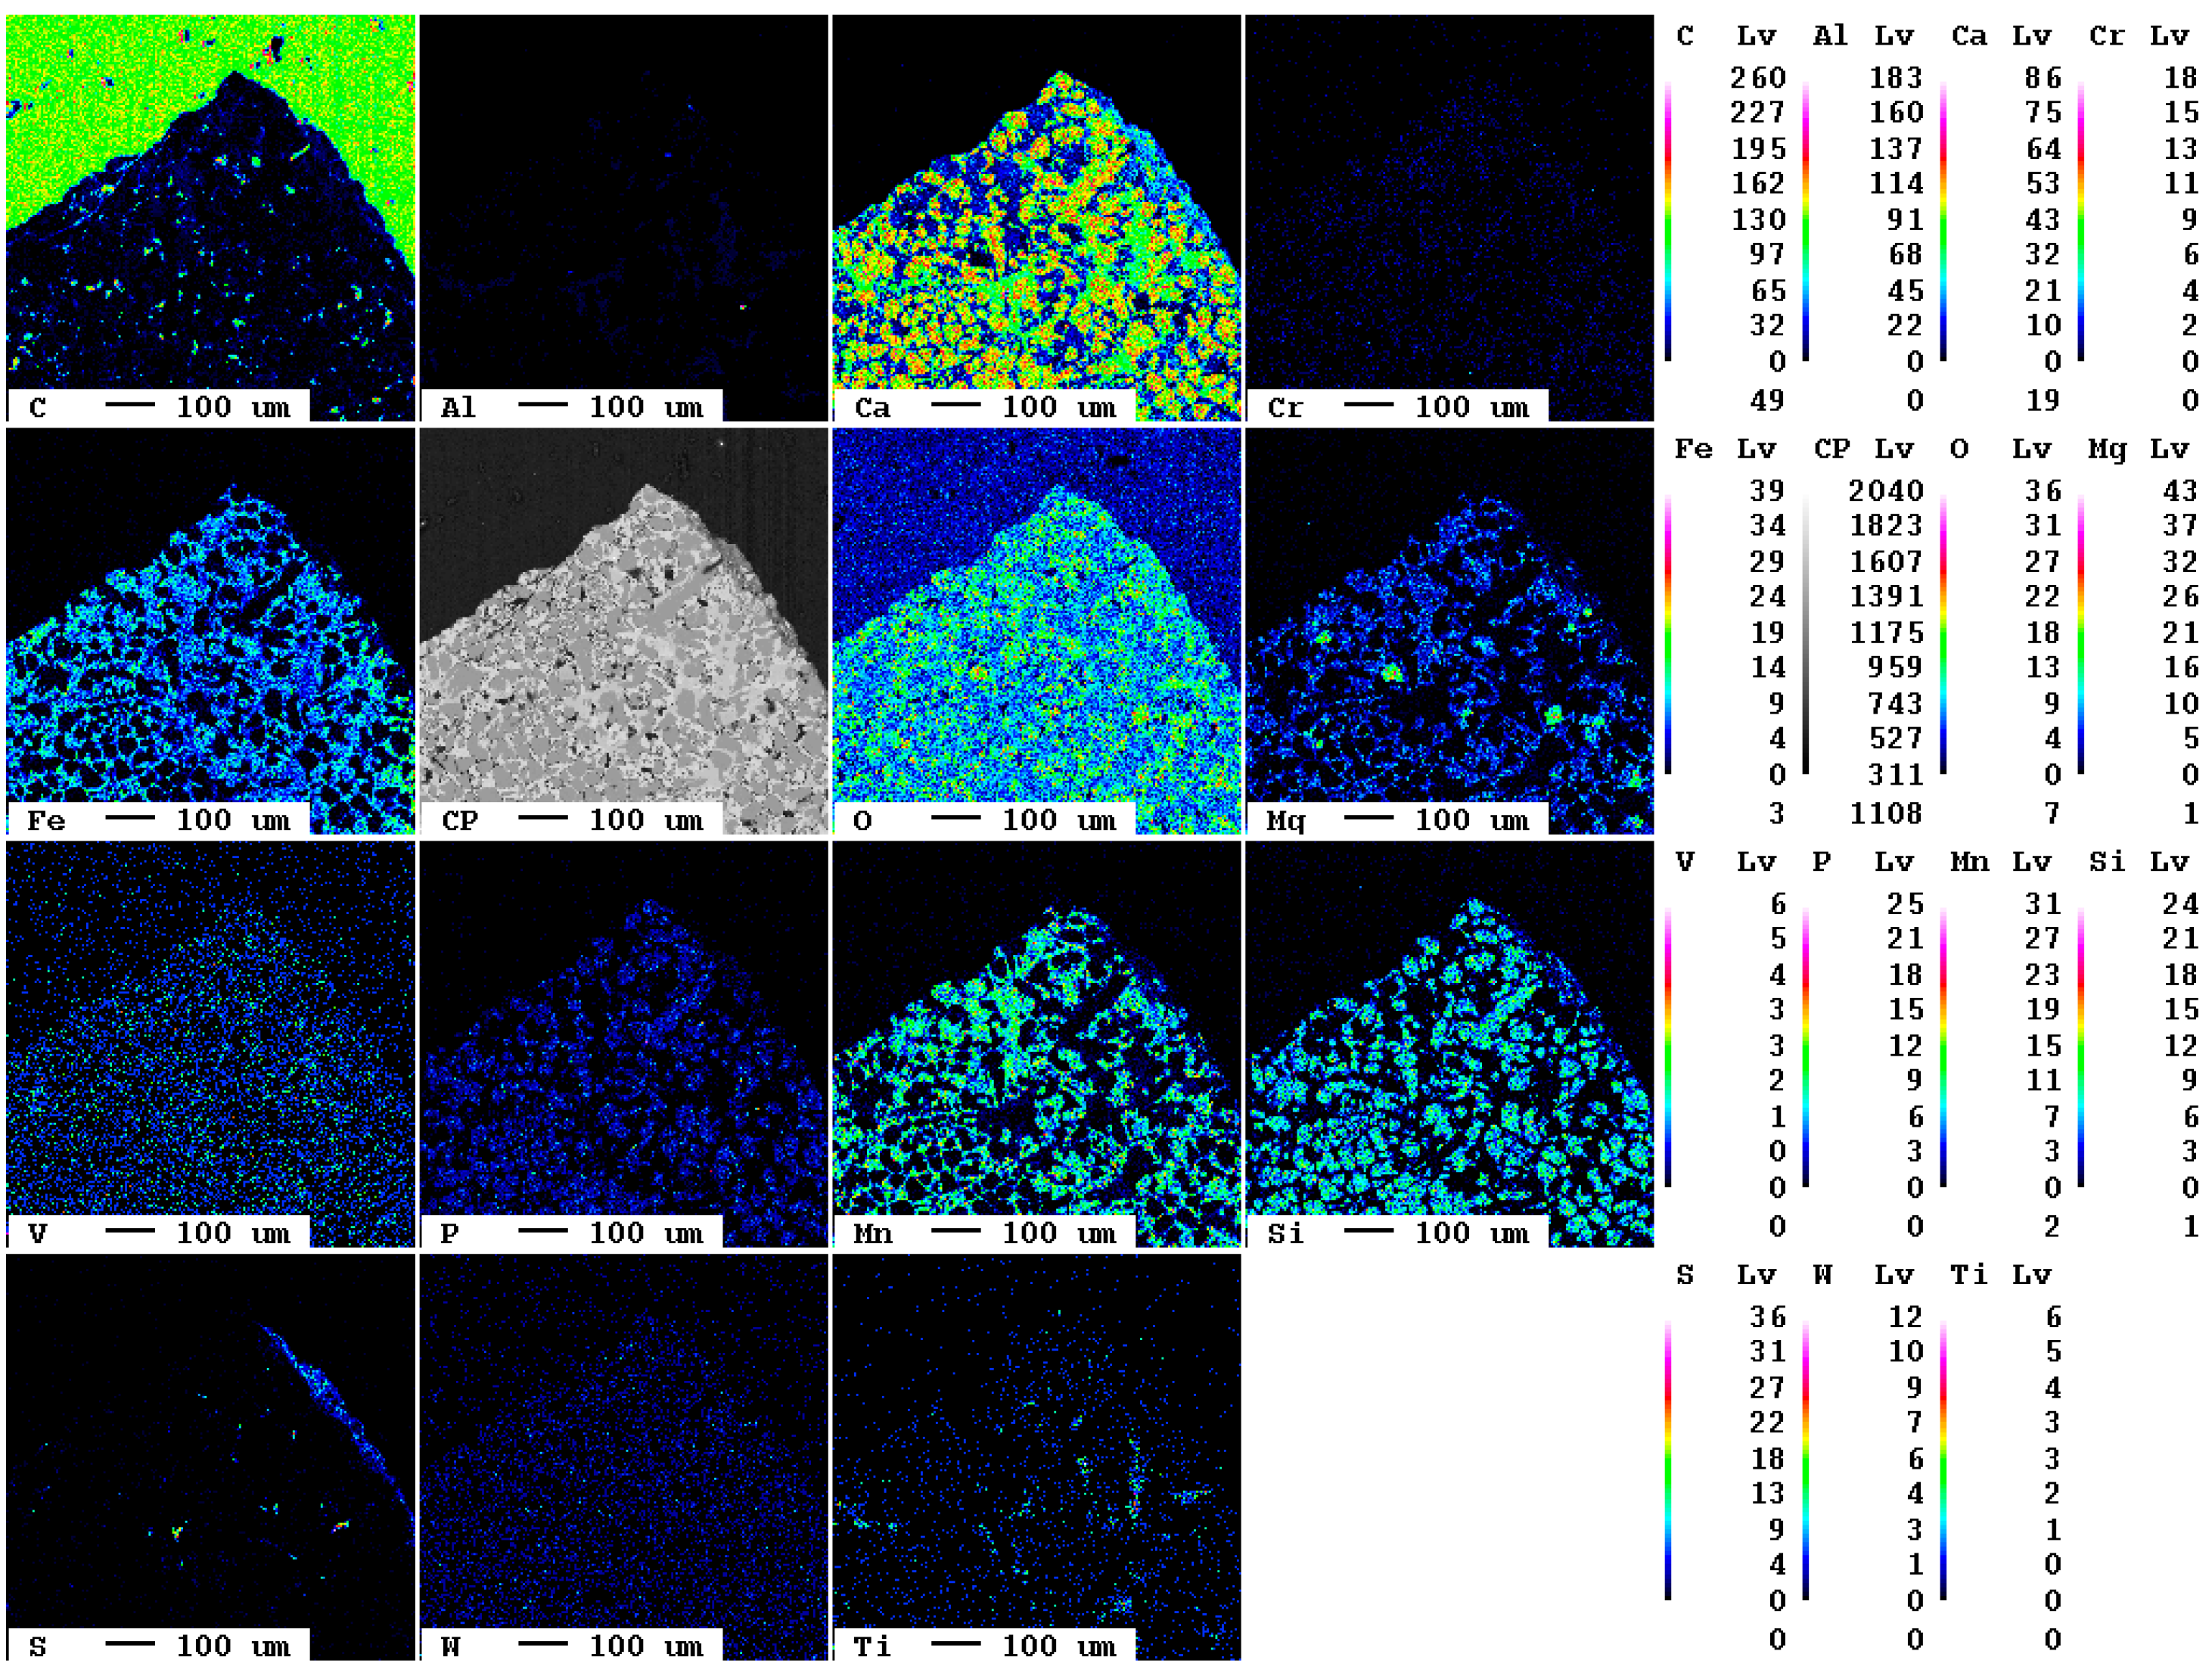
After an experimental duration of 9 d, a similar state is observed (Figure 13).
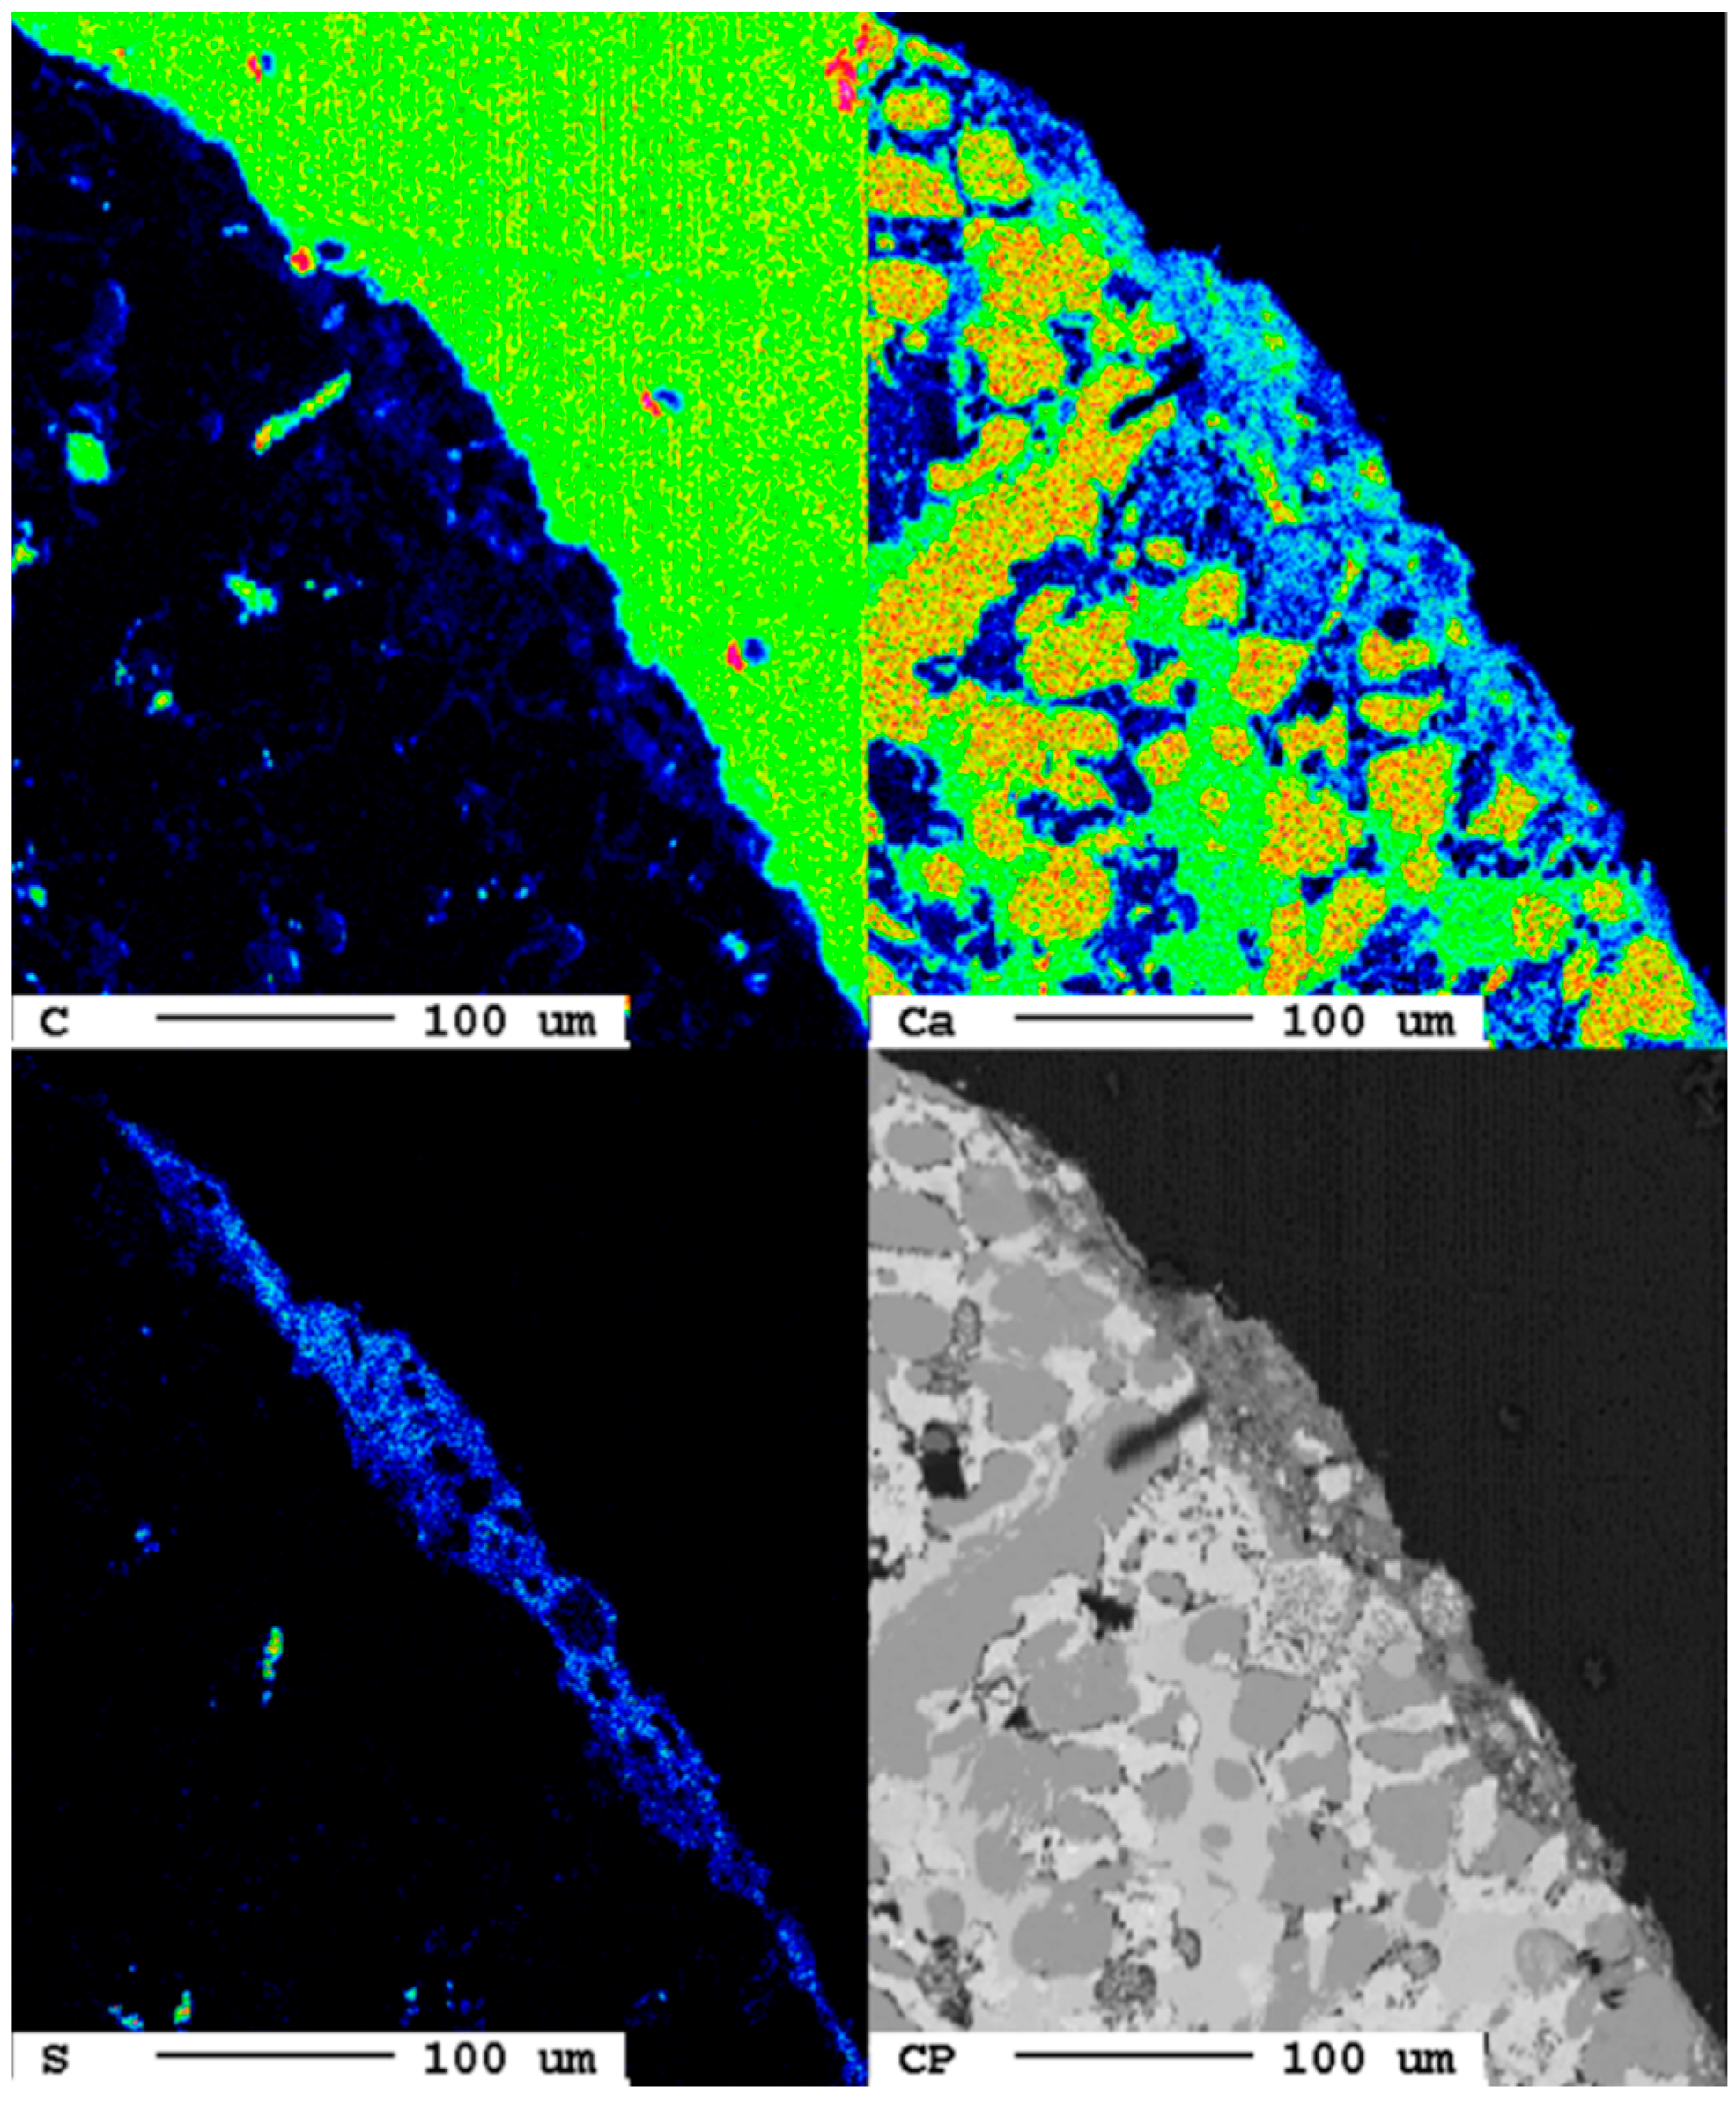
The section was produced from a hand specimen of higher porosity resulting in a strong signal of carbon in the elemental distribution map from the epoxy resin in the pores. The reaction rim is displayed in detail in Figure 14. The elemental distribution map of carbon in the reaction rim shows only an inhomogeneous signal, whereas calcium and especially sulfur show a more homogeneous distribution. However, the false-color image is slightly misleading as turquoise hues in the carbon map correspond to an intensity of 70, and in the sulfur map, only of 5. Still, it can be confirmed that at the grain boundary that not only carbonation, but also the formation of sulfur-containing phases occurs.
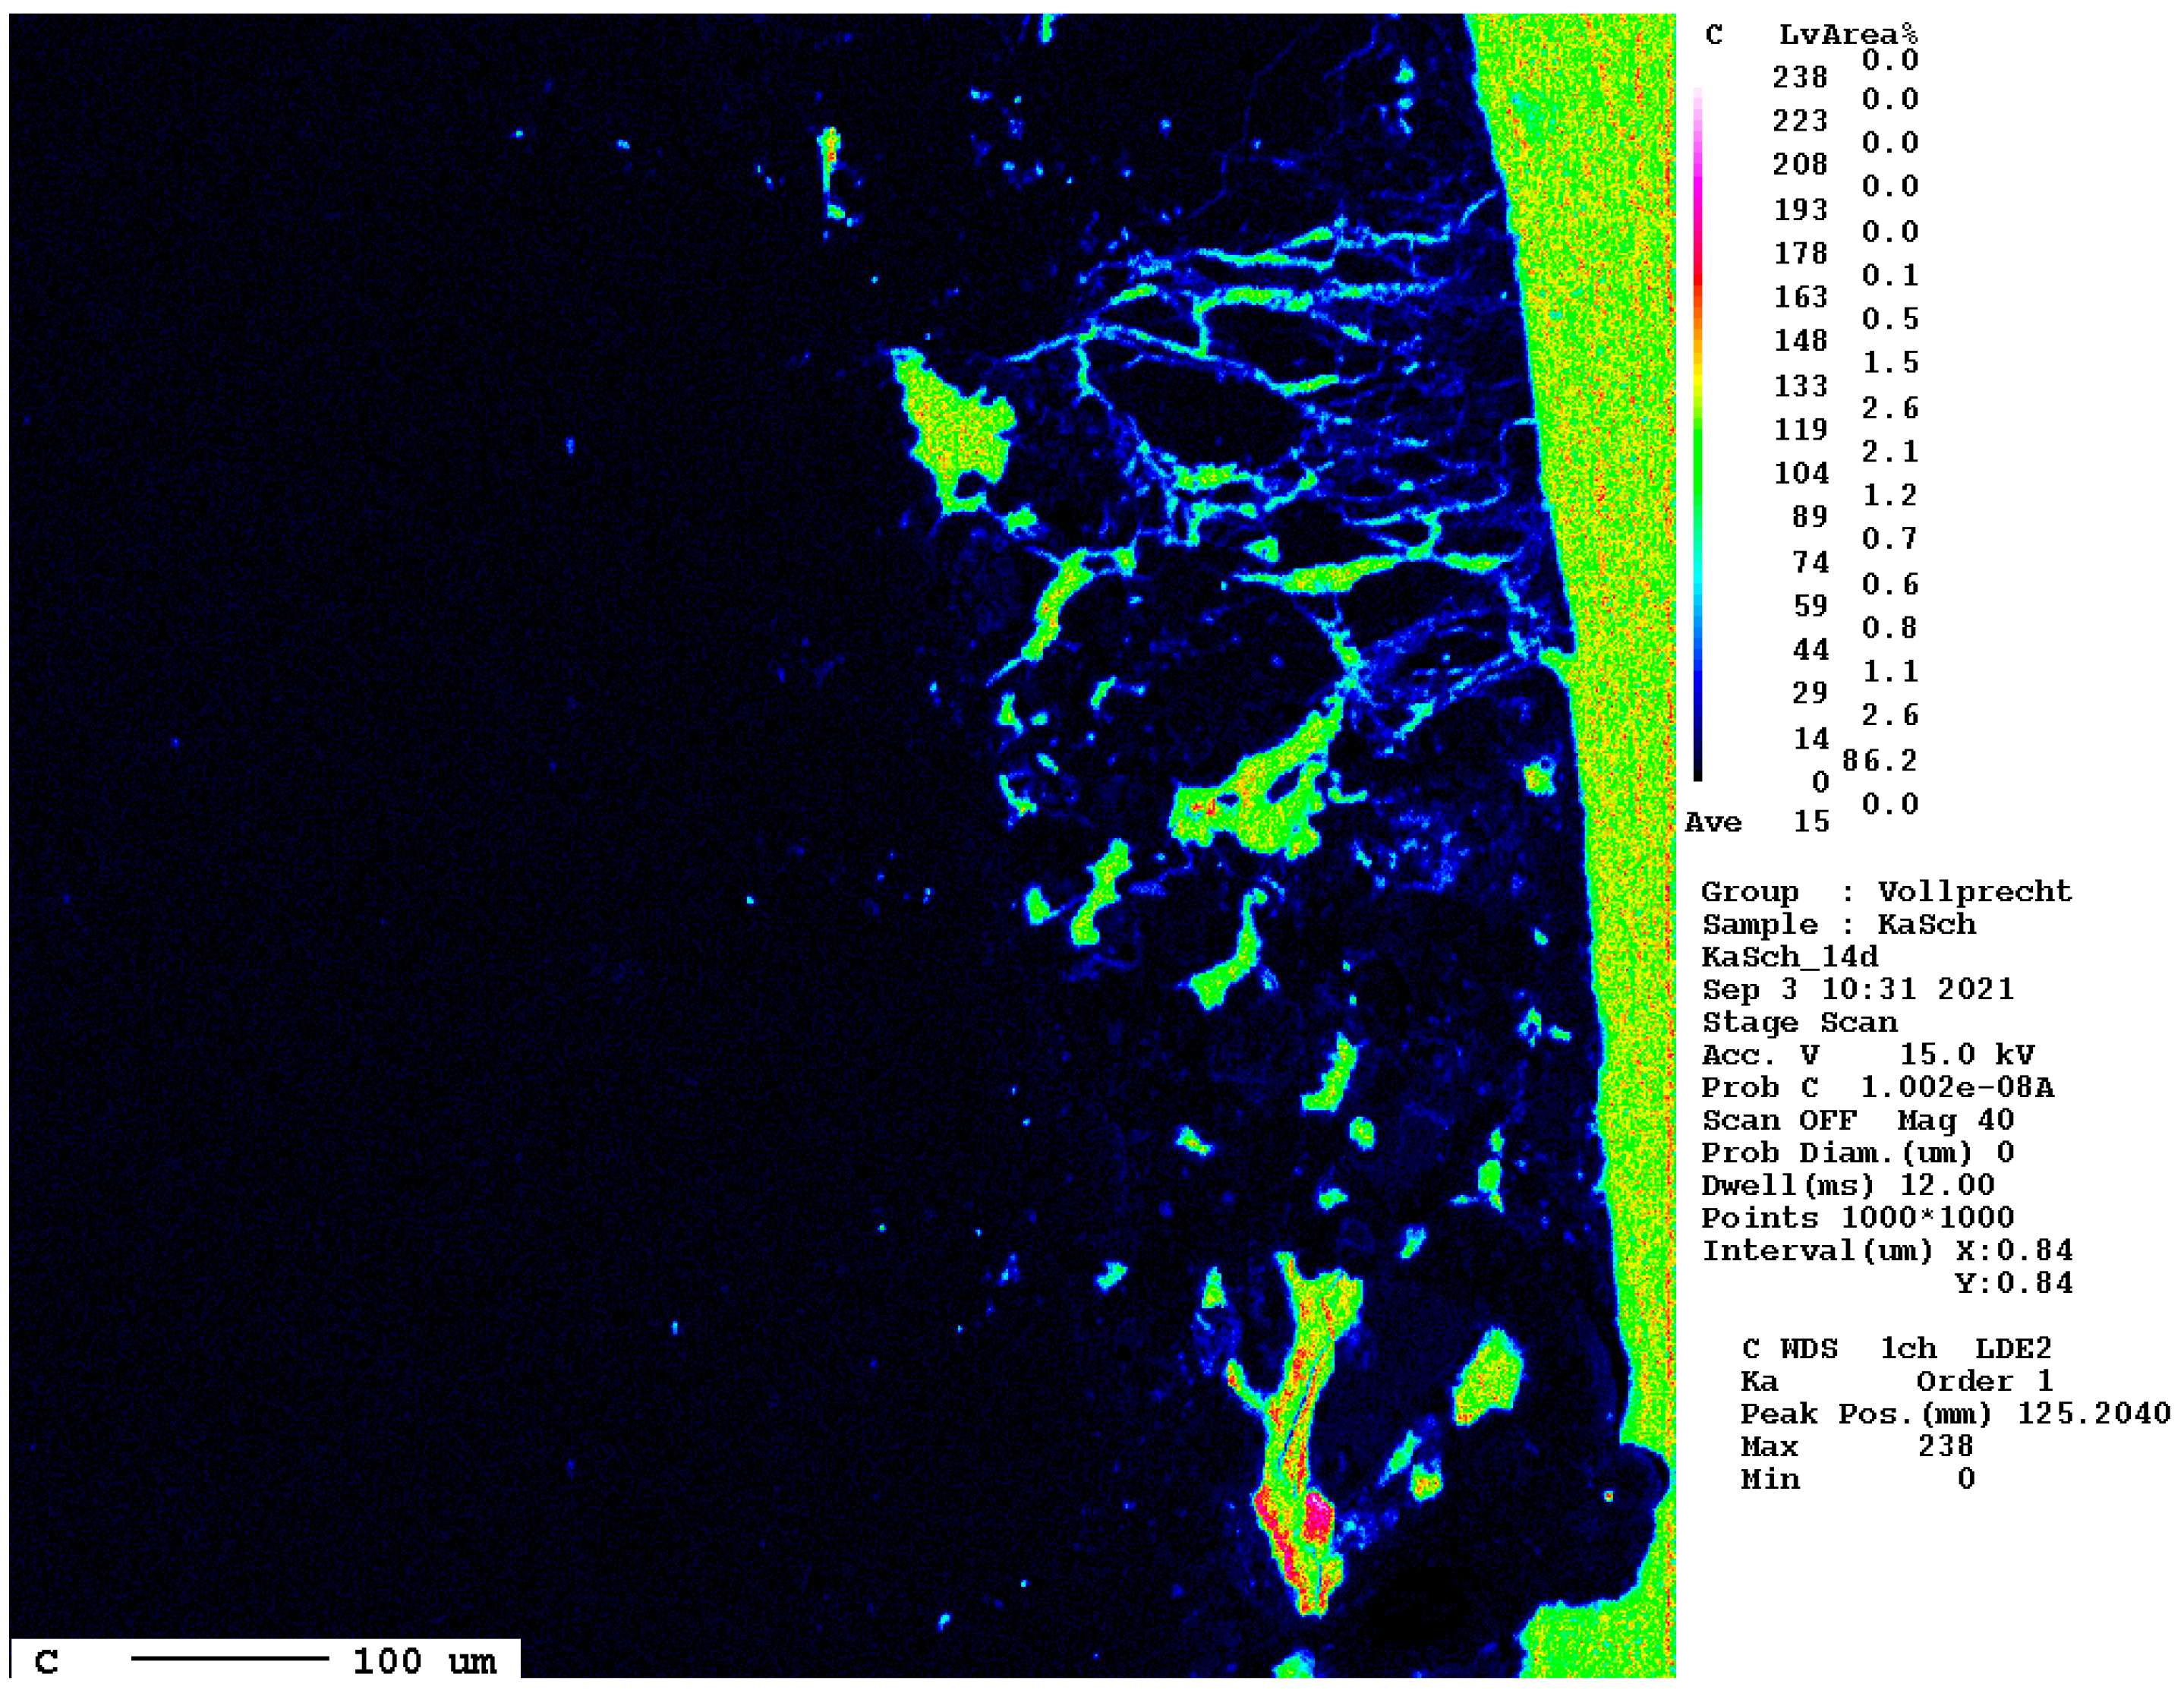
Additionally, after 14 d, there are only local carbonation and sulfate formation features visible in the reaction rim (Figure 15). At the very right, the embedding medium with its high carbon content is visible; at the left, the slag covers the largest part of the image. In the lower area of the contact, an area of about 200 × 500 µm with increased contents of sulfur and—compared to the slag—increased carbon contents can also be seen. However, due to the carbon-rich resin, they occur only as dark blue hues in the false-color image.
The elemental distribution map of carbon is displayed separately in Figure 16.
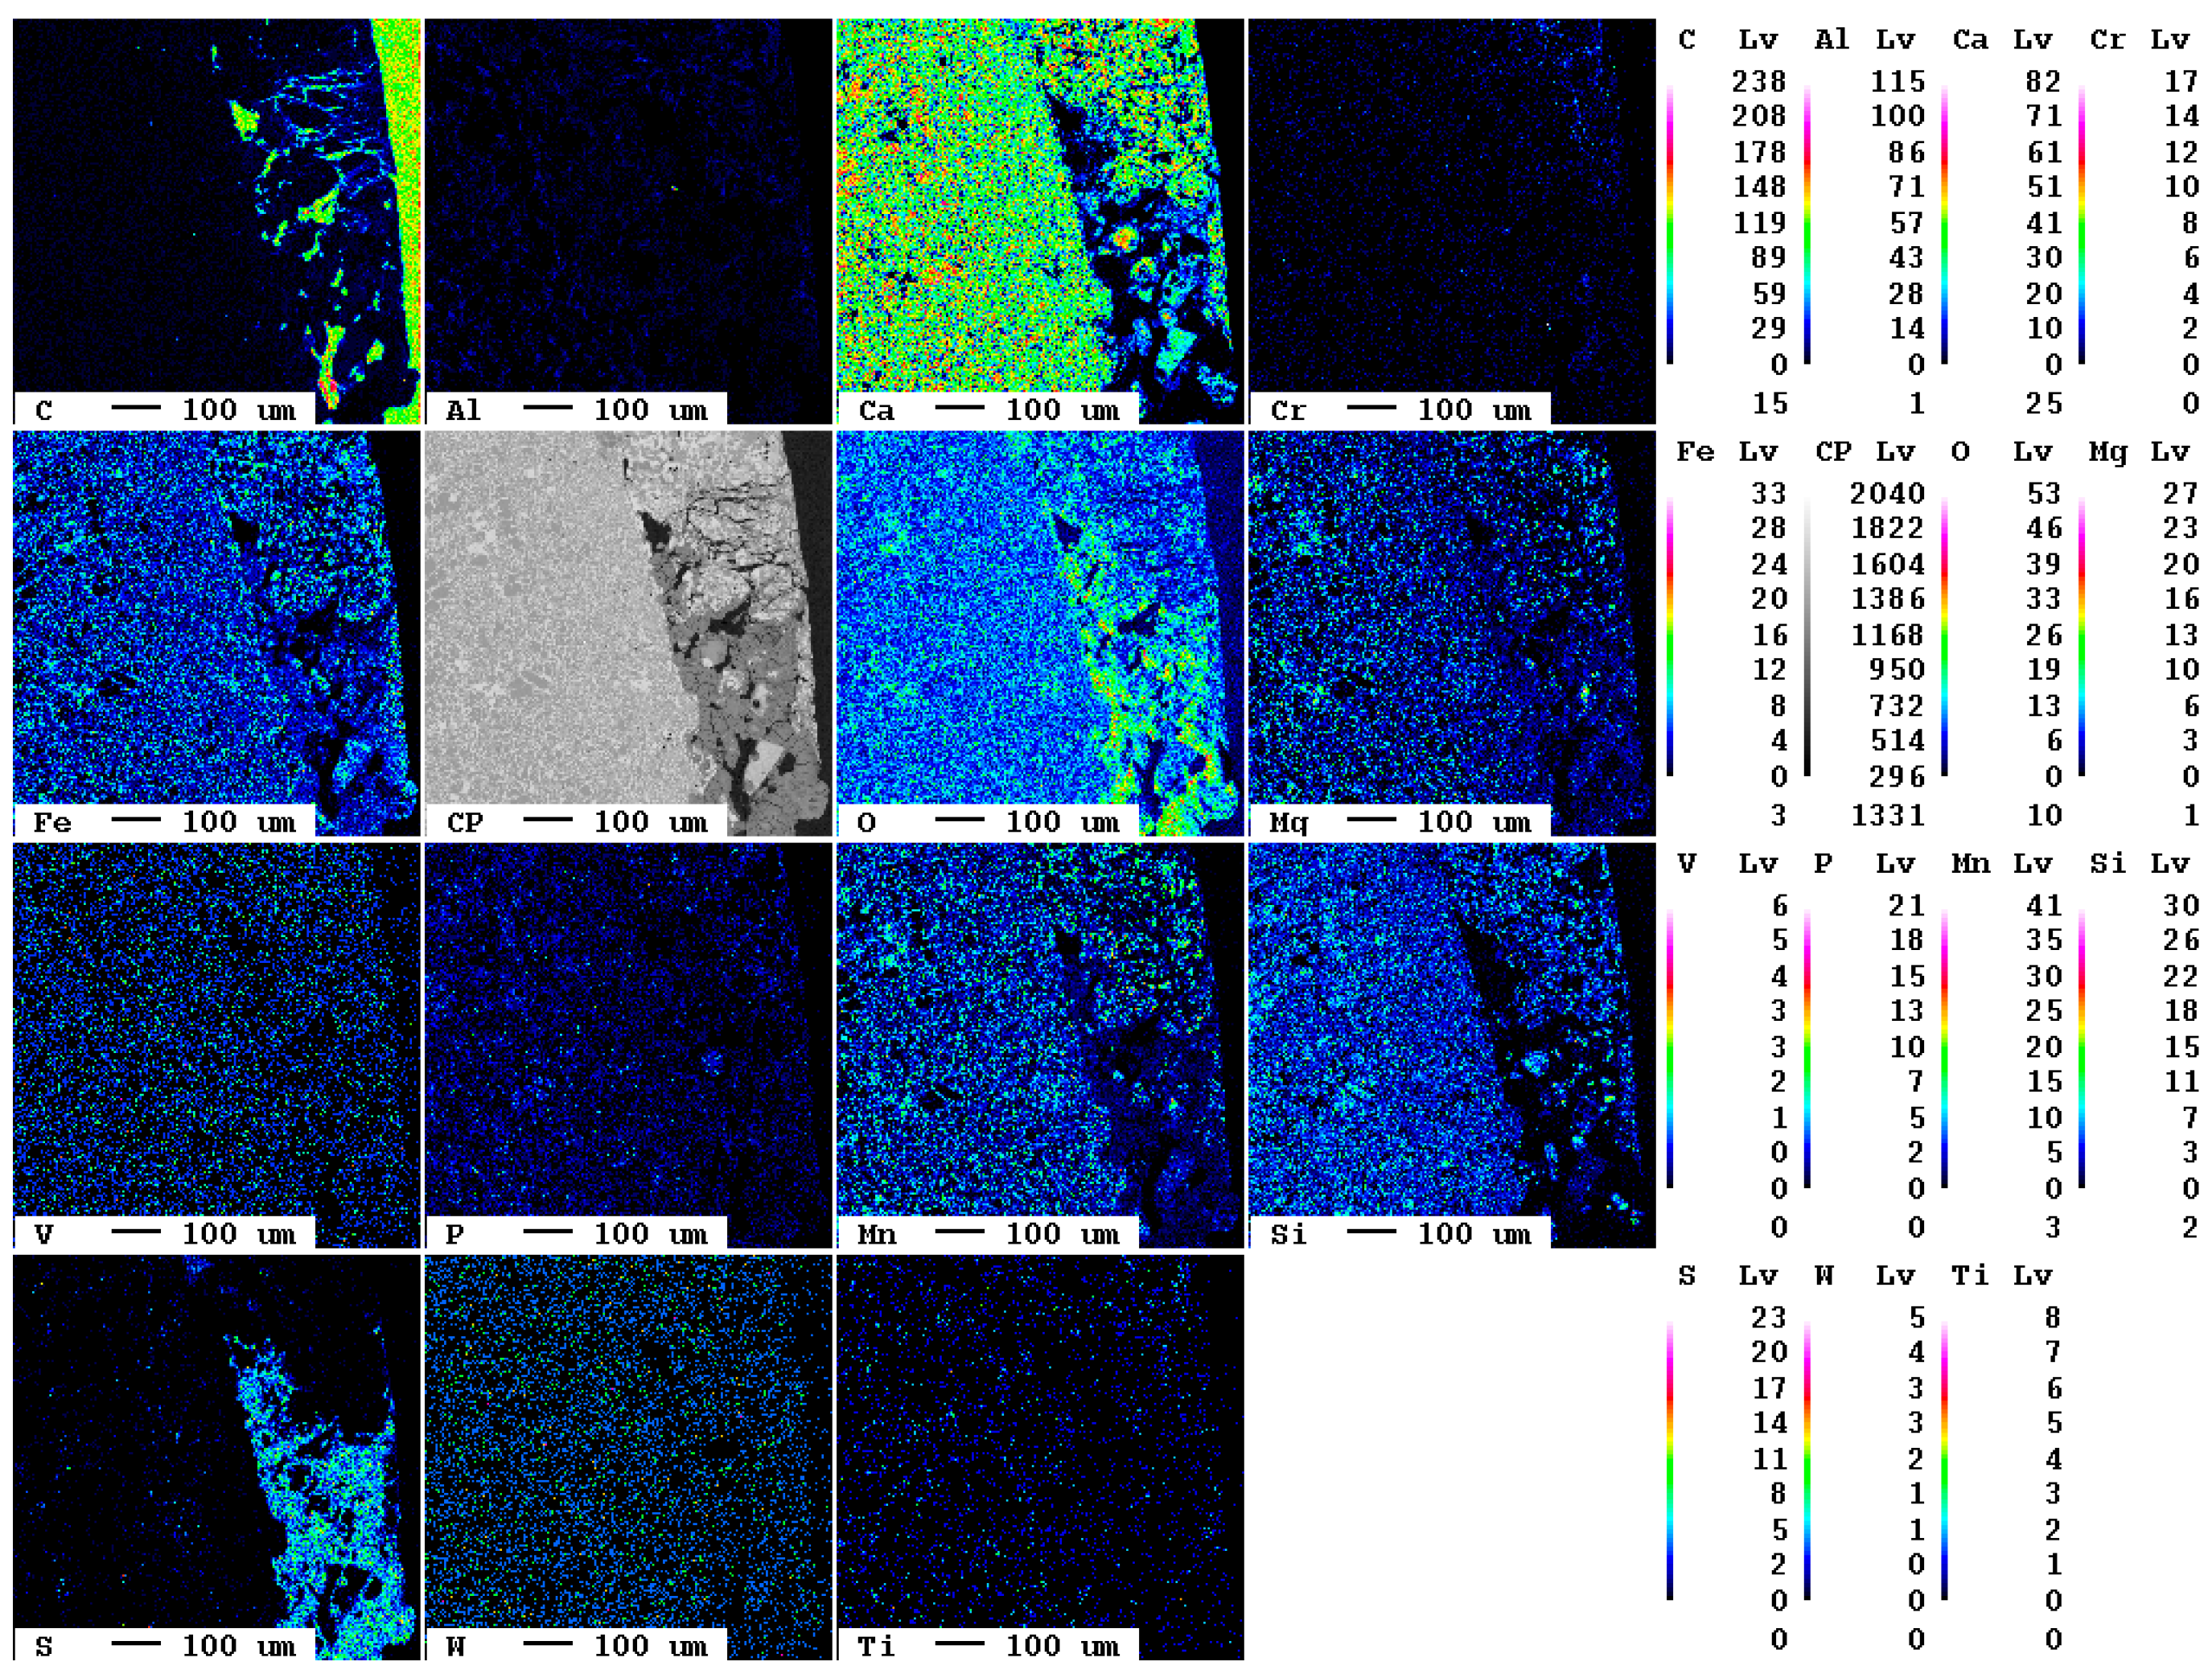
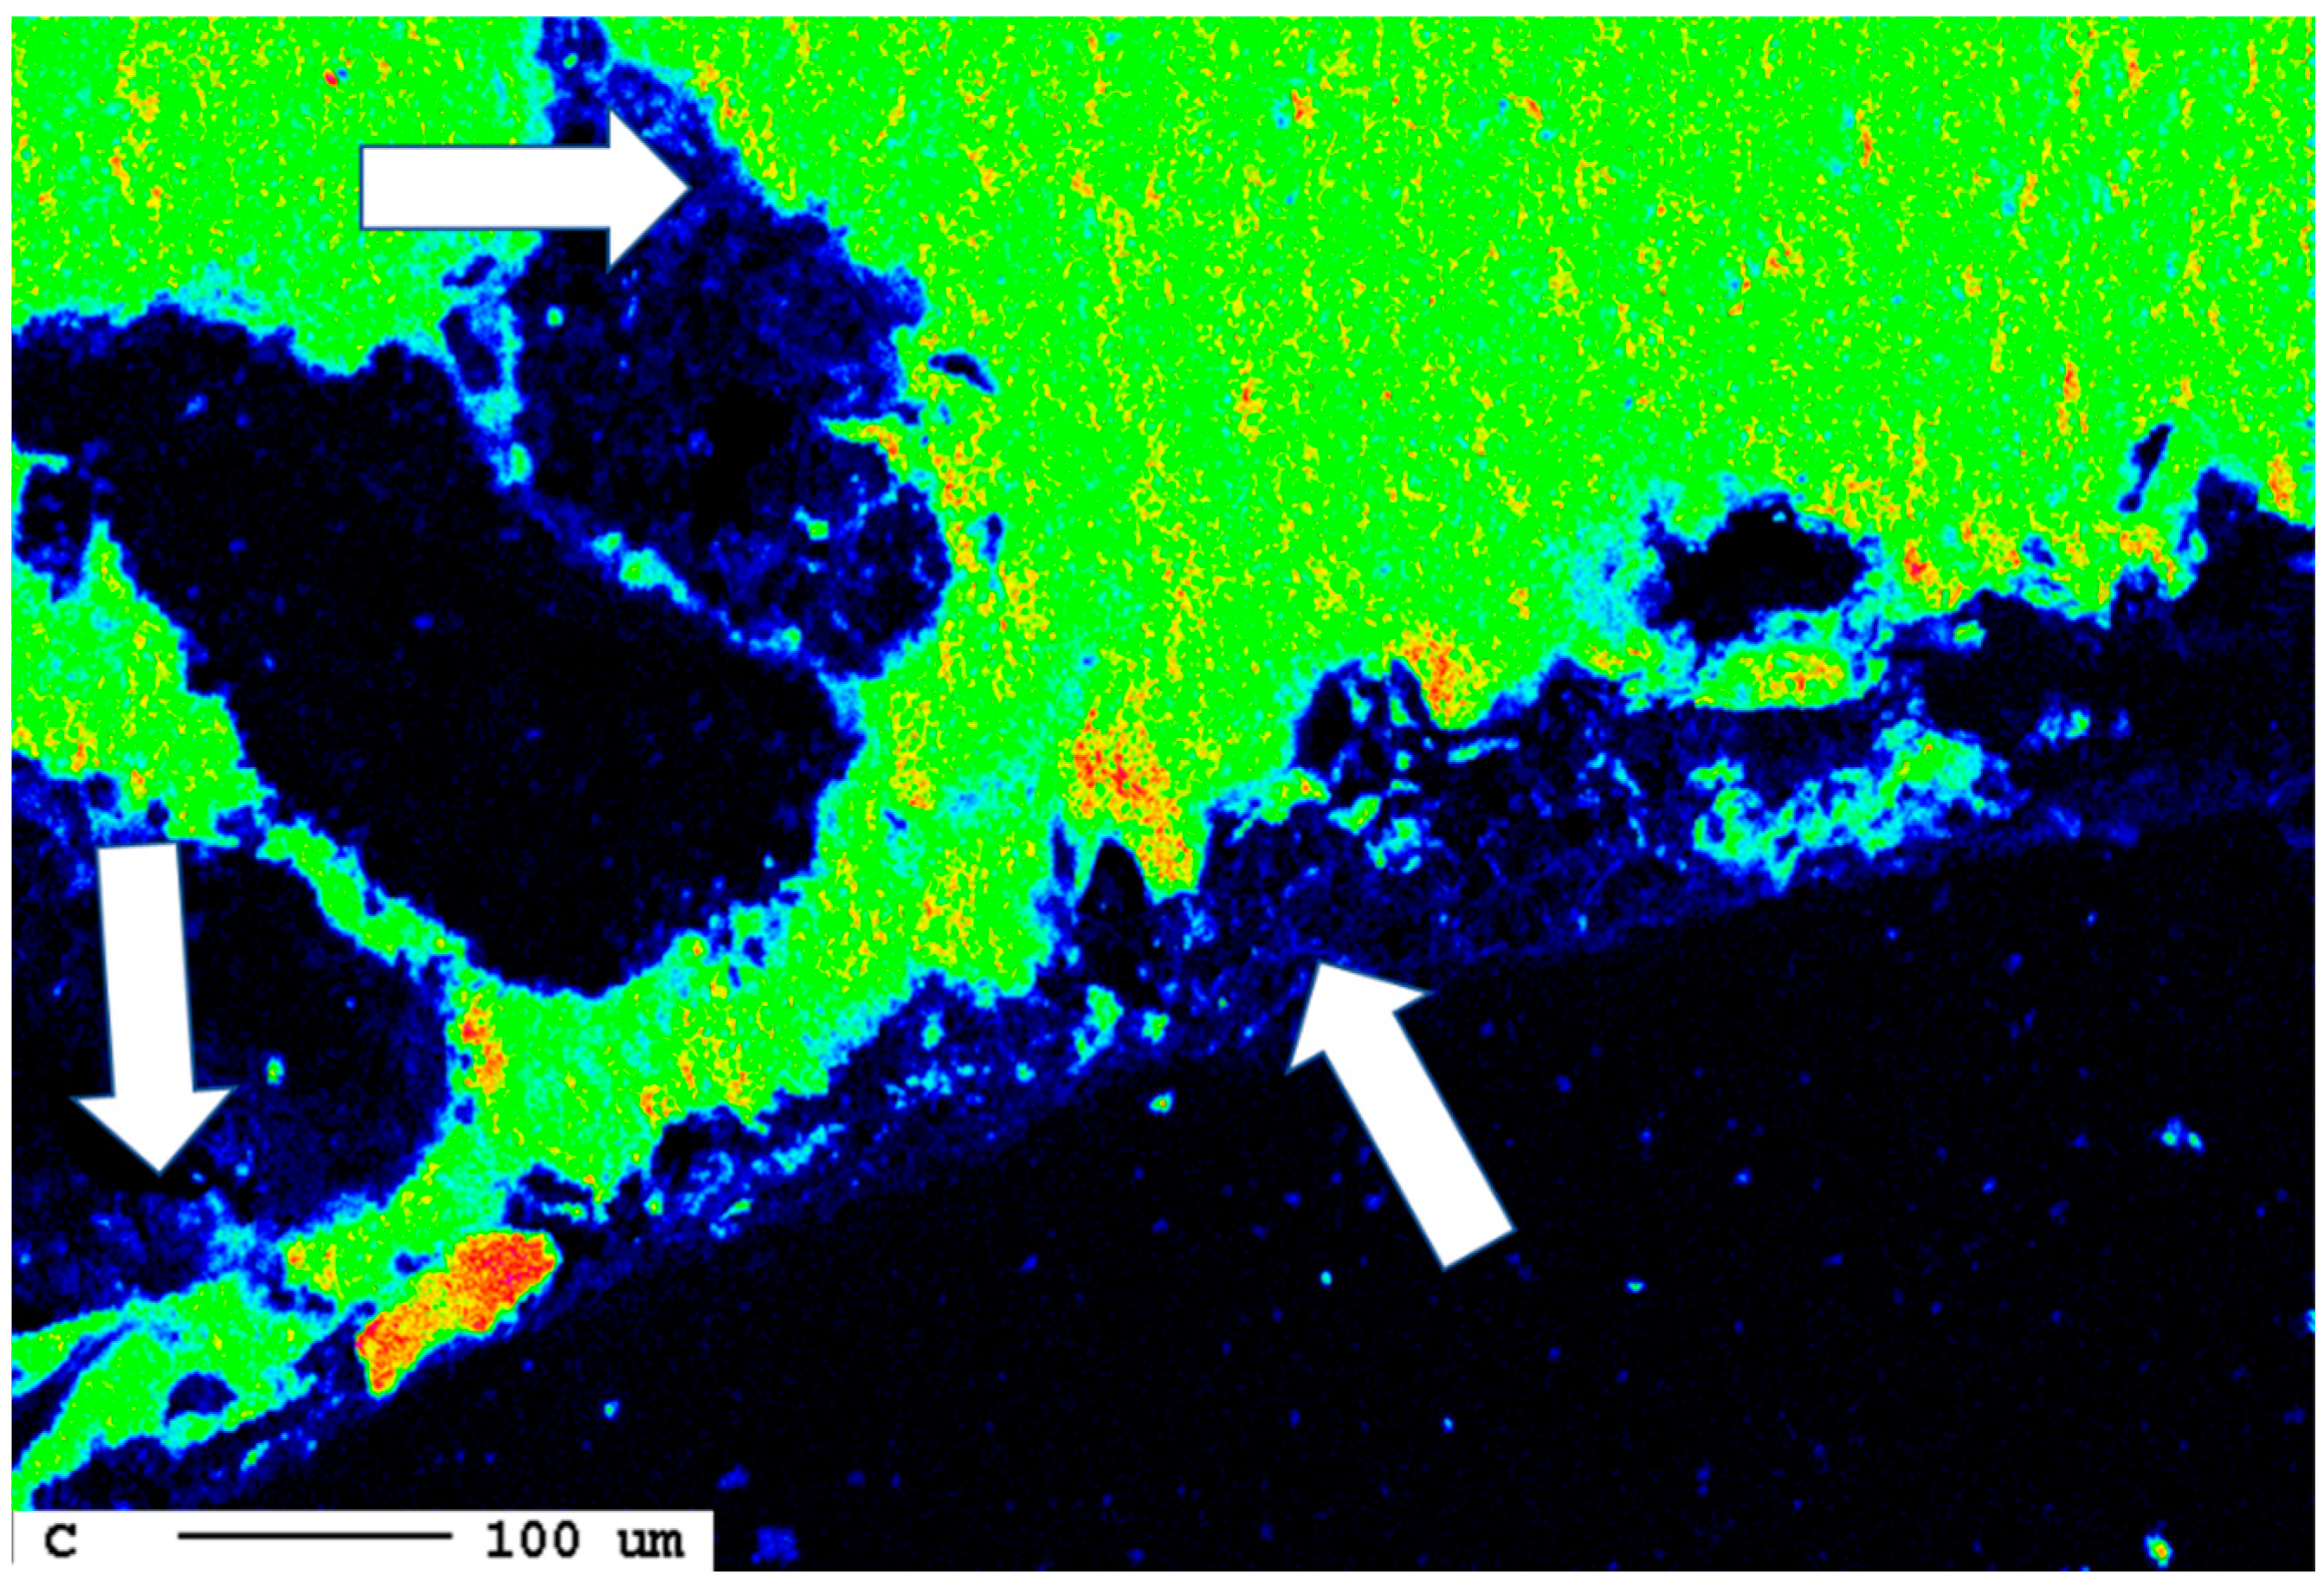
After a reaction time of 24 d, larger fragments of secondary phases occur at the surface of the slag (Figure 17).
The area of the reaction rim is displayed in detail in Figure 18. The irregular areas with dark blueish tones present an enrichment of carbon compared to the slag. Similar to the samples with lower carbonation duration, no consistent carbonation front is visible. The percentage of carbonated areas might have increased slightly, but this is not clear due to the very low share of carbonates and the heterogeneity of the samples.
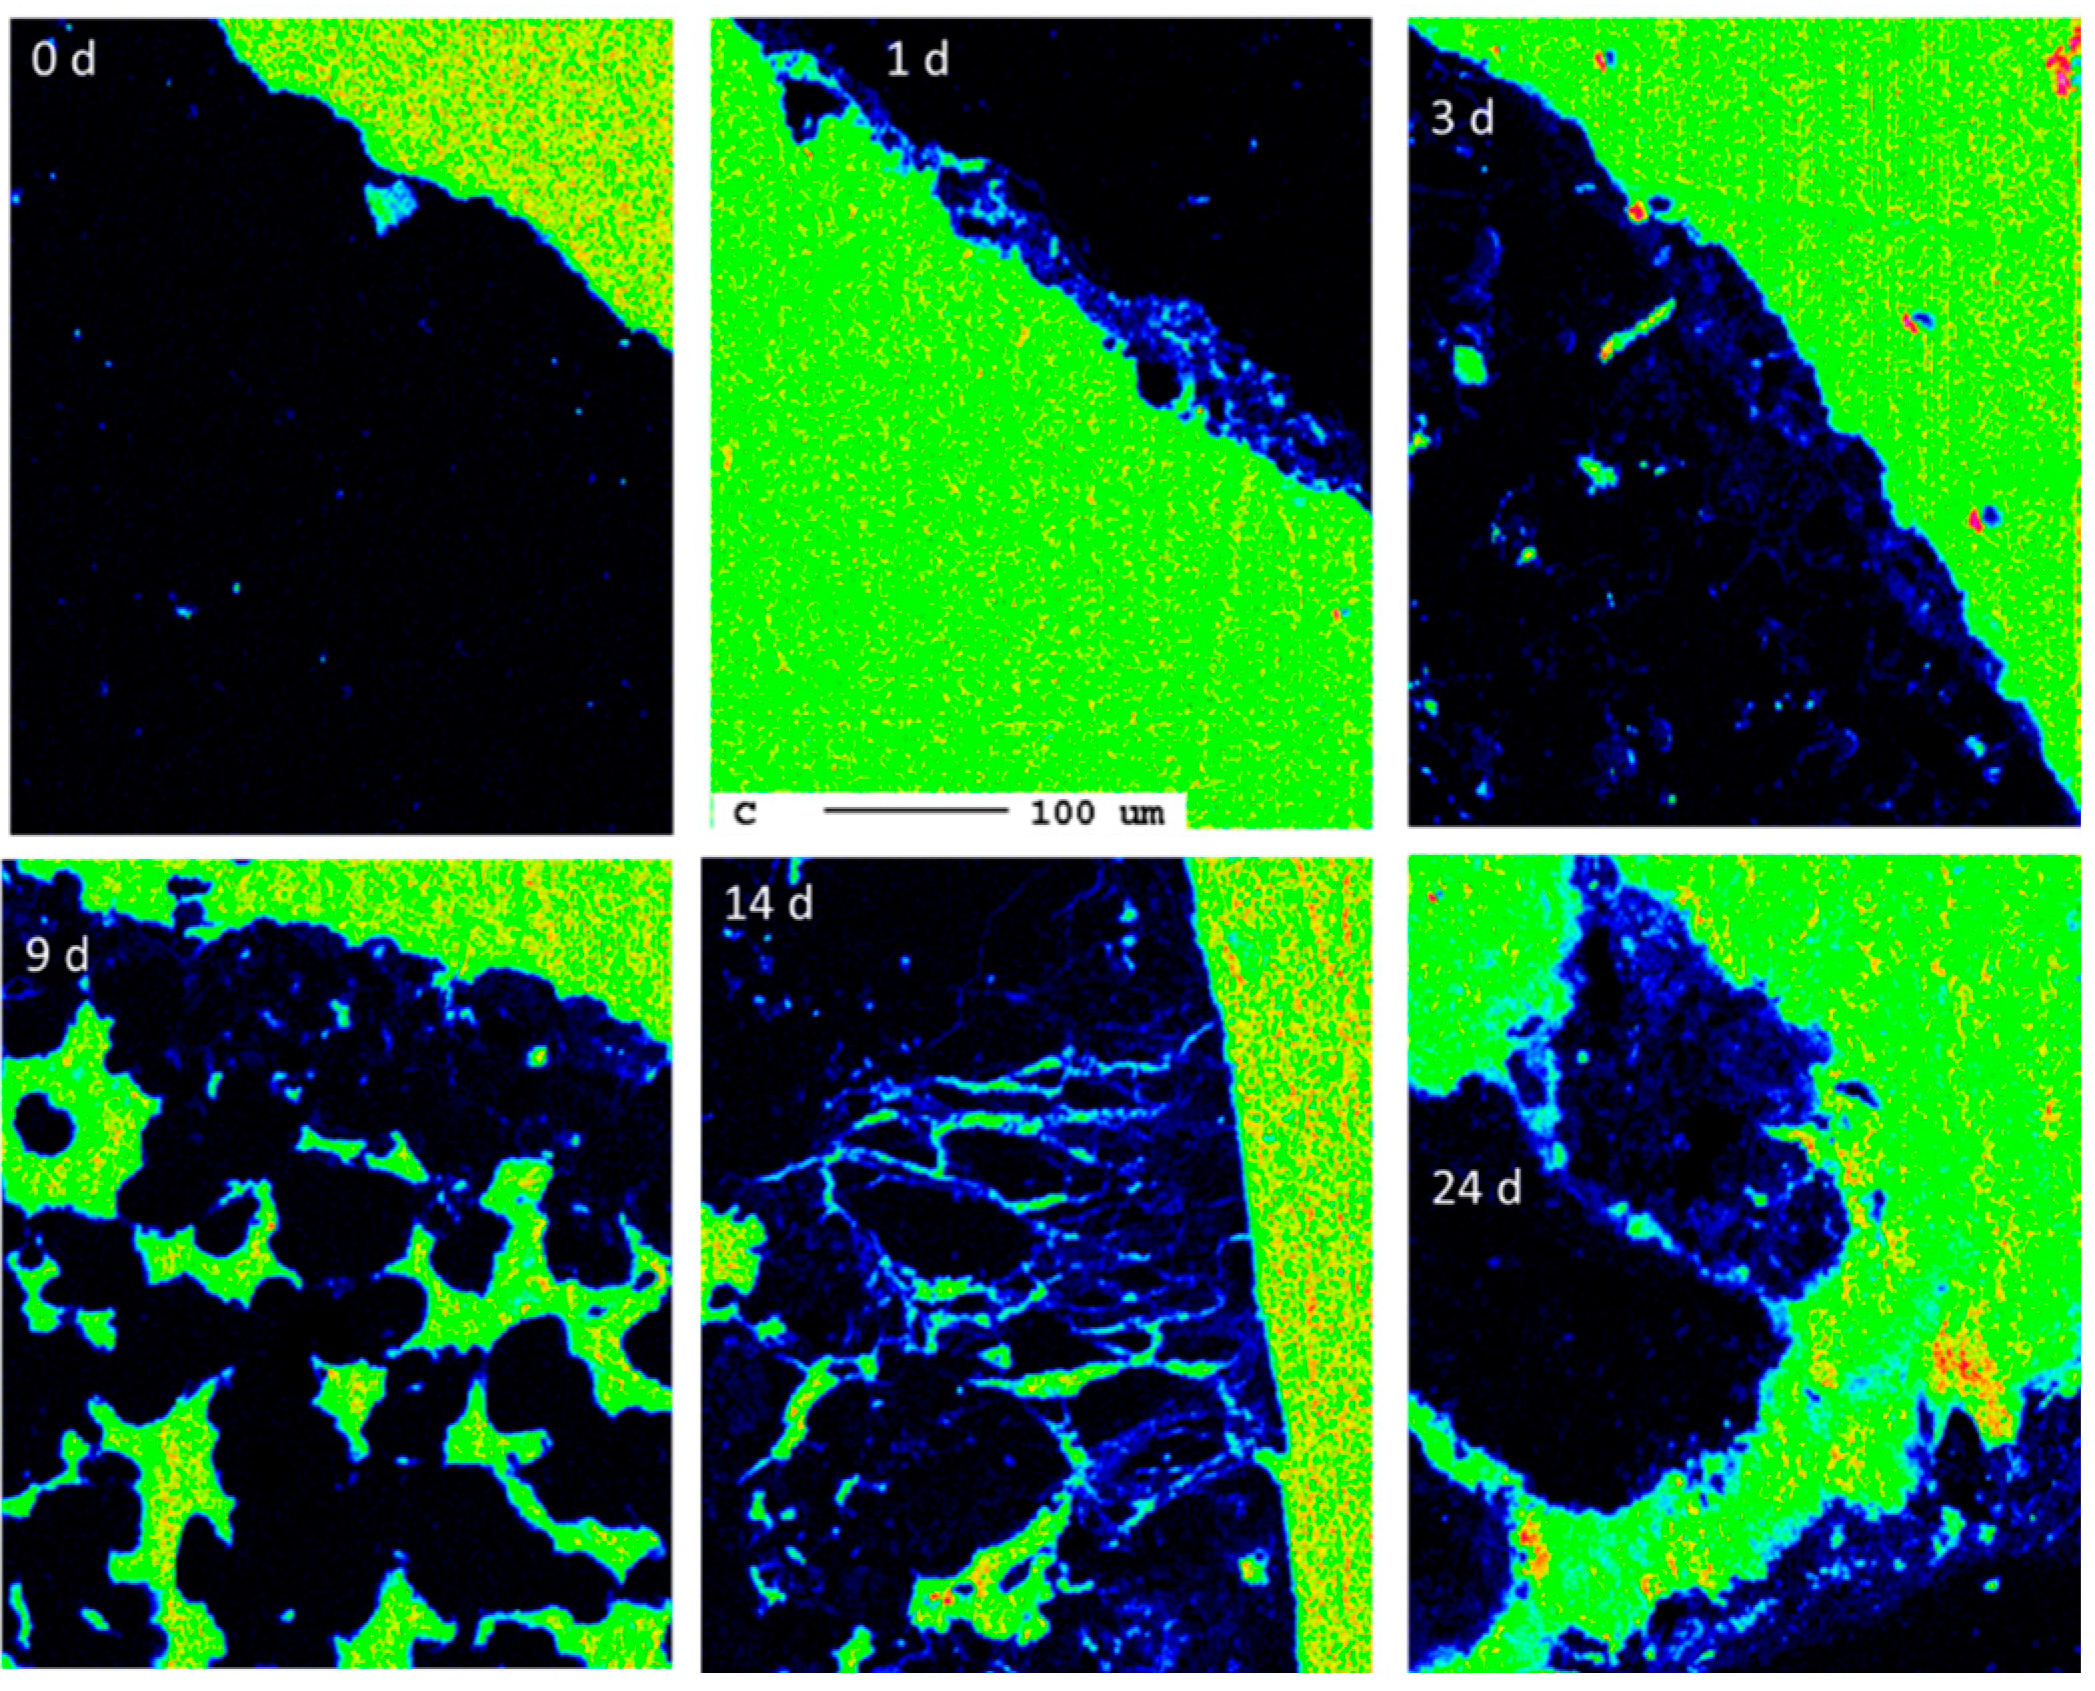
The following calculation shall give a rough estimate of the degree of carbonation. A particle size of 10 mm yields a cross-section area of 100 mm2 per particle. A reaction rim with a thickness of 20 µm covering 5% of all surfaces is, on average, only 1 µm thick. The cross-section has a circumference of 40 mm and 40,000 µm, respectively. Consequently, a reaction rim of 1 µm thickness has an area of 40,000 µm2 and 0.04 mm2, respectively. Compared to the area of the cross-section of 100 mm2, these are only 0.04%. Therefore, the carbonation degree is negligible from the perspective of carbon capture. This observation is in agreement with the overall progress of carbonation during the experiment as indicated by the carbon elemental maps at different reaction times (Figure 19).
3.2. Chemical Analyses
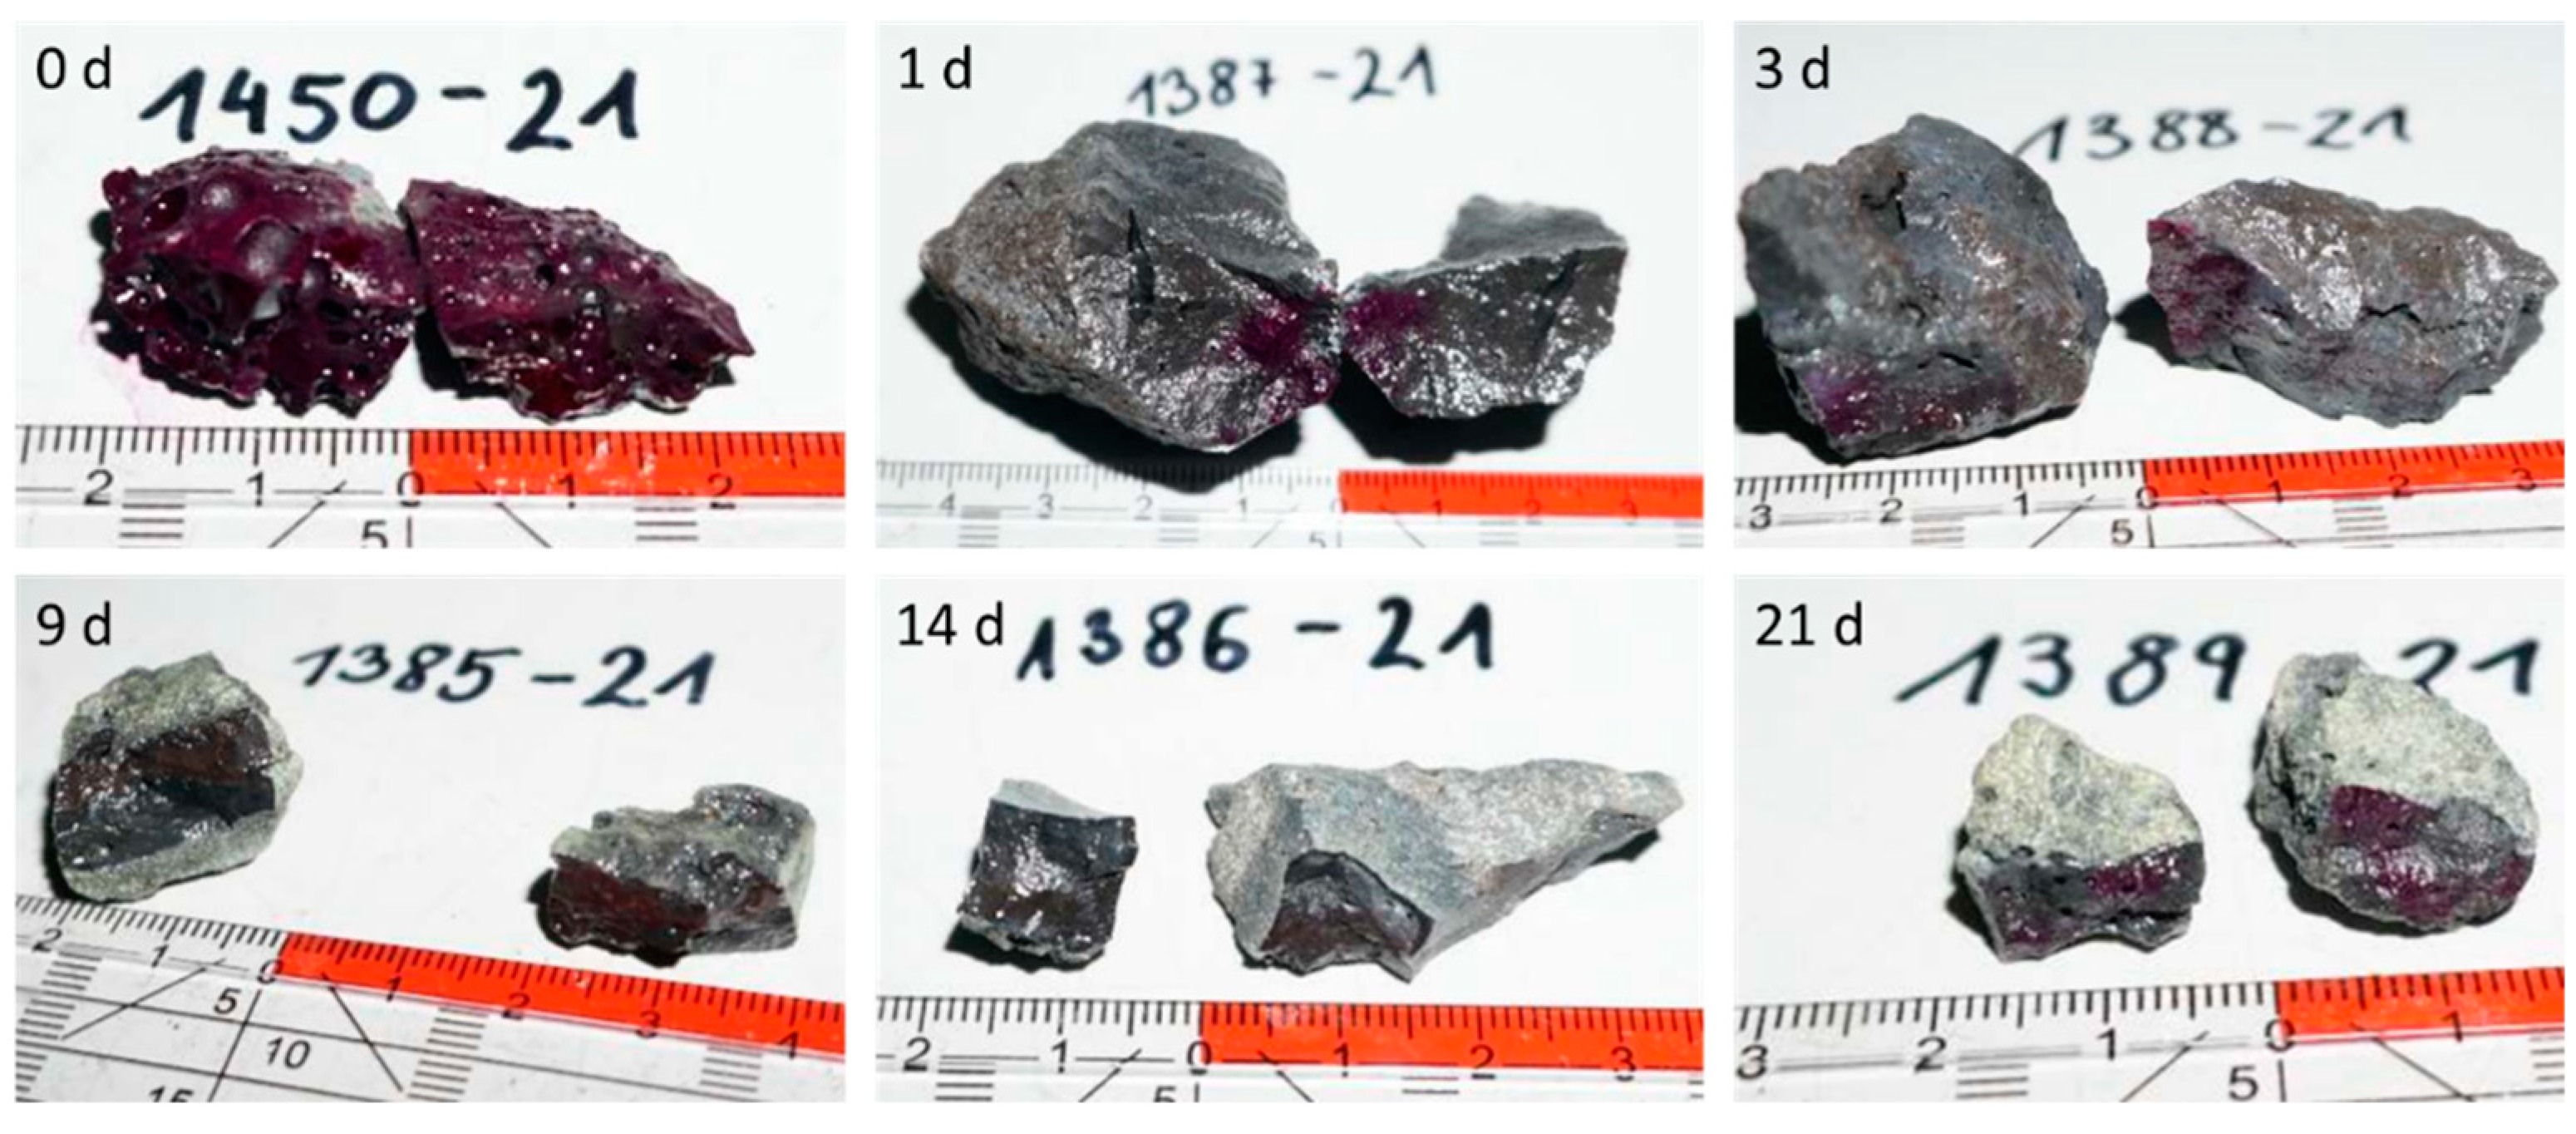
The determination of the carbonation depth using phenolphthalein shows that even the original slag sample develops violet color upon reaction with the reagent (Figure 20). This means that a reaction with CO2 from the atmosphere has already occurred. The subsequent samples also show irregular colors at the fracture planes produced for the determination of the carbonation depth suggesting inhomogeneous carbonation. Since the carbonation depth of an individual sample is therefore not constant, it cannot be quantified. The estimation of the carbonation degree from microprobe analyses can neither be confirmed nor refuted by the phenolphthalein method.
The effect of carbonation on the carbon content and the leachable concentrations is summarized in Table 3. The effect on the bulk chemical composition is marginal as indicated by the elemental mappings.
The carbon content never increases above the detection limit of 0.5 wt.%, although carbonation was proven by electron microprobe analyses and by phenolphthalein. However, considering the limited area of carbonation according to these imaging techniques, the results are consistent. The limited degree of carbonation is surprising, as passivation of the surface is not the entire reason since a still fresh surface area is visible. Consequently, there must be factors inhibiting carbonation. Since carbonation at the given conditions is generally thermodynamically feasible, there must be kinetic reasons. For example, a rapid flow of CO2 through the sample might yield too short contact times to allow the chemical reaction. Another idea is that the formed carbonates are detached from the surface by the flue gas flow and transported to the off-gas. The latter hypothesis is supported by the electron microscopic image (Figure 18), showing at the right side a break-off of the surface.
The solubility of the slag increases with increasing carbonation, e.g., the leachability of sulfate increases from 7.8 to 8720 mg/kg DM, and that of calcium from 940 to 3860 mg/kg DM. This can be explained by a lower pH of the aqueous solution in equilibrium due to carbonation resulting in a higher solubility of mineral phases. The extreme mobilization of sulfate in connection with the formation of secondary sulfate phases according to electron microprobe analyses suggests that these phases are characterized by a high solubility. The leachable concentration of sulfate of 8000 mg/kg DM or 800 mg/L is in the range of the solubility of gypsum of 2.14 g/L [18].
The leaching of environmentally relevant elements is diverse. The leachable concentration of molybdenum increases from 0.017 mg/kg DM to 0.089 mg/kg DM, that of chromium remains constant at about 0.05 mg/kg DM, whereas that of vanadium decreases from 1.1 to 0.45 mg/kg DM. The limit values of the Austrian Recycling Building Materials, class D, are kept for all samples.
4. Conclusions
The investigated samples show a superficial carbonation during the experiment which was determined by using electron microprobe analyses and phenolphthalein. However, this carbonation is restricted to a few areas at the surface and progresses for a few tens of micrometers in the interior of the grains. Consequently, after 24 days of carbonation, the carbon concentration is still below 0.5 wt.%. The superficial carbonation leads to an increased leachability of the main components of sulfate and calcium, but the leachate concentrations of all environmentally relevant elements remain below the limit values of class D of the Austrian Recycling Building Materials Ordinance.
Considering the slow reaction kinetics and the possible detachment of carbonates from the surface, it is suggested to focus on indirect carbonation involving a liquid phase to enhance carbon capture and utilization.
Author Contributions
Conceptualization, D.V. and D.W.; methodology, D.V. and D.W.; investigation, D.V.; resources, D.V. and D.W..; data curation, D.V..; writing—original draft preparation, D.V. writing—review and editing, D.W.; visualization, D.V.; project administration, D.V. and D.W.; funding acquisition, D.W. All authors have read and agreed to the published version of the manuscript.
Funding
This research was funded by voestalpine Stahl Donawitz.
Institutional Review Board Statement
Not applicable.
Informed Consent Statement
Not applicable.
Data Availability Statement
The data presented in this study are available in this article.
Acknowledgments
The authors thank the heads of the mineralogical and chemical laboratory of Montanuniversität Leoben, Federica Zaccharini, and Alexia Aldrian, respectively, and their co-workers.
Conflicts of Interest
The funder, voestalpine Stahl Donawitz GmbH, is the employer of the co-author D.W. The contribution of D.W. to the study is described in the Author Contributions. The funder supports the publication of this study.
References
- Huigen, W.; Witkamp, G.-J.; Comans, R. Mineral CO2 sequestration by steel slag carbonation. Environ. Sci. Technol. 2005, 39, 9676–9682. [Google Scholar] [CrossRef] [PubMed]
- Höllen, D.; Berneder, I.; Capo Tous, F.; Stöllner, M.; Sedlazeck, K.P.; Schwarz, T.; Aldrian, A.; Lehner, M. Stepwise treatment of ashes and slags by dissolution, precipitation of iron phases and carbonate precipitation for production of raw materials for industrial applications. Waste Manag. 2018, 78, 750–762. [Google Scholar] [CrossRef] [PubMed]
- Tian, S.; Jiang, J.; Chen, X.; Yan, F.; Li, K. Direct gas-solid carbonation kinetics of steel slag and the contribution to in situ sequestration of flue gas CO2 in steel making plants. ChemSusChem 2013, 6, 2348–2355. [Google Scholar] [CrossRef] [PubMed]
- Boone, M.; Nielsen, P.; De Kock, T.; Boone, M.; Quaghebeur, M.; Cnudde, V. Monitoring of Stainless-Steel Slag Carbonation Using X-ray Computed Microtomography. Environ. Sci. Technol. 2014, 48, 674–680. [Google Scholar] [CrossRef] [PubMed]
- Berryman, E.; Williams-Jones, A.; Migdisov, A. Steel slag carbonation in a flow-through reactor: The role of fluid-flux. J. Environ. Sci. 2015, 27, 266–275. [Google Scholar] [CrossRef] [PubMed]
- Huijgen, W.; Comans, R. Carbonation of steel slag for CO2 sequestration: Leaching of products and reaction mechanisms. Environ. Sci. Technol. 2006, 40, 2790–2796. [Google Scholar] [CrossRef] [PubMed]
- Brechlmacher, M.; Vollprecht, D. Use of BOF Slags as Mountain-Stabilizing Element; Unpublished Report; Montanuniversität Leoben: Leoben, Austria, 2021. [Google Scholar]
- Chaurand, P.; Rose, J.; Briois, V.; Olivi, L.; Hazemann, J.-L.; Proux, O.; Domas, J.; Bottero, J.-Y. Environmental impacts of steel slag reused in road construction: A crystallographic and molecular (XANES) approach. J. Hazard. Mater. 2007, 139, 537–542. [Google Scholar] [CrossRef] [PubMed]
- Naidu, T.S.; Sheridan, C.M.; van Dyk, L.D. Basic oxygen furnace slag: Review of current and potential uses. Miner. Eng. 2020, 149, 106234. [Google Scholar] [CrossRef]
- ÖNORM EN 15002:2015-07-01; Characterization of Waste—Preparation of Test Portions from the Laboratory Sample. Austrian Standards International: Vienna, Austria, 2015.
- ÖNORM EN 14346:2007-03-01; Characterization of Waste—Calculation of Dry Matter by Determination of Dry Residue or Water Content. Austrian Standards International: Vienna, Austria, 2007.
- ÖNORM L 1084:2016-07-01; Chemical Analyses of Soils—Determination of Carbonate Taking into Account Air Pressure and Temperature. Austrian Standards International: Vienna, Austria, 2016.
- ÖNORM EN 14630:2007-01-01; Products and Systems for the Protection and Repair of Concrete Structures—Test Methods—Determination of Carbonation Depth in Hardened Concrete by the Phenolphthalein Method. Austrian Standards International: Vienna, Austria, 2007.
- ÖNORM EN 12457-4:2003-01; Characterization of Waste—Leaching; Compliance Test for Leaching of Granular Waste Materials and Sludges—Part 4: One Stage Batch Test at a Liquid to Solid Ratio of 10 L/kg for Materials with Particle Size below 10 mm (without or with Limited Size Reduction). German version EN 12457-4:2002; Austrian Standards International: Vienna, Austria, 2003.
- ÖNORM EN ISO 17294-1:2007-01-01; Water Quality—Application of Inductively Coupled Plasma Mass Spectrometry (ICP-MS)—Part 1: General Guidelines (ISO 17294-1:2004). Austrian Standards International: Vienna, Austria, 2007.
- DIN EN ISO 10304-1:2009-07; Water quality—Determination of Dissolved Anions by Liquid Chromatography of Ions—Part 1: Determination of Bromide, Chloride, Fluoride, Nitrate, Nitrite, Phosphate and Sulfate (ISO 10304-1:2007). German version EN ISO 10304-1:2009; Deutsches Institut für Normung: Berlin, Germany, 2009.
- DIN 38405-24:1987-05; German Standard Methods for the Examination of Water, Waste Water and Sludge; Anions (Group D); Photometric Determination of Chromium(VI) Using 1,5-Diphenylcarbonohydrazide (D 24). Deutsches Institut für Normung: Berlin, Germany, 1987.
- Available online: https://www.salzwiki.de/index.php/Gips (accessed on 1 September 2022).
Figure 1.
Elemental distribution maps of the original slag sample.

Figure 2.
Detail of the elemental distribution maps of the original slag sample: 1: Mg- and Mn-bearing wuestite (Fe,Mg,Mn)O; 2: calcium silicate (Ca2SiO4 or Ca3SiO5); 3: brownmillerite (Ca(Fe,Al)2O5.
Figure 2.
Detail of the elemental distribution maps of the original slag sample: 1: Mg- and Mn-bearing wuestite (Fe,Mg,Mn)O; 2: calcium silicate (Ca2SiO4 or Ca3SiO5); 3: brownmillerite (Ca(Fe,Al)2O5.

Figure 3.
EDX spectrum of alite, Ca3SiO5.

Figure 4.
EDX spectrum of belite, Ca2SiO4.

Figure 5.
EDX spectrum of melilite, (Ca,Na)2(Mg,Al)[4][Si2O7].

Figure 6.
EDX spectrum of brownmillerite, Ca(Al,Fe)2O5.

Figure 7.
EDX spectrum of calcium ferrite, CaFe2O4.

Figure 8.
EDX spectrum of Mg-, Ca-, and Mn-bearing wuestite, (Mg,Ca,Mn,Fe)O.

Figure 9.
Elemental distribution maps of the sample after 1 d.

Figure 10.
Beginning carbonation at the slag surface after 1 d. The elemental distribution of carbon (top left) and calcium (top right) show blue hues in the area of the reaction rim in the backscattered electron image (bottom right), but also enrichments of sulfur (bottom left) are visible.
Figure 10.
Beginning carbonation at the slag surface after 1 d. The elemental distribution of carbon (top left) and calcium (top right) show blue hues in the area of the reaction rim in the backscattered electron image (bottom right), but also enrichments of sulfur (bottom left) are visible.

Figure 11.
Elemental distribution maps of the sample after 3 d.

Figure 12.
Initial carbonation of the slag surface after 3 d. The elemental distribution maps of carbon (top left) and calcium (top right) indicate blue hues in the area of the reaction rims in the backscattered electron image (bottom right), but there are also enrichments of sulfur (bottom left).
Figure 12.
Initial carbonation of the slag surface after 3 d. The elemental distribution maps of carbon (top left) and calcium (top right) indicate blue hues in the area of the reaction rims in the backscattered electron image (bottom right), but there are also enrichments of sulfur (bottom left).

Figure 13.
Elemental distribution map of the sample after 9 d.

Figure 14.
Development of the reaction rim after 9 d. (top left) elemental distribution map of carbon; (top right) elemental distribution map of calcium; (bottom left) elemental distribution map of sulfur; (bottom right) backscattered electron image.
Figure 14.
Development of the reaction rim after 9 d. (top left) elemental distribution map of carbon; (top right) elemental distribution map of calcium; (bottom left) elemental distribution map of sulfur; (bottom right) backscattered electron image.

Figure 15.
Elemental distribution map of the sample after 14 d.

Figure 16.
Elemental distribution map of carbon after 14 d. The dark blue hues mark the carbonated areas between the slag (left, black) and the epoxy resin (right, green).
Figure 16.
Elemental distribution map of carbon after 14 d. The dark blue hues mark the carbonated areas between the slag (left, black) and the epoxy resin (right, green).

Figure 17.
Elemental distribution map of the sample after 24 d.

Figure 18.
Superficial carbonation (white arrows) of the sample after 24 d.

Figure 19.
Progress of carbonation during the experimental duration (0 d, 1 d, 3 d, 9 d, 14 d, 24 d) indicated by elemental distribution maps of carbon (the scale bar refers to all images).
Figure 19.
Progress of carbonation during the experimental duration (0 d, 1 d, 3 d, 9 d, 14 d, 24 d) indicated by elemental distribution maps of carbon (the scale bar refers to all images).

Figure 20.
Determination of the carbonation depth using phenolphthalein.


Table 1.
Chemical composition of BOF slags in wt.% (n.a.: not analyzed).
| Component | BOF Slag Donawitz [7] | BOF Slag Linz [8] |
|---|---|---|
| Na2O | 0.03 | n.a. |
| CaO | 34.8 | 41.3 |
| Fe2O3 | 33.4 | 31.2 |
| SiO2 | 15.3 | 12.5 |
| MnO | 11.9 | 6.1 |
| MgO | 3.4 | 4.3 |
| Al2O3 | 1.3 | 2.4 |
| TiO2 | 0.26 | 0.8 |
| P2O5 | 1.1 | 1.1 |
| SO3 | 0.18 | n.a. |
| Cr2O3 | 0.58 | 0.35 |
| V2O3 | 0.47 | 0.10 |
| Sum | 100 | 100 |
Table 2.
Mineralogical composition of BOF slags (x = detected).
| Phase | BOF Slag Donawitz [7] | BOF Slag Linz [8] |
|---|---|---|
| Larnite, β-Ca2SiO4 | x | x |
| Calcium ferrite, CaFe2O4 | x | |
| Magnesiowuestite, (Fe,Mg,Mn,Ca)O | x | x |
| Portlandite, Ca(OH)2 | x | |
| Brownmillerite, Ca(Al,Fe)2O5 | x |
Table 3.
Effects of carbonation on total inorganic carbon (TIC) content and leachable concentrations. Sample codes (e.g., 1 d) refer to the duration of carbonation. DM = dry matter.
Table 3.
Effects of carbonation on total inorganic carbon (TIC) content and leachable concentrations. Sample codes (e.g., 1 d) refer to the duration of carbonation. DM = dry matter.
| Parameter | Unit | Original | 1 d | 3 d | 9 d | 14 d | 24 d |
|---|---|---|---|---|---|---|---|
| TIC | % | <0.5 | <0.5 | <0.5 | <0.5 | <0.5 | <0.5 |
| Cl- | mg/kg DM | <5.0 | <5.0 | 6.4 | 8.3 | 13 | 9.8 |
| F- | mg/kg DM | <5.0 | <5.0 | <5.0 | <5.0 | <5.0 | <5.0 |
| NO3- | mg/kg DM | <5.0 | <5.0 | <5.0 | <5.0 | <5.0 | <5.0 |
| NO2- | mg/kg DM | <5.0 | <5.0 | <5.0 | <5.0 | <5.0 | <5.0 |
| PO43- | mg/kg DM | <5.0 | <5.0 | <5.0 | <5.0 | <5.0 | <5.0 |
| SO42- | mg/kg DM | 7.8 | 440 | 780 | 4010 | 4310 | 8270 |
| Cr (VI) | mg/kg DM | <0.5 | <0.5 | <0.5 | <0.5 | <0.5 | <0.5 |
| Li | mg/kg DM | 0.037 | 0.027 | 0.038 | 0.4 | 0.074 | 0.025 |
| Be | mg/kg DM | <0.10 | <0.10 | <0.10 | <0.10 | <0.10 | <0.10 |
| Na | mg/kg DM | 2.1 | 1.6 | 1.6 | 3 | 3.2 | 2.1 |
| Mg | mg/kg DM | 0.82 | 1.5 | 1.8 | 1.1 | 1.7 | 2.2 |
| Al | mg/kg DM | 1.89 | 2.3 | 2.3 | 1.7 | 1.1 | <1.0 |
| Si | mg/kg DM | 150 | 120 | 120 | 110 | 140 | 130 |
| P | mg/kg DM | 0.34 | 0.41 | 0.24 | 0.28 | 0.25 | 0.55 |
| K | mg/kg DM | 4 | 2.8 | 3 | 6 | 5.7 | 3.9 |
| Ca | mg/kg DM | 940 | 900 | 1060 | 2650 | 2540 | 3860 |
| Ti | mg/kg DM | 0.019 | 0.016 | 0.014 | 0.014 | 0.017 | 0.017 |
| V | mg/kg DM | 1.1 | 0.6 | 0.56 | 0.37 | 0.54 | 0.45 |
| Cr | mg/kg DM | 0.05 | 0.042 | 0.036 | 0.058 | 0.046 | 0.045 |
| Mn | mg/kg DM | <0.020 | <0.020 | <0.020 | <0.020 | <0.020 | <0.020 |
| Fe | mg/kg DM | <0.10 | 0.079 | <0.10 | 0.068 | 0.068 | 0.11 |
| Co | mg/kg DM | <0.010 | <0.010 | <0.010 | <0.010 | <0.010 | 0.012 |
| Ni | mg/kg DM | <0.020 | 0.03 | 0.03 | 0.073 | 0.074 | 0.12 |
| Cu | mg/kg DM | <0.020 | <0.020 | <0.020 | <0.020 | <0.020 | <0.020 |
| Zn | mg/kg DM | <0.10 | <0.10 | <0.10 | <0.10 | <0.10 | <0.10 |
| As | mg/kg DM | <0.10 | <0.10 | <0.10 | <0.10 | <0.10 | <0.10 |
| Se | mg/kg DM | <0.10 | <0.10 | <0.10 | <0.10 | <0.10 | 0.18 |
| Sr | mg/kg DM | 0.54 | 0.47 | 0.53 | 1.3 | 1.5 | 2.5 |
| Mo | mg/kg DM | 0.017 | 0.04 | 0.015 | 0.13 | 0.12 | 0.089 |
| Pd | mg/kg DM | <0.010 | <0.010 | <0.010 | <0.010 | <0.010 | <0.010 |
| Ag | mg/kg DM | <0.010 | <0.010 | <0.010 | <0.010 | <0.010 | <0.010 |
| Cd | mg/kg DM | <0.010 | <0.010 | <0.010 | <0.010 | <0.010 | <0.010 |
| Sn | mg/kg DM | <0.020 | <0.020 | <0.020 | <0.020 | <0.020 | <0.020 |
| Sb | mg/kg DM | <0.010 | <0.010 | <0.010 | <0.010 | <0.010 | 0.18 |
| Te | mg/kg DM | <0.020 | <0.020 | <0.020 | <0.020 | <0.020 | 0.058 |
| Ba | mg/kg DM | 0.13 | 0.19 | 0.13 | 0.2 | 0.21 | 0.18 |
| W | mg/kg DM | 0.035 | 0.029 | 0.035 | 0.058 | 0.067 | 0.058 |
| Hg | mg/kg DM | <0.010 | <0.010 | <0.010 | <0.010 | <0.010 | <0.010 |
| Tl | mg/kg DM | <0.010 | <0.010 | <0.010 | <0.010 | <0.010 | <0.010 |
| Pb | mg/kg DM | <0.010 | <0.010 | <0.010 | <0.010 | <0.010 | <0.010 |
Publisher’s Note: MDPI stays neutral with regard to jurisdictional claims in published maps and institutional affiliations. |
© 2022 by the authors. Licensee MDPI, Basel, Switzerland. This article is an open access article distributed under the terms and conditions of the Creative Commons Attribution (CC BY) license (https://creativecommons.org/licenses/by/4.0/).
Share and Cite
MDPI and ACS Style
Vollprecht, D.; Wohlmuth, D. Mineral Carbonation of Basic Oxygen Furnace Slags. Recycling 2022, 7, 84. https://doi.org/10.3390/recycling7060084
AMA Style
Vollprecht D, Wohlmuth D. Mineral Carbonation of Basic Oxygen Furnace Slags. Recycling. 2022; 7(6):84. https://doi.org/10.3390/recycling7060084
Chicago/Turabian StyleVollprecht, Daniel, and Dominik Wohlmuth. 2022. "Mineral Carbonation of Basic Oxygen Furnace Slags" Recycling 7, no. 6: 84. https://doi.org/10.3390/recycling7060084