Article

An Electrothermal Model of an NMC Lithium-Ion Prismatic Battery Cell for Temperature Distribution Assessment

by
Said Madaoui
1,2,*,
Jean-Michel Vinassa
1,
Jocelyn Sabatier
1,* and
Franck Guillemard
2
1
CNRS, Bordeaux INP, IMS, UMR 5218, University of Bordeaux, 33400 Talence, France
2
Stellantis, 75000 Paris, France
*
Authors to whom correspondence should be addressed.
Batteries 2023, 9(9), 478; https://doi.org/10.3390/batteries9090478
Submission received: 1 June 2023 / Revised: 3 August 2023 / Accepted: 28 August 2023 / Published: 21 September 2023
(This article belongs to the Collection Advances in Battery Energy Storage and Applications)

Abstract

:
Charge time has become one of the primary issues restricting the development of electric vehicles. To counter this problem, an adapted thermal management system needs to be designed in order to reduce the internal thermal gradient, by predicting the surface and internal temperature responses of the battery. In this work, a pseudo 3D model is developed to simulate battery cell performance and its internal states under various operational scenarios such as temperature and convection conditions as well as the applied current during charge and discharge. An original mesh of the JR is proposed where heat exchanges in the three directions (radial, orthoradial and axial) are considered. The model represents one of the solutions that enable increasing the lifespan of batteries while decreasing charging time. It offers the opportunity to optimize operating parameters to extend battery life. In this paper, attention was paid not only to the core and non-core components, but also to the experiments required to parametrize the thermal and electrochemical models (heat generation). Unlike existing approaches documented in the literature, the model developed in this work achieves an impressive balance between computational efficiency and result accuracy, making it a groundbreaking contribution in the field of electric vehicle technology.

Graphical Abstract

1. Introduction

In recent years, climate change and energy shortage have gradually become the common challenges facing all mankind [1]. Since the transport field is one of the major emitters of greenhouse gases [2], the majority of car manufacturers around the world are committed to a policy of electrifying their vehicles by offering hybrid and electric vehicles [3]. The battery pack is the main source of energy of an electric vehicle, and replacing a thermal vehicle involves several technical challenges that engineers and specialists must face, in order to both increase the autonomy and lifespan while reducing the battery charging time. Lithium-ion batteries have gradually evolved from a variety of technologies. Due to their low self-discharge rate, high energy density and lack of memory effect, this type of battery has revolutionized the energy storage technology and enabled the mobile revolution [4]. A battery pack is traditionally a set of modules made up of cells, a metal cover and electrical harness and a control unit called a BMS (battery management system) whose role is to manage electrical balancing and temperature both between cells and at cell level.
Lithium-ion battery (LIB) cells are available in various shapes: pouch, cylindrical and prismatic [5], with the prismatic variant gaining popularity in electric vehicles due to its efficient packaging and simpler manufacturing using the jelly roll design. The performance and dependability of LIBs are significantly impacted by the temperature at which they operate, which is one of the key limiting factors for battery pack performance and lifetime. Temperature heterogeneity inside LIBs can lead to uneven current density distributions, local state-of-charge (SOC) differences and local ageing differences, which may not only accelerate the global ageing, but also reduce the accessible energy of the battery. Temperature rise and spatial temperature gradient minimization inside the cell is one of the main thermal challenges during fast charge [6]. To counter these challenges, thermal management systems (TMSs) are employed in the majority of vehicles [7]. Cells can be cooled at different surfaces or at electrical connection tabs, or a combination of both [8]. The TMS is required to control the temperature of the battery pack within the optimal temperature range of 15–35 °C, which ensures the good charge and discharge stability of the battery pack. Depending on the type of heat transfer medium, the TMS can be divided into air cooling, liquid cooling and phase-change material cooling (PCM) [9]. Liquid cooling can be divided into direct liquid cooling and indirect liquid cooling, depending on whether the coolant exchanges calories with the batteries or not [10]. In cold weather conditions, it is necessary to preheat the battery in an electric vehicle in order to improve the performance and lifetime of the batteries. Preheating can be divided into external heating and internal heating [11,12].
The in situ measurement of internal states such as current, temperature and SOC is difficult to achieve without opening the cell [13,14]. Therefore, a model-based approach is required. By modeling the LIB, its behavior can be predicted, thus contributing to managing the battery. The battery model consists of electrical and thermal parts. Regarding the electrical model, there are broadly two approaches of modeling a lithium-ion cell: a physics-based pseudo two-dimensional (P2D) model, and an equivalent-circuit model (ECM). The model, established by Newman, uses partial differential equations, including the temporal dimension and one or more spatial dimensions to represent the different internal operating mechanisms. While the P2D model is known for its accuracy and adaptability, its complex computational procedures pose challenges when integrating it into current management algorithms [15]. To address this, Wang et al. [16] introduced a streamlined discrete electrochemical model that remains applicable across a broad temperature spectrum. Building upon the foundation of the P2D model, they simplified the control equation governing solid solution diffusion by employing parabolic approximations for lithium-ion concentration. Additionally, they developed a lumped mass thermal model to describe temperature fluctuations within the battery.
The second approach, the ECM, reproduces the battery behavior through an analogy with an electrical circuit. These are models with localized constants. The spatial dimensions are thus eliminated, and the equations are ordinary differential equations of the time dimension alone [17]. Of various levels of complexity, these models are generally dedicated to the global study of the electrical behavior of a cell. Due to its simplicity and ease of parametrization, the ECM approach is adopted in this work. The internal parameters of LIBs are affected by temperature. During charging and discharging, a large amount of heat can be generated in LIBs, changing the temperature of the battery. With the variation in battery temperature, parameters such as internal resistance will change and affect heat generation in turn. Therefore, electricity and heat are coupled to each other in LIBs [18,19]. The heat generated is considered as the input to the thermal model which results in a new temperature which is fed back to the electrical model [20]. The temperature varies depending not only on the properties of the cell, but also on the type of loads applied on the cell. Xu and colleagues studied the effects of different discharge rates on the surface temperature of a prismatic battery and found that high temperatures could be reached at high discharge rates [10]. To date, various models have been built and a wide range of work focusing on the thermal modeling of LIBs has been reported. The simplest and most common approach is to treat the cell as a homogenous and isotropic material. This approach has the limitation of not providing internal thermal gradients due to the isotropic assumption. Other models take into account the anisotropy of the materials and provide the spatial temperature distribution, but are nevertheless unable to provide the internal thermal gradient due to their simplicity [20]. On the other hand, there are more complex models based on Finite Element Analysis (FEA) with detailed cell structure which can reach a very high accuracy, but the complexity of the models greatly limits their real-time application. Optimal models that are not time consuming, that take into account the anisotropy of the materials and are able to assess the inner thermal gradient already exist in the literature, but these models focus only on cylindrical cells and not on prismatic ones [21].
The aim of this study was to find an alternative solution between the simplest models which are not accurate enough and the complex models which are too time consuming to be embedded in an electric vehicle. First of all, we tackle the jelly roll (JR) modeling by proposing an adapted mesh which represents the physics of the JR by taking into account the winding of the electrodes.

2. Materials and Methods

The battery studied here is a commercial 67 Ah prismatic battery cell. The cell specifications are given in Table 1.
The battery cell is represented in Figure 1.
One of the most critical steps for developing battery prognostics solutions is to establish a battery model which enables the car maker to simulate battery behavior and interpret battery issues in a form that can be understood by users and designers [22]. This section details the proposed model. By utilizing inputs such as the current, initial temperature and environmental temperature, the model is capable of accurately forecasting the internal temperature distribution and state-of-charge of the battery. As mentioned earlier, the model comprises three interconnected sub-models: a thermal model, an electrical model based on ECM and a heat generation model. Each sub-model contributes to a holistic understanding of the battery’s behavior and facilitates more precise predictions of its performance under varying conditions.

2.1. The Thermal Model

The main challenge lies in effectively visualizing and quantifying the temperature gradients within the cell, all while ensuring that the model can be simulated efficiently within a short timeframe to be compatible with integration on a battery thermal management system. Considering the complex geometry of the JR, it was necessary to design a mesh which makes it possible to represent all the heat exchanges in all directions inside the cell. To successfully reproduce the thermal behavior of the JR, it is essential to provide a reliable mesh able to provide a good assessment of the cell’s inner thermal gradient. The proposed model involves meshing the JR in thickness as well as in height. The particularity of this mesh compared to what can be found in the literature is that it considers the orthoradial direction which shows that the heat can be exchanged between the meshes by going around the winding. Figure 2 shows the proposed mesh by considering the three directions, axial (according to the height of the JR), radial (normal to the winding) and orthoradial (parallel to the winding) [23,24]. The JR mesh is detailed in [25]
The JR mesh is governed by the following Fourier equation of heat [26,27]:
ρ i j C i j d T i , j d t V i j = r T i + 1 , j T i , j S r i / i + 1 d r T i , j T i 1 , j S r i 1 / i d + l T i + 1 , j T i , j S l d l i / i + 1 l T i , j T i 1 , j S l d l i 1 / i + l T i , j + 1 T i , j S z i d z j / j + 1 l T i , j T i , j 1 S z i d z j 1 / j + Q ˙ i , j
where ρ i j is the density of the mesh i,j, C i j is the specific heat capacity of the mesh, Q ˙ i , j the heat generated by a mesh i,j and V i j is its volume. These variables are calculated from the thermo-physical characteristics of the sub-elementary layers of the JR, as described in Equations (2) and (3):
ρ i j = V i ρ i V i
C i j = M i C p i M i
where V i is the volume of the sublayer of the JR, ρ i is its density, M i is its mass and C p i is the specific heat capacity of each sublayer [28].
The JR is obtained by wrapping the electrodes around a hollow space. Each turn is qualified as an elementary layer which is made of different sublayers. Each elementary sublayer has its own thermal conductivity and capacity, its own thickness as well as its own density. All these essential data for the thermal model are sourced from the literature as they could not be obtained from the supplier. Table 2 represents the thermo-physical properties of a pouch cell with a capacity of 20 Ah, obtained from [29], and implemented in the model for simulation.

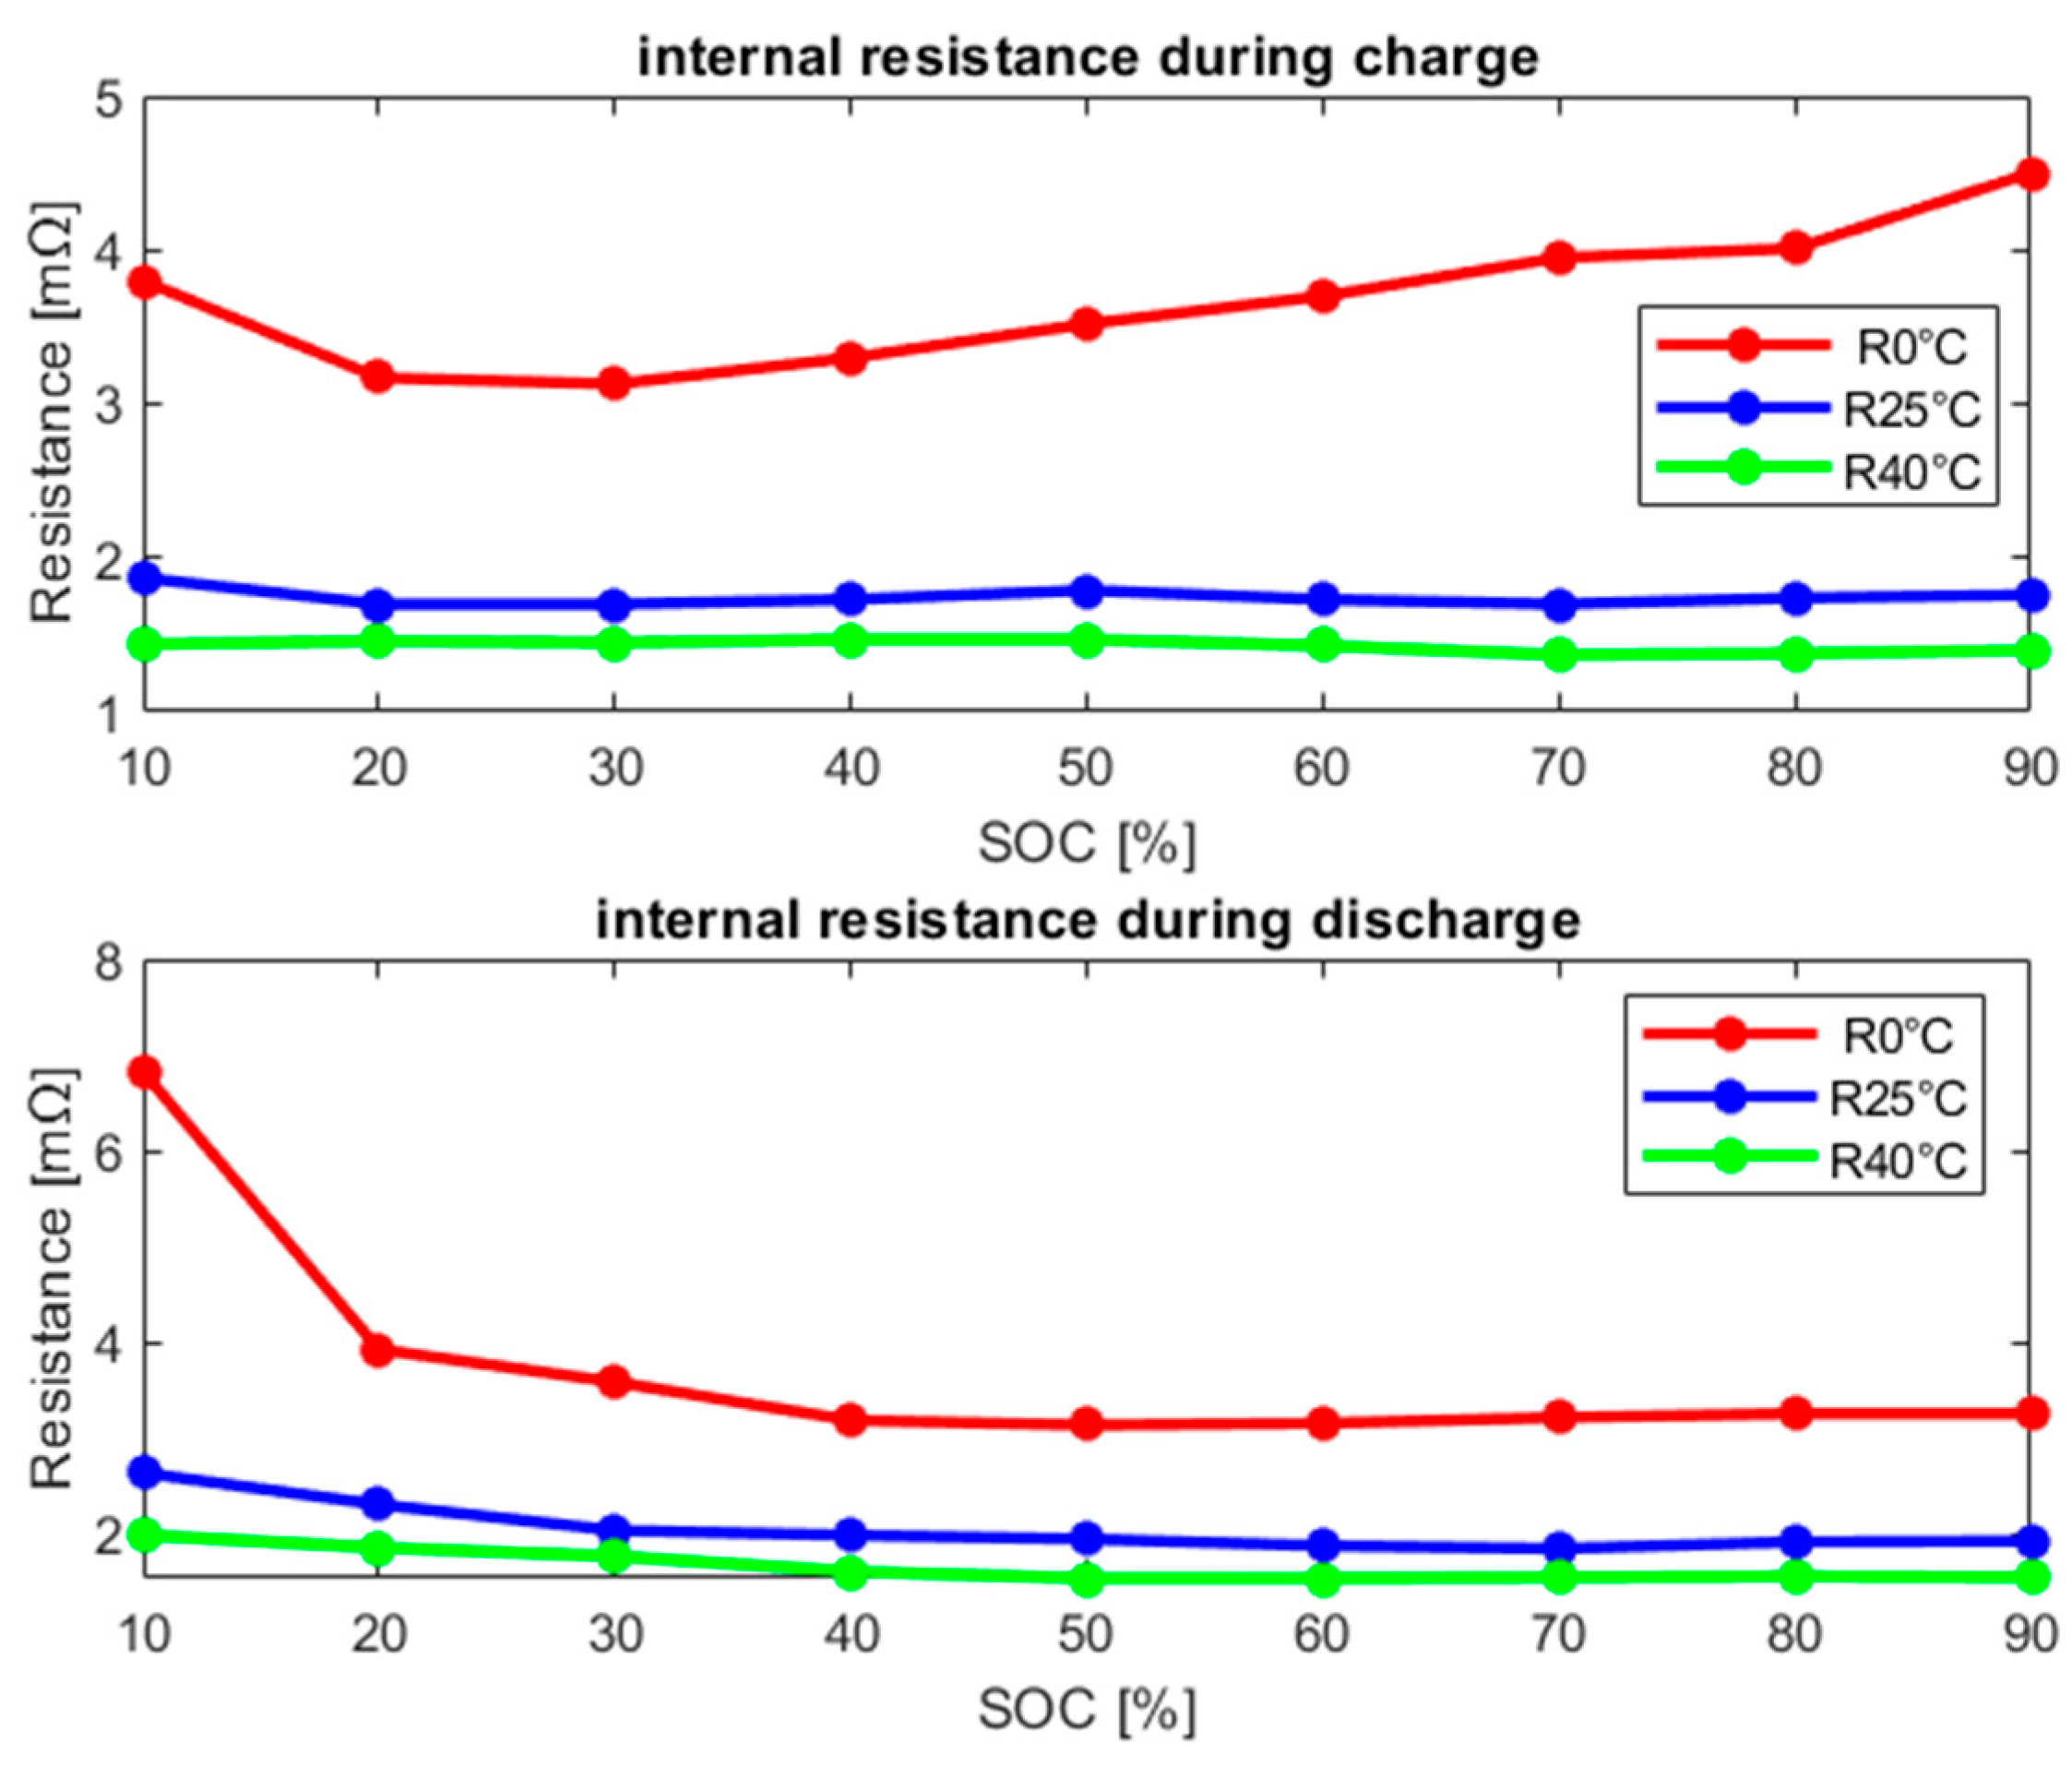
2.2. The Electrical Model

In order to investigate the dynamic behavior of the cell, two main approaches are discussed in the literature: (i) Electrochemical Impedance Spectroscopy (EIS) and (ii) measurement of a voltage response using a controlled input current. From this information, optimization techniques are then applied to determine the model parameters. The general principle of the EIS method involves the application of an input signal, either current (galvanostatic) or voltage (potentiostatic), followed by the measurement of the characteristic cell response, which is dependent on the cell impedance. In this work, pulse discharge measurement was used to determine the internal resistance as a function of temperature and SOC [30].
The open-circuit voltage (OCV) can be measured either under continuous load with a very low current (pseudo-OCV) or under incremental load accompanied by relaxations using the Galvanostatic Electrochemical Intermittent Titration Technique (GITT). In this work, both methods were investigated. Although the two techniques are different, the OCV results obtained as a function of SOC were similar. The OCV is assumed to be dependent on the SOC, temperature and the direction of charge/discharge [31]. The hysteresis of the OCV between charge and discharge is very negligible since the battery chemistry is NMC.
Figure 3 shows the OCV/SOC curves obtained with the two methods described in the section above (the GITT method is applied in charge/discharge).
The impedance parameters represent different phenomena which cover a very wide dynamic range. Moreover, they are sensitive to operating conditions. A large number of studies can be found in the literature on the qualitative comparison of the impedance characterization in the frequency and time domains [32]. The frequency method, in particular GEIS, involves applying an AC current in a frequency range so that the measurement does not lead to a variation in SOC and therefore in the OCV, which facilitates the parameter identification. The time characterization method is based on a step response of the cell which involves applying a step or a square wave of current Ip for a duration tp. This makes it possible to characterize the sensitivity of the parameters to the direction and to the amplitude of the current. The main advantage of the time characterization method concerns the characterization of the diffusion impedance. Under a DC current step, the majority of the diffusion resistance is reached between a few seconds to hundreds of seconds. In this work, the time method was chosen, and the diffusion resistance was obtained after 30 s [20] after comparison with the EIS method which gives a good result but was considered to be highly time consuming. The internal resistance increases with decreased temperature and battery ageing. In general, the influence of temperature is greater than that of cell degradation. The discharge resistance is relatively constant around an SOC of 50% and increases with decreased SOC especially in the low-SOC range. Joule-heat influencing factors are in decreasing order of importance, temperature, ageing effect and SOC, while at a low-SOC range, the SOC value is most crucial, followed by temperature and the ageing effect [33]. Figure 4 provides the results of charge and discharge resistance as a function of SOC and temperature. It can be clearly seen that charge resistance is smaller than discharge resistance, meaning that Joule heat production is lower during the charging process. The simplification which involves not taking into consideration the hysteresis of the OCV between charge/discharge does not affect our results, since the cell studied here is an NMC prismatic cell, and the hysteresis of NMC batteries is still negligible [34].
For simulation purposes, three lookup tables were implemented: OCV as a function of SOC, R30s as a function of SOC and temperature for charge and discharge.

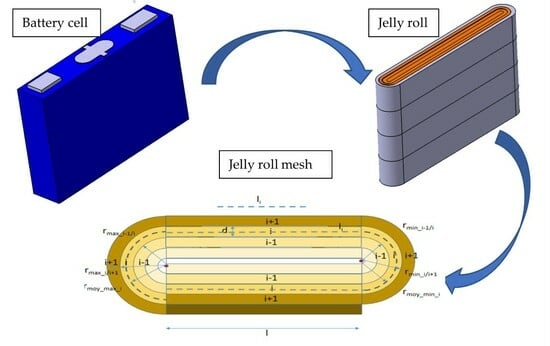
2.2.1. Electrical Model of a Meshed JR

As mentioned above, the JR is the heart of the cell where the energy is stored. By meshing the JR, it was assumed that the meshes are electrically parallel because of the way they are linked to the tabs, so all the meshes have the same voltage. The aim of this work was to have at every mesh level a thermal model coupled to an electrochemical model. Each mesh has its own volume according to Equation (4). The electrical resistance as well as the electrical capacity of each mesh depend on its volume calculated from the generic parameters of the battery cell:
V i , j = 2 l d + π / 2 2 r m i n   i / i + 1 2 r m i n   i 1 / i + ( π / 2 ) ( 2 r m a x   i / i + 1 2 r m a x   i 1 / i ) )
The electrical resistance of a mesh can be calculated according to Equation (5):
R 30 s   i , j = R 30 s   J R   N
where N is the number of meshes, R 30 s   i , j the electrical resistance of a mesh i,j and R 30 s   J R the electrical resistance of the JR.
In this work, due to volume variation, the electrical resistance and the electrical capacity of a mesh i,j were calculated according to the following two equations:
  R 30 s   i , j = R 30 s   J R   V J R V i , j
Q i , j = Q J R   V i , j V J R

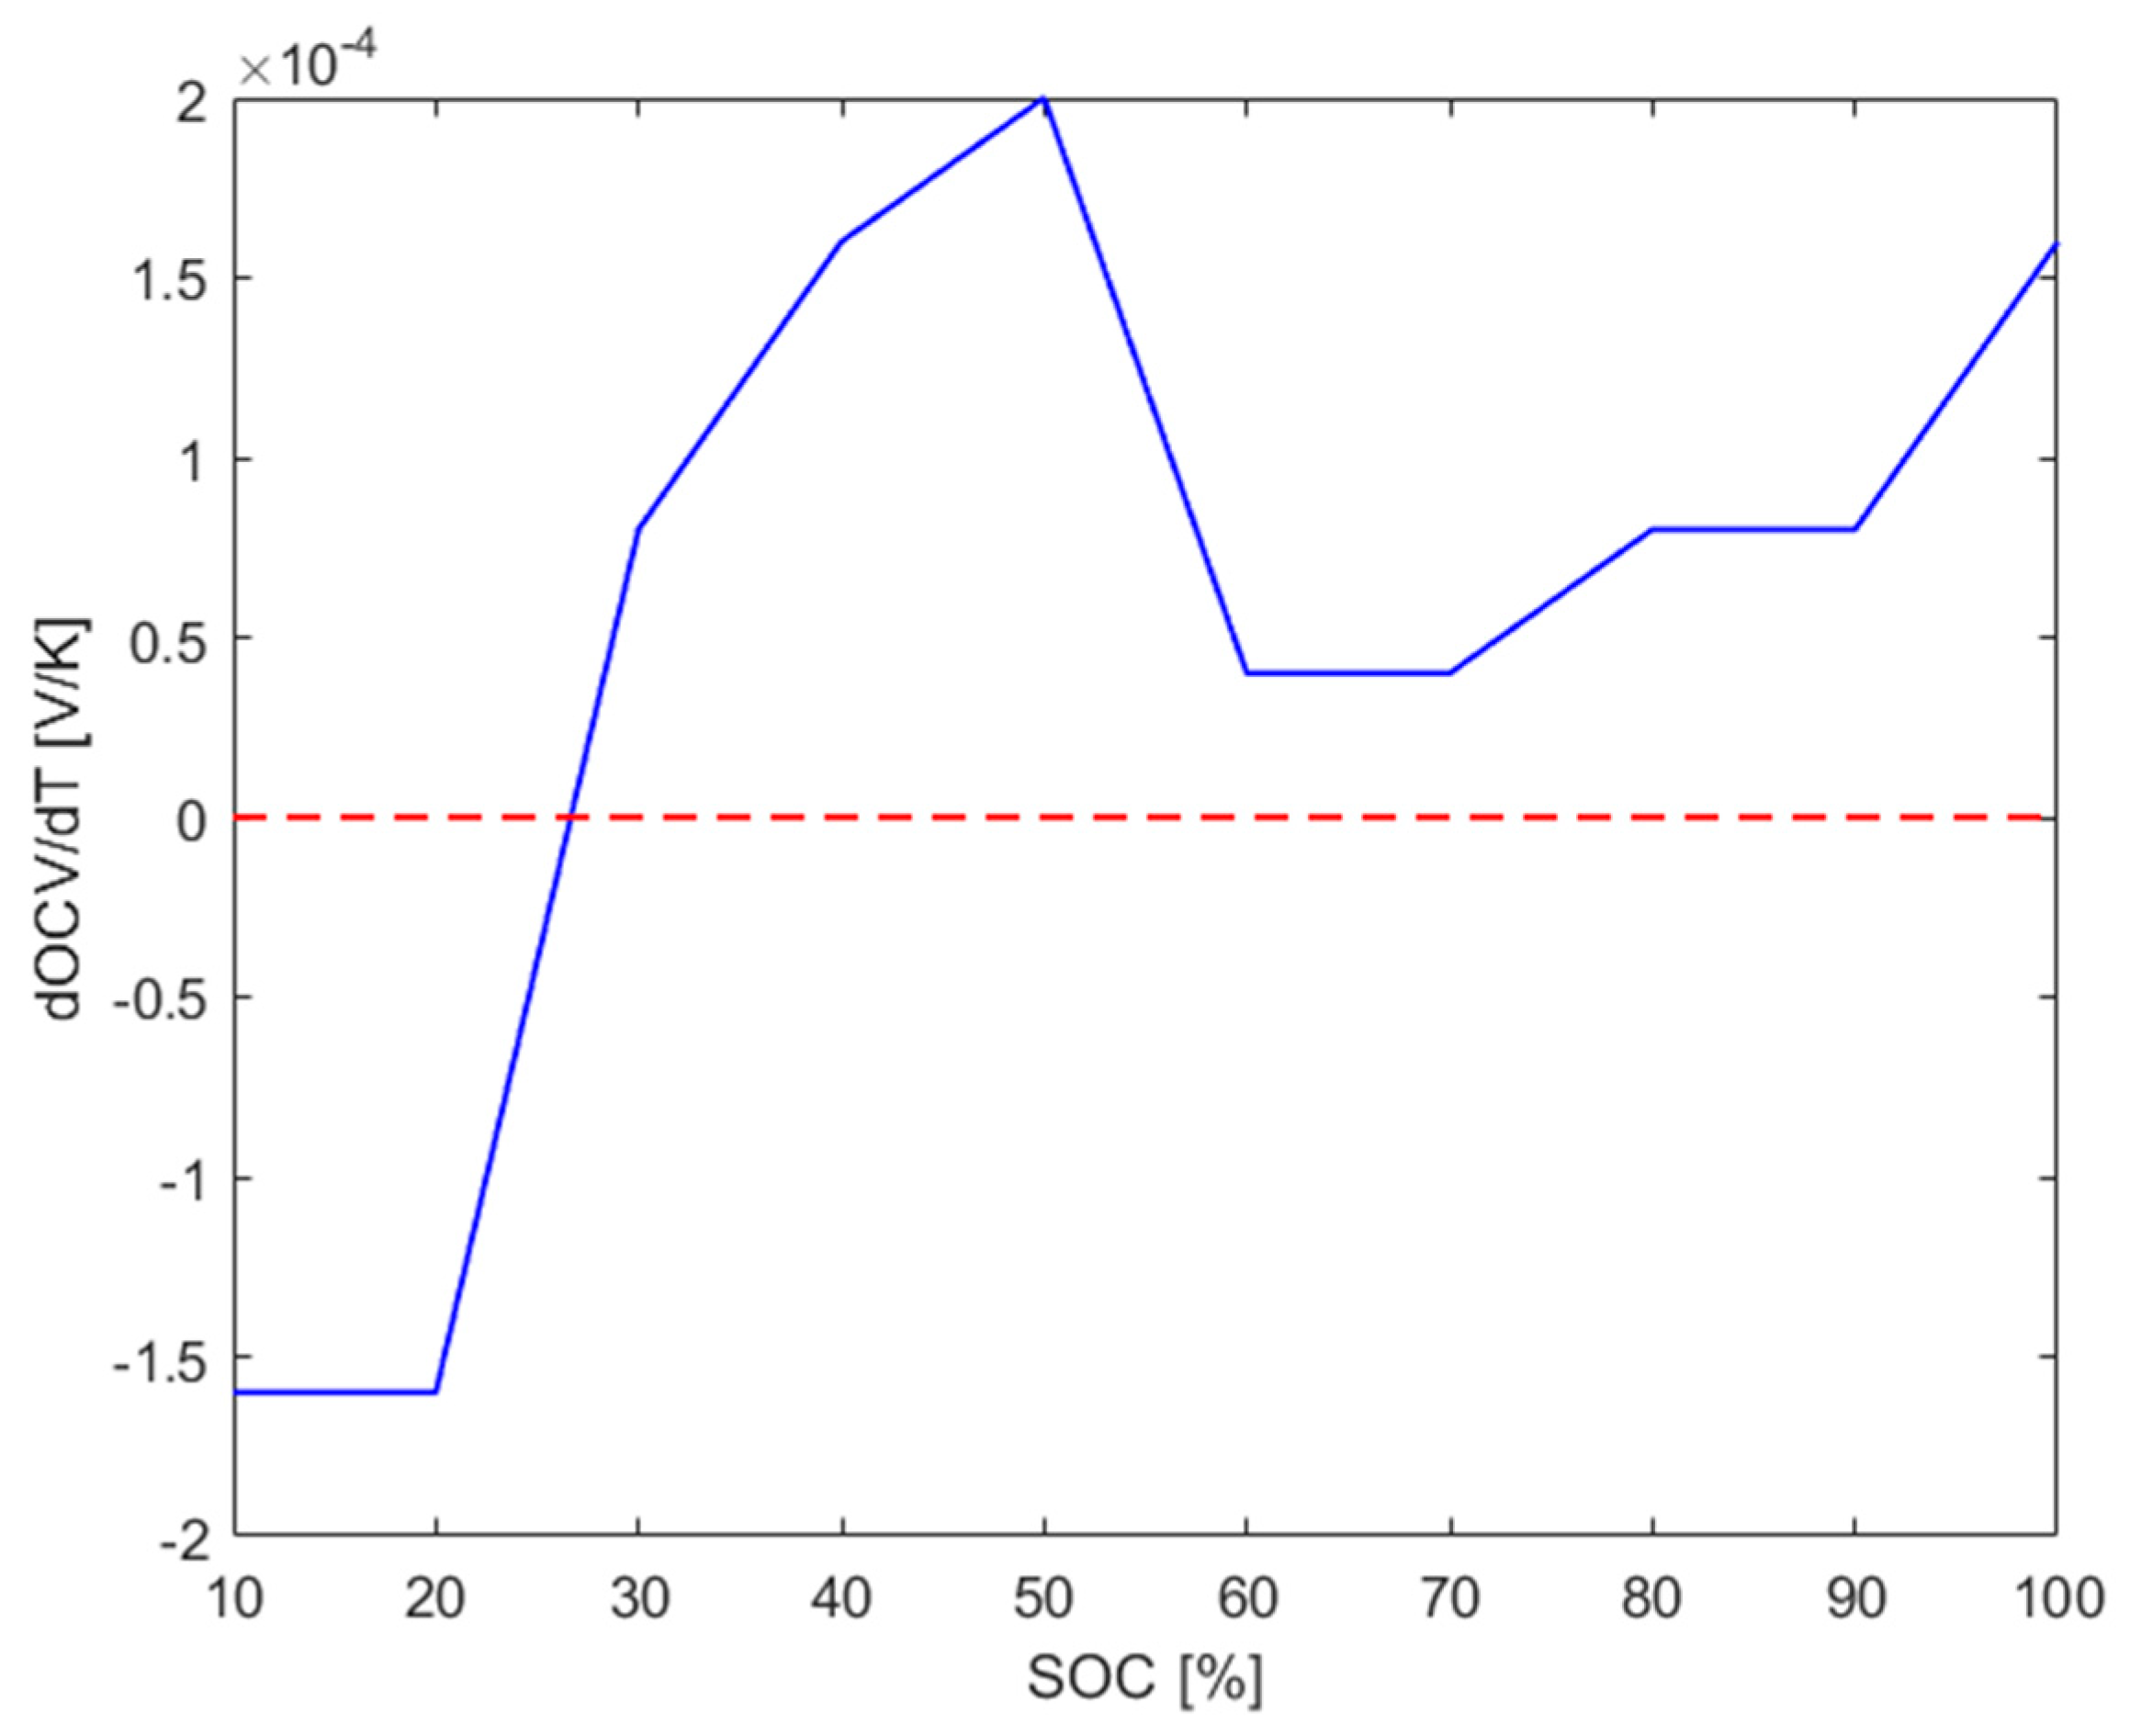
2.2.2. Heat Generation Model

As shown by Equation (8), the total heat generated during the operation of a LIB Q ˙ can be divided into two main parts: irreversible Q ˙ i r r heat and reversible Q ˙ r e v heat [35]:
Q ˙ = Q ˙ i r r + Q ˙ r e v
The irreversible heat results from various sources, including ohmic losses caused by electron/ion transport and the overpotential of the electrochemical reaction, and it consistently possesses a positive value. It stands out that reaction heat contributes about 80% of the total heat generation during the operation of a battery [36]. In this study, the irreversible heat arises from Joule heating due to internal electrical resistance, while the retrievable heat is approximated by considering the cell’s current and entropic coefficient. To obtain the reversible heat generation, the entropy change as a function of the SOC was measured using the potentiometric method. The method measures the OCV for each SOC for two different temperatures (0 °C and 25 °C). During the measurement, the cell is maintained for 3 h at 25 °C and then 6 h at 0 °C to reach an equilibrium potential. The OCV change due to temperature variation is recorded, and the process is repeated every 10% of SOC until the cell is fully discharged (SOC of 95% to SOC of 5%) [37].
According to Gibb’s free energy relationship and the Nernst equation ( Δ G = Δ H Δ S ) [37], the derivative of the variation of free energy Δ G with respect to temperature gives the expression of the variation of entropy Δ S as a function of variation of OCV at thermodynamic equilibrium with temperature. Depending on the current and entropy signatures, the energy can be either exothermic (heat release) or endothermic (heat absorption), leading to the following reversible heat equation:
Q ˙ r e v = I T O C V T .
where I is the current applied to the battery and T is the battery temperature.
Figure 5 represents the variation of the entropic coefficient according to the SOC. The data were implemented thanks to a lookup table in the heat generation model.
To summarize, the heat generated by a mesh i,j can be calculated according to the following equation:
Q ˙ i , j = R 30 s   i , j     I i , j 2 + I i , j T i , j O C V i , j T i , j
where Q ˙ i , j is the total heat generated by a single mesh i,j, R 30 s   i , j is the electrical resistance of a mesh i,j which is responsible of the irreversible heat generation, I i , j is the electrical current delivered by a mesh i,j and T i , j is the temperature of a mesh i,j
Figure 6 shows the electrothermal model of a meshed JR [38].
To achieve a comprehensive cell model, the JR must be interconnected with other cell components surrounding it, beginning with the casing, which acts as a thermal bridge between the JR and the external environment. In order to visualize the thermal gradient on the casing, the latter is meshed in height, and each mesh j of the casing is connected with a mesh i,j of the JR. The casing thermal model is governed by the following equation:
  ρ c a s i n g C c a s i n g d T j d t V j = c a s i n g T j + 1 T j S j + 1 / j d + c a s i n g T j T j 1 S j / j 1 d + h c o n v S T a i r T j + T i , j T j R t h
Since the casing is made of aluminum, its physico-thermal characteristics are known, so the only factor that remains to be quantified is the convection coefficient. To determine this parameter, the cell is initially positioned at room temperature (25 °C) outside a climate chamber. The climate chamber is then regulated to 40 °C, and once the temperature stabilizes, the cell is swiftly transferred into the pre-set 40 °C climate chamber. Subsequently, the temperature variation of the cell is measured until it reaches a steady state. The obtained temperature variation data are then fitted using Equation (12) to ultimately deduce the convection coefficient within the climate chamber:
m   C p d T c d t = h c o n v T a i r T C
where m is the mass of the battery cell,   C p its specific heat capacity, T C its temperature, T a i r is the air temperature inside the climate chamber and h c o n v is the heat transfer coefficient between the battery and the air inside the climate chamber.

3. Results and Discussion

3.1. Validation of the JR Thermal Model

Boundary conditions: various scenarios were investigated to validate the thermal model of the JR. In this article, one scenario is described.
The scenario involves subjecting the lower surface of the JR to convection with a heat transfer coefficient of 30 W· m 2 · K 1 , with an outside temperature of 500 K. The other surfaces of the JR are maintained adiabatic (no thermal exchange with the external environment). The main goal of this simulation is to investigate the thermal gradient developed at the JR level after 972 s (stop time chosen randomly).
Four meshes in height and four meshes in thickness were considered for the JR, as shown in Figure 7. The link between the mesh and the temperature data for each mesh is indicated through dotted arrows: the black arrow represents the most external mesh on the base of the JR, and the red arrow represents the central mesh at the top of the JR. For the scenario described above, the thermal gradient in height reached after 972 s is about 4 °C, with a maximum temperature of 42 °C and a minimum temperature of 38 °C [39].
This analysis thus validates the mesh used for the JR discretization and provides a highly accurate estimation of the thermal gradient with a low computational load.

3.2. Validation of the Electrothermal Model of the Battery Cell

To validate the electrothermal model, the battery cell is subjected to charge/discharge current profiles using the BCS-815 module from BioLogic, which has eight channels and eight inputs for temperature measurement using K-type thermocouples. Before the cell is solicited, it is first placed in a climate chamber. The cell is then wired to the battery cycler, and finally instrumented by thermocouples in order to recover both the average temperature of the cell and to investigate the hot spots and the thermal gradient at the cell level. The instrument specifications are tabulated in Table 3.
To validate the electrothermal model of the cell, two current profiles were used; see Figure 8a,b. During these tests, the cell is fully charged in CC-CV mode, then the cell is relaxed. Once the cell is fully relaxed electrically and thermally, it is then discharged until it reaches the lower operating limit given by the manufacturer. The choice of these current profiles is justified by the fact of wanting to scan the entire operating range of the battery cell from an SOC of 0% to an SOC of 100% and validate the resistance lookup tables implemented in the model. The other reason was to analyze the charging and discharging behaviors of the battery. For the current, two different amplitudes were used in order to investigate the effect of current amplitude on the heat generated as well as on the thermal behavior of the cell [40]. Figure 8c,d represents the variation of voltage as a function of time for both current profiles.
The observation shows that the model’s accuracy decreases at low state-of-charge (SOC) due to the battery’s nonlinear behavior. As the SOC decreases, the temperature difference between the simulation and experimental results widens until it reaches 0.8 °C, as depicted in Figure 8h. However, even at a high C-rate, the error remains within 1 °C, and the identified error remains smaller than the uncertainty associated with the thermocouple, which is +/−1 °C. Overall, the model performs reasonably well, especially considering the inherent challenges posed by the battery’s nonlinear characteristics and the associated uncertainties in the experimental measurements.
Figure 8g,h represents the temperature responses of the model compared to those obtained during tests. In both cases, the maximum temperature reached after discharge is higher than the maximum temperature reached after charge [41,42]. According to the figures shown above, it is clear that the model is able to reproduce the behavior of the battery cell both electrically and thermally with high accuracy for different boundary conditions. It was found that there is a proportional relationship between current amplitude and temperature response. Figure 8c,d shows that the voltage curve provided by the model is representative of the real voltage response of the cell during the charging and discharging phases, except at low SOCs, where the results do not fit well because of the non-linear behavior of the battery at low SOCs.
The model is also able to reproduce the endothermic behavior as shown in Figure 8h, where the temperature slows down between 0.5 ×   10 4 and 1 ×   10 4 s and also between 2.3 ×   10 4 and 2.6 ×   10 4 s, which corresponds to the SOC range of 35–60%. This phenomenon is not visible in Figure 8g because of the irreversible heat which dominates the reversible one at high currents.
Figure 9 illustrates the changes in reversible, irreversible and total heat generated by the battery, corresponding to the current profile displayed in Figure 8b. The reversible heat, unlike the irreversible heat, is not consistently positive. If it becomes negative, it indicates that the activation reactions occurring at the anode and cathode levels are endothermic, resulting in heat absorption instead of heat generation.

3.3. Thermal Gradient Assessment for a Given Current Profile

After the mesh description and the battery cell electrothermal model validation, the aim of this section is to assess the battery cell thermal gradient for a given boundary condition and current profile.
Boundary conditions:
  • The current profile is chosen to investigate the effect of current on the thermal gradient during charge and discharge;
  • The battery is subjected to conduction through its bottom surface with a cooling plate;
  • The air temperature is set at 25 °C;
  • The cooling temperature is set at 30 °C.
Figure 10 presents the thermal gradient observed after discharging and subsequently charging the battery. It is evident that the thermal gradient is more pronounced during the charging phase, primarily because the current is higher during the charge process. During the discharge phase, the thermal gradient remains below 0.2 °C, while it reaches 0.7 °C during the charge phase.
Consequently, the temperature difference between the upper and lower sections of the battery increases notably at high C-rates, particularly when the cooling plate’s temperature is low. This trend emphasizes the significance of managing temperature variations and cooling efficiency, especially during high-current charging scenarios, to maintain optimal battery performance and safety.

4. Conclusions

In this paper, a detailed model of a prismatic cell is built. An original mesh of the JR is proposed where heat exchanges in the three directions (radial, orthoradial and axial) are considered. A pure thermal test which involves quantifying the heat transfer coefficient within a climate chamber was carried out, and the value of the coefficient was obtained. The meshed JR thermal model has been validated by subjecting the JR to various boundary conditions. The electrothermal model of the cell has been validated through electrothermal tests in which the cell is solicited by two different current profiles. It turns out that there is a relationship between the amplitude of the current and the maximum temperature reached during a test. Reversible heat is not to be neglected in the heat generation model, especially at low C-rates. According to the simulations presented in the previous section, the temperature of the cell does not increase all the time: it might decrease between a SOC of 35% and 60% due to the endothermic phenomenon. The impact of this work will be most important in high-rate applications such as the automotive industry, especially in battery thermal management. The idea is to use this model and duplicate it depending on the battery pack topology, and also assess the thermal gradient during a fast charge and investigate battery behavior in extreme conditions. Experimental tests will also be carried out to validate the model in terms of thermal gradient assessment.

Author Contributions

Conceptualization, F.G; methodology, S.M., F.G., J.S. and J.-M.V.; simulation, S.M.; experiments, S.M., F.G., J.S. and J.-M.V.; validation, S.M., F.G., J.S. and J.-M.V.; writing-original draft preparation, S.M., F.G., J.S. and J.-M.V. All the authors reviewed the paper. All authors have read and agreed to the published version of the manuscript.

Funding

This research was funded by Stellantis and carried out under a CIFRE agreement and granted by the ANRT 2020/1011.

Data Availability Statement

Data are available on request from the authors.

Acknowledgments

This work took place within the framework of the OpenLab ‘Electronic and Systems for Automotive’ combining IMS laboratory, Lodz laboratory and Stellantis. This work was carried out under a CIFRE agreement and granted by the ANRT.

Conflicts of Interest

The authors declare no conflict of interest.

References

  1. China Energy Storage Alliance. Energy Storage Industry White Paper. (Summary Version). 2022. Available online: https://en.cnesa.org/our-work (accessed on 26 March 2023).
  2. U.S. Geological Survey. Mineral Commodity Summaries 2023; Mineral Commodity Summaries No. 2023; U.S. Geological Survey: Reston, VA, USA, 2023. Available online: http://pubs.er.usgs.gov/publication/mcs2023 (accessed on 20 March 2023).
  3. Statista. Estimated Market Demand for Lithium-Ion Batteries Used in Electric Vehicles in 2019 with a Forecast for 2020 through 2030 (In Gigawatt Hours) [Graph]. 2021. Available online: https://www.statista.com/statistics/309570/lithium-ion-batterymarket-in-electric-vehicles/ (accessed on 13 March 2023).
  4. Scientific Background on the Nobel Prize in Chemistry. 2019. Available online: https://www.nobelprize.org/uploads/2019/10/advanced-chemistryprize2019-2.pdf (accessed on 9 October 2019).
  5. Statista. Estimated Electric Vehicle Battery Cell Price Breakdown as of 2020, by Category. 2020. Available online: https://www.statista.com/statistics/1176656/electric-vehicle-battery-price-by-category/?locale=en (accessed on 20 March 2023).
  6. Steinhardt, M.; Gillich, E.I.; Stiegler, M.; Jossen, A. Thermal conductivity inside prismatic lithium-ion cells with dependencies on temperature and external compression pressure. J. Energy Storage 2020, 32, 101680. [Google Scholar] [CrossRef]
  7. Zhou, Y.; Wang, Z.; Xie, Z.; Wang, Y. Parametric Investigation on the Performance of a Battery Thermal Management System with Immersion Cooling. Energies 2022, 15, 2554. [Google Scholar] [CrossRef]
  8. Hunt, I.A.; Zhao, Y.; Patel, Y.; Offer, G.J. Surface Cooling Causes Accelerated Degradation Compared to Tab Cooling for Lithium-Ion Pouch Cells. J. Electrochem. Soc. 2016, 163, A1846–A1852. [Google Scholar] [CrossRef]
  9. Olabi, A.G.; Maghrabie, H.M.; Adhari, O.H.K.; Sayed, E.T.; Yousef, B.A.; Salameh, T.; Kamil, M.; Abdelkareem, M.A. Battery thermal management systems: Recent progress and challenges. Int. J. Thermofluids 2022, 15, 100171. [Google Scholar] [CrossRef]
  10. Xu, J.; Chen, Z.; Qin, J.; Minqiang, P. A lightweight and low-cost liquid-cooled thermal management solution for high energy density prismatic lithium-ion battery packs. Appl. Therm. Eng. 2022, 203, 117871. [Google Scholar] [CrossRef]
  11. Wu, S.; Xiong, R.; Li, H.; Nian, V.; Ma, S. The state of the art on preheating lithium-ion batteries in cold weather. J. Energy Storage 2020, 27, 101059. [Google Scholar] [CrossRef]
  12. Kalogiannis, K.; Jaguemont, J.; Omar, N.; Mierlo, J.V.; Van den Bossche, P. A Comparison of Internal and External Preheat Methods for NMC Batteries. World Electr. Veh. J. 2019, 10, 18. [Google Scholar] [CrossRef]
  13. Shen, K.; Sun, J.; Zheng, Y.; Xu, C.; Wang, H.; Wang, S.; Chen, S.; Feng, X. A comprehensive analysis and experimental investigation for the thermal management of cell-to-pack battery system. Appl. Therm. Eng. 2022, 211, 118422. [Google Scholar] [CrossRef]
  14. Li, S.; Kirkaldy, N.; Zhang, C.; Gopalakrishnan, K.; Amietszajew, T.; Diaz, L.B.; Barreras, J.V.; Shams, M.; Hua, X.; Patel, Y.; et al. Optimal cell tab design and cooling strategy for cylindrical lithium-ion batteries. J. Power Sources 2021, 492, 229594. [Google Scholar] [CrossRef]
  15. Dao, T.-S.; Vyasarayani, C.P.; McPhee, J. Simplification and order reduction of lithium-ion battery model based on porous-electrode theory. J. Power Sources 2012, 198, 329–337. [Google Scholar] [CrossRef]
  16. Wang, D.; Huang, H.; Tang, Z.; Zhang, Q.; Yang, B.; Zhang, B. A lithium-ion battery electrochemical-thermal model for a wide temperature range applications. Electrochim. Acta 2020, 362, 137118. [Google Scholar] [CrossRef]
  17. Barreras, J.V.; Raj, T.; Howey, D.A. Derating strategies for lithium-ion batteries in electric vehicles. In Proceedings of the IECON 2018—44 th Annual Conference of the IEEE Industrial Electronics Society, Washington, DC, USA, 21–23 October 2018. [Google Scholar] [CrossRef]
  18. Perez Estevez, M.A.; Calligaro, S.; Bottesi, O.; Caligiuri, C. An electro-thermal model and its electrical parameters estimation procedure in a lithium-ion battery cell. J. Energy 2021, 234, 121296. [Google Scholar] [CrossRef]
  19. Shi, H.; Wang, S.; Fernandez, C.; Yu, C.; Xu, W.; Dablu, B.E.; Wang, L. Improved multi-time scale lumped thermoelectric coupling modeling and parameter dispersion evaluation of lithium-ion batteries. J. Appl. Energy 2022, 324, 119789. [Google Scholar] [CrossRef]
  20. Damay, N. Modélisation Thermique D’une Batterie Li-Ion Prismatique de Grande Capacité et Validation Expérimentale. Ph.D. Thesis, Université de Technologie de Compiègne, Compiègne, France, 2015; p. 8. [Google Scholar]
  21. Waldmann, T.; Scurtu, R.-G.; Richter, K.; Wohlfahrt-Mehrens, M. 18650 vs. 21700 Li-ion cells—A direct comparison of electrochemical, thermal, and geometrical properties. J. Power Sources 2020, 472, 228614. [Google Scholar] [CrossRef]
  22. Rezvanizaniani, S.M.; Liu, Z.; Chen, Y.; Lee, J. Review and recent advances in battery health monitoring and prognostics technologies for electric vehicle (EV) safety and mobility. J. Power Sources 2014, 256, 110–124. [Google Scholar] [CrossRef]
  23. Fleckenstein, M.; Bohlen, O.; Baker, B. Aging Effect of Temperature Gradients in Li-ion Cells Experimental and Simulative Investigations and the Consequences on Thermal Battery Management. World Electr. Veh. J. 2012, 5, 322–333. [Google Scholar] [CrossRef]
  24. Worwood, D.; Kellner, Q.; Wojtala, M.; Widanage, W.D.; McGlen, R.; Greenwood, D.; Marco, J. A new approach to the internal thermal management of cylindrical battery cells for automotive applications. J. Power Sources 2017, 346, 151–166. [Google Scholar] [CrossRef]
  25. Madaoui, S.; Guillemard, F.; Sabatier, J.; Vinassa, J.-M. A detailed electro-thermal model of an NMC lithium-ion prismatic battery cell. In Proceedings of the 2023 IEEE 97th Vehicular Technology Conference (VTC2023-Spring), Florence, Italy, 20–23 June 2023. [Google Scholar] [CrossRef]
  26. Li, K.; Zhou, F.; Chen, X.; Yang, W.; Shen, J.; Song, Z. State-of-charge estimation combination algorithm for lithium-ion batteries with Frobenius-norm-based QR decomposition modified adaptive cubature Kalman filter and H-infinity filter based on electro-thermal model. J. Energy 2023, 263, 125763. [Google Scholar] [CrossRef]
  27. An, Z.; Zhang, C.; Luo, Y.; Zhang, J. Cooling and preheating behavior of compact power Lithium-ion battery thermal management system. J. Appl. Therm. Eng. 2023, 226, 120238. [Google Scholar] [CrossRef]
  28. Xu, S.; Wang, Y.; Shao, J.; Li, J.; Yu, Q. An electroechemical-thermal coupling model for prismatic lithium-ion batteries over wide temperature range. J. Appl. Therm. Eng. 2022, 217, 119282. [Google Scholar] [CrossRef]
  29. Zhao, Y.; Patel, Y.; Zhang, T.; Offer, G.J. Modeling the Effects of Thermal Gradients Induced by Tab and Surface Cooling on Lithium Ion Cell Performance. J. Electrochem. Soc. 2018, 165, A3169–A3178. [Google Scholar] [CrossRef]
  30. Skoog, S. Parameterization of equivalent circuit models for high power lithium-ion batteries in HEV applications. In Proceedings of the 2016 18th European Conference on Power Electronics and Applications (EPE’16 ECCE Europe), Karlsruhe, Germany, 5–9 September 2016; pp. 1–10. [Google Scholar] [CrossRef]
  31. Baccouche, I.; Jemmali, S.; Manai, B.; Nikolian, A.; Omar, N. Li-ion battery modeling and characterization: An experimental overview on NMC battery. Int. J. Energy Res. 2022, 46, 3843–3859. [Google Scholar] [CrossRef]
  32. Mathieu, R. Modélisation de L’influence de la Rapidité de Recharge Totale ou Partielle sur les Performances Electro-Thermiques et la Durée de vie des Batteries Pour Applications Automobiles. Ph.D. Thesis, Université de Bordeaux, Bordeaux, France, 2020; p. 253. [Google Scholar]
  33. Liu, G.; Ouyang, M.; Lu, L.; Li, J.; Han, X. Analysis of the heat generation of lithium-ion battery during charging and discharging considering different influencing factors. J. Therm. Anal. Calorim. 2014, 116, 1001–1010. [Google Scholar] [CrossRef]
  34. Lu, L.; Han, X.; Li, J.; Hua, J.; Ouyang, M. A review on the key issues for lithium-ion battery management in electric vehicles. J. Power Sources 2013, 226, 272–288. [Google Scholar] [CrossRef]
  35. Palmieri, B.; Cilento, F.; Siviello, C.; Bertocchi, F.; Giordano, M.; Martone, A. Mitigation of Heat Propagation in a Battery Pack by Interstitial Graphite Nanoplatelet Layer: Coupled Electrochemical-Heat Transfer Model. J. Compos. Sci. 2022, 6, 296. [Google Scholar] [CrossRef]
  36. Wu, L.; Liu, K.; Liu, J.; Pang, H. Evaluating the heat generation characteristics of cylindrical lithium-ion battery considering the discharge rates and N/P ratio. J. Energy Storage 2023, 64, 107182. [Google Scholar] [CrossRef]
  37. Xu, X.; Zhang, H.; Cao, L.; Yi, Z.; Li, P.; Guo, H. Heat generation and surrogate model for large-capacity nickel-rich prismatic lithium-ion battery as against 18650 battery. J. Loss Prev. Process Ind. 2022, 77, 104783. [Google Scholar] [CrossRef]
  38. Doh, C.-H.; Ha, Y.-C.; Eom, S.-W. Entropy measurement of a large format lithium ion battery and its application to calculate heat generation. Electrochim. Acta 2019, 309, 382–391. [Google Scholar] [CrossRef]
  39. Lv, Y.; Luo, W.; Li, C.; Zhang, G.; Huang, S.; Rao, Z. Experimental and numerical simulation study on the integrated thermal management system for electric vehicles. J. Energy Storage 2023, 70, 107895. [Google Scholar] [CrossRef]
  40. Zhao, J.; Lv, P.; Rao, Z. Experimental study on the thermal management performance of phase change material module for the large format prismatic lithium-ion battery. Energy 2022, 238, 122081. [Google Scholar] [CrossRef]
  41. Li, X.; Xiao, L.; Geng, G.; Jiang, Q. Temperature characterization based state-of-charge estimation for pouch lithium-ion battery. J. Power Sources 2022, 535, 231441. [Google Scholar] [CrossRef]
  42. Merveillaut, M. Modelisation non Entiere et non Lineaire d’un Accumulateur Litium-ion en vue de la Mise en œuvre D’observation de Variable Interne. Ph.D. Thesis, University of Bordeaux, Bordeaux, France, 2010. [Google Scholar]
Figure 1. The studied prismatic battery cell.
Batteries 09 00478 g001
Figure 2. The proposed mesh of the JR. Where d is the thickness of the mesh i, j, l the length of the JR without the rounded parts, r min _ i / i + 1 the minimum radius of the mesh i,j r max _ i / i + 1 the maximum radius of the mesh i,j,   r m o y _ min _ i the mean minimum radius of mesh i,j, r m o y _ max _ i the average maximum radius of mesh i,j and dz represents the height of each mesh.
Batteries 09 00478 g002
Figure 3. OCV as a function of SOC.
Batteries 09 00478 g003
Figure 4. Electrical resistance as a function of SOC and temperature.
Batteries 09 00478 g004
Figure 5. Entropic coefficient variation as function of SOC.
Batteries 09 00478 g005
Figure 6. Electrothermal model of a meshed JR.
Batteries 09 00478 g006
Figure 7. Mesh temperatures from the developed model.
Batteries 09 00478 g007
Figure 8. (a,b) Current profiles; (c,d) voltage responses; (e,f) total heat generation; (g,h) temperature responses.
Batteries 09 00478 g008aBatteries 09 00478 g008b
Figure 9. The variation of reversible, irreversible and total heat generated during charging and discharging at 20 A.
Batteries 09 00478 g009
Figure 10. Thermal gradient assessment during charge and discharge of the battery.
Batteries 09 00478 g010
Table 1. Specifications of the battery cell.
SpecificationValue
Cathode materialNMC
Anode materialGraphite
Nominal capacity67 Ah
Cut-off voltages2.7–4.3 V
Dimensions150 mm 30 mm 100 mm
Thermal conductivities 40–2.5–40 W · m 1 · K 1 .
Thermal capacity1200 J· k g 1 · K 1 .
Table 2. Thickness and thermo-physical properties of jelly roll components.
Material/LayerThickness [μm]Density [kg·m−3]Specific Heat Capacity
[J·kg−1·K−1]
Thermal Conductivity [W·m−1·K−1]
Aluminum foil212702903238
Copper foil128933385298
Separator sheet25101719780.34
Positive electrode70289512701.58
Negative electrode79155514371.04
Table 3. Instrument specifications.
InstrumentManufacturer TypeUltimate RangeUncertainty
Battery cyclerBioLogicBCS-815±15 A/channel±1%
ThermocouplesRS PROK−75~250 °C±1 °C
Climate chamberClimatsTM 55−30~150 °C±0.15%
Disclaimer/Publisher’s Note: The statements, opinions and data contained in all publications are solely those of the individual author(s) and contributor(s) and not of MDPI and/or the editor(s). MDPI and/or the editor(s) disclaim responsibility for any injury to people or property resulting from any ideas, methods, instructions or products referred to in the content.

