Article

A Plating-Free Charging Scheme for Battery Module Based on Anode Potential Estimation to Prevent Lithium Plating

1
School of Engineering, University of Lincoln, Lincoln LN6 7TS, UK
2
Warwick Manufacturing Group, University of Warwick, Coventry CV4 7AL, UK
3
The Faraday Institution, Harwell Campus, Didcot OX11 0RA, UK
*
Author to whom correspondence should be addressed.
Batteries 2023, 9(6), 294; https://doi.org/10.3390/batteries9060294
Submission received: 31 March 2023 / Revised: 17 May 2023 / Accepted: 23 May 2023 / Published: 27 May 2023
(This article belongs to the Section Battery Modelling, Simulation, Management and Application)

Abstract

:
Since fast charging schemes for lithium-ion batteries are known to lead to a reduction in battery capacity, there is a need to avoid lithium plating during the charging process. This paper designed an anode potential observer and a plating-free charging scheme for a battery module to avoid the risk of lithium plating for all cells in the module. The observer was designed using an electrochemical cell model and an electrical busbar model to estimate the anode potential of all cells within a parallel connected battery module. Due to its simplicity and low computational loads, the observer was easy to implement in a charge management system. The results demonstrated that the designed observer and charging scheme can accurately estimate the anode potential of all cells in the module. The estimation results of the observer were used in the plating-free charging scheme. Compared to conventional charging methods, the proposed scheme added an additional stage to estimate and control the anode potential, therefore reducing the risk of lithium plating during charging. It also reduced the peak temperature of the battery by approximately 9.8% and reduced the overall charging time by 18%.

1. Introduction

In response to climate change and the impact of greenhouse gases on the environment, many industry sectors, including energy, buildings, and transportation, are decarbonizing to ensure a low-carbon future. In transport, electric vehicles (EVs) grew rapidly in recent years [1]. With the electrification of transport, the demand for batteries also increased [2]. The total number of electric vehicles is expected to exceed 300 million by 2030, requiring an installed battery capacity of 3000 GWh [3,4]. Among them, lithium-ion batteries (LIBs) are the most widely used technology due to their favorable characteristics, such as high energy density, no memory effect, low environmental pollution, low self-discharge rate, and long service life [5,6,7]. However, range anxiety and long recharging times are often cited as major issues hindering the widespread adoption of electric vehicles compared to gasoline vehicles [8,9]. As a result, fast charging capability became one of the main challenges for the battery and electric vehicle industry.
Simply increasing the charging rate was validated to accelerate the degradation of Li-ion cells, leading to a reduction in capacity and power capability, and even damaging the battery [10,11,12]. On the other hand, the heat generated during fast charging is difficult to manage uniformly and efficiently, especially in battery packs containing a large number of cells, leading to accelerated battery degradation and safety concerns [13,14]. Due to these restrictions, fast charging rates are typically only possible at around 80% of full state of charge (SOC) level [15]. At high SOC or low ambient temperatures, the current needs to be gradually reduced to avoid exceeding the maximum voltage limit of the battery, resulting in a longer time required to charge to full capacity [16]. Therefore, the development of safe and efficient fast charging strategies for Li-ion cells is essential and gained increasing attention over recent years. Many studies categorized the optimal charging mode for Li-ion cells as a combinatorial optimization problem to solve. The literature [17] used an ant colony system algorithm to search for the optimal fast charging pattern. The study [18] proposed a novel algorithm combining standard genetic algorithm with evolution of a queen bee to obtain an optimal controller for boost converters. The literature [19] proposed a fuzzy control charging strategy based on constant-polarization to adapt the acceptance of the charging current to the SOC stage of the battery. The article [20] used a dynamic programming approach to solve the trade-offs concerning charging time and energy loss. Within [21], a closed-form optimal control scheme was proposed to solve the optimal charging problem for LIBs. Conversely, within [22], a three-objective function, i.e., charging time, energy loss, and temperature rise, was developed and heuristics were applied to optimize the function to obtain the optimal charging current profile. However, most of these were designed based on certain factors to optimize the fast-charging strategies. It is necessary to address the effects of fast charging on LIBs in terms of the electrochemical principles of battery generation of side reactions.
In recent years, researchers found that the loss of battery capacity under different charging rates is related to lithium plating [23]. Lithium plating is a self-accelerating degradation phenomenon observed on graphite anodes and is a Faraday-type side reaction that leads to irreversible capacity loss and early cell failure [24,25]. This reaction occurs mainly during rapid charging. Plenty of research work was carried out over the last few decades to understand the mechanism of lithium plating [26], but its mechanism was still not fully elucidated [27]. It is basically believed that lithium plating is a parasitic process that accompanies the lithium intercalation process [28]. During the charging process, the vacant sites in the graphite layer decrease and, therefore, the intercalation current is decreased. The lithium plating current is then increased as it is in competition with the intercalation current to total charging current [29]. When the anode potential drops below zero volt, the lithium deposition rate will exceed the intercalation rate [30]. At this point, the lithium ions are reduced to metallic Li [31,32] and deposited on the surface of the graphite anode, rather than intercalating into the anode crystal structure [33]. The deposited metallic Li is generally reversible. However, during the oxidation process, the deposited metallic Li can react with the electrolyte to form a secondary SEI layer, which isolates from the graphite anode and forms a high impedance ‘dead’ lithium film [34]. This process is irreversible and not only increases the internal resistance, but also leads to accelerated capacity degradation [35]. In severe cases, the accumulated lithium plating can form lithium dendrites that can pierce the separator and cause internal short circuits [36]. Many studies showed that lithium plating can be localized in the presence of local inhomogeneity on the surface of the graphite anode [37]. As a result, lithium plating can occur thermodynamically when the local potential of the anode is below 0 V due to high charging C-rates [38] and low temperatures [39], all of which polarize the electrode [40]. Increasing the charging current and decreasing the ambient temperature both lead to a decrease in the anode potential [41]. Therefore, to solve the problem of lithium plating during fast charging, the current level needs to be adjusted during the charging process, while reducing the heat generation and avoiding the conditions where lithium plating occurs and, ultimately, which limit the degradation of the LIB.
One of the earliest types of protocols designed specifically for fast charging was the multi-stage constant current (MCC) protocol [42]. This method consists of two or more constant current stages, usually followed by a constant voltage (CV) stage [43]. The earlier constant current (CC) stage is usually chosen to have a higher current level, as the anode potential is less likely to become negative at the beginning of the charging process. The current level is reduced whenever the local lithium deposition reaches a predetermined value. This method was validated to reduce the rate of degradation but requires extensive experimentation to calibrate the charging protocol [44]. An alternative method is to control the anode potential directly via a reference electrode [45]. The tendency of metallic lithium deposition at the anode interface is eliminated by limiting the anodic overpotential to a positive value. This charging strategy was shown to be suitable for low-temperature charging, eliminating most of the lithium plating and increasing up to seven times of its cycle life [45]. However, this method requires the insertion of a reference electrode into a commercial cell to rebuild the cell, which leads to a significant reduction in the practicality of the method. As with most electrochemical energy storage systems, the internal state of a typical commercial cell cannot be measured directly and can only be estimated and predicted indirectly from limited signals, such as voltage, current, and temperature [46,47].
In recent years, some research began to turn attention to the estimation of anode potential using cell models to detect whether lithium plating is occurring. Due to the complex electrochemical reactions within the battery, the internal state exhibits a highly non-linear relationship with the externally measured signals [48,49,50]. Many methods use equivalent circuit models (ECMs) to estimate the state of the cell, e.g., SOC and state of health (SOH). However, given that parameters of ECM, such as resistance and capacitance, are derived by curve fitting to experimental training data, the resulting models were not sufficiently accurate. In the absence of insight into the physics behind the state variables, it is not possible to accurately estimate whether the battery interior is free from unwanted side reactions during fast charging. In recent years, researchers attempted to use electrochemical-based models for battery charging management, including the pseudo-two-dimensional (P2D) model [51], single particle model (SPM) [52], and thermal single particle model with electrolyte (TSPMe) model [53]. These models describe phenomena such as ion diffusion kinetics, intercalation kinetics, and electrochemical potentials and can reproduce the dynamics of the battery with high fidelity [11]. However, these applications are potentially limited by the complex calculations associated with partial differential equation (PDE)-based non-linear models and online optimization. For battery packs containing a large number of cells, the use of electrochemical models for modelling each individual cell is not applicable. In recent years, some research proposed a novel decomposed motor model to predict the anode potential by splitting the classical ECM model into two parts, thus achieving the effect of a three-electrode cell [54]. However, this approach cannot explain how lithium plating will affect the electrochemical variables and mechanisms within the cell. Another study used a data-driven approach to predict the anode potential by training a neural network model to match the simulation results of the P2D model [55]. However, the data-driven model parameters lacked physical meaning and no valid battery parameters can be extracted from the model. Another study used a simplified electrochemical model (SEM)-based observer for low-complexity SOC and anode potential prediction for Li-ion batteries [56]. However, this SEM model was linear and may reduce the accuracy of the estimation as the non-linear part was neglected. Furthermore, the above methods were designed to estimate the anode potential of a single cell without taking into account the interactions between cells in a battery containing dozens or even more cells. This led to doubts about the predictive capability of these methods in practical applications.
In our previous publications, an anode potential observer was proposed using a reduced-order electrochemical TSPMe model, to reduce the computational effort to 2% of the full-order model to allow it to run in real-time [57]. Considering estimating states of each cell in a battery pack, a simplified modelling approach of the busbar was proposed to estimate the current distribution and temperature distribution within the parallel pack in our previously work [58]. Building on the contributions of those two papers, this paper designed an anode potential observer for a battery module and a plating-free fast charging scheme to avoid the risk of lithium-plating of all the cells in a battery module. The observer applied in this scheme used a TSPMe cell model as well as an electrical busbar model of the battery pack, allowing it to estimate the anode potential of each cell in the pack with high accuracy for use in the charge management system. The proposed charging scheme regulated the charging current of the battery pack by estimating and limiting the drop in anode potential through the designed observer. The main contributions of this paper are summarized below:
  • An observer was designed to estimate the anode potential of all cells in a parallel connected battery module with a low computational load;
  • A plating-free charging scheme was developed based on the observer to avoid lithium plating by estimating and controlling the anode potential of all cells to not fall below a positive threshold;
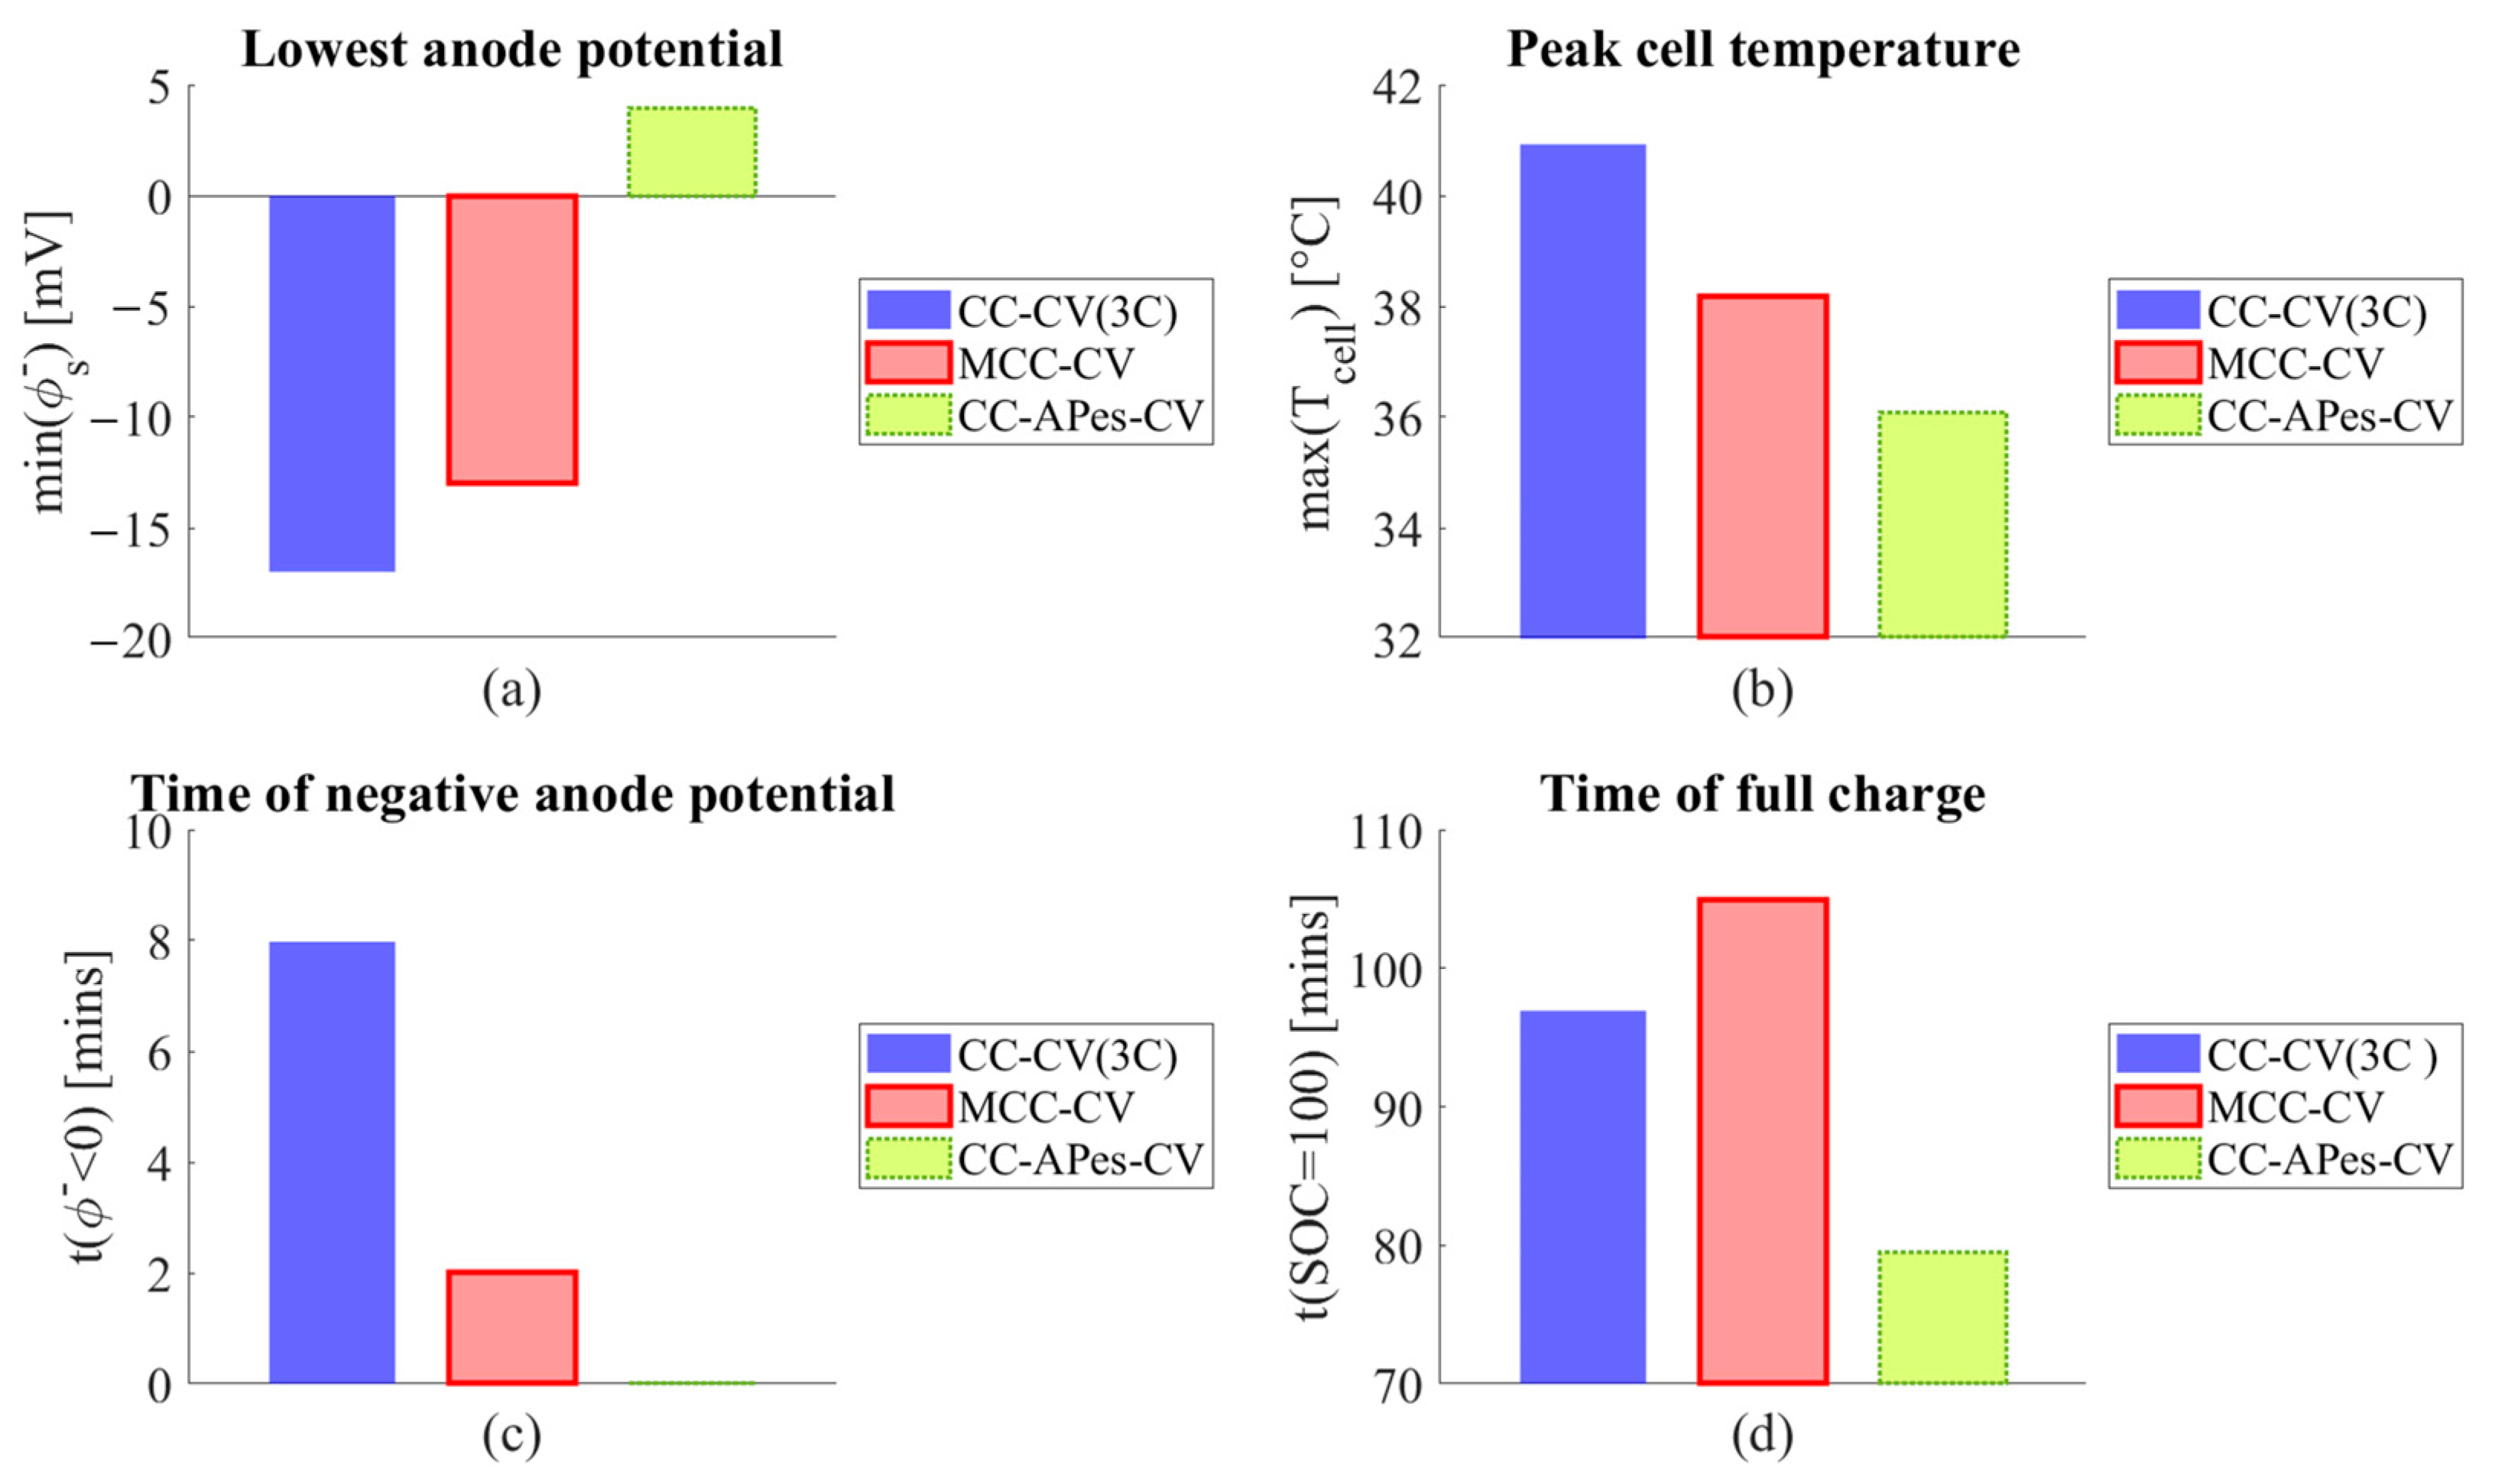
  • The charging scheme was validated in simulation, showing that it eliminated the occurrence of negative anode potentials and reduced the peak temperature and overall charging time compared to traditional CC-CV method.
The remaining parts of this paper are structured as follows. Section 2 presents the TSPMe model and the design of the anode potential observer and charging scheme. Section 3 shows the simulation results to validate the performance of the model, observer and charging approach. Finally, the findings of this paper are concluded in Section 4.

2. Design of Model-Based Anode Potential Observer and Charging Scheme

To accurately estimate the anode potential of each cell in a battery pack, there is a need to minimize the computational effort of the observer while improving the estimation accuracy. Observers for estimating individual cells within a battery pack can use both ECMs and electrochemical models. While ECMs are widely used for system validation and controller design due to their simple structure, they are unable to accurately model factors such as whether side reactions occur within the cell due to their lack of observation of the physical behavior within the cell. As a result, electrochemical models were widely developed to simulate the physical behavior of Li-ion cells. The most basic and commonly used model is the Doyle–Fuller–Newman (DFN) model, which is also known as the P2D model. The P2D model has good performance in modelling the physical behavior of the internal dynamics of the cell. However, it is too complex and computationally expensive for practical applications. A simplified version of the P2D model is the SPM, which uses one particle to simulate the average behavior of each solid phase. In recent years, researchers extended the SPM model to consider thermal effects by proposing a TSPMe derived in a systematic way using asymptotic techniques [53]. The validation result indicated that, compared to a thermal P2D model, the TSPMe showed high accuracy in the prediction of the behavior of real cells with a computational cost over forty times smaller.
The battery pack used in an electric vehicle is usually a combination of hundreds or even thousands of batteries connected in series and parallel. If each battery is modelled individually using the TSPMe model, even though the model significantly reduced the amount of computational load, simulating such a large number of cells at the same time is not possible for a real battery management system (BMS) device. Therefore, this section devises an estimation scheme to estimate the states of each cell in a parallel connected battery module. The designed observer uses a TSPMe model to simulate the full states of a single cell based on the average charging current. The modelled states are used as the baseline of the battery module. Then, the busbar model is used to simulate the current, temperature, and SOC gradients between different cells within the battery module. The states of each individual cell can then be calculated by adding the baseline value from the TSPMe model and the distribution gradients from the busbar model. An outline block diagram of the observer-based charging scheme is shown in Figure 1, where I p a c k * denotes the control signal of pack current while I p a c k denotes the real pack current from charger. The observer was used to estimate the SOC and anode potential of all cells in the module, where a 30 parallel connected cell module was considered in this paper. A charging strategy was designed by monitoring the minimum anode potential and average SOC across all cells and adjusting the charging current for the battery pack to allow all cells to be free from lithium plating risk. The observer was designed using a cell model for simulating the detailed electrochemical reactions within the cell and a busbar model for simulating the current distribution in the module and the interconnecting currents between cells. Therefore, the electrochemical cell model is presented first in the following subsection.

2.1. Thermal Single Particle Model with Electrolyte

The SPM type models use the same key idea of representing the behavior of all particles by a single particle in each electrode. The model, therefore, assumes that the cell operates in a regime with a small deviation from the equilibrium potential, which means that the cell operates at moderate to low C-rates. In addition to the SPM, the TSPMe model takes into account the effects of electrolyte and thermal behavior. In the model of electrolyte, three assumptions are used for simplifications, including quasi-steady-state electrolyte concentration, constant electrolyte conductivity, and fast lithium diffusion. Therefore, in the TSPMe model, we assumed that the electrolyte conductivity and the ion transport properties in the electrolyte are constants, the diffusion coefficient in the electrolyte is not dependent on concentration, and the electrolyte diffusion rate is much higher than the change rate of current. In the thermally coupled model, the temperature is assumed to be approximately homogeneous within the cell. Further details of the assumptions made in the TSPMe cell model can be found in our previous published paper [53].
In TSPMe, the governing equation for intercalated lithium concentration are given as
c k t = 1 r 2 r r 2 D k c k r ,         i n   0 < r < R k
where c k is the intercalated lithium concentration, D k is the diffusion coefficient of intercalated lithium, R k is the particle radius, where k p , n denotes the positive (p) and negative (n) electrodes/particles.
The concentration in electrolyte is given by
ε k x c e t = x D e B k x c e x + 1 t + i a p p F L n , i f   0 x < L n 0 , i f   L n x < L L p 1 t + i a p p F L p , i f   L L p x L
where c e is the lithium-ion concentration in the electrolyte, D e is the bulk diffusion coefficient of lithium ions, ε k x and B k x are the porosity and the geometry factor according to the position of x , where the subscripts k n , s , p denote the values for the negative electrode, separator and positive electrode, respectively, t + is the transference number, L = L n + L s + L p is the total cell thickness.
The potentials of electrodes can be expressed as
Φ ± = U ± c s ± R k + η r ± + η e ± + Δ Φ e ± + Δ Φ s ±
where U is the equilibrium potential to which the terminal voltage converges when no current is applied, η r is due to the reaction overpotentials, η e is due to the concentration gradients in the electrolyte, Δ Φ e is due to Ohmic losses in the electrolyte, and Δ Φ s is due to Ohmic losses in the solid electrode. They can be expressed as [53]
η r + = 2 R T F 1 L p L L p L sinh 1 i a p p a p L p j + d x
η r = 2 R T F 1 L n 0 L n sinh 1 i a p p a n L n j d x
η e + = 1 t + 2 R T F 1 L p L L p L log c e d x
η e = 1 t + 2 R T F 1 L n 0 L n log c e d x
Δ Φ e + = 1 L p L L p L 0 x i e s , t d s σ e c e s , t B s d x
Δ Φ e = 1 L n 0 L n 0 x i e s , t d s σ e c e s , t B s d x
Δ Φ s + = i a p p 2 L L p x x 2 L p σ p i a p p 2 L p 2 6 L L p + 3 L 2 6 L p σ p
Δ Φ s = i a p p 2 L n x x 2 L n σ n + i a p p L n 3 σ n
j ± = m k c e c s ± c k m a x c s ±
where T is the average temperature of the cell, σ p and σ n are the electronic conductivity of the positive and negative electrodes, σ e is the ionic conductivity of the electrolyte, R is the universal gas constant, j + and j are the reaction surface current density of positive and negative electrodes, a k is the surface area density, F is the Faraday constant, i a p p is the applied current density, and L k is the electrode thickness.
The output voltage, V t , is given by
V t t = Φ + L , t Φ 0 , t
The thermal behavior is given by [53]
θ d T d t = h a c o o l T T a m b + Q s + Q e + Q i r r + Q r e v
with
Q s = i a p p Δ Φ s + Δ Φ s
Q e = i a p p η e + η e + Δ Φ e + Δ Φ e
Q i r r = i a p p η r + η r
Q r e v = i a p p L Π n Π p
where θ is the lumped volumetric heat capacity of the cell, h is the heat exchange coefficient, a c o o l is the cooling surface area, T a m b is the ambient temperature, Q s is the electrode heat source, Q e is the electrolyte heat source, Q i r r is the irreversible heat source, Q r e v is the reversible heat source of the intercalation reaction, and Π k ( k p , n ) is the Peltier coefficient described as the heat generated due to the entropy of the intercalation reaction, which is defined as
Π k = T U k T
The number of storage compartments in the negative electrode is considered to be a key factor in the capacity of a LIB due to the different choice of positive and negative electrode materials. The SOC of a LIB is, therefore, more relevant to the ionic concentration of the negative electrode. The SOC is expressed using the average ionic concentration in the negative electrode, c s , as [57]
S O C t = c s t c s , m i n c s , m a x c s , m i n

2.2. Observer Design

To estimate the electrochemical state of each cell in a battery pack, it is necessary to use at least one TSPMe model to accurately simulate the behavior of the cells. As the battery modules are considered to be connected in parallel, the current input of each cell is essentially at a similar level. However, each cell behaves differently due to current distribution gradients caused by the busbar design of the battery modules and the uneven heat dissipation caused by the close arrangement of the cells. In designing the observer, the difference between cells is assumed to be much smaller than the variation in the mean value of the battery pack/module. Based on this assumption, the difference in current between cells can be represented using a simplified busbar model, and the difference in temperature can be calculated using a matrix to calculate the equivalent ambient temperature of each cell and its surrounding cells.
The SOC estimation for each cell can be expressed as
S O ^ C t = S O C + 1 Q I ^ c e l l I p a c k 30 d t
where S O C is the average state of charge estimated from the TSPMe model, Q is the capacity of a single cell, I ^ c e l l is the estimated applied current for each cell estimated from the busbar model, and I p a c k is the real current applied to the battery module that contains 30 individual cells.
The SOC estimation is based on a hybrid calculation where the first term is obtained from the ionic concentration estimated by the electrochemical model, and the second term is estimated from the linear relationship between the current difference between cells and the SOC. The sum of these two components is approximately equal to the real SOC of each cell. Compared to modelling each cell separately using the electrochemical model, the method not only maintains a very high accuracy rate in modelling the electrochemical behavior, but also replaces the part with less influence with a linear model, thus reducing the computational effort considerably. The corresponding cell resistance and open circuit voltage (OCV) are then obtained from look-up-tables and fed back to the busbar model to continuously calculate the current distribution among all cells.
The temperature distribution within the battery module is related to the arrangement of the cells and their heat transfer characteristics. As the cells are arranged closely together within the battery module, for cylindrical cells, each cell is surrounded by six adjacent cells. Each cell exchanges heat with the other six cells surrounding it. For a single cell, the average temperature of the six cells around it forms the ambient temperature of that cell. For a cell at the edge of the battery module, the temperature of the cells that do not exist around it can be replaced by the ambient temperature of the whole module. Therefore, an ambient temperature matrix can be designed to transform the cell temperature vector into an ambient temperature vector. This is shown in Figure 2.
As can be seen on the left side of the figure, in the battery module, 6 cells are arranged in a column and 5 columns of cells are staggered together for a total of 30 cells, being numbered 1–30. The ambient temperature of the module is numbered 31. The matrix in the middle of the figure represents the numbering of the 6 cells around each cell. In the matrix on the right side of the figure, the vertical columns indicate the target cell numbers and the horizontal rows indicate the surrounding cell numbers. A ‘0’ in the matrix means that the target cell is not adjacent to it and a ‘1’ means that it is adjacent to it. Column 31 indicates how many sectors of the cell are in direct contact with the environment. The heat transfer matrix is, therefore, a 30 × 31 matrix, with the values in each row summing to 6. The ambient temperature vector can be calculated as the product of this ambient temperature matrix and the cell temperature vector, multiplied by a gain of 1/6. The estimated temperature of each cell is then derived by calculating the heat generation as the current flows through the internal resistance using the Joule–Lenz law, and the heat transfer between the cell itself and the ambient based on the heat transfer equation. The average temperature of all cells is then given as input to the TSPMe model.
The final part of the observer design is to estimate the anode potential for each cell within the battery module. As there is no more information available to estimate the anode potential, the only way for anode potential estimation is to use the average anode potential estimated from the TSPMe and its rate of change against the SOC. As can be seen from Equation (3), the anode potential incorporates several components including the open circuit voltage, the reaction overpotential, the concentration gradient and ohmic loss of the electrolyte, and the ohmic loss of the solid electrode. Some components are related to the applied current. The anode potential estimation is also divided into two parts when designing the observer. The first part is the estimation of the negative open circuit voltage, U n , associated with the SOC, where the change rate of the U n to the SOC is calculated from the state values from the TSPMe model. The same change rate is then multiplied by the difference in SOC between cells to obtain the distribution of the difference in U n across the 30 cells, which is expressed as
Δ U ^ n = S O ^ C S O C d U n d S O C
The other part is the estimation of the current-dependent part of the anode potential. The rate of change of this component to current is calculated using a similar method and is then multiplied by the difference in current between cells, which is expressed as
Δ η ^ n = I ^ c e l l I p a c k 30 Φ U n I p a c k / 30
The two calculated parts are summed to obtain the difference distribution of the anode potential. This is then added to the average anode potential derived from the TSPMe model to obtain an estimate of the anode potential for each cell as
Φ ^ = Φ + Δ U ^ n + Δ η ^ n
A block diagram of the final design of the observer is shown in Figure 3. Two models were used in the observer, a cell model to simulate the detailed electrochemical reactions inside the cells and a busbar model to simulate the current distribution in the module and the interconnection currents between the cells. The inputs to the cell model were the average current and temperature of all cells. The outputs of cell model included the OCV, SOC, anode potential, and OCV of negative electrode. The interconnection resistance in the busbar model was assumed to be of constant value. The inputs to the busbar model were the total current of the input pack, the estimated OCV, and internal resistance of each cell. In addition to cell and busbar model, the observer was divided into three estimation components. In order to reduce the computational load of the observer, it was assumed that the current difference between cells was much smaller than the cell currents. The electrical state was estimated by integrating the current difference calculated from the busbar model to obtain the SOC difference of each cell. The OCV and equivalent internal resistance of each cell was then obtained by a look-up-table. The temperature was estimated by calculating the heat generation of each cell from the Joule–Lorentz law, and then, the temperature changed for each cell by using the heat transfer matrix illustrated in Figure 2. The anode potential was also estimated using a linear estimation method but was slightly different from the method of electrical state estimation. The anode potential of a cell can be divided into two parts depending on whether it is current dependent. The OCV of negative electrode was only related to SOC and, therefore, the rate of change was calculated from the output of the cell model and multiplied by the estimated SOC distribution of cells in the module. The remaining part is represented by the over-potential, which was assumed to be in proportional to the current over a small range. The over-potential distribution was obtained by calculating its change rate and multiplying it by the current difference. The two estimated parts were added to the reference anode potential estimated by the cell model to obtain the anode potential distribution of all cells in the battery module.

2.3. Charging Scheme Based on Anode Potential Estimation

Due to its simplicity and ease of implementation, the constant current constant voltage (CC-CV) charging method became the standard charging protocol in most applications. The early CC stage is usually chosen for higher current levels, as the anode potential is less likely to become negative at the beginning of the charging process. Once the cell voltage rises to a cut-off value, it switches to a CV stage to maintain the charging voltage until the current drops close to zero. The main purpose of the CV stage is to prevent the OCV of the battery from exceeding the maximum voltage limit. However, during rapid charging, the high current results in a large potential difference between its OCV and terminal voltage. Thus, when the terminal voltage reached the maximum value, the OCV was still far from reaching the maximum voltage. Reducing the charging current at this point will undoubtedly increase the charging time. If one investigates the electrochemical principles within the LIB, the constant voltage aims to prevent the storage compartment of the negative electrode from being filled with lithium and causing subsequent metallic lithium to adhere to the surface of the negative electrode. However, if it is possible to measure or estimate whether the negative electrode material is already fully filled by lithium, then the overcharge problem can be avoided.
As the electrochemical model-based observer designed in the previous section can estimate various physical properties inside the cell, it is possible to detect the intercalated lithium concentration in the negative electrode as well as the anode potential. Based on this idea, this paper designed a fast charging scheme with additional charging stage between CC and CV, limiting the anode potential of cells to a non-negative level through the estimation from the observer. This method is, therefore, named as constant current—anode potential estimation—constant voltage (CC-APes-CV). In summary, the designed charging method is summarized as:
  • The CC stage of charging is first carried out while the anode potential estimation is started using the designed observer;
  • When the estimated anode potential is reduced to a preset value greater than zero (e.g., 20 mV), switch to the anode potential control stage to gradually reduce the current to keep the anode potential at a preset value;
  • When the estimated SOC is close to full charge (e.g., 95%), switch to the CV charging stage;
  • When the charging current is reduced to a preset value (e.g., C/20), stop charging.
For charging a parallel connected battery module, the controller detects the minimum anode potential of all cells and adjusts the charging current in time to avoid the risk of lithium plating for all cells in the module.

3. Results and Discussion

The validation of the model, the observer, and the charging scheme is in the Simulink simscape simulation environment.

3.1. Model Validation

First, experimental data were used to validate the TSPMe model, from low to high charging current at different C-rates. The model parameters and experimental data were based on the test of LG M50 21700 LIB, whose operating voltage window was 2.5–4.2 V. In the experiment, the cell was dismantled and reconstructed into a three-electrode cell using the original positive and negative electrodes to allow the direct measurement of the cathode and anode potentials, as described in [59]. The dimensional and electrochemical parameters of LG M50 cell used in the TSPMe model are given in Table 1.
Figure 4 shows a comparison of the experimental data and the model output for the three-electrode cell. The input current to the model was the same as the experimental current, as shown in Figure 4a, ranging from a charging rate from 0.3 C to 3 C and constant discharging rate of 0.5 C within a voltage range between 2.5 and 4.2 V. Figure 4b,c show the comparison performance of cathode and anode potentials between three-electrode experiments and model outputs. Figure 4c shows that the anode potential dropped to less than 0 V within a short interval when the charge C rate was above 1 C. It was indeed possible that lithium plating occurred at this point. However, the three-electrode cell experiment can only be used to measure the anode potential and, thus, determine whether lithium plating is possible. The test did not provide any quantitative results, such as how much lithium was plated. Therefore, we cannot provide a more detailed picture in the experiment to show whether lithium plating occurred. This is a generic problem with the method of inserting reference electrode, which cannot be solved with the method provided in this paper. This issue is also added to the Section 3 in this paper.
The results shown in Figure 4 verify that the modelled cathode and anode potentials matched the experimentally tested value of potentials in most charging profiles. The estimation performance of charging cycles was acceptable. It can be concluded that the model can perform well to the actual behavior of the target LIB at any C rate of charging current.
From the results above, it can also be found that the higher the charging C-rate, the lower the anode potential can reach. However, as the C-rate mainly acts on the CC stage of the CC-CV charging cycles, when the C-rate in the CC stage is high, the charging time of the CC stage is shortened due to the internal resistance. The charger will then switch it to the CV stage after the terminal voltage reaches the threshold. Therefore, from the above results, the CC cycle of 3C charging only lasts a few seconds. If further increase the charging C-rate, it will not see a significant reduction in the total charging time. This can also be found in the result of the charging time and the minimum anode potential at different charging rates, as shown in Figure 5 below.
As the C rate increased from 1C to 3C, it can be clearly seen that the charging time decreased due to the increase in current and the minimum anode potential decreased inversely with the increase in C rate. However, when the C rate was increased beyond 3C, there was no significant reduction in charging time and minimum anode potential. Furthermore, it can be noted from the results that in the conventional CC-CV charging curve, the minimum anode potential decreased to a negative value when the C-rate increased above 1.5C, which led to a high potential for lithium plating to occur.

3.2. Observer Performance Validation

This section aims to validate the performance of using the designed observer to estimate the anode potential and temperature of all cells in a battery module. The results compare the estimation performance of the observer with those of 30 individual TSPMe cell models run in parallel in a cluster computational PC to simulate the real battery module.
The results compare the modelled and estimated states of cell current, generated heat due to power loss and anode potentials of individual cells. To calculate the heat generation, the TSPMe model used the product of the current and the difference between terminal voltage and OCV of each cell, while the observer used the product of the current squared and the equivalent resistances. The current and anode potential were obtained from the TSPMe model and the observer for comparison. The results are shown in Figure 6.
Figure 6a shows the current response of the individual cells in the battery module under a 1C constant current charge, while Figure 6b shows the observer-estimated current profile for each cell. The results show the current distribution of the 30 cells in the battery module, arranged in six rows (R) and five columns (C) in a 6 × 5 battery module. The performance of each cell is indicated by a different color and line. For example, C1R1 in the figure represents the cell located in the first column and the first row of the battery module.
Figure 6c,d show the model-simulated and observer-estimated power loss on internal resistance, respectively. The power loss on the internal resistance generated heat and affected the temperature of the cell, ultimately affecting the thermal behavior of each cell. As the battery module was modelled using 30 TSPMe cell models, the power loss was obtained from the product of the voltage difference between the terminal voltage (Vt) and the open circuit voltage (U) and the charging current (i). The observed power loss was calculated as the product of the current squared and the equivalent resistance. As the observer used a different method to calculate the power loss, the error in the estimation of the cell temperature distribution was more obvious compared to the estimation of the current distribution. Figure 6e,f show the anode potential from the model and the estimates from the observer, respectively.
In terms of the overall comparison results, the observed currents, the heat generated due to power losses, and the anode potentials of all individual cells had a similar performance to those from the TSPMe models. To further quantify the observed performance, Figure 7 provides boxplots to show the observed error for each state of each cell. The result divided the 30 cells in the battery module into five columns according to their original positions. For example, cells 1 to 6 in the figure are the cells in the leftmost column of the module, while cells 25 to 30 in the figure are the cells in the rightmost column of the battery module, in numbered order.
It is clearly shown from the results that the centrally located cells had a larger average error in observation of temperature, but a smaller error in observation of anode potential. In Figure 7a, the average current error was less than 0.2 A for all cells, with the largest error in column 5. Thus, if considering the current estimation of cells in columns 1 to 5, the average observation error from the observer was less than 0.1 A, with an error of approximately 2% at an average charging current of 5 A. In Figure 7b, the temperature observation error for all cells was less than 1.5 V. In columns 2, 3, and 4, the temperature estimation error peaked for the centrally located cells. This was because the cell in the center of the battery module had a higher ambient temperature and, therefore, less heat transferred from the cell to the environment. Based on this situation, the temperature gradient of the cells within the battery module will be the focus in our future work. In Figure 7c, the average observed error in the anode potential for all cells was less than 0.015 V. This error was acceptable. The observed anode potentials can be used in the charging scheme design for the battery modules. Therefore, the anode potential threshold can be set at 20 mV in the APes stage of the designed charging scheme, thus avoiding negative anode potentials occurred due to observation errors.

3.3. Fast Charge Strategies Validation

The simulation results were used to compare the CC-APes-CV charging scheme with the conventional CC-CV and MCC-CV charging methods. All three methods had the same initial phase, i.e., a constant charging current at 3C, and the same end phase, i.e., the CV stage. The difference between the three methods was the switching link between CC and CV stages. Conventional CC-CV switched directly from CC to CV when the terminal voltage of cells reached its maximum value. MCC-CV switched between multiple CC stages and finally switched to CV. CC-APes-CV switched from CC to the anode potential control stage using estimated values and switched to CV when its SOC reached a pre-defined threshold.
The results of the comparison between the three methods are shown in Figure 8. As it was difficult to compare all curves of 30 cells simultaneously, the average cell states of the battery module are shown in the results. The blue dashed line in the figure shows the results of the conventional CC-CV charging method at 3C charging current, the red solid line shows the results of the MCC-CV charging method and the green dashed line shows the results of the proposed CC-APes-CV method. As can be seen from the terminal voltage results shown in Figure 8b, the green dashed line is the only curve where the terminal voltage can be higher than 4.2 V. This is because, during the anode potential control stage, the current or voltage was not tracked but only the estimated anode potential was controlled. It can then be seen from the comparative results of the anode potential in Figure 8c that the CC-APes-CV method reduced the current as the estimated anode potential was reduced to near zero, it then reduced the charging current to a lower level than the other two methods and it slowly increased the terminal voltage over a period of approximately from 0.1 h to 0.5 h. It reduced the charging speed in the first stage. However, the terminal voltage of the CC-APes-CV method continued to increase above 4.2 V when the other two methods reached a maximum terminal voltage of 4.2 V. According to the observer, the anode potential was still positive at this point and the intercalated lithium concentration of the negative electrode was also greater than 0. So it was considered that the cells were still able to accept additional charges. Ultimately, the CC-APes-CV took less charging time than the other two methods to fully charge the LIB. In the results of the temperature comparison, as shown in Figure 8d, it was found that the peak temperature using the CC-APes-CV charging method was less than the other two methods.
The charging times to reach a specific SOC using the different methods are compared in Table 2. When charging up to 70% SOC was considered, the charging time using CC-APes-CV was similar to that of CC-CV. When charging targeted at a higher percentage, e.g., 80% to 100% SOC, the charging time with CC-APes-CV was much less than the other two methods. This was because the charging current was reduced in the CC stage to reduce the risk of negative anode potential. This makes the CC-APes-CV method slower than the conventional CC-CV method in the initial stage of charging. However, in the anode potential control stage, the control strategy tracked the estimated anode potential, and the terminal voltage can reach a higher value than the set point. This allowed the CC-APes-CV to charge faster than the CC-CV and MCC-CV methods. The overall charging period of the proposed method was shorter than the other two methods.
The comparison between these three methods used bar charts to represent the minimum anode potential, peak cell temperature, time period of anode potential being negative, and full charging time, as shown in Figure 9. The results show that the proposed method eliminated the risk of negative anode potential, reduced the peak battery temperature by 5 °C, approximated 9.8% of the temperature of using CC-CV, and reduced the overall charging time to full SOC by 18% compared to the conventional CC-CV charging method.
The design of the CC-APes-CV charging scheme was based on the current version of electrochemical models and their parametric accuracy. The charging scheme was not experimentally validated due to the difficulty of accurately measuring the anode potential and lithium concentration of commercial LIBs. The reconstructed three-electrode cells not only are costly, but it is also difficult to ensure the same parameters for all reconstituted cells under laboratory conditions. Therefore, it is not easy to accurately compare the effects of the proposed charging scheme on lithium plating in experiments in a short time under current technical conditions. In our future work, we will aim to address this issue and experimentally validate the effectiveness of the observer and the charging scheme as well as the feasibility of applying them to practical EV charging protocols.

4. Conclusions

This paper developed an anode potential observer for a parallel-connected battery module and a plating-free charging scheme to avoid the risk of lithium plating for all cells in the module during charging. The designed anode observer used a TSPMe cell model and a busbar model to simulate the internal electrochemical states of each individual cell within the module. The results demonstrated that the designed observer not only accurately estimated the states of cells, such as SOC and anode potential, but also significantly reduced the computational effort for use in the charge management system. The estimated results of the observer were used in a plating-free charging scheme. Compared with the traditional CC-CV charging method, the proposed scheme added an extra stage to estimate and control the anode potentials, which reduces risk of lithium plating during charging. The results demonstrated that the charging scheme not only eliminated the risk of negative anode potential in the battery module, but also reduced the peak cell temperature by approximately 9.8% and reduced the overall charging time by 18%.

Author Contributions

Conceptualization, Y.R., D.W. and J.M.; methodology, Y.R.; software, D.W.; validation, Y.R.; formal analysis, Y.R.; resources, D.W. and J.M.; data curation, Y.R. and D.W.; writing—original draft preparation, Y.R.; writing—review and editing, D.W. and J.M.; visualization, Y.R.; supervision, J.M.; project administration, J.M.; funding acquisition, D.W. and J.M. All authors have read and agreed to the published version of the manuscript.

Funding

This work was supported by the Faraday Institution Multi-Scale Modelling project [EP/S003053/1 grant number FIRG025].

Conflicts of Interest

The authors declare no conflict of interest.

Abbreviations

APesAnode potential estimation
BMSBattery management system
CCConstant current
CVConstant voltage
ECMsEquivalent circuit models
EVElectric vehicle
LIBLithium-ion battery
MCCMulti-stage constant current
OCVOpen circuit voltage
P2DPseudo-two-dimensional
PDEPartial differential equation
SEMSimplified electrochemical model
SOCState of charge
SOHState of health
SPMSingle particle model
TSPMeThermal single particle model with electrolyte

References

  1. Lu, L.; Han, X.; Li, J.; Hua, J.; Ouyang, M. A review on the key issues for lithium-ion battery management in electric vehicles. J. Power Sources 2013, 226, 272–288. [Google Scholar] [CrossRef]
  2. Yilmaz, M.; Krein, P.T. Review of battery charger topologies, charging power levels, and infrastructure for plug-in electric and hybrid vehicles. IEEE Trans. Power Electron. 2012, 28, 2151–2169. [Google Scholar] [CrossRef]
  3. Miao, Y.; Liu, L.; Zhang, Y.; Tan, Q.; Li, J. An overview of global power lithium-ion batteries and associated critical metal recycling. J. Hazard. Mater. 2022, 425, 127900. [Google Scholar] [CrossRef] [PubMed]
  4. Rivera, F.P.; Zalamea, J.; Espinoza, J.L.; Gonzalez, L.G. Sustainable use of spilled turbinable energy in Ecuador: Three different energy storage systems. Renew. Sustain. Energy Rev. 2022, 156, 112005. [Google Scholar] [CrossRef]
  5. Mastali, M.; Samadani, E.; Farhad, S.; Fraser, R.; Fowler, M. Three-dimensional multi-particle electrochemical model of LiFePO4 Cells based on a resistor network methodology. Electrochim. Acta 2016, 190, 574–587. [Google Scholar] [CrossRef]
  6. Chacko, P.J.; Sachidanandam, M. Optimization & validation of Intelligent Energy Management System for pseudo dynamic predictive regulation of plug-in hybrid electric vehicle as donor clients. ETransportation 2020, 3, 100050. [Google Scholar]
  7. Shen, J.; Wang, Q.; Ma, Z.; He, Y. Nonlinear optimization strategy for state of power estimation of lithium-ion batteries: A systematical uncertainty analysis of key impact parameters. IEEE Trans. Ind. Inform. 2021, 18, 6680–6689. [Google Scholar] [CrossRef]
  8. Howell, D.; Duong, T.; Faguy, P.; Cunningham, B. DOE Vehicle Battery R&D: Progress Update 2011; U.S. Department of Energy: Wahsington, DC, USA, 2011.
  9. Rao, Z.; Wang, S. A review of power battery thermal energy management. Renew. Sustain. Energy Rev. 2011, 15, 4554–4571. [Google Scholar] [CrossRef]
  10. Choi, S.S.; Lim, H.S. Factors that affect cycle-life and possible degradation mechanisms of a Li-ion cell based on LiCoO2. J. Power Sources 2002, 111, 130–136. [Google Scholar] [CrossRef]
  11. Wang, F.; Cui, N.; Fang, H. Multi segment charging strategy for lithium ion battery based on taguchi method. In Proceedings of the 2017 Chinese Automation Congress (CAC), Jinan, China, 20–22 October 2017; pp. 5057–5061. [Google Scholar]
  12. Zou, C.; Hu, X.; Wei, Z.; Wik, T.; Egardt, B. Electrochemical estimation and control for lithium-ion battery health-aware fast charging. IEEE Trans. Ind. Electron. 2017, 65, 6635–6645. [Google Scholar] [CrossRef]
  13. Park, B.; ho Lee, C.; Xia, C.; Jung, C. Characterization of gel polymer electrolyte for suppressing deterioration of cathode electrodes of Li ion batteries on high-rate cycling at elevated temperature. Electrochim. Acta 2016, 188, 78–84. [Google Scholar] [CrossRef]
  14. Zhang, C.; Jiang, J.; Gao, Y.; Zhang, W.; Liu, Q.; Hu, X. Charging optimization in lithium-ion batteries based on temperature rise and charge time. Appl. Energy 2017, 194, 569–577. [Google Scholar] [CrossRef]
  15. Mussa, A.S.; Klett, M.; Behm, M.; Lindbergh, G.; Lindström, R.W. Fast-charging to a partial state of charge in lithium-ion batteries: A comparative ageing study. J. Energy Storage 2017, 13, 325–333. [Google Scholar] [CrossRef]
  16. Hu, X.; Cao, D.; Egardt, B. Condition monitoring in advanced battery management systems: Moving horizon estimation using a reduced electrochemical model. IEEE/ASME Trans. Mechatron. 2017, 23, 167–178. [Google Scholar] [CrossRef]
  17. Liu, Y.-H.; Teng, J.-H.; Lin, Y.-C. Search for an optimal rapid charging pattern for lithium-ion batteries using ant colony system algorithm. IEEE Trans. Ind. Electron. 2005, 52, 1328–1336. [Google Scholar] [CrossRef]
  18. Sundareswaran, K.; Sreedevi, V. Boost converter controller design using queen-bee-assisted GA. IEEE Trans. Ind. Electron. 2008, 56, 778–783. [Google Scholar] [CrossRef]
  19. Jiang, J.; Zhang, C.; Wen, J.; Zhang, W.; Sharkh, S.M. An optimal charging method for Li-ion batteries using a fuzzy-control approach based on polarization properties. IEEE Trans. Veh. Technol. 2013, 62, 3000–3009. [Google Scholar] [CrossRef]
  20. Zhang, S.; Zhang, C.; Xiong, R.; Zhou, W. Study on the optimal charging strategy for lithium-ion batteries used in electric vehicles. Energies 2014, 7, 6783. [Google Scholar] [CrossRef]
  21. Abdollahi, A.; Han, X.; Avvari, G.; Raghunathan, N.; Balasingam, B.; Pattipati, K.R.; Bar-Shalom, Y. Optimal battery charging, Part I: Minimizing time-to-charge, energy loss, and temperature rise for OCV-resistance battery model. J. Power Sources 2016, 303, 388–398. [Google Scholar] [CrossRef]
  22. Liu, K.; Li, K.; Yang, Z.; Zhang, C.; Deng, J. An advanced Lithium-ion battery optimal charging strategy based on a coupled thermoelectric model. Electrochim. Acta 2017, 225, 330–344. [Google Scholar] [CrossRef]
  23. Waldmann, T.; Wilka, M.; Kasper, M.; Fleischhammer, M.; Wohlfahrt-Mehrens, M. Temperature dependent ageing mechanisms in Lithium-ion batteries—A Post-Mortem study. J. Power Sources 2014, 262, 129–135. [Google Scholar] [CrossRef]
  24. Vetter, J.; Novák, P.; Wagner, M.R.; Veit, C.; Möller, K.-C.; Besenhard, J.; Winter, M.; Wohlfahrt-Mehrens, M.; Vogler, C.; Hammouche, A. Ageing mechanisms in lithium-ion batteries. J. Power Sources 2005, 147, 269–281. [Google Scholar] [CrossRef]
  25. Takahashi, K.; Srinivasan, V. Examination of graphite particle cracking as a failure mode in lithium-ion batteries: A model-experimental study. J. Electrochem. Soc. 2015, 162, A635. [Google Scholar] [CrossRef]
  26. Tian, Y.; Lin, C.; Li, H.; Du, J.; Xiong, R. Detecting undesired lithium plating on anodes for lithium-ion batteries—A review on the in-situ methods. Appl. Energy 2021, 300, 117386. [Google Scholar] [CrossRef]
  27. Lin, X.; Khosravinia, K.; Hu, X.; Li, J.; Lu, W. Lithium plating mechanism, detection, and mitigation in lithium-ion batteries. Prog. Energy Combust. Sci. 2021, 87, 100953. [Google Scholar] [CrossRef]
  28. Harris, S.J.; Timmons, A.; Baker, D.R.; Monroe, C. Direct in situ measurements of Li transport in Li-ion battery negative electrodes. Chem. Phys. Lett. 2010, 485, 265–274. [Google Scholar] [CrossRef]
  29. Liu, Q.; Du, C.; Shen, B.; Zuo, P.; Cheng, X.; Ma, Y.; Yin, G.; Gao, Y. Understanding undesirable anode lithium plating issues in lithium-ion batteries. RSC Adv. 2016, 6, 88683–88700. [Google Scholar] [CrossRef]
  30. Ecker, M.; Sabet, P.S.; Sauer, D.U. Influence of operational condition on lithium plating for commercial lithium-ion batteries—Electrochemical experiments and post-mortem-analysis. Appl. Energy 2017, 206, 934–946. [Google Scholar] [CrossRef]
  31. Jow, T.R.; Delp, S.A.; Allen, J.L.; Jones, J.-P.; Smart, M.C. Factors limiting Li+ charge transfer kinetics in Li-ion batteries. J. Electrochem. Soc. 2018, 165, A361. [Google Scholar] [CrossRef]
  32. Mao, C.; Ruther, R.E.; Li, J.; Du, Z.; Belharouak, I. Identifying the limiting electrode in lithium ion batteries for extreme fast charging. Electrochem. Commun. 2018, 97, 37–41. [Google Scholar] [CrossRef]
  33. Chandrasekaran, R. Quantification of bottlenecks to fast charging of lithium-ion-insertion cells for electric vehicles. J. Power Sources 2014, 271, 622–632. [Google Scholar] [CrossRef]
  34. Legrand, N.; Knosp, B.; Desprez, P.; Lapicque, F.; Raël, S. Physical characterization of the charging process of a Li-ion battery and prediction of Li plating by electrochemical modelling. J. Power Sources 2014, 245, 208–216. [Google Scholar] [CrossRef]
  35. Hein, S.; Latz, A. Influence of local lithium metal deposition in 3D microstructures on local and global behavior of Lithium-ion batteries. Electrochim. Acta 2016, 201, 354–365. [Google Scholar] [CrossRef]
  36. Hein, S.; Danner, T.; Latz, A. An electrochemical model of lithium plating and stripping in lithium ion batteries. ACS Appl. Energy Mater. 2020, 3, 8519–8531. [Google Scholar] [CrossRef]
  37. Janakiraman, U.; Garrick, T.R.; Fortier, M.E. Lithium plating detection methods in Li-ion batteries. J. Electrochem. Soc. 2020, 167, 160552. [Google Scholar] [CrossRef]
  38. Keil, P.; Jossen, A. Charging protocols for lithium-ion batteries and their impact on cycle life—An experimental study with different 18650 high-power cells. J. Energy Storage 2016, 6, 125–141. [Google Scholar] [CrossRef]
  39. Birkl, C.R.; McTurk, E.; Zekoll, S.; Richter, F.H.; Roberts, M.R.; Bruce, P.G.; Howey, D.A. Degradation diagnostics for commercial lithium-ion cells tested at −10 °C. J. Electrochem. Soc. 2017, 164, A2644. [Google Scholar] [CrossRef]
  40. Li, Z.; Huang, J.; Liaw, B.Y.; Metzler, V.; Zhang, J. A review of lithium deposition in lithium-ion and lithium metal secondary batteries. J. Power Sources 2014, 254, 168–182. [Google Scholar] [CrossRef]
  41. Yang, X.-G.; Zhang, G.; Ge, S.; Wang, C.-Y. Fast charging of lithium-ion batteries at all temperatures. Proc. Natl. Acad. Sci. USA 2018, 115, 7266–7271. [Google Scholar] [CrossRef]
  42. Zhang, S.S. The effect of the charging protocol on the cycle life of a Li-ion battery. J. Power Sources 2006, 161, 1385–1391. [Google Scholar] [CrossRef]
  43. Liu, Y.-H.; Luo, Y.-F. Search for an optimal rapid-charging pattern for Li-ion batteries using the Taguchi approach. IEEE Trans. Ind. Electron. 2009, 57, 3963–3971. [Google Scholar] [CrossRef]
  44. Tomaszewska, A.; Chu, Z.; Feng, X.; O’kane, S.; Liu, X.; Chen, J.; Ji, C.; Endler, E.; Li, R.; Liu, L. Lithium-ion battery fast charging: A review. ETransportation 2019, 1, 100011. [Google Scholar] [CrossRef]
  45. Rangarajan, S.P.; Barsukov, Y.; Mukherjee, P.P. Anode potential controlled charging prevents lithium plating. J. Mater. Chem. A 2020, 8, 13077–13085. [Google Scholar] [CrossRef]
  46. Zhang, S.; Zhang, X. Joint estimation method for maximum available energy and state-of-energy of lithium-ion battery under various temperatures. J. Power Sources 2021, 506, 230132. [Google Scholar] [CrossRef]
  47. Chen, Z.; Zhao, H.; Zhang, Y.; Shen, S.; Shen, J.; Liu, Y. State of health estimation for lithium-ion batteries based on temperature prediction and gated recurrent unit neural network. J. Power Sources 2022, 521, 230892. [Google Scholar] [CrossRef]
  48. Naseri, F.; Schaltz, E.; Stroe, D.-I.; Gismero, A.; Farjah, E. An enhanced equivalent circuit model with real-time parameter identification for battery state-of-charge estimation. IEEE Trans. Ind. Electron. 2021, 69, 3743–3751. [Google Scholar] [CrossRef]
  49. Al-Gabalawy, M.; Hosny, N.S.; Dawson, J.A.; Omar, A.I. State of charge estimation of a Li-ion battery based on extended Kalman filtering and sensor bias. Int. J. Energy Res. 2021, 45, 6708–6726. [Google Scholar] [CrossRef]
  50. Tang, X.; Gao, F.; Zou, C.; Yao, K.; Hu, W.; Wik, T. Load-responsive model switching estimation for state of charge of lithium-ion batteries. Appl. Energy 2019, 238, 423–434. [Google Scholar] [CrossRef]
  51. Jokar, A.; Rajabloo, B.; Désilets, M.; Lacroix, M. Review of simplified Pseudo-two-Dimensional models of lithium-ion batteries. J. Power Sources 2016, 327, 44–55. [Google Scholar] [CrossRef]
  52. Li, J.; Adewuyi, K.; Lotfi, N.; Landers, R.G.; Park, J. A single particle model with chemical/mechanical degradation physics for lithium ion battery State of Health (SOH) estimation. Appl. Energy 2018, 212, 1178–1190. [Google Scholar] [CrossRef]
  53. Planella, F.B.; Sheikh, M.; Widanage, W.D. Systematic derivation and validation of a reduced thermal-electrochemical model for lithium-ion batteries using asymptotic methods. Electrochim. Acta 2021, 388, 138524. [Google Scholar] [CrossRef]
  54. Lu, Y.; Han, X.; Chu, Z.; Feng, X.; Qin, Y.; Ouyang, M.; Lu, L. A decomposed electrode model for real-time anode potential observation of lithium-ion batteries. J. Power Sources 2021, 513, 230529. [Google Scholar] [CrossRef]
  55. Hamar, J.C.; Erhard, S.V.; Zoerr, C.; Jossen, A. Anode potential estimation in lithium-ion batteries using data-driven models for online applications. J. Electrochem. Soc. 2021, 168, 030535. [Google Scholar] [CrossRef]
  56. Wu, L.; Pang, H.; Geng, Y.; Liu, X.; Liu, J.; Liu, K. Low-complexity state of charge and anode potential prediction for lithium-ion batteries using a simplified electrochemical model-based observer under variable load condition. Int. J. Energy Res. 2022, 46, 11834–11848. [Google Scholar] [CrossRef]
  57. Li, L.; Ren, Y.; O’Regan, K.; Koleti, U.R.; Kendrick, E.; Widanage, W.D.; Marco, J. Lithium-ion battery cathode and anode potential observer based on reduced-order electrochemical single particle model. J. Energy Storage 2021, 44, 103324. [Google Scholar] [CrossRef]
  58. Ren, Y.; Liu, K.; Grandjean, T.; Widanage, W.D.; Marco, J. Current Distribution and Anode Potential Modelling in Battery Modules with a Real-World Busbar System. IEEE Trans. Transp. Electrif. 2022, 1. [Google Scholar] [CrossRef]
  59. Chen, C.-H.; Planella, F.B.; O’regan, K.; Gastol, D.; Widanage, W.D.; Kendrick, E. Development of experimental techniques for parameterization of multi-scale lithium-ion battery models. J. Electrochem. Soc. 2020, 167, 080534. [Google Scholar] [CrossRef]
Figure 1. Outline block diagram of a plating-free charging scheme for a battery module based on the anode potential observer.
Batteries 09 00294 g001
Figure 2. The derivation of ambient temperature matrix from the cell arrangement in a battery module.
Batteries 09 00294 g002
Figure 3. Final block diagram of the battery pack observer of 30 cells.
Batteries 09 00294 g003
Figure 4. Model validation using experimental data of CC-CV charging/discharge cycles. (a) Charging C-rate, (b) cathode potential, (c) anode potential.
Batteries 09 00294 g004
Figure 5. The charging time and minimum anode potential of CC-CV charging under different C rate.
Batteries 09 00294 g005
Figure 6. Observer estimation performance of charging current, power loss on internal resistance, and anode potential of each cell within the battery module. (a) Measured cell currents in the model, (b) power losses of cells in the model, (c) anode potential of each cell in the model, (d) observed cell currents, (e) observed power losses, (f) observed anode potentials.
Batteries 09 00294 g006
Figure 7. Average observation error of current, temperature, and anode potential for each cell that located at different column. Average observation error of (a) current of each cell, (b) temperature of each cell, (c) anode potential of each cell.
Batteries 09 00294 g007
Figure 8. Simulation profiles of different charging strategies: (a) charging C rate, (b) terminal voltage, (c) anode potential, (d) cell temperature.
Batteries 09 00294 g008
Figure 9. Bar chart of indices in different fast charging strategies. (a) Lowest anode potential, (b) peak cell temperature, (c) time of negative anode potential, (d) peak terminal voltage.
Batteries 09 00294 g009
Table 1. The dimensional and electrochemical parameters for the LG M50 cell [53].
SymbolDescription k = p k = s k = n Unites
L k Thickness75.61285.2μm
R k Radius of electrode particles5.22-5.86μm
a k Particle surface area density3.82 × 105-3.84 × 1051/m
D k Lithium diffusivity in particles0.004-0.033μm2/s
σ k Electrode conductivity0.18-2151/Ωm
m k Kinetic reaction rate3.42 × 10−6-6.48 × 10⁻⁷(A/m2)(mol/m3)−1.5
ε k Electrolyte volume fraction0.3350.470.25-
c k , i n i t Initial particle concentration17,038-29,866mol/m3
c k m a x Maximum particle concentration63,104-33,133mol/m3
F Faraday constant96,485C/mol
R Universal gas constant8.314J/K/mol
κ Thermal conductivity1.05W/m/K
h Heat exchange coefficient20W/m/K
a c o o l Cooling surface area density219.421/m
t + Transference number0.2594-
c e , i n i t Initial electrolyte concentration1000mol/m3
Table 2. Time comparison of different fast charge strategies according to SOCs.
Charging TimeCC-CVMCC-CVCC-APes-CV
70% SOC30.3 min37.8 min30.6 min
80% SOC40.3 min48.1 min38.8 min
90% SOC56.9 min64.5 min50.5 min
100% SOC98.1 min105.7 min79.9 min
Disclaimer/Publisher’s Note: The statements, opinions and data contained in all publications are solely those of the individual author(s) and contributor(s) and not of MDPI and/or the editor(s). MDPI and/or the editor(s) disclaim responsibility for any injury to people or property resulting from any ideas, methods, instructions or products referred to in the content.

