

Electrical Modeling and Impedance Spectra of Lithium-Ion Batteries and Supercapacitors
Department of Electric Vehicle Engineering, Dongshin University, Naju 58245, Republic of Korea
Batteries 2023, 9(3), 160; https://doi.org/10.3390/batteries9030160
Submission received: 22 December 2022
/
Revised: 23 February 2023
/
Accepted: 3 March 2023
/
Published: 8 March 2023
(This article belongs to the Topic Energy Storage Materials and Devices)
Abstract
:In this study, electrical models for cylindrical/pouch-type lithium Li-ion batteries and supercapacitors were investigated, and the impedance spectra characteristics were studied. Cylindrical Li-ion batteries use Ni, Co, and Al as the main materials, while pouch-type Li-ion batteries use Ni, Co, and Mn as the main materials. Herein, 2600–3600 mAh 18650-type cylindrical Li-ion batteries, 5000 mAh 21700-type cylindrical Li-ion batteries, 37–50.5 Ah pouch-type Li-ion batteries, and a 2.7 V, 600 F supercapacitor are compared and analyzed. For a cylindrical Li-ion battery, the value of a battery with a protection device (circular thermal disc cap) is in the range of 14–38 mΩ. For the 18650-type cylindrical Li-ion battery with a protection device, the value of the battery is between 48 and 105 mΩ, and the protection device increases the value by at least 33 mΩ. A good Li-ion battery exhibits . Moreover, it has small overall and values. For the 21700-type cylindrical Li-ion battery with a protection device, the value of the battery is 25 mΩ. For the pouch-type Li-ion battery, the value of the battery is between 0.86 and 1.04 mΩ. For the supercapacitor, the value of the battery is between 0.4779 and 0.5737 mΩ. A cylindrical Li-ion battery exhibits a semicircular shape in the impedance spectrum, due to the oxidation and reduction reactions of Li ions, and the impedance increases with a slope of 45° in the complex plane, due to the generated by Li ion diffusion. However, for a pouch-type Li-ion battery, the impedance spectrum exhibits a part of the semicircular shape, due to the oxidation and reduction reactions of Li ions, and the generated by Li ion diffusion does not appear. In a supercapacitor, the oxidation and reduction reactions of ions do not appear at all, and the generated by Li ion diffusion does not occur.
1. Introduction
Recently, as the importance of batteries as energy storage devices has increased, various studies have been conducted on various characteristics and electrical modeling of lithium-ion batteries [1,2,3,4,5,6,7,8,9,10,11,12,13,14,15,16,17,18] and supercapacitors [6,19,20,21,22,23,24,25,26].
In addition, research on the impedance change of the batteries and the interpretation of the characteristics based on frequency injection from high to low frequencies, based on the battery’s impedance spectra, have been conducted [5,6,7,8,9,10,11,27,28,29,30,31,32,33,34,35,36,37,38,39,40,41,42,43,44,45,46,47,48].
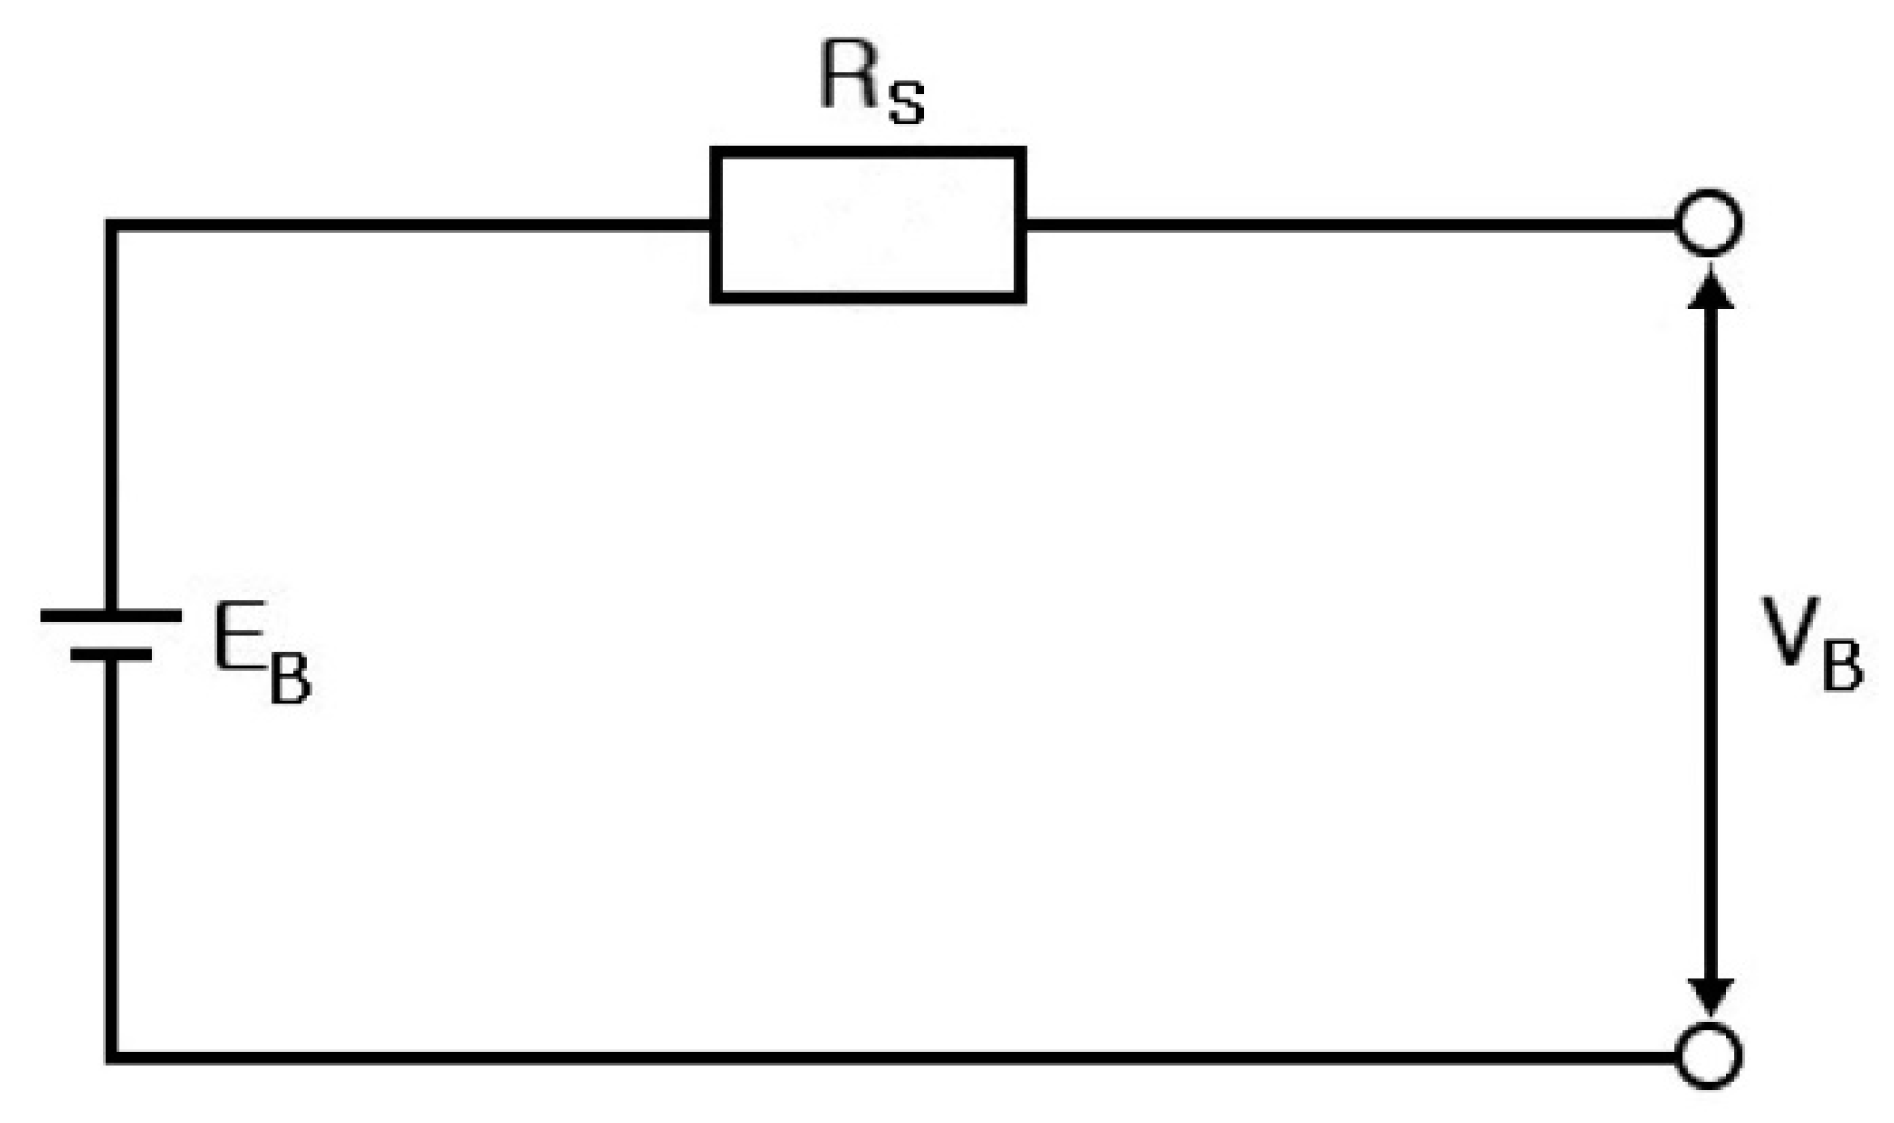
This study investigates the electrical equivalent models and impedance spectra of cylindrical/pouch-type lithium Li-ion batteries and supercapacitors, based on various battery models. Figure 1 displays the simplest battery model, which comprises the battery voltage (), the battery equivalent series resistance (), and the battery open circuit voltage () [1].
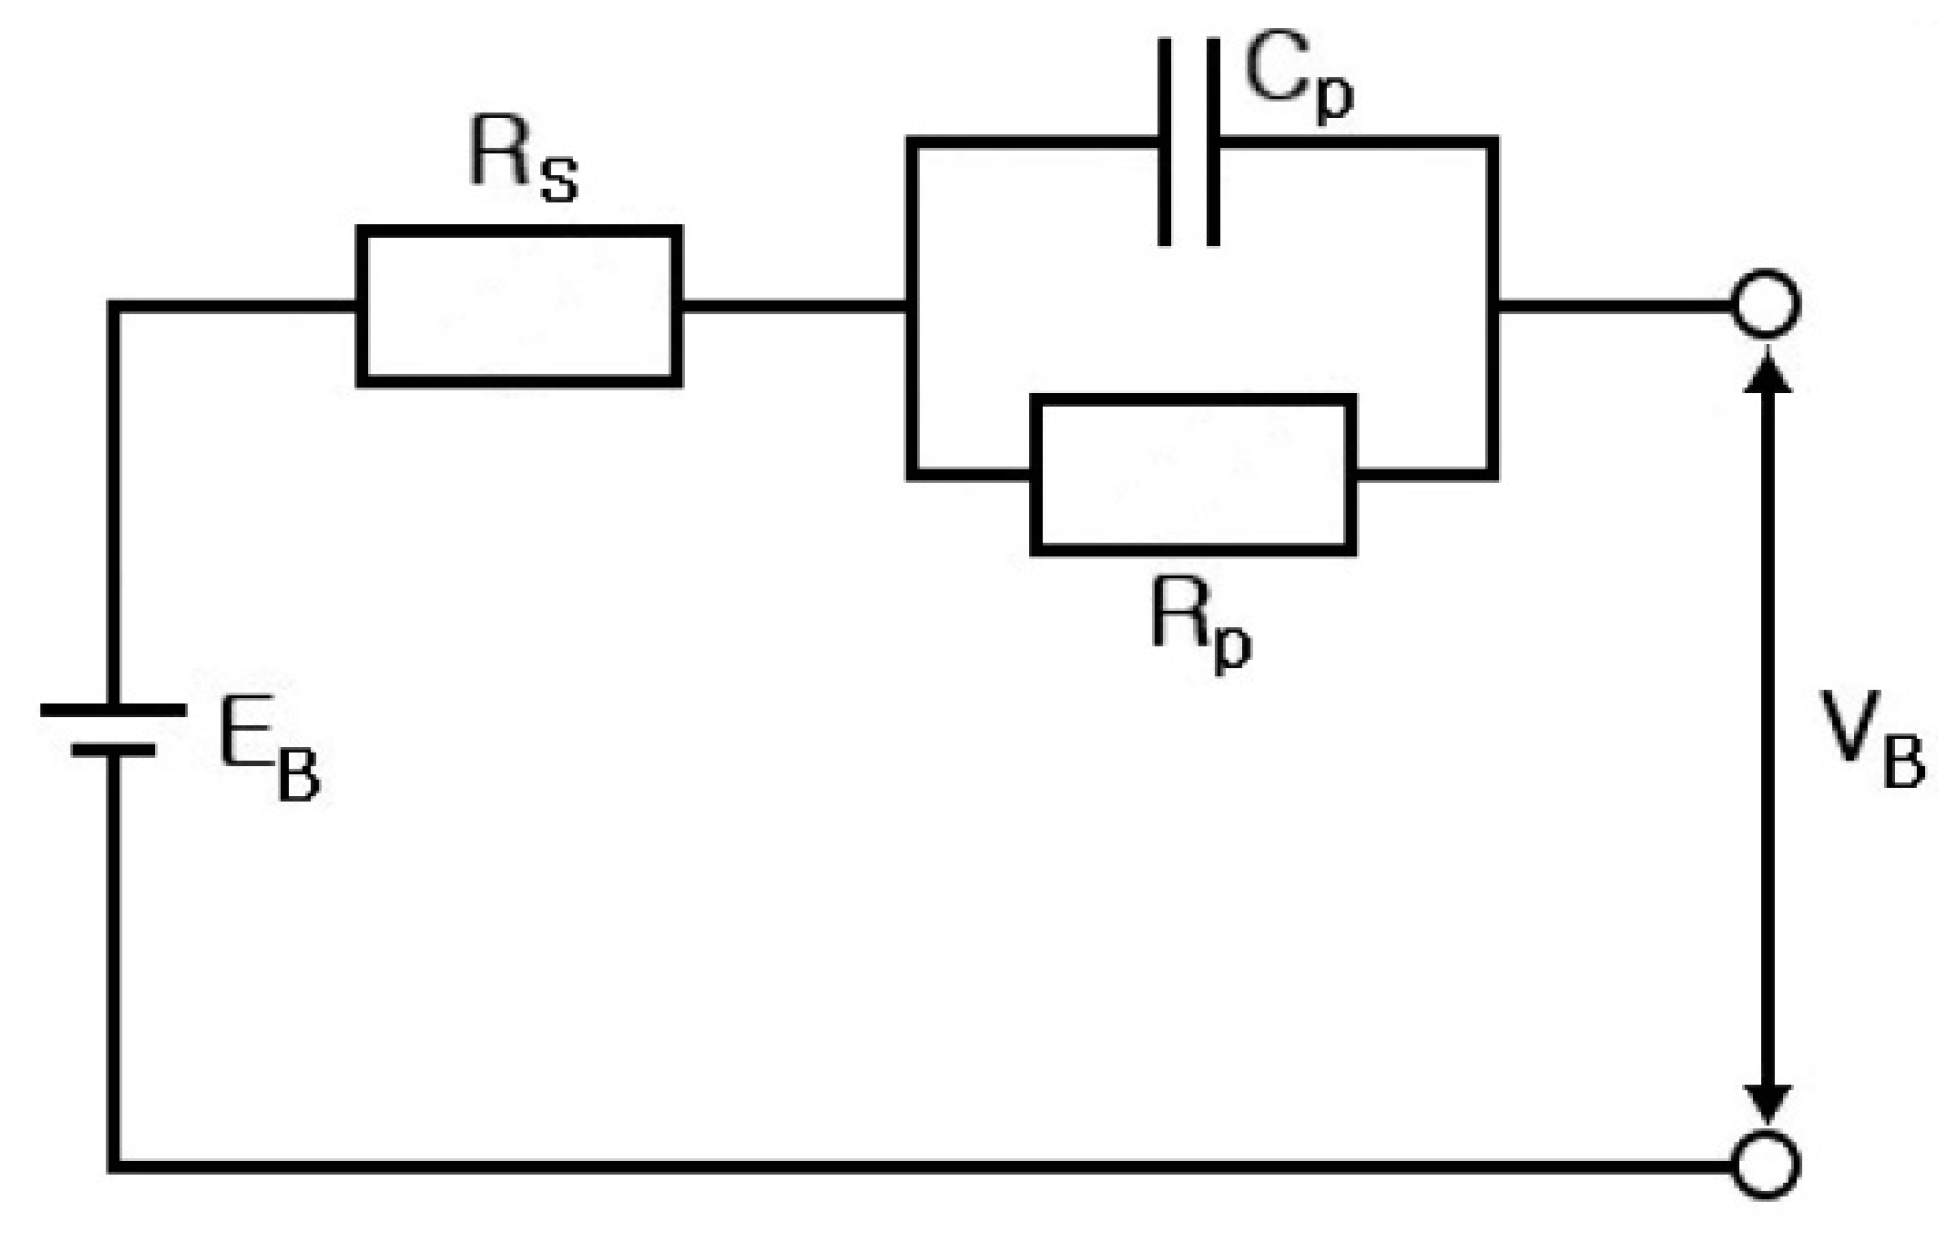
Chan and Sutanto [1] proposed a Thevenin battery model, which is a more practical battery model, as shown in Figure 2.
The Thevenin battery model comprises the battery voltage (), the battery equivalent series resistance (), a battery parallel resistance (), a battery parallel capacitor (), and the battery open circuit voltage ().
Additionally, the battery parallel resistance (RP) represents the nonlinear resistance generated due to the contact resistance of the electrolyte [1]. Sims et al. [2] proposed the following equation to represent the dynamic characteristics of the battery [2]:
where is the polarization constant, is the battery discharge current, and is the state of charge.
The dynamic characteristics of the battery are characterized by considering , , and [2].
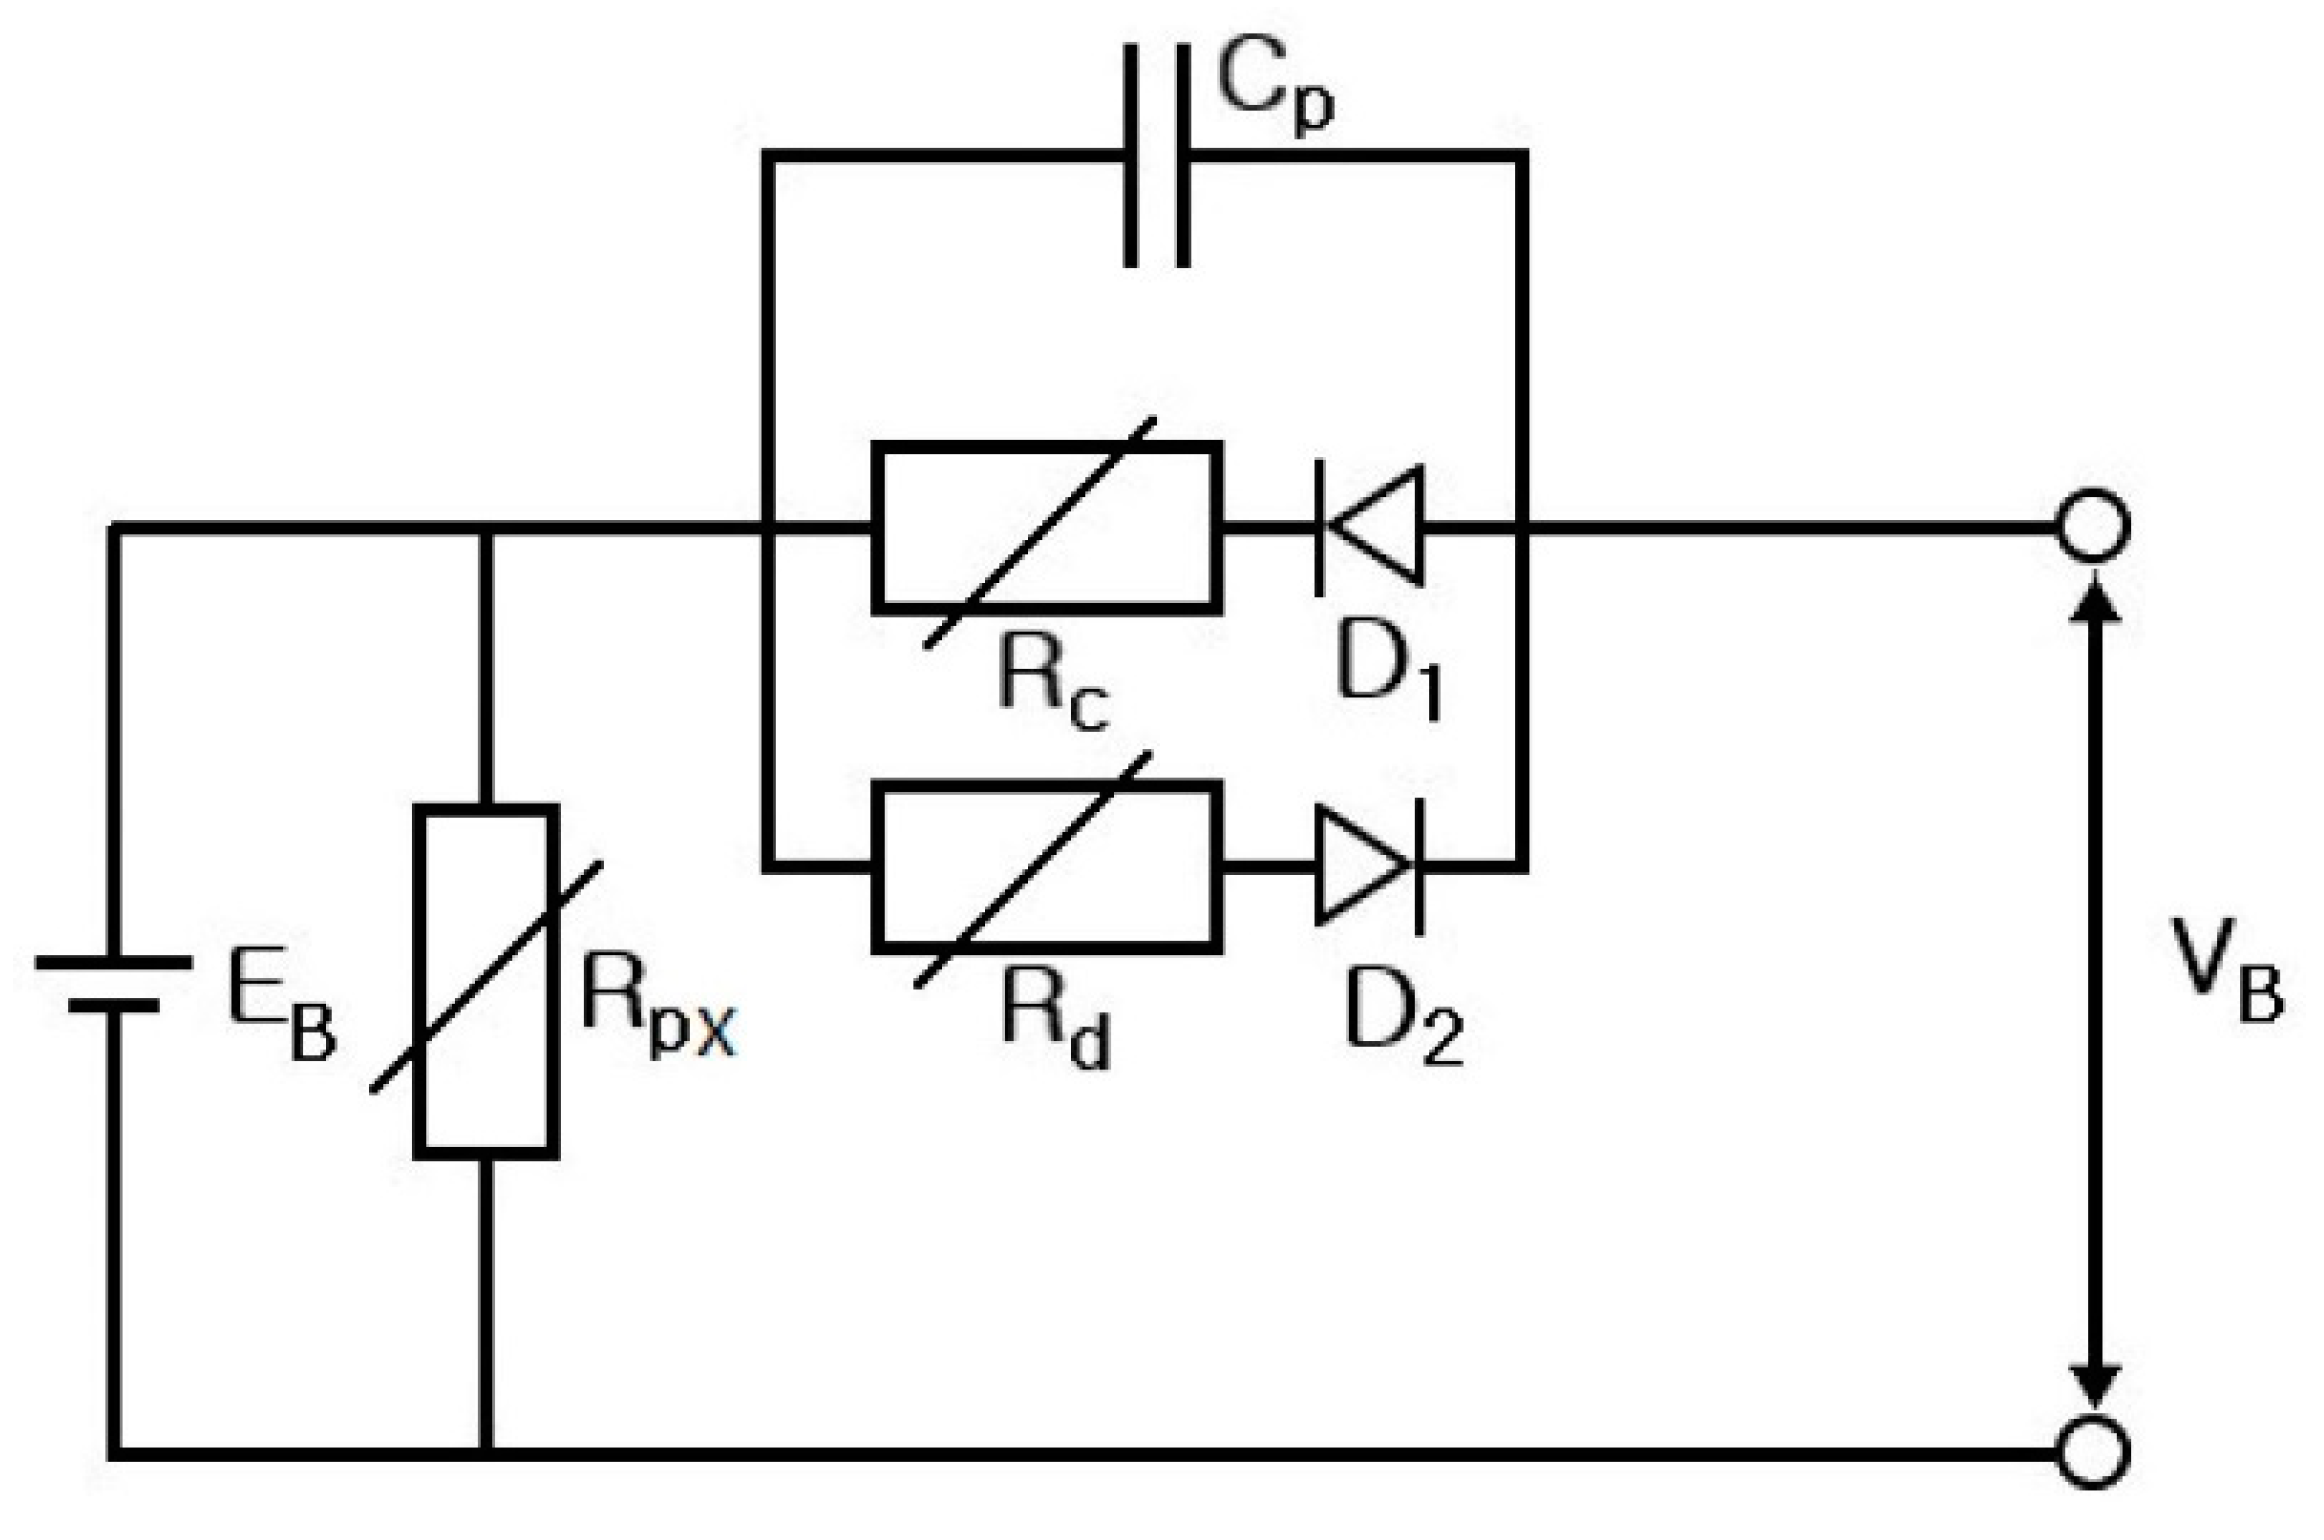
Ziyad et al. [3] and Margaret and Ziyad [4] proposed an improved battery model, which is shown in Figure 3. The improved battery model comprises , , and ; particularly, the variable resistor () and the diode () are arranged such that nonlinearity is afforded during charging and discharging. Moreover, the model includes a typical battery element [3,4].
In Figure 3, is the battery variable parallel resistance, is the variable resistance when charging the battery, and is the variable resistance when discharging the battery.
Recently, life prediction and performance analyses of the Li-ion batteries and supercapacitors used in electric vehicles, personal mobility vehicles, and energy storage systems (ESS) are being increasingly performed. Buller et al. [5,6] introduced a variable frequency for Li-ion batteries and supercapacitors, and based on this, proposed this study for analyzing their characteristics in the complex plane. Their method reduces the time required to perform the characteristic analysis of Li-ion batteries and supercapacitors, which is traditionally performed by charging and discharging Li-ion batteries and supercapacitors over long periods of time. Advantageously, it can analyze the basic characteristics of batteries within a very short time [5,6].
Electrical and mathematical models for cylindrical Li-ion batteries, pouch-type Li-ion batteries, and supercapacitors have been investigated [5,6,7,8,9,10,11]. By actually measuring the impedance spectrum in the state of being charged and discharged, the battery characteristics can be experimentally analyzed and compared. Subsequently, changes in the actual performance of cylindrical Li-ion batteries, pouch-type Li-ion batteries, and supercapacitors can be objectively observed, and the performance characteristics of electric vehicles, personal mobility vehicles, and ESS can be analyzed. This study suggests a method for quick and objective verification and analysis.
2. Electrical Modeling of Cylindrical Li-Ion Batteries
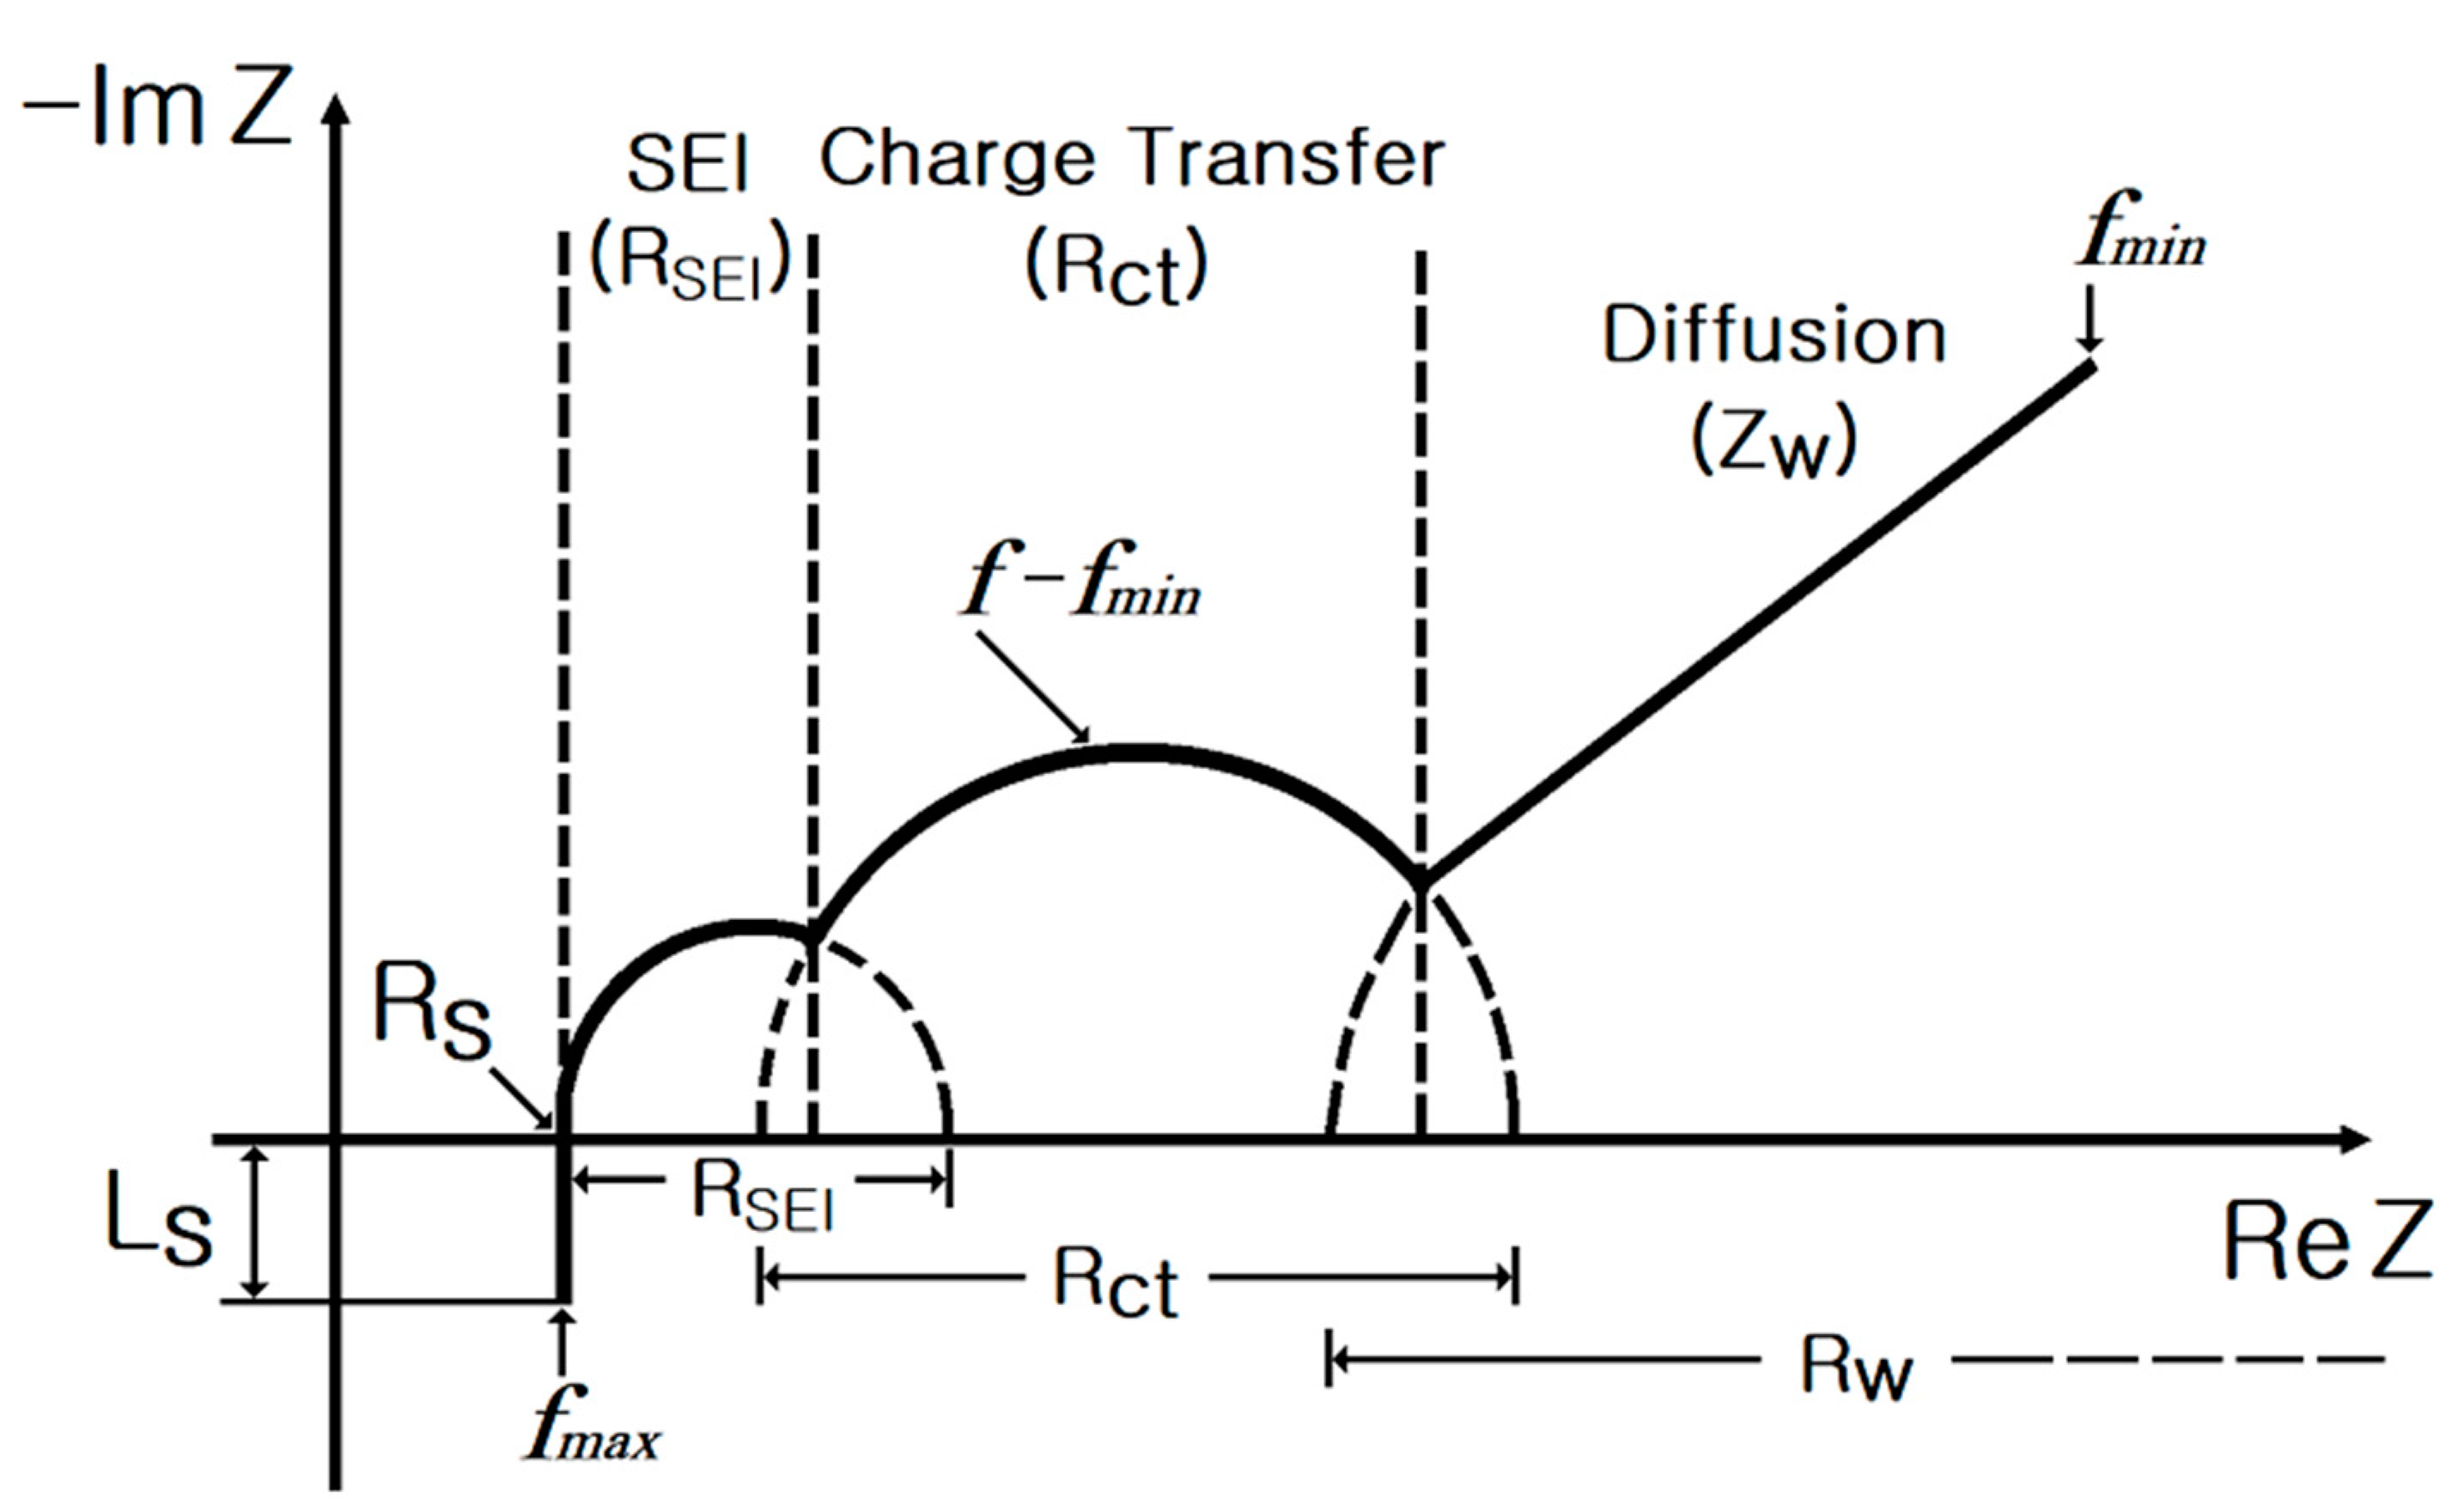
Figure 4 displays the impedance spectrum of a cylindrical Li-ion battery in the complex plane [6,8]. Cylindrical Li-ion batteries use Ni, Co, and Al as the main materials. In the impedance spectrum, the series inductor () of the cylindrical battery is located in the high-frequency region (), and the part where the trace of the impedance spectrum and the real axis () meet is the of the cylindrical battery.
In Figure 4, the small semicircle, which is expressed using the film resistance () and the capacitor (), corresponds to the charge transfer of the solid electrolyte interface (SEI) generated by the inner electrode. The Warburg impedance (), which is the diffusion region, denotes the diffusion of solid-state Li ions, and it increases with a slope of 45° in the complex plane [6,8]. can be expressed as follows [8,9]:
where is the capacitor, is the angular frequency, and is the resistance at angular frequency.
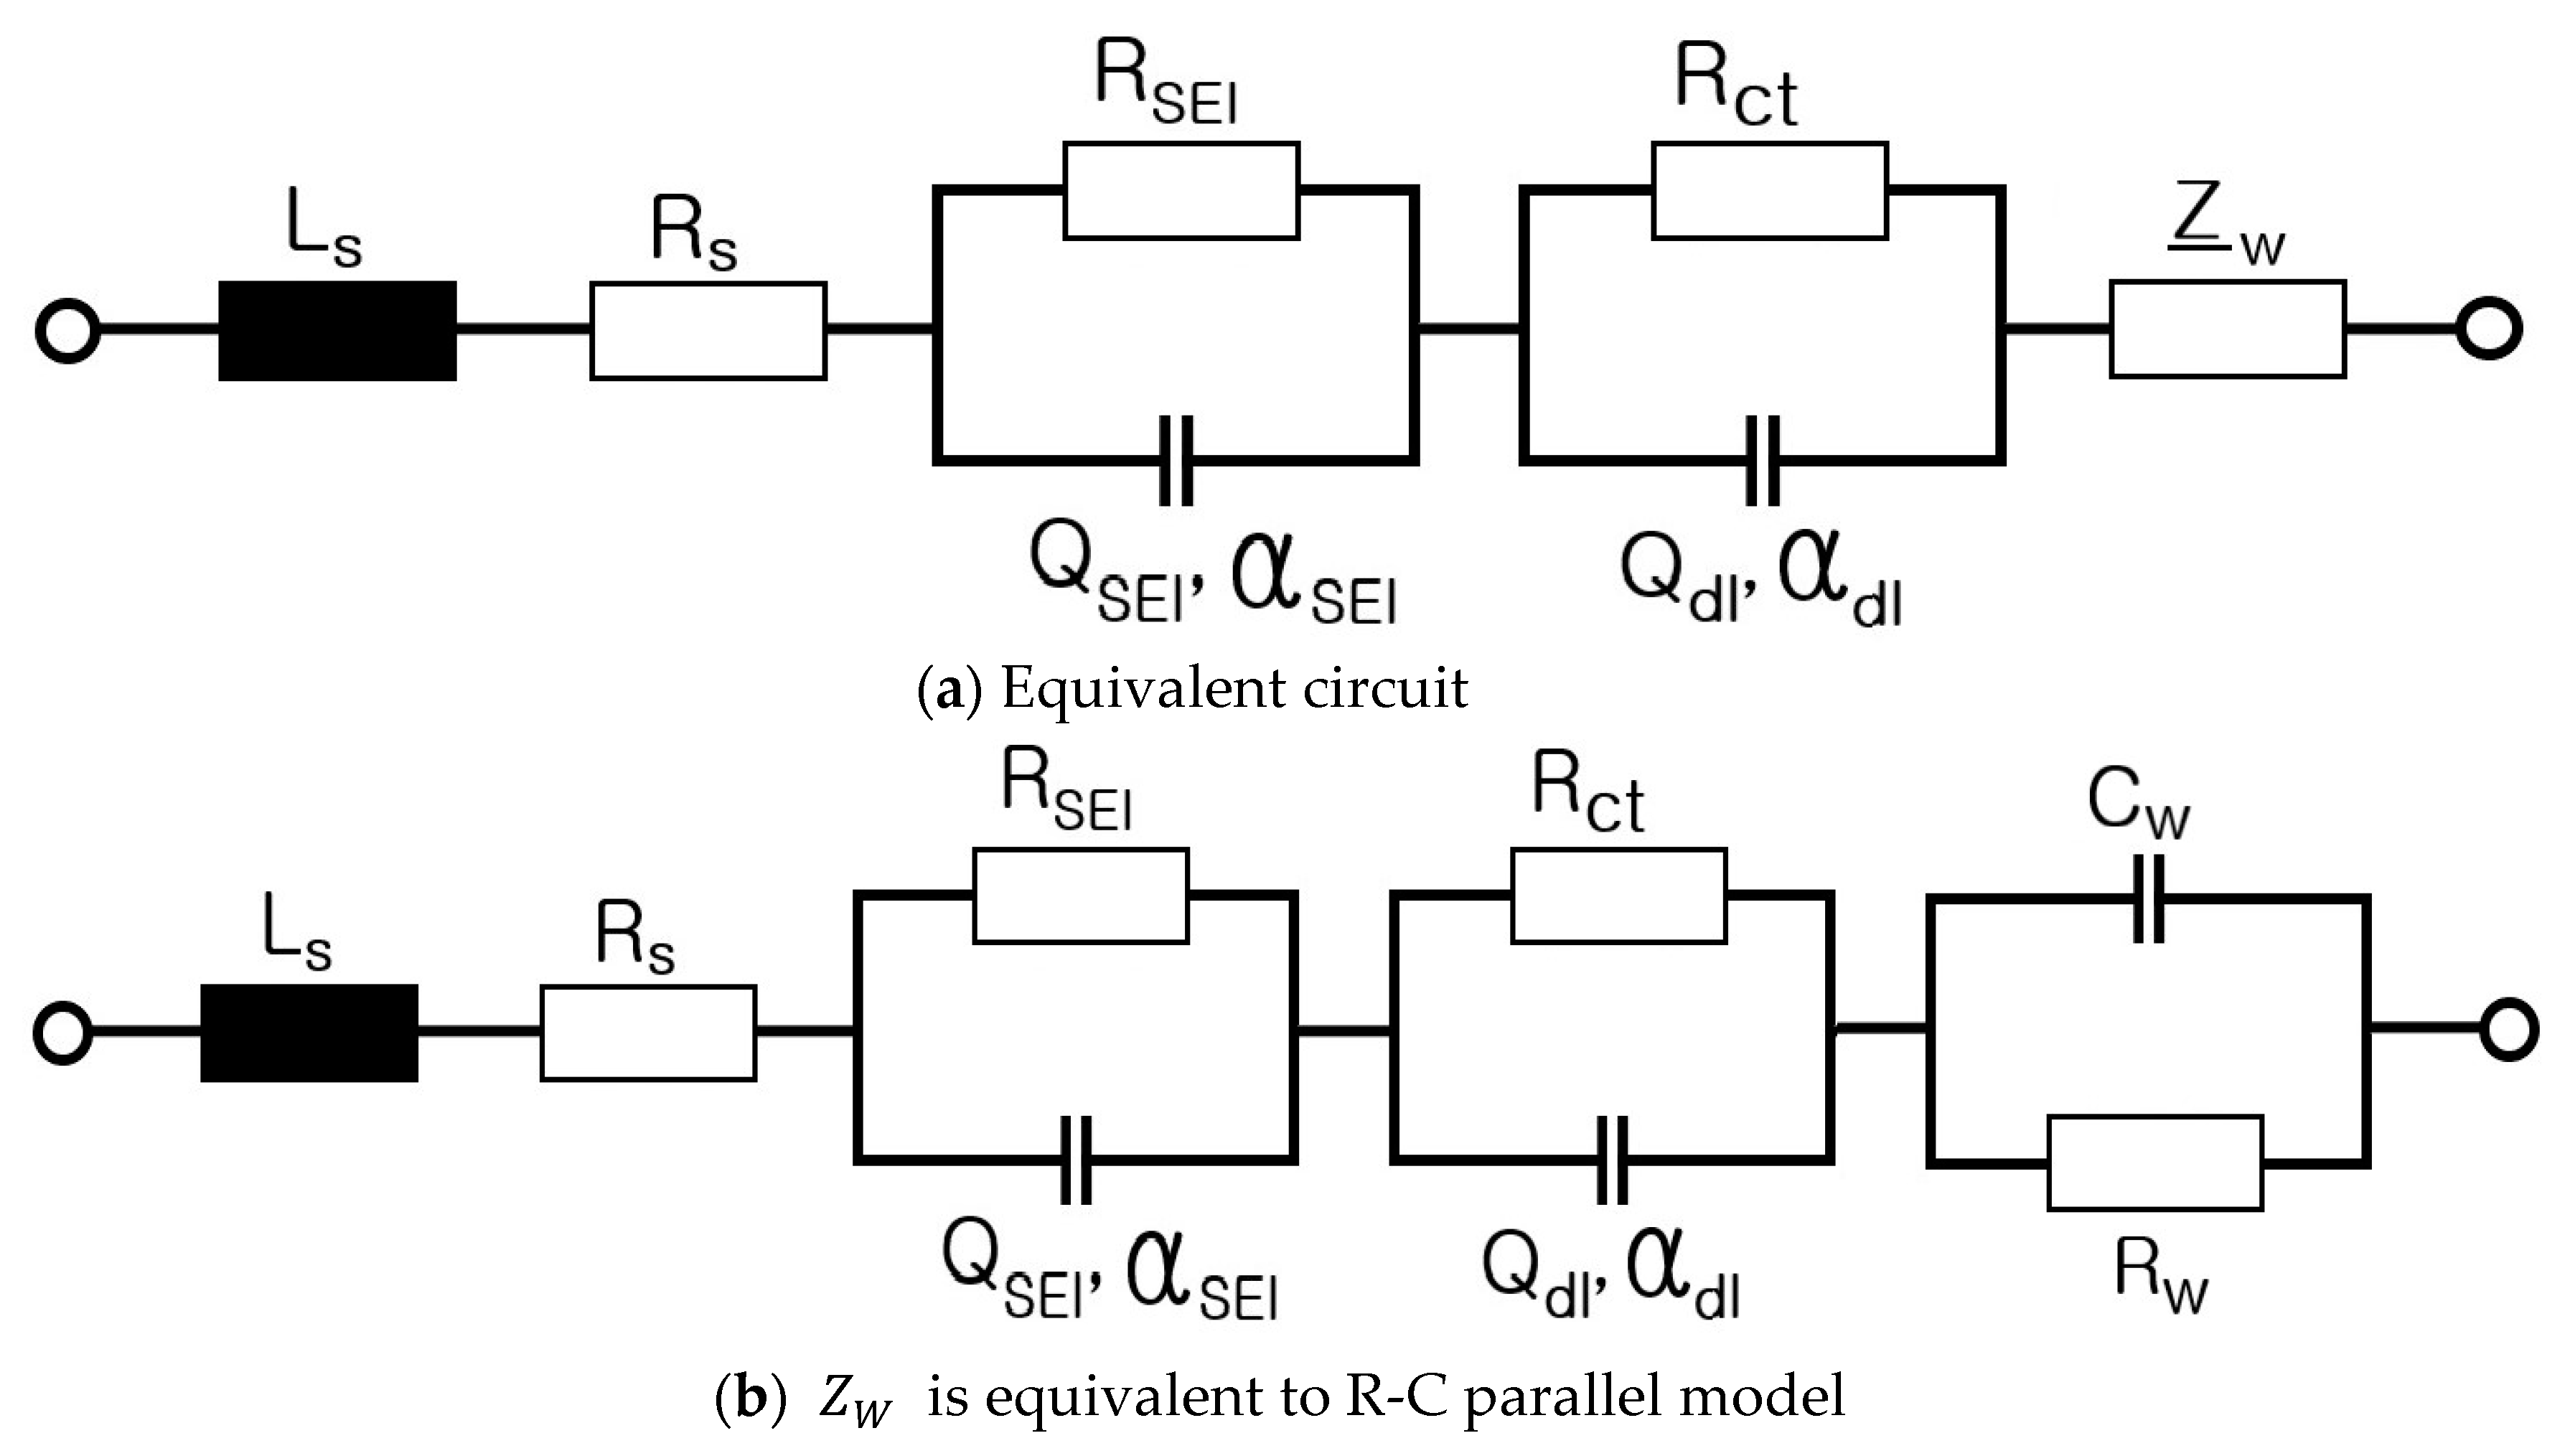
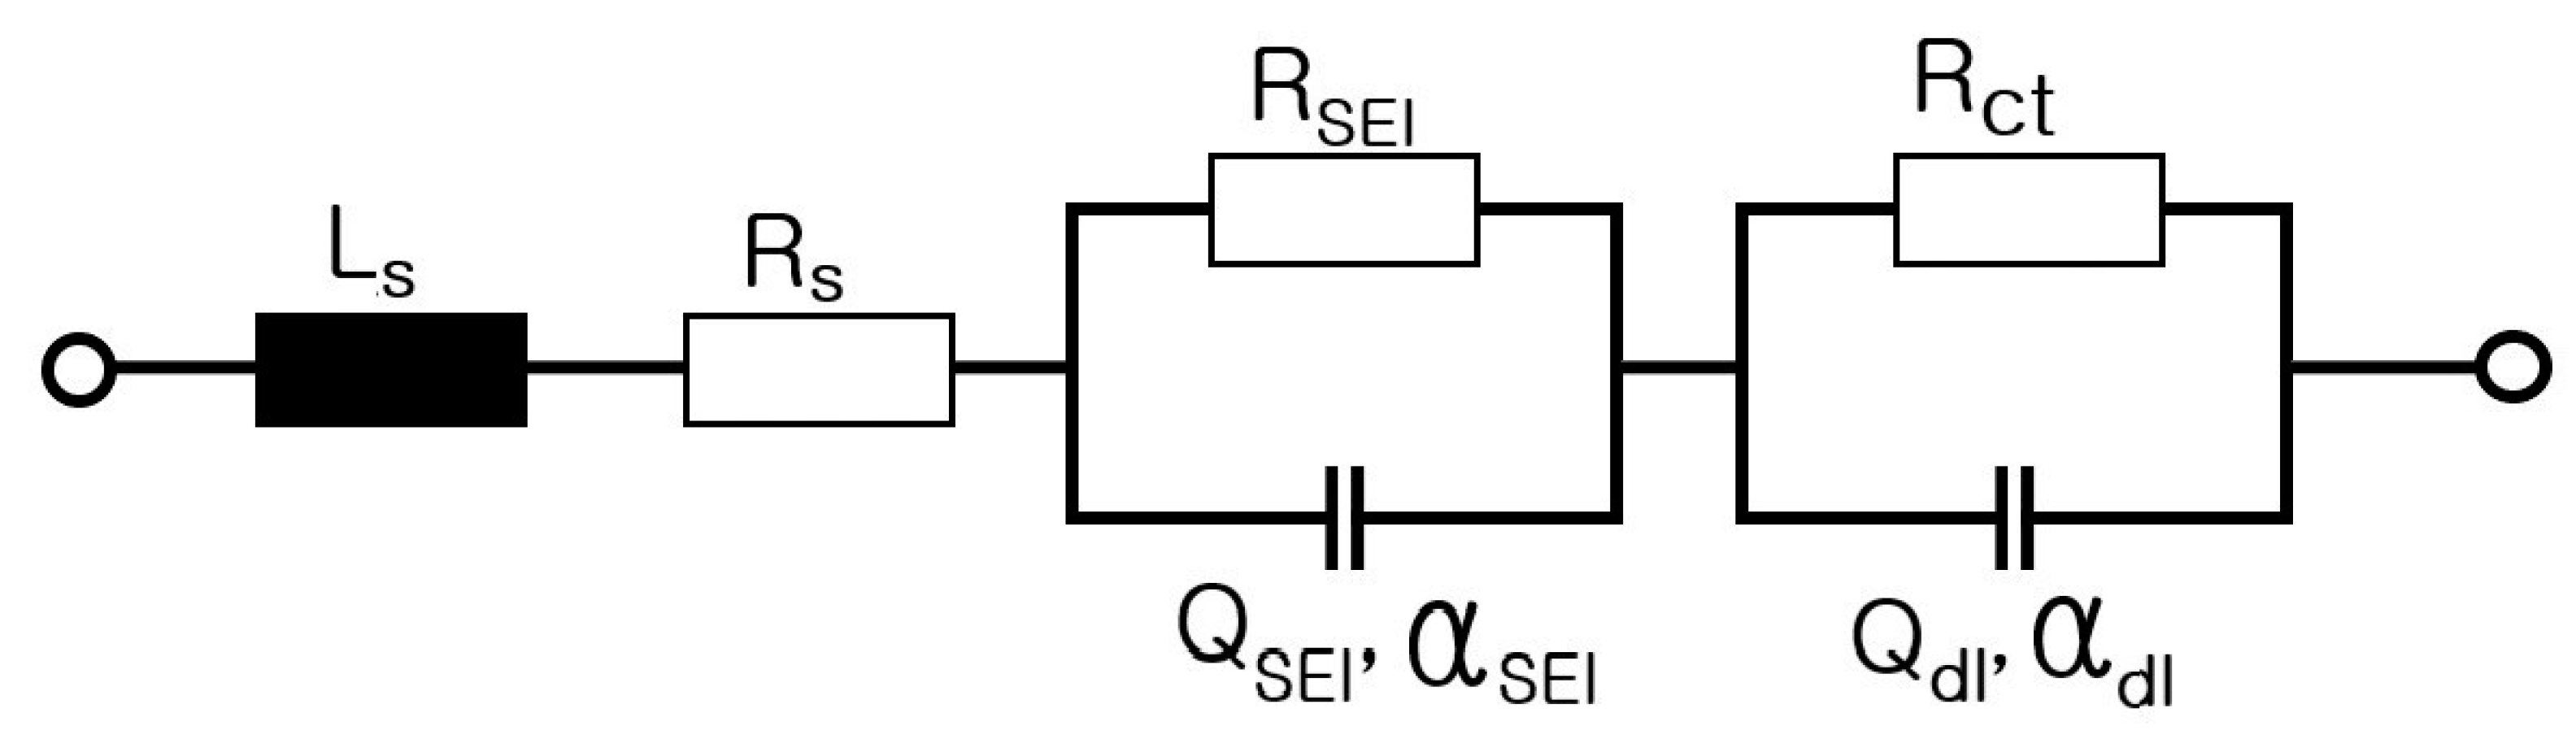
Figure 5 depicts the electrical equivalent circuit of a cylindrical Li-ion battery.
For a cylindrical Li-ion battery, since the parallel plate battery is wound into a cylinder, the series inductor () is relatively larger than that for a pouch-type battery, and the of the battery is arranged in series therewith.
The and corresponding to charge transfer are arranged according to the SEI generated by the internal electrode of the Li-ion battery, and the charge transfer resistance () representing the oxidation and reduction reactions of Li ions and a double layer () are arranged. Furthermore, the Warburg impedance () afforded by Li ion diffusion can be modeled as a resistor () and a capacitor (). Particularly, the impedance spectrum of a cylindrical Li-ion battery in the complex plane shows that the first small semicircle is generated by the SEI, and the second large semicircle is generated by the oxidation and reduction reactions of Li ions. The diffusion of Li ions is a part of the large semicircle, and it increases with an inclination of 45° in the complex plane [5,7].
Based on Figure 5, the equivalent impedance for a cylindrical Li-ion battery can be expressed as follows [8,9,10].
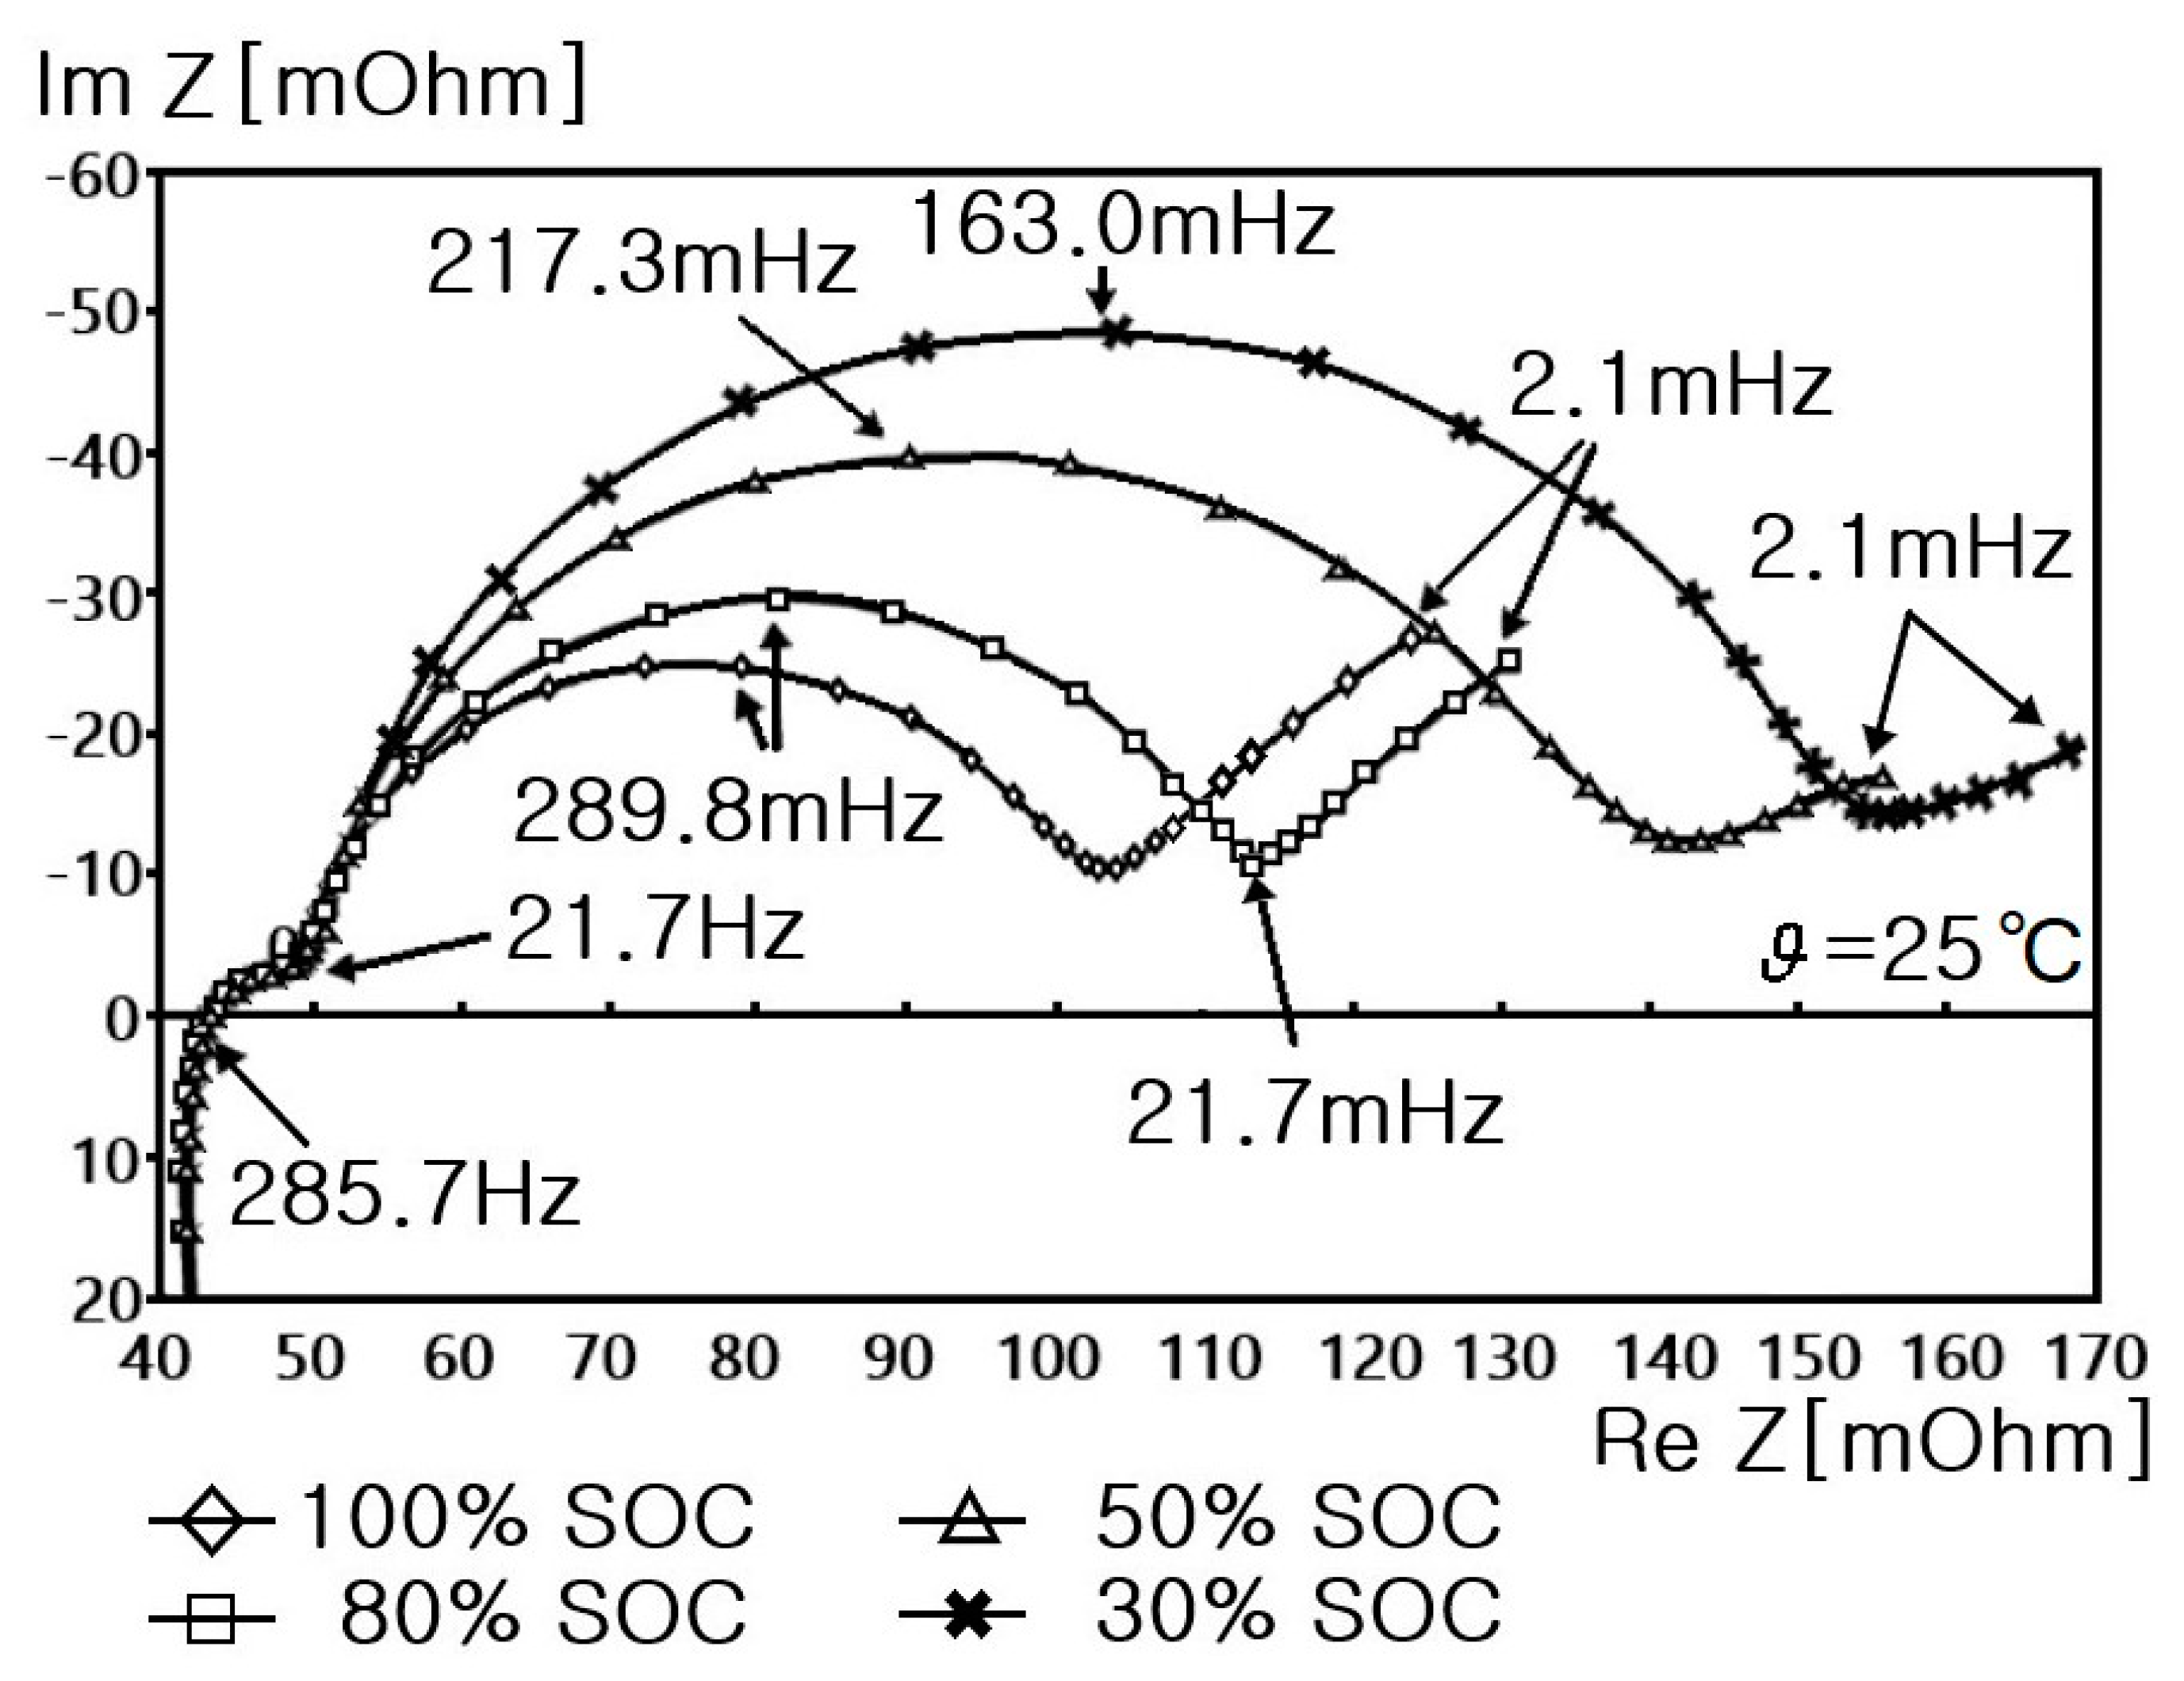
Figure 6 shows the impedance spectrum in the complex plane, according to the SoC, in a cylindrical Li-ion battery. Figure 6 shows that as the SoC of the battery increases, the oxidation and reduction reactions of Li ions at the electrode material interface of the Li-ion battery gradually decrease, and thus, the size of the semicircle decreases.
Figure 7 presents the impedance spectrum for a cylindrical Li-ion battery, according to the presence or absence of charging [5]. Figure 7 shows that the size of the semicircle also decreases as the oxidation and reduction reactions decrease when charging is not performed, compared to when charging at 1 A is performed [5].
3. Electrical Modeling of Pouch-Type Li-Ion Batteries
Figure 8 displays the electrical equivalent circuit of a pouch-type Li-ion battery in the complex plane [10].
The pouch-type Li-ion battery uses cathode active material NMC (Ni, Co, and Mn) as the main materials. Since the overall structure of the battery has a parallel plate shape, it has a relatively small compared to a cylindrical Li-ion battery.
It is placed in series with the and of the battery. The and corresponding to the charge transfer are arranged according to the SEI generated by the internal electrode of the Li-ion battery, and the of the pouch-type Li-ion battery, representing the oxidation and reduction reactions of Li-ions and the double layer (), is the same as that of a cylindrical Li-ion battery.
4. Electrical Modeling of Supercapacitors
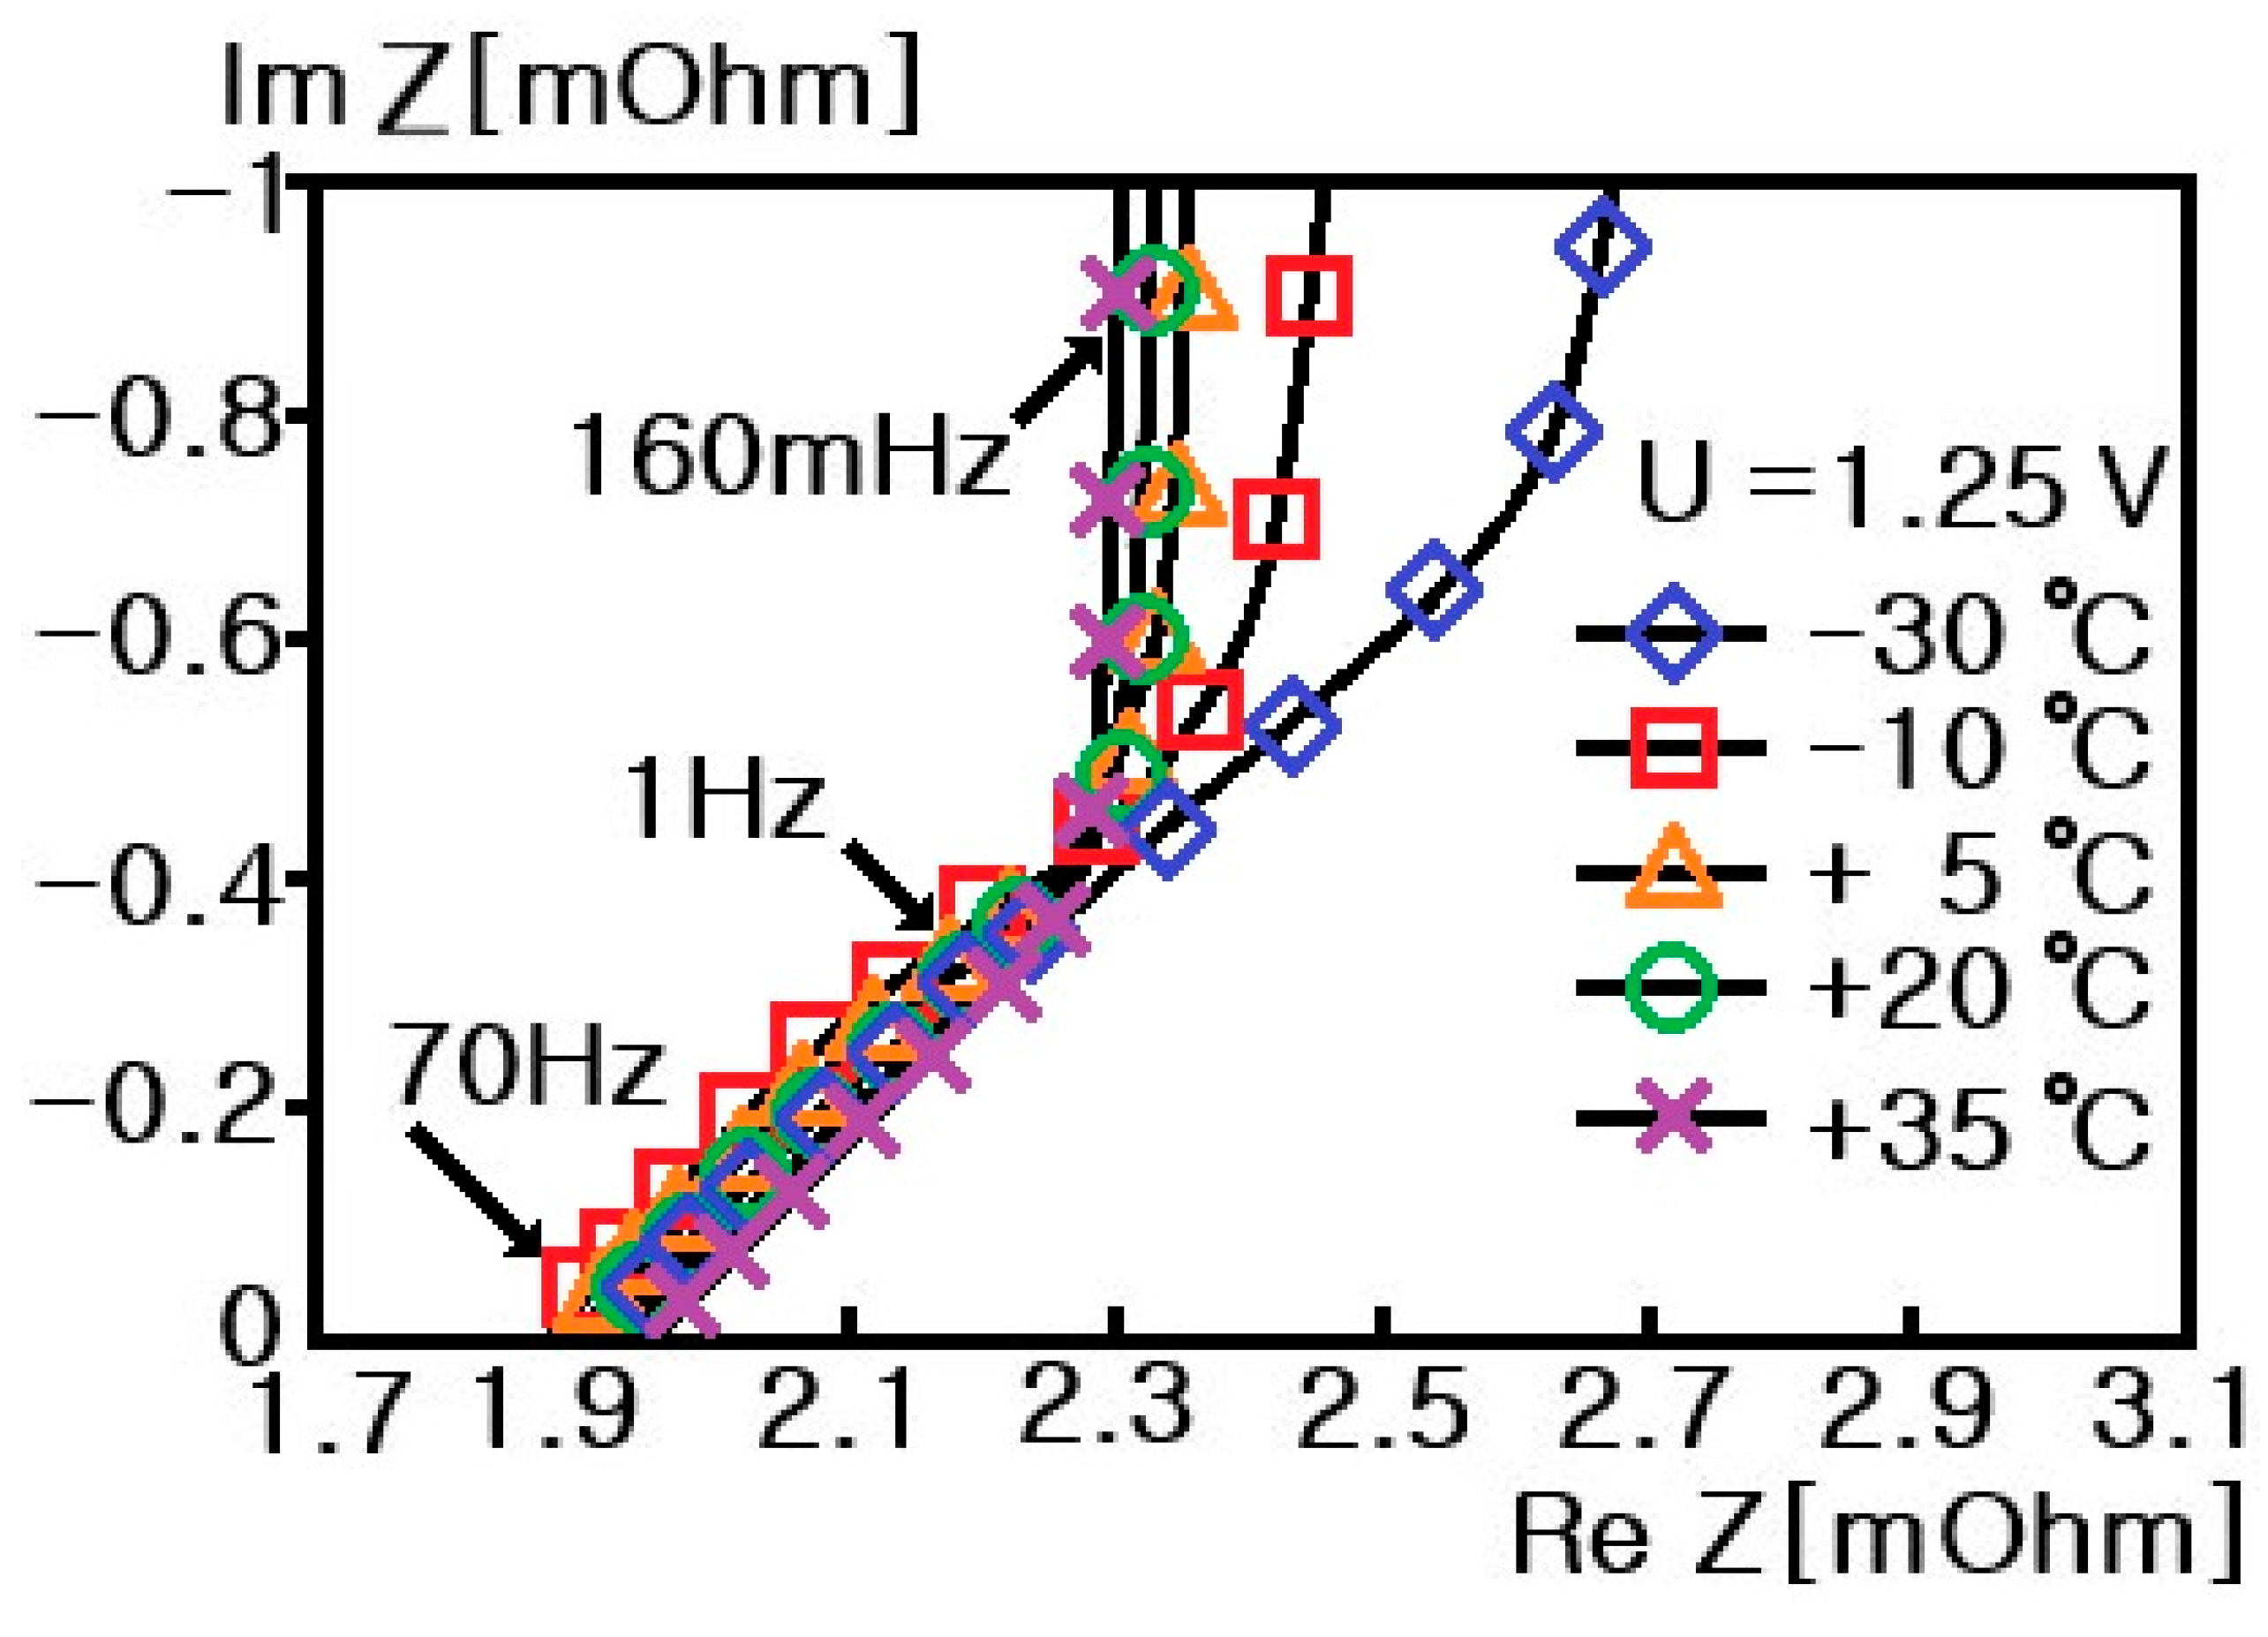
Figure 9 presents the impedance spectrum of a supercapacitor in the complex plane [5,6,11]. Supercapacitors are based on carbon, and notably, they do not exhibit charge transfer of the SEI. Moreover, since oxidation and reduction reactions of ions do not occur, semicircular trajectories do not appear. However, due to the impedance of the supercapacitor, the impedance spectrum increases with a slope of 45°, and at very low frequencies, the impedance spectrum increases with a slope of 90°, like an ideal capacitor [6].
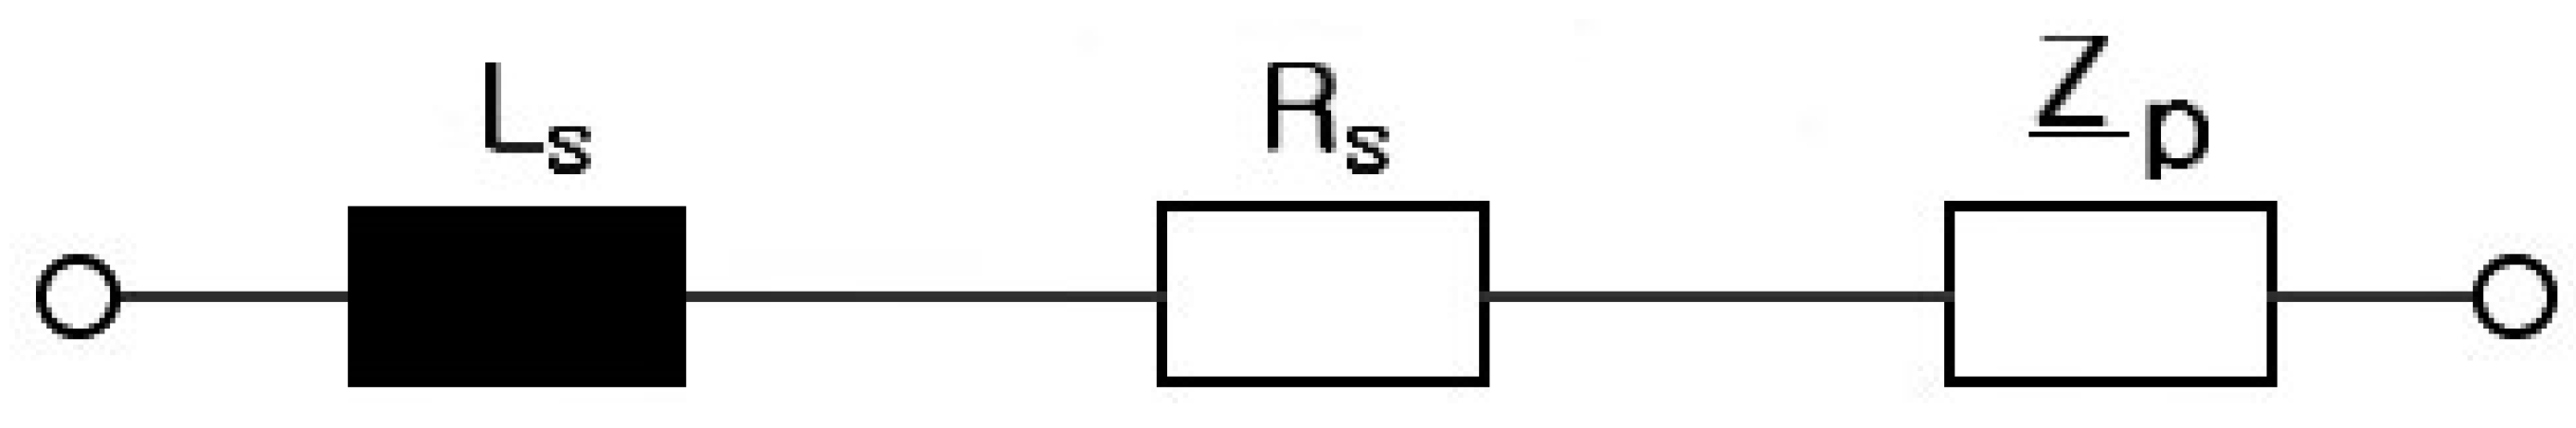
Figure 10 shows the electrical equivalent circuit of a supercapacitor. The electrical equivalent circuit of a supercapacitor comprises , , and supercapacitor impedance (). is afforded by the porosity of the supercapacitor electrode and can be expressed using Equation (5) [6,11].
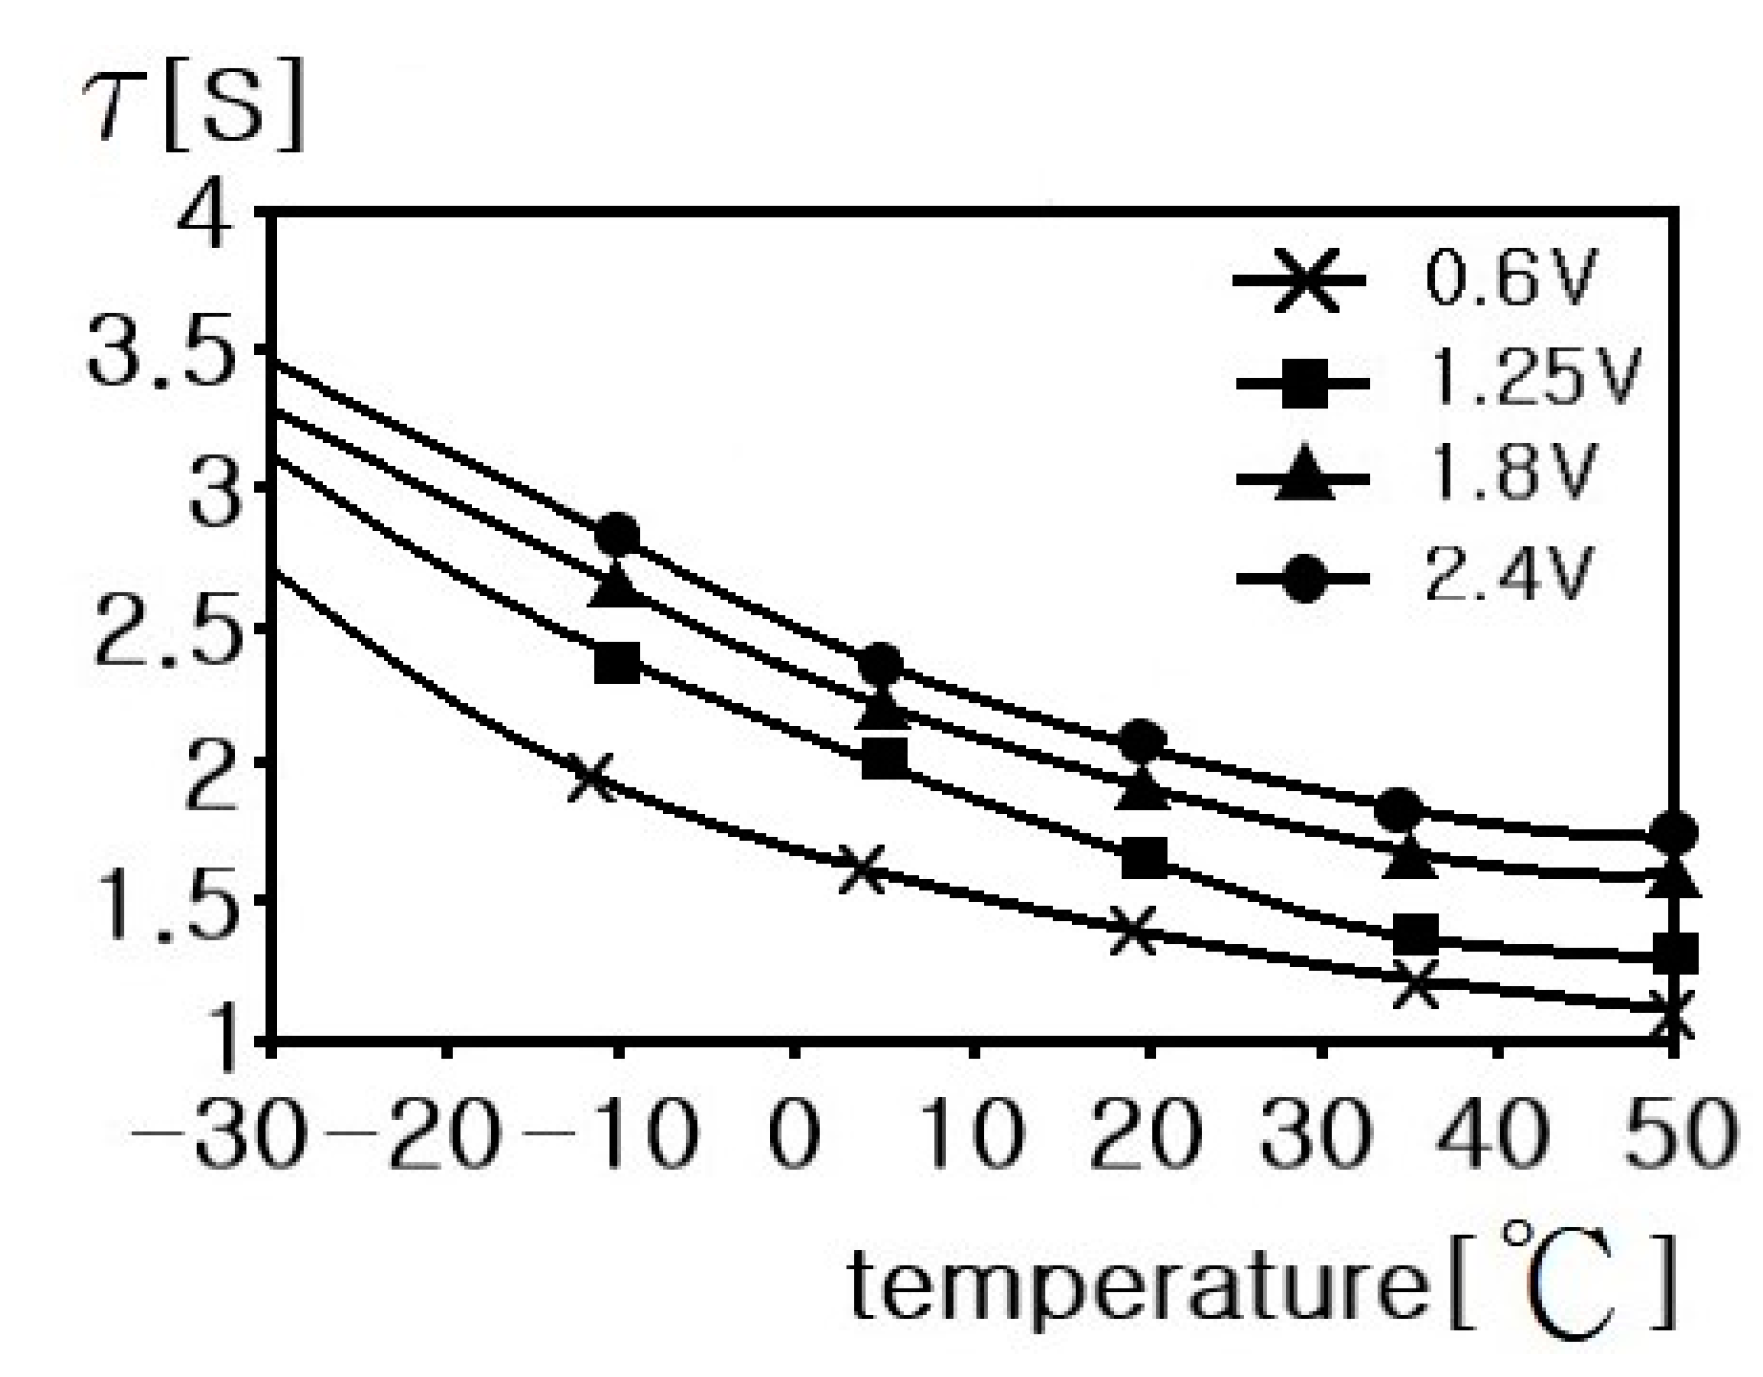
where, is the angular frequency, is the capacitance of the supercapacitor, and is the independent parameter of temperature and voltage in supercapacitors.
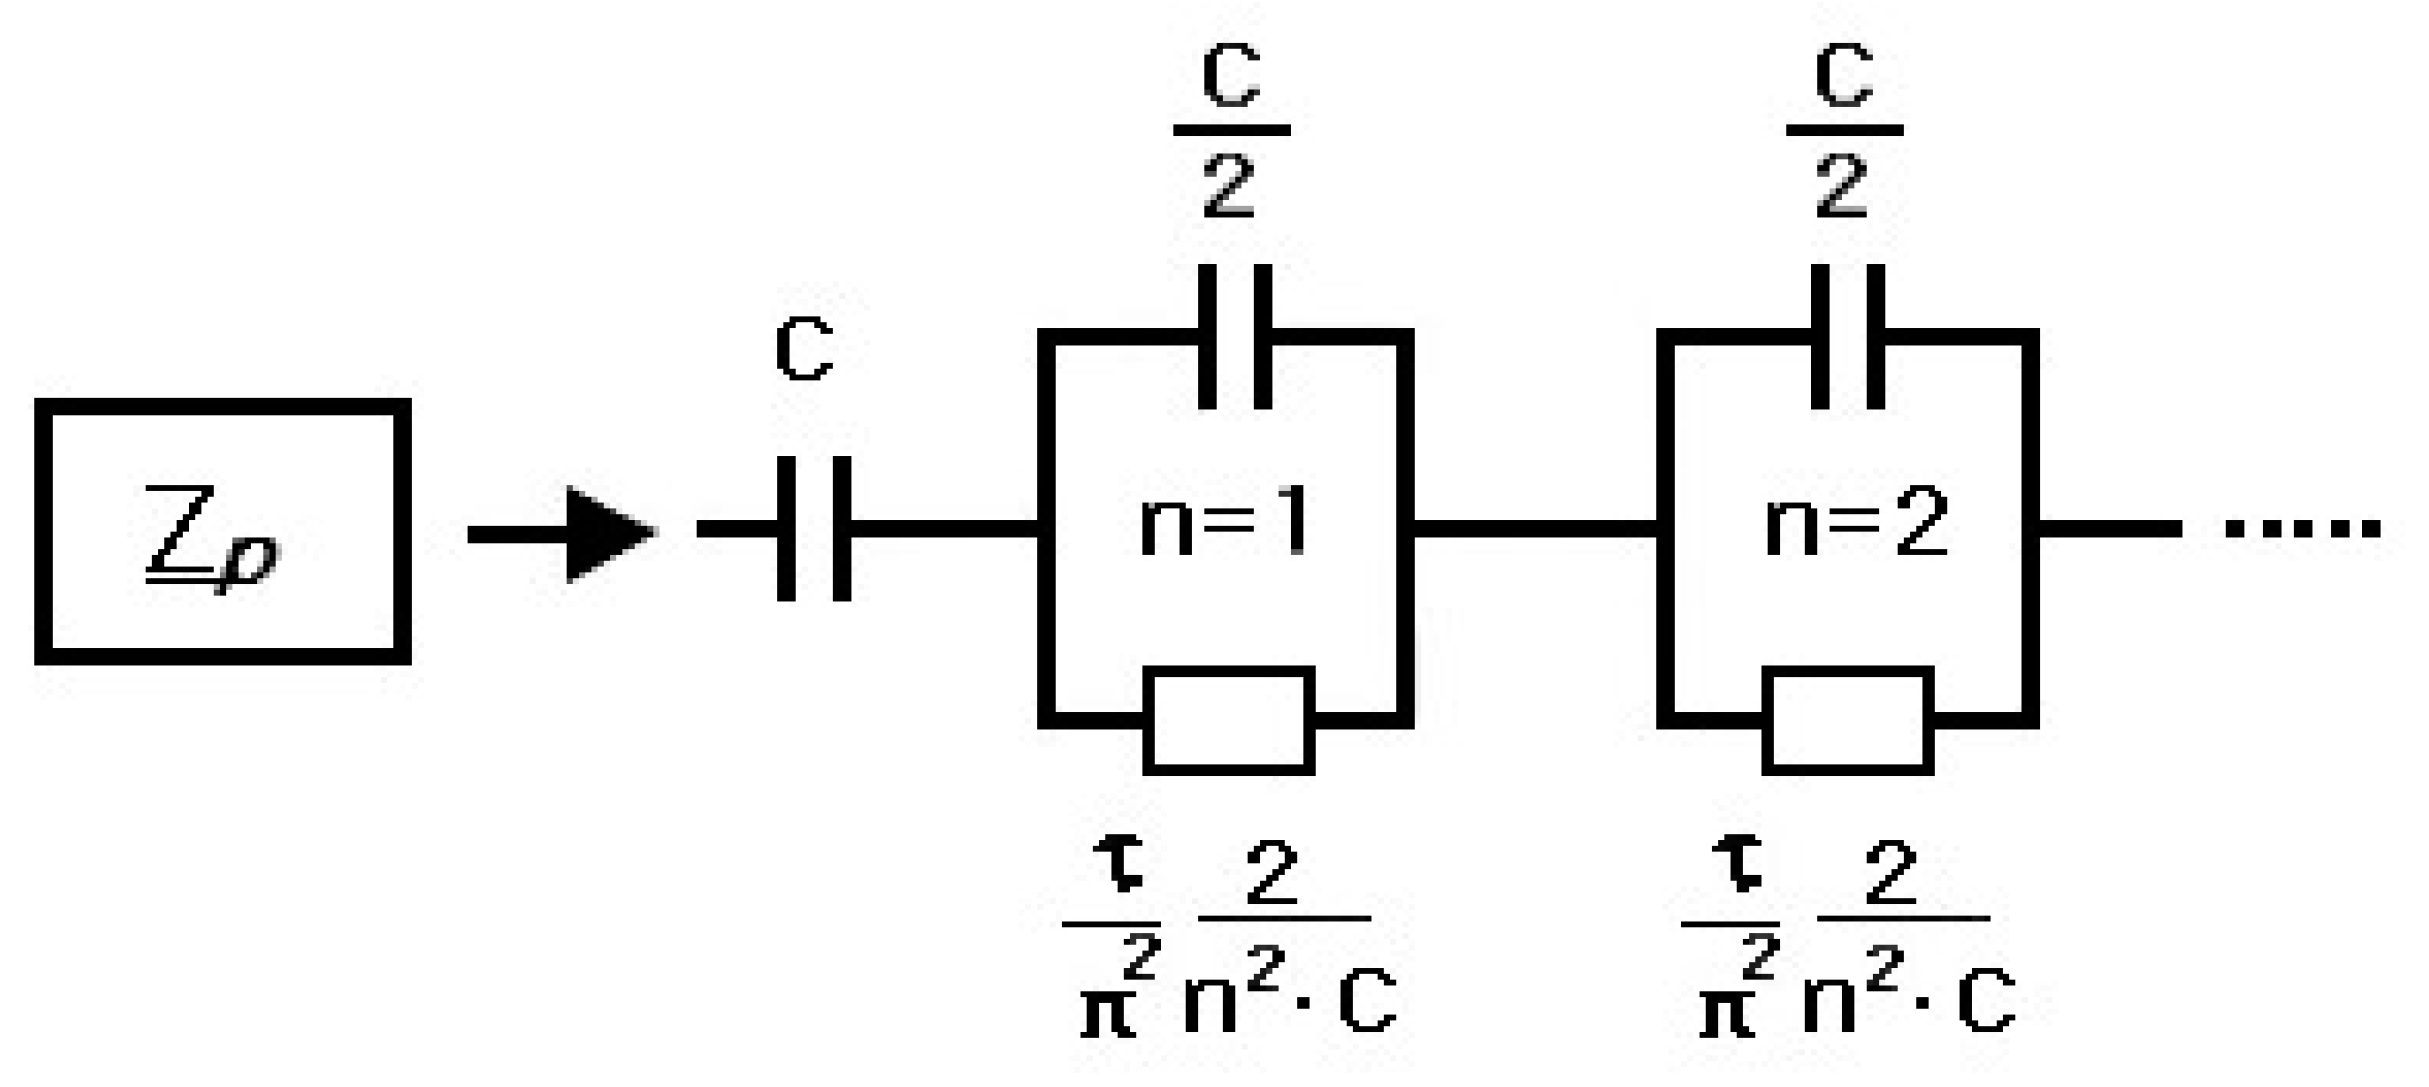
Figure 11 displays the electrical equivalent model of . is equivalent to a circuit wherein capacitor (), and N capacitors and resistors , are connected in parallel.
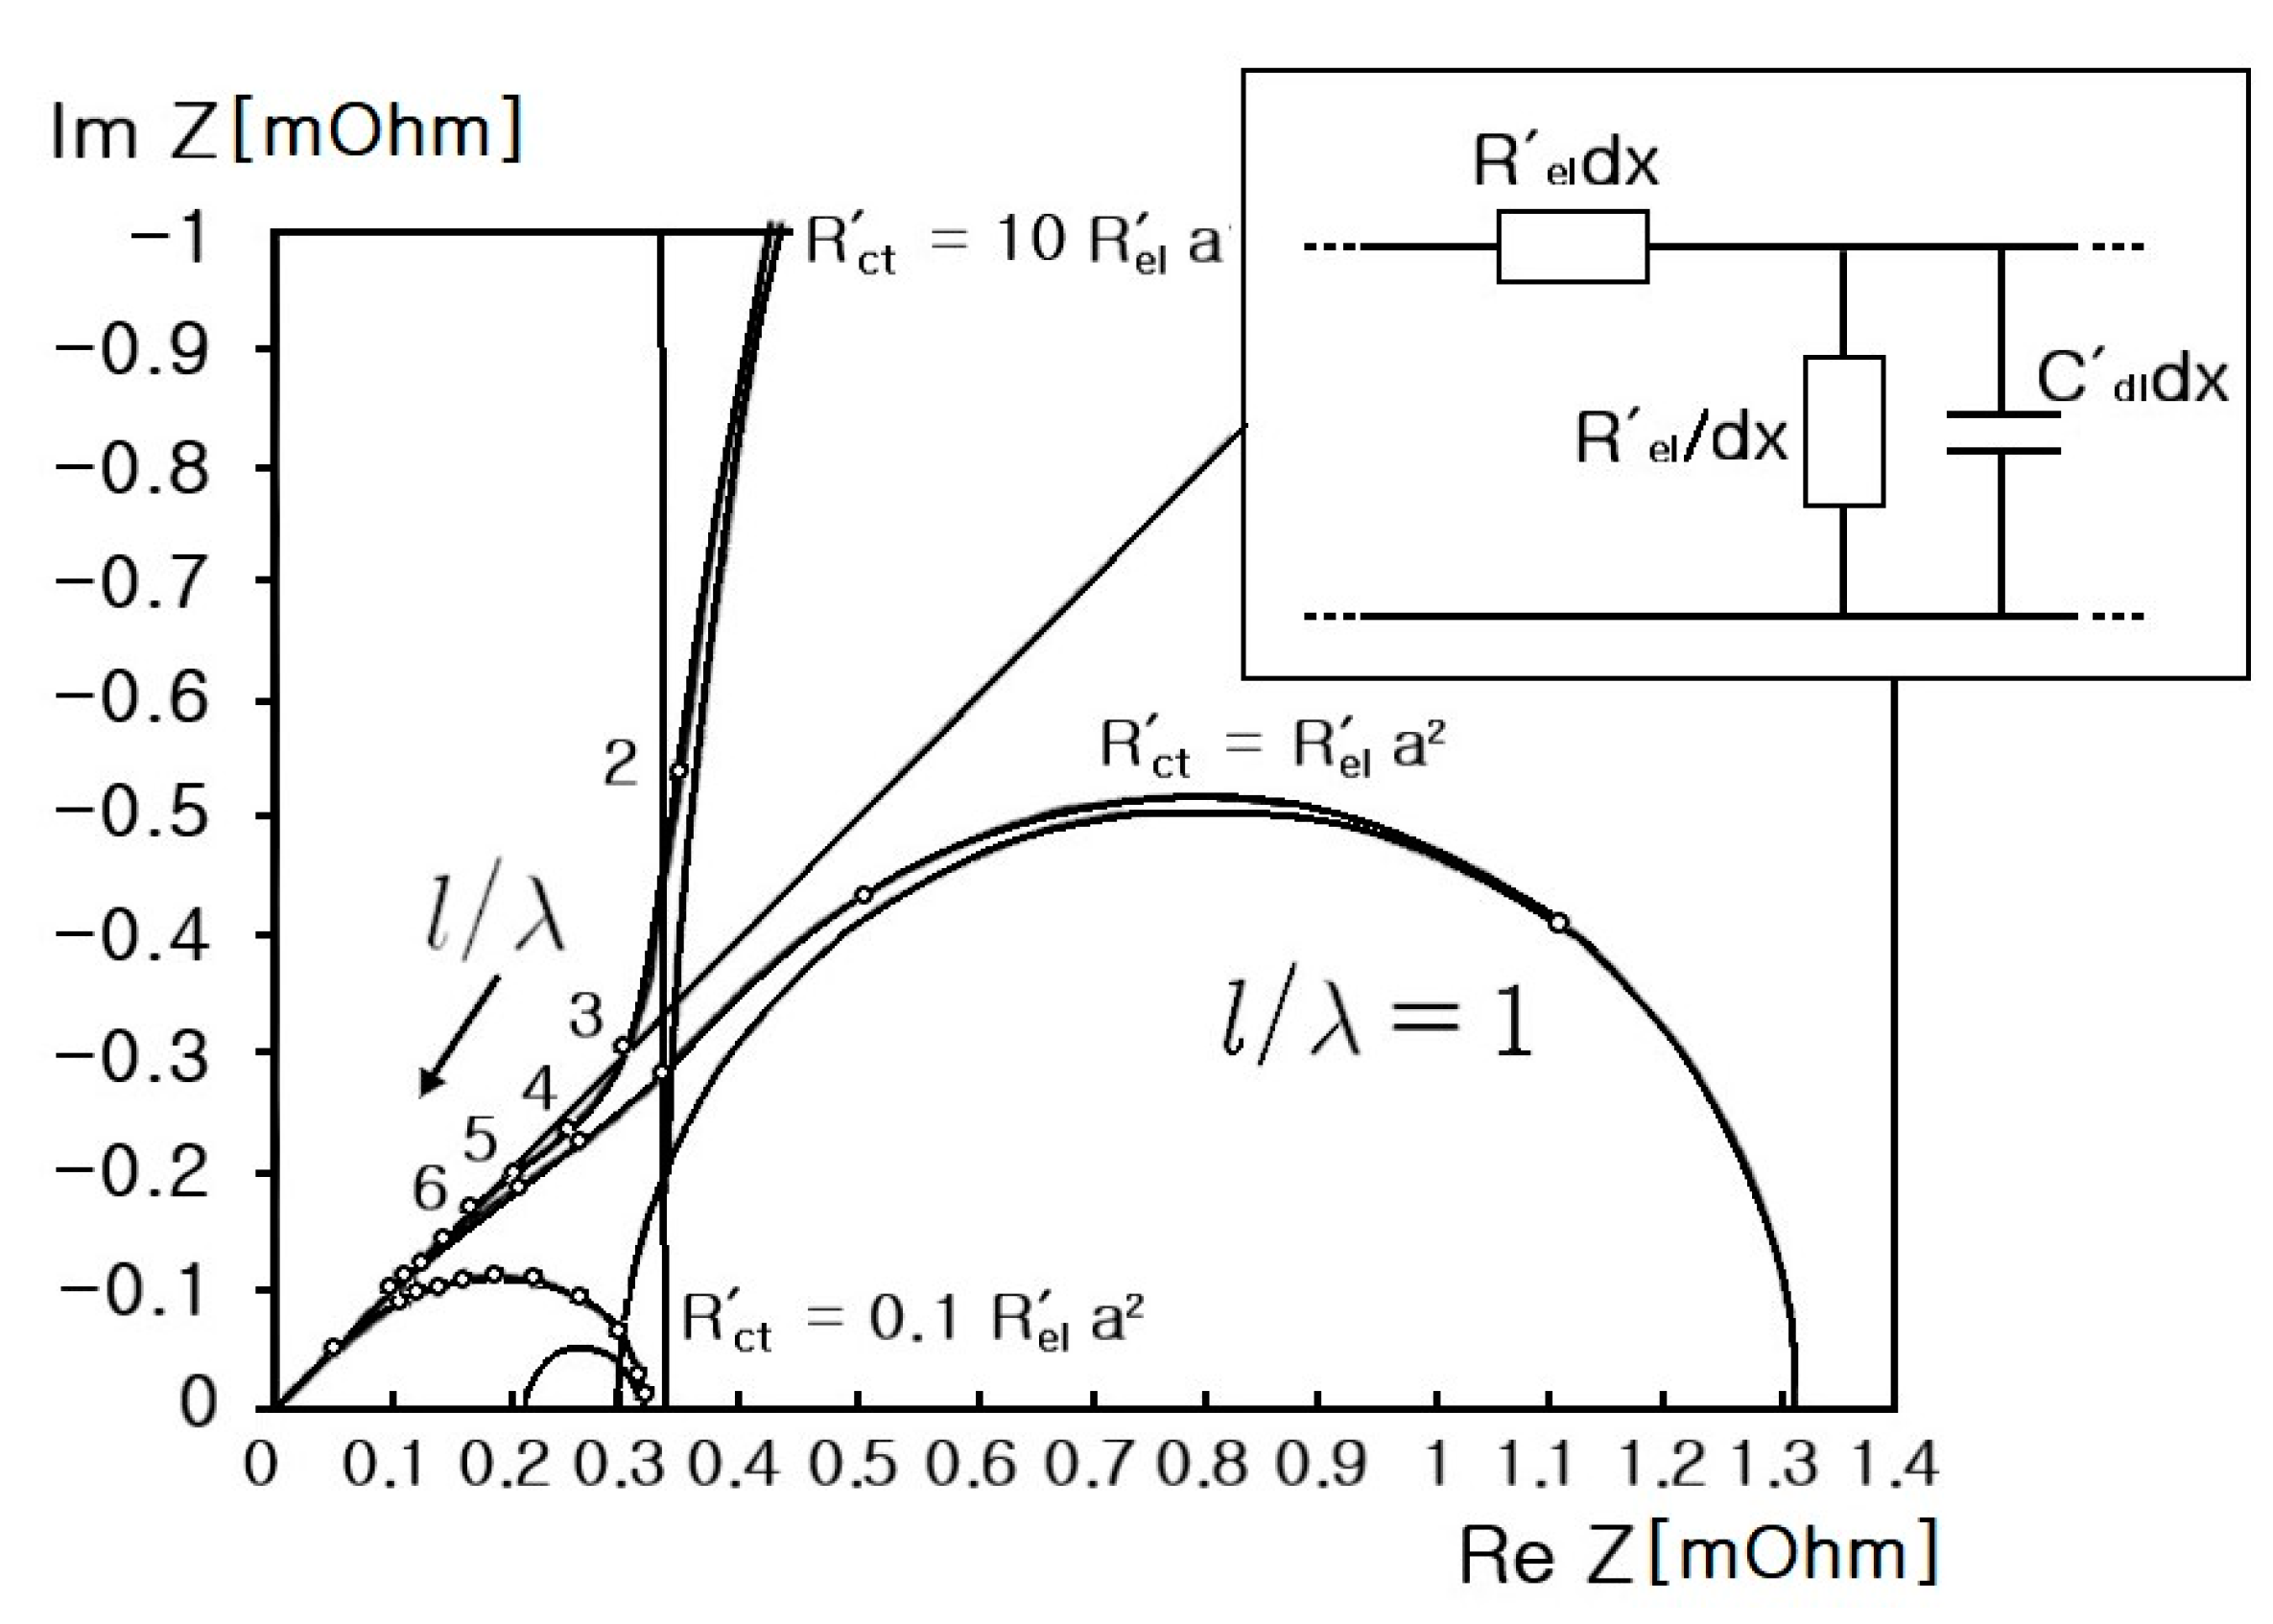
Figure 12 shows the curve of [6]. Buller et al. [5,6,11] performed a simulation of the impedance spectrum of the supercapacitor in a complex plane according to Equation (4) and Figure 12. Figure 13 presents the theoretical model of the impedance spectrum of a supercapacitor with porous electrodes [5,6,11].
where is the length of the porous electrode, and λ is the wavelength.
5. Experimental Equipment and System
Table 1 shows the specifications of the Li-ion batteries and supercapacitor used herein.
Impedance spectra were obtained for all 18 samples.
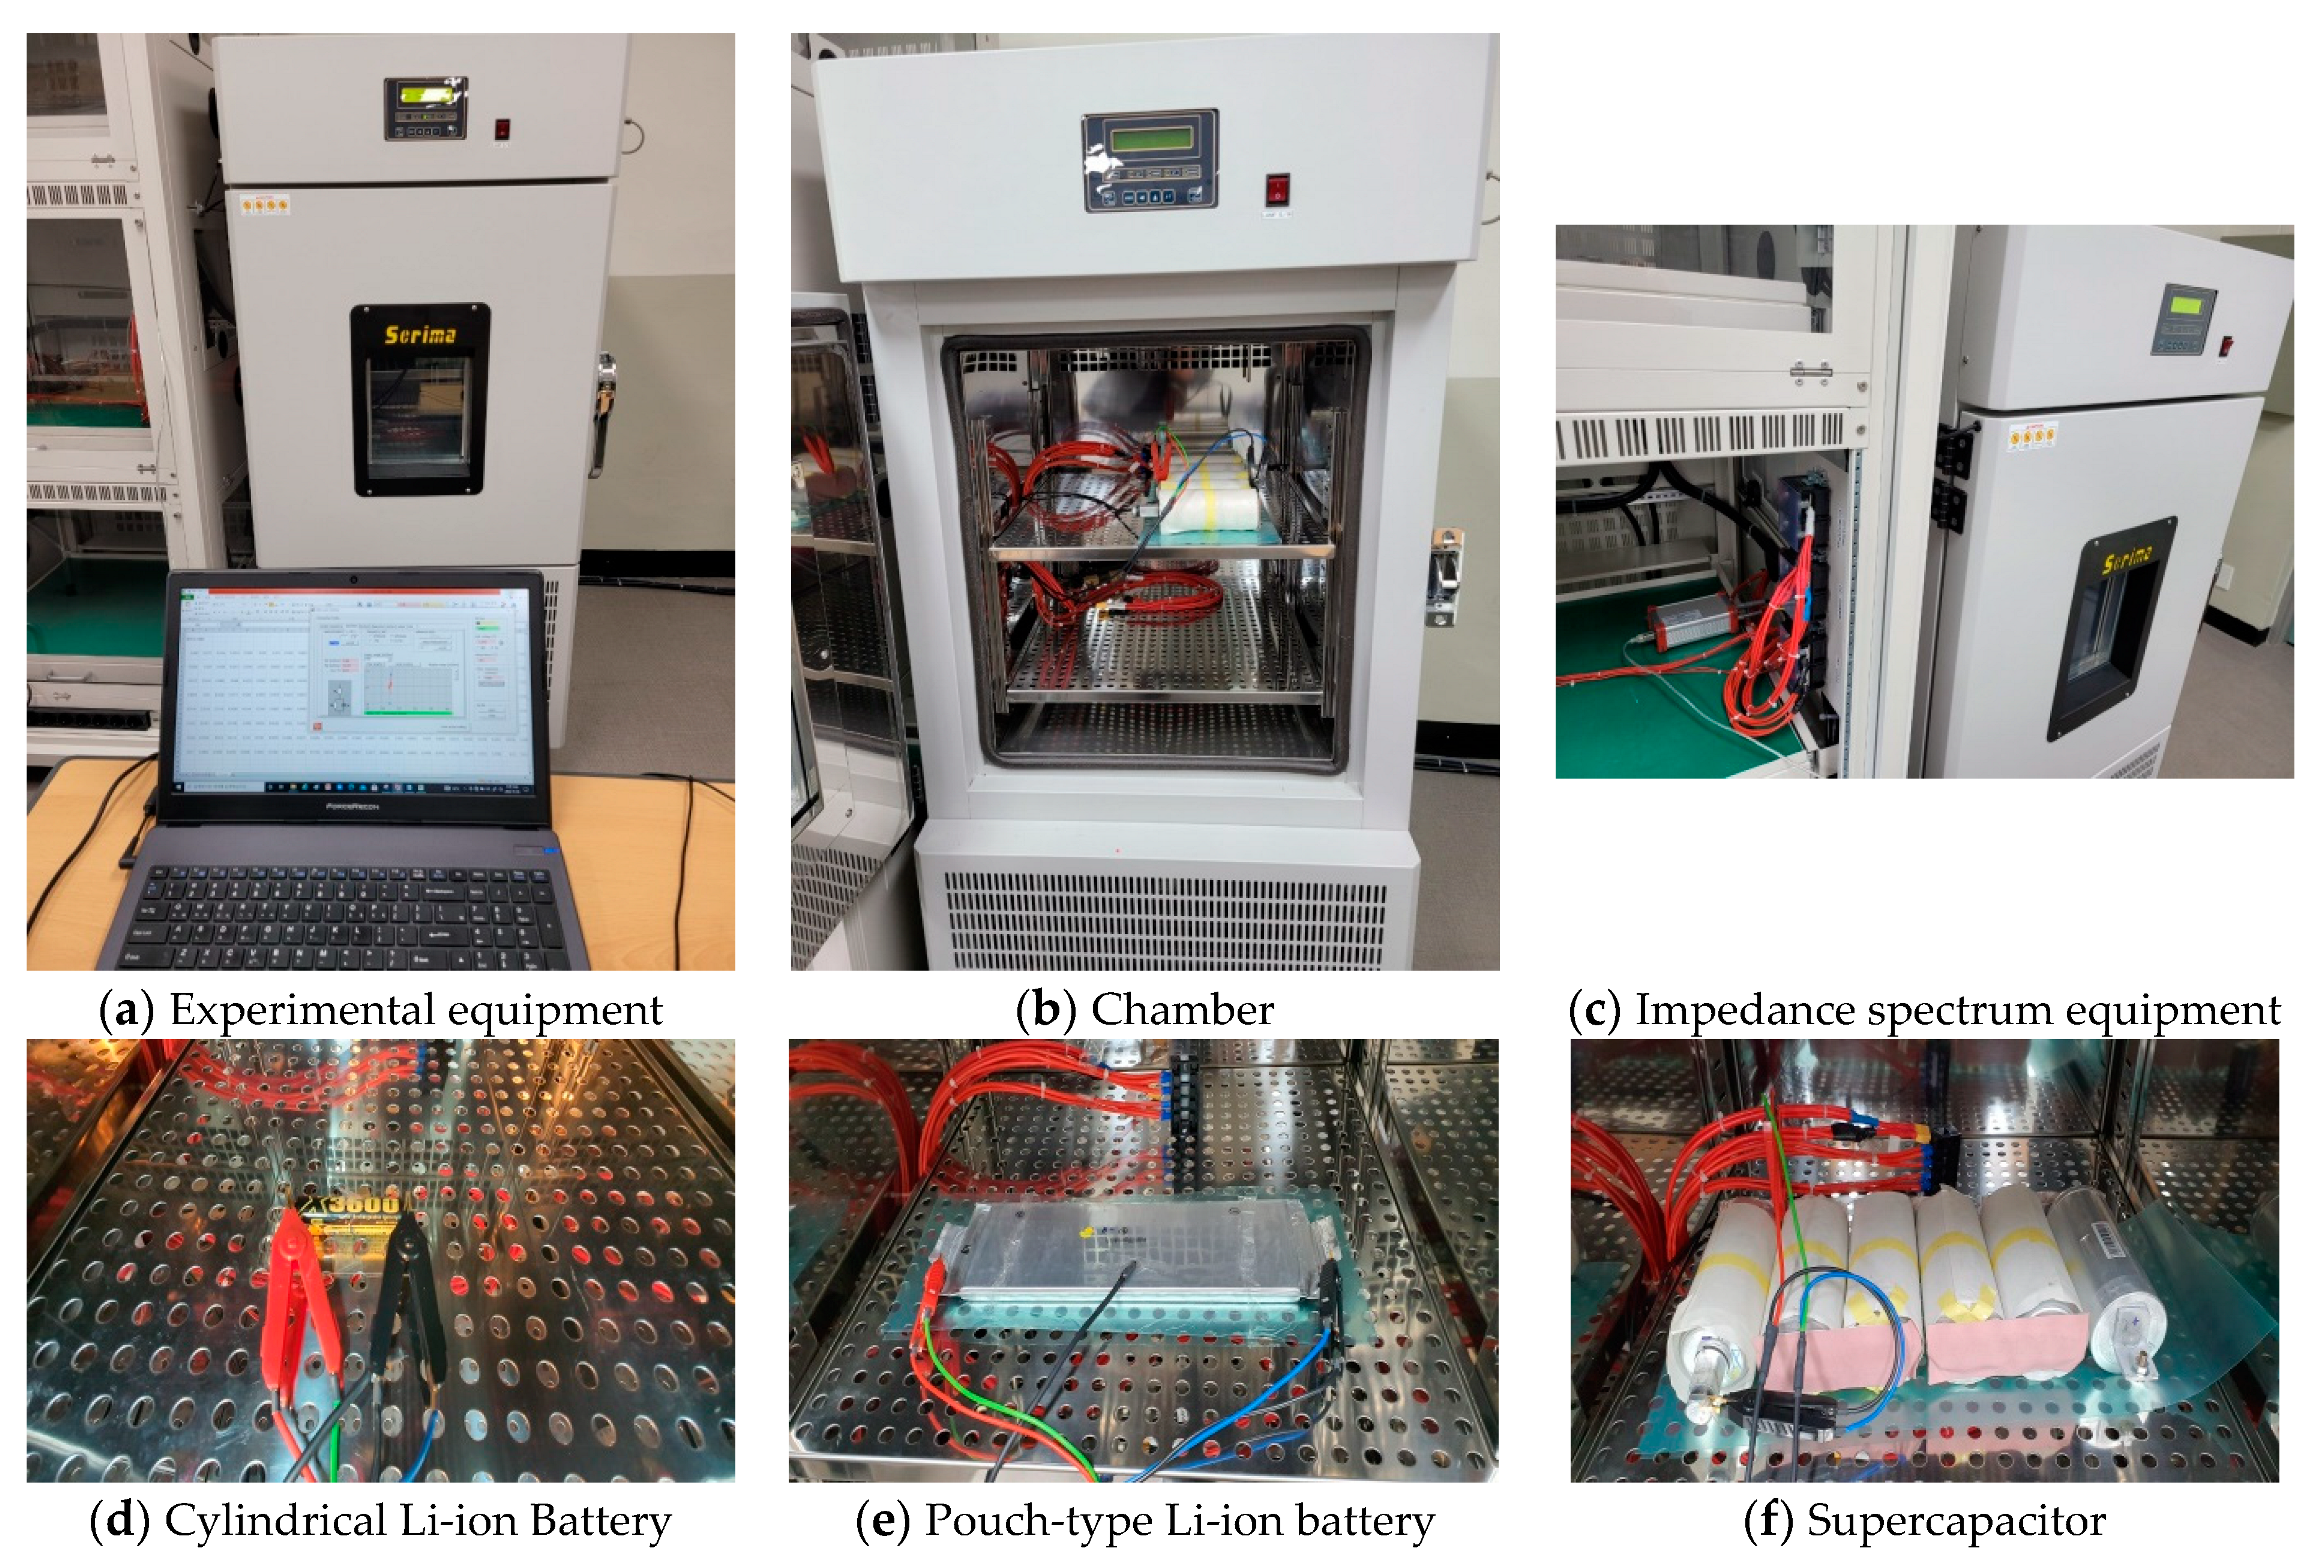
Figure 14 shows the Li-ion batteries and supercapacitor used in the experiments in this study.
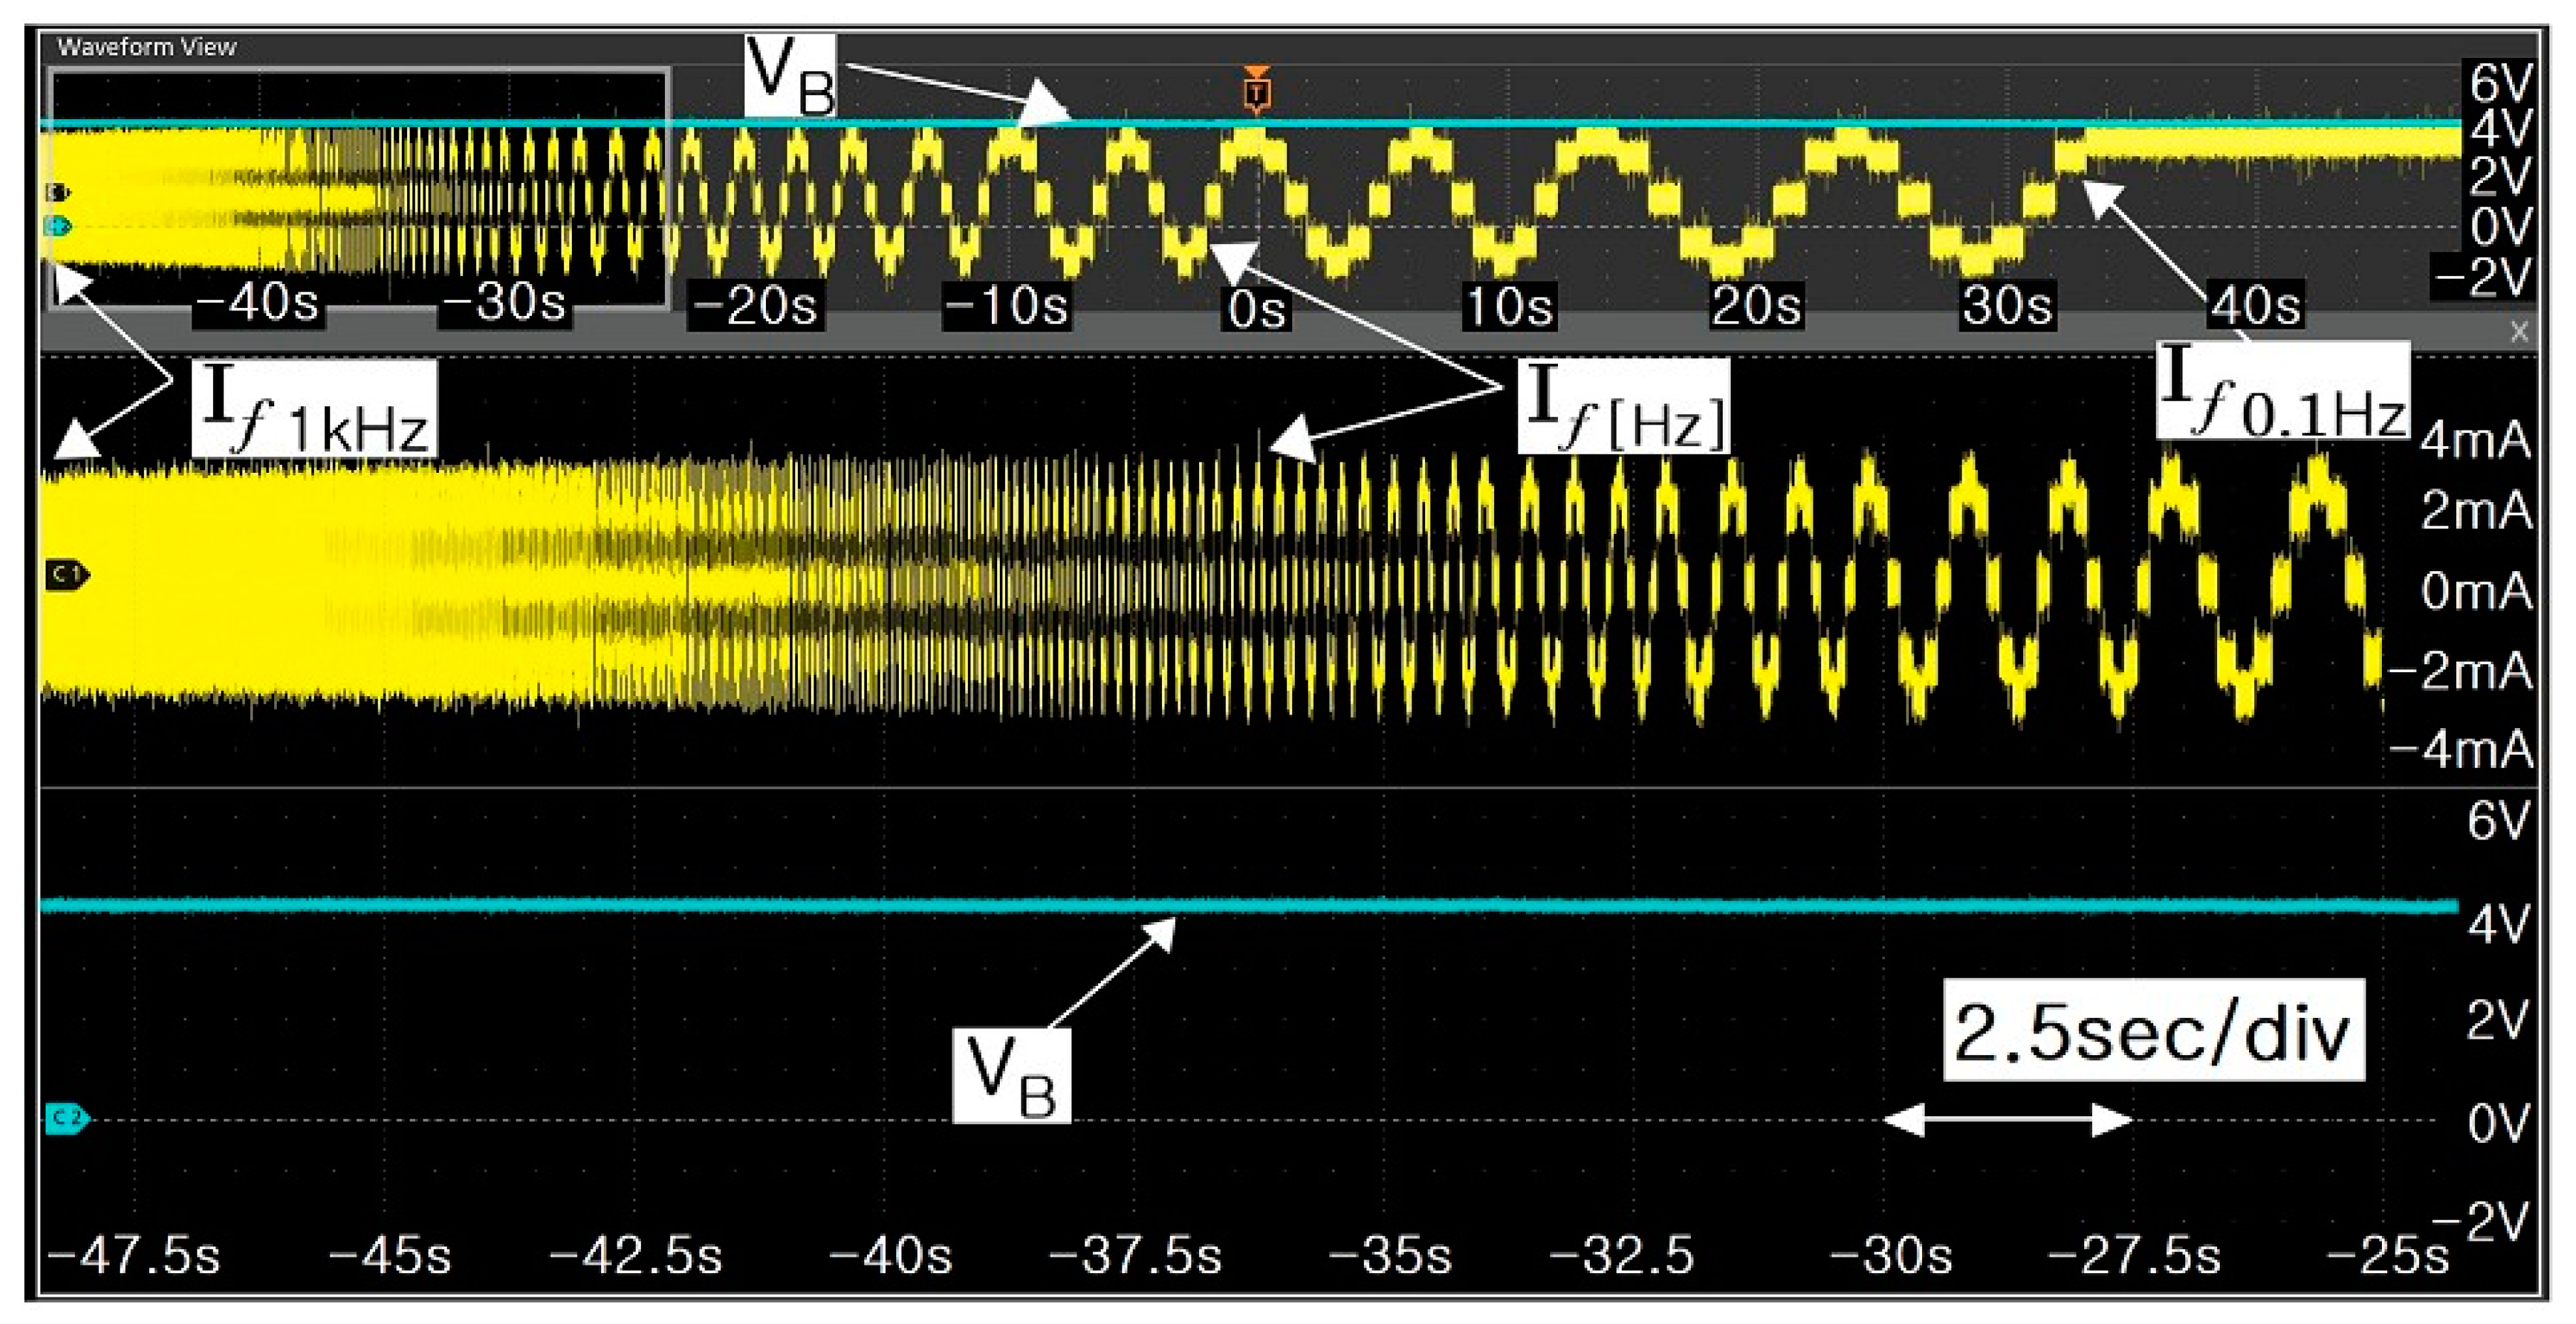
Figure 15 shows the impedance spectrum equipment and the experimental apparatus of the chamber, and Figure 16 shows the voltage and current waveforms obtained when measuring the impedance spectra.
The measurements were made using the battery measuring equipment of BRS Messtechnik GmbH (Strohberg 23, City of Stuttgart, Germany).
When measuring the impedance of the Li-ion batteries and supercapacitor, the impedance was measured while varying the frequency from 1 kHz to 0.1 Hz. The impedance spectra according to the charging and discharging states were measured and compared.
6. Experimental Results
6.1. Impedance Spectra of Cylindrical Li-Ion Batteries
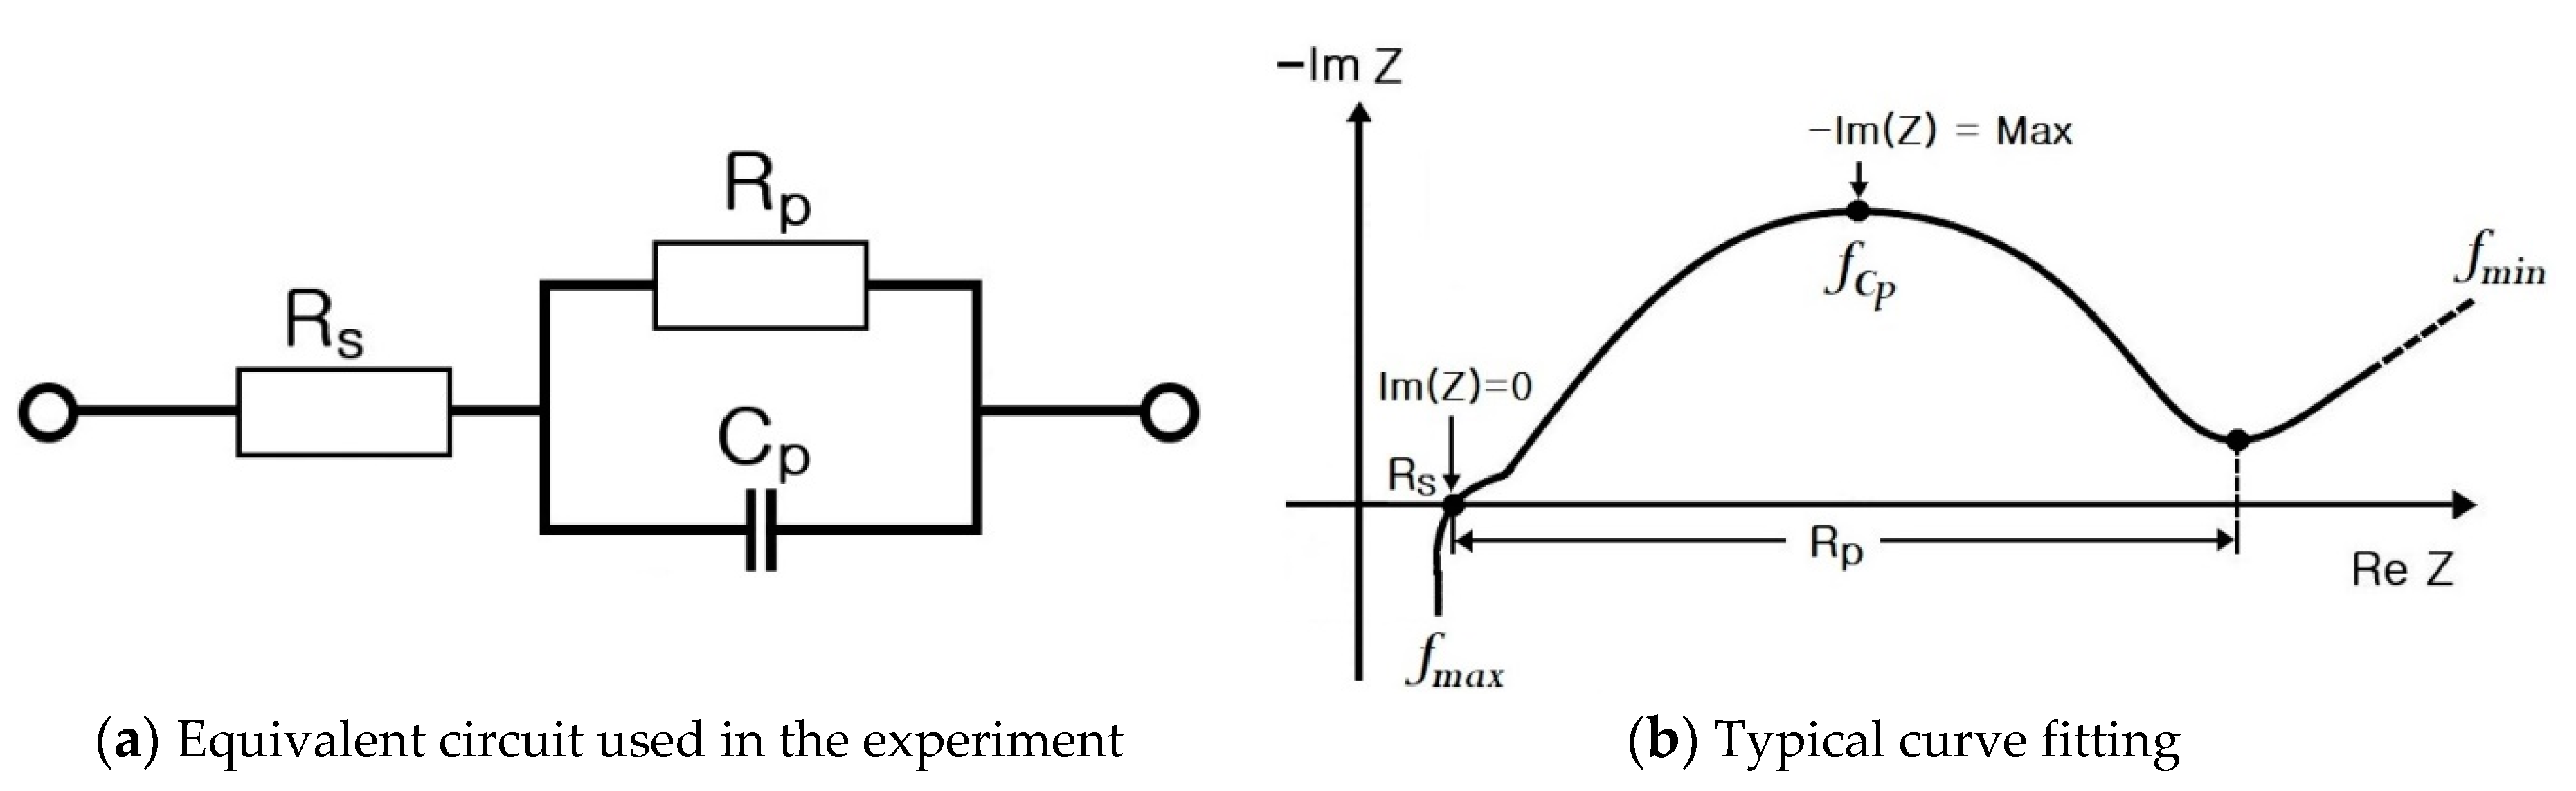
Figure 17 shows the equivalent circuit of the batteries and supercapacitor used herein, as well as the values of , , and . The electrical equivalent circuit can be represented by more precise modeling, for a cylindrical Li-ion battery (Figure 5), a pouch-type Li-ion battery (Figure 8), and a supercapacitor (Figure 10).
However, in this experiment, it was equalized using the Thevenin battery model (Figure 2), and values can be defined as in Figure 17b.
Figure 18 compares the impedance spectra during charging and discharging of the 18650-type cylindrical Li-ion battery without a protective device. As shown in Figure 18a, the cylindrical Li-ion battery is equipped with a circular thermal disc cap, to prevent overvoltage or overcurrent.
The impedance spectrum experiment comprised the following seven steps.
- -
- Step 1: Cylindrical pouch-type Li-ion batteries and supercapacitors were prepared (Figure 14).
- -
- Step 2: A chamber was used to keep the temperature constant at 25 °C. This is because the characteristics of batteries are temperature sensitive (Figure 15).
- -
- Step 3: A sine wave frequency in the range of 1 kHz to 0.1 Hz was injected into the battery, through the impedance spectrum equipment (BRS Ltd.).
- -
- Step 4: The impedance spectrum equipment acquired the following information from a reflected wave of the sinusoidal signal supplied: (1) injection frequency value (f), (2) RMS current value (I), and (3) RMS voltage value (V). The data were analyzed by shifting their frequency from 1 kHz to 0.1 Hz. The above data were graphed by dividing f.
- -
- Step 5: The change in the parameters R, XL, XC, L, and C of the battery, with the battery frequency, was obtained from the following expressions:
and satisfy Ohm’s law for the AC circuit model. Therefore, the impedance can be expressed as [38]:
can be simplified using Euler’s formula,
By dividing the above equation into real and imaginary parts, the following equation can be obtained [38]:
- -
- Step 6: The values of R, XL, XC, L, and C, at frequencies from 1 kHz to 0.1 Hz, were determined, and graphs were drawn using the data.
- -
- Step 7: RS, RP, and CP are shown in Figure 17 and measured on the basis of the above data. Thus, the results in Figure 18, Figure 19, Figure 20, Figure 21, Figure 22, Figure 23 and Figure 24 are experimental data, obtained by injecting a sine wave into a real battery, and based on the injection frequency, RMS current value (I), and RMS voltage value (V). In Figure 18, Figure 19, Figure 20, Figure 21, Figure 22, Figure 23 and Figure 24, the units of the x-axis and y-axis are mΩ.
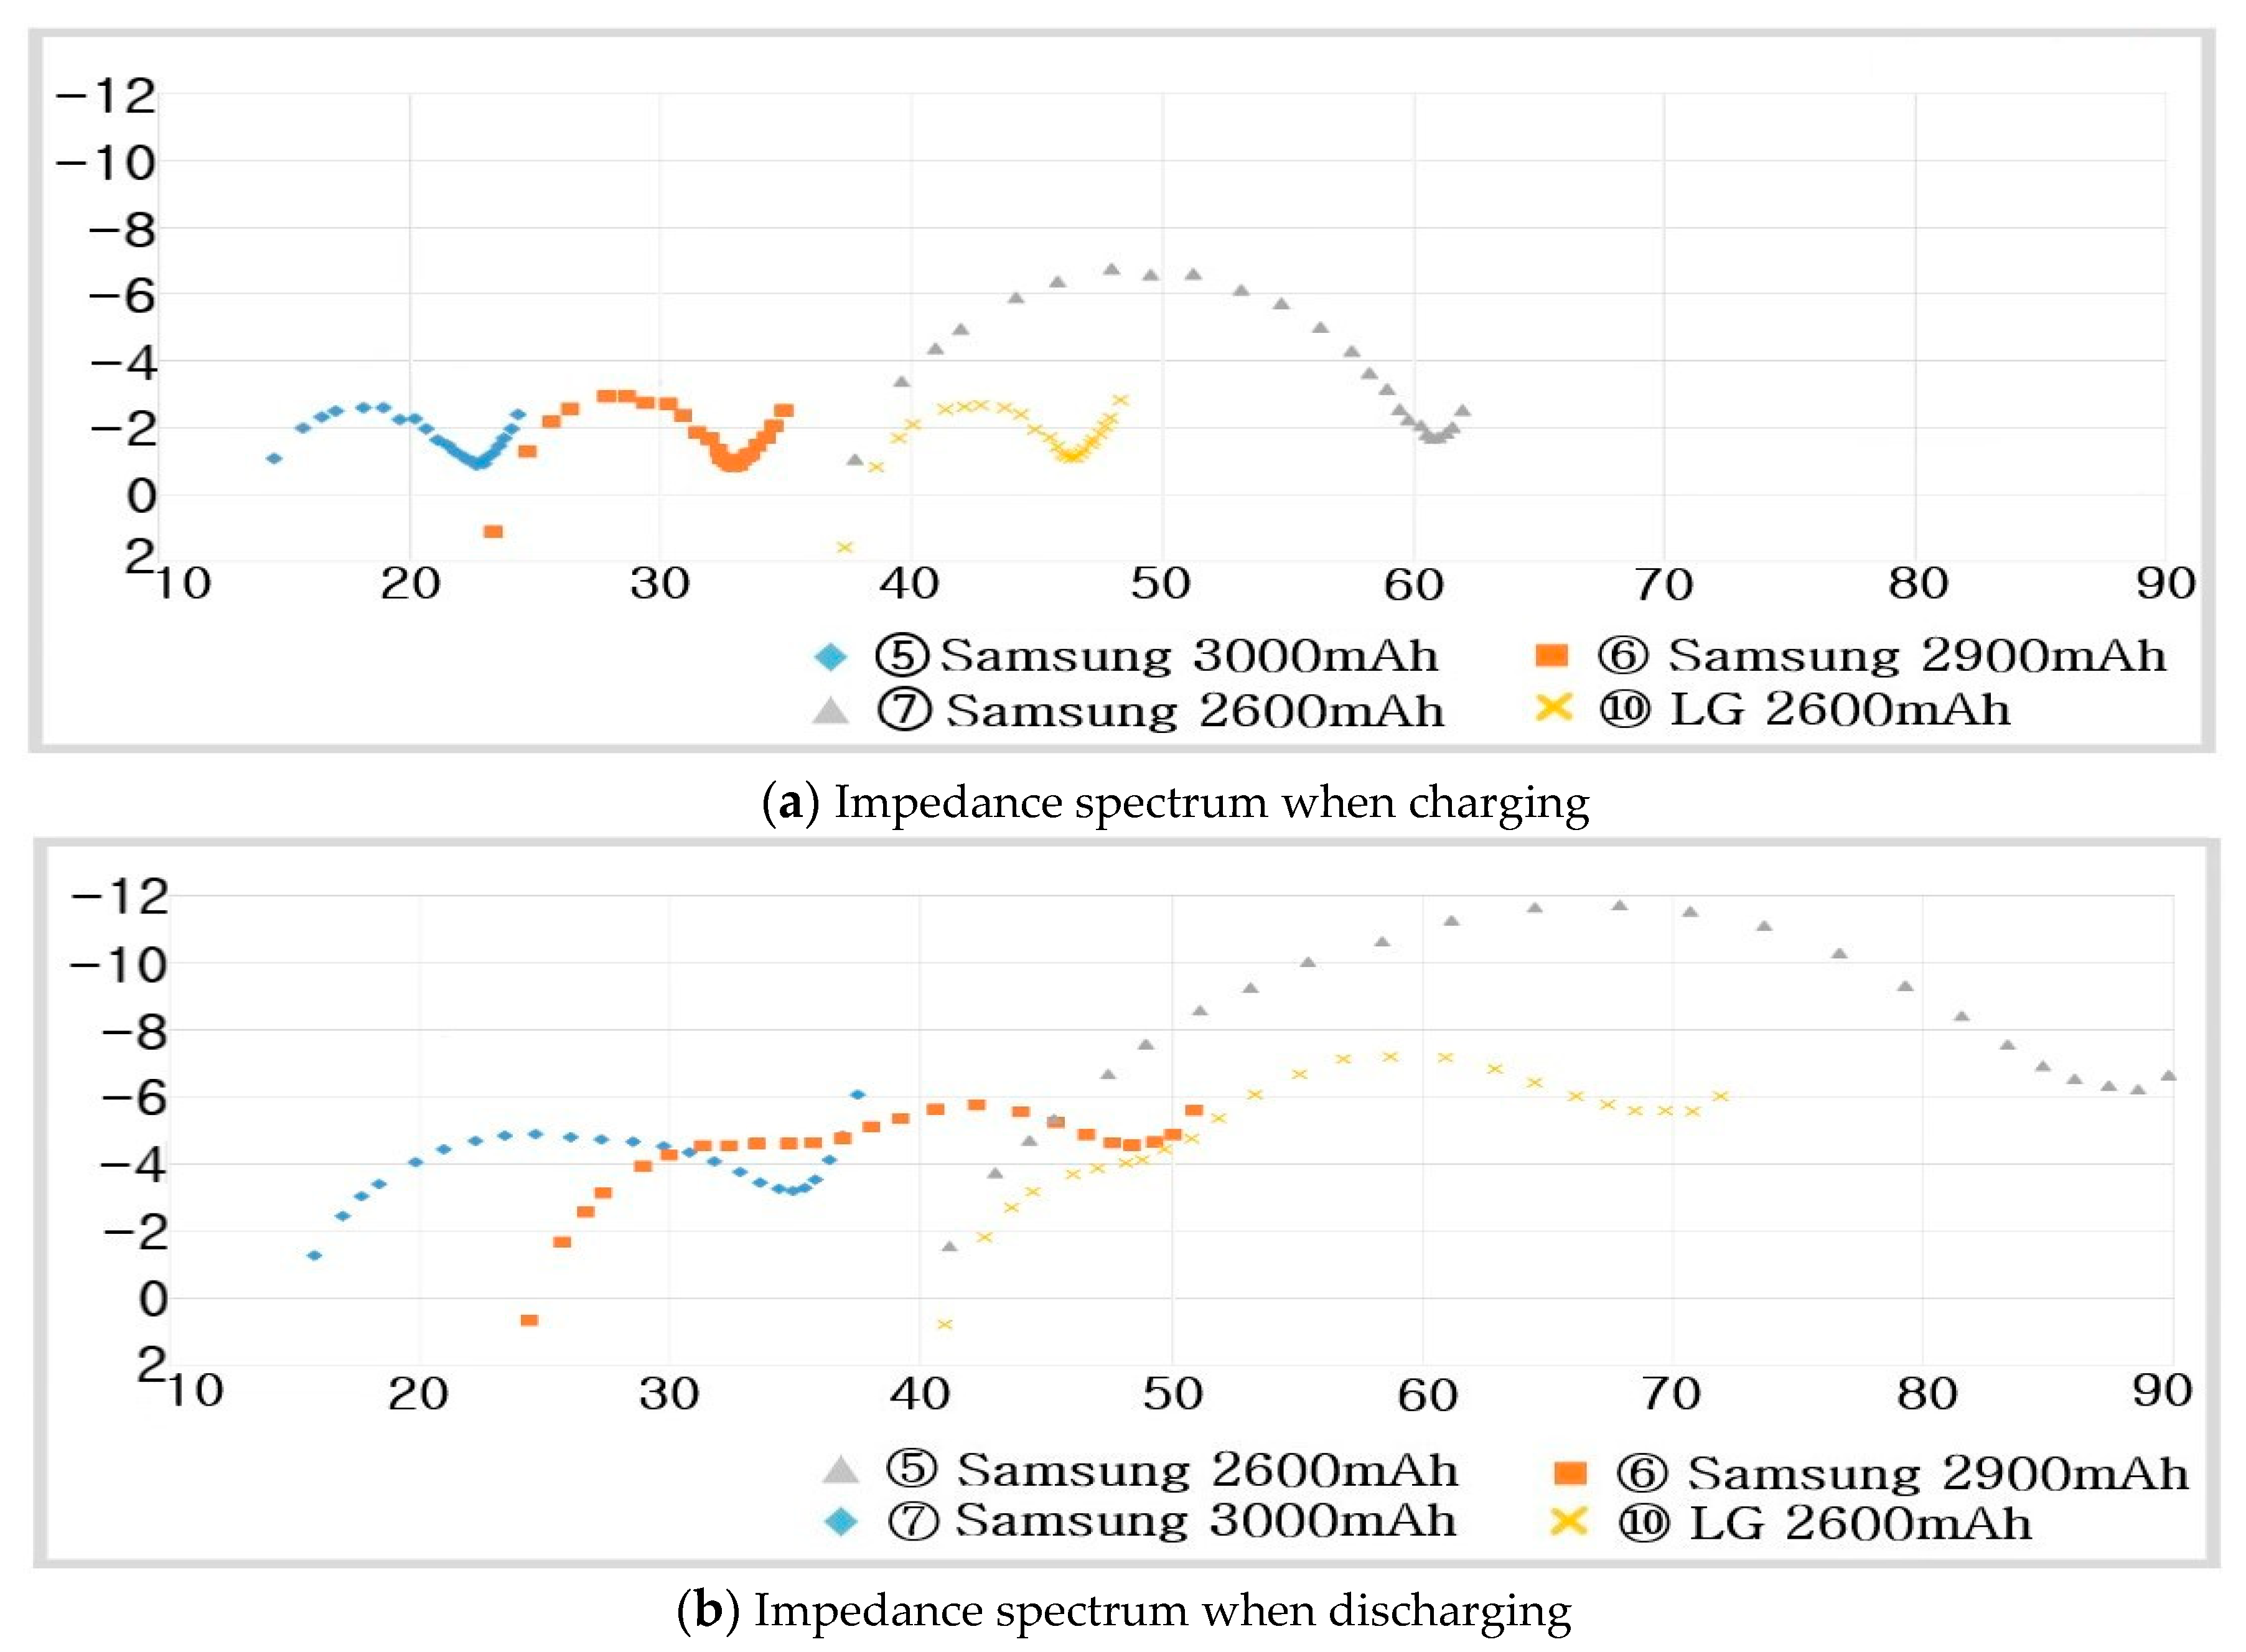
When such a protection device does not exist, the battery series impedance, 14–18 mΩ, represents a relatively low resistance value during charging. The experimental result in Figure 18 show that the RS value was small when the capacity of the cylindrical Li-ion battery was large, and vice versa.
The battery equivalent series resistance (RS) values of the 18650-type cylindrical Li-ion batteries, without the protection device, during charging are as follows:
- -
- ⑤ Samsung :
- -
- ⑥ Samsung :
- -
- ⑦ Samsung :
- -
- ⑩ LG :
Even for the Li-ion batteries with the same capacity, i.e., Samsung (⑦) and LG (⑩), the parallel impedance () and parallel capacitance () differ as follows:
- -
- ⑦ Samsung :
- -
- ⑩ LG :
For the 18650-type cylindrical Li-ion batteries without a protection element, a semicircle graph appears, due to the oxidation and reduction reactions of Li ions, and Li-ion batteries with smaller graphs exhibit better performances. Therefore, it can be predicted that the Samsung (⑦) Li-ion battery, with a smaller semicircle, will exhibit better performance than the LG (⑩) Li-ion battery, with a larger semicircle.
Figure 18b displays the impedance spectrum of a 18650-type cylindrical Li-ion battery without a protection element during discharge. The figure shows that the impedance of the battery increases as the battery discharges.
During discharge, the resistance increases, due to the oxidation and reduction reactions of Li ions, and the values during the discharge are as follows.
- -
- ⑤ Samsung :
- -
- ⑥ Samsung :
- -
- ⑦ Samsung :
- -
- ⑩ LG :
The increase in the resistance value during the discharge of the battery can be explained by an increase in factors impeding the charge transfer in a Li-ion battery.
Comparing the Li-ion batteries of the same capacity, i.e., Samsung (⑦) and LG (⑩), the Samsung (⑦) battery with relatively small and has smaller battery impedance than the LG battery (⑩). The smaller the Li ion oxidation and reduction reactions, the better the exhibited properties.
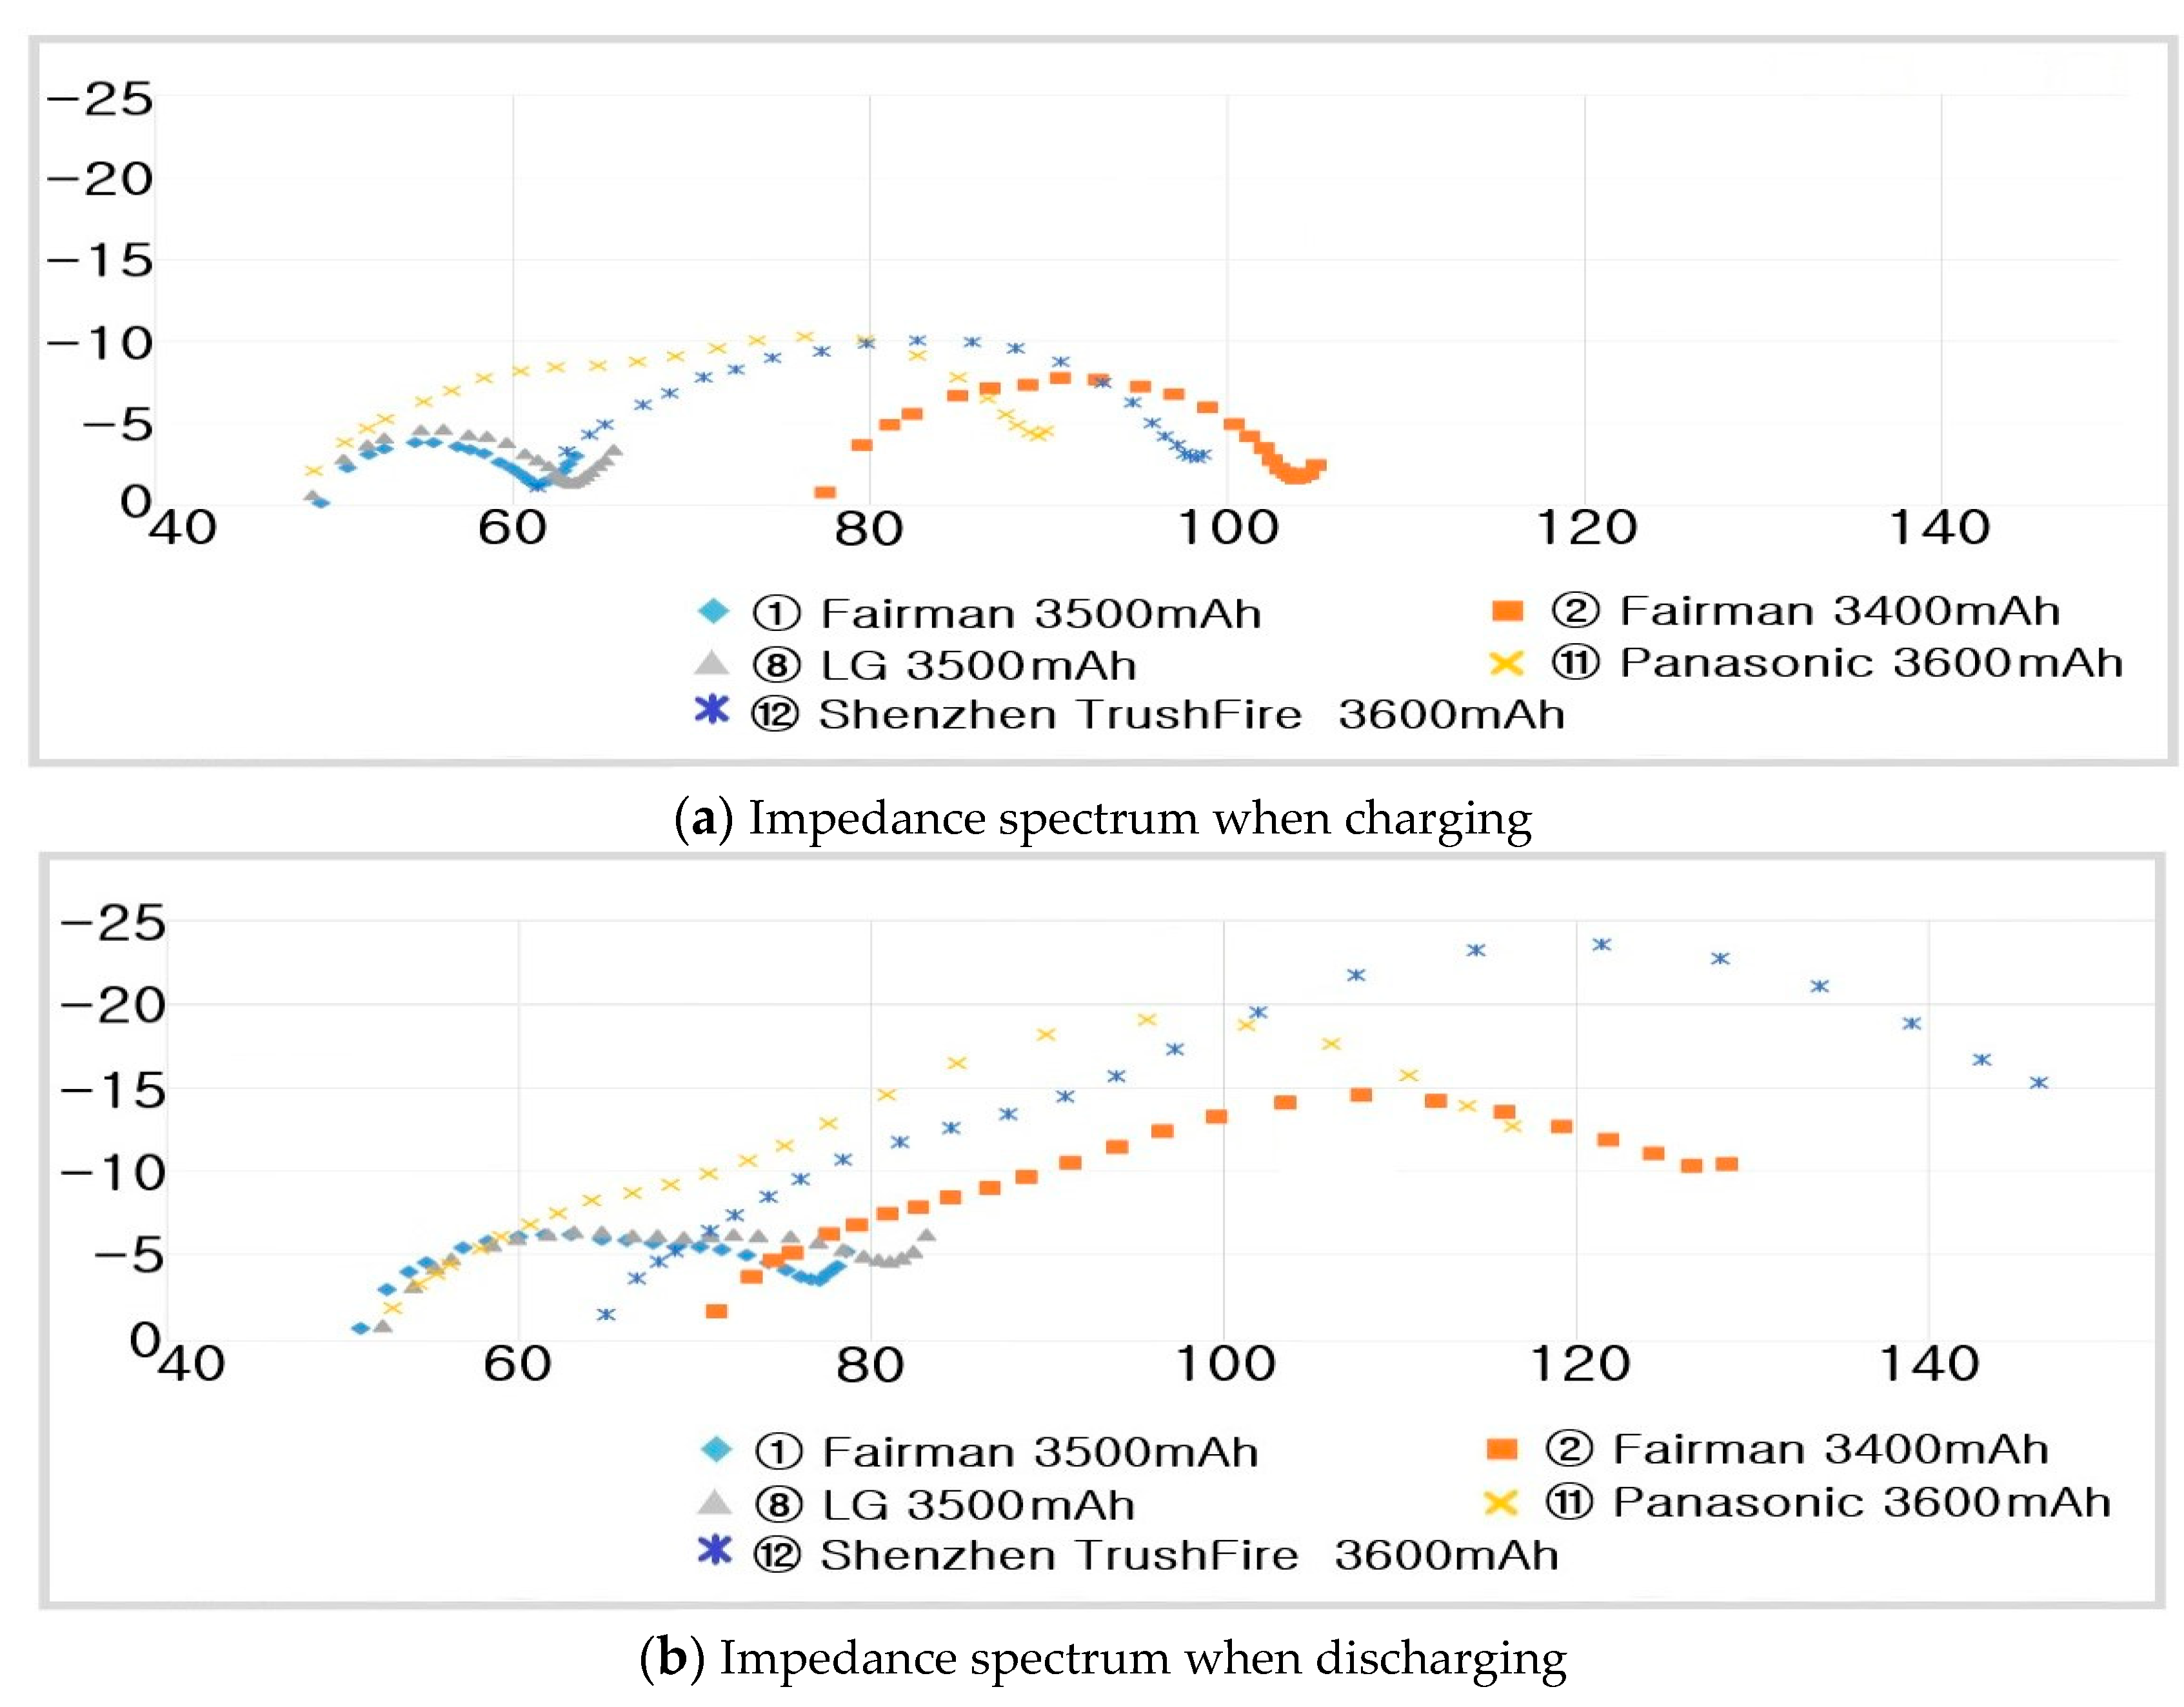
Figure 19 compares the impedance spectra of charging and discharging of the 18650-type cylindrical 3400–3600 Li-ion batteries equipped with protection devices. As shown in Figure 18, the of the 18650-type Li-ion batteries without the protection device are in the range of 15–38. As shown in Figure 19, the RS of 18650-type Li-ion batteries with the protection device are in the range of 48–105.
The use of a protective device (thermal disc cap) for preventing overvoltage or overcurrent is a major cause of the increase in above the minimum of 33.
Deciding the best battery among the various 18650-type cylindrical Li-ion batteries is essential. A battery with a relatively small and affords the best charge transfer characteristics during charging and discharging. A battery with a small exhibits reduced oxidation and reduction reactions of Li ions when discharging.
As shown in Figure 19a, the values of the 18650-type cylindrical Li-ion batteries with the protection device during charging are as follows.
- -
- ⑧ LG :
- -
- ⑪ Panasonic :
- -
- ① Fairman :
- -
- ⑫ Shenzhen TrushFire :
- -
- ② Fairman :
For the 3400–3600 18650-type Li-ion batteries with a protection device, the LG (⑧), Panasonic (⑪), and Fairman (①) batteries exhibited similar values.
For the Shenzhen TrushFire (⑫) and Fairman (②) batteries, the values were relatively large, 61 and 77, respectively; thus, it can be predicted that the battery characteristics are somewhat deteriorated.
As shown in Figure 19a, for the Fairman (①), LG (⑧), and Panasonic (⑪) batteries with similar values, the values at each charge are as follows.
- -
- ⑧ LG :
- -
- ⑪ Panasonic :
- -
- ① Fairman :
Therefore, the Fairman (①) battery, with the smallest , exhibited the best charge transfer characteristics during charging.
As shown in Figure 19b, the and values of the 18650-type cylindrical Li-ion batteries with a protection device during discharge are as follows:
- -
- ⑧ LG :
- -
- ⑪ Panasonic :
- -
- ① Fairman :
- -
- ⑫ Shenzhen TrushFire :
- -
- ② Fairman :
Even during discharging, the Fairman (①) battery exhibited the smallest value; thus, it had the best charge transfer characteristics even during discharging. Additionally, the Fairman (①) battery had the smallest value, of 6.1474; therefore, the oxidation and reduction reactions of the Li-ion battery will be reduced.
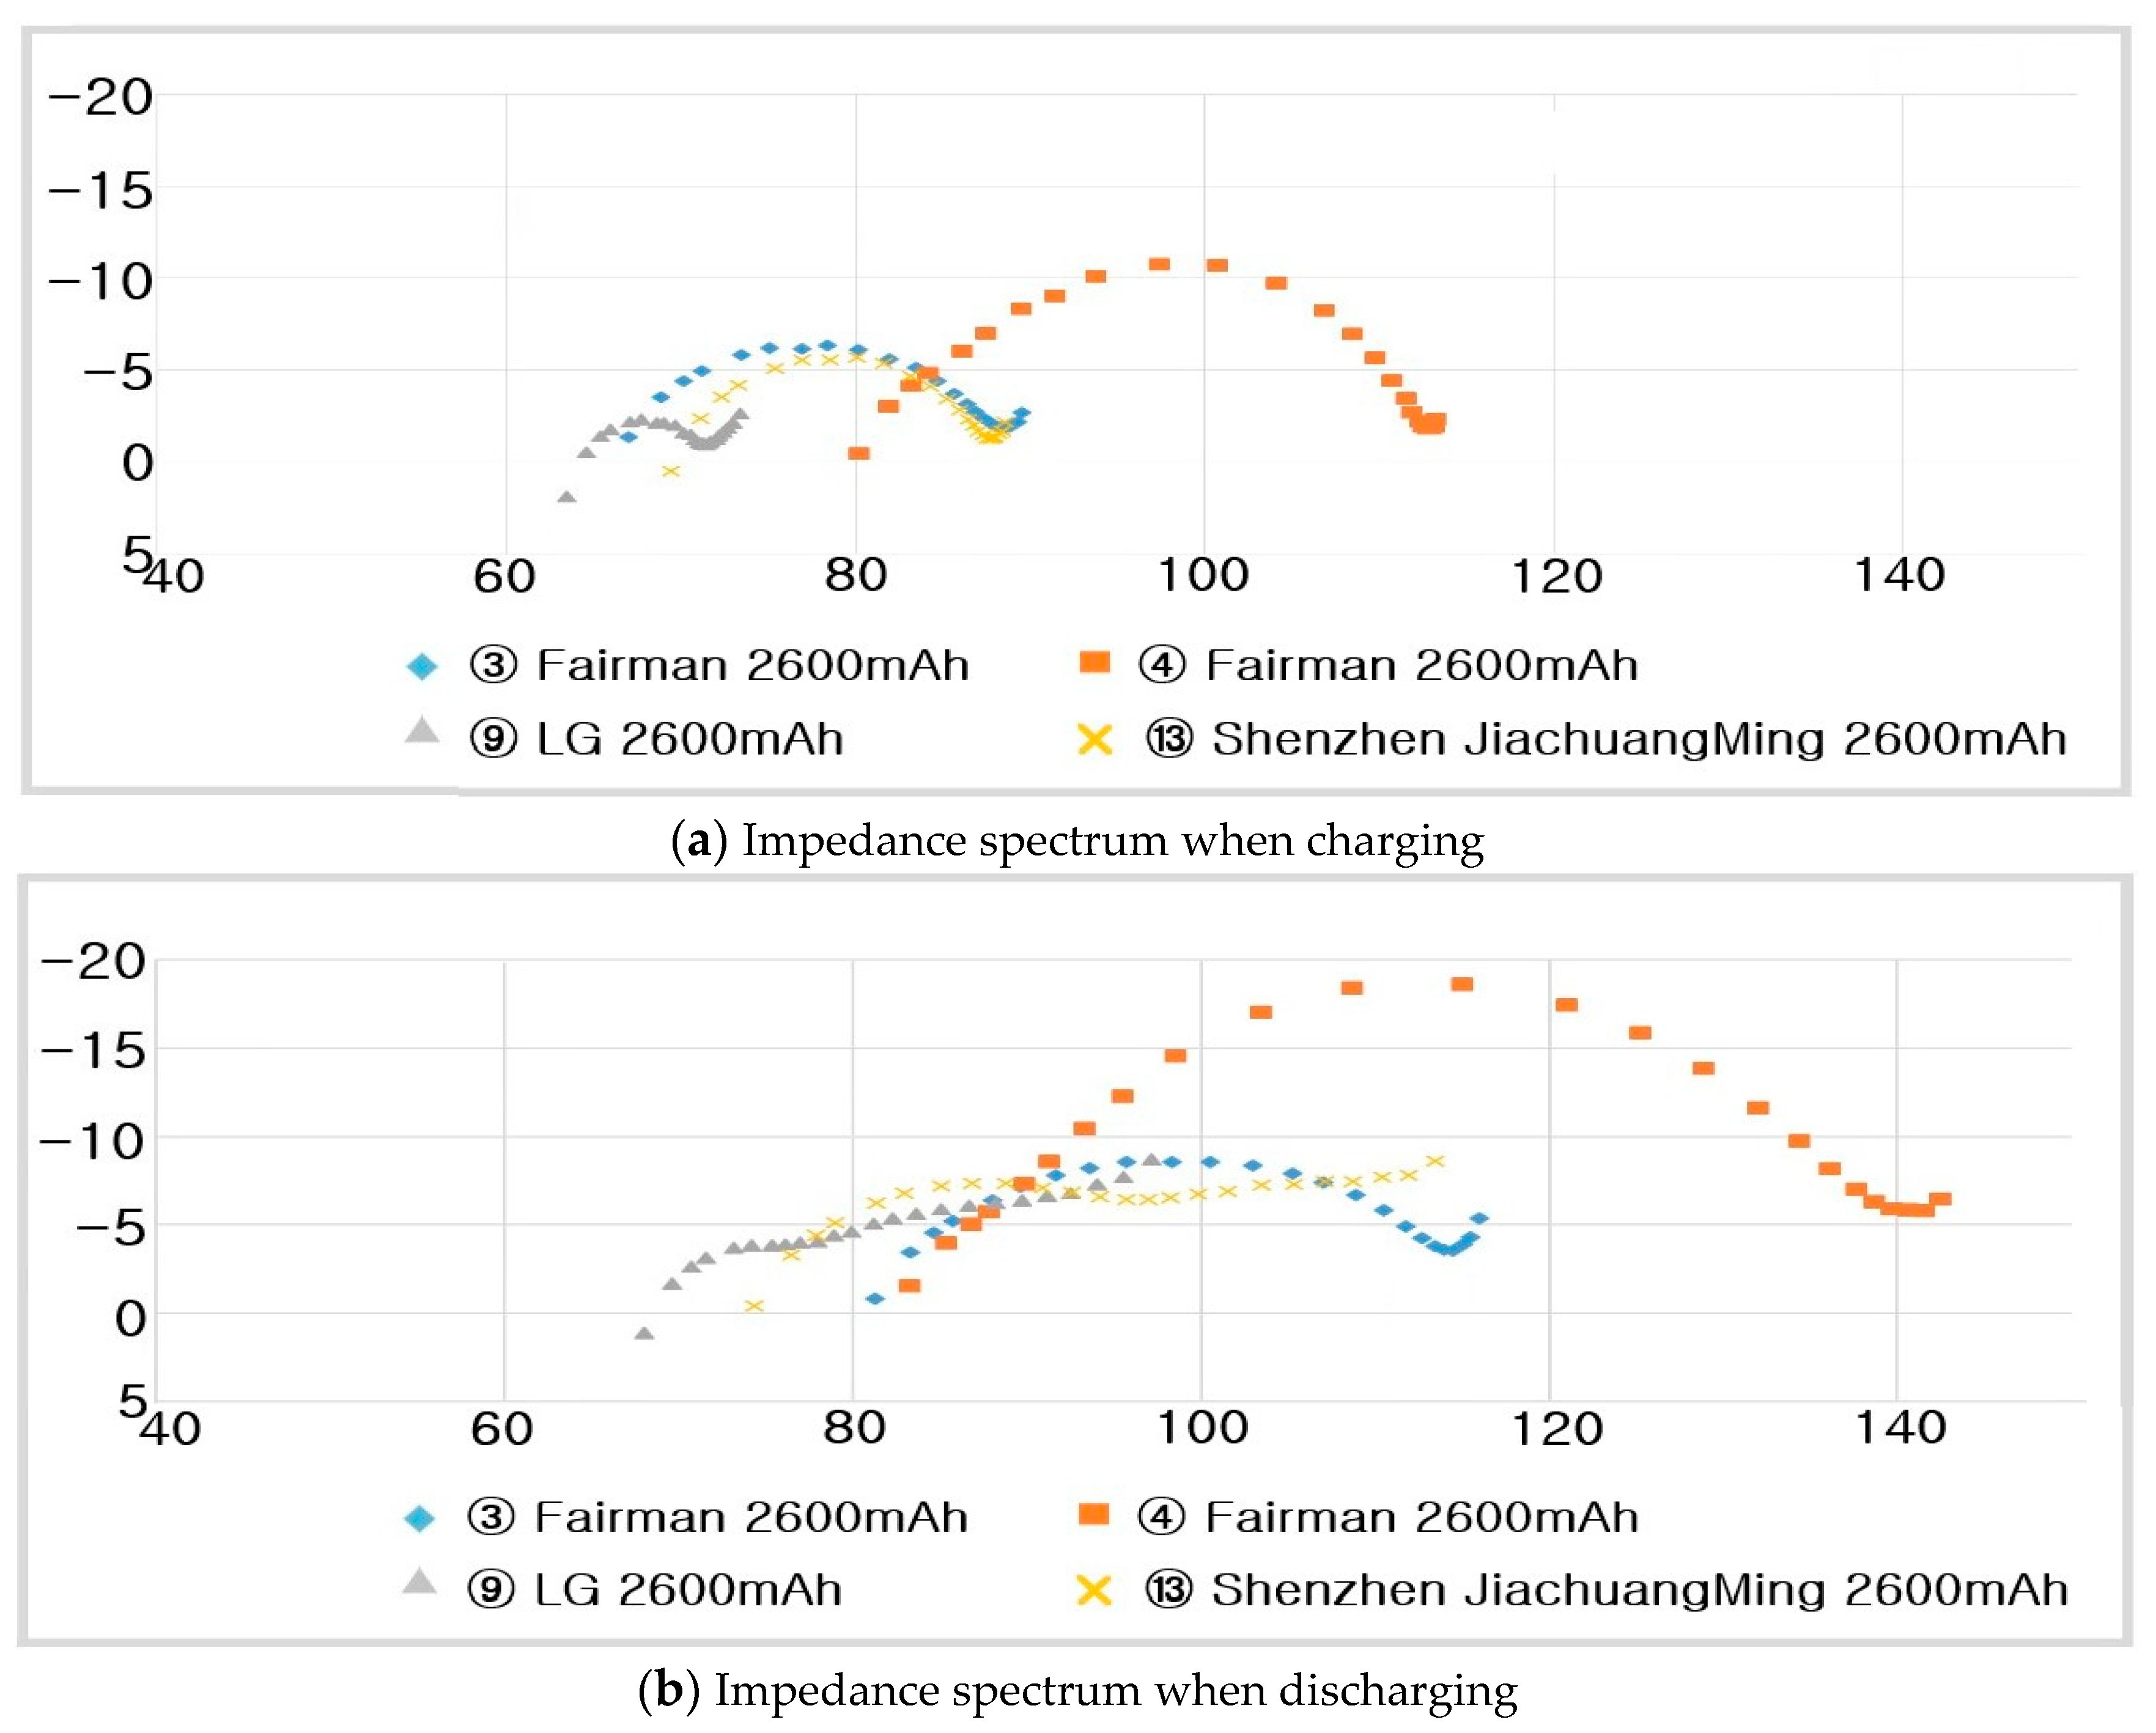
Figure 20 compares the impedance spectra during charging and discharging of 2600 18650-type cylindrical Li-ion batteries with a protection device. As shown in Figure 20a, the values of the 18650-type cylindrical Li-ion batteries with a protection device during charging are as follows:
- -
- ⑨ LG :
- -
- ③ Fairman :
- -
- ④ Fairman :
- -
- ⑬ Shenzhen JiaChuangMing :
Figure 20 experimentally shows that the LG(⑨) battery exhibited the lowest , , and values during charging. Therefore, it is predicted that the LG(⑨) battery has a small impedance when charging, and has excellent oxidation and reduction reactions.
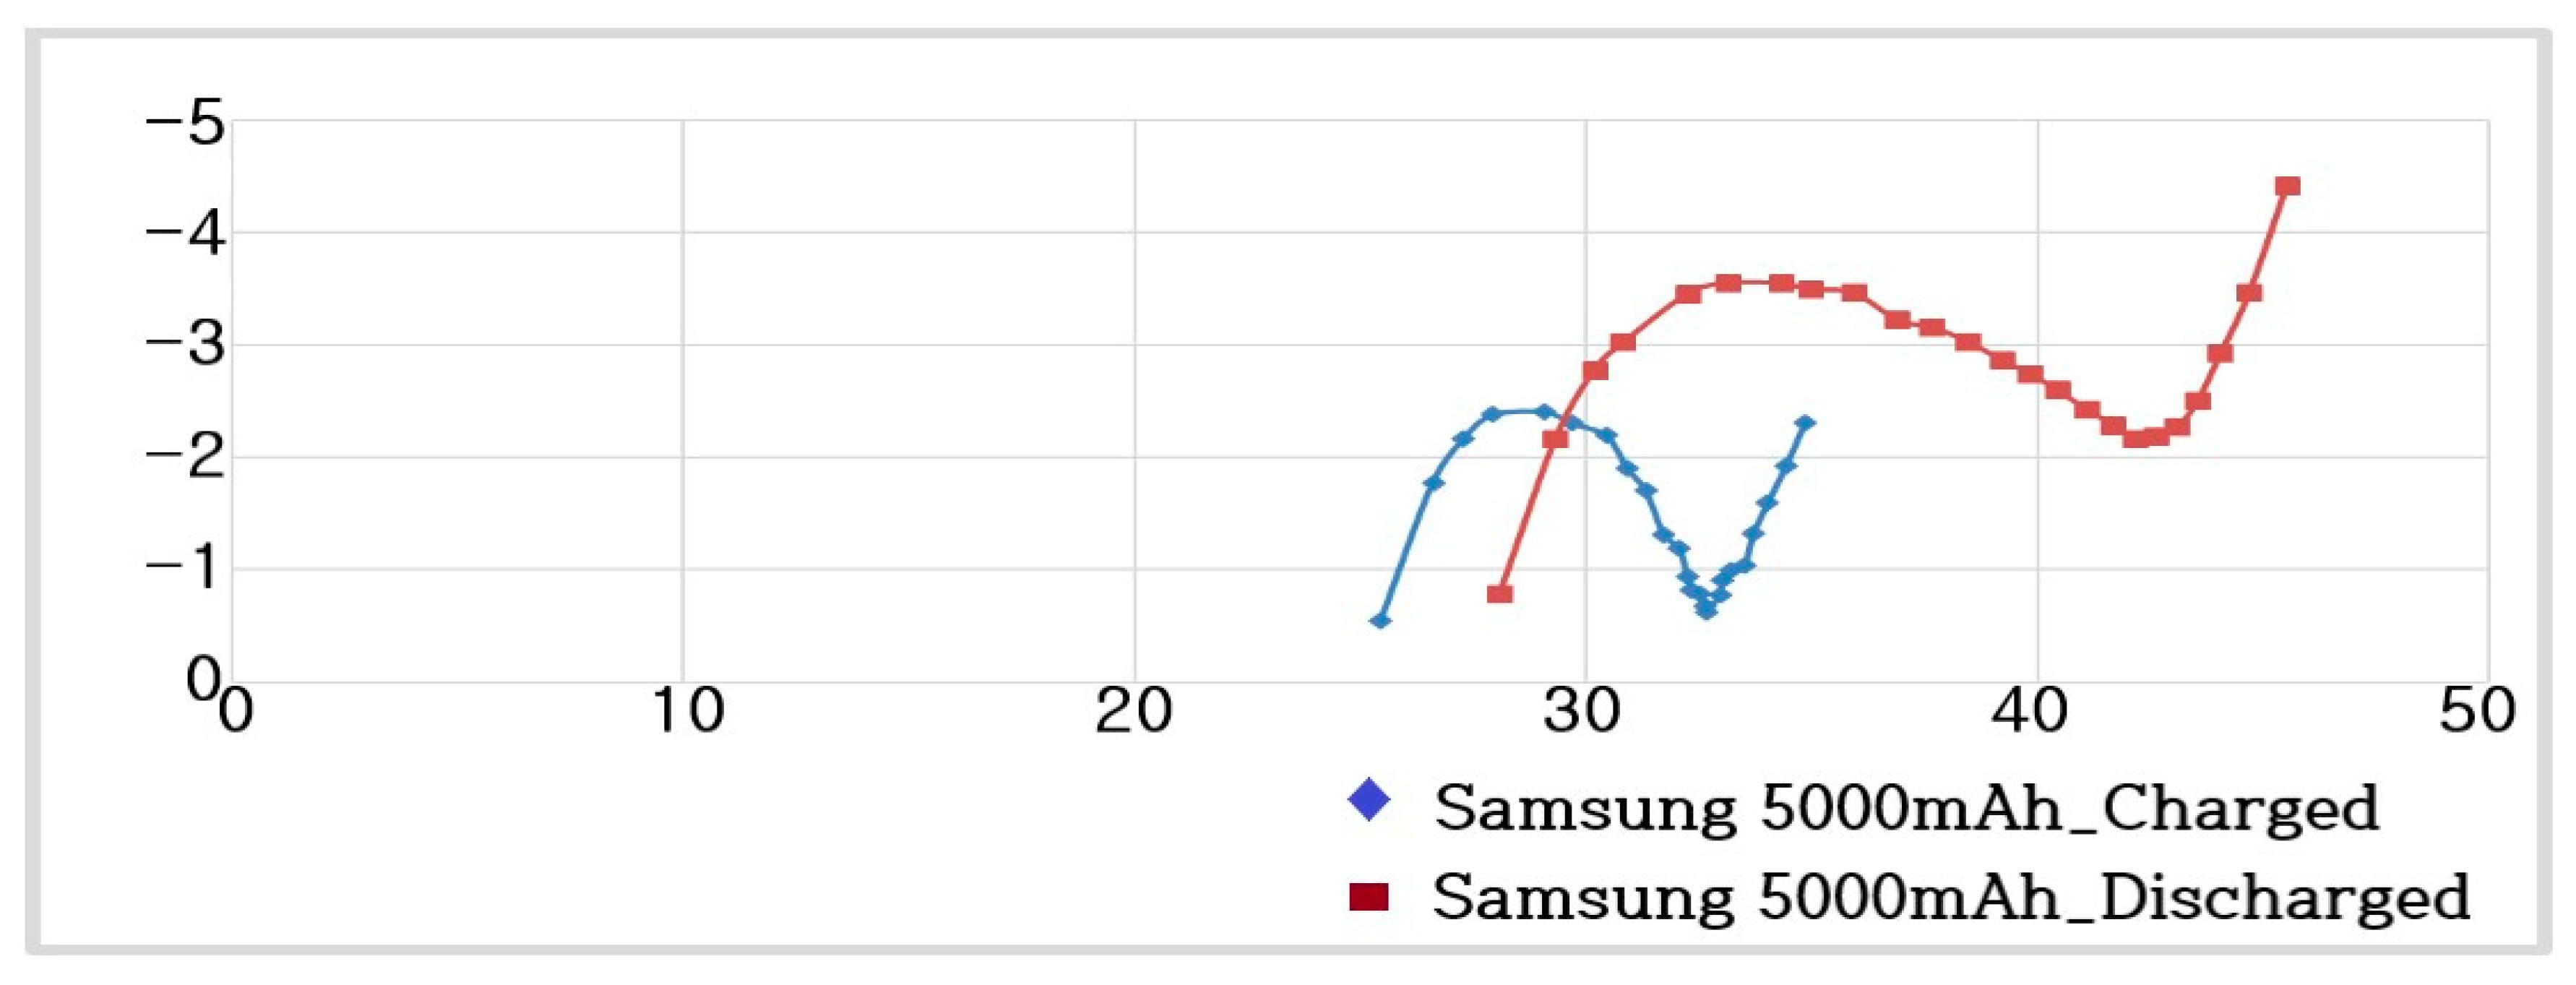
Figure 21 shows the impedance spectra of a 21700-type Li-ion battery with a protection device. The , , and values for the battery capacity during charging and discharging are as follows:
- -
- (Charging) Samsung :
- -
- (Discharging) Samsung :
Figure 21 displays the value of the 21700-type Li-ion battery with protection device during discharging. In the figure, the and values increase overall. This denotes that the overall impedance of the battery increases and the oxidation and reduction reactions of Li ions increase.
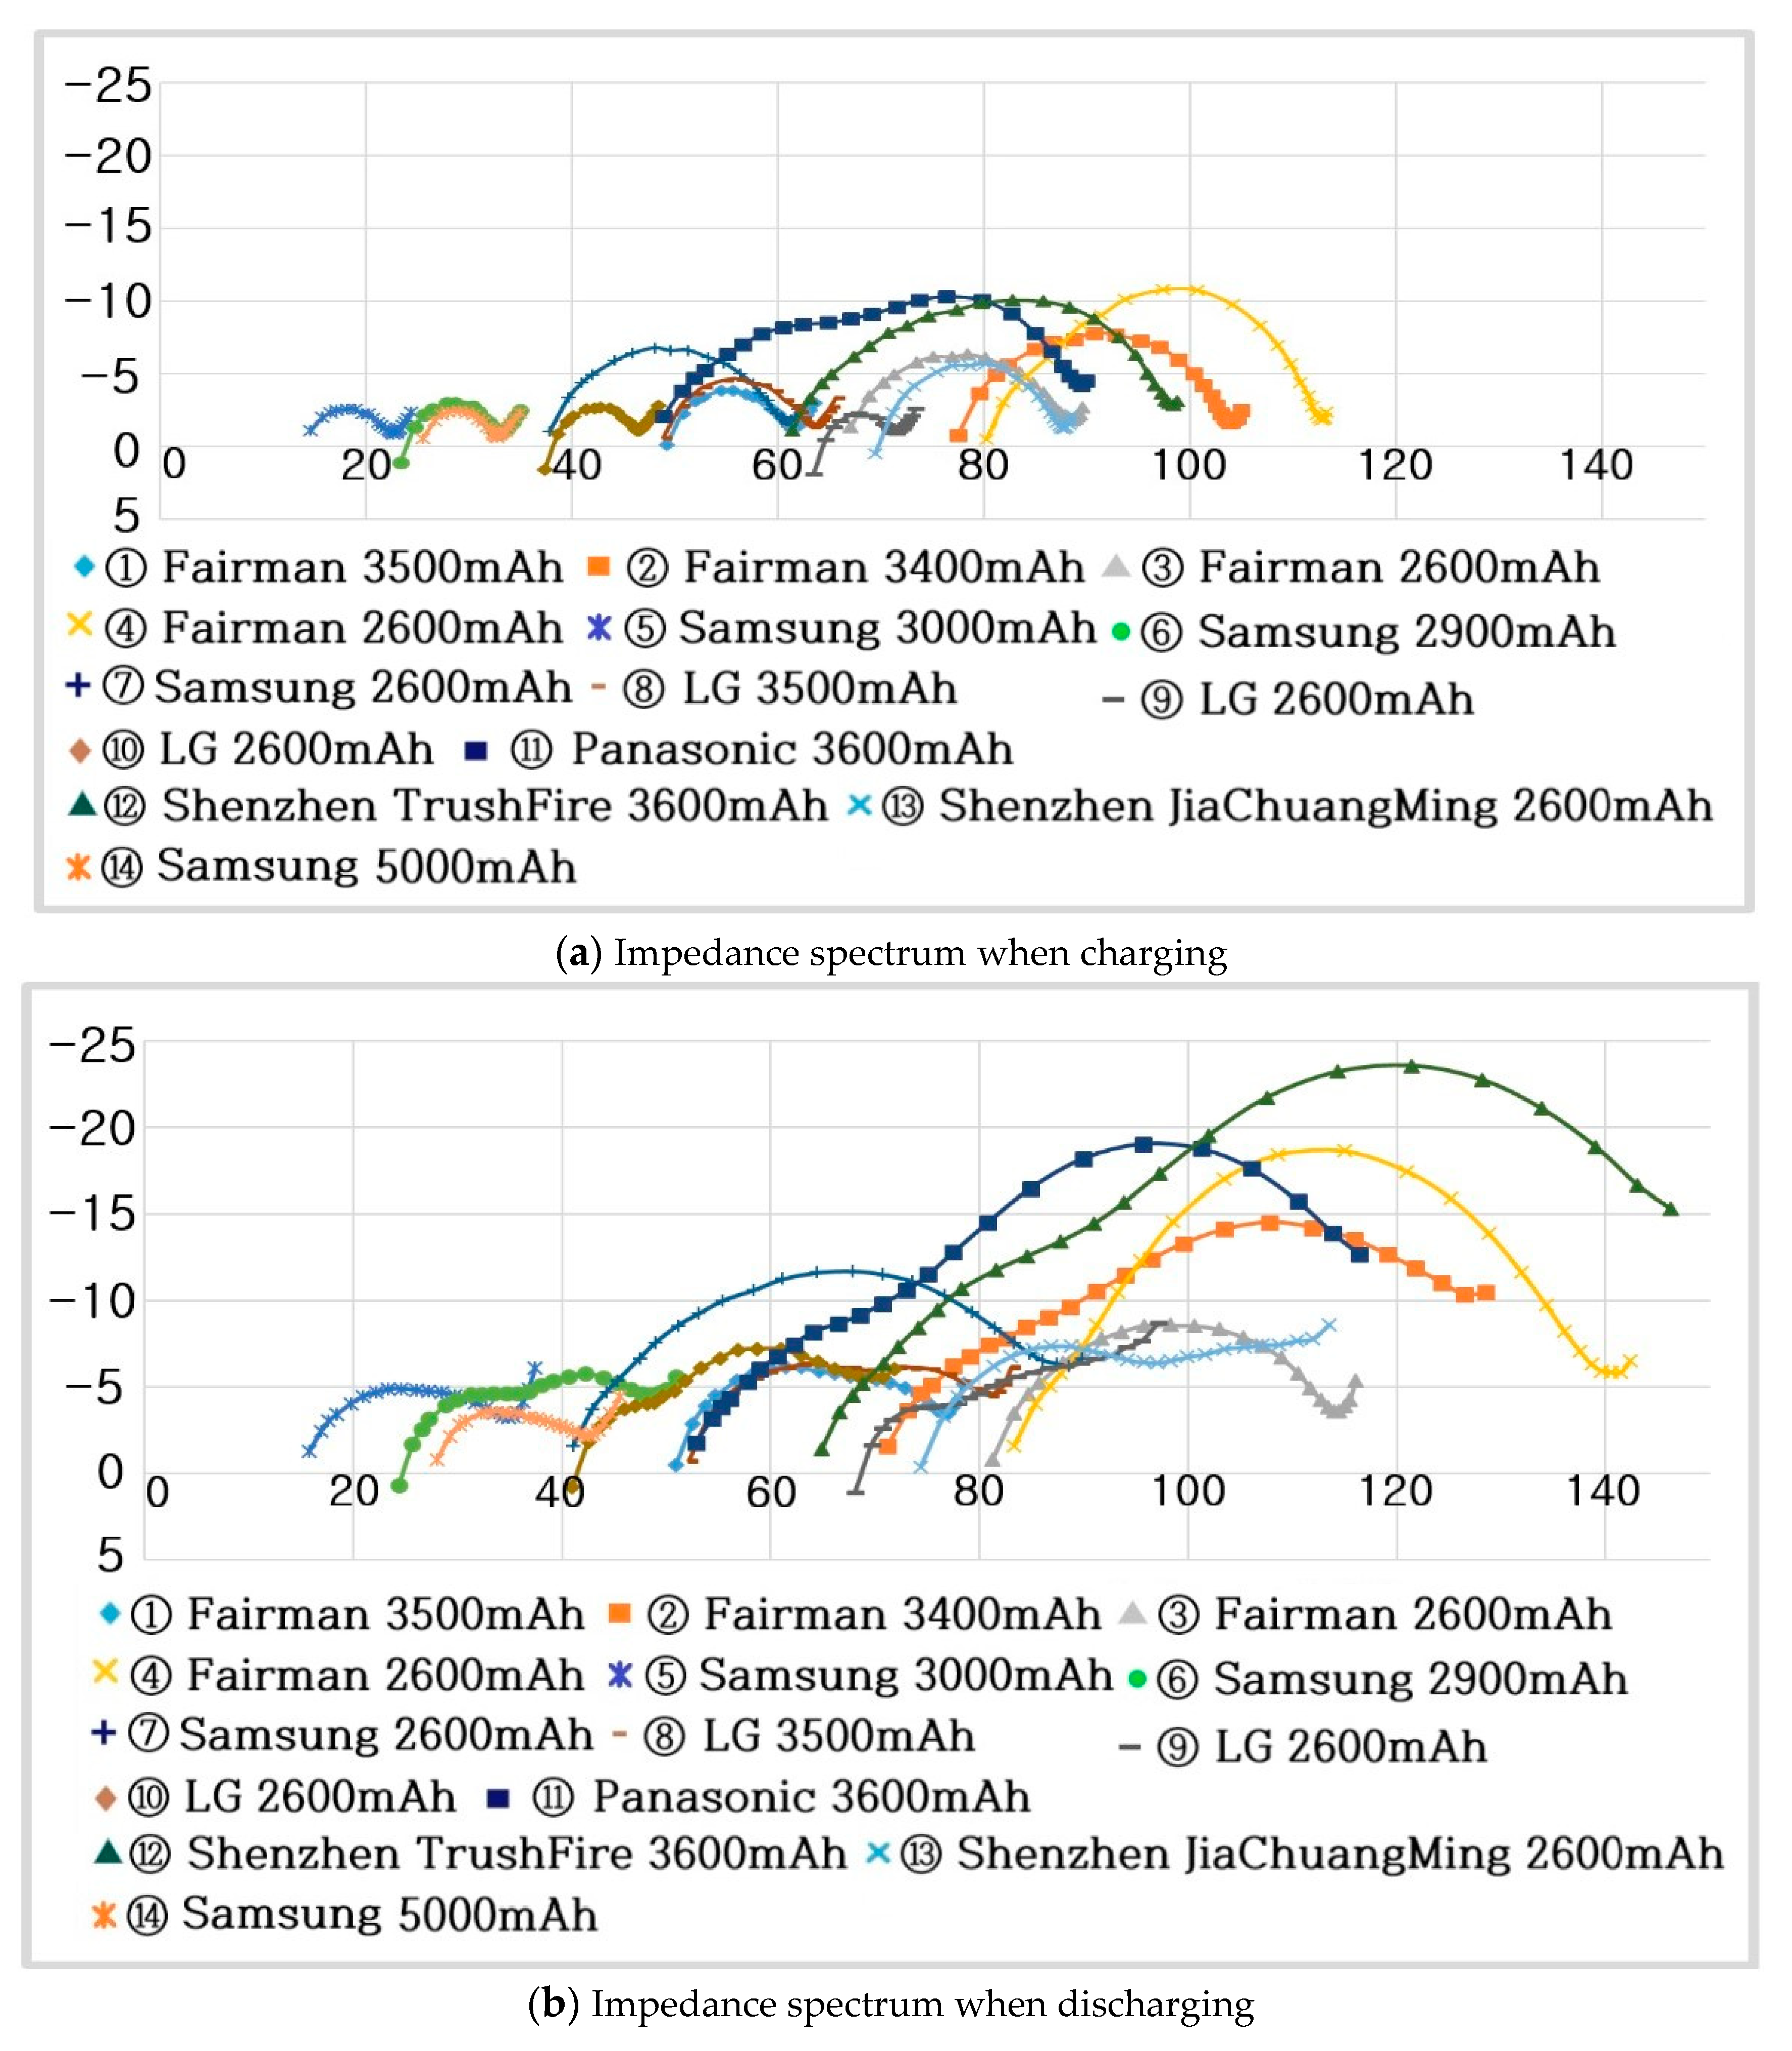
Figure 22 displays the impedance spectra of the 18650- and 21700-type cylindrical Li-ion batteries. Recently, various companies have started selling Li-ion batteries with varying capacities, but it is difficult to confirm which battery is the best. Accurately determining the performance of a Li-ion battery only by the capacity () indicated on the surface is difficult.
If the , and values during charging are small overall, the values of , and do not significantly change even at the time of discharging. Cylindrical Li-ion batteries exhibit a semicircular shape due to their oxidation and reduction reactions, and it was experimentally confirmed that the afforded by Li ion diffusion increases at a slope of 45° in the complex plane.
6.2. Impedance Spectra of Pouch-Type Li-Ion Batteries
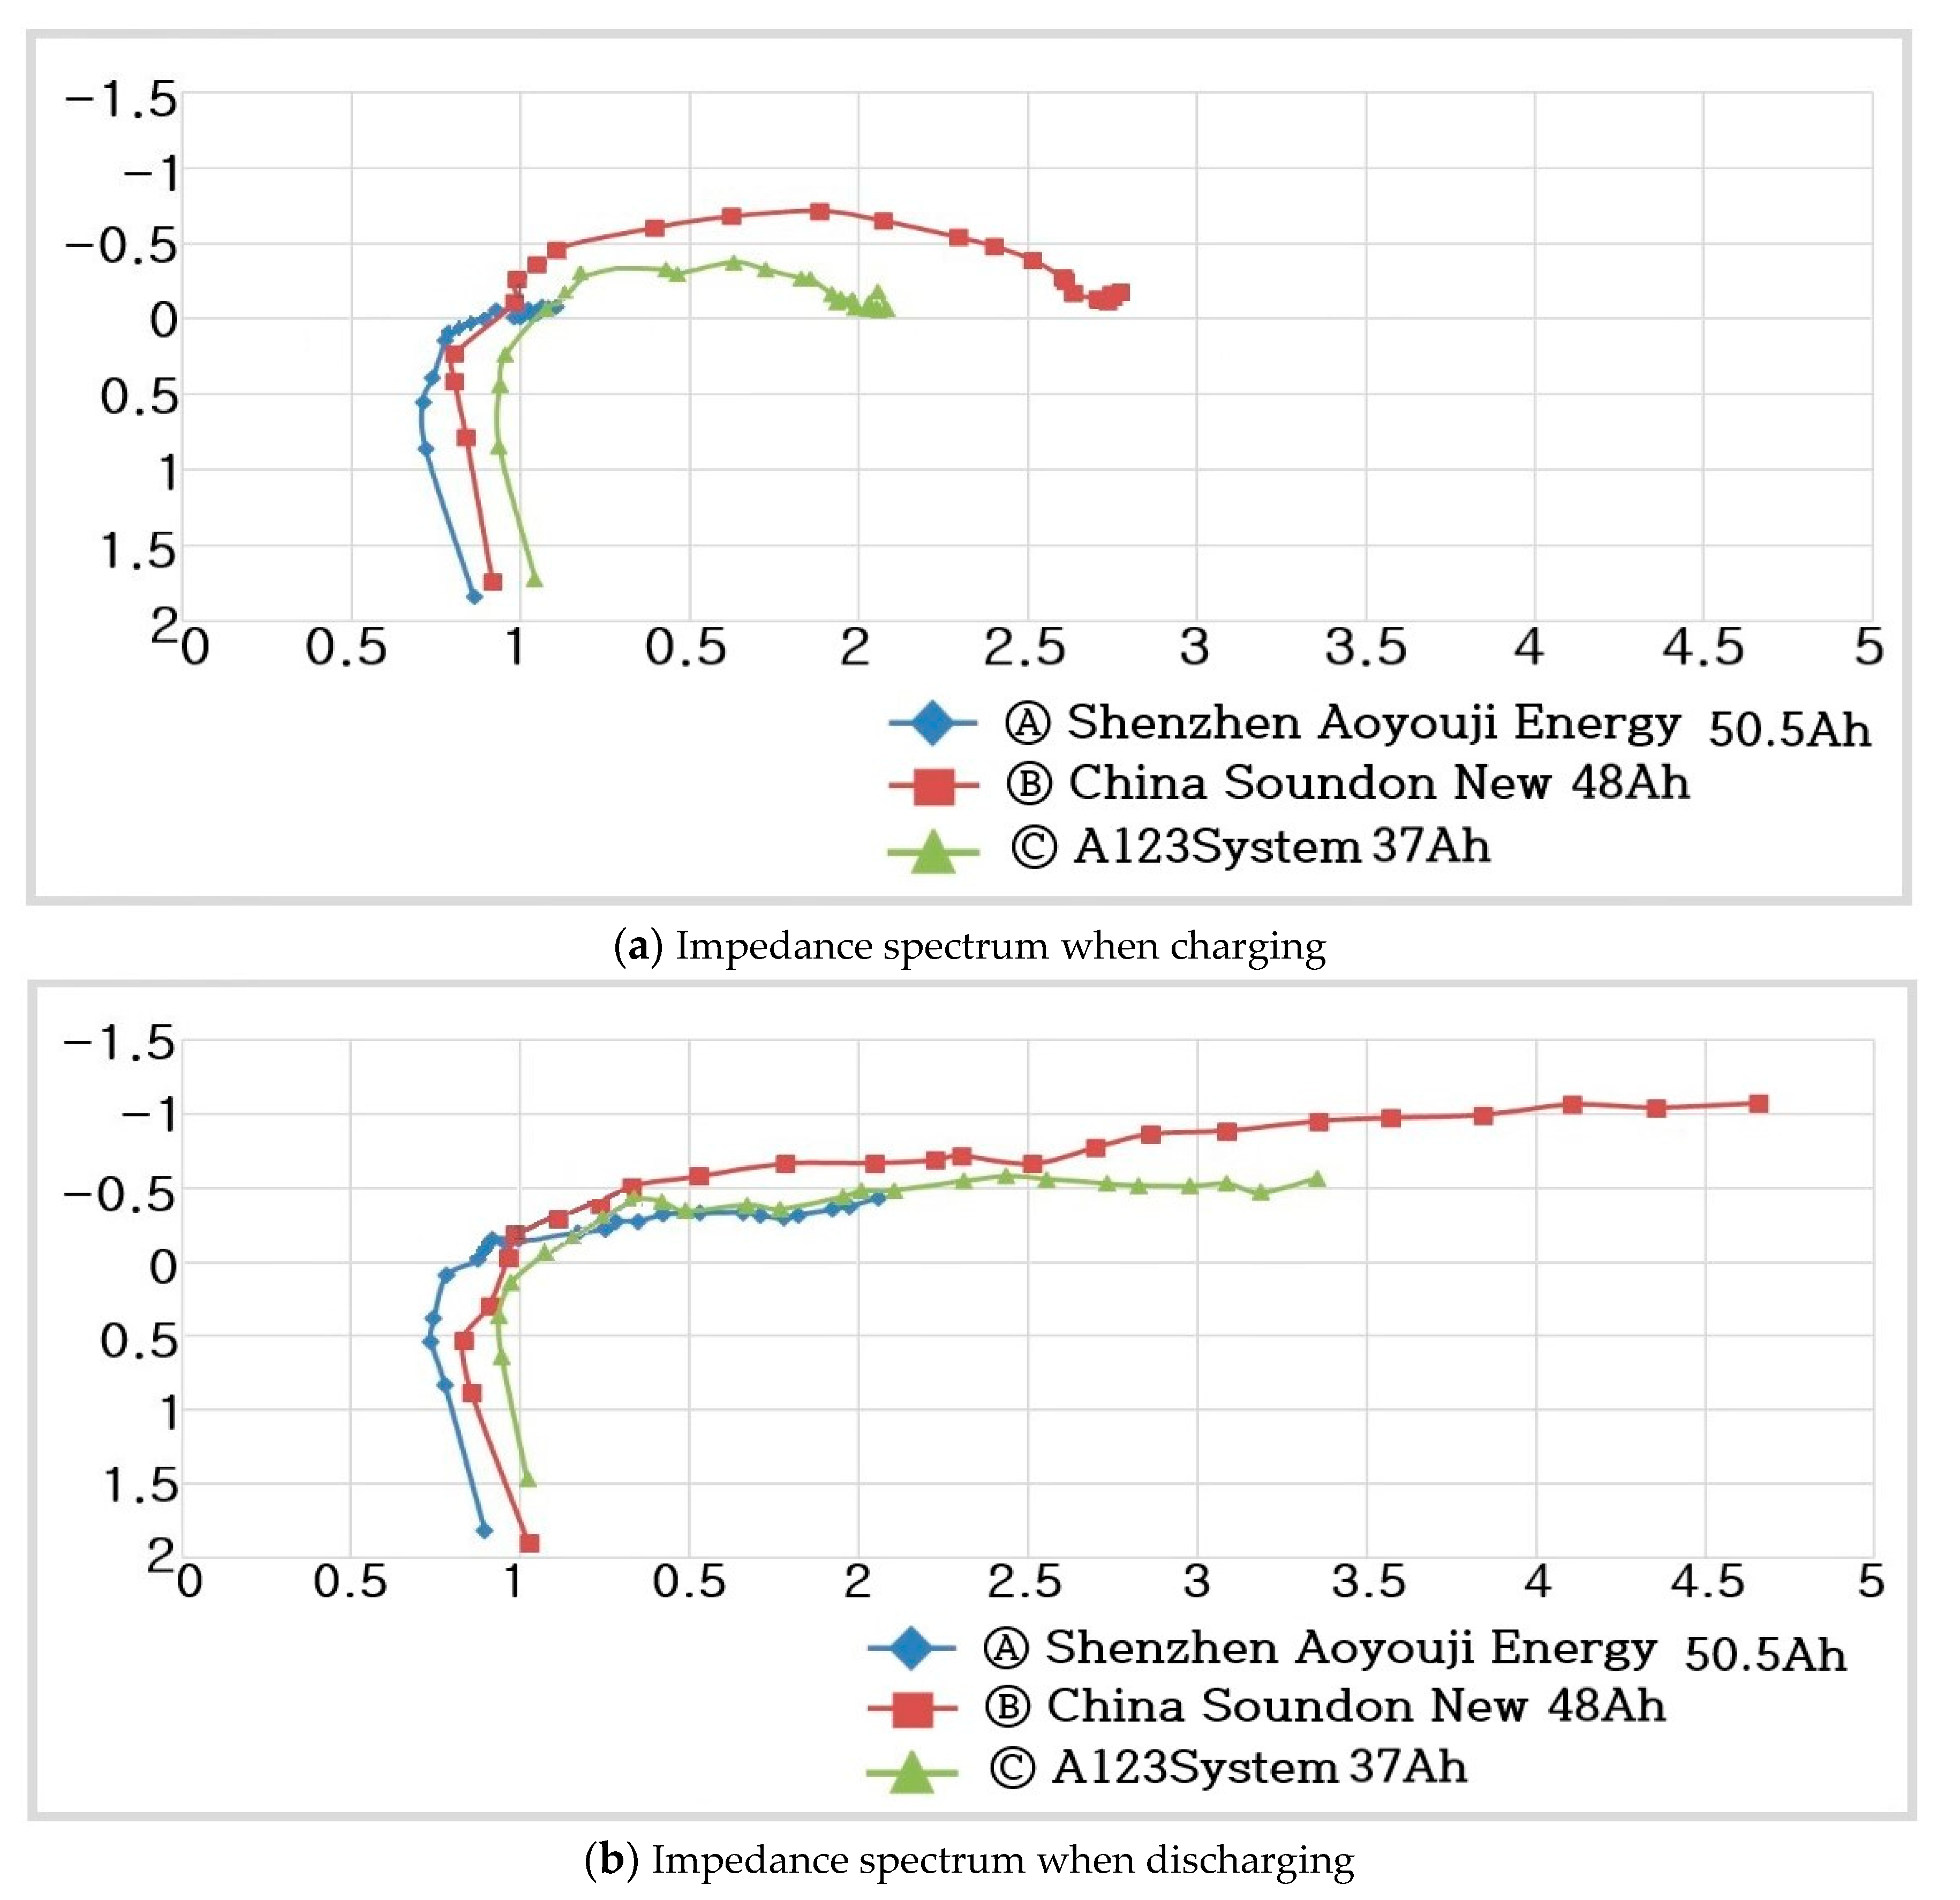
Figure 23 shows the impedance spectra of pouch-type Li-ion batteries.
As shown in Figure 23a, the value when charging pouch-type batteries without a protection device are as follows:
- -
- Ⓐ Shenzhen Aoyou vji Energy :
- -
- Ⓑ China Soundon New Energy :
- -
- Ⓒ A123System :
It can be seen that pouch-type lithium-ion batteries showed a clear difference in the change of the impedance spectrum curve in the low-frequency region during charging and discharging. In particular, in the case of pouch-type lithium-ion batteries, the resistance, R, value increases in the low-frequency region during discharge, and the afforded by Li ion diffusion does not appear at all.
- -
- Ⓐ-1 Shenzhen Aoyou vji Energy 50.5 Ah charging range of : 0.722–1.181
- -
- Ⓐ-2 Shenzhen Aoyou vji Energy 50.5 Ah discharging range of : 0.725–2.021
- -
- Ⓑ-1 China Soundon New Energy 48 Ah charging range of : 0.728–2.758
- -
- Ⓑ-2 China Soundon New Energy 48 Ah discharging range of : 0.729–4.199
- -
- Ⓒ-1 A123System 37 Ah charging range of : 0.921–2.174
- -
- Ⓒ-2 A123System 37 Ah discharging range of : 0.923–3.328
The overall comparison of the cylindrical and pouch-type Li-ion batteries is as follows:
- -
- 18,650 Cylindrical Li-Ion Battery (protected):
- -
- 18,650 Cylindrical Li-Ion Battery (protected):
- -
- 18,650 Cylindrical Li-Ion Battery (unprotected):
- -
- 21,700 Cylindrical Li-Ion Battery (protected):
- -
- Pouch-type Li-Ion Battery (unprotected):
A pouch-type Li-ion battery basically has considerably smaller than a cylindrical Li-ion battery, and the current capacity supplied by the battery is very good. For a pouch-type Li-ion battery, as the current increases, the decreases.
The most fundamental difference between the pouch-type and cylindrical Li-ion batteries is that in the pouch-type batteries, only a part of the semicircular shape appears due to the oxidation and reduction reactions of Li ions, and the afforded by Li ion diffusion does not appear at all.
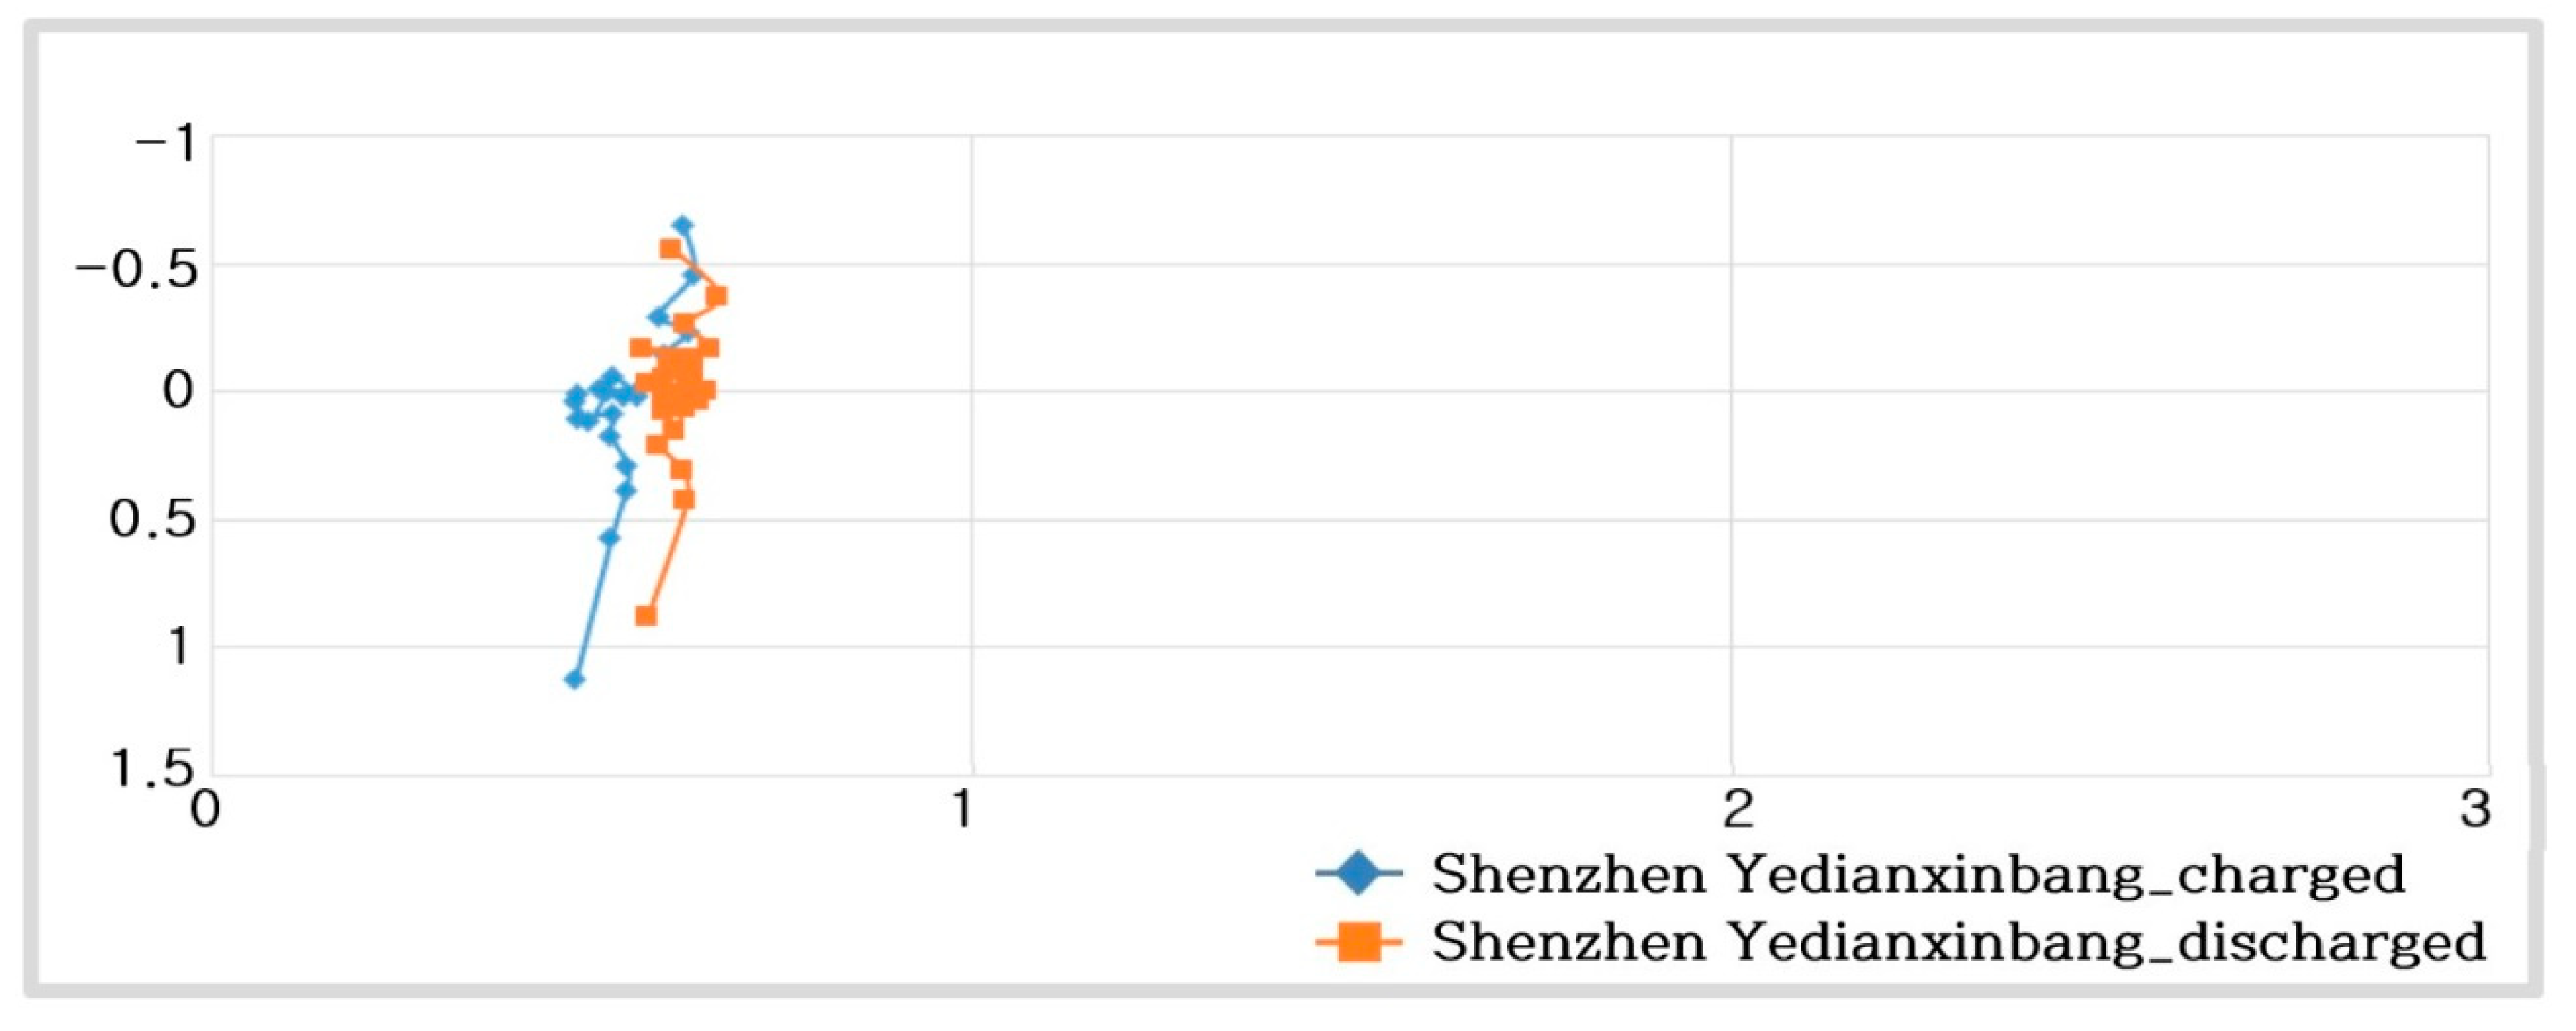
6.3. Impedance Spectrum of a Supercapacitor
Figure 24 illustrates the impedance spectrum of a supercapacitor.
As shown in Figure 24, the capacity of the supercapacitor is 600, and the value is as follows:
- -
- (Charging) Shenzhen Yedianxinbang 500:
- -
- (Discharging) Shenzhen Yedianxinbang 500 F:
For the supercapacitor, the impedance spectrum increases with a slope of nearly 90°. The of the supercapacitor is smaller than that of a pouch-type Li-ion battery, and the characteristics of the supercapacitor are substantially more similar to those of an ideal energy storage device, compared to the characteristics of the Li-ion batteries considered.
Table 2 summarizes the and values of the Li-ion batteries and supercapacitor.
- The value decreases in the following order: 18650-type cylindrical Li-ion battery > 21700-type cylindrical Li-ion battery > pouch-type Li-ion battery > supercapacitor.
- A cylindrical Li-ion battery with the smallest , , and values exhibits the best characteristics.
- A cylindrical Li-ion battery exhibits a semicircular shape due to the oxidation and reduction reactions of Li ions, which increases with a slope of 45° in the complex plane due to the generated by Li ion diffusion.
- For a pouch-type Li-ion battery, a part of the semicircle shape appears due to the oxidation and reduction reactions of Li ions, but the afforded by Li ion diffusion does not appear.
- For a supercapacitor, no oxidation or reduction reactions of ions are observed, and the caused by Li ion diffusion hardly occurs, and its characteristics are similar to those of an ideal capacitor.
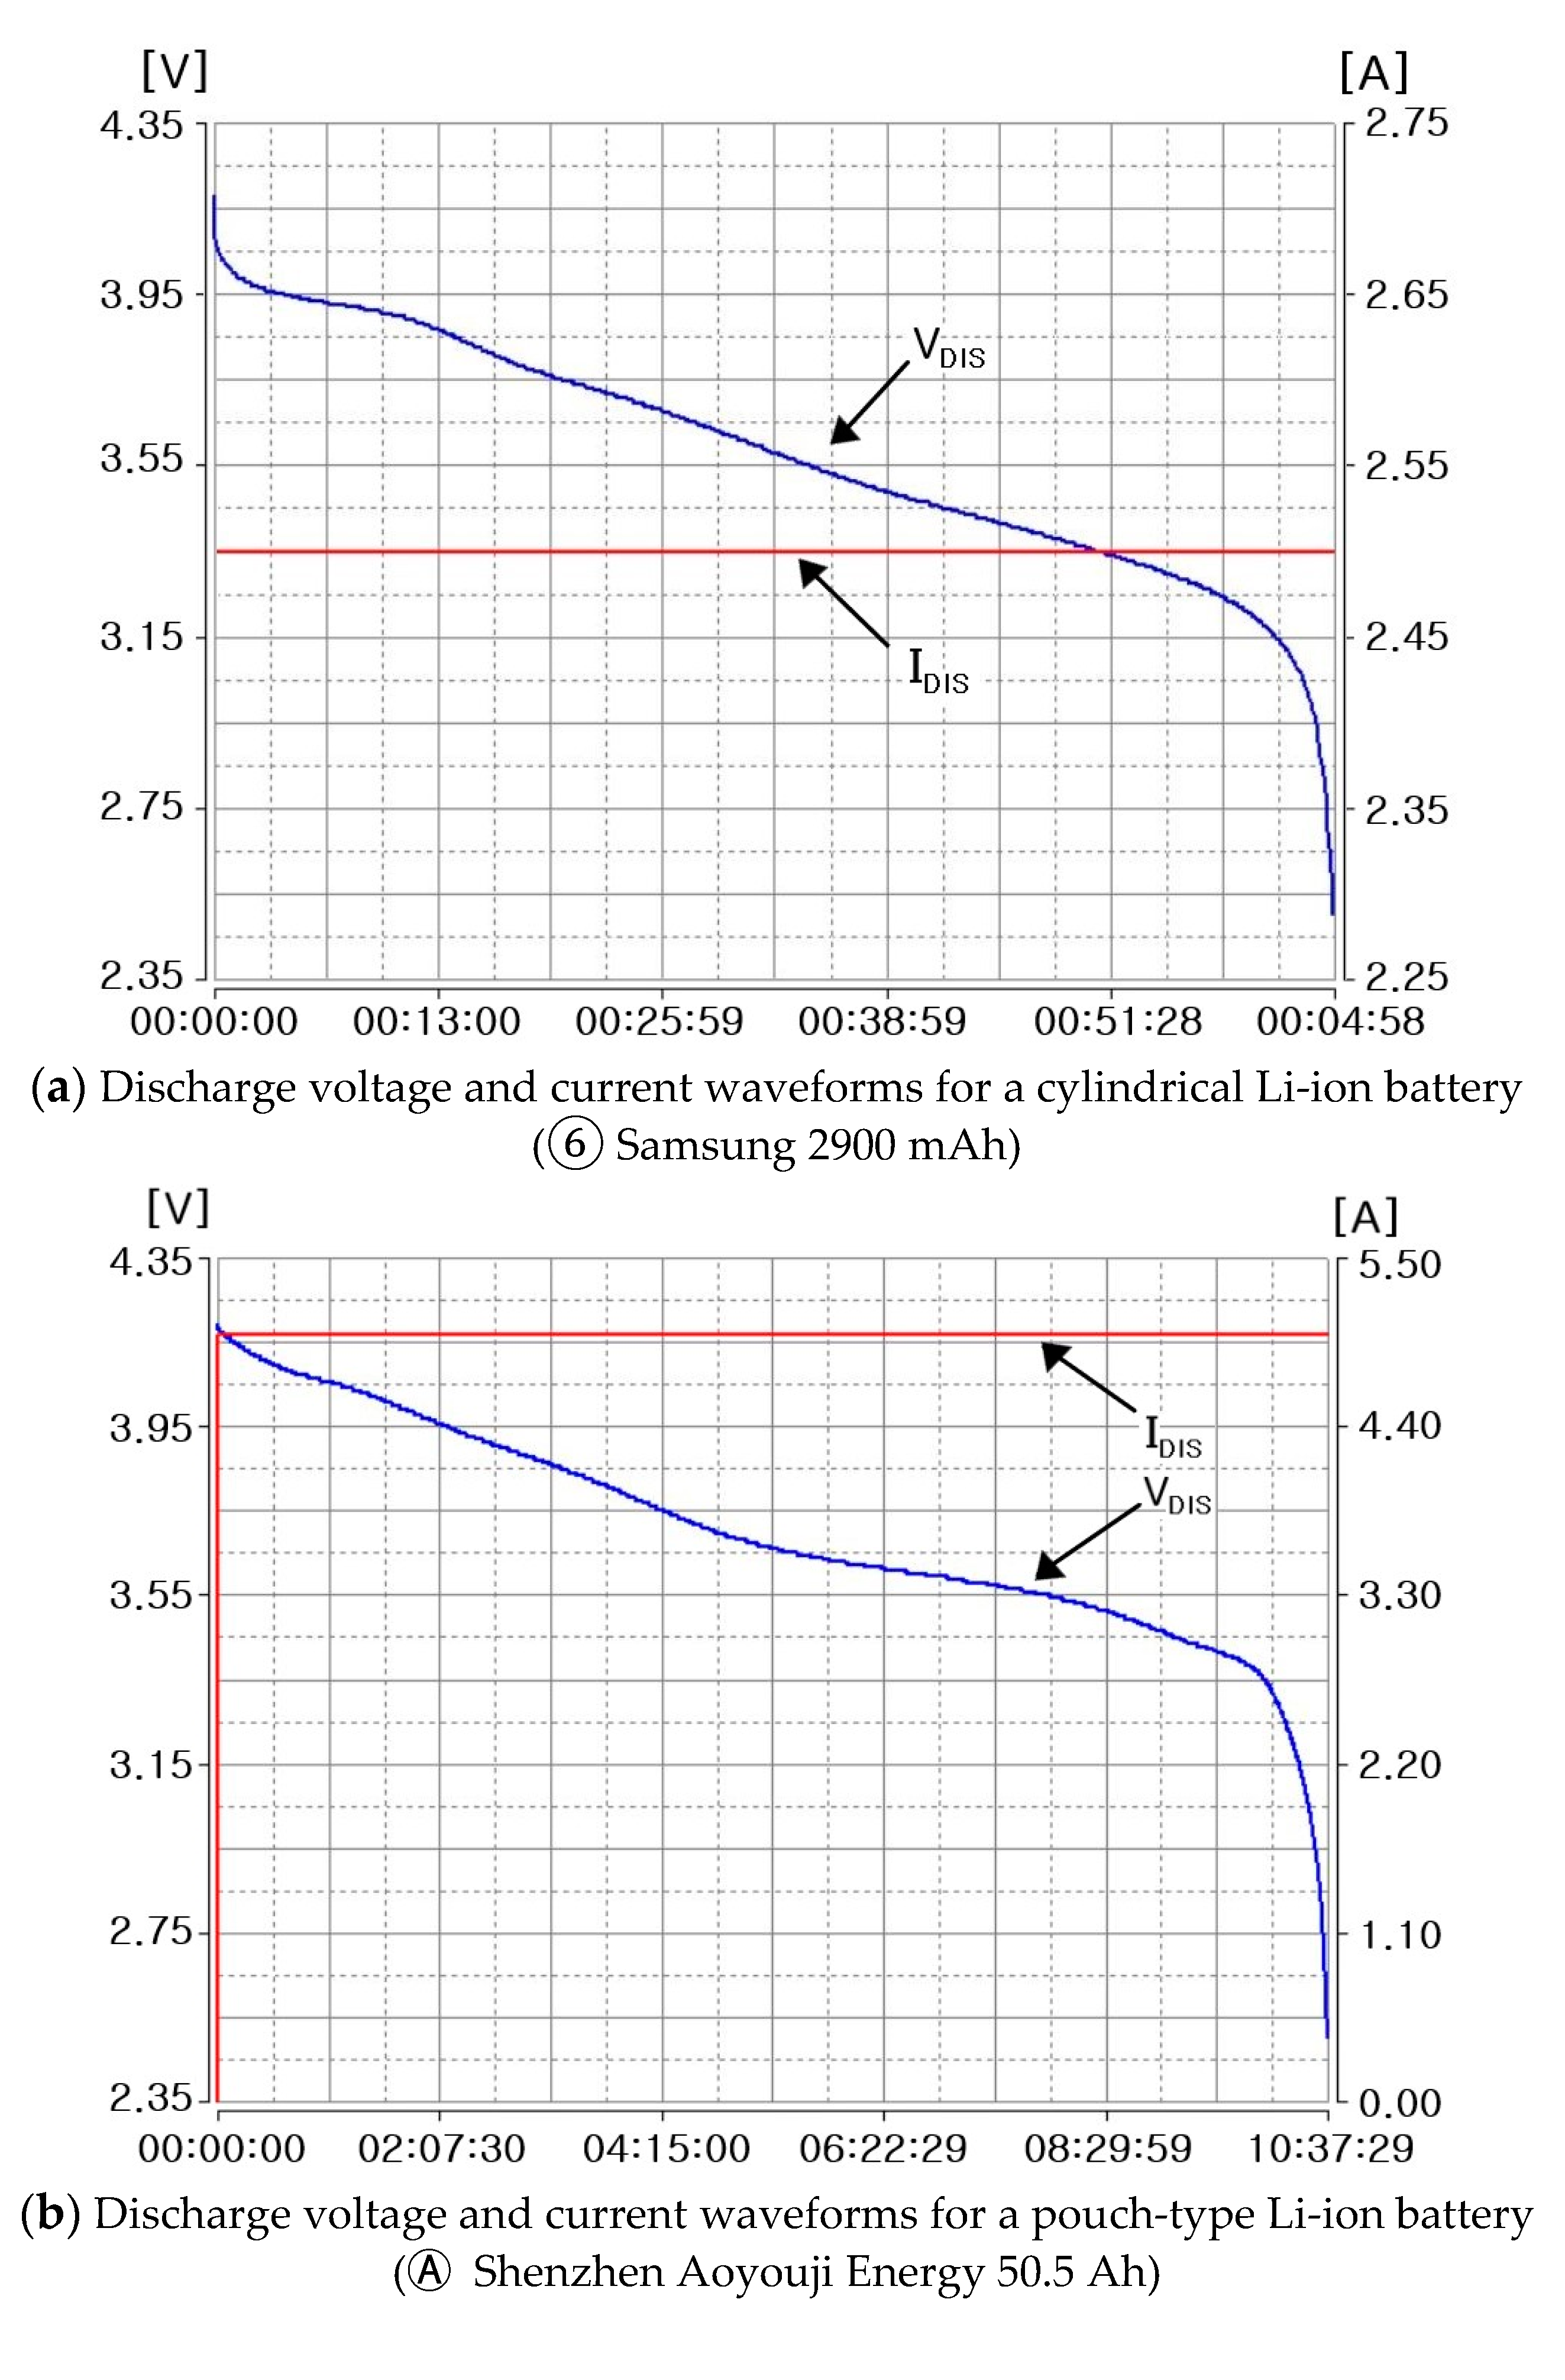
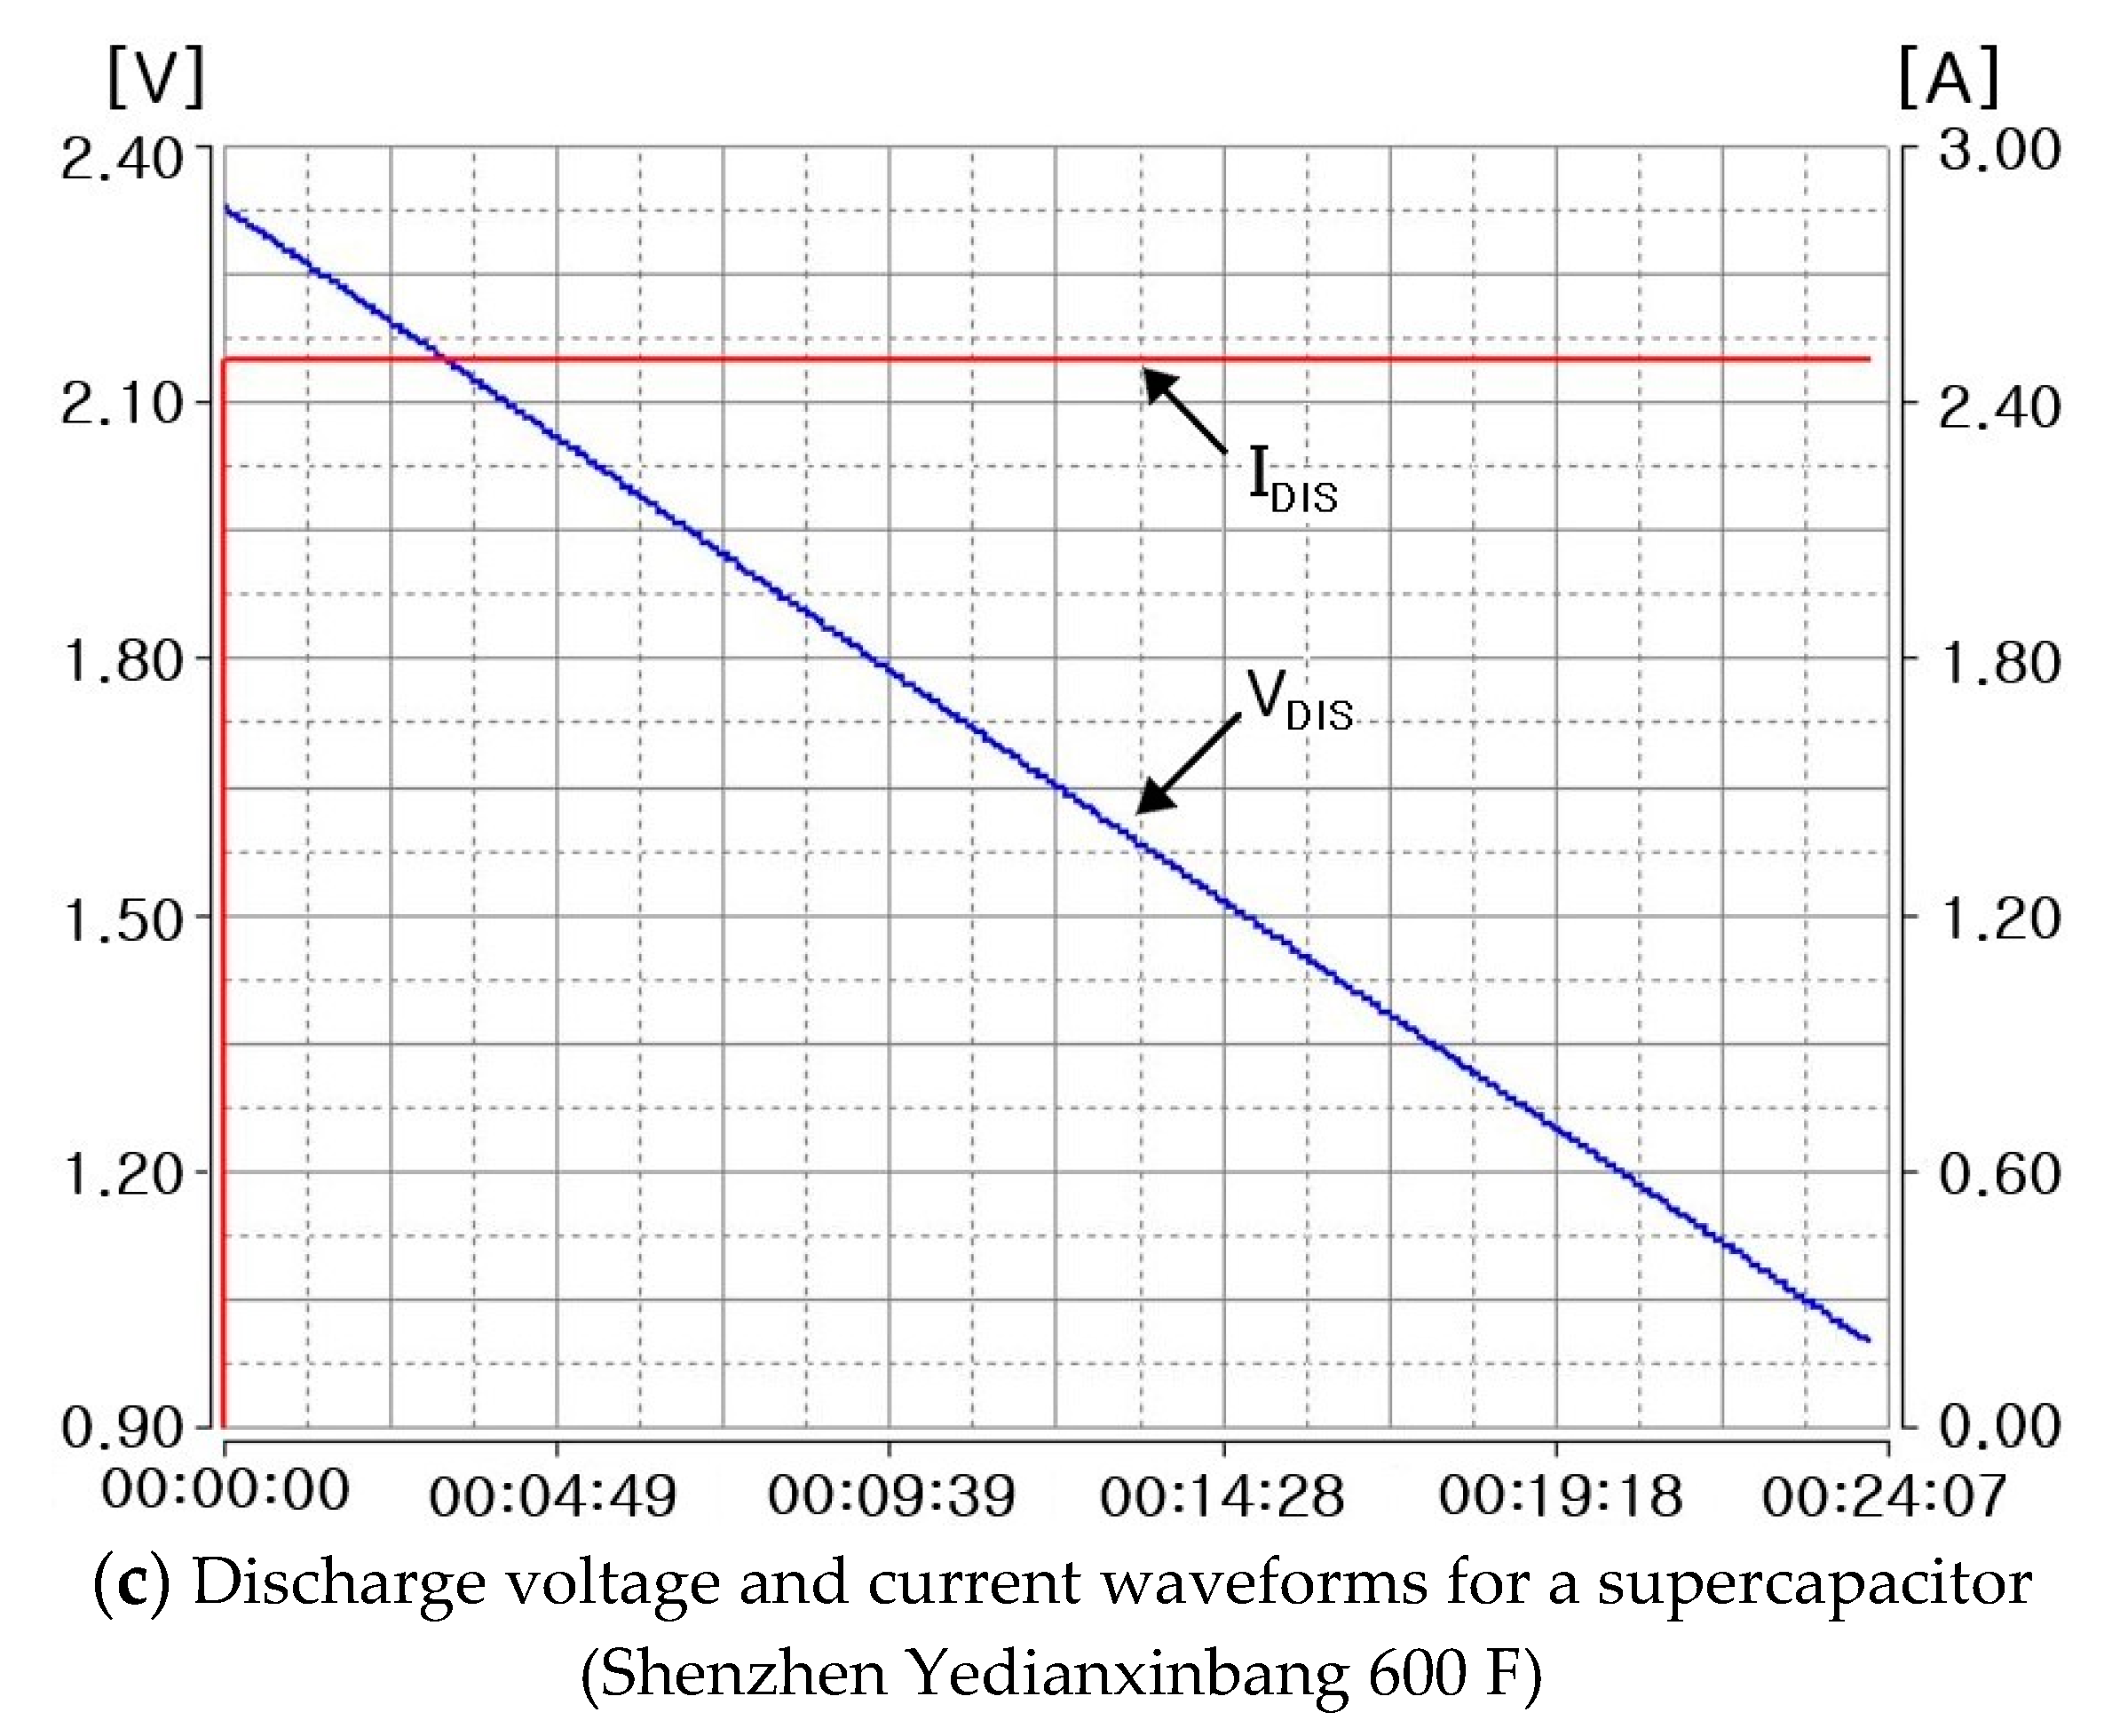
Figure 25 shows the discharge voltage and current waveforms of the cylindrical and pouch-type Li-ion batteries and supercapacitor. The voltage and current characteristics when discharging with a constant current (CC) were obtained using a discharge apparatus.
Figure 25a shows the discharge voltage and current waveforms when a cylindrical Li-ion battery (⑥ Samsung 2900 mAh) was discharged with a CC of 2.5 A.
The voltage of the battery gradually decreased from 4.2 to 3.15 V in about 60 min and then sharply decreased after 3.15 V.
Figure 25b shows the discharge voltage and current waveforms when a pouch-type Li-ion battery (Ⓐ Shenzhen Aoyouji Energy 50.5 Ah) was discharged with a CC of 5 A. The voltage of the battery gradually decreased from 4.2 to 3.35 V in about 10 h and then sharply decreased after 3.35 V.
Figure 25a,b shows the typical discharge characteristics of Li-ion batteries; the pouch-type Li-ion battery exhibited better energy storage characteristics than the cylindrical Li-ion battery.
Figure 25c shows the discharge voltage and current waveforms when the supercapacitor (Shenzhen Yedianxinbang 600 F) was discharged with a CC of 2.5 A. The voltage linearly decreased from 2.3 to 0.9 V in about 24 min. The discharge voltage and current waveforms verify that the characteristics of the supercapacitor are similar to those of an ideal energy storage device.
The fundamental reason for such a shape is indicated by the impedance spectrum curve. In the case of Li-ion batteries, the discharge voltage rapidly decreases when the state of charge (SOC) is low, but for supercapacitors, the slope of the discharge voltage is constant regardless of the SOC.
Currently, Li-ion batteries are widely used as energy storage systems (ESSs) and to power electric vehicles, and the Impedance Spectra method is expected to be very useful for quickly evaluating the performance of batteries and supercapacitors.
7. Conclusions
This study compared and analyzed 2600–3600 mAh 18650-type cylindrical Li-ion batteries, a 5000 mAh 21700-type cylindrical Li-ion battery, 37–50.5 Ah pouch-type Li-ion batteries, and a 600 F supercapacitor. Electrical and mathematical modeling was organized for the cylindrical and pouch-type Li-ion batteries and the supercapacitor. Subsequently, the impedance spectra of 13 types of 18650-type cylindrical Li-ion batteries, 1 type of 21700-type cylindrical Li-ion battery, 3 types of pouch-type Li-ion batteries, and 1 type of supercapacitor were obtained. For a cylindrical Li-ion battery, the value of a battery with a protection device (circular thermal disc cap) is in the range of 14–38. For the 18650-type cylindrical Li-ion battery with a protection device, the value of the battery is between 48 and 105, and the protection device increases the value by at least 33. A good Li-ion battery has small overall , , and values. A cylindrical Li-ion battery exhibits a semicircular shape in the impedance spectrum, due to the oxidation and reduction reactions of Li ions, and the impedance increases with a slope of 45° in the complex plane, due to the generated by Li ion diffusion. However, for a pouch-type Li-ion battery, the impedance spectrum exhibits a part of the semicircular shape, due to the oxidation and reduction reactions of Li ions, and the generated by Li ion diffusion does not appear. In a supercapacitor, the oxidation and reduction reactions of ions do not appear at all, and the generated by Li ion diffusion does not occur. Thus, the impedance spectrum of a supercapacitor is very similar to that of an ideal capacitor. Therefore, the values are in the order: 18650-type cylindrical Li-ion batteries >21700-type cylindrical Li-ion batteries > pouch-type Li-ion batteries > supercapacitor. Furthermore, when a Li-ion battery is discharged with CC, its voltage gradually decreases, up to a specific voltage, and then rapidly decreases. However, a supercapacitor has the characteristic of linearly discharging voltage during CC discharge. The study results are expected to be very useful for the performance analysis of electric vehicles, personal mobility, and ESS.
Funding
This research was funded by National Research Foundation of Korea(NRF) and the Ministry of Education(MOE): 2022RIS-002.
Data Availability Statement
Data sharing is not applicable.
Conflicts of Interest
The authors declare no conflict of interest.
References
- Chan, H.L.; Sutanto, D. A New Battery Model for use with Battery Energy Storage Systems and Electric Vehicles Power Systems. In Proceedings of the IEEE Power Engineering Society Conference, Singapore, 23–27 January 2000; pp. 470–475. [Google Scholar] [CrossRef]
- Sims, R.I.; Carnes, J.C.; Dzieciuch, M.A.; Fenton, J.E. Computer Modeling of Automotive Lead Acid Batteries; Ford Research Laboratories Technical Report; 1990; SR-90-154. [Google Scholar]
- Ziyad, M.S.; Margaret, A.C.; William, A.L. A Mathematical Model for Lead-Acid Batteries. IEEE Trans. Energy Con. 1992, 7, 93–98. [Google Scholar] [CrossRef]
- Margaret, A.C.; Ziyad, M.S. Determination of Lead-Acid Battery Capacity Via Mathematical Modeling Techniques. IEEE Trans. Energy Con. 1992, 7, 442–446. [Google Scholar] [CrossRef]
- Buller, S.; Thele, M.; Doncker, R.W.D.; Karden, E. Impedance-Based Simulation Models of Supercapacitors and Li-Ion Batteries for Power Electronic Applications. IEEE Trans. Ind. App. 2005, 41, 742–747. [Google Scholar] [CrossRef]
- Buller, S.; Karden, E.; Kok, D.; Doncker, R.W.D. Modeling the Dynamic Behavior of Supercapacitors Using Impedance Spectroscopy. IEEE Trans. Ind. App. 2002, 38, 1622–1626. [Google Scholar] [CrossRef]
- Stroe, D.I.; Swierczynski, M.; Stan, A.I.; Knap, V.; Teodorescu, R.; Andreasen, S.J. Diagnosis of Lithium-Ion Batteries State-of-Health based on Electrochemical Impedance Spectroscopy Technique. In Proceedings of the IEEE Transactions on Energy Conversion Congress and Exposition (ECCE), Pittsburgh, PA, USA, 14–18 September 2014; pp. 4576–4582. [Google Scholar] [CrossRef] [Green Version]
- Oldenburger, M.; Bedürftig, B.; Gruhle, A.; Grimsmann, F.; Richter, E.; Findeisen, R.; Hintennach, A. Investigation of the Low Frequency Warburg Impedance of Li-Ion Cells by Frequency Domain Measurements. J. Energy Storage 2019, 21, 272–280. [Google Scholar] [CrossRef]
- Samuel, C.M.; Paul, G. An Impedance Model Based on a Transmission Line Circuit and a Frequency Dispersion Warburg Component for the Study of EIS in Li-Ion Batteries. J. Electroanal. Chem. 2020, 871, 114305. [Google Scholar] [CrossRef]
- Maheshwari, A.; Heck, M.; Santarelli, M. Cycle Aging Studies of Lithium Nickel Manganese Cobalt Oxide-Based Batteries Using Electrochemical Impedance Spectroscopy. Electrochim. Acta 2018, 273, 335–348. [Google Scholar] [CrossRef]
- Karden, E.; Buller, S.; Doncker, R.W.D. A Frequency-Domain Approach to Dynamical Modeling of Electrochemical Power Sources. Electrochim. Acta 2002, 47, 2347–2356. [Google Scholar] [CrossRef]
- Buller, S.; Thele, M.; Karden, E.; Doncker, R.W.D. Impedance-Based Non-Linear Dynamic Battery Modeling for Automotive Applications. J. Power Source 2003, 113, 422–430. [Google Scholar] [CrossRef]
- Chen, M.; Rincón-Mora, G.A. Accurate Electrical Battery Model Capable of Predicting Runtime and I–V Performance. IEEE Trans. Energy Con. 2006, 21, 504–511. [Google Scholar] [CrossRef]
- Lee, J.M.; Nam, O.Y.; Cho, B.H. Li-ion Battery SOC Estimation Method Based on the Reduced Order Extended Kalman Filtering. J. Power Source 2007, 174, 9–15. [Google Scholar] [CrossRef]
- Kim, J.H.; Shin, J.W.; Chun, C.Y.; Cho, B.H. Stable Configuration of a Li-Ion Series Battery Pack Based on a Screening Process for Improved Voltage/SOC Balancing. IEEE Trans. Power Electron. 2012, 27, 411–424. [Google Scholar] [CrossRef]
- Deng, Z.; Zhang, Z.; Lai, Y.; Liu, J.; Li, J.; Liu, Y. Electrochemical Impedance Spectroscopy Study of a Lithium/Sulfur Battery: Modeling and Analysis of Capacity Fading. J. Electrochem. Soc. 2013, 160, A553–A558. [Google Scholar] [CrossRef]
- Bugryniec, P.J.; Davidson, J.N.; Brown, S.F. Advanced Abuse Modelling of Li-ion Cells—A Novel Description of Cell Pressurisation and Simmering Reactions. J. Power Source 2020, 474, 228396. [Google Scholar] [CrossRef]
- Abada, S.; Marlair, G.; Lecocq, A.; Petit, M.; Sauvant-Moynot, V.; Huet, F. Safety Focused Modeling of Lithium-Ion Batteries: A Review. J. Power Source 2016, 306, 178–192. [Google Scholar] [CrossRef]
- Gauchia, L.; Castaño, S.; Sanz, J. New Approach to Supercapacitor Testing and Dynamic Modelling. In Proceedings of the IEEE, Vehicle Power and Propulsion Conference, Lille, France, 1–3 September 2010; pp. 1–5. [Google Scholar] [CrossRef]
- Mahon, P.J.; Paul, G.L.; Keshishian, S.M.; Vassallo, A.M. Measurement and Modelling of the High-Power Performance of Carbon-Based Supercapacitors. J. Power Source 2000, 91, 68–76. [Google Scholar] [CrossRef]
- Du, Y.; Mo, Y.; Chen, Y. Effects of Fe Impurities on Self-Discharge Performance of Carbon-Based Supercapacitors. Materials 2021, 14, 1908. [Google Scholar] [CrossRef] [PubMed]
- Himanshu; Rao, S.S.; Punnoose, D.; Sathishkumar, P.; Gopi, C.V.V.M.; Bandari, N.; Durga, I.K.; Krishna, T.N.V.; Kim, H.J. Development of Novel and Ultra-High-Performance Supercapacitor Based on a Four Layered Unique Structure. Electronics 2018, 7, 121. [Google Scholar] [CrossRef] [Green Version]
- Huang, Z.; Qin, C.; Wang, J.; Cao, L.; Ma, Z.; Yuan, Q.; Lin, Z.; Zhang, P. Research on High-Value Utilization of Carbon Derived from Tobacco Waste in Supercapacitors. Materials 2021, 14, 1714. [Google Scholar] [CrossRef]
- Yuan, Y.; Sun, Y.; Feng, Z.; Li, X.; Yi, R.; Sun, W.; Zhao, C.; Yang, L. Nitrogen-doped hierarchical porous activated carbon derived from paddy for high-performance supercapacitors. Materials 2021, 14, 318. [Google Scholar] [CrossRef]
- Khalid, S.; Cao, C.; Naveed, M.; Younas, W. 3D hierarchical MnO2 microspheres: A prospective material for high performance supercapacitors and lithium-ion batteries. Sustain. Energy Fuels 2017, 1, 1795–1804. [Google Scholar] [CrossRef]
- Bi, S.; Banda, H.; Chen, M.; Niu, L.; Chen, M.; Wu, T.; Wang, J.; Wang, R.; Feng, J.; Chen, T.; et al. Molecular understanding of charge storage and charging dynamics in supercapacitors with MOF electrodes and ionic liquid electrolytes. Nat. Mater. 2020, 19, 552–558. [Google Scholar] [CrossRef]
- Stroe, D.I.; Knap, V.; Swierczynski, M.; Schaltz, E. Electrochemical Impedance Spectroscopy-based Electric Circuit Modeling of Lithium-Sulfur Batteries during Discharging State. IEEE Trans. Ind. Appl. 2019, 55, 631–637. [Google Scholar] [CrossRef] [Green Version]
- Lee, J.H.; Choi, W.J. Novel State-of-Charge Estimation Method for Lithium Polymer Batteries Using Electrochemical Impedance Spectroscopy. J. Power Electron. 2011, 11, 237–243. [Google Scholar] [CrossRef] [Green Version]
- Sihvo, J.; Stroe, D.I.; Messo, T.; Roinila, T. A Fast Approach for Battery Impedance Identification Using Pseudo Random Sequence (PRS) Signals. IEEE Trans. Power Electron. 2020, 35, 2548–2557. [Google Scholar] [CrossRef]
- Santoni, F.; Angelis, A.D.; Moschitta, A.; Carbone, P. Digital Impedance Emulator for Battery Measurement System Calibration. Senors 2021, 21, 7377. [Google Scholar] [CrossRef] [PubMed]
- Islam, S.M.R.; Park, S.Y.; Balasingam, B. Unification of Internal Resistance Estimation Methods for Li-Ion Batteries Using Hysteresis-Free Equivalent Circuit Models. Batteries 2020, 6, 32. [Google Scholar] [CrossRef]
- Ovejas, V.J.; Cuadras, A. Impedance Characterization of an LCO-NMC/Graphite Cell: Ohmic Conduction, SEI Transport and Charge-Transfer Phenomenon. Batteries 2018, 4, 43. [Google Scholar] [CrossRef] [Green Version]
- Gheem, E.V.; Pintelon, R.; Vereecken, J.; Schoukens, J.; Hubin, A.; Verboven, P.; Blajiev, O. Electro-Chemical Impedance Spectroscopy in the Presence of Nonlinear Distortions and Non-Stationary Behaviour Part I: Theory and Validation. Electrochim. Acta 2004, 49, 4753–4762. [Google Scholar] [CrossRef]
- Kim, J.H.; Kowal, J. Development of a Matlab/Simulink Model for Monitoring Cell State-of-Health and State-of-Charge via Impedance of Lithium-Ion Battery Cells. Batteries 2022, 8, 8. [Google Scholar] [CrossRef]
- Heinrich, M.; Wolff, N.; Seitz, S.; Krewer, U. Identifying Anode and Cathode Contributions in Li-Ion Full-Cell Impedance Spectra. Batteries 2022, 8, 40. [Google Scholar] [CrossRef]
- Goldammer, E.; Kowal, J. Determination of the Distribution of Relaxation Times by Means of Pulse Evaluation for Offline and Online Diagnosis of Lithium-Ion Batteries. Batteries 2021, 7, 36. [Google Scholar] [CrossRef]
- Macdonald, J.R. Impedance Spectroscopy. Ann. Biomed. Eng. 1992, 20, 289–305. [Google Scholar] [CrossRef] [PubMed]
- Choi, W.S.; Shin, H.C.; Kim, J.M.; Choi, J.Y.; Yoon, W.S. Modeling and Applications of Electrochemical Impedance Spectroscopy (EIS) for Lithium-ion Batteries. J. Electrochem. Sci. Technol 2020, 11, 1–13. [Google Scholar] [CrossRef] [Green Version]
- Olarte, J.; Ilarduya, J.M.; Zulueta, E.; Ferret, R.; Fernández-Gámiz, U.; Lopez-Guede, J.M. A Battery Management System with EIS Monitoring of Life Expectancy for Lead–Acid Batteries. Electronics 2021, 10, 1228. [Google Scholar] [CrossRef]
- Franke-Lang, R.; Kowa, J. Analysis of Electrochemical Impedance Spectroscopy on Zinc-Air Batteries Using the Distribution of Relaxation Times. Batteries 2021, 7, 56. [Google Scholar] [CrossRef]
- Podias, A.; Pfrang, A.; Persio, F.D.; Kriston, A.; Bobba, S.; Mathieux, F.; Messagie, M.; Boon-Brett, L. Sustainability Assessment of Second Use Applications of Automotive Batteries: Ageing of Li-Ion Battery Cells in Automotive and Grid-Scale Applications. World Electr. Veh. J. 2018, 9, 24. [Google Scholar] [CrossRef] [Green Version]
- Hasan, R.; Scott, J. Impedance Measurement of Batteries under load. In Proceedings of the IEEE International Instrumentation and Measurement Technology Conference(I2MTC), Auckland, New Zealand, 20–23 May 2019. [Google Scholar] [CrossRef]
- Ray, A.; Saruhan, B. Application of Ionic Liquids for Batteries and Supercapacitors. Materials 2021, 14, 2942. [Google Scholar] [CrossRef]
- Yang, G.; Song, Y.; Wang, Q.; Zhang, L.; Deng, L. Review of ionic liquids containing, polymer/inorganic hybrid electrolytes for lithium metal batteries. Mater. Des. 2020, 190, 108563. [Google Scholar] [CrossRef]
- Karuppasamy, K.; Theerthagiri, J.; Vikraman, D.; Yim, C.J.; Hussain, S.; Sharma, R.; Maiyalagan, T.; Qin, J.; Kim, H.S. Ionic liquid-based electrolytes for energy storage devices: A brief review on their limits and applications. Polymers 2020, 12, 918. [Google Scholar] [CrossRef] [Green Version]
- Zhang, R.; Xia, B.; Li, B.; Cao, L.; Lai, Y.; Zheng, W.; Wang, H.; Wang, W. State of the Art of Lithium-Ion Battery SOC Estimation for Electrical Vehicles. Energies 2018, 11, 1820. [Google Scholar] [CrossRef] [Green Version]
- Rivera-Barrera, J.P.; Muñoz-Galeano, N.; Sarmiento-Maldonado, H.O. SoC Estimation for Lithium-ion Batteries: Review and Future Challenges. Electronics 2017, 6, 102. [Google Scholar] [CrossRef] [Green Version]
- Hahn, M.; Schindler, S.; Triebs, L.C.; Danzer, M.A. Optimized Process Parameters for a Reproducible Distribution of Relaxation Times Analysis of Electrochemical Systems. Batteries 2019, 5, 43. [Google Scholar] [CrossRef] [Green Version]
Figure 1.
Simple battery model [1].
Figure 1.
Simple battery model [1].

Figure 2.
Thevenin battery model [1].
Figure 2.
Thevenin battery model [1].


Figure 5.
Electrical equivalent circuit of a cylindrical Li-ion battery.

Figure 6.
Impedance spectrum according to the SoC of a cylindrical Li-ion battery [5].
Figure 6.
Impedance spectrum according to the SoC of a cylindrical Li-ion battery [5].

Figure 7.
Impedance spectrum according to the presence or absence of charging for a cylindrical Li-ion battery [5].
Figure 7.
Impedance spectrum according to the presence or absence of charging for a cylindrical Li-ion battery [5].

Figure 8.
Electrical equivalent circuit of pouch-type Li-ion battery.


Figure 10.
Electrical equivalent circuit of the supercapacitor [6].
Figure 10.
Electrical equivalent circuit of the supercapacitor [6].

Figure 11.
Electrical equivalent model of the supercapacitor impedance () [6].
Figure 11.
Electrical equivalent model of the supercapacitor impedance () [6].

Figure 12.
Curve of , which is an independent parameter of temperature and voltage in supercapacitors.
Figure 12.
Curve of , which is an independent parameter of temperature and voltage in supercapacitors.

Figure 13.
Theoretical model of the impedance spectrum of supercapacitors with porous electrodes [11].
Figure 13.
Theoretical model of the impedance spectrum of supercapacitors with porous electrodes [11].

Figure 14.
Li-ion batteries and supercapacitor used in the experiment. (a) Cylindrical Li-ion batteries: 18650-type—13 samples; 21700-type—1 sample; total of 14 samples. (b) Pouch-type Li-ion batteries: size 300 × 100 × 10 mm; total of 3 samples. (c) Supercapacitor: diameter 60 × height 140 mm; total of 1 sample.

Figure 15.
Experimental apparatus.

Figure 16.
Voltage and current waveforms when measuring impedance spectrum.

Figure 17.
Equivalent circuit and typical curve fitting.

Figure 18.
Impedance spectra of 18650-type Li-ion batteries (non-protection device).

Figure 19.
Impedance spectra of 18650-type (cylindrical 3400–3600 mAh) Li-ion batteries (built-in protection device).
Figure 19.
Impedance spectra of 18650-type (cylindrical 3400–3600 mAh) Li-ion batteries (built-in protection device).

Figure 20.
Impedance spectra of 2600 mAh 18650-type Li-ion batteries (built-in protection device).

Figure 21.
Impedance spectrum of 21700-type Li-ion Batteries (built-in protection device).

Figure 22.
Impedance spectra of cylindrical Li-ion batteries.

Figure 23.
Impedance spectra of pouch-type Li-ion batteries.

Figure 24.
Impedance spectra of supercapacitor.

Figure 25.
Discharge voltage and current waveforms of Li-ion batteries and supercapacitor.


Table 1.
Specifications and parameters of the Li-ion batteries and supercapacitor.
| Device Type of Energy Storage | Company | Quantity | Value | |
|---|---|---|---|---|
| Cylindrical Li-ion battery | 18650 | ① Fairman (Kor.) | Capacity | 3500 mAh |
| Type | Built-in protection device | |||
| Color | Yellow | |||
| ② Fairman (Kor.) | Capacity | 3400 mAh | ||
| Type | Built-in protection device | |||
| Color | Orange | |||
| ③ Fairman (Kor.) | Capacity | 2600 mAh | ||
| Type | Built-in protection device | |||
| Color | Blue | |||
| ④ Fairman (Kor.) | Capacity | 2600 mAh | ||
| Type | Built-in protection device | |||
| Color | Dark pink | |||
| ⑤ Samsung (Kor.) | Capacity | 3000 mAh | ||
| Type | Non-protection device | |||
| Color | Pink | |||
| ⑥ Samsung (Kor.) | Capacity | 2900 mAh | ||
| Type | Non-protection device | |||
| Color | Blue | |||
| ⑦ Samsung (Kor.) | Capacity | 2600 mAh | ||
| Type | Non-protection device | |||
| Color | Pink | |||
| ⑧ LG (Kor.) | Capacity | 3500 mAh | ||
| Type | Built-in protection device | |||
| Color | Yellow/Black | |||
| ⑨ LG (Kor.) | Capacity | 2600 mAh | ||
| Type | Built-in protection device | |||
| Color | Green | |||
| ⑩ LG (Kor.) | Capacity | 2600 mAh | ||
| Type | Non-protection device | |||
| Color | Purple | |||
| ⑪ Panasonic (Jap.) | Capacity | 3600 mAh | ||
| Type | Built-in protection device | |||
| Color | Green | |||
| ⑫ Shenzhen TrushFire Tech. (Chi.) | Capacity | 3600 mAh | ||
| Type | Built-in protection device | |||
| Color | Black | |||
| ⑬ Shenzhen JiaChuangMing Tech. (Chi.) | Capacity | 2600 mAh | ||
| Type | Built-in protection device | |||
| Color | Pink | |||
| 21700 | ⑭ Samsung (Kor.) | Capacity | 5000 mAh | |
| Type | Built-in protection device | |||
| Color | Black | |||
| Pouch-type Li-ion battery | Ⓐ Shenzhen Aoyouji Energy Electronics (Chi.) | Capacity | 50.5 Ah | |
| Type | Non-protection device | |||
| Color | BEV battery | |||
| Ⓑ China Soundon New Energy (Chi.) | Capacity | 48 Ah | ||
| Type | Non-protection device | |||
| Color | BEV battery | |||
| Ⓒ A123System LLC (Chi.) | Capacity | 37 Ah | ||
| Type | Non-protection device | |||
| Color | PHEV battery | |||
| Supercapacitor | Shenzhen Yedianxinbang Tech. (Chi.) | Capacity | 600 F | |
| Rated voltage | DC 2.7 V | |||
Table 2.
, and values of Li-ion batteries and supercapacitor.
| Cell Type | Charging 4.1–4.2 V | Charging 2.5–3.0 V | ||||||
|---|---|---|---|---|---|---|---|---|
| RS[mΩ] | RP[mΩ] | CP[F] | RS[mΩ] | RP[mΩ] | CP[F] | |||
| C Y L I N D R E R | 18650 | ① Fairman 3500 mAh Built-in protection | 49.2132 | 12.1129 | 0.4140 | 50.9349 | 26.0793 | 0.5439 |
| 18650 | ② Fairman 3400 mAh Built-in protection | 77.4560 | 26.3065 | 0.4286 | 71.1773 | 55.2958 | 7.2934 | |
| 18650 | ③ Fairman 2600 mAh Built-in protection | 66.9574 | 21.5832 | 0.5269 | 81.2983 | 33.1674 | 0.8552 | |
| 18650 | ④ Fairman 2600 mAh Built-in protection | 80.1501 | 32.5909 | 0.6811 | 83.2599 | 58.2183 | 0.8534 | |
| 18650 | ⑤ Samsung 3000 mAh Non-protection | 14.5825 | 8.0615 | 0.4300 | 15.7654 | 19.1020 | 0.9763 | |
| 18650 | ⑥ Samsung 2900 mAh Non-protection | 23.2917 | 9.5717 | 0.3764 | 24.3366 | 24.0597 | 12.5382 | |
| 18650 | ⑦ Samsung 2600 mAh Non-protection | 37.7485 | 22.9729 | 0.3525 | 41.1192 | 47.4514 | 1.9968 | |
| 18650 | ⑧ LG 3500 mAh Built-in protection | 48.7836 | 14.5156 | 0.3427 | 52.2040 | 28.7976 | 0.5290 | |
| 18650 | ⑨ LG 2600 mAh Built-in protection | 63.4390 | 8.0161 | 0.6920 | 68.0641 | 29.1099 | 182.175 | |
| 18650 | ⑩ LG 2600 mAh Non-protection | 37.3298 | 9.0120 | 0.6067 | 40.9606 | 29.8173 | 6.6918 | |
| 18650 | ⑪ Panasonic 3600 mAh Built-in protection | 48.8667 | 40.5615 | 4.6757 | 52.8348 | 63.5486 | 12.2790 | |
| 18650 | ⑫ Shenzhen TrushFire Tech. 3600 mAh Built-in protection | 61.4019 | 36.9122 | 1.5803 | 64.9093 | 81.3262 | 9.9237 | |
| 18650 | ⑬ Shenzhen JiaChuangMing Tech. 2600 mAh Built-in protection | 69.4137 | 18.2993 | 0.5883 | 74.3780 | 22.6098 | 0.4537 | |
| 21700 | ⑭ Samsung 5000 mAh Built-in protection | 25.4537 | 7.2190 | 0.2645 | 28.0604 | 14.0903 | 0.4479 | |
| P O U C H | Ⓐ Shenzhen Aoyouji Energy 50.5 Ah Non-protection | 0.8625 | - | 41.2273 | 0.8941 | - | 3694.40 | |
| Ⓑ China Soundon New Energy 48 Ah Non-protection | 0.9151 | - | 14.6219 | 1.0247 | - | 1480.24 | ||
| Ⓒ A123System 37 Ah Non-protection | 1.0420 | - | 19.6525 | 1.0209 | - | 2746.89 | ||
| Supercapacitor Shenzhen Yedianxinbang 600 F | 0.4779 | - | 2427.99 | 0.5737 | - | 2855.31 | ||
Disclaimer/Publisher’s Note: The statements, opinions and data contained in all publications are solely those of the individual author(s) and contributor(s) and not of MDPI and/or the editor(s). MDPI and/or the editor(s) disclaim responsibility for any injury to people or property resulting from any ideas, methods, instructions or products referred to in the content. |
© 2023 by the author. Licensee MDPI, Basel, Switzerland. This article is an open access article distributed under the terms and conditions of the Creative Commons Attribution (CC BY) license (https://creativecommons.org/licenses/by/4.0/).
Share and Cite
MDPI and ACS Style
Bae, J.-Y. Electrical Modeling and Impedance Spectra of Lithium-Ion Batteries and Supercapacitors. Batteries 2023, 9, 160. https://doi.org/10.3390/batteries9030160
AMA Style
Bae J-Y. Electrical Modeling and Impedance Spectra of Lithium-Ion Batteries and Supercapacitors. Batteries. 2023; 9(3):160. https://doi.org/10.3390/batteries9030160
Chicago/Turabian StyleBae, Jin-Yong. 2023. "Electrical Modeling and Impedance Spectra of Lithium-Ion Batteries and Supercapacitors" Batteries 9, no. 3: 160. https://doi.org/10.3390/batteries9030160
Note that from the first issue of 2016, this journal uses article numbers instead of page numbers. See further details here.