
Optimal Capacity and Cost Analysis of Battery Energy Storage System in Standalone Microgrid Considering Battery Lifetime

 ,
,  ,
,  and
and
Abstract
:1. Introduction
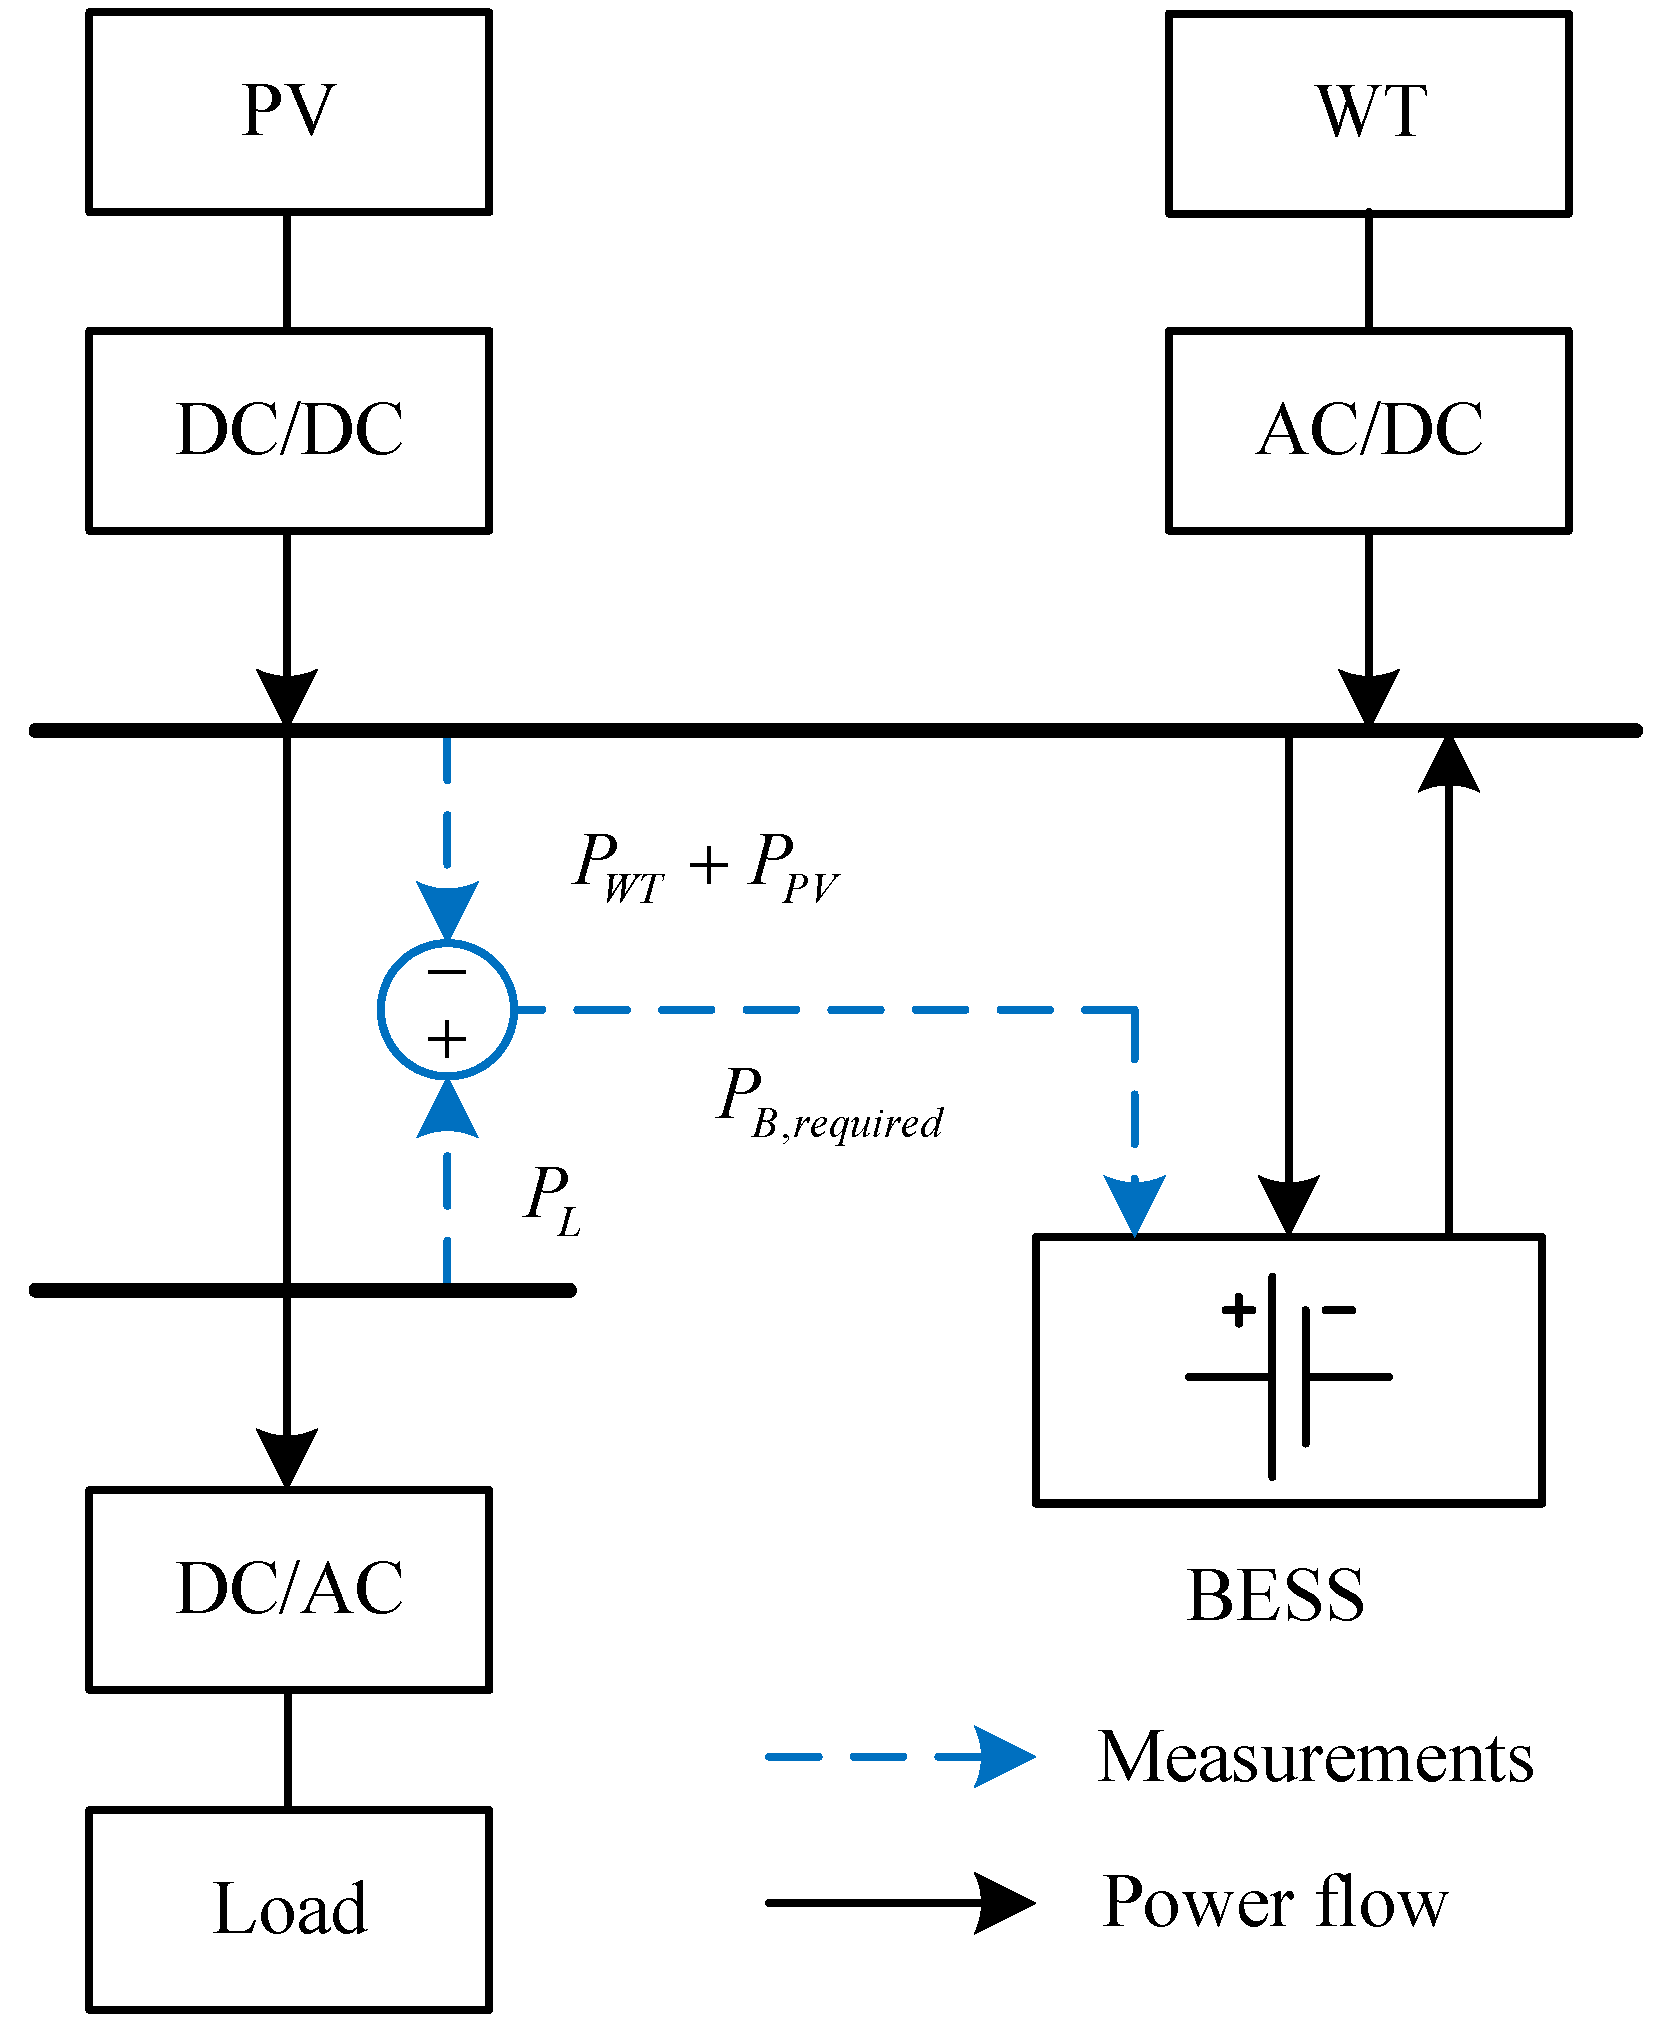
2. DGs and BESS Models
2.1. PV Model
2.2. Wind Turbine Model
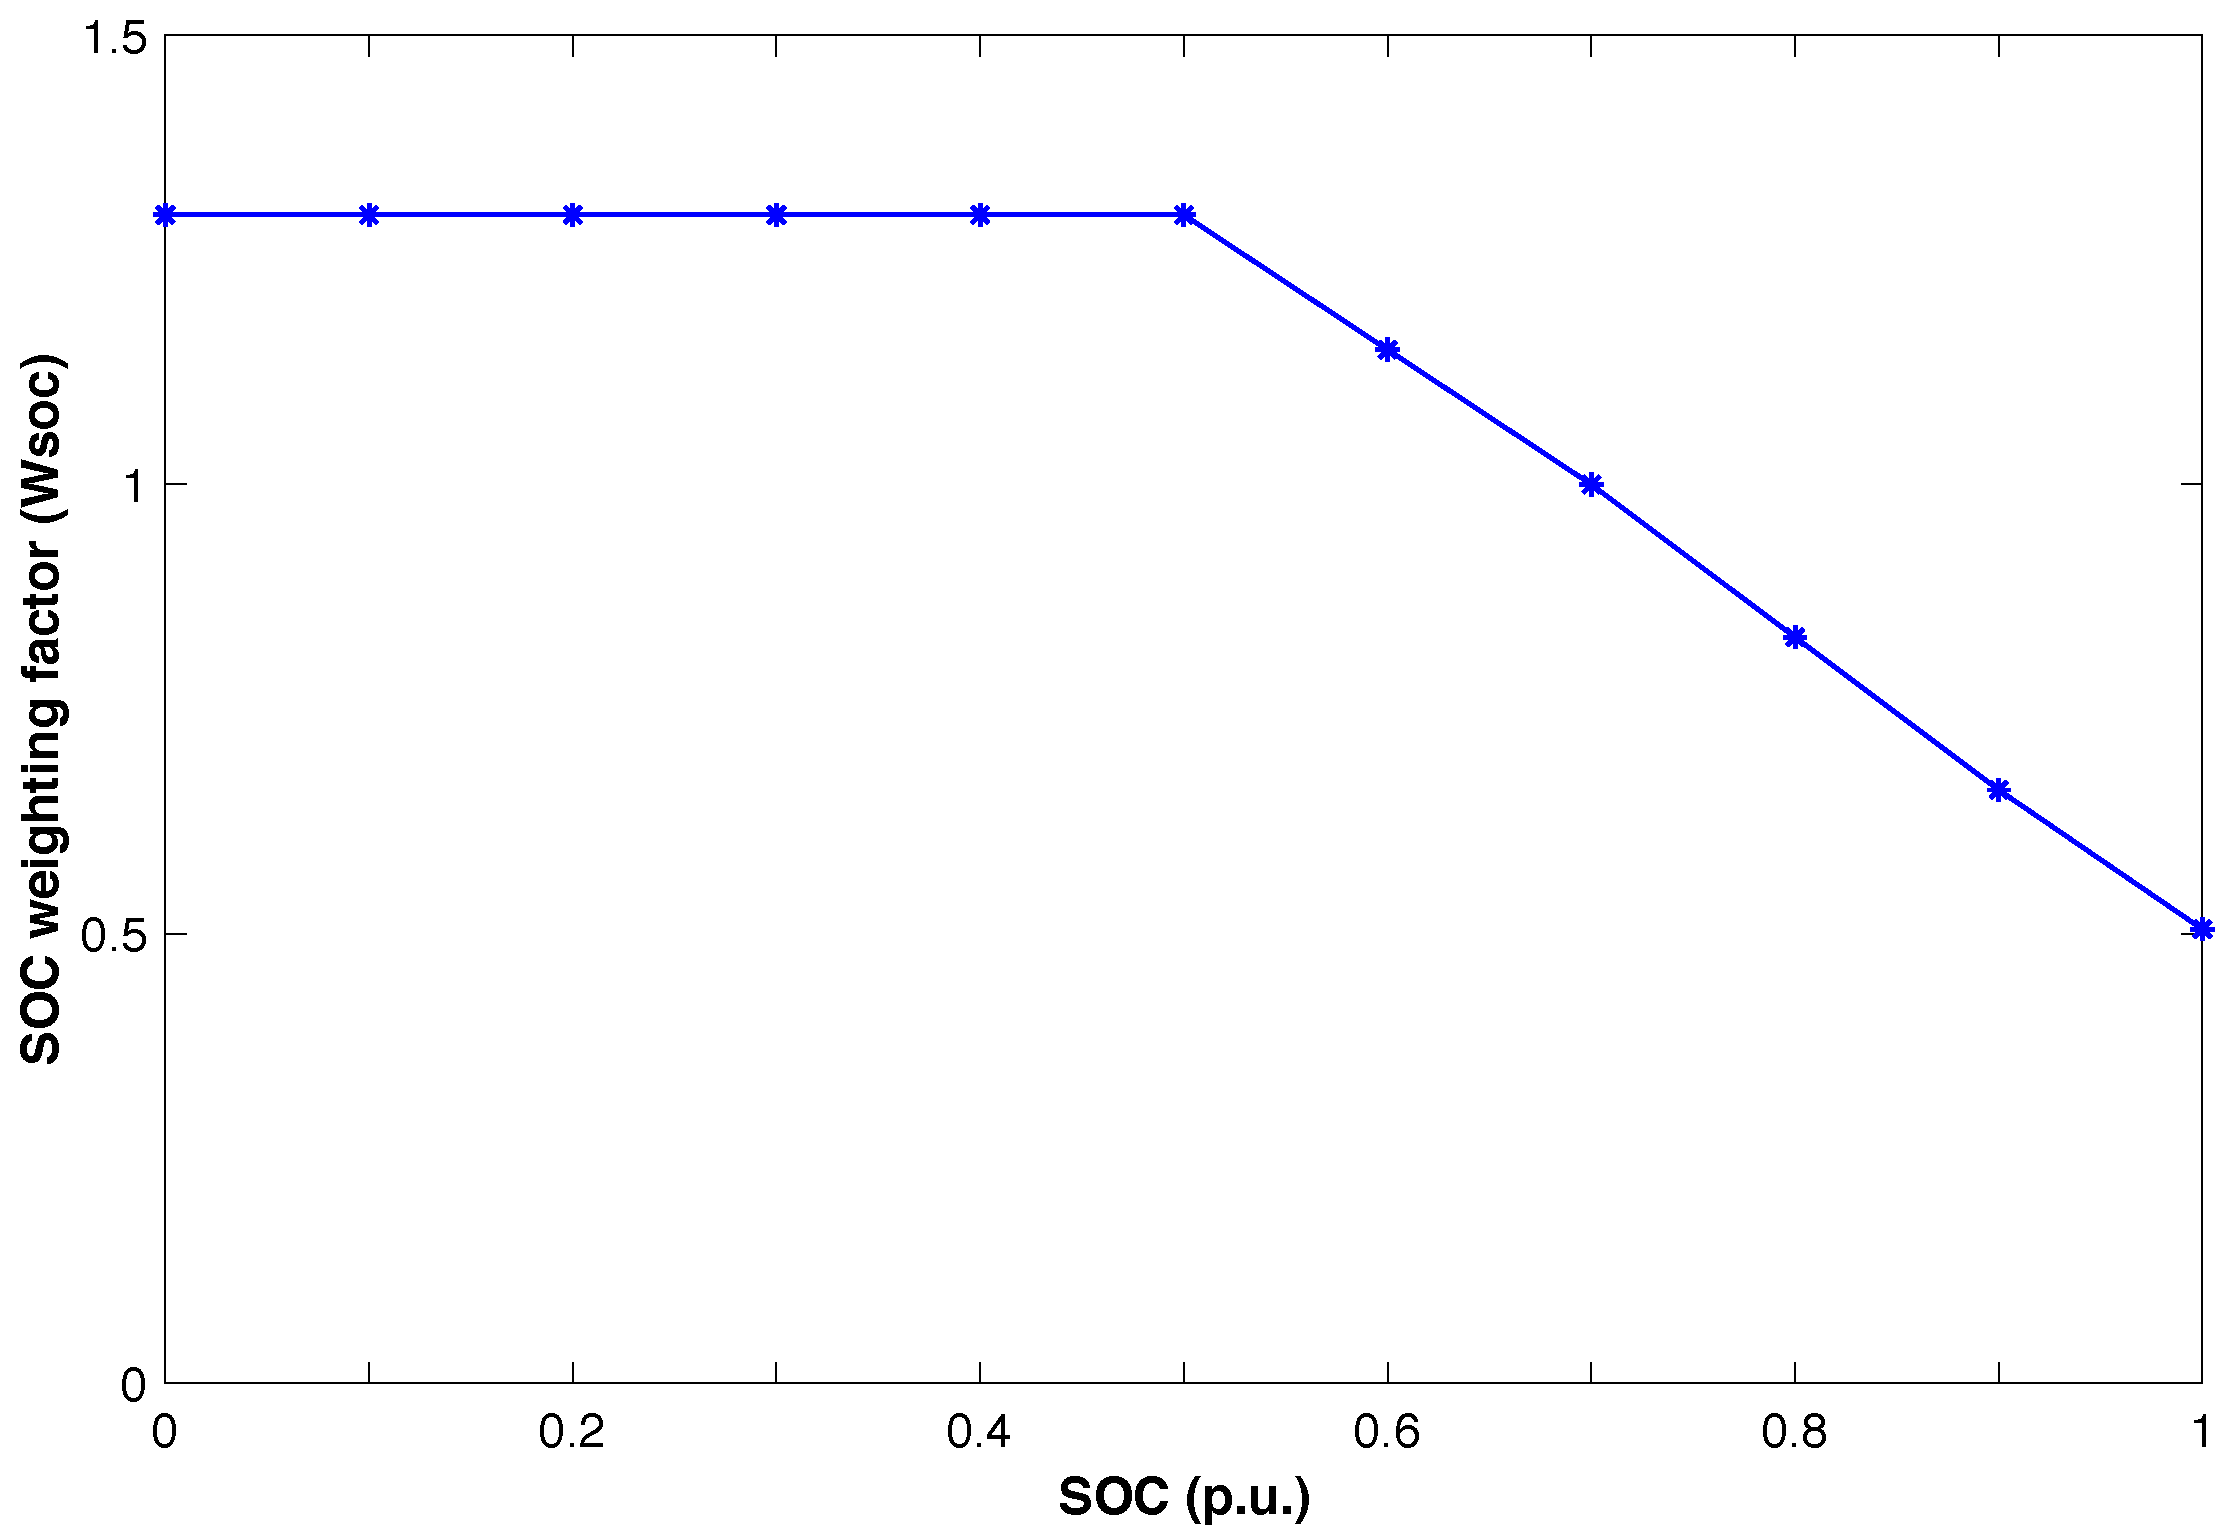
2.3. BESS Model
2.4. BESS Capacity Model
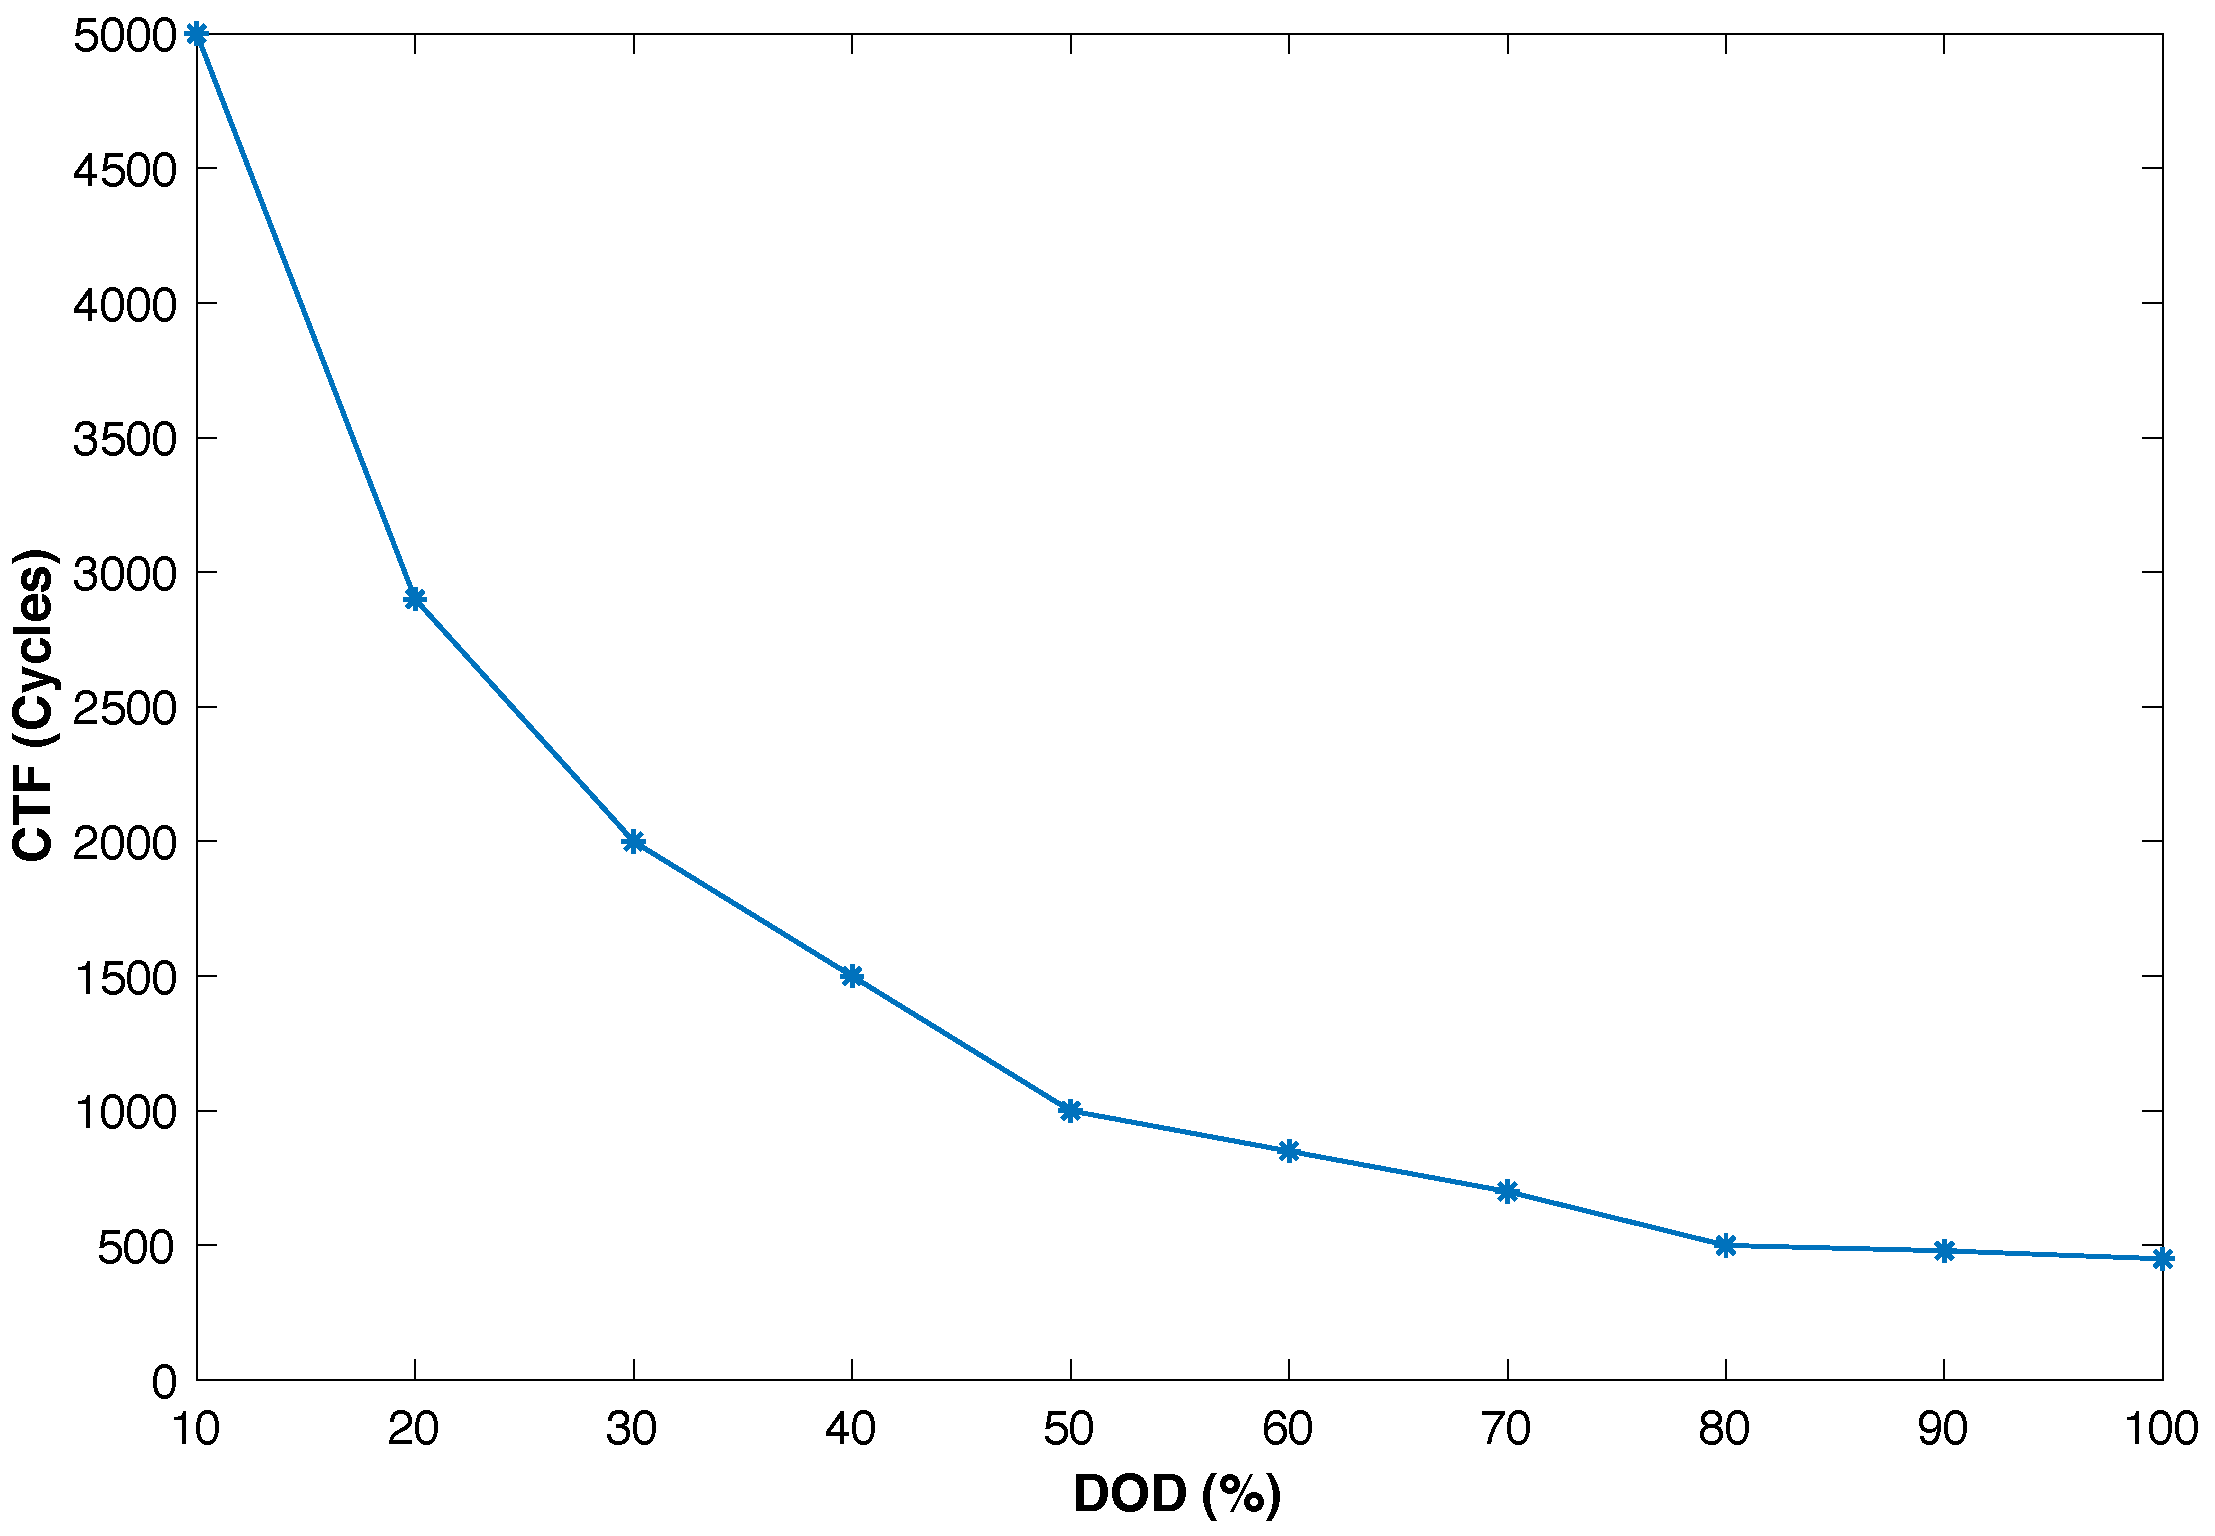
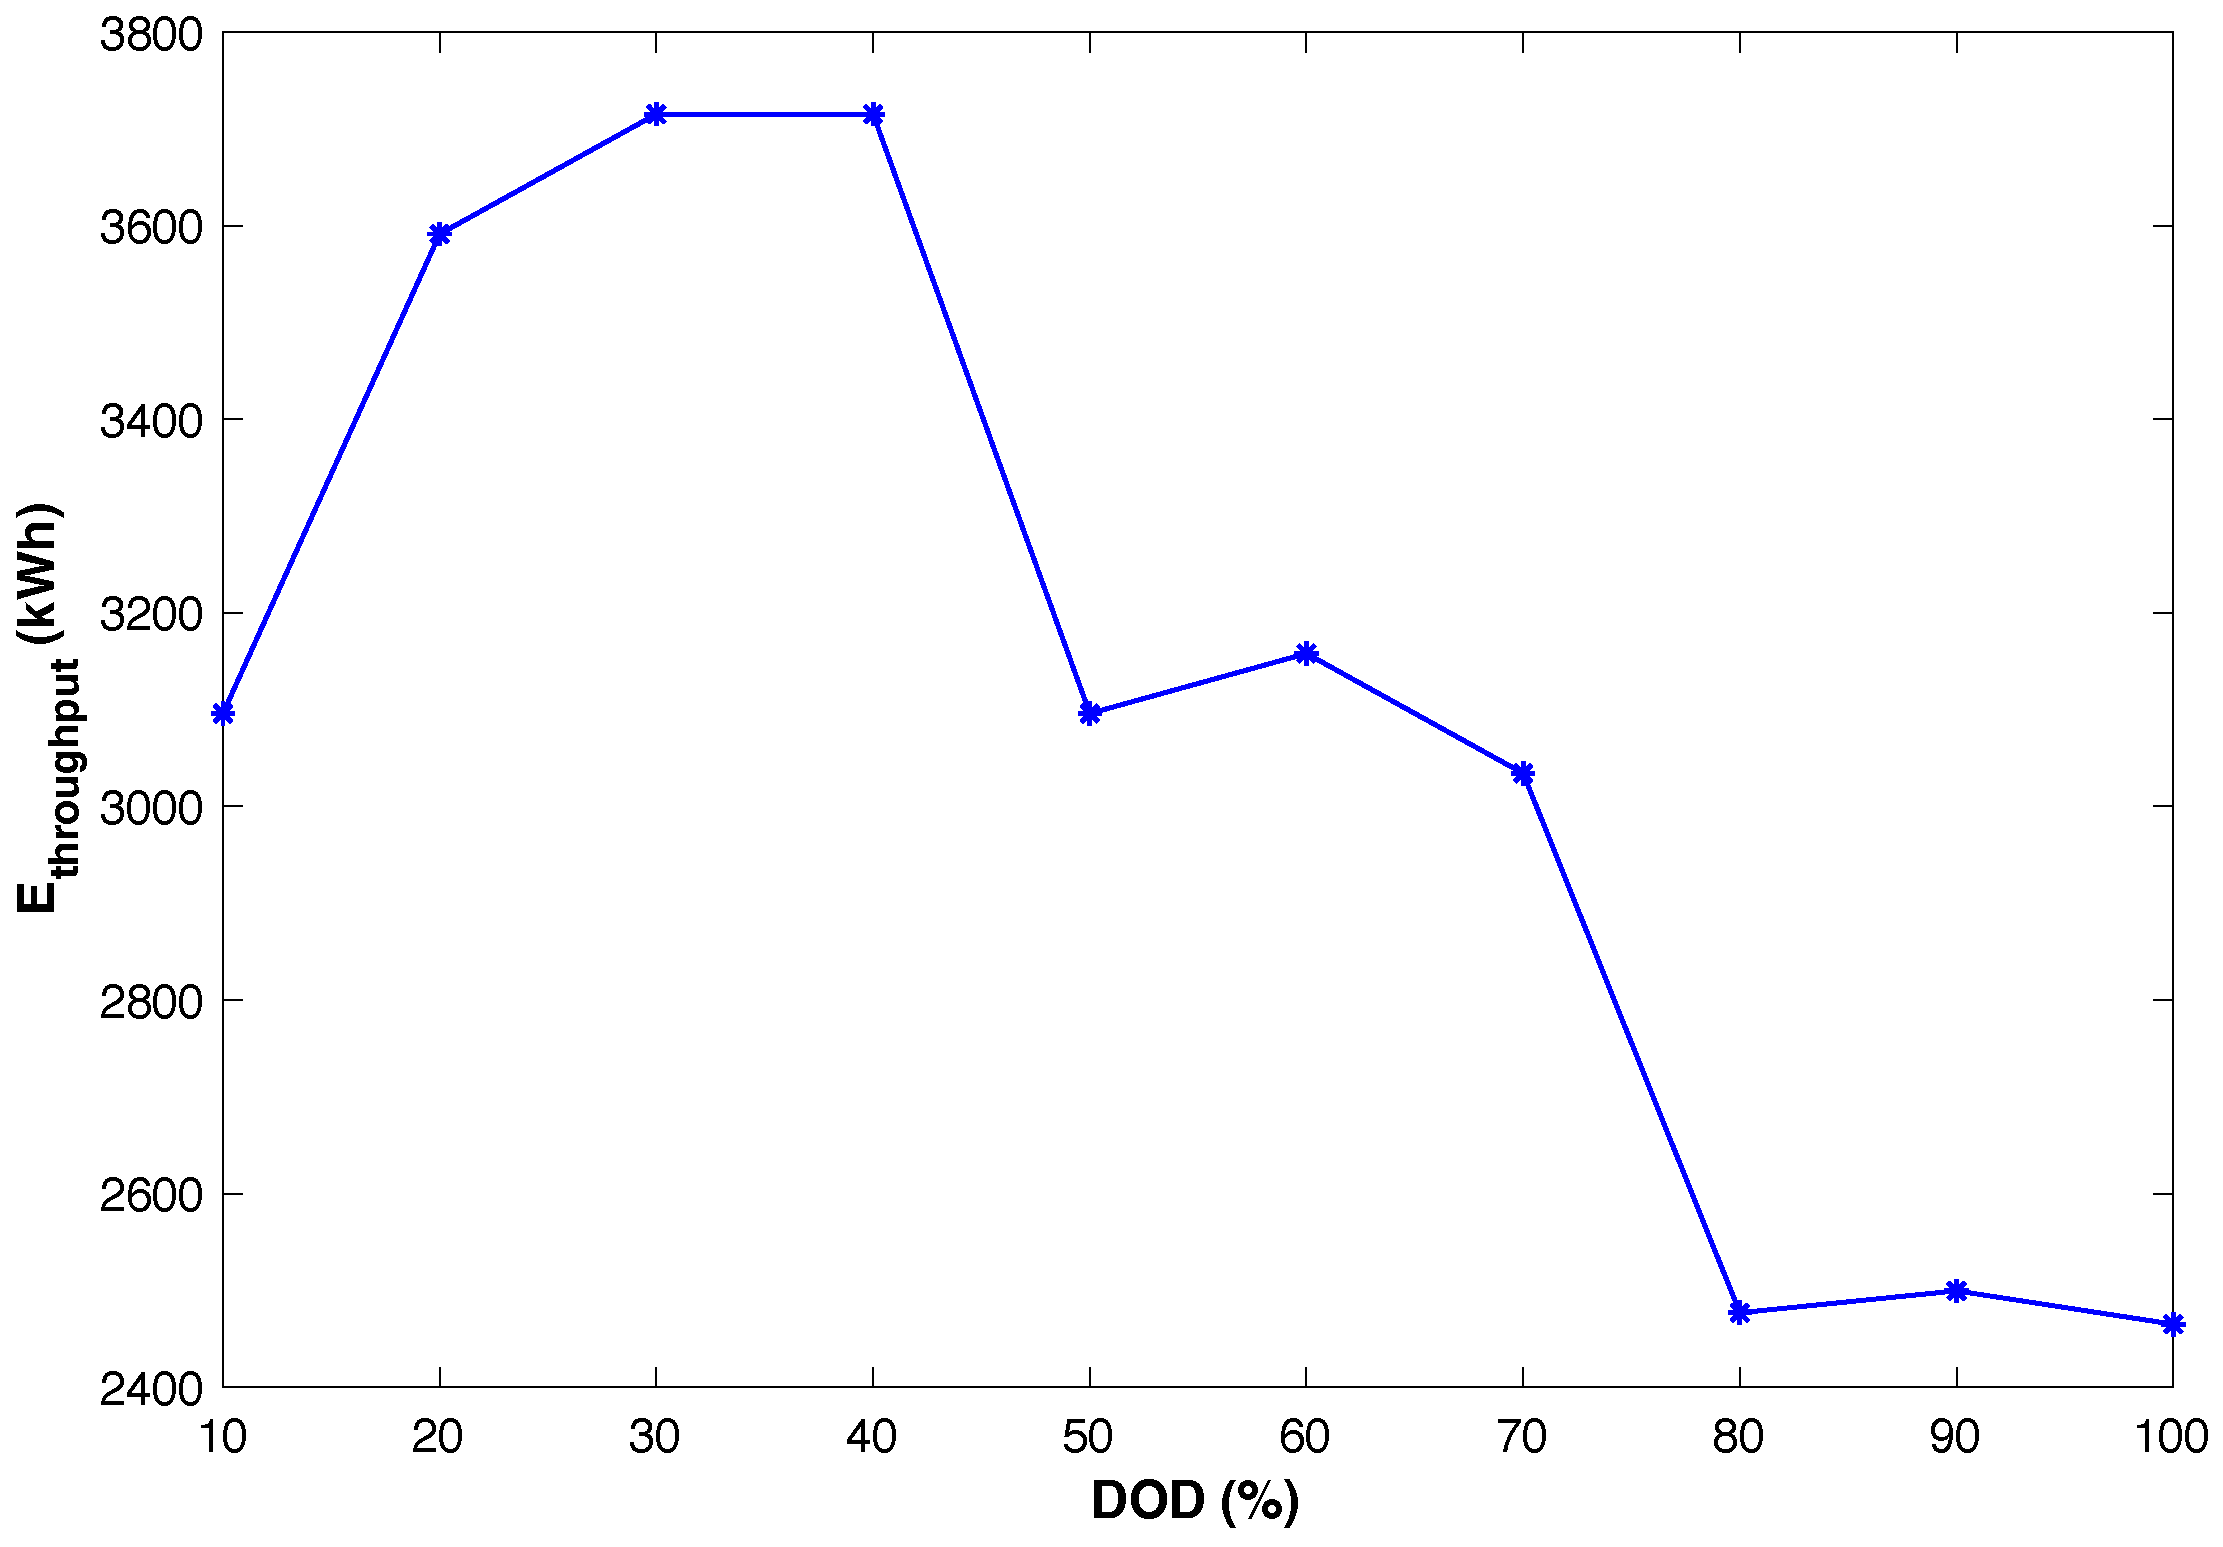
2.5. BESS Lifetime Estimation
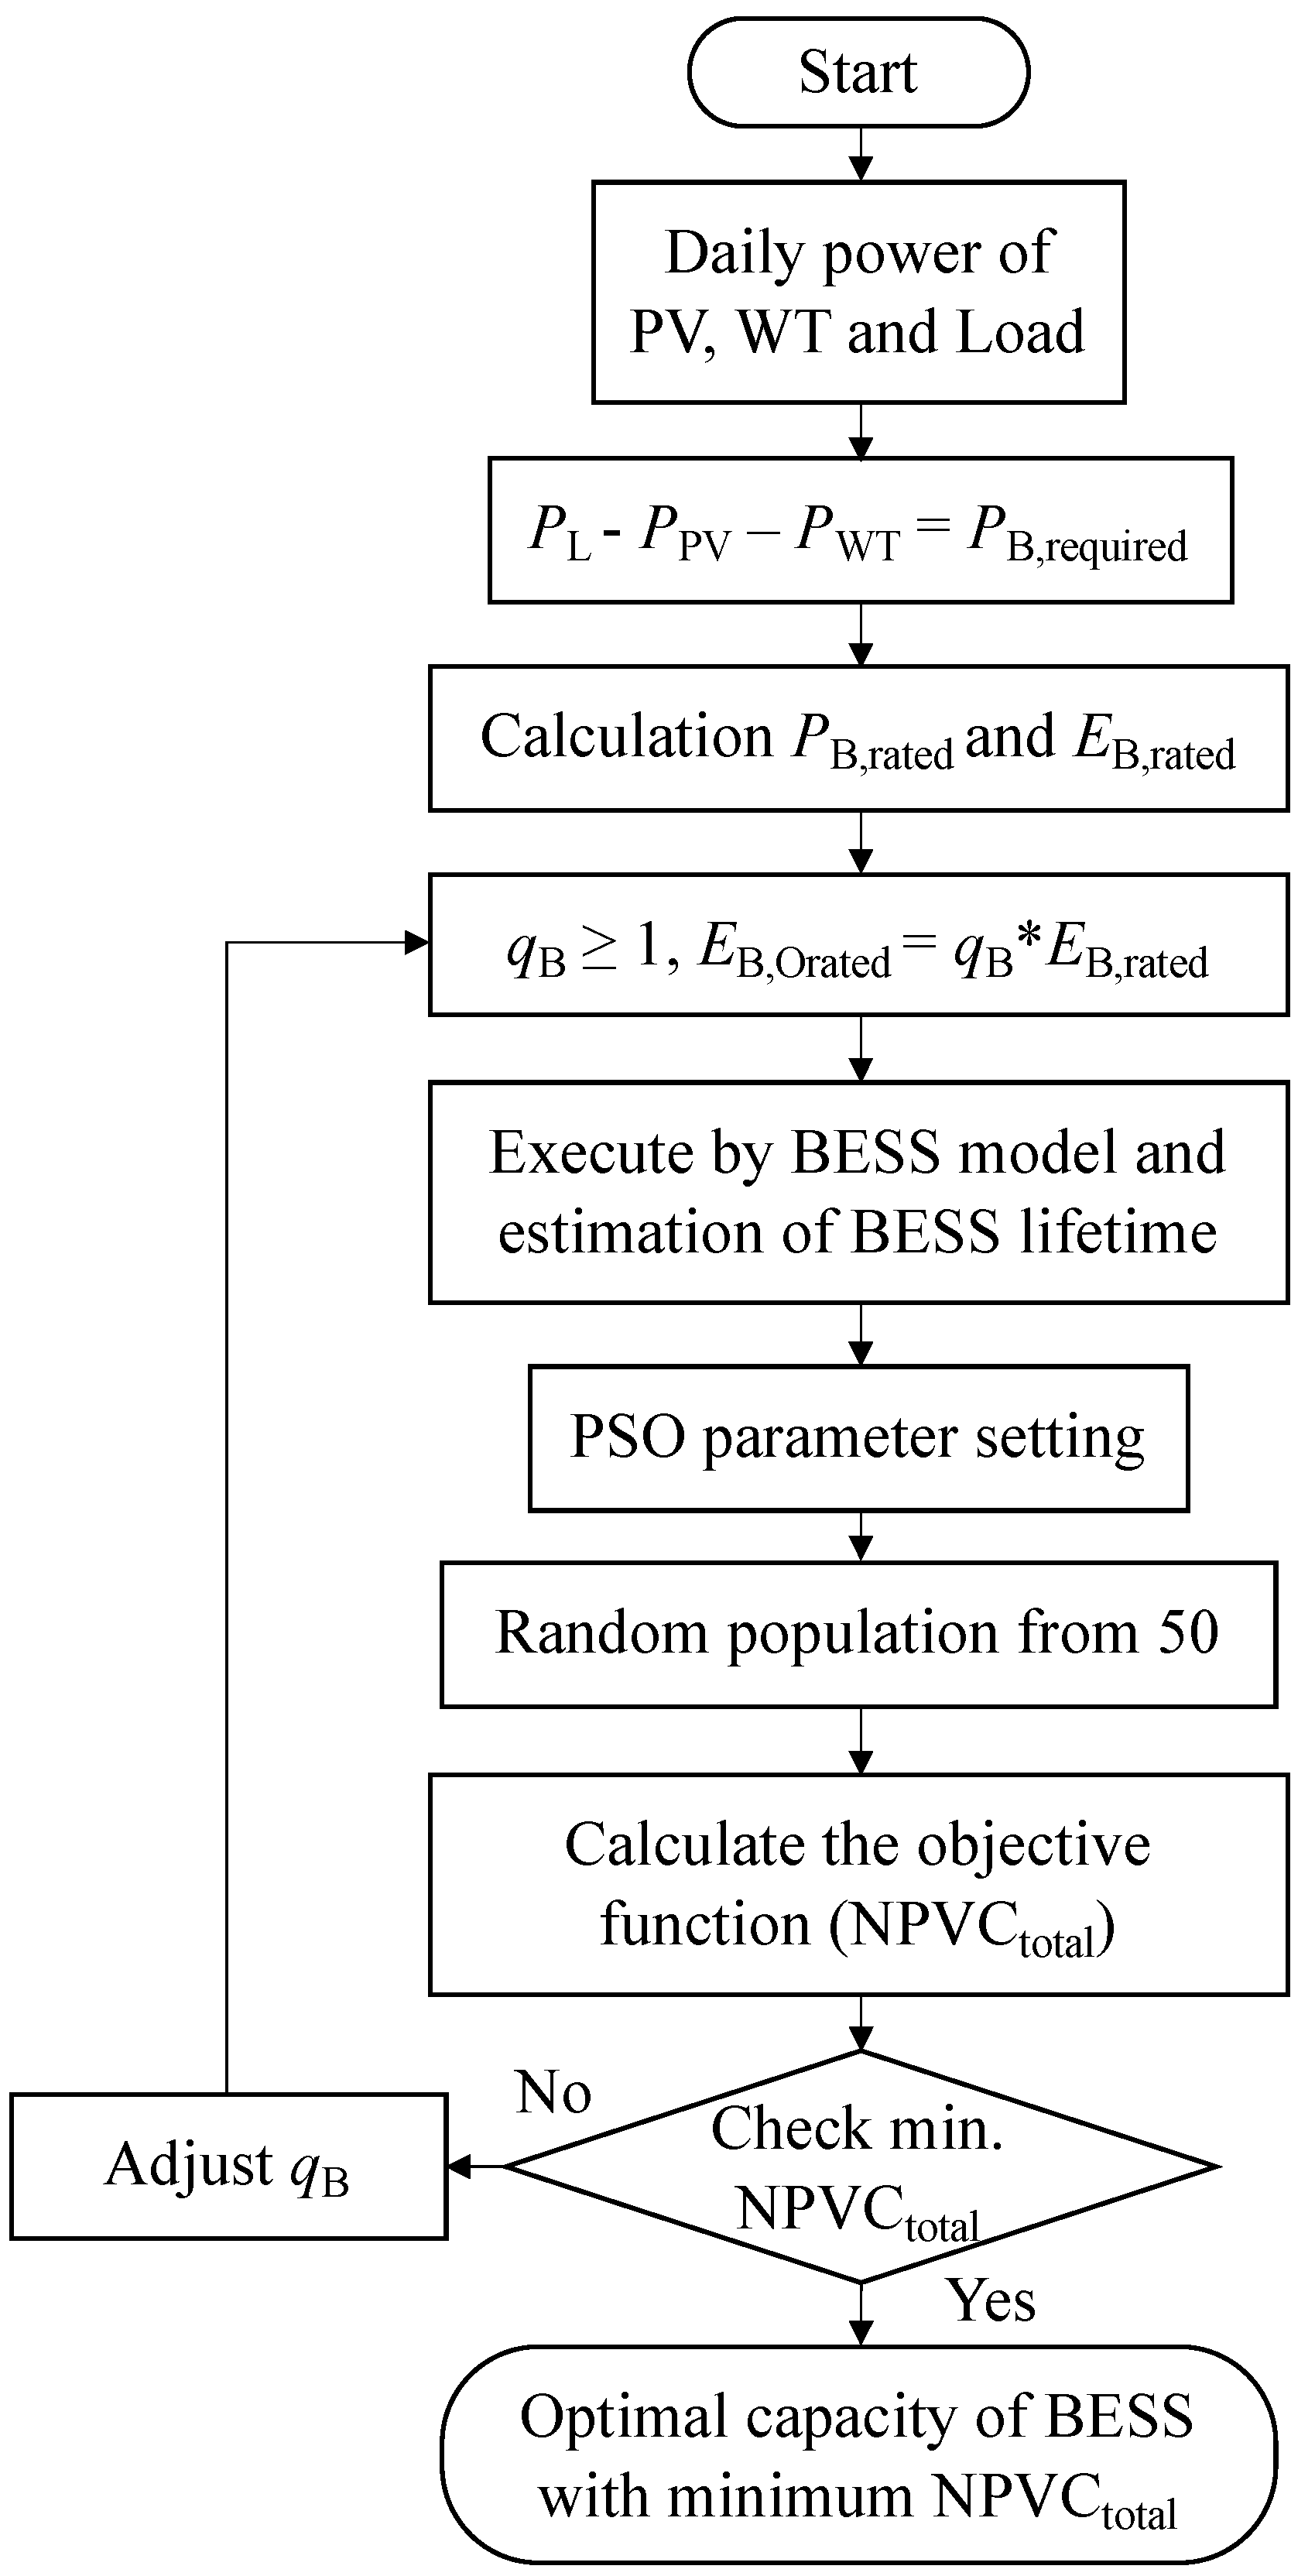
3. Optimization Model
3.1. Objective Function
3.2. PSO Algorithm
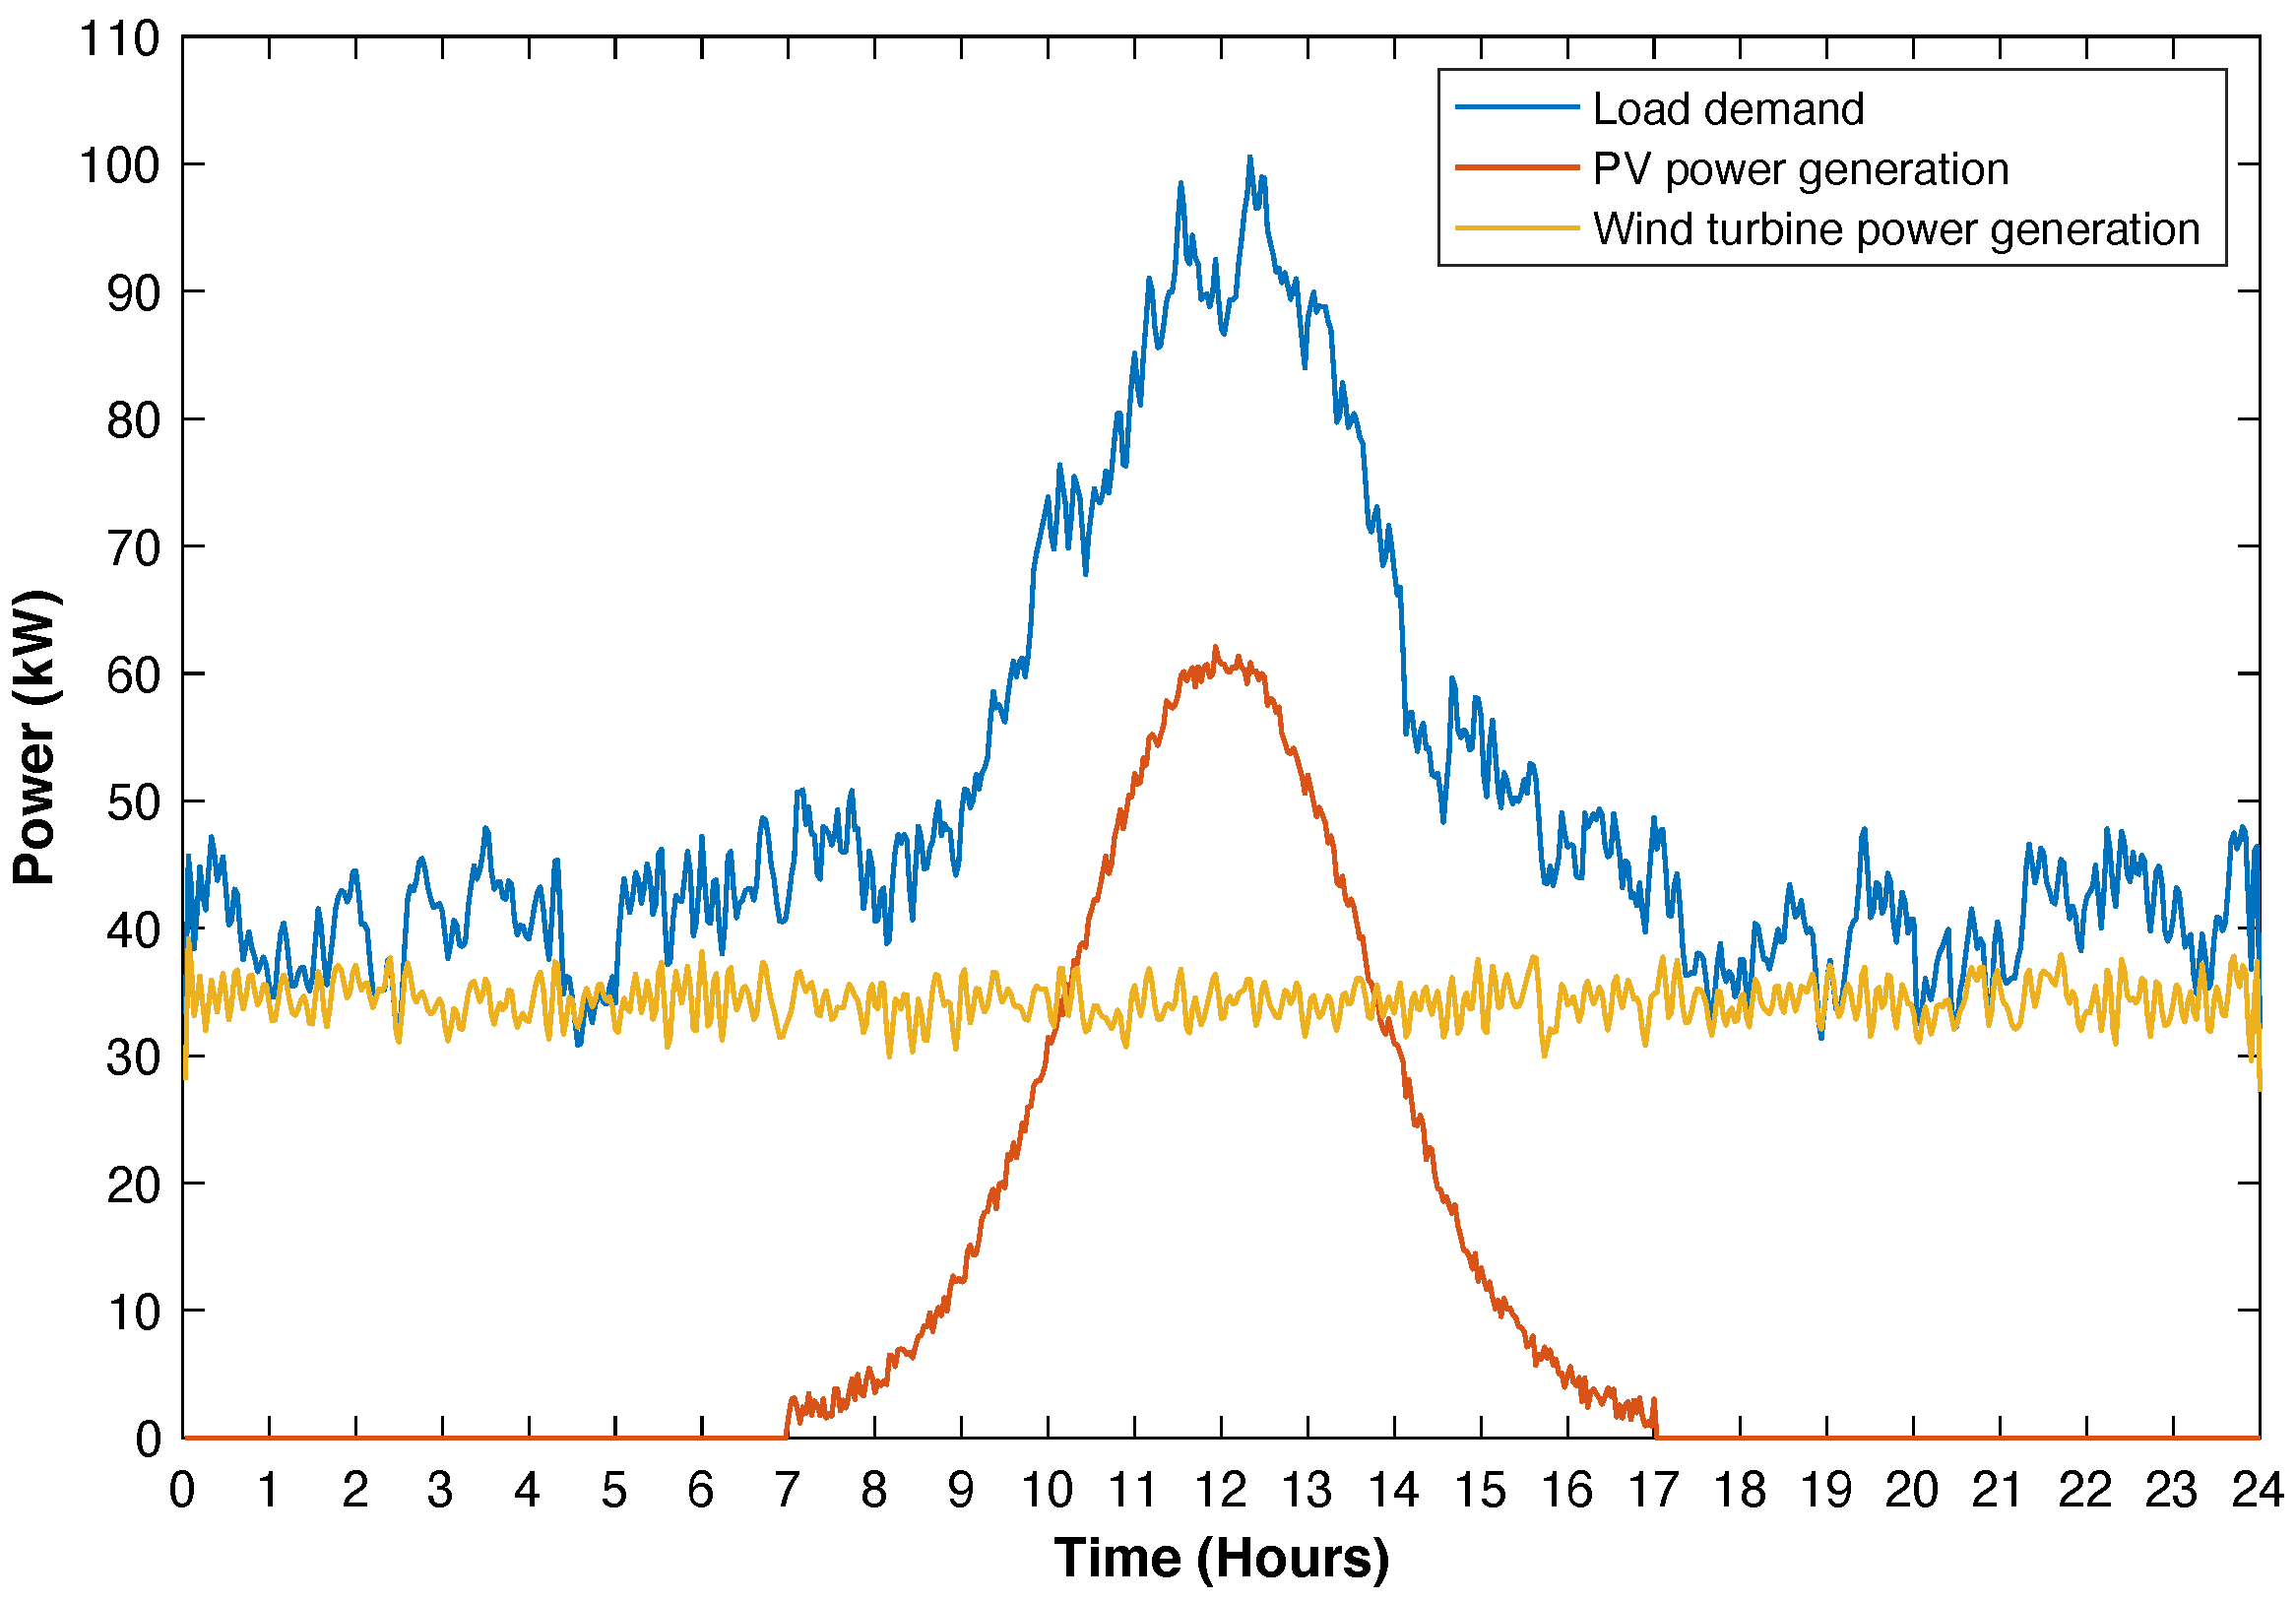
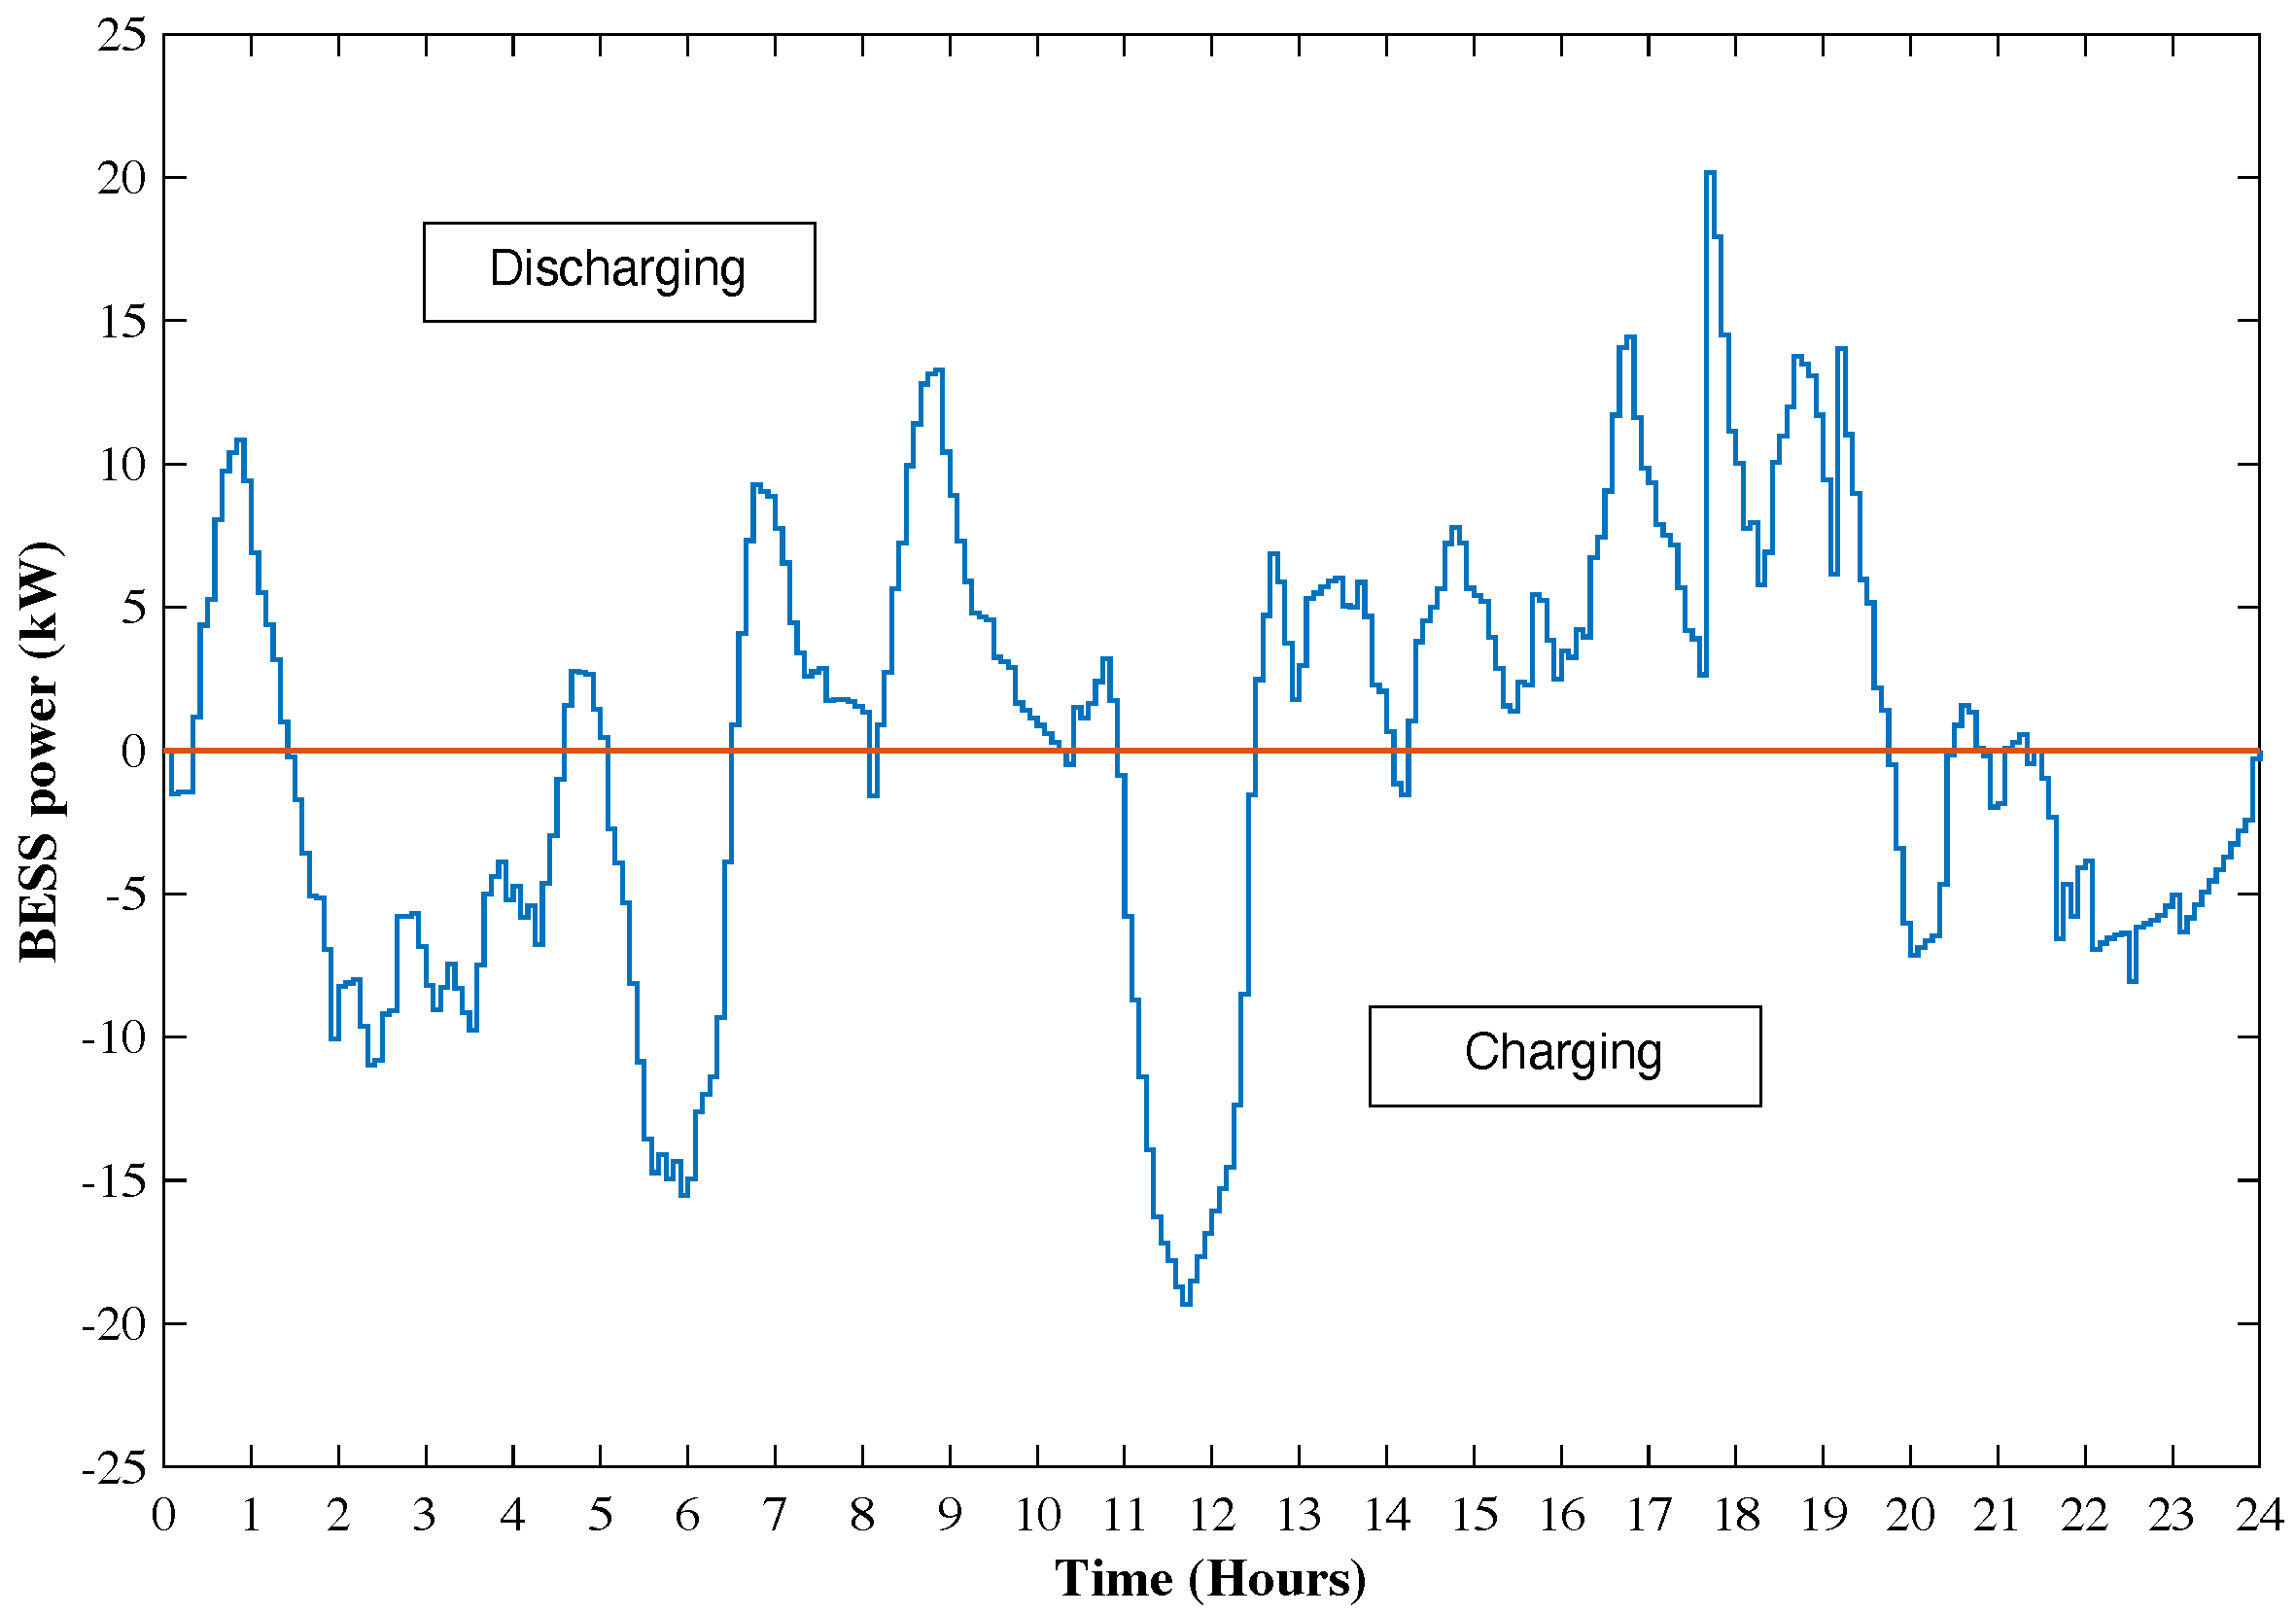
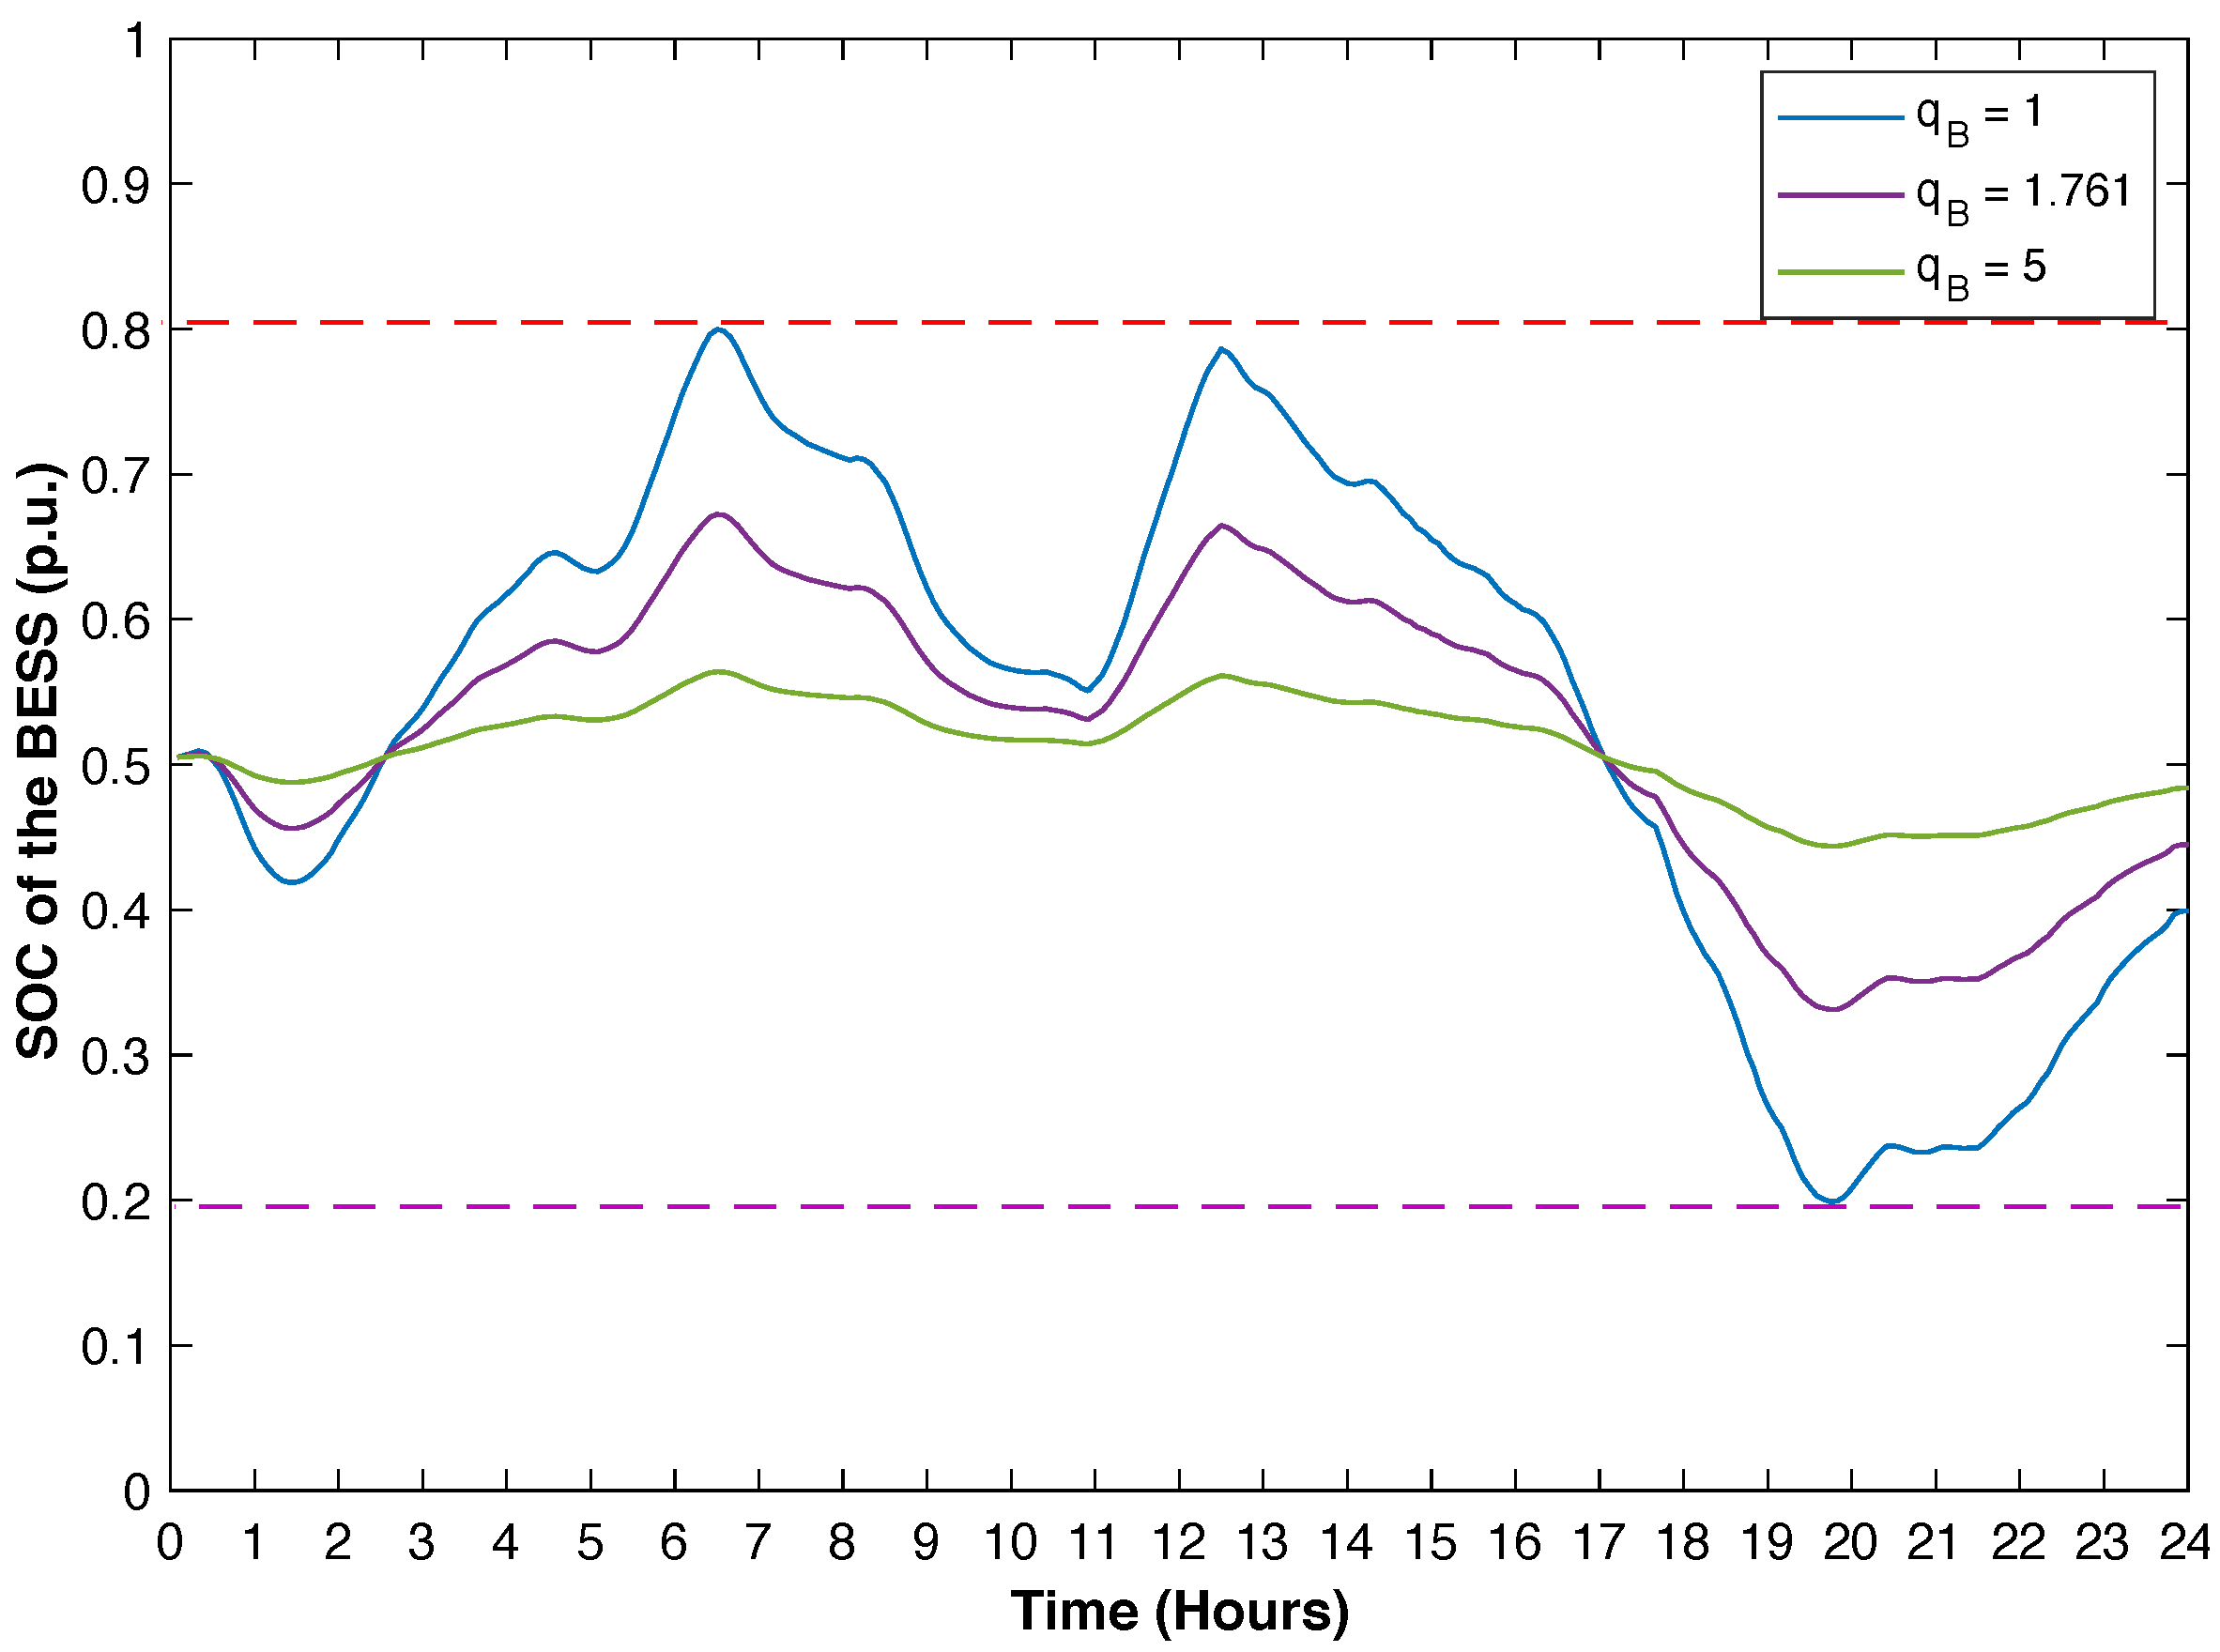
4. Results
5. Conclusions
Author Contributions
Funding
Institutional Review Board Statement
Informed Consent Statement
Conflicts of Interest
Abbreviations
| BESS | Battery Energy Storage System |
| Acceleration factors | |
| Initial cost | |
| Fixed operation and maintenance cost | |
| Replacement cost | |
| Cycles to failure | |
| Total cost | |
| d | Discount rate |
| DGs | Distributed generation system |
| Depth of discharge | |
| Battery energy | |
| Battery capacity | |
| Battery’s oversize energy | |
| Battery throughput corresponding to a specified DOD | |
| Average battery throughput | |
| The best global solution | |
| The solar irradiance on the operating time | |
| The solar irradiance on the standard test condition (STC) (1000w/) | |
| i | Particle index |
| Maximum iteration | |
| Temperature coefficient | |
| k | Discrete time index |
| The operation and maintenance cost set to 5% of the initial cost ($/kWh/year) | |
| The BESS initial cost per energy ($/kWh) | |
| The BESS initial cost per power ($/kW) | |
| BESS lifetime | |
| Life loss | |
| LPSP | Loss of power supply probability |
| n | Number of particles in the swarm |
| Net present value of cost | |
| Net present value | |
| Number of BESS replacement throughput the project | |
| Personal pest solution | |
| Output power limit of BESS | |
| Charging and discharging power of BESS | |
| BESS’s required power | |
| BESS’s rated power | |
| Upper limits of charging and discharging power of BESS | |
| Output power of PV system | |
| Rated output power of WT | |
| Rated output power at standard test condition | |
| PV | Photovoltaic |
| Output power of WT | |
| Adjusting factor | |
| Random number [0, 1] | |
| State of charge | |
| The PV temperature on the operating time | |
| Uniform series presents the worth factor | |
| v | Wind speed (m/s) |
| Velocity of the particle i | |
| Cut-in speed, rated speed and cut-off speed of WT | |
| w | Inertia factor |
| Weight factor | |
| x | Position of particle i |
| Battery’s self discharge rate | |
| Charging and discharging efficiency of BESS |
References
- Momoh, J.A. Smart Grid: Fundamentals of Design and Analysis; John Wiley & Sons: Hoboken, NJ, USA, 2012; Volume 63. [Google Scholar]
- Pinthurat, W.; Hredzak, B. Distributed Control Strategy of Single-Phase Battery Systems for Compensation of Unbalanced Active Powers in a Three-Phase Four-Wire Microgrid. Energies 2021, 14, 8287. [Google Scholar] [CrossRef]
- Annathurai, V.; Gan, C.K.; Ibrahim, K.A.; Baharin, K.A.; Ghani, M. A review on the impact of distributed energy resources uncertainty on distribution networks. Int. Rev. Electr. Eng. 2016, 11, 420. [Google Scholar] [CrossRef]
- Boonraksa, T.; Boonraksa, P.; Marungsri, B. Optimal capacitor location and sizing for reducing the power loss on the power distribution systems due to the dynamic load of the electric buses charging system using the artificial bee colony algorithm. J. Electr. Eng. Technol. 2021, 16, 1821–1831. [Google Scholar] [CrossRef]
- Hatziargyriou, N. Microgrids: Architectures and Control; John Wiley & Sons: Hoboken, NJ, USA, 2014. [Google Scholar]
- Chen, H.; Gao, L.; Zhang, Z.; Li, H. Optimal Energy Management Strategy for an Islanded Microgrid with Hybrid Energy Storage. J. Electr. Eng. Technol. 2021, 16, 1313–1325. [Google Scholar] [CrossRef]
- Chalise, S.; Sternhagen, J.; Hansen, T.M.; Tonkoski, R. Energy management of remote microgrids considering battery lifetime. Electr. J. 2016, 29, 1–10. [Google Scholar]
- Pinthurat, W.; Hredzak, B.; Konstantinou, G.; Fletcher, J. Techniques for compensation of unbalanced conditions in LV distribution networks with integrated renewable generation: An overview. Electr. Power Syst. Res. 2023, 214, 108932. [Google Scholar] [CrossRef]
- Gao, D.W. Energy Storage for Sustainable Microgrid; Academic Press: Cambridge, MA, USA, 2015. [Google Scholar]
- Elbaz, A.; Guneser, M.T. Multi-objective optimization method for proper configuration of grid-connected PV-wind hybrid system in terms of ecological effects, outlay, and reliability. J. Electr. Eng. Technol. 2021, 16, 771–782. [Google Scholar] [CrossRef]
- Sansa, I.; Belaaj, N.M.; Villafafilla, R. Optimal sizing design of an isolated micro grid keeping the longest battery lifetime. In Proceedings of the 2017 International Conference on Green Energy Conversion Systems (GECS), Hammamet, Tunisia, 23–25 March 2017; pp. 1–8. [Google Scholar]
- Falai, A.; Giuliacci, T.A.; Misul, D.A.; Anselma, P.G. Reducing the Computational Cost for Artificial Intelligence-Based Battery State-of-Health Estimation in Charging Events. Batteries 2022, 8, 209. [Google Scholar] [CrossRef]
- Iurilli, P.; Brivio, C.; Carrillo, R.E.; Wood, V. Physics-Based SoH Estimation for Li-Ion Cells. Batteries 2022, 8, 204. [Google Scholar] [CrossRef]
- Narayan, N.; Papakosta, T.; Vega-Garita, V.; Qin, Z.; Popovic-Gerber, J.; Bauer, P.; Zeman, M. Estimating battery lifetimes in Solar Home System design using a practical modelling methodology. Appl. Energy 2018, 228, 1629–1639. [Google Scholar] [CrossRef]
- Jenkins, D.P.; Fletcher, J.; Kane, D. Lifetime prediction and sizing of lead–acid batteries for microgeneration storage applications. IET Renew. Power Gener. 2008, 2, 191–200. [Google Scholar]
- Zhao, B.; Zhang, X.; Chen, J.; Wang, C.; Guo, L. Operation Optimization of Standalone Microgrids Considering Lifetime Characteristics of Battery Energy Storage System. IEEE Trans. Sustain. Energy 2013, 4, 934–943. [Google Scholar] [CrossRef]
- Anuphappharadorn, S.; Sukchai, S.; Sirisamphanwong, C.; Ketjoy, N. Comparison the economic analysis of the battery between lithium-ion and lead-acid in PV stand-alone application. Energy Procedia 2014, 56, 352–358. [Google Scholar] [CrossRef] [Green Version]
- Kebede, A.A.; Coosemans, T.; Messagie, M.; Jemal, T.; Behabtu, H.A.; Van Mierlo, J.; Berecibar, M. Techno-economic analysis of lithium-ion and lead-acid batteries in stationary energy storage application. J. Energy Storage 2021, 40, 102748. [Google Scholar] [CrossRef]
- Chen, S.X.; Gooi, H.B.; Wang, M.Q. Sizing of Energy Storage for Microgrids. IEEE Trans. Smart Grid 2012, 3, 142–151. [Google Scholar] [CrossRef]
- Bai, L.; Li, F.; Hu, Q.; Cui, H.; Fang, X. Application of battery-supercapacitor energy storage system for smoothing wind power output: An optimal coordinated control strategy. In Proceedings of the 2016 IEEE Power and Energy Society General Meeting (PESGM), Boston, MA, USA, 17–21 July 2016; pp. 1–5. [Google Scholar]
- Den Heeten, T.; Narayan, N.; Diehl, J.C.; Verschelling, J.; Silvester, S.; Popovic-Gerber, J.; Bauer, P.; Zeman, M. Understanding the present and the future electricity needs: Consequences for design of future Solar Home Systems for off-grid rural electrification. In Proceedings of the 2017 International Conference on the Domestic Use of Energy (DUE), Cape Town, South Africa, 4–5 April 2017; pp. 8–15. [Google Scholar]
- Narayan, N.; Popovic, J.; Diehl, J.C.; Silvester, S.; Bauer, P.; Zeman, M. Developing for developing nations: Exploring an affordable solar home system design. In Proceedings of the 2016 IEEE Global Humanitarian Technology Conference (GHTC), Seattle, WA, USA, 13–16 October 2016; pp. 474–480. [Google Scholar]
- Liu, C.; Wang, X.; Wu, X.; Guo, J. Economic scheduling model of microgrid considering the lifetime of batteries. IET Gener. Transm. Distrib. 2017, 11, 759–767. [Google Scholar] [CrossRef]
- Xtender, S. Sun Xtender® PVX-2580L Solar Battery Specifications. Available online: http://www.sunxtender.com/solarbattery.php?id=11 (accessed on 3 November 2022).
- Kennedy, J.; Eberhart, R. Particle swarm optimization. In Proceedings of the ICNN’95-International Conference on Neural Networks, Perth, Australia, 27 November–1 December 1995; Volume 4, pp. 1942–1948. [Google Scholar]
- Liu, H.; Ji, Y.; Zhuang, H.; Wu, H. Multi-objective dynamic economic dispatch of microgrid systems including vehicle-to-grid. Energies 2015, 8, 4476–4495. [Google Scholar] [CrossRef] [Green Version]
- Sreenivasan, G. Solution of dynamic economic load dispatch (DELD) problem with valve point loading effects and ramp rate limits using PSO. Int. J. Electr. Comput. Eng. 2011, 1, 59. [Google Scholar] [CrossRef] [Green Version]
- Dhayalini, K.; Sathiyamoorthy, S.; Rajan, C.A. Particle Swarm Optimization Technique for the Coordination of Optimal Wind and Thermal Generation Dispatch. Int. Rev. Electr. Eng. 2013, 8, 1843–1849. [Google Scholar]
- Shi, Y.; Eberhart, R.C. Parameter selection in particle swarm optimization. In Proceedings of the International Conference on Evolutionary Programming, San Diego, CA, USA, 25–27 March 1998; Springer: Berlin/Heidelberg, Germany, 1998; pp. 591–600. [Google Scholar]
- Birge, B. PSOt-a particle swarm optimization toolbox for use with Matlab. In Proceedings of the 2003 IEEE Swarm Intelligence Symposium. SIS’03 (Cat. No. 03EX706), Indianapolis, IN, USA, 26 April 2003; pp. 182–186. [Google Scholar]
- Homer Software. Available online: https://www.homerenergy.com/products/pro/index.html?fbclid=IwAR3mBIFJhn92zNB5JFMnuw96avfNlx1WH_3Px5DsVxO6RlxSclq_kuxcwU8 (accessed on 20 January 2018).
- Nguyen, C.L.; Lee, H.H. An optimal hybrid supercapacitor and battery energy storage system in wind power application. In Proceedings of the IECON 2015-41st Annual Conference of the IEEE Industrial Electronics Society, Yokohama, Japan, 9–12 November 2015; pp. 003010–003015. [Google Scholar]
- Microgrid, S. The Advantage, and Cost of Lead-Acid and Li-Ion. Available online: https://medium.com/solar-microgrid/battery-showdown-lead-acid-vs-lithium-ion-1d37a1998287 (accessed on 3 November 2022).
- Sivaram, A. Cost Comparison of Battery Technology. Available online: https://saurorja.org/2011/08/30/lead-acid-is-the-cheapest-battery-conditions-apply/ (accessed on 3 November 2022).
- Ren, M.; Mitchell, C.R.; Mo, W. Managing residential solar photovoltaic-battery systems for grid and life cycle economic and environmental co-benefits under time-of-use rate design. Conserv. Recycl. 2021, 169, 105527. [Google Scholar] [CrossRef]


| Parameter | Variable | Unit | Value |
|---|---|---|---|
| Project life | years | 20 | |
| BESS Calendar life | years | 10 | |
| BESS SOC limits | - | % | 20–80 |
| Charge/discharge efficiency | % | 90/90 | |
| Initial cost per energy [32,33,34] | $/kWh | 183.86 | |
| Initial cost per power | $/kW | 183.86 | |
| Operation & maintenance cost | $/kWh/year | 9.19 | |
| Discount rate [35] | d | % | 5 |
| ($) | ($) | ($) | ($) | |||
|---|---|---|---|---|---|---|
| 1.0 | 1.20 | 16 | 18,419 | 23.48 | 185,992 | 204,436 |
| 1.5 | 1.72 | 11 | 25,958 | 35.23 | 178,562 | 204,557 |
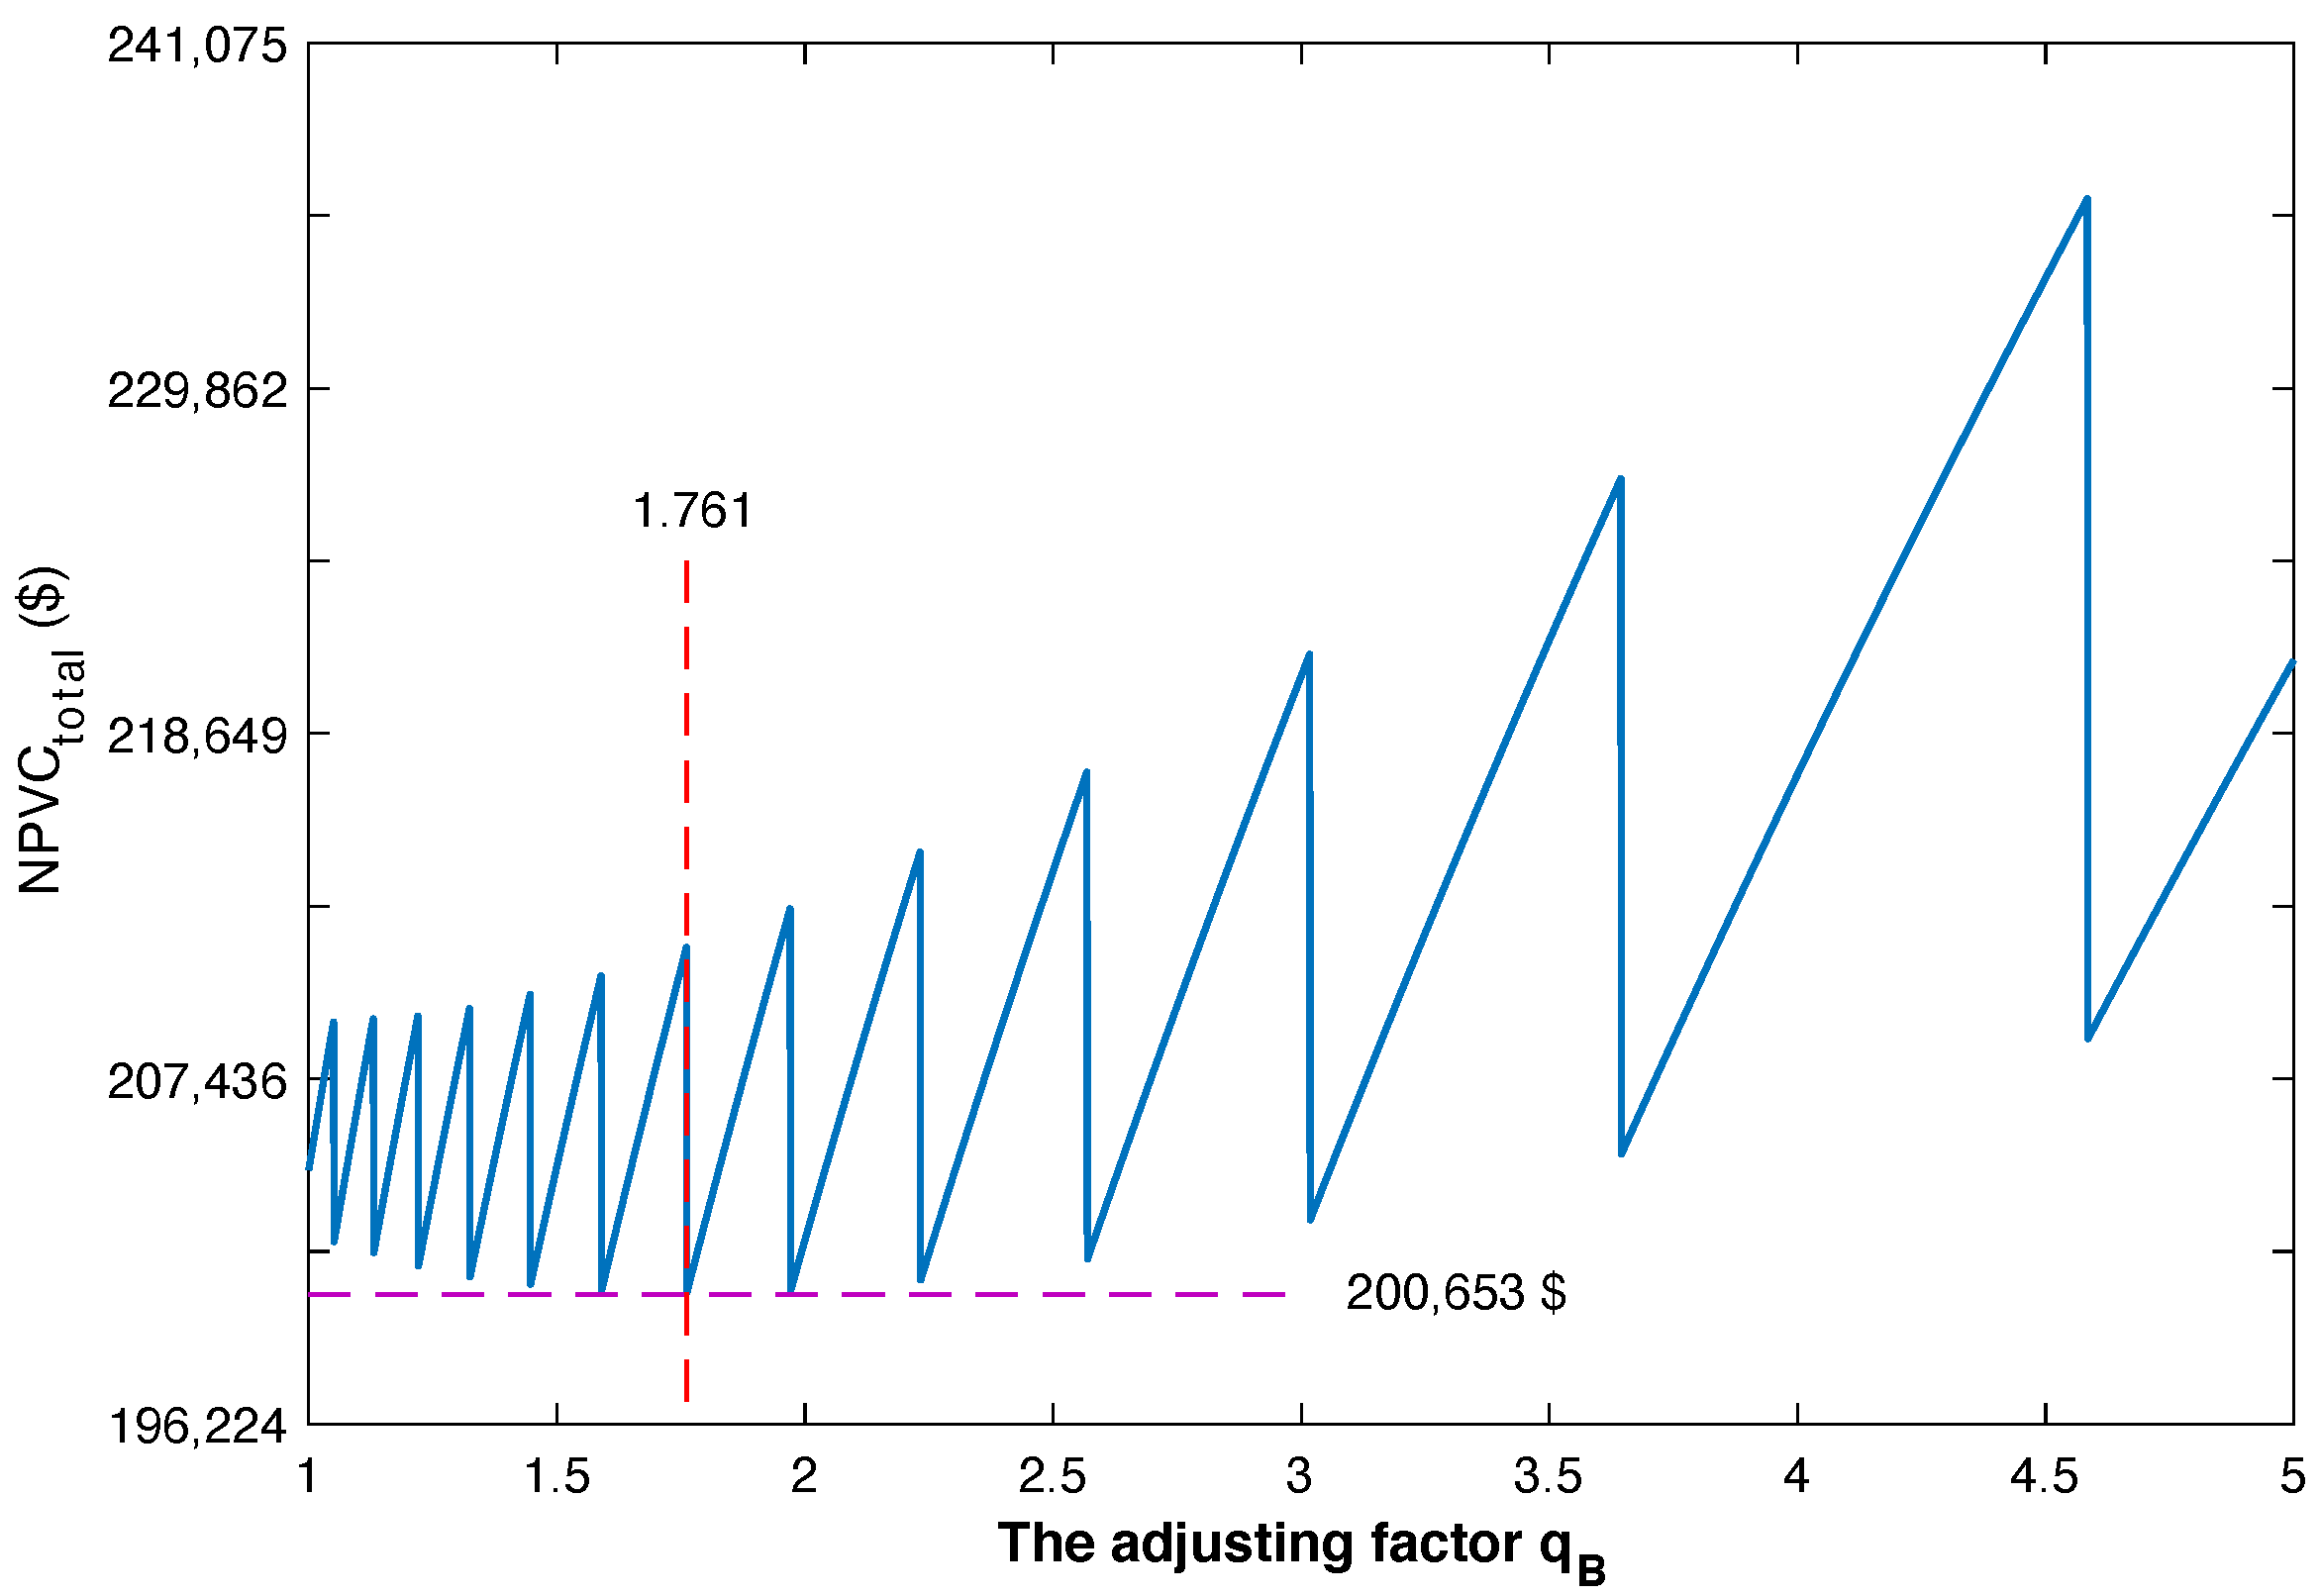
| 1.761 | 2.00 | 9 | 29,896 | 41.36 | 170,468 | 200,653 |
| 2.0 | 2.25 | 8 | 33,497 | 46.97 | 168.626 | 202,172 |
| 2.2 | 2.46 | 8 | 36,513 | 51.67 | 176,524 | 213,088 |
| 3.0 | 3.31 | 6 | 48,573 | 70.46 | 171,838 | 220,482 |
| 4.0 | 4.38 | 4 | 63,649 | 93.94 | 153,539 | 217,284 |
| 5.0 | 5.44 | 3 | 78,724 | 117.43 | 142,152 | 220,994 |
Disclaimer/Publisher’s Note: The statements, opinions and data contained in all publications are solely those of the individual author(s) and contributor(s) and not of MDPI and/or the editor(s). MDPI and/or the editor(s) disclaim responsibility for any injury to people or property resulting from any ideas, methods, instructions or products referred to in the content. |
© 2023 by the authors. Licensee MDPI, Basel, Switzerland. This article is an open access article distributed under the terms and conditions of the Creative Commons Attribution (CC BY) license (https://creativecommons.org/licenses/by/4.0/).
Share and Cite
Wongdet, P.; Boonraksa, T.; Boonraksa, P.; Pinthurat, W.; Marungsri, B.; Hredzak, B. Optimal Capacity and Cost Analysis of Battery Energy Storage System in Standalone Microgrid Considering Battery Lifetime. Batteries 2023, 9, 76. https://doi.org/10.3390/batteries9020076
Wongdet P, Boonraksa T, Boonraksa P, Pinthurat W, Marungsri B, Hredzak B. Optimal Capacity and Cost Analysis of Battery Energy Storage System in Standalone Microgrid Considering Battery Lifetime. Batteries. 2023; 9(2):76. https://doi.org/10.3390/batteries9020076
Chicago/Turabian StyleWongdet, Pinit, Terapong Boonraksa, Promphak Boonraksa, Watcharakorn Pinthurat, Boonruang Marungsri, and Branislav Hredzak. 2023. "Optimal Capacity and Cost Analysis of Battery Energy Storage System in Standalone Microgrid Considering Battery Lifetime" Batteries 9, no. 2: 76. https://doi.org/10.3390/batteries9020076