Article

End-to-End Direct-Current-Based Extreme Fast Electric Vehicle Charging Infrastructure Using Lithium-Ion Battery Storage

1
Holcombe Department of Electrical and Computer Engineering, Clemson University, Clemson, SC 29634, USA
2
Department of Automotive Engineering, Clemson University, Greenville, SC 29607, USA
*
Author to whom correspondence should be addressed.
Batteries 2023, 9(3), 169; https://doi.org/10.3390/batteries9030169
Submission received: 2 February 2023 / Revised: 23 February 2023 / Accepted: 10 March 2023 / Published: 14 March 2023
(This article belongs to the Collection Recent Advances in Battery Management Systems)

Abstract

:
An urgent need to decarbonize the surface transport sector has led to a surge in the electrification of passenger and heavy-duty fleet vehicles. The lack of widespread public charging infrastructure hinders this electric vehicle (EV) transition. Extreme fast charging along interstates and highway corridors is a potential solution. However, the legacy power grid based on alternating current (AC) beckons for costly upgrades that will be necessary to sustain sporadic fast charging loads. The primary goal of this paper is to propose a sustainable, low-loss, extremely fast charging infrastructure based on photovoltaics (PV) and co-located lithium-ion battery storage (BESS). Lithium-ion BESS plays a pivotal role in our proposed design by mitigating demand charges and operating as an independent 16–18 h power source. An end-to-end direct current power network with high voltage direct current interconnection is also incorporated. The design methodology focuses on comprehensive hourly EV-load models generated for different types of passenger vehicles and heavy-duty fleet charging. Appropriate PV-BESS sizing, optimum tilt, and temperature compensation techniques based on 15 years of irradiation data were utilized in the design. The proposed grid-independent DC power networks can significantly improve well-to-wheels efficiency by minimizing total system losses for fast charging networks. The network power savings for low, medium, and high voltage use cases were evaluated. Our results demonstrate 17% to 25% power savings compared to the traditional AC case.

Graphical Abstract

1. Introduction

One of the major crises facing humanity is tackling climate-related challenges. The recent global pandemic demonstrated an urgent need for increasing sustainable ecosystems and reducing environmental impacts from human activities. The highest annual greenhouse gas (GHG) emissions of about 58 gigatons of carbon dioxide (CO2) will be recorded by the end of 2022 [1]. Energy generation and transportation based on fossil fuels are the two significant contributors to the rise in GHG levels. The energy sector is already undergoing a green and clean transformation to mitigate climate-related emergencies. The traditional fossil-fuel-based generation, which causes havoc on climate, disrupts world peace [2], and destabilizes the global economy [3], is being replaced with renewable energy sources. For sustainable energy generation, the two ideal sources are the inexhaustible and free solar and wind energy [4]. In the United States, solar and wind energy constituted about 71% of newly added electric power generation capacity in the first six months of 2022 [5]. Energy conversion from photovoltaics (PV), and wind turbines has spearheaded a global transformation. By the end of 2021, the installed cumulative DC power capacities of PV and wind energy were 940 and 837 GW, respectively [6,7]. During 2022, global cumulative PV capacity exceeded 1 TW [8]. Along with the lowest GHG emissions, other driving factors for the transition to PV and wind energy sources are abundance of energy, ultra-low-cost power, minimal use of water in electricity generation [9], and the highest safety for all [10]. Battery storage technologies play a vital role in this green energy transition. Due to advancements in technology and ultra-large-scale manufacturing, lithium-ion batteries are emerging as a cost-effective solution for electric power storage [11]. The spatial and temporal variations in distributed PV and wind power generation can be regularized by co-located lithium-ion (Li-ion) battery storage. Free-fuel-based energy generation from photovoltaics (PV) and wind energy, coupled with Li-ion battery storage, has the potential to provide ultra-low-cost sustainable electricity for all with a minimal impact on the environment [12].
Similar to the energy sector, transportation based on fossil fuels is also undergoing a major overhaul. The highly inefficient gasoline-based internal combustion engines (ICE) and powertrains are being replaced with efficient electric motors and electronic powertrains. The triangular relationship between PV, electric vehicles (EV), and battery technology has bolstered electrification. As depicted in Figure 1, the accelerated development of the EV market is analogous to the development of the PV market [13]. The EV market is broadly classified into battery electric vehicles (BEVs), hybrid vehicles (HEV), plug-in hybrids (PHEVs), and fuel-cell electric vehicles (FCEV). FCEVs have compressed hydrogen gas stored in on-board vehicle tanks that use electrochemical processes to convert hydrogen to electricity, which powers electric motors. The hydrogen economy for road transportation has several pitfalls and is practically not a viable option today. The cost-intensive generation process of green hydrogen is one of the major drawbacks of hydrogen infrastructure. The majority of the hydrogen generation today is either grey hydrogen—obtained by burning fossil fuels as an energy source that emits carbon dioxide (CO2) and carbon monoxide (CO) as byproducts—or blue hydrogen, which just like grey hydrogen, also uses fossil fuels as its energy source but incorporates carbon capture, utilization, and sequestration (CCUS) techniques to capture and store CO2 byproducts. Other than the groundwater contamination, these CCUS techniques are not proven to have high capture rates, thereby also contributing to major GHG emissions. They also add to the already high cost of hydrogen generation. Green hydrogen generated with sustainable electric power from PV and wind with minimal environmental and water impacts is the only true GHG reduction process. However, the higher costs and safety of transportation infrastructure are still potential looming concerns for the green hydrogen economy. On the other hand, the well-to-wheel efficiency of FCEVs is about 25–35%, significantly lower than its competitor BEVs, which have high efficiency numbers ranging from 70 to 90% [14]. Owing to such reasons, BEVs are the only efficient and viable electric mode of road transportation. For the rest of the paper, the term EV will be used to represent BEVs.
The four major challenges faced by EV markets today are higher EV costs, range anxiety, slower charging rates, and a lack of charging infrastructure. The rapidly declining costs of the battery packs and improvements in design, manufacturing, supply chain, and sensor technology will bolster further cost reduction of EVs. As many major auto manufacturers climb aboard the wagon of electric mobility, healthy competition could further reduce the cost of EVs. To tackle the second issue of range anxiety, EVs need higher-density battery packs with flatter battery degradation curves and better thermal management systems. Several EV manufacturers, such as Tesla, are making continuous progress in addressing these issues. Tesla’s Million Mile improved battery chemistry and technology, providing 95% battery capacity retention after 2000 charge–discharge cycles will directly alleviate range anxiety [15]. The minimal loss of high-voltage powertrains of 800 V and higher will also significantly improve charging efficiency [16]. Cost-effective recycling of Li-ion batteries will drive the circular economy [17]. To address the third and fourth issues of EV charging rates and infrastructure, we should implement a novel, extremely fast electrical power network that can provide faster refueling with minimal power losses, resulting in lower costs to the consumers. This paper proposes a sustainable, low-loss, direct current (DC) charging infrastructure based on PV and Li-ion batteries. The proposed end-to-end DC architecture will be capable of achieving higher charging speeds at power levels of 250, 350 kW, and higher. High-voltage direct current (HVDC) transmission, medium voltage direct current (MVDC) distribution, and local power networks of low-voltage direct current (LVDC) will be utilized. The power losses were evaluated for three different use cases for the extreme fast charging (XFC) EV application and compared with the traditional business-as-usual alternating current (AC) case. This work highlights the advantages of loss reduction (power savings) for proposed use cases in end-to-end DC power networks. Four different types of light-duty passenger EV charging profiles have been studied, and XFC charging loads were synthetically designed to represent the corridor charging scenario along the interstates and highways. Medium-duty passenger EV charging and three heavy-duty fleet charging scenarios were also evaluated to design a combined XFC charging-load profile. PV and battery energy storage systems (BESS) were appropriately sized for complete off-grid generation.
The novelty of the paper lies in generating an out-of-the-box DC-based XFC charging infrastructure which can sustain an ever-growing EV load demand and have minimal impact on the grid and the environment. The proposed network can achieve sustainability and higher well-to-wheels efficiency by employing a DC network and eliminating power-conversion needs. In the following section, we will address the major shortcomings of the existing AC-grid-tied XFC infrastructure. The need for a PV and battery based end-to-end DC architecture is elaborated in Section 2 and Section 3. A detailed description of our proposed design is highlighted in Section 3. Section 4 illustrates the design of different EV charging loads and sizing of PV and BESS. Section 5 demonstrates the results in power savings for three different use cases. Section 6 deals with the future scope and conclusion of the paper.

2. Key Challenges for Grid-Connected Extreme Fast Electric Vehicle Charging

It is crucial to establish a reliable, ultra-low cost, and XFC network for widespread adoption of EVs. Consumers’ experience of charger availability and the charging times of EVs should be at least as good as they are today for internal combustion-based transportation. Public fast-charging infrastructure will accelerate EV adoption and provide complete electrification of the surface transportation sector. Today, direct current fast charging (DCFC) and extreme fast charging (XFC) provide charging power levels of 50, 150, 250, and 350 kW, and above. Faster recharging using a public fast charging station (FCS) provides a quick charge in a densely populated neighborhood for shorter trips, alleviates the range anxiety for long-distance trips, and benefits multiple charging events for fleets’ daily routine trips. Such “on-the-go” fast charging will eventually be as easy and convenient as refueling a gasoline vehicle.
Contrary to the existing Level 1 and Level 2 residential charging practices, references [18,19] highlight the need for a fast-charging EV infrastructure. As more users transition to EVs, overnight residential charging will become a luxury and account for fewer charging events in the next decade compared to public fast charging. However, AC grid-tied fast-charging infrastructure has several areas for improvement. AC grid charging can negatively affect EV adoption by forcing users to charge during off-peak-load hours. Moreover, grid-connected fast charging can cause sudden load peaks, hamper generation-demand balance, cause voltage flickers and phase fluctuations, deteriorate power quality, and induce current harmonics and supra-harmonics. Due to aging infrastructure and integration of variable PV and wind sources, the power grid is already functioning near the operational limits and stability boundaries. New FCS load centers will create additional stress on the AC grid’s reliability and resilience. This section discusses in detail the impacts of grid-tied fast charging technologies. It also illustrates the pitfalls in grid-tied PV generation, transmission, and distribution techniques that throttle maximum utilization of green PV power for EV charging applications.

2.1. Infrastructure Upgrades Necessary for DCFC and XFC Charging Stations

The legacy distribution and transmission infrastructure need a complete overhaul to accommodate fast charging stations (FCS). The majority of studies evaluate the effects of FCS installations, primarily on the low voltage (LV) and medium voltage (MV) distribution grids [20,21,22,23,24]. However, as the numbers of EVs and FCS continue to increase, several stations will require sub-transmission and transmission-level interconnections. As demonstrated in a recent study by National Grid, the Electric Highways Project identified several charging station sites that would require transmission interconnections of more than 5 MW, and some would require about 20 MW—the power consumed by a small town [25]. Planning and upgrades at both the transmission and distribution levels are thus needed. Most grid-connected DCFC and XFC stations operate on 480 V and higher voltages that require a three-phase (3-Ø) connection with a dedicated service transformer. Construction of charging stations also requires close proximity to the substations, independent switchgear, and lightly loaded distribution feeders. Installation of FCS is thus a costly and labor-intensive task. Table 1 [26,27,28] highlights the upgrades needed for FCS installations. Furthermore, if the FCS requires a higher than 1 MW peak demand, it must undergo separate screening tests, which will postpone the installation timeline by several years. Beyond the 5–10 MW distribution interconnection limit, transmission grid interconnection becomes costly and further leads to time-consuming approvals. Owing to such factors, we propose that the public fast charging infrastructure be totally independent of the AC grid and operate on the proposed end-to-end DC architecture.

2.2. Interconnection Delays in PV, Wind, and Battery Storage Projects

New FCS installations would require tremendous power generation to balance the EV charging demand with transmission and distribution upgrades. As per the US Federal Zero-Emission Target of 2030, annual demand for electricity with 15% EV penetration would surge from 11 billion kWh to 230 billion kWh in 2030 [29]. PV and wind energy generation can easily meet this increased EV charging demand. However, several interconnections and curtailment issues with existing policies throttle the maximum utilization of PV and wind energy sources. Interconnection queues—exhaustive lists of projects undergoing several impact studies before grid connections—are ever-growing. As of 2021, newer PV, wind, and storage projects stuck in these queues number over 1400 GW [30]. The minimum approval time for shovel-ready bulk utility-scale projects is about 5 to 8, years depending on various regional utilities and transmission planning system operators [31]. Almost 75% of such proposed projects stuck in the limbo queues are withdrawn and never make it to the commercial operational stage [30]. Power-purchasing agreements expire, land deals fail, governing officials are replaced, and eventually, these projects are stuck in endless approval loops. As depicted in Figure 2 from reference [30], the US has about 998 GW of capacity in queues that is proposed to be online by 2024. Among the queued interconnections, solar energy projects comprise of 537 GW as compared to 307 GW of storage and 138 GW of wind energy projects [30]. These overflowing interconnection backlogs of 998 GW are just shy of the estimated 1100 GW of PV and wind capacity needed for the Biden administration’s zero-carbon electricity target of 95% carbon-free energy by 2035 [30]. Most of the approval backlogs are a result of legacy line ratings and weak transmission grid resources. Owing to such backlogs in clean energy approvals, most energy requirements for the electrification of transportation will continue to be furnished with fossil-fuel sources, which would defeat the purpose of electrification—i.e., to eliminate GHG emissions. Implementing our proposed grid-independent end-to-end DC architecture for EV charging would alleviate this interconnection issue on two fronts. First, it will provide newer HVDC transmission techniques that would help mobilize clean energy in various US zones. Furthermore, it will reduce the interconnection queue times of the impact studies by providing faster connection to the country-wide DC power network. Thus, the proposed architecture for PV, wind, and storage projects should be employed for integrating newer DC power generating sources into a separate DC power network to reduce the growing interconnection queues.

2.3. Curtailments and Increased Frequency of Negative Wholesale Pricing

The PV and wind projects that make it through the maze of approvals still experience heavy curtailments at the operational level. Ensuring grid balance between rising demand and newer renewable energy generation is a major issue with the traditional AC grid. Due to a lack of flexibility (slower ramp-up and -down speeds) of the legacy coal and nuclear generating plants, newly added renewables, such as PV and wind power with co-located storage, are primarily utilized for balancing the peak load demands. The majority of the baseload is still met with the traditional generation due to the ease of its dispatch. This curtails the clean, nearly-free, readily available renewable generation. Curtailments are very common for traditional generation with high inertia. However, curtailment of excess PV and wind power is complete wastage of fuel-free generation, which instead can be utilized for charging EVs with FCS.
Based on real-time power balance, curtailments are enforced by a balancing authority’s setpoint, or sometimes incentivized through negative pricing to encourage operators to stop generation in deficient-load cases. As demonstrated in reference [32], the 5-min wholesale prices went negative about 200 million times across the seven US grids in 2021, more than twice as often as five years earlier. As reported by [33], during 2021, nearly 3302 GWh of solar energy was curtailed by the California and Texas System Operators. This clearly indicates that there are enormous amounts of PV-generated power that is just dumped away, which could easily be used for balancing the increased XFC EV load. The upstream flow of renewable power from distribution grid might be one of the major causes of such large curtailments to prevent sub-transmission congestion. This is because pockets of high energy demand are not directly connected to pockets of high solar and wind energy generation. The existing transmission grid infrastructure lacks country-wide interconnections. Surging congestion and demand charges to transport electricity across grid interconnections need to be eliminated. The proposed HVDC infrastructure in our end-to-end DC power network can easily eliminate this issue. The curtailed surplus energy generation can also be stored using utility-scale co-located battery energy storage systems (BESS) to offset negative pricing. These features make the proposed architecture robust and resilient to maximize the utilization of generated PV power. It also ensures that the XFC EV charging load is supplied with a clean PV power, unlike existing grid practices.

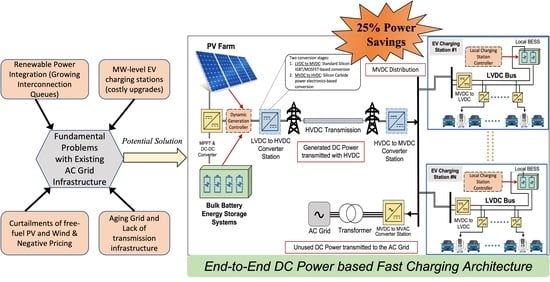
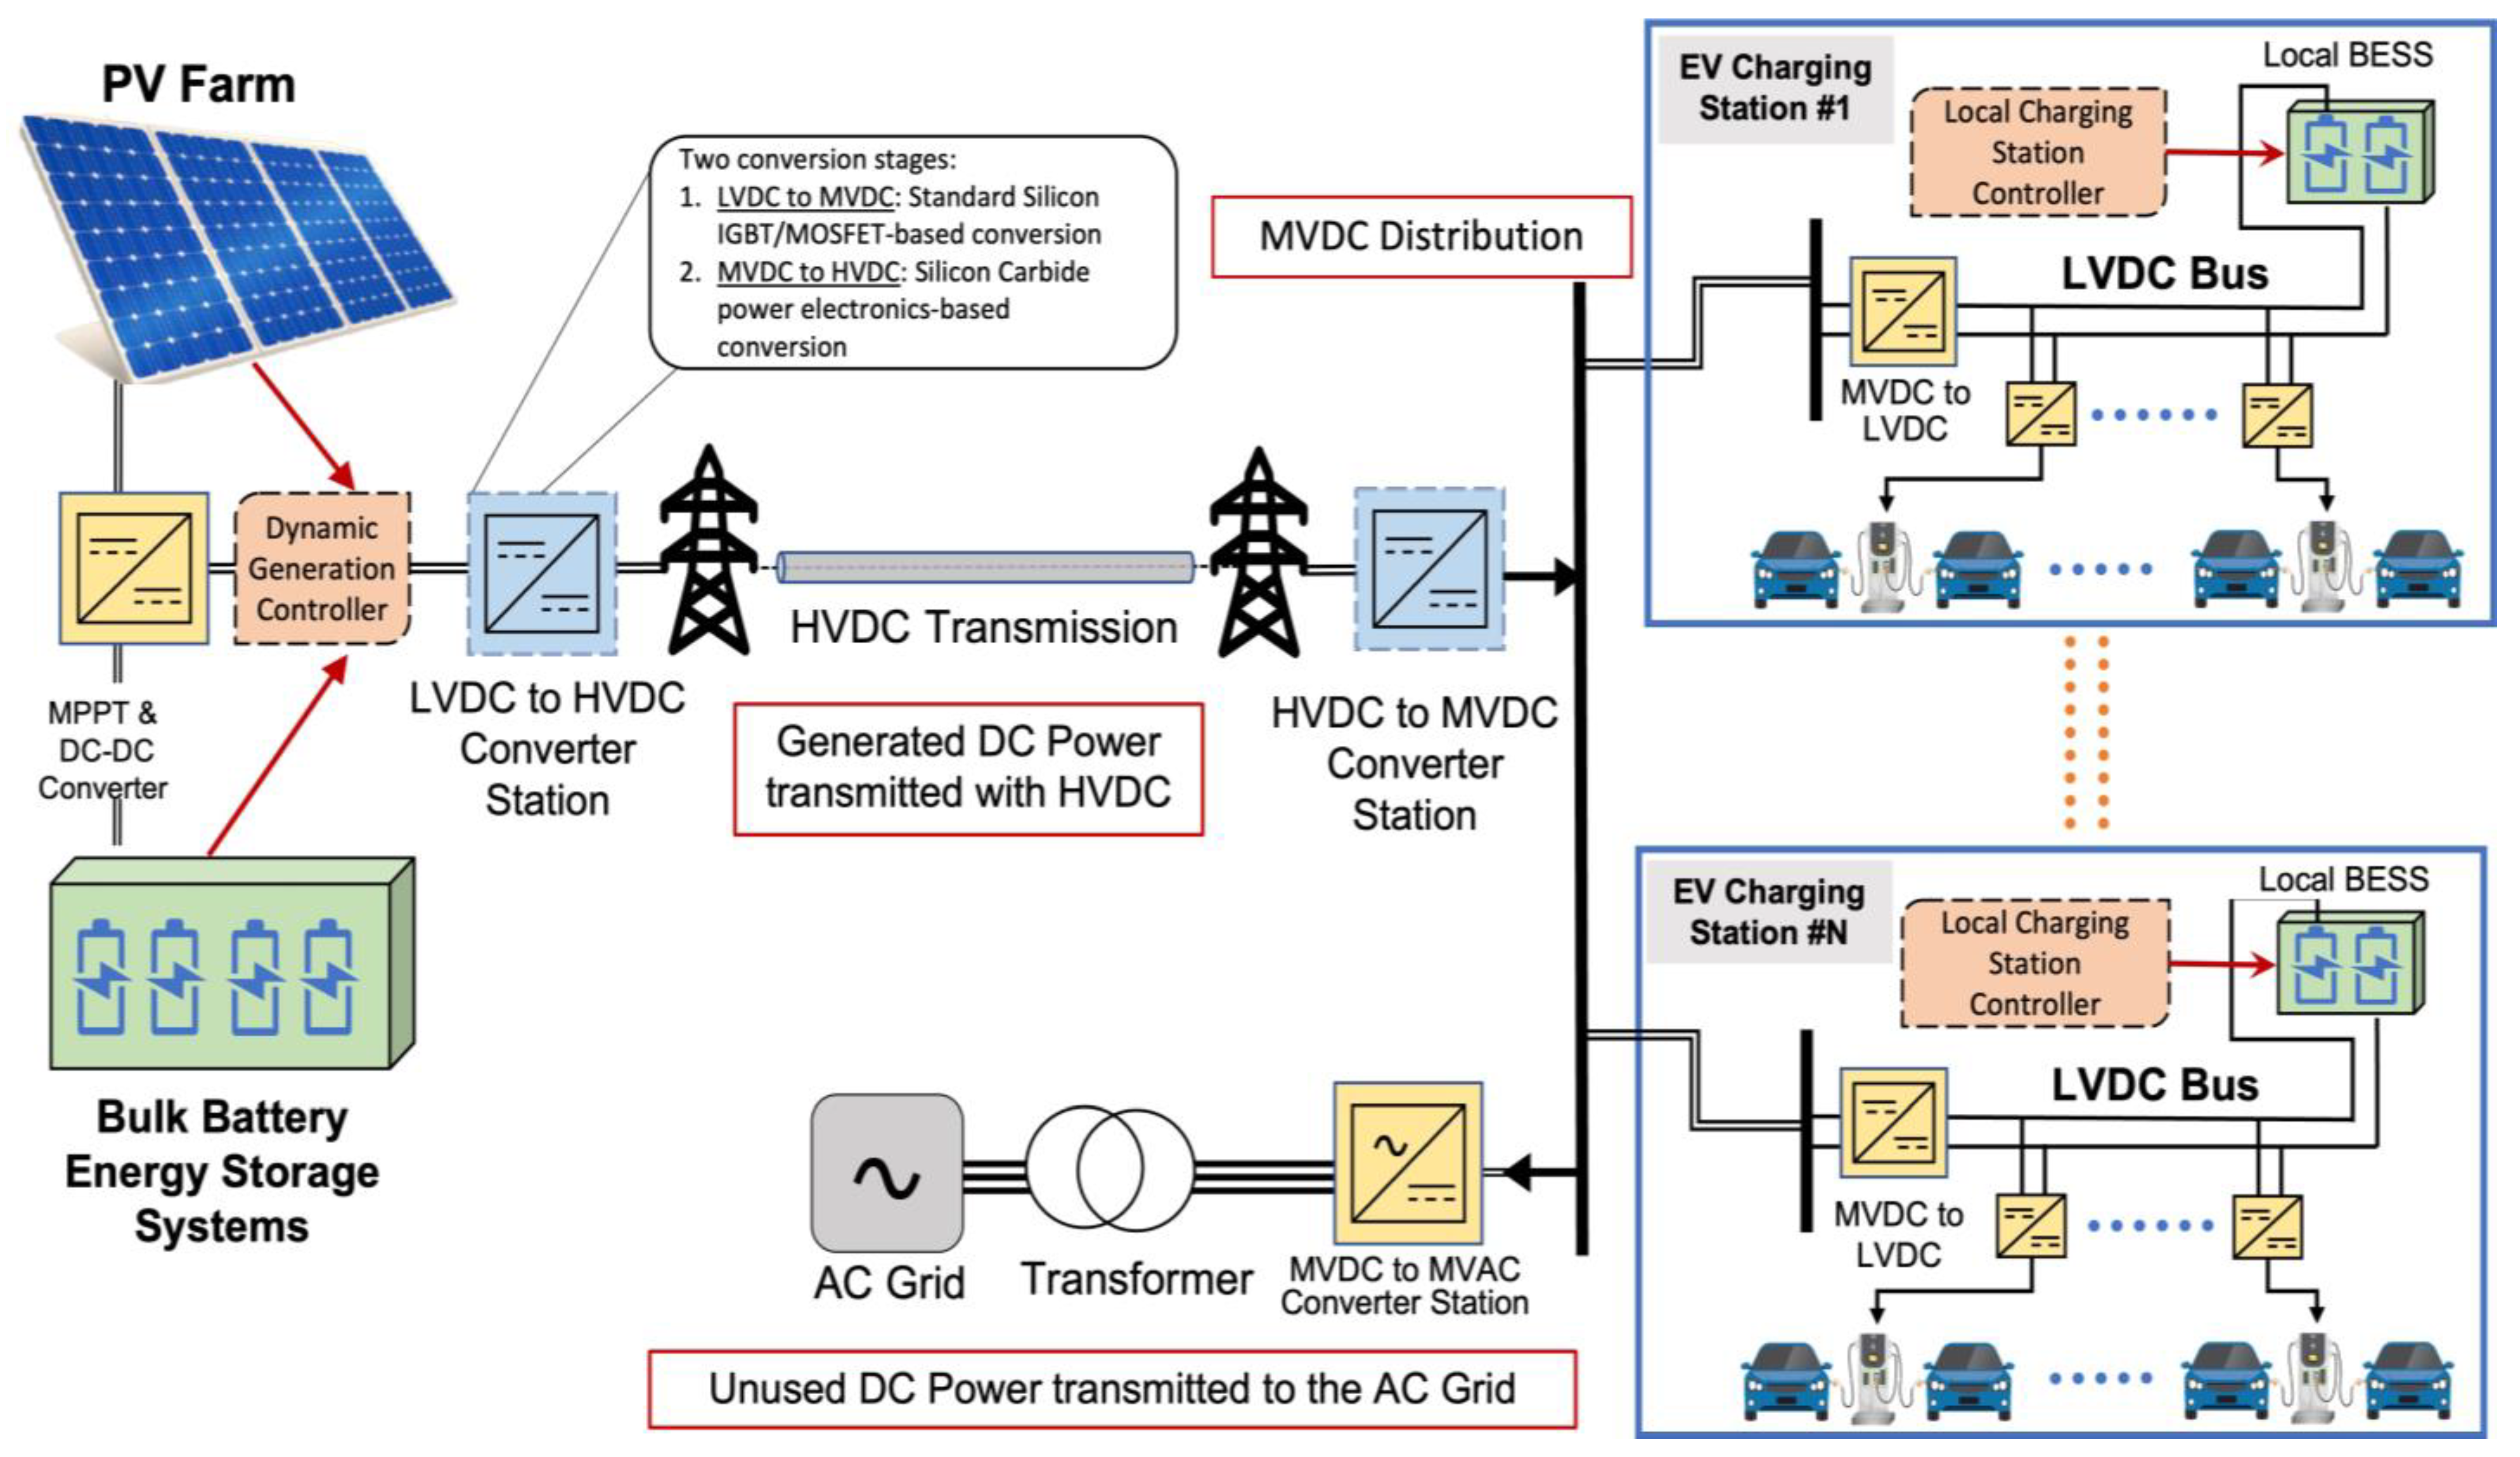
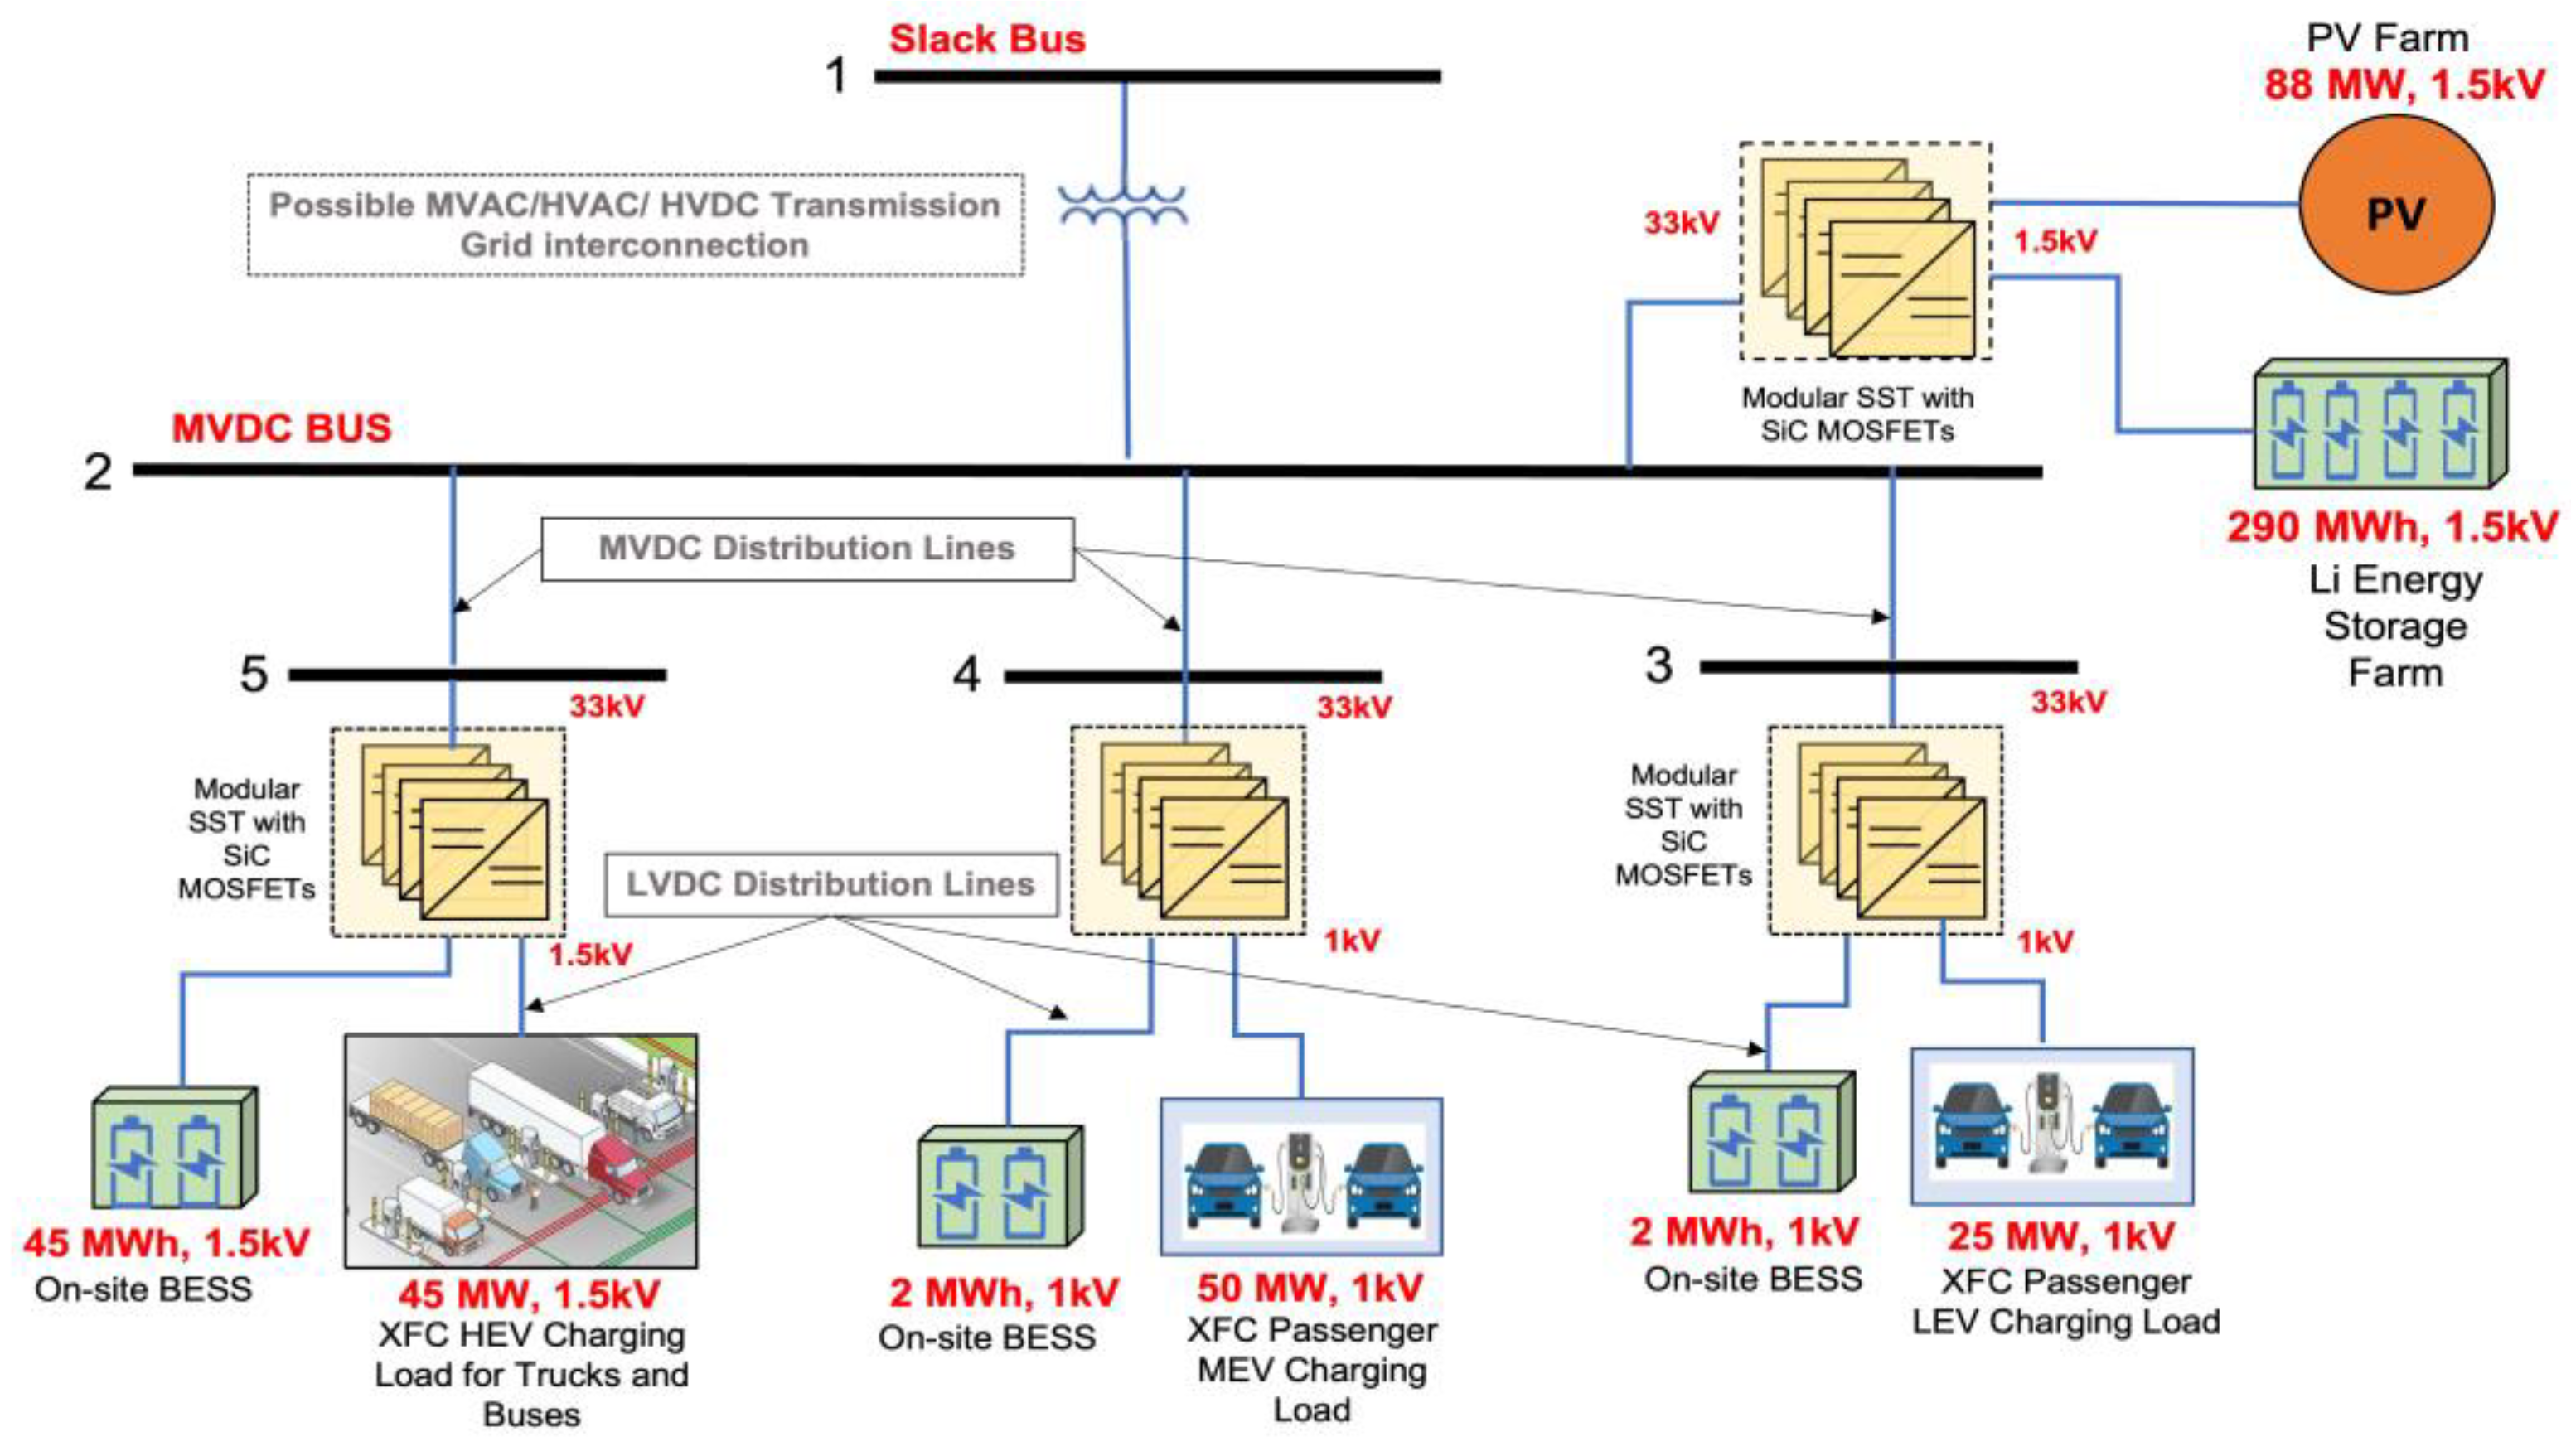
3. Proposed Sustainable End-to-End Direct Current Power Networks for Extreme Fast EV Charging

A sustainable power network generates clean, green energy with minimal water usage and reduced cradle-to-grave impact on the environment [10]. Our current electricity infrastructure based on an alternating current (AC) grid is not sustainable. Most of our loads today, except a few inductive loads, can operate on direct current (DC) as the input power. Photovoltaics generate DC power, and batteries store DC power. Wind turbines generate erratic AC power, which is sometimes converted to DC and back to AC power to match the frequency and phase of the legacy AC grid. Such power conversion in different stages of green energy integration lowers the efficiency and limits the optimum utilization of low-cost renewable power. The re-evaluation of 21st century power grid is necessary to incorporate green DC energy sources and diverse DC loads. As stated in [34], DC power networks can save more than 30% of power and capital compared to AC networks. Thus, from an energy-efficiency (directly related to the cost of electricity) viewpoint, the current AC grids are highly inefficient and waste tremendous energy. The loss numbers and key challenges for establishing XFC EV infrastructure are explained in [35]. This work elaborates on the urgency to deploy such DC-based power networks for XFC of EVs.
The proposed design of the XFC architecture is illustrated in Figure 3. It consists of sustainable DC power networks with PV-farm generation and co-located storage connected to a HVDC transmission bus. Several charging stations with co-located BESS are integrated into the MVDC bus. The proposed architecture can implement sustainable DC power networks on local, community, and regional levels without affecting the existing AC grid’s infrastructure. Wherever possible, Thomas Edison’s original concept of local DC power is implemented to create low voltage (<1500 V) local DC power networks (LVDC) [34]. In all other cases, long-distance high-voltage DC transmission and medium-voltage DC distribution are needed. BESS will be co-located with the PV-farm generation and at each charging station. At the generation farm site, BESS will regulate variable PV power during the day and supply charging power during the nighttime. At the FCS sites, BESS will be responsible for managing uncontrolled charging peaks and transmitting unused excess power back to the AC grid as per the utilization rate of the charging station.
The proposed DC fast charging infrastructure can potentially eliminate additional AC grid upgrades and extra conversion stages, avoid grid interconnection and synchronization issues, and bolster easy and maximum integration of PV and storage in power networks. The primary components in our designed DC XFC architecture are explained below in Figure 3.

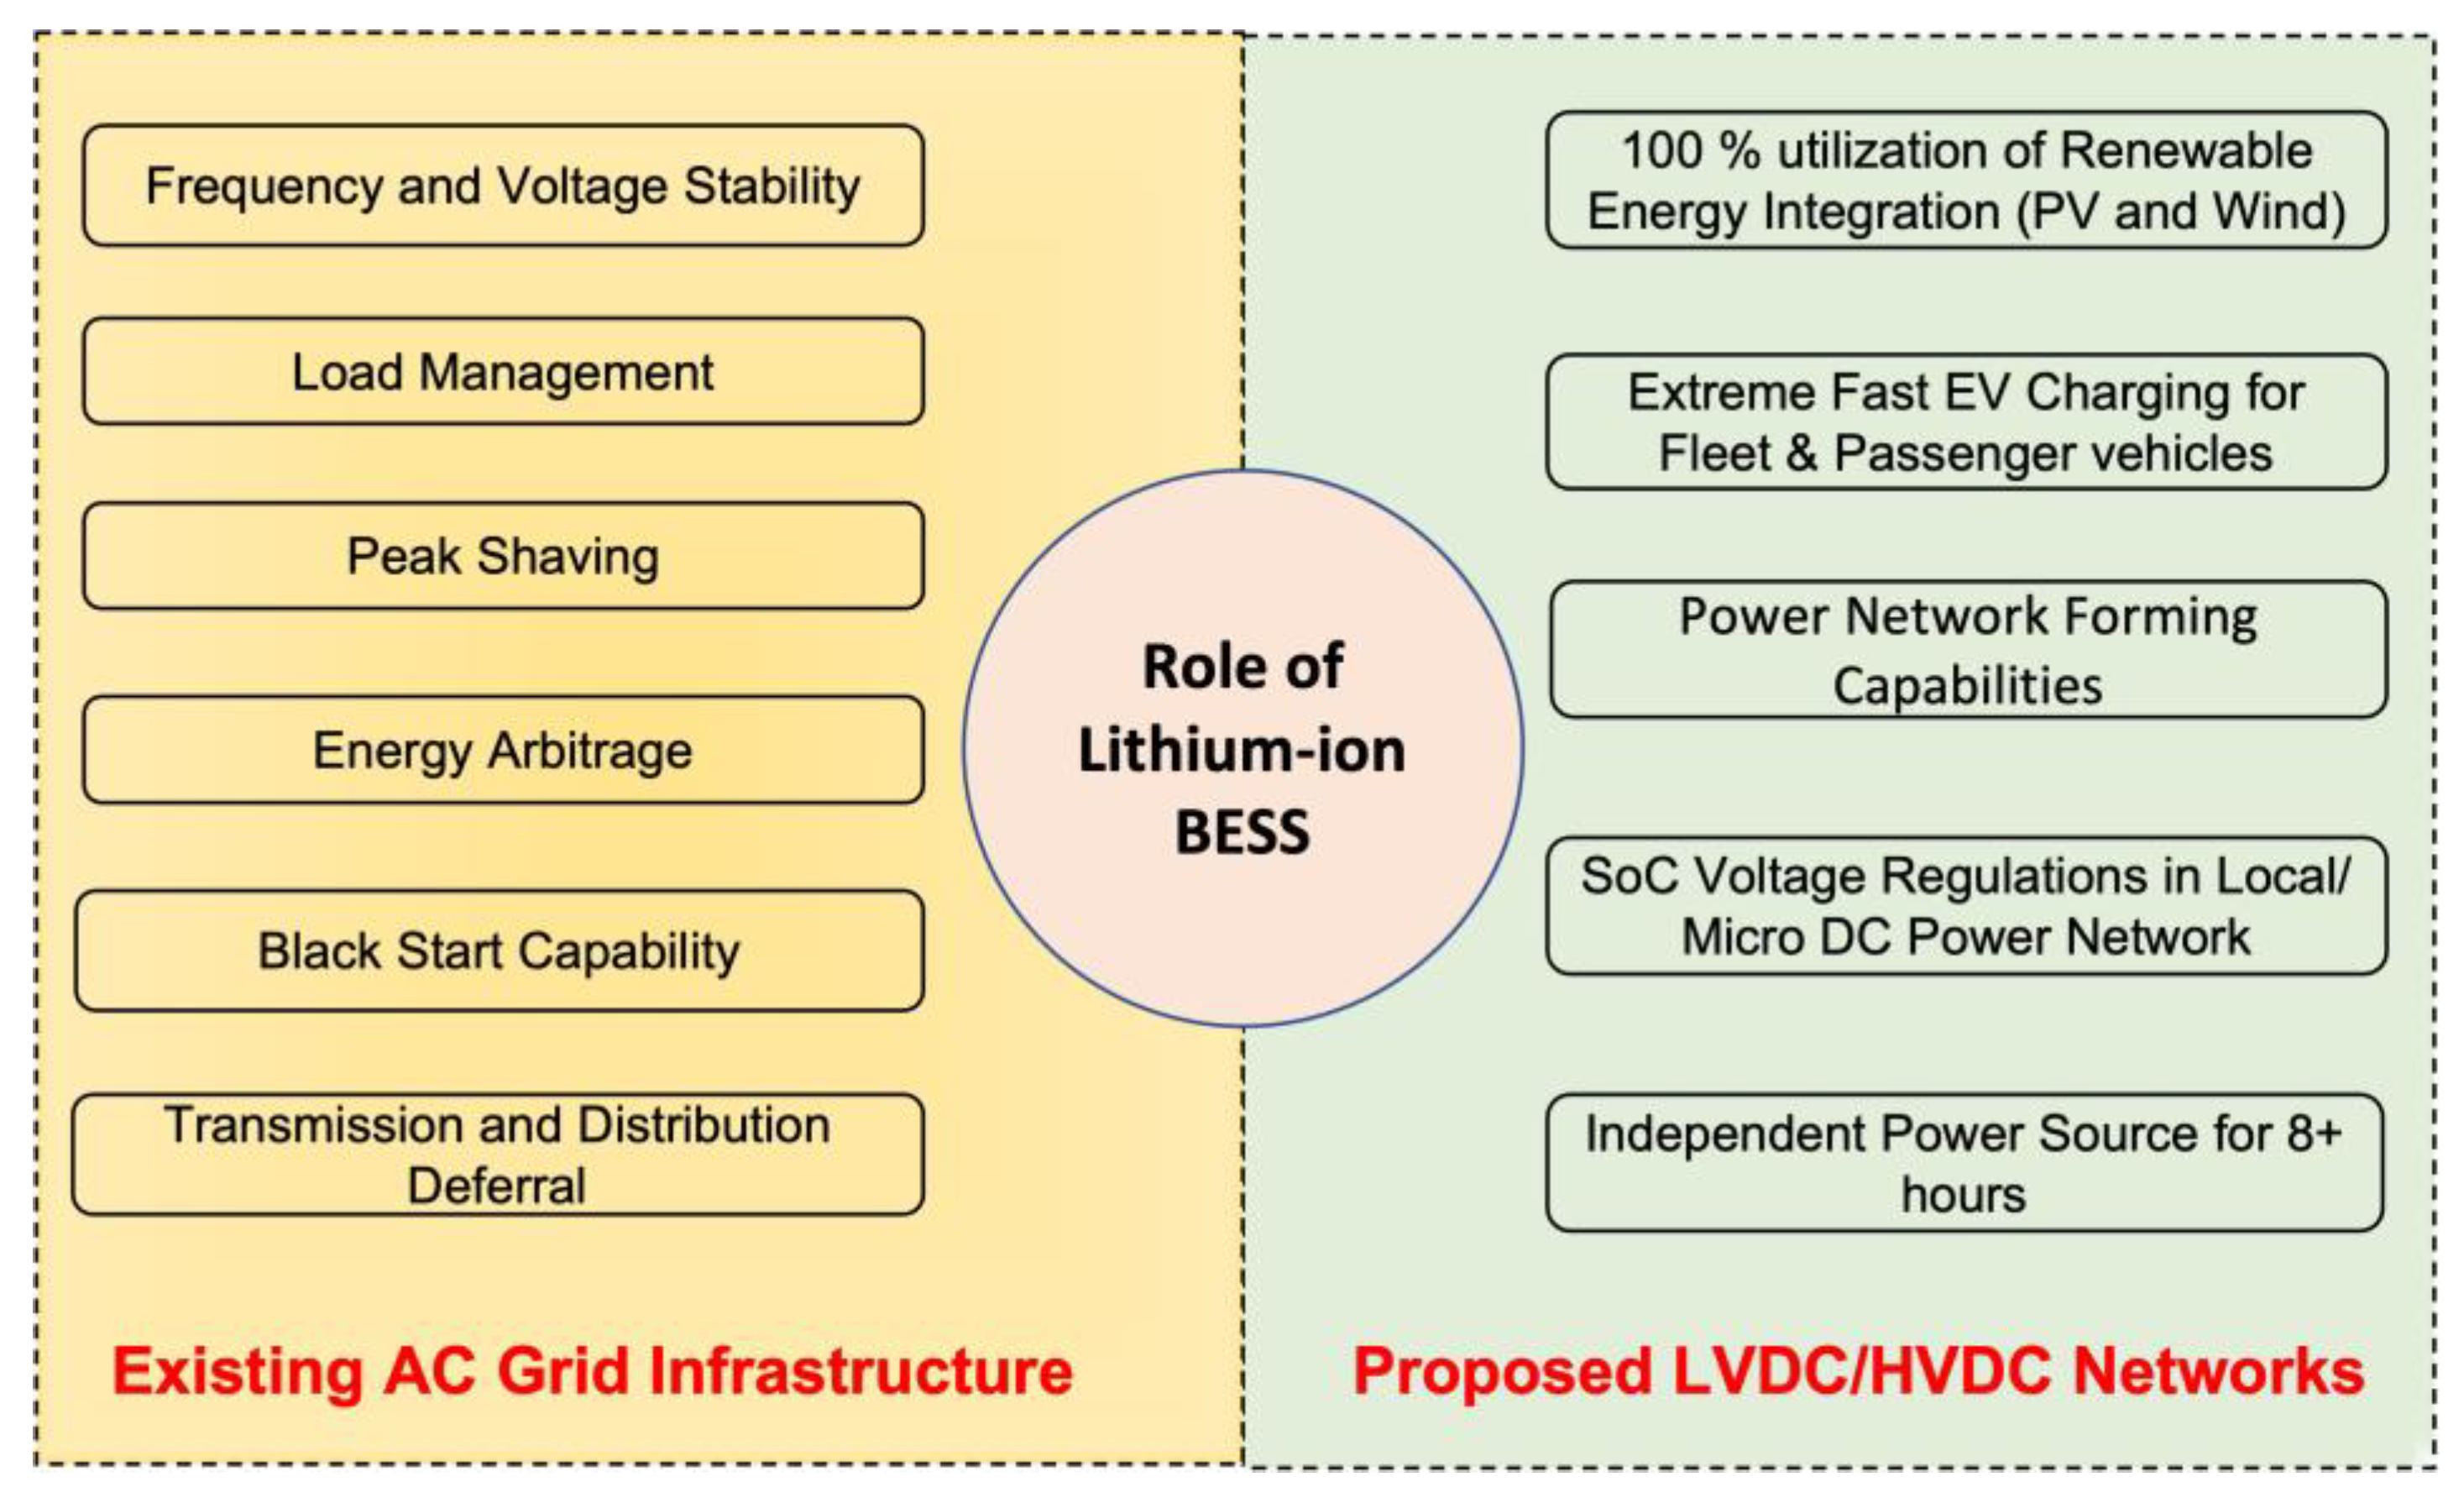
3.1. Role of Battery Energy Storage Systems in Sustainable DC Power Networks

Battery energy storage systems (BESS) based on lithium-ion technology play an important role in transitioning to clean electrification. Based on rapidly declining costs and advances in manufacturing, lithium-ion battery chemistry is dominating the BESS market. For the rest of the paper, BESSs invariably refer to lithium-ion utility-scale BESSs. The value of integrating BESSs into the distribution and bulk power grid is already established and is being implemented by several utilities. The majority of the utility-scale BESSs employed in the US are utilized for providing operating reserves and ancillary services to the grid [36]. Several applications for BESS include providing black start capabilities, energy arbitrage, renewable energy curtailment reduction, load-levelling, peaking capacity, and transmission and distribution upgrade deferrals. However, these applications are designed for the AC grid interactions and reduce the maximum potential of BESSs. The AC-conditioned BESS is still based on lossy integrations. In addition, a BESS’s operations are limited mostly to 4–6 h for providing peak shaving and are directly in competition with the gas peaking plants. Higher capital and operational costs are often regarded as the barriers demanding fewer hours of operation. However, this is a misconception. As hours of operation for BESS increase beyond 8–16 h, the BESS operational costs will decline, as outlined in reference [9]. For the highest energy efficiency of the power network and ultra-low-cost power, an end-to-end DC architecture is essential. Figure 4 elaborates the different applications for BESSs in HVDC and LV DC power networks.
In the proposed XFC DC network, BESSs will play an important role. Some primary reasons deterring private investors or organizations to install FCS are reduced annual profit margins and capital recovery periods due to low utilization rates of FCS. Low utilization rates are governed by high-demand pricing during peak hours and a lack of EVs in an area, or due to charging-congestion-relief policy that provides several charging alternatives. According to [37], demand charges for 350 kW and higher charging power stations account for about 73–85% of charging costs that are borne by the consumer. This hike in charging rates discourages users from charging EVs during certain times of the day (peak demand hours) and inhibits widespread adoption of EVs, in turn leading to low-utilization rates for FCS. This is a classic chicken-egg phenomena where low utilization is needed but not at the cost of increased charging rates and specific charging time periods. Such coordinated or controlled charging schemes will not prove viable as the number of EV users increases and as they are diversified.
For the reasons explained above, our proposed DC XFC stations will incorporate a BESS at every charging station to manage uncontrolled charging. Locally available BESSs can mitigate peak load demands from sudden surges of charging events locally. They can also help alleviate the supply–demand mismatch scenario, as PV power generated from a distant farm can provide cheaper charging power during the daytime, and local farm storage can supply power during nighttime charging peaks. The proposed FCSs installed along highways with BESS can increase the utilization rates and simultaneously manage the demand charge, allowing users to charge anytime “on-the-go”. Transporting electricity along HVDC and MVDC corridors can still account for some minimal losses, and thus, locally sourced BESSs will be ideal for managing charging surges during heavy-traffic scenarios. BESSs will also assist in transmitting cheaper excess power back to the AC grid to avoid battery-sitting losses. This will be performed with the help of forecasted weekly load profiles and utilization rates for different FCS.

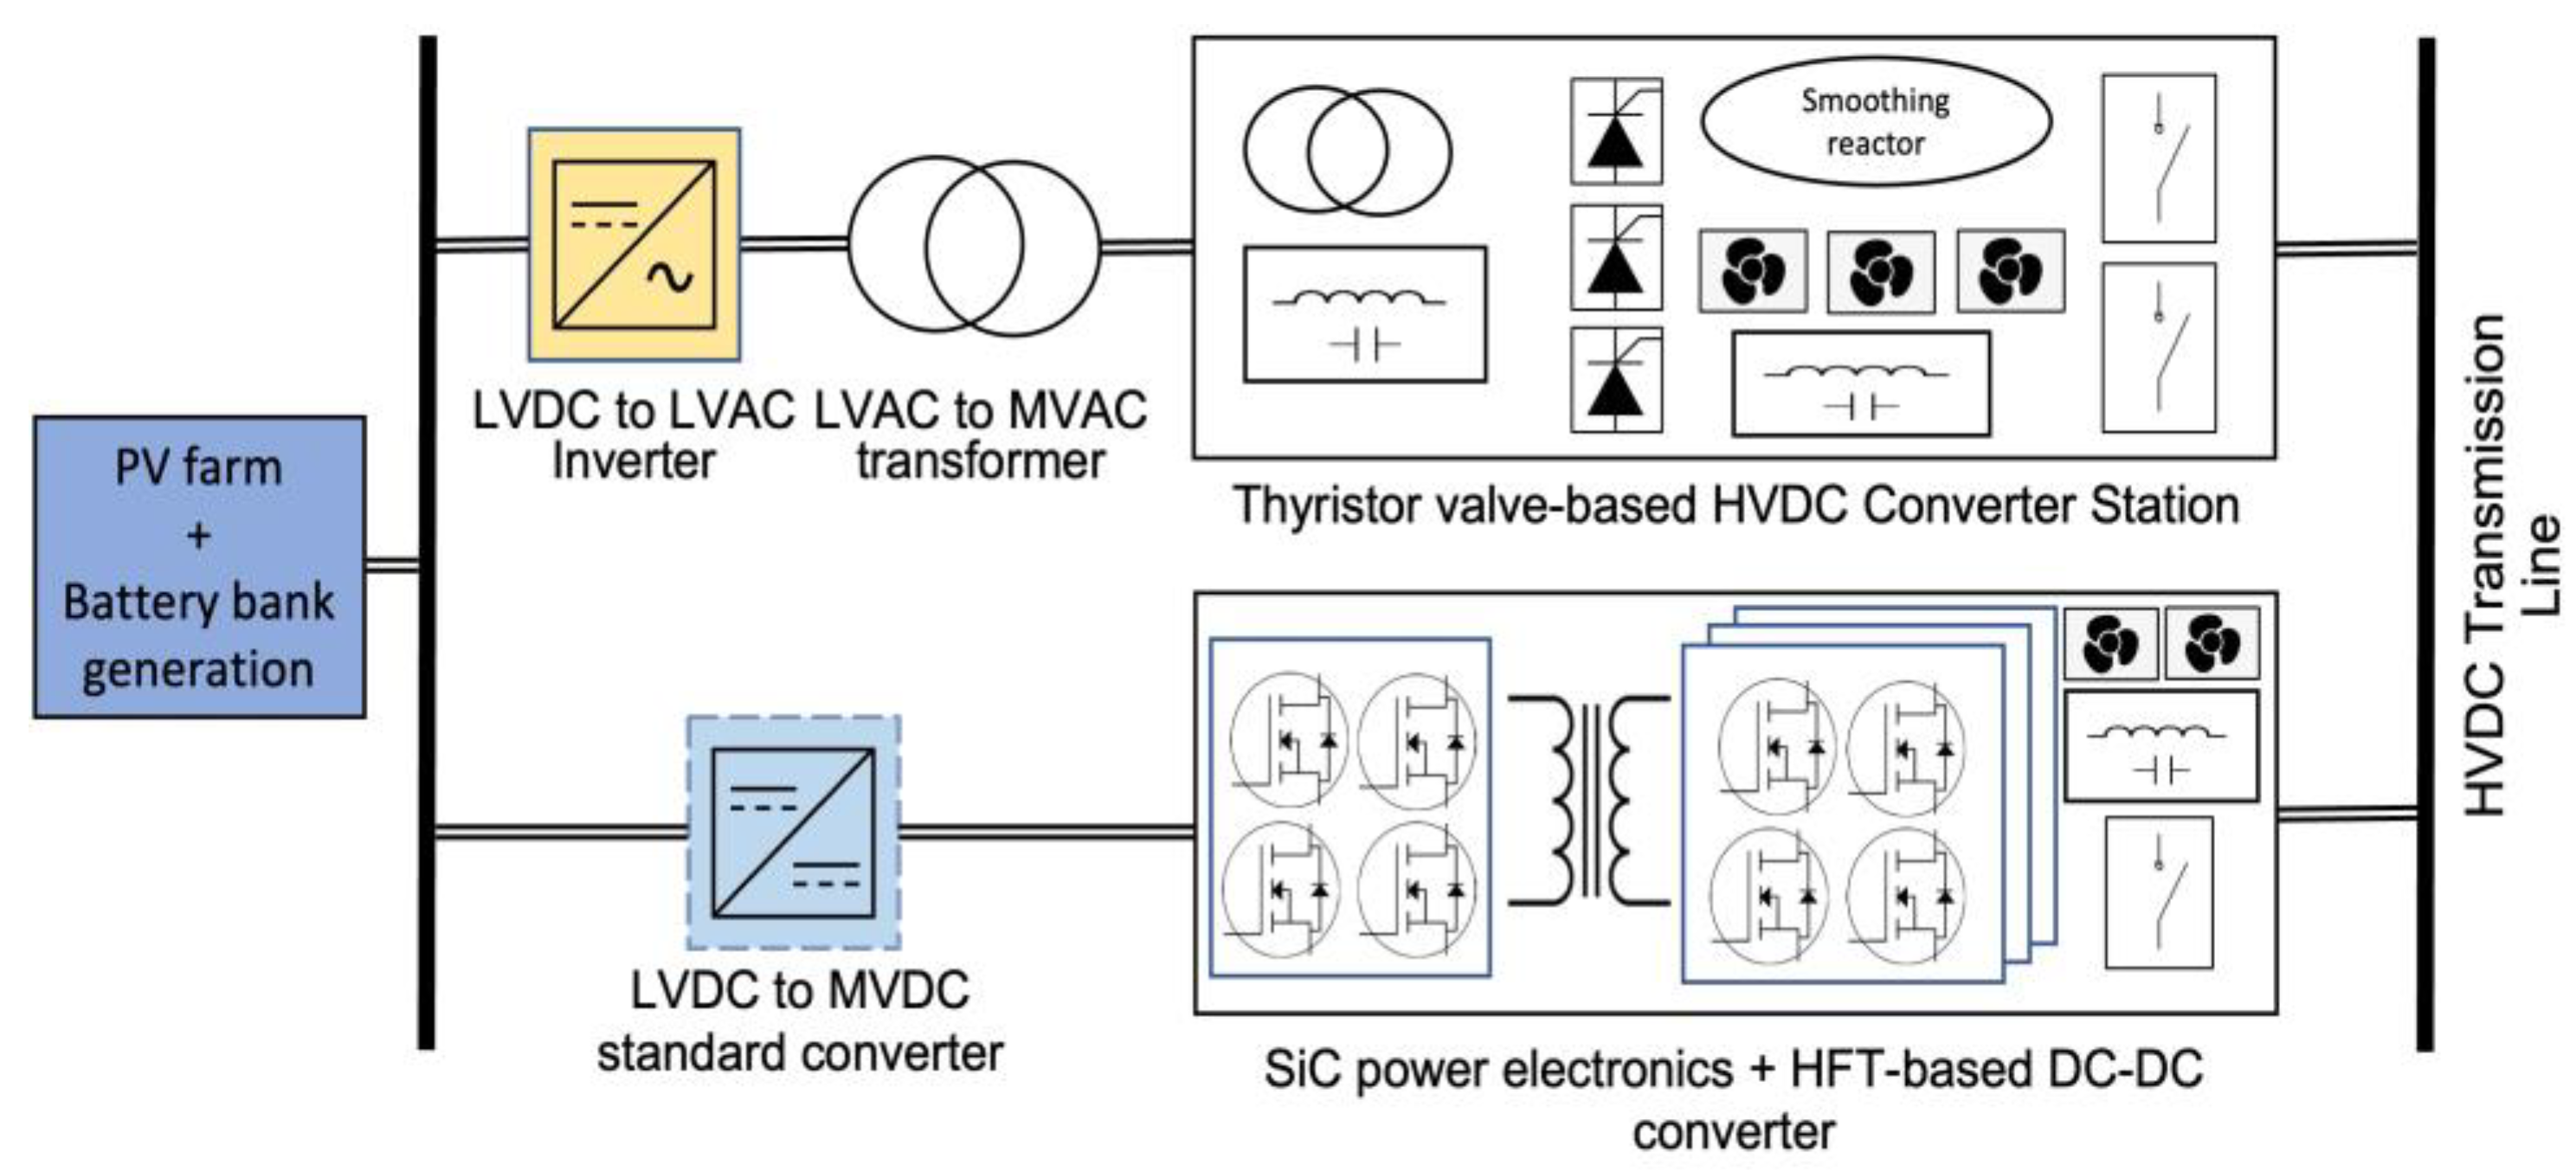
3.2. Role of HVDC Transmission in Sustainable DC Power Networks

It is vital to implement a HVDC transmission network to connect distant PV and wind generation sites with urban and suburban load centers such as XFC stations. To incorporate new DC power generation for newer loads, the legacy transmission grid requires several upgrades, as explained in Section 2. The existing high voltage AC (HVAC) transmission upgrades are costly, time consuming, and create a severe imbalance for the AC grid power flows. Without changing the existing transmission topology, a macro-HVDC network should be developed to connect remote PV and wind farms with newer load centers. HVDC technology has several advantages over HVAC, such as narrower right of way (ROW), fewer dielectric and capacitive losses, increased power-carrying capacity, transmitting higher voltages without increasing current carrying capacity—thereby reducing sag and heating issues [38]—and many more. All these benefits can be leveraged by often using the same wires and structures, by just switching to HVDC power. However, traditional HVDC practices are based on line-commutated conversion (LCC), which involve multiple AC-to-DC and DC-to-AC conversion stages. Such conversion losses can be eliminated with voltage source converter (VSC) techniques and by employing several high-efficiency DC-to-DC converters. Many LVDC-to-MVDC and MVDC-to-LVDC converters are readily available in the market today. However, design of an efficient solid-state converter for MVDC-to-HVDC and HVDC-to-MVDC applications is the need of the hour. Our proposed conceptual design for a MVDC-HVDC-MVDC converter is highlighted in Figure 5 and discussed in detail in [10]. The proposed XFC charging architecture will utilize silicon carbide (SiC)-based converters with high-frequency transformers for converting LVDC power from PV and battery storage farms to HVDC transmission.
By utilizing such DC-DC converter stations, the breakeven distance for transmitting HVDC vs. HVAC power can be further reduced to below 200 km, as large converter stations account for the maximum HVDC cost [35,38]. This will make HVDC technology less lossy and affordable, even for shorter distances for transmitting DC power for electric vehicle fast charging.

4. Design and Implementation of End-to-End Direct Current Fast Charging Networks

The overview of the end-to-end charging infrastructure depicted in Figure 3 divides the power network into three familiar zones—viz., DC power generation using a distant PV farm with a co-located BESS, HVDC transmission with an MVDC-LVDC distribution, and EV charging loads. To eliminate the geo-spatial and temporal variability, the study is planned for the 2030 EV load scenario in the city of Carlsbad, San Diego County, California, USA. The charging stations are located along major highways and interstate passing through Carlsbad, such as Interstate 5 (I-5). The PV farm is located outside the city limits and connected via a HVDC/MVDC architecture. In this section, we discuss design concepts and sizing decisions for the EV loads and PV-farm generation.

4.1. Mathematical Formulation for the Electric Vehicle Charging Station Load Profiles

EV charging-load profiles can either be based on simulated values or real-world data. The surveyed literature shows a mix of both methods for EV profiles [39,40,41,42,43]. The majority of the available real-world data are based on Level #1 and Level #2 types of AC charging. Since DCFC, and more so XFC, are in nascent stages of development, there is little to no real-world load data available from these charging stations. Additionally, the temporal, spatial, and power-level variations (250 kW and higher) for different FCSs make it difficult to model a standardized sample of an EV charging profile. For this reason, some authors [40,42] simulated synthetic EV load-charging data based on certain assumptions. Such studies can broadly be classified into two approaches—(i) individual EV load profiles based on assumptions for users’ travel patterns, distance, speed, etc.; and (ii) cumulative load profiles for an entire charging station (CS). Owing to tremendous variability in travel patterns, distances, and schedules for the growing EV user base, we have modelled our EV charging-load profiles on a hybrid approach. Cumulative charging profiles were designed for different types of CS based on diverse EVs, arrival rates, charging times, charging power curves, and sessions per day to account for variability in the load model.
The following are key assumptions with respect to system design:
(1)
We have considered a system of N buses, i.e., 1, 2, 3, …, n ∈ N, which are LVDC load buses used for local connection with the Nth charging station. The DC voltage and current at these LVDC buses are given by V C S N and I C S N , respectively, and are bounded by following limits:
400   V V C S N t 1500   V
437.5   A   I C S N t 3000   A
(2)
The total number of charging points (CPs) at the Nth station is K, i.e., K = 1, 2, 3 …, k, and is dependent on maximum power constraints permissible at the charging station, utilization rate of the station, number of EV users, geographical topology, and vehicle charging schemes (shared or individual). The total power rating of the kth charger at the Nth station is given by P k N and is broadly classified under the two categories:
  • Light-duty EV (LEV) Passenger XFC [43]:
    250   kW     P k N t   500   kW     k     N l i g h t d u t y
  • Medium to Heavy-duty EV Fleet (MEV/HEV) XFC:
    1000   kW     P k N ( t )     4500   kW     k     N heavy duty
This is to also ascertain that the XFC charging points (CP) at a given station have similar charging ratings and there are not different chargers (Level 1, Level 2, DCFC, etc.) present at the same charging station (CS). Some CS are exclusively reserved for charging heavy-duty vehicles, such as buses and truck fleets, and others are designated for light-duty or small passenger EVs. Table 2 highlights the three different types of CS considered in the paper. The total charging load is the cumulative demand observed at these three stations for different EV types.

4.1.1. Light-Duty Passenger EV’s Load Profile

For discussion of light-duty or small passenger EVs arriving to charge at Type #1 CSs, we have used following assumptions.
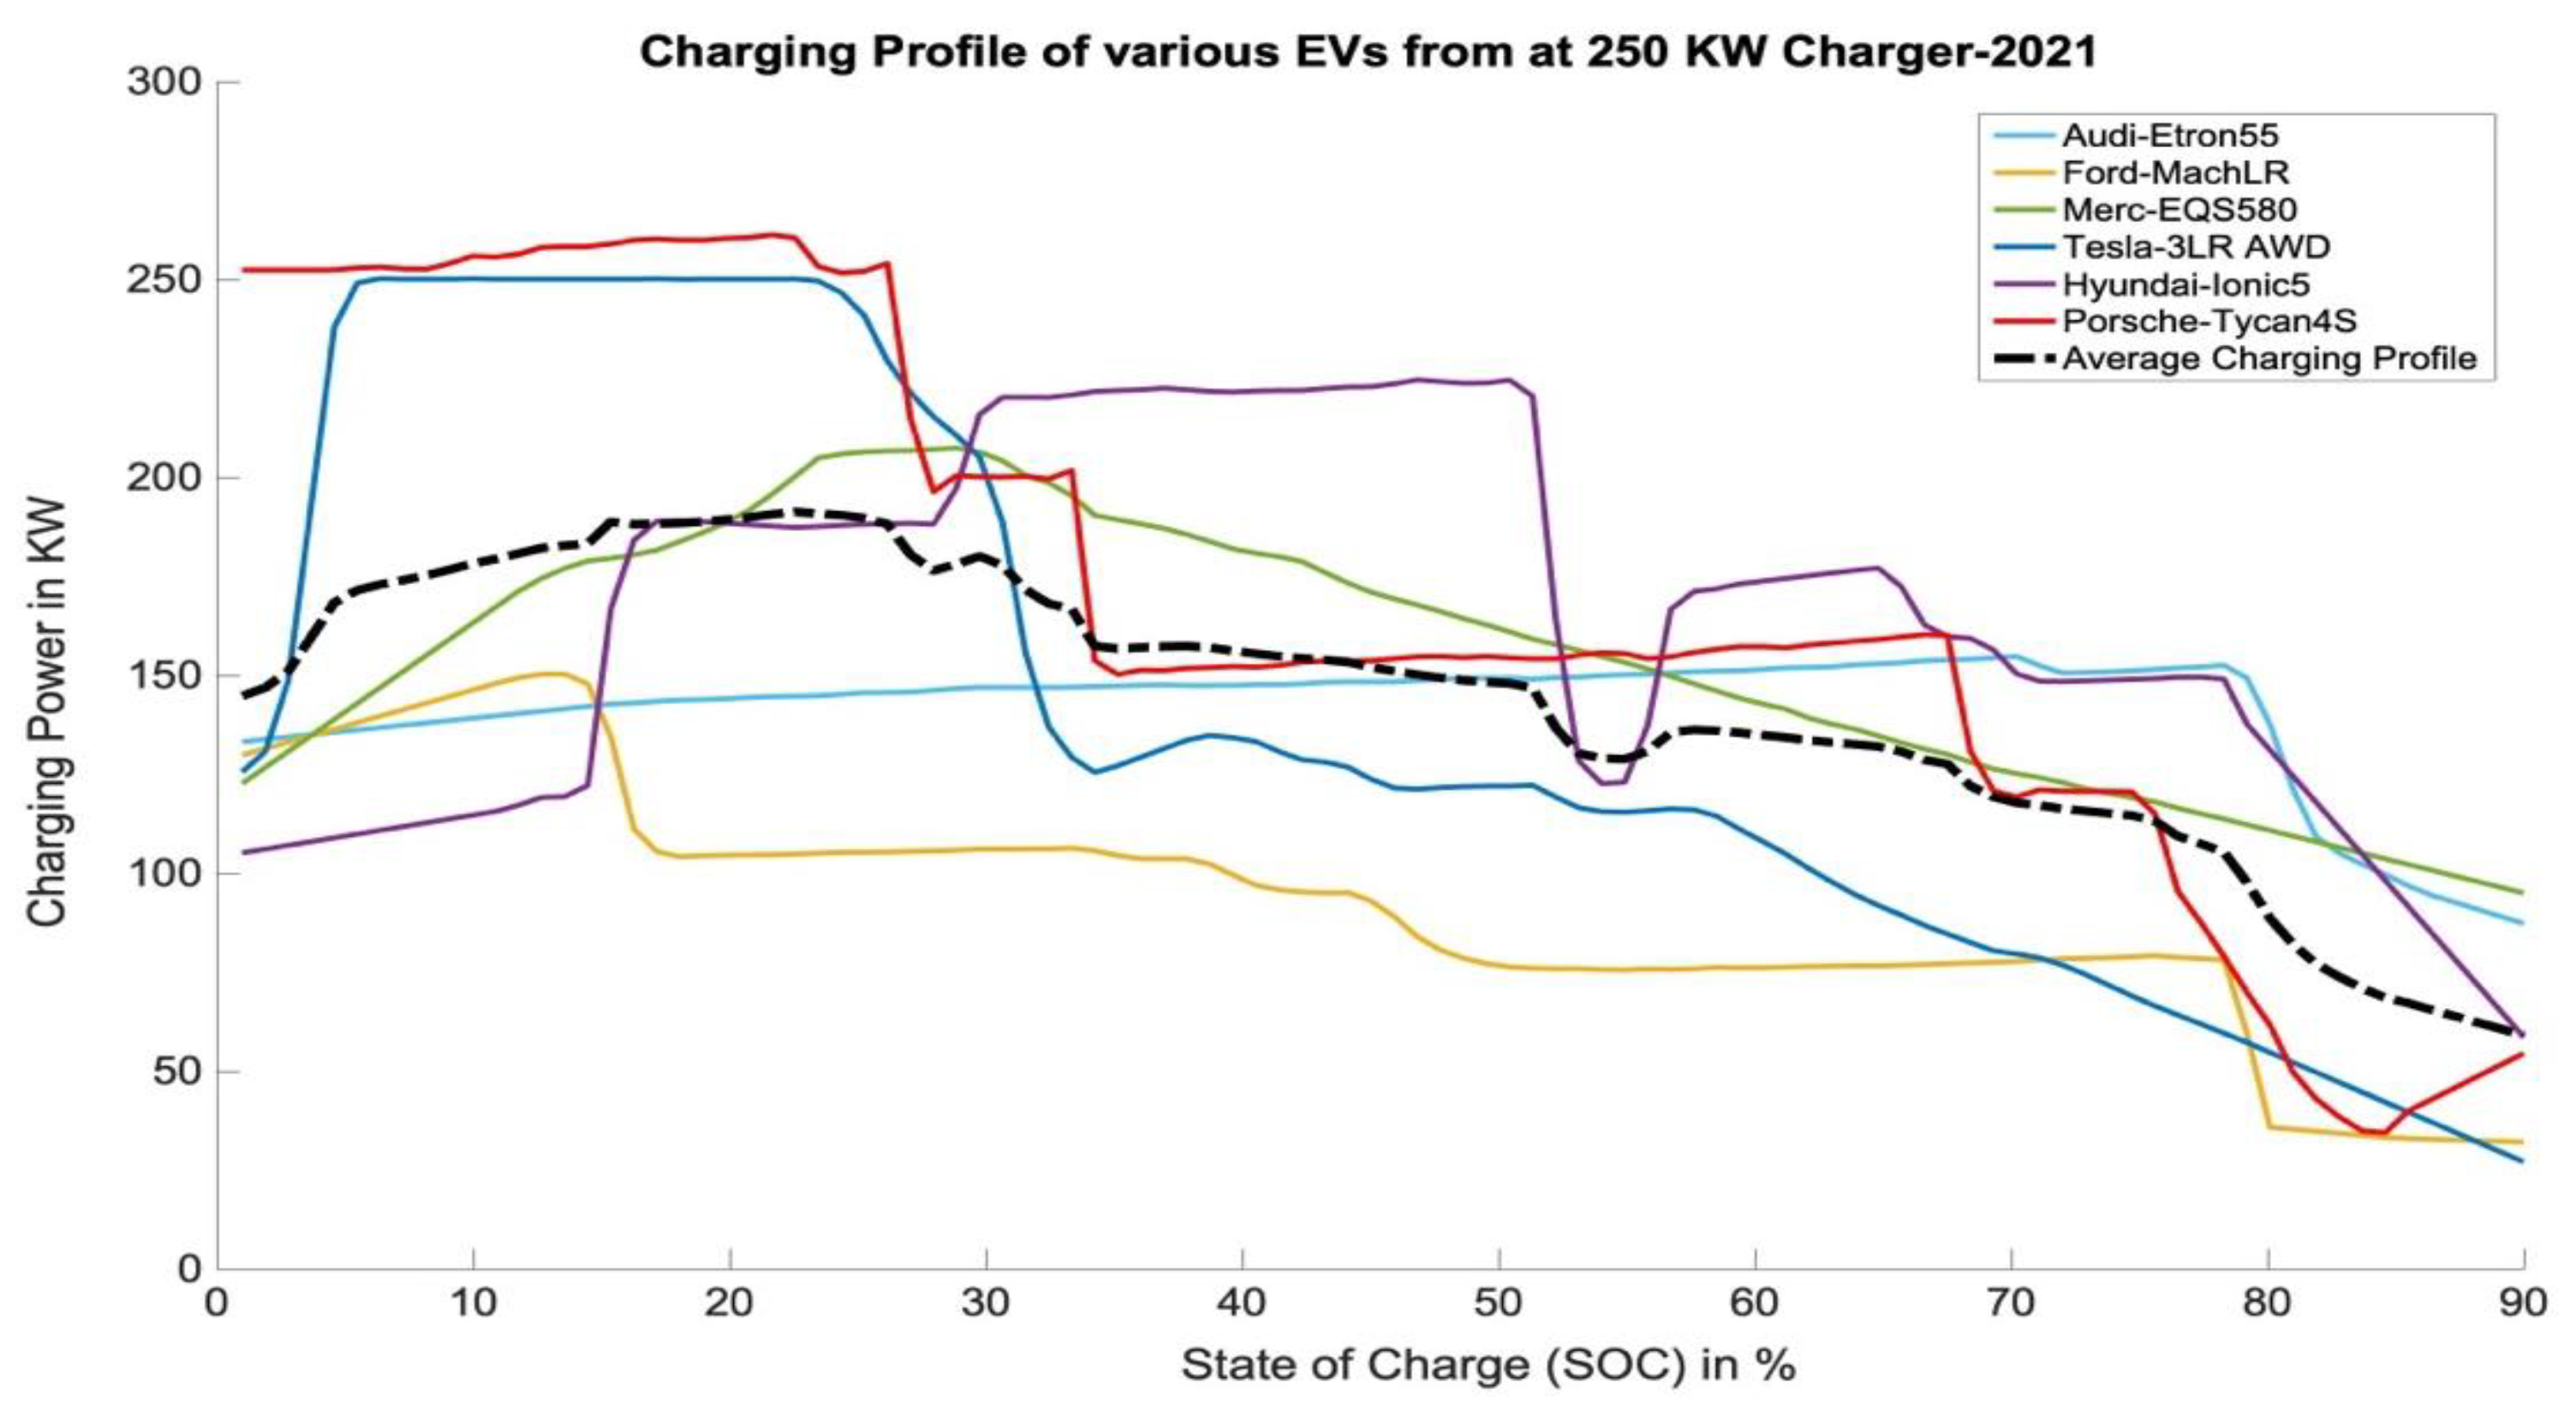
  • Vehicle Type: Different EV manufacturers have various specifications for driving range, battery size, weight, the drivetrain, charging speed, and the battery management system (BMS). As newer cars are being manufactured, the charging infrastructure should be flexible to incorporate a range of vehicles and not be specific to a single type of manufacturer. To incorporate a real-world scenario in our model, the top 12 EVs were surveyed, and available charging profiles were studied. The choice was narrowed down to the top four EVs based on EV market sales in CA [47]. The electric vehicle-mix selected was—Tesla Model 3—Long Range (LR), Porsche Tycan 4S, Mercedes EQS 580, and Hyundai Ionic 5. Table 3 illustrates the specifications and assigned population mix of selected EVs that made up our LD passenger-EV charging-load profile.
Table 3. Specifications of different EVs considered in the load profile for the 250 kW charging level.
Sr. No.Make & Model
(2021)
Assigned Proportion of EV
Population
Average Charging Time (in Minutes) Total Rated Battery CapacityMax. Charging Power per EVRef.
1.Tesla Model 3-LR55%2282 kWh250 kW[48]
2.Porsche Tycan 4S15%2593 kWh257 kW[49]
3.Mercedes EQS-58017%23108 kWh200 kW[50]
4.Hyundai Ionic 513%1877 kWh220 kW[51]
  • State of charge (SOC): The EVs arriving at the CS have depleted battery capacity—20% state of charge (SOC) of the rated battery capacity. EVs need charging to a maximum level of 80% SOC of the rated battery capacity. After the 80% SOC level was reached, the CP stopped charging the car. We assumed an ideal scenario replicating the gas pumps where users do not park or occupy the CP longer than required and quickly vacate the spot when finished charging.
  • Charging rate and time for full charge: The charging profiles for EVs will be different based on battery chemistry and drivetrain ratings adopted by different EV manufacturers. To prevent electrode oxidation and battery degradation, the on-board BMS for EVs limits the battery charge rate to improve long-term battery efficiency. This results in limitation in charging the EVs at the maximum nameplate power rating of the XFC charger [52]. For realistic charging profiles for EVs, we have considered this limiting rate for different modelled EVs. An average charging profile mix was generated based on reference [53]. The 250 kW DC fast charger is shown in Figure 6.
Figure 6. Average charging profiles for different EVs on a 250 kW charger [53].
Batteries 09 00169 g006
Appendix A highlights the demonstrates the charging profiles and variability generated in load profiles generated using MATLAB.
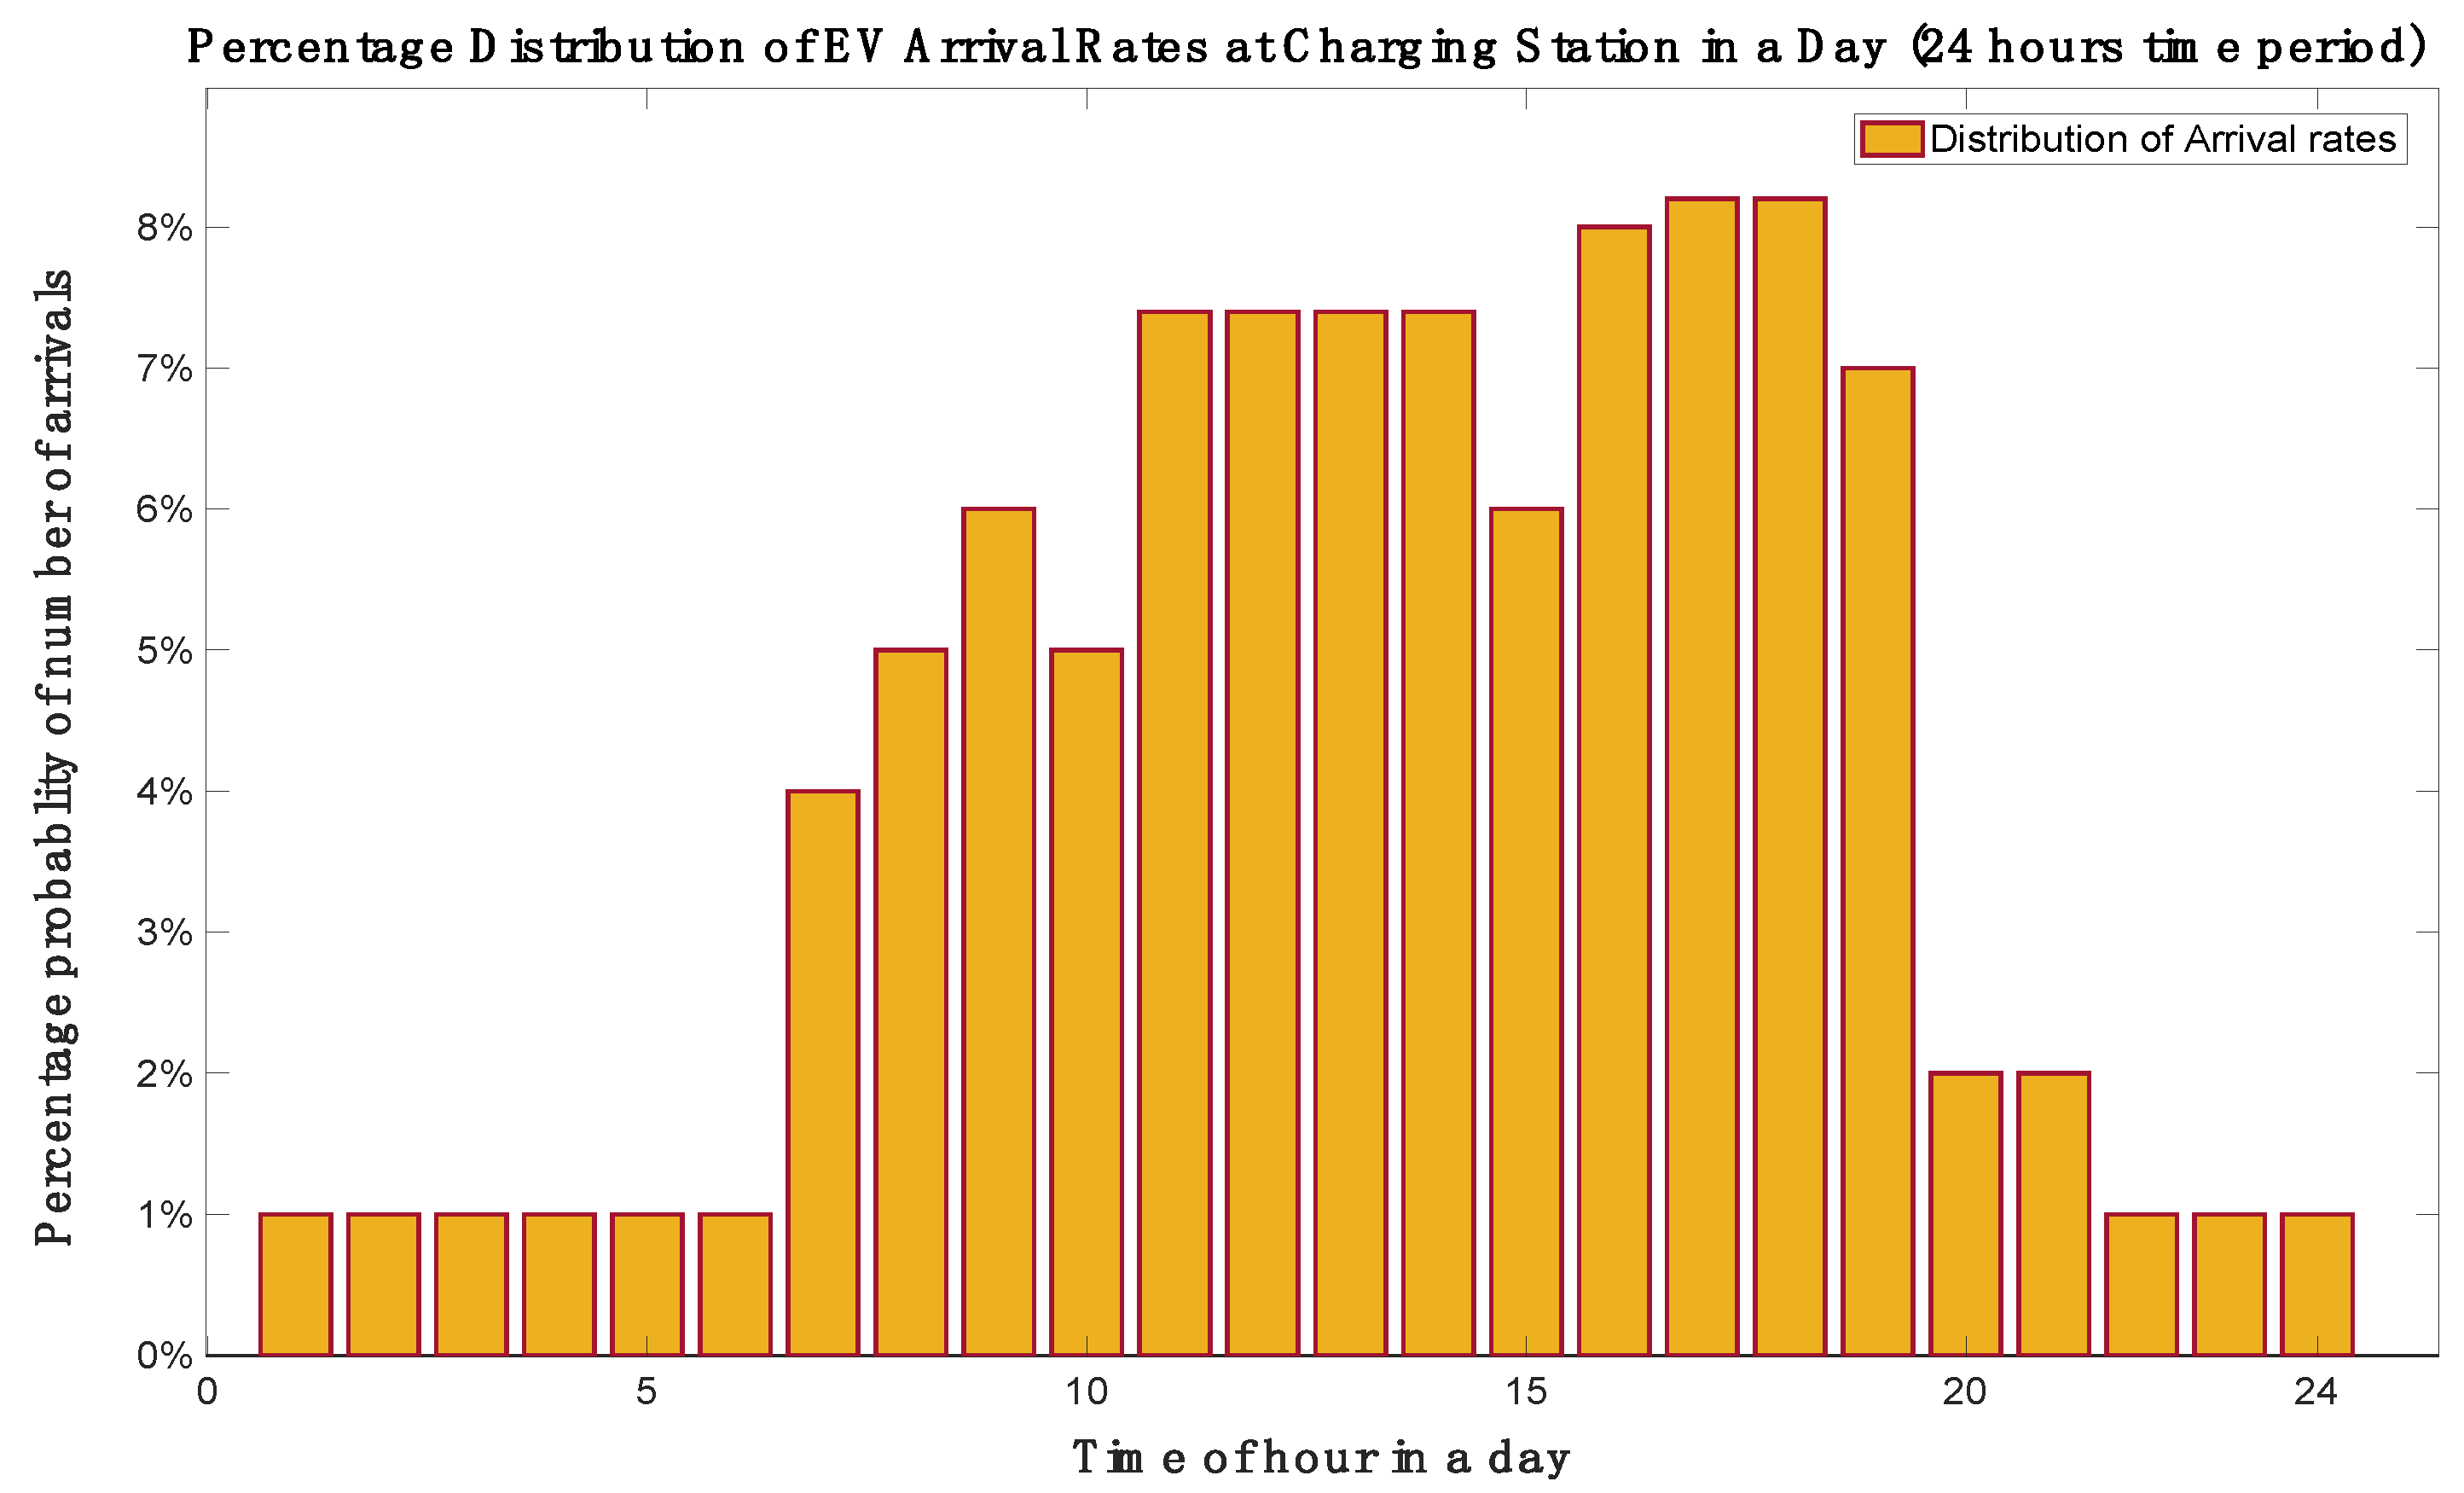
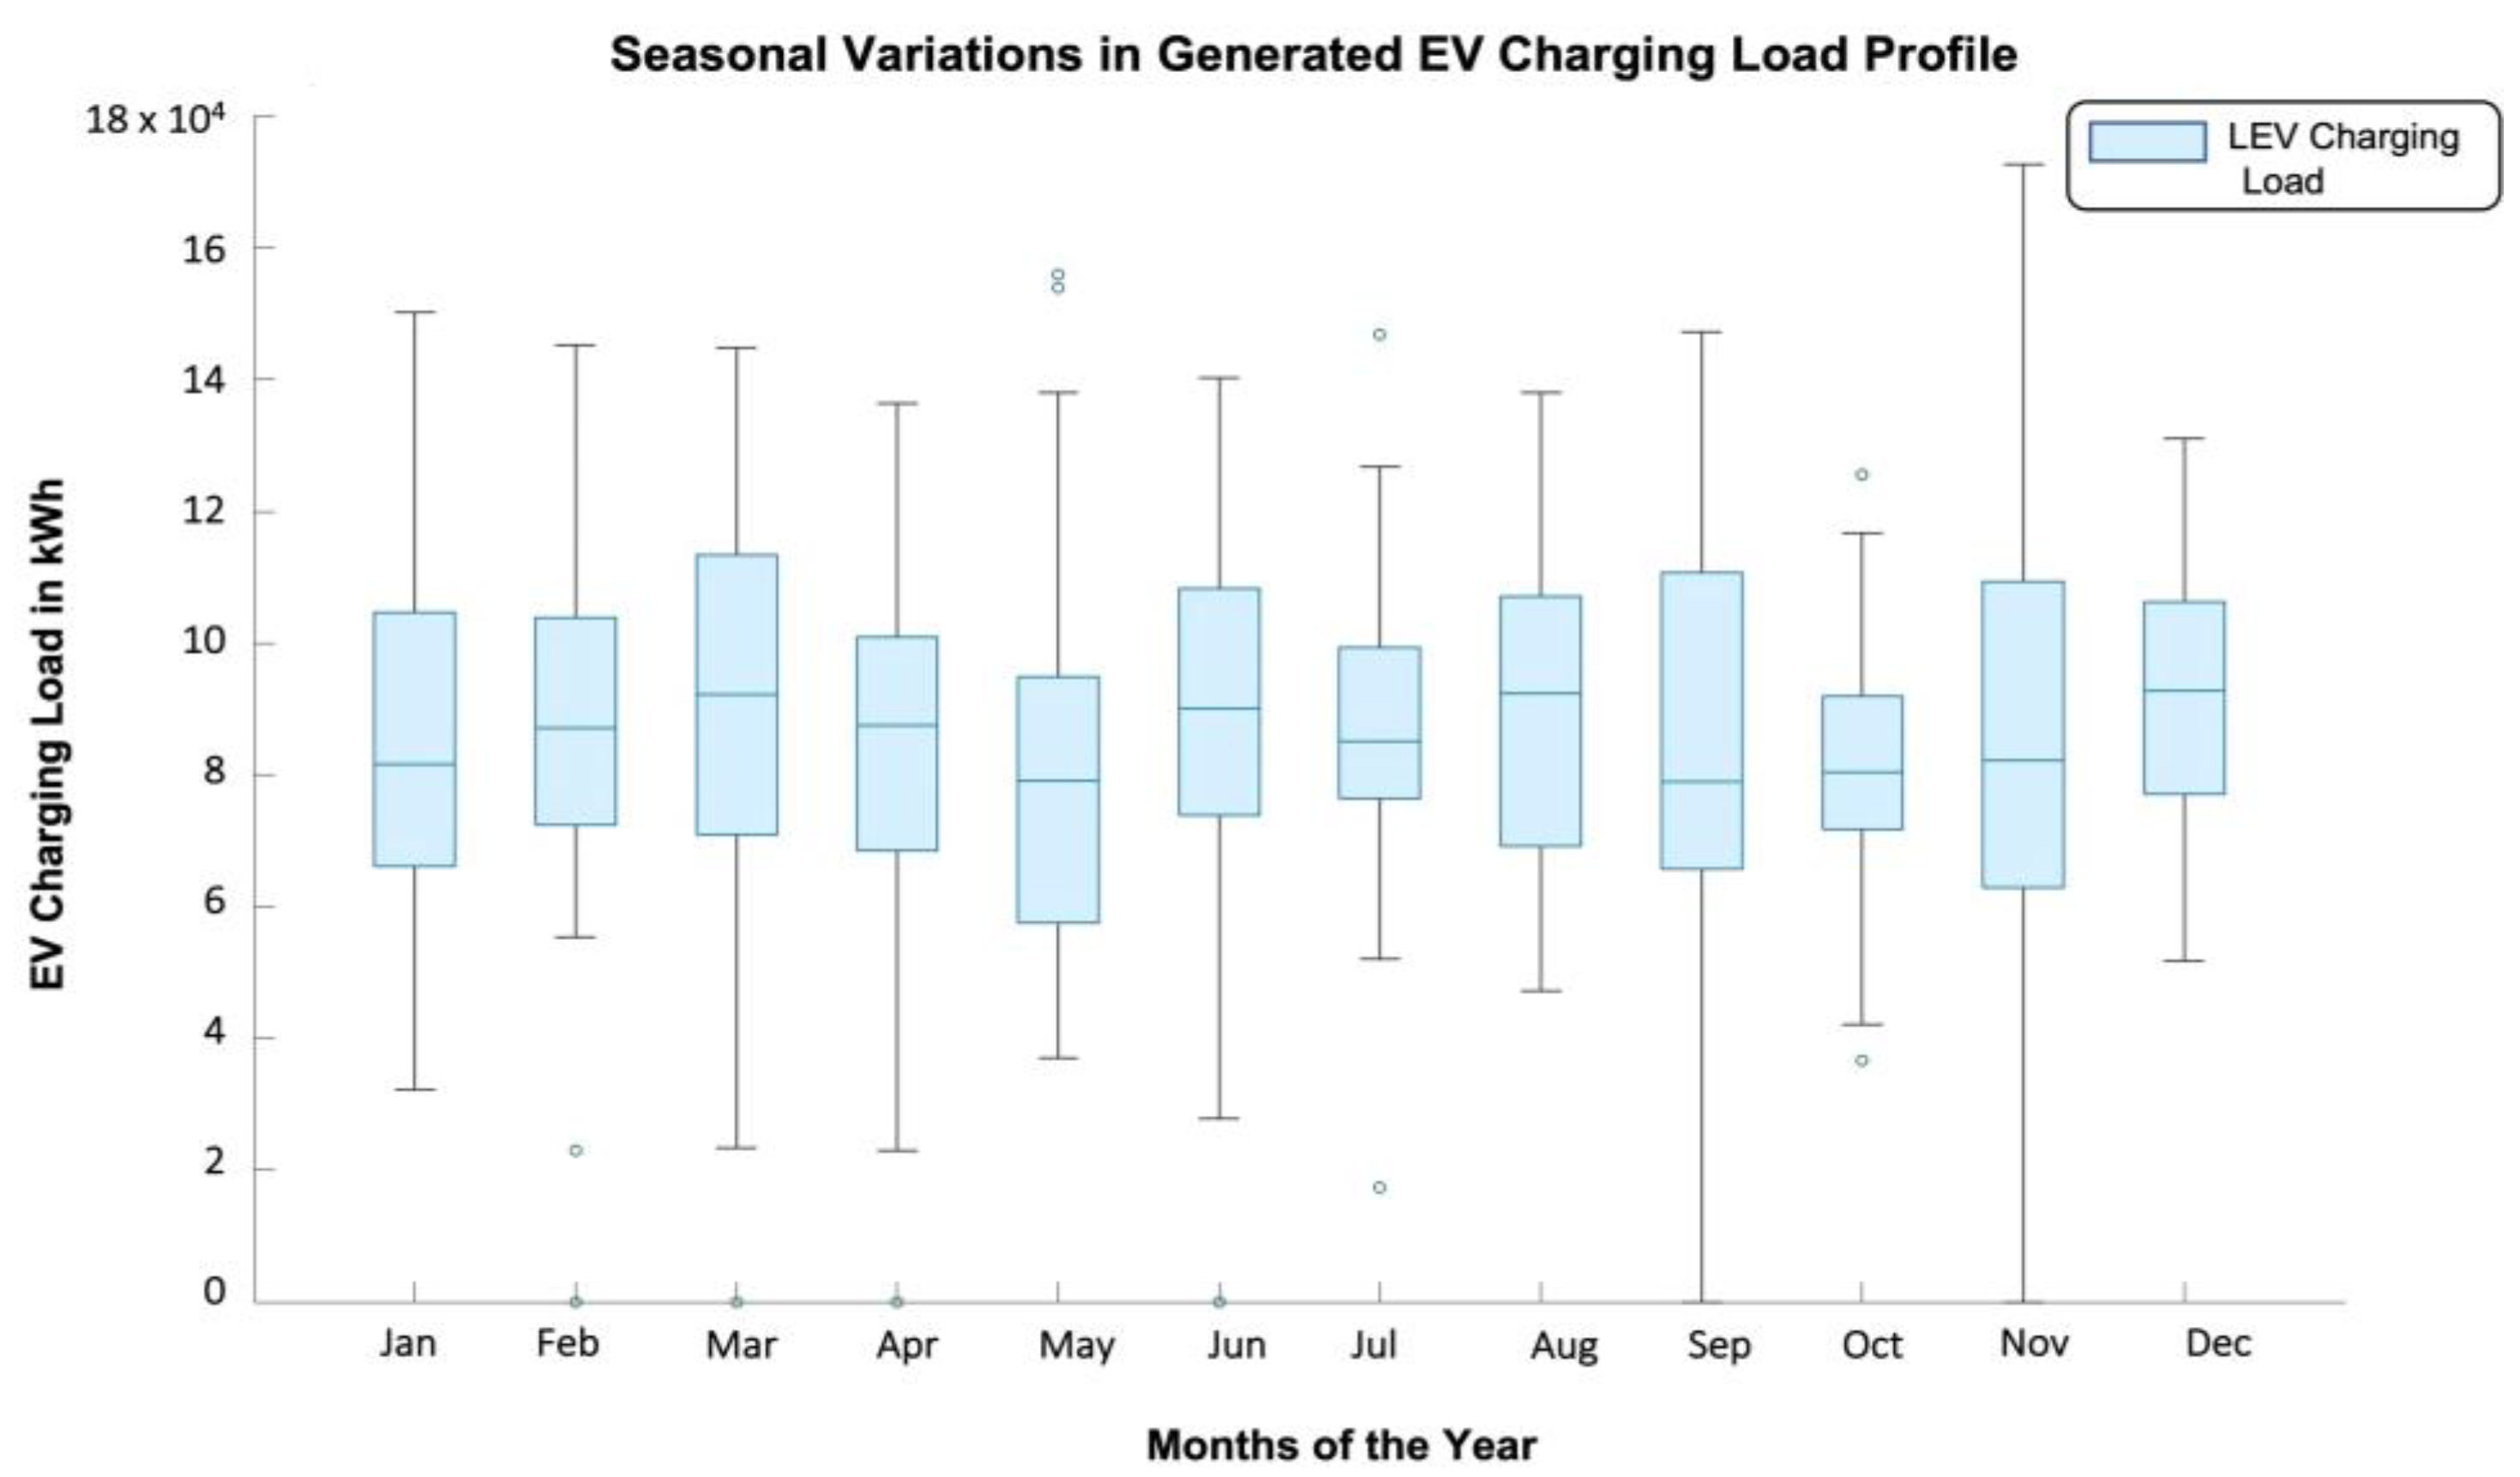
  • Arrival rate at charging stations: The arrival rate of EVs at the CS is random in an uncoordinated charging strategy. To incorporate this stochastic behavior in our load profile, we modeled the arrival rates based on the existing gas station service model [54]. With the widespread adoption of EVs and eradication of the demand-charge pricing model that dictates charging times, the consumer behavior for refueling at the gas station will remain the same for charging EVs at public FCS, irrespective of the type of transportation. Thus, we have designed the load profile based on the distribution of users at the gas pumps. The modeled histogram for frequency of arrival in different hours of the day is depicted in Appendix A. Poisson-distributed arrivals rates are assumed for each hourly timestep based on the mean, as indicated in reference [54]. Different profiles for weekday and weekend charging events were generated to account for variability. The load model also includes 5% seasonal, 30% day-to-day, and 10% timestep variability. For each season (4 months), each day (24 h), and each timestep (1 h), randomized numbers from the uniform distribution of mean, as given in reference [54], and standard deviation with respective percentage variations, were selected. As a result, a unique annual load profile was generated, with varying peak and minimum values, while maintaining a fixed gas-station distribution mean of arrivals. Appendix A explains in detail the generated EV charging-load profile and depicts a boxplot showing seasonal variation in load data.
  • Charging connectors: Public FCS should have standardized connectors that reduce the use of multiple adapters for a widespread EV adoption scenario. Existing DC connector markets offer four types of connectors—viz., Combined Charging System (CCS1 or CCS2), CHAdeMO, GB/T, and Tesla’s proprietary connector. CCS is the most commonly used connector in several countries, and eventually, a cohort of auto-manufacturers and charging environment providers should standardize a global DC fast charging connector. Adaptors used for charging should be completely avoided and eliminated from the charging mix. Adapters, as additional parts in the electric connection between an EV and an FCS, increase the probability of faults and affect the functional safety [55]. The proposed model advocates for an adapter-less, standardized DC connector design. Thus, different makes and models of EVs could all leverage the proposed fast charging infrastructure.
  • Utilization rate: The low utilization rate of FCSs leads to diminished return on investments and throttles newer installations. On the other hand, a high utilization rate leads to longer queues and increased wait times for users, which discourages public FCSs. Thus, optimum utilization is crucial for profitability. In the proposed model, a range of utilization scenarios are considered for LD, MD, and HD EV charging. The decided utilization rate is based on little-to-no queues at the charging station. For LD passenger EVs with Type #1 CS (as listed in Table 2), a variable utilization rate of 20–30% was selected. This rate is also substantiated by reference [56] as a rule of thumb for optimum utilization based on economic reasons. For higher utilization scenarios, we propose the operator should likely expand capacity or add another nearby FCS site. A scaled average of 1000 charging sessions or events per day were evaluated for load profile generation. Uniformly distributed variability was added to the number of charging sessions per day with a minimum of 600 and a maximum of 1500 sessions for 100 total charging points at a Type #1 (250 kW) station and 50 points at a Type #2 (350 kW) station. The hourly maximum utilization of 30–60% of CPs occupied was also studied, which easily replicates densely populated urban cities.

4.1.2. Heavy-Duty EVs—Truck Fleet Charging Load Profile

Electrification of both short-haul (<300 miles) and long-haul (>300 miles) trucks, also referred to as Class 7 and 8 tractors or semis, requires major grid upgrades, as mentioned in Table 1. According to [57], 70% of these electrified heavy duty (HD) fleets will require public FCSs for completing trips, as opposed to slow overnight depot-charging. The HD fleet charging infrastructure is thereby undergoing a complete revamp and is in its nascent design and development stages. There is very little real-world data available from HD trucks charging with 1–2 MWh battery capacities at ultra-fast 1 MW+ charging stations. Owing to the abovementioned reasons, the load profile for HD fleet charging was studied and adapted from existing studies [46,58,59,60,61]. Short-haul HD trucks are prime candidates for electrification. As explained in [62], short-haul truck trips account for roughly 50–70% of all freight trips completed each day in the U.S. These trips are usually less than 100–200 miles in distance. Long-haul trips account for a meager ~10% of heavy-duty freight transport (an operating range of 500 miles or more) [63]. For this purpose, the proposed load design for HD truck charging is focused on short-haul transport. However, contrary to [63] the approach of slow overnight depot charging, we propose a grid-independent, reliable fast charging network of 1 MW+ chargers irrespective of the short or long-haul use of the trucks. A standardized freight-transport charging infrastructure is necessary for improving efficiency and reducing GHG emissions. For the purpose of this study, a dataset for short-haul heavy-duty trucks regarding the routes, frequency, schedules, charging profiles, etc., was incorporated from [63]. Following are some key assumptions:
  • State of charge (SOC): The HD fleet trucks or buses arriving at the CS have depleted battery capacities, 30% SOC, and need fast charging to a maximum level of 80% SOC. The justification for the above assumption is [62], where the vehicles under test running the daily duty cycle never dropped to 50% SOC for their batteries.
  • Charging rate and time for full charge: Since d range is the prime necessity of such HD/MD vehicles, we assume that the XFC charging infrastructure can provide power to the EV at a maximum nameplate charger rating. Thus, there are no limitations imposed on the charging power, and a fixed power flow as described by Equation (4) is assumed with charger efficiency. The time to full charge (80% SOC) is about 40–70 min, depending on a variable battery capacity of 600–1200 kWh [60].
  • Arrival rate at charging: Most of the HD trucks have scheduled travel time during the night and off-duty times after trip completion that occur during the evenings [58]. The HD trucks thus may charge in between trips during the daytime or before beginning the trips in the wee hours of morning. However, as studied in [26,58], the peak demand in truck electrification is probable to occur during the midday window when the curtailment of renewables is most likely. The negative wholesale electricity prices during early to midafternoon can also be avoided by utilizing high PV and wind generation to furnish the peak HD truck charging demands. The temporal concurrence of truck electrification load and solar irradiance shows a possible synergy for powering HD trucks with photovoltaics. The arrival rates and schedules were adapted from Fleet 3—Food and grocery delivery trucks, from [63]. The selected fleet’s load profile has a busier and more variable schedule, more travelled miles (500+ maximum daily vehicle miles travelled), and higher peak demand than the other two fleet profiles from reference [63]. The selected load profile can also be extended for long-haul HD trucks with optimally located charging stations. The immediate peak load charging scenario was modeled for 100 EV fleets. We have tweaked the code for enabling fast charging at 1 MW instead of 100 kW slow charging from the original work.
  • Utilization: Since the HD trucks only make up about 4% of road transport vehicles [63], and have sporadic routes of longer distances, lower-utilization scenarios along highway corridors need to be considered. On the other hand, higher utilization rates can be considered for depot charging for one or multi-owner fleets. We have thus utilized varying 10–50% utilization for load formulation to accommodate both these cases.

4.1.3. Medium-Duty EV Charging Load Profile

  • For MD Type #2 FCS, 85% of the EVs were assumed to charge at the rated 350 kW nameplate rating, and the other 15% were charged at 250 kW. This is due to on-board BMS vehicle charging constraints and is not related to charger limitations. As seen in these studies [64,65], the average charging duration for MD trucks charging at 350 kW is assumed to be a variable time of 40–60 min. Several MD trucks, such as the Chevy Silverado EV, Ford F-150 Lighting, GMC Hummer EV, and Rivian R1T, were considered for the study. Most of these are in production stages, and once available on the market, one could study the on-board charger limitations in detail. Other than passenger vehicles, fleet school buses, pickup delivery vans, and refusal trucks can also utilize these MD FCS for on-the-go charging in between trips. However, since these fleets will account for a very small fraction, as depot charging will be preferred, we have modeled the load at MD FCS to be of a passenger EV type. The arrival schedule for charges was thus similar to that of LD passenger Type #1 chargers, and all other specifications were directly incorporated from passenger vehicles from Section 4.1.1.
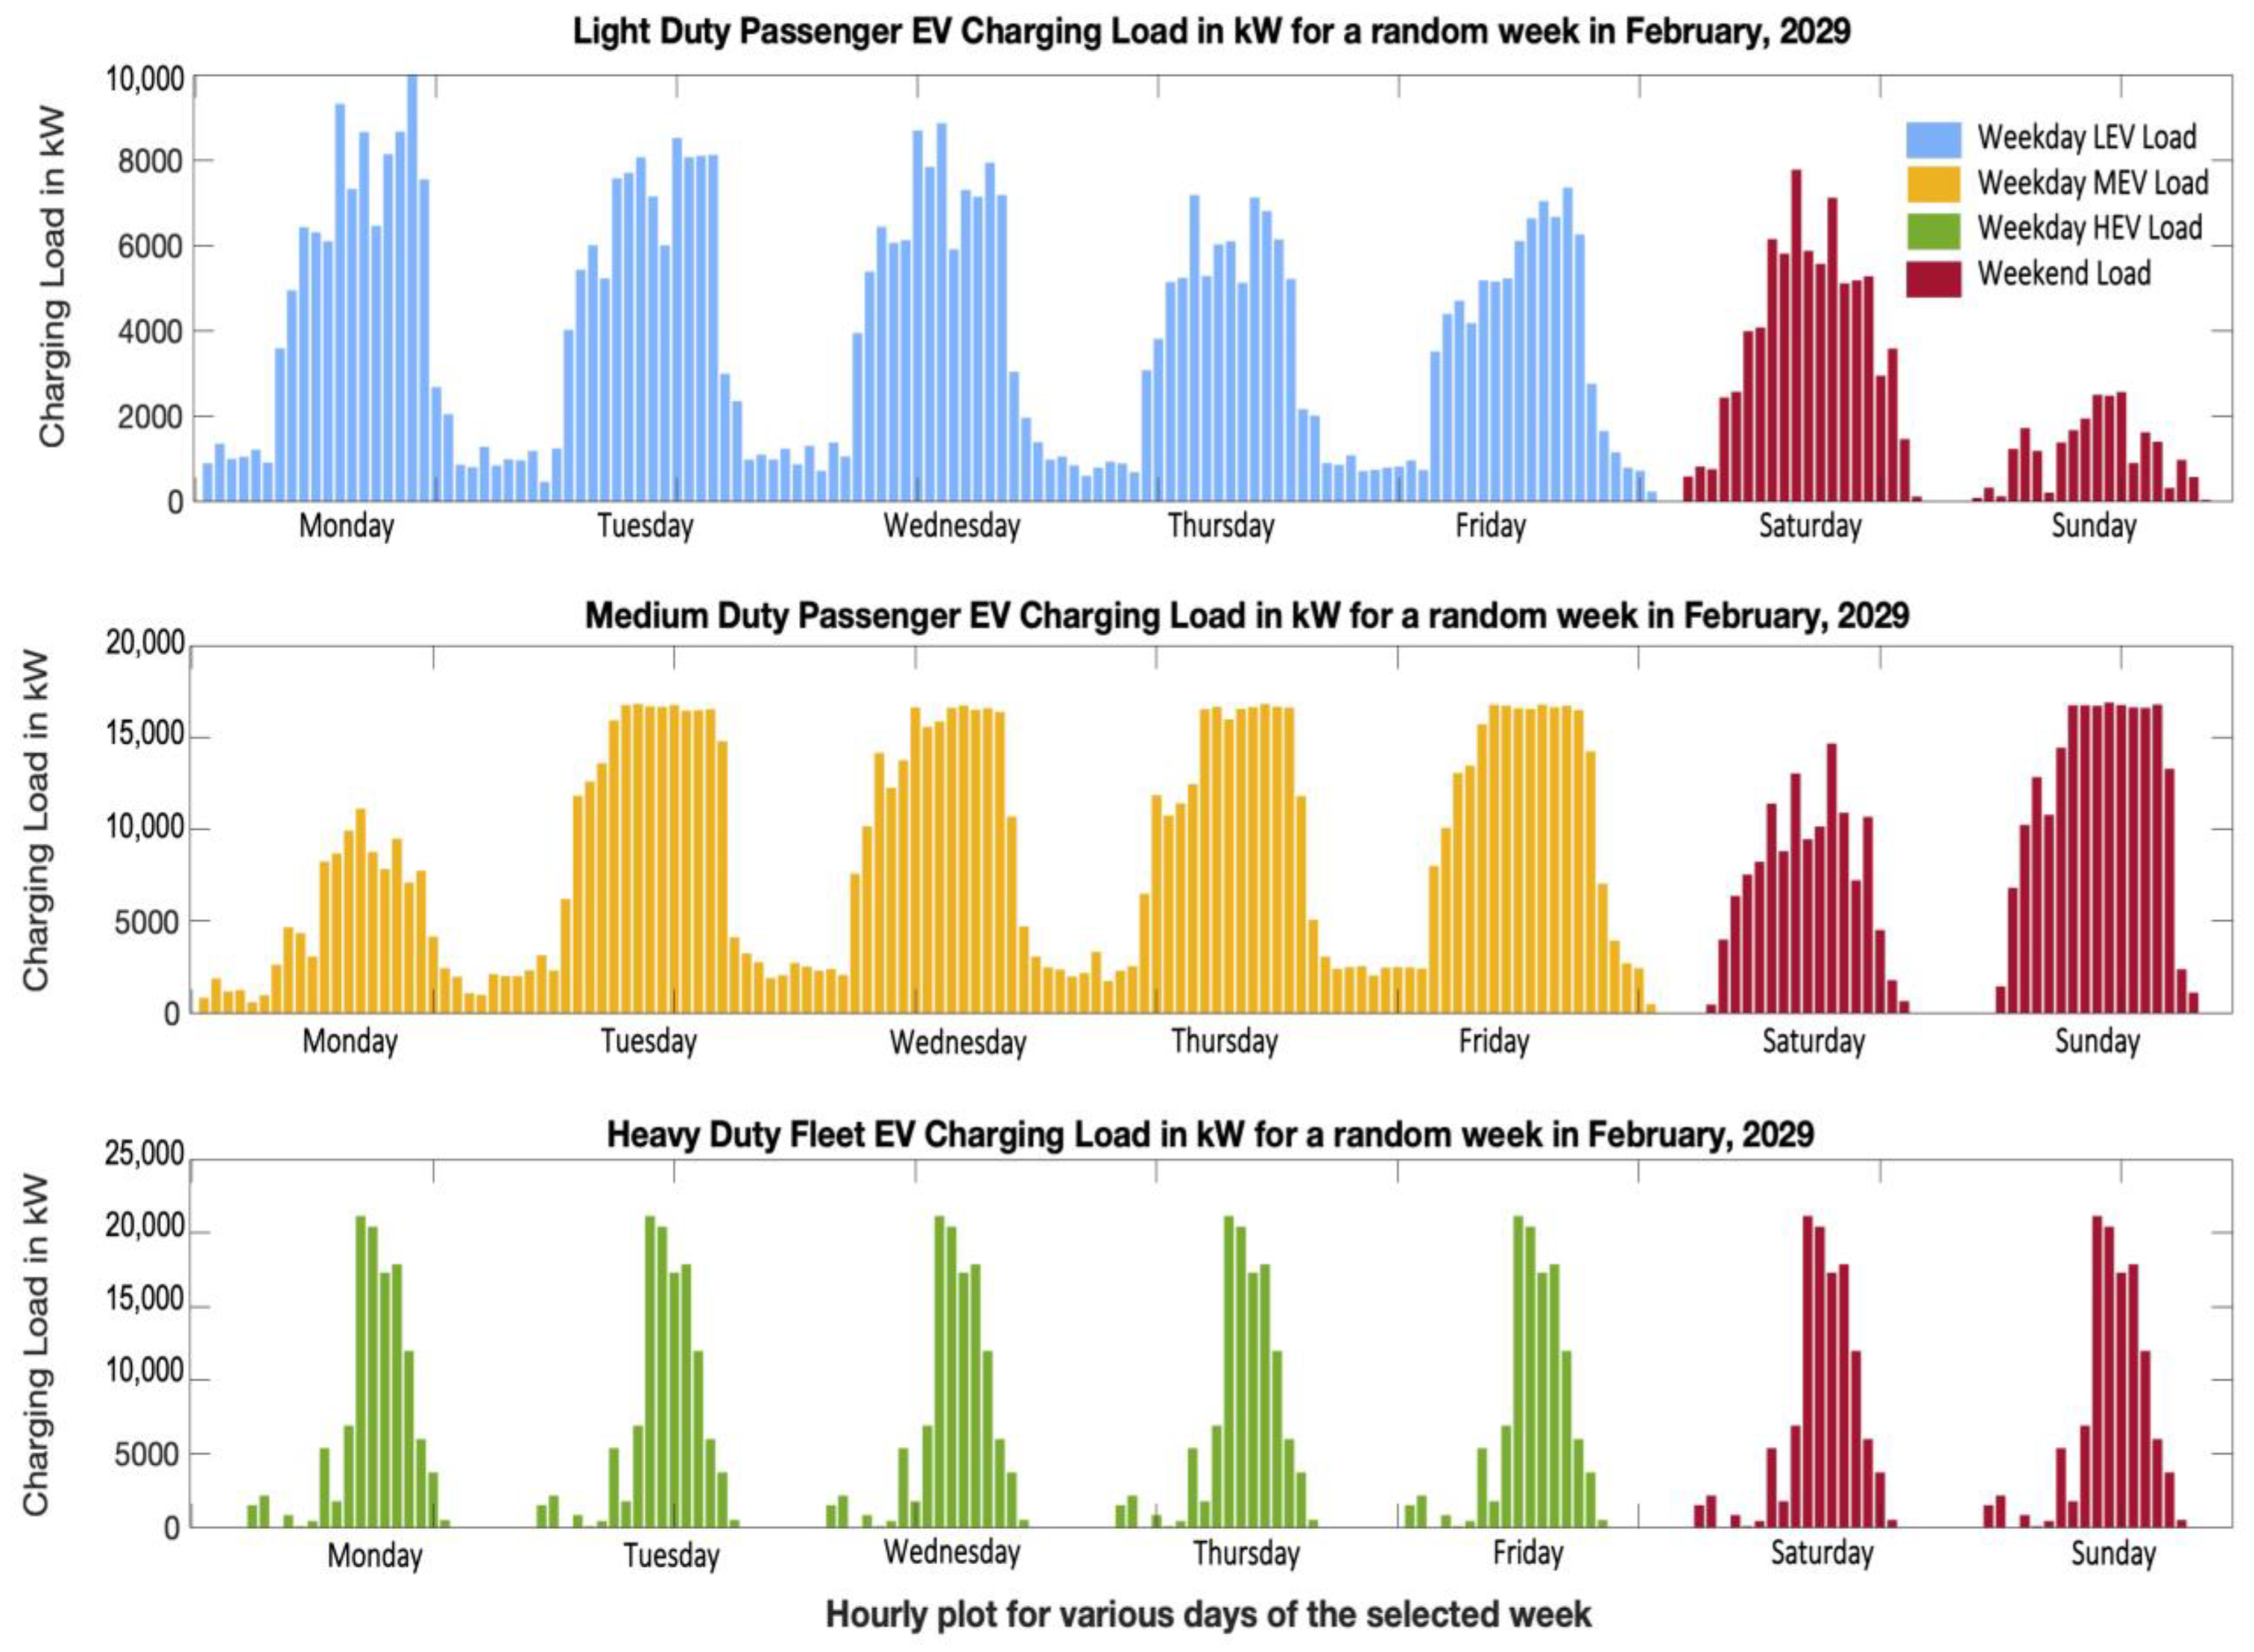
  • The combined load profiles for all three types of charging stations (in Table 2) are depicted in Figure 7. For passenger LD loads, separate weekend and weekly profiles were generated, and a random week was chosen for graphing purposes. Since seasonal variations do not account for much variability in HD truck fleets, as assumed in [63], we excluded those variables in our load model.

4.2. Mathematical Formulation and Sizing of the PV Farm and BESS

The preliminary step of sizing a PV farm is obtaining the irradiation profile of a specific geographical region under test. Considering that the majority of the FCS will be located around densely populated urban or suburban localities, land area for the localized PV farm is limited. We have thereby assumed the farm location to be several kilometers from the designated charging station corridors. Two different cases for the PV farm connected to MVDC distribution and HVDC transmission were considered. The summary of the proposed PV farms selected for the designed EV load is provided in Table 4. The selected PV farms are existing utility-scale solar projects by Aventus, formerly known as 8 min Solar Energy, that are either in developmental or operational stages [66]. Thus, the land-use feasibility and environmental impact study of these locations are already approved. These PV farm projects are shovel-ready and not in interconnection queues. The design and sizing for both the PV farms are analogous and explained in the subsections below.

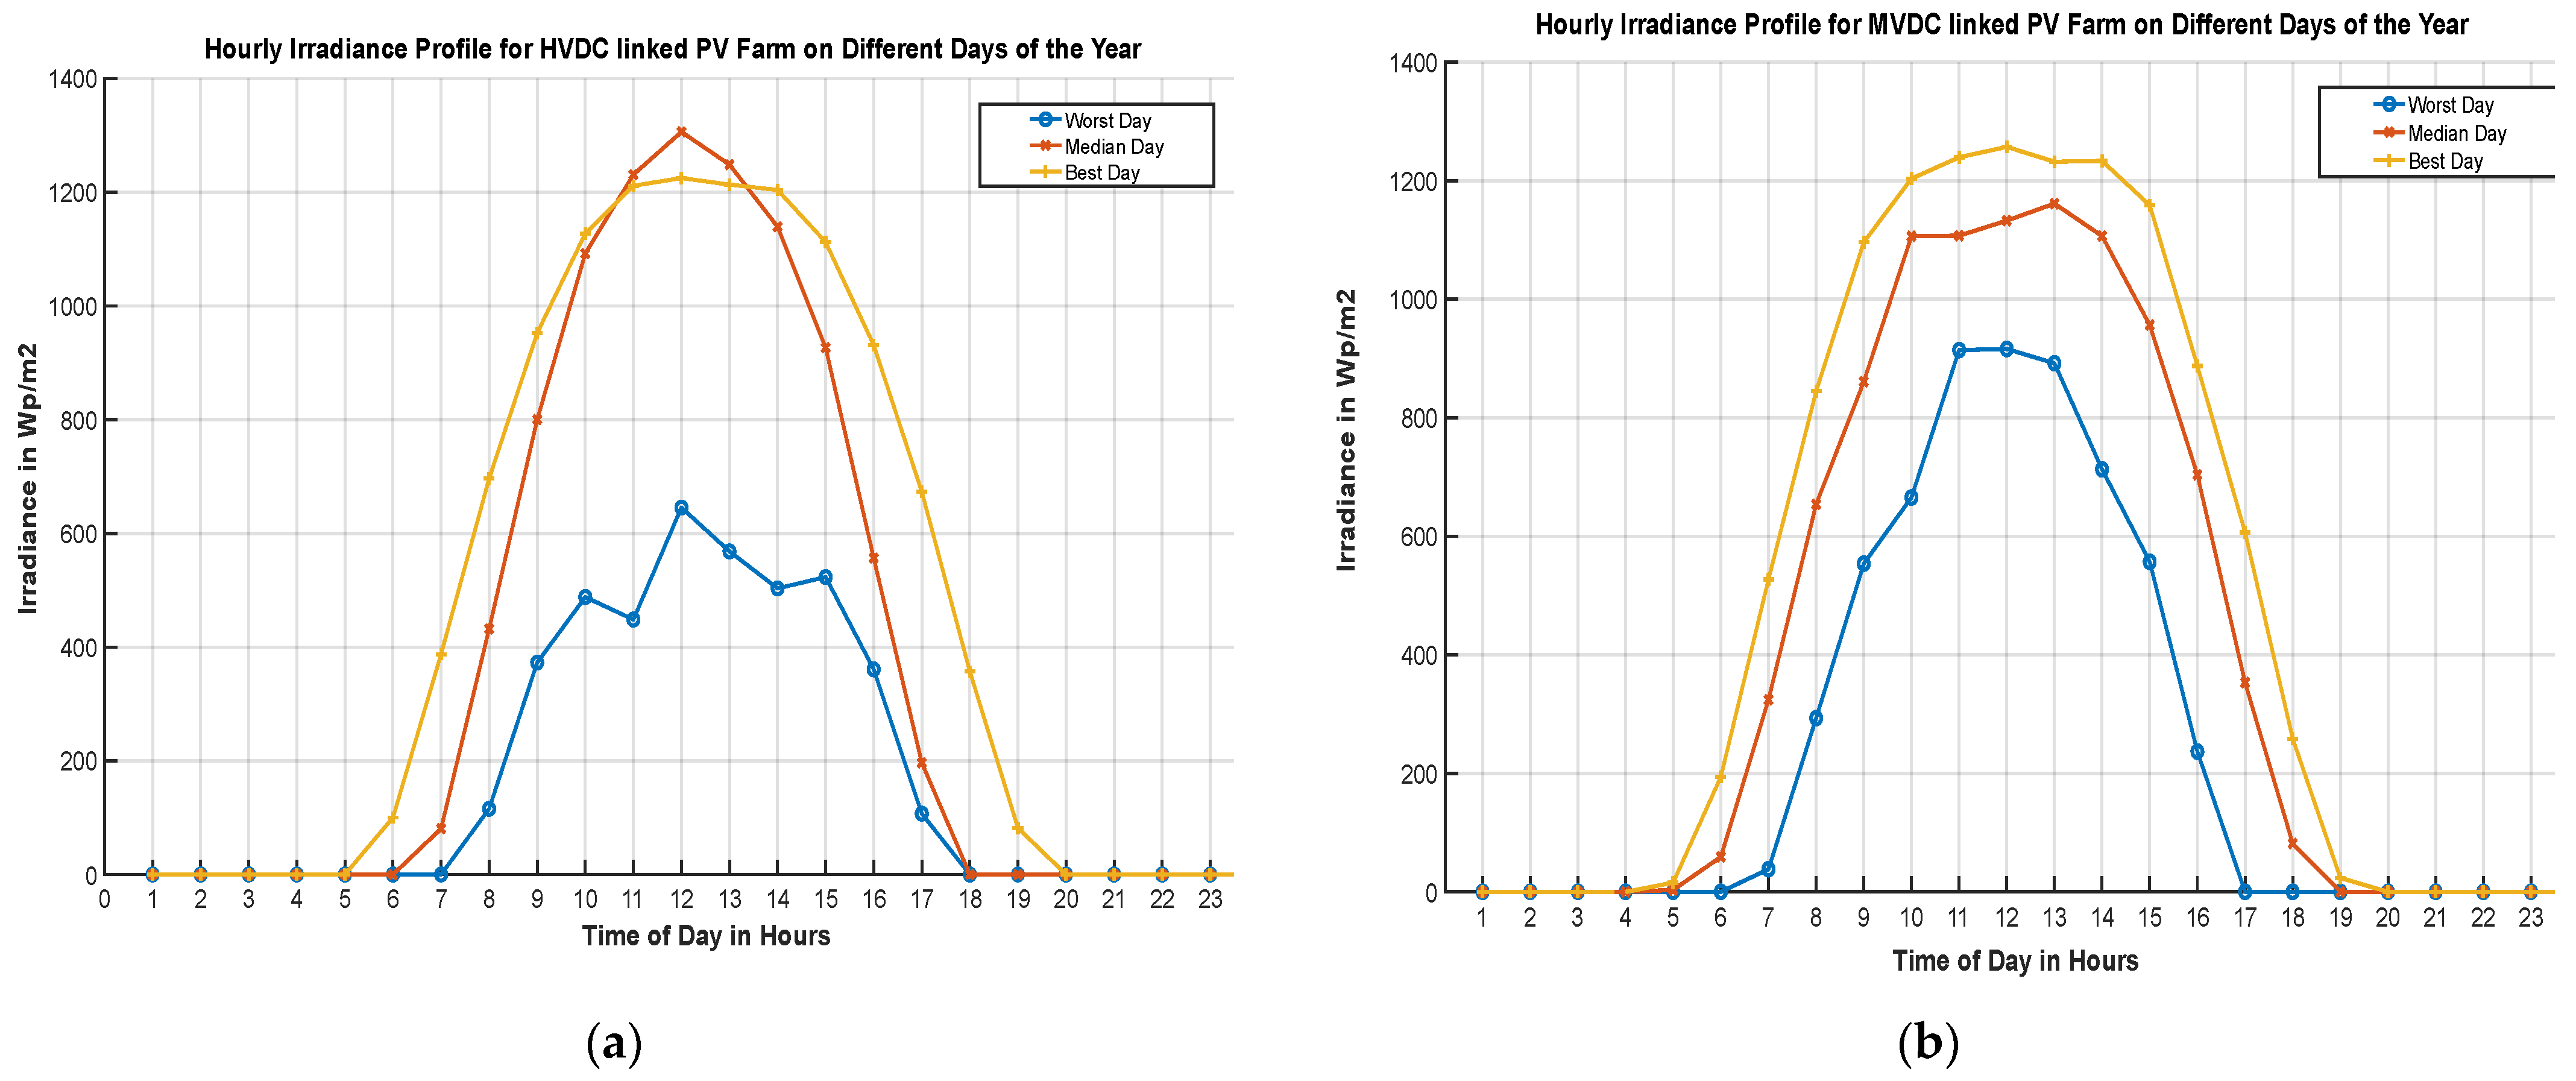
4.2.1. Irradiation Profile

The annual irradiation profile based on the above two PV farm locations was downloaded from National Renewable Energy Laboratory’s (NREL’s) National Solar Radiation Database (NSRDB) [68] for the previous 15 years (2006–2020) on an hourly basis. This was required for eliminating erroneous readings of the pyrometer during cloud cover conditions. Since the area of the farm is spread out and much larger than the field of view of a pyrometer’s coverage, it would not be practically correct to incorporate near-zero values for the direct normal component of irradiation during specific cloud cover scenarios as measured in the database. Along with the direct normal, horizontal diffused radiation and surface-reflected irradiation components are also included in our model to account for a realistic PV farm’s irradiation profile. The PV farm is oversized, based on the worst irradiance (cloudy) day scenario, such that maximum EV charging load is easily satisfied with PV generation, even under cloud cover. Thus, we ensured reliability of meeting the yearly EV charging demand. We have also included temperature compensation and optimum tilt angle calculations to maximize the PV farm output. We avoided the use of single-axis or double-axis trackers, since the selected farm locations produce sufficient tilted and temperature-compensated irradiance. Specifics about the solar panels utilized, the arrangements, and various other losses for accurate PV farm sizing are included in Appendix B. Figure 8 shows the hourly irradiation profiles for three different sunshine days of the year for the PV farm locations.

4.2.2. Temperature Compensation and Optimum Tilt Considerations

The temperature of solar panels is compensated using the formula adapted from [9]:
Compensated Panel Efficiency = Panel Efficiency + Τtest − Τambient × Tpower derate factor
where Panel Efficiency is assumed to be 22.3% for SunPower’s MAXEON 6: SPR-MAX6-475COM [69]; Ttest = 25 °C, assuming the standard testing conditions (STC); Tambient = ambient temperature for locations from NSRDB; Tpower derate factor = −0.29% per 1 °C rise from Ttest.
This is particularly useful for colder temperatures, as the power deration factor decreases the PV panels’ efficiency for hotter days with higher-than-STC temperatures. Thus, on a winter sunny (good irradiation) day, the PV farm’s output is improved compared to a hot summer day, where losses due to heat lower the PV farm’s output.

4.2.3. Optimum Tilt Angle Calculations

Optimum tilt angle is calculated in order to maximize the PV farm’s output. For this purpose, we incorporated the direct normal beam, sky-diffused, and ground-reflected components of solar irradiation into our model as well. The incident irradiation on the tilted plane of array (POA) of a PV panel is mathematically given as:
IPOA = I beam-direct + I sky-diffused + I ground-reflected
Equations (7)–(14) below describe the process for determining each of these components and the optimum tilt of PV panels. The major component of the solar irradiation is the direct-beam normal component (I beam-direct), which is given as:
I beam-direct = DNI × cos θ
The DNI value is obtained from the NSRDB pyrometer measurement and cos θ is evaluated from Equation (8) [9] as:
cos θ = sin δ × sin ϕ × cos βsin δ × cos ϕ × sin β × cos ψ + cos δ × cos ϕ × cos β × cos ђ + cos δ × sin ϕ × sin β × cos ψ × cos ђ + cos δ × sin ψ × sin ℏ × sin β
where:
δ => declination angle, evaluated from (9);
ϕ => latitude of desired farm location—in this case, ϕ = 32.673° and 35.899°;
Ψ => panel azimuth angle = 0°; since in the Northern Hemisphere, PV panels are orientated true south assumed to be 0° facing directly towards the Equator;
β => panel tilt daily values evaluated from (10);
Ђ => hour angle; evaluated from (11)–(13).
The declination angle (δ) and panel tilt angle (β) are given as:
δ = 23.45° × sin ((360/365) × (day − 81))
β = 90 − α where elevation angle α = 90 − ϕ + δ
The solar hour angle (HRA or Ђ) is evaluated as follows:
Equation of time (EoT) = 9.87 × sin {2 × (360/365) × (day − 81)} − 7.53 × cos {(360/365) × (day − 81)} − 1.5 × sin {(360/365) × (day − 81)}
Time Correction Factor (TC) = 4 × (LongitudeLocal Standard Time Meridian) + EoT
Hour Angle (ħ) = 15° × (Time Local + (TC/60) − 12)
Equations (8)–(13) were adapted from our previous work outlined in [9]. The other components of solar irradiation, as listed in Equation (6), are sky-diffuse and ground-reflected irradiation. The simple Sandia sky diffuse model [70] was adopted for calculating the I sky-diffuse component. The sky dome for diffused irradiation encompasses the isotropic component representing the uniform irradiance, the circumsolar component representing the forward scattering around the sun, and horizon brightening components [70]. An empirical model from Sandia Labs is listed in Equation (14) [70].
Isky-diffused = DHI × ((1 + cos β)/2) + GHI × ((0.012 ζ − 0.04) × (1 − cos β)/2)
where ζ => the sun’s zenith angle, evaluated from ζ = ϕ − δ
DHI and GHI are diffused horizontal and global horizontal measured irradiation. The first term in Equation (14) is a simple isotropic sky diffuse model, and the second term is an empirical correction to account for circumsolar and horizon brightening. To calculate the ground-reflected component, the albedo coefficient is used as 0.26 for fresh grass from reference [70] and is calculated in Equation (15) as:
Iground-reflected = GHI × albedo × (1 − cos β)/2
As expressed in Equations (6)–(15), the tilt angles for both the solar farms were calculated. We divided the annual tilt data into three seasons each spanning four months each to accommodate the seasonal variations in our irradiation profiles. The average tilt of every season (4 month-average) was used as a reference to plot the initial tilted irradiation profile. The power output based on this tilt value was then calculated. However, it was observed that with the averaged initial tilt reference, the worst irradiation profile (low power output sunshine days) usually occurred in the month of December for PV Farm #1 and January for PV Farm #2 (based on the past 15 years’ historical data). These low irradiance and heavy cloud-cover days need better-optimized tilt angles. The tilt values were thereby adjusted to be closer to December and January. This improved the PV farms’ overall generation profiles for cold winter seasons but resulted in lower late summer values. The updated optimum tilts at PV Farms #1 and #2 for spring, summer, and winter seasons were 53°, 15°, and 40° and 53°, 17°, and 48° respectively.
For farm BESS generation, the battery model and sizing steps were incorporated from [9]. The thresholds for maximum and minimum state of charge (SOC) permissible were set to 90% and 20% of total battery capacity, respectively, to ensure longevity of BESS operation. The BESS acts as an independent power source to meet the nighttime (apart from sun-hours) EV charging load. The battery sizing model incorporates 8–10% round-trip cycling efficiency loss, as stated in the datasheet [71], and other conversion losses, as indicated in Appendix B. Due to grid-independent operation, the BESS completes at least one complete charge-discharge cycle daily. Thus, the sitting losses are minimized and negligible in the 1-year EV load operation scenario, as compared to other conversion losses. An oversized BESS capacity was determined that ensures zero load deficit days for the entire annual period of operation. The other BESS parameters were incorporated from the Tesla Megapack battery specifications, as indicated in reference [71].

5. Evaluation of System Losses for Various Test Cases

DC power networks have the ability to satisfy an EV’s charging demand with 100% PV utilization without violating the physical limits of its components or losing system stability. Improve transmission efficiency, no skin-effect losses, reduced right of way (ROW), avoidance of unnecessary frequency and reactive power synchronization, and ease of power-flow control are some characteristics that bolster an end-to-end DC power network. For this purpose, the following section evaluates three different use cases for DC power networks—viz., local LVDC, and distant MVDC and/or HVDC. The cumulative DC power-flow equations and losses are calculated.
The total system losses as a function of time in different DC power networks can be summarized in Equation (16).
Ploss-net (t) = Ploss-line (t) + Ploss-conv (t) + Ploss-load (t) + Ploss-source (t)
The line losses (Ploss-line (t)) account for the ohmic transmission and distribution losses and are dependent on resistance per unit distance and type of cables, ambient temperature, amperage, etc. The DC-DC conversion losses (Ploss-conv (t)), along with the EV charger load loss (Ploss-load (t)), is also included in the design. The power generating source—either PV or BESS—would also incur some losses. These include the shading and soling; wiring and mismatch loss; and light degradation loss for PV farms. The charging/discharging loss and idle sitting losses comprise the BESS’s losses. A modular DC coupled system with MPPT control and DC optimizers can minimize the PV source losses and reduce the BESS charging/discharging losses. Additionally, by optimally sizing the PV-BESS system, the sitting losses are minimized. The source losses are ignored in our model, as we have oversized the PV farm for the worst cloudy days.

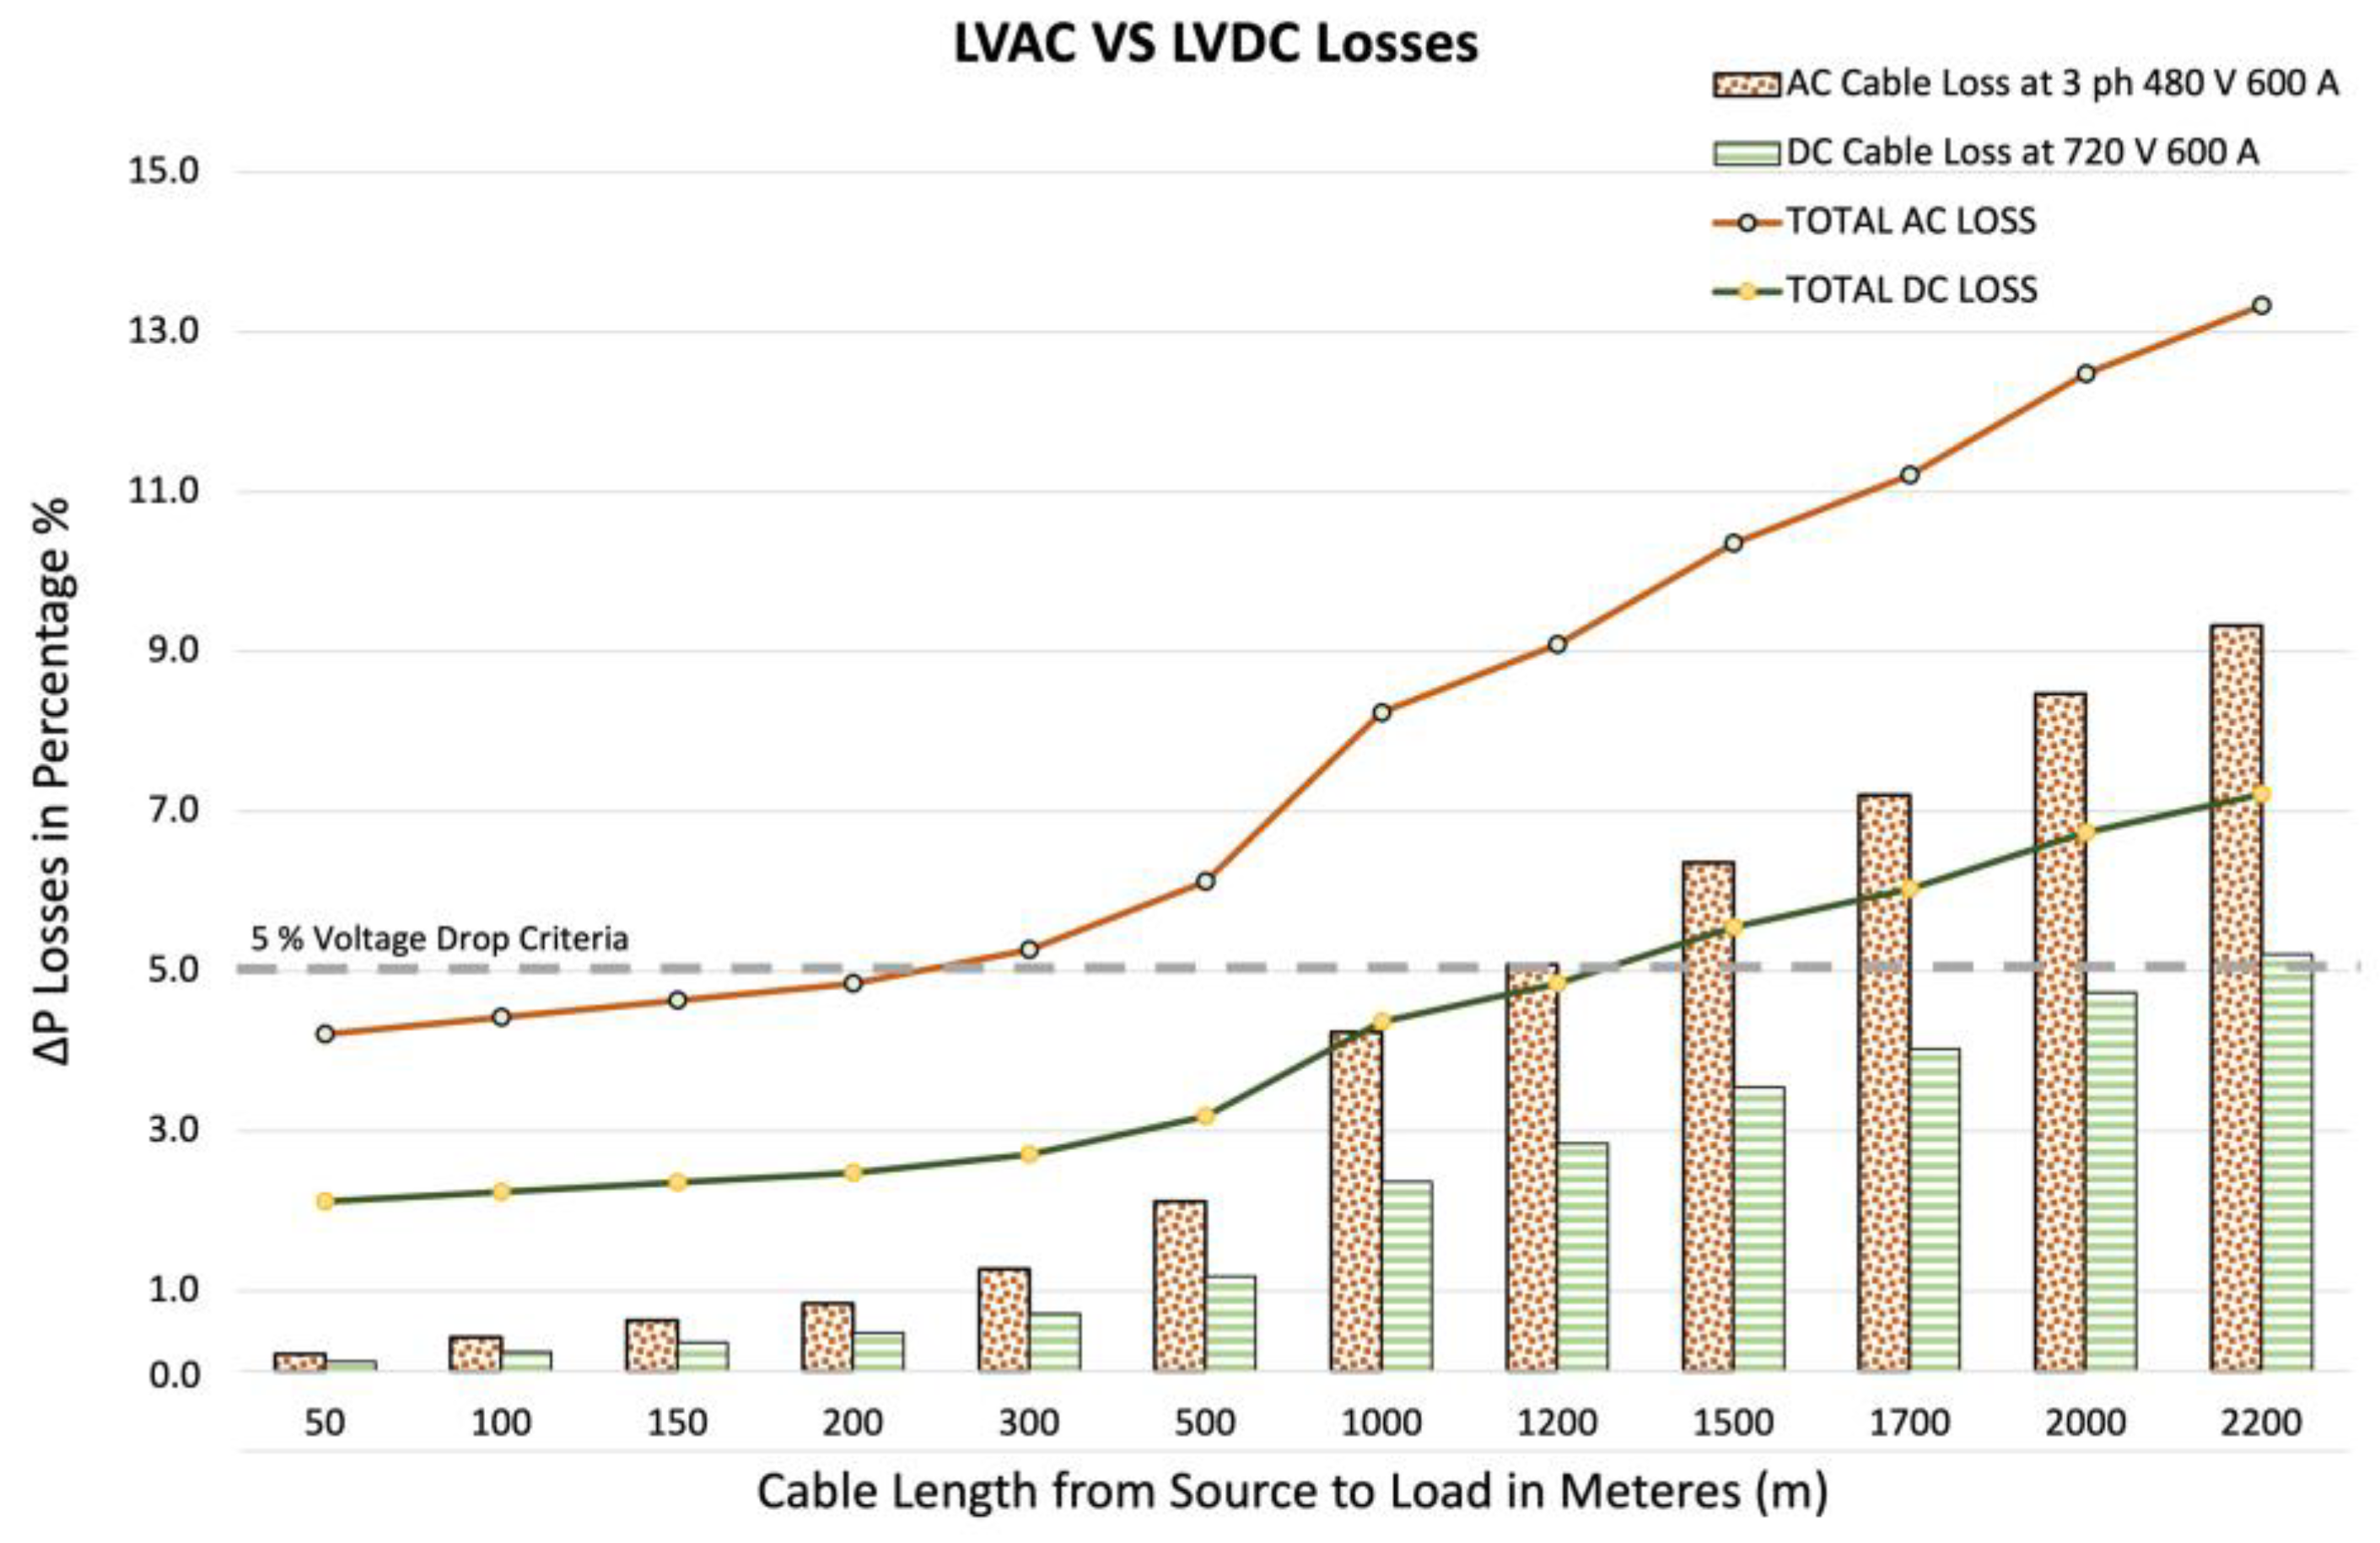
5.1. Case 1: Local LVAC Power Network vs. LVDC Power Network

As already mentioned, local LVDC networks based on Thomas Edison’s original concept should be incorporated in the design wherever possible. This case assumes that the PV farm is located in the close vicinity of the EV charging stations. The PV farm and BESS are connected to FCS load centers via LVAC/LVDC cables. The internal on-site wiring of charging stations with different charging points is also LVAC/LVDC. A cumulative loss comparison between LVAC and LVDC network was evaluated. The designed maximum hourly load profile for Type #1 FCS is 15.027 MW with a per hour average of 3.66 MW. For an LVAC/LVDC connection to transmit such high power flow is not a feasible solution, and MV interconnections are needed. However, this case was evaluated with parallel runs of conductors to increase the amperage capacity for meeting the average hourly EV charging load. For a realistic comparison between the AC/DC networks, we assumed the same cables were used for both networks to supply the same power of 0.864 MW in a single cable run. The LVAC network parameters were set as balanced: 3-Ø 480 V, 600 A. The 3-core polyethylene (XLPE) Type XHHW-2 cables are considered in the design. The detailed cable specifications are included in Appendix C. For delivering the same power, the LVDC network would need to operate on 720 Vdc, assuming a unipolar DC network. This substantial increase in the DC voltage from 3-Ø 480 Vac is justified because the cables are rated to withstand a maximum of 600 V (RMS) line to line voltage, which corresponds to 849 Vdc (=600 Vrms × √2). The chosen value of 720 Vdc is slightly above the peak cable rating of 680 Vp, but well within the maximum permissible cable limits. For the bipolar DC case, where two cores are utilized, the voltage rating of ±360 Vdc is assumed. Initially, the LVDC network ratings are designed to match the PV farm voltage of 1500 V, as already established DC power-protection and regulation schemes exist at this voltage. However, this voltage is later adjusted to match the cable specifications. In an ideal LVDC case, 1–1.5 kV PV-farm generation would sustain through rated cable specifications and charge EV powertrains of 800 V–1 kV or higher with minimum conversion losses. The DC-DC converter losses and dual AC/DC inverter-rectifier pair losses are also incorporated in the total system loss numbers. In AC networks, two conversion losses take place, viz., at the DC PV-farm and at the DC EV charging stations. These loss numbers are listed in Appendix B. The voltage deviation with respect to varying cable length was calculated for both types of networks. The cumulative line and power losses were calculated based on Equations (17)–(20) [72,73].
P3-ØAC = 3 × Vrms × Irms × cos ϕ
PDC = 2 × Vdc × Idc
VdropAC = (3 × Irms × Rac × L)/P OR VdropDC = (2 × Irms × Rdc × L)/P
where P3-ØAC and PDC are total power delivered to load in LVAC and LVDC networks; cos ϕ is a power factor that is assumed to be 1 for DC EV charging load; Vrms, Irms, Vdc, and Idc are voltages and currents in AC and DC grids, respectively; Vdrop is the voltage drop in a cable of length L with P parallel conductors; and Rac and Rdc are AC and DC cable resistance, respectively. The skin effect and proximity losses are also considered while calculating the AC resistance (Rac) values. A comparative graph for varying cable distances in the existing LVAC practices vs. proposed LVDC network topology is shown as Figure 9. As is evident in the graph, LVDC network cables account for a nearly 54% increase in the distance of power transmission while adhering to the nominal 5% voltage drop. The large diameter of the cables considered in this design allows 600 Amps and a cable length of up to 1200 m for AC voltages while maintaining a 5% voltage drop without any reactive support. LVDC cables of up to 2200 m can easily be utilized to meet the voltage-drop criteria while transmitting the same 600 Amps of current. For limiting the power losses to a 5% margin, the total power-loss numbers for LVDC clearly indicate up to 400% improvement in distance as compared to LVAC networks. Using a bipolar DC configuration, the same conductors can carry nearly 2/3 more power, thereby also increasing the power-carrying capacity. This reiterates the fact that LVDC networks have better power-carrying capacity, can transmit similar power over significantly longer distances, and have reduced losses as compared to LVAC networks.

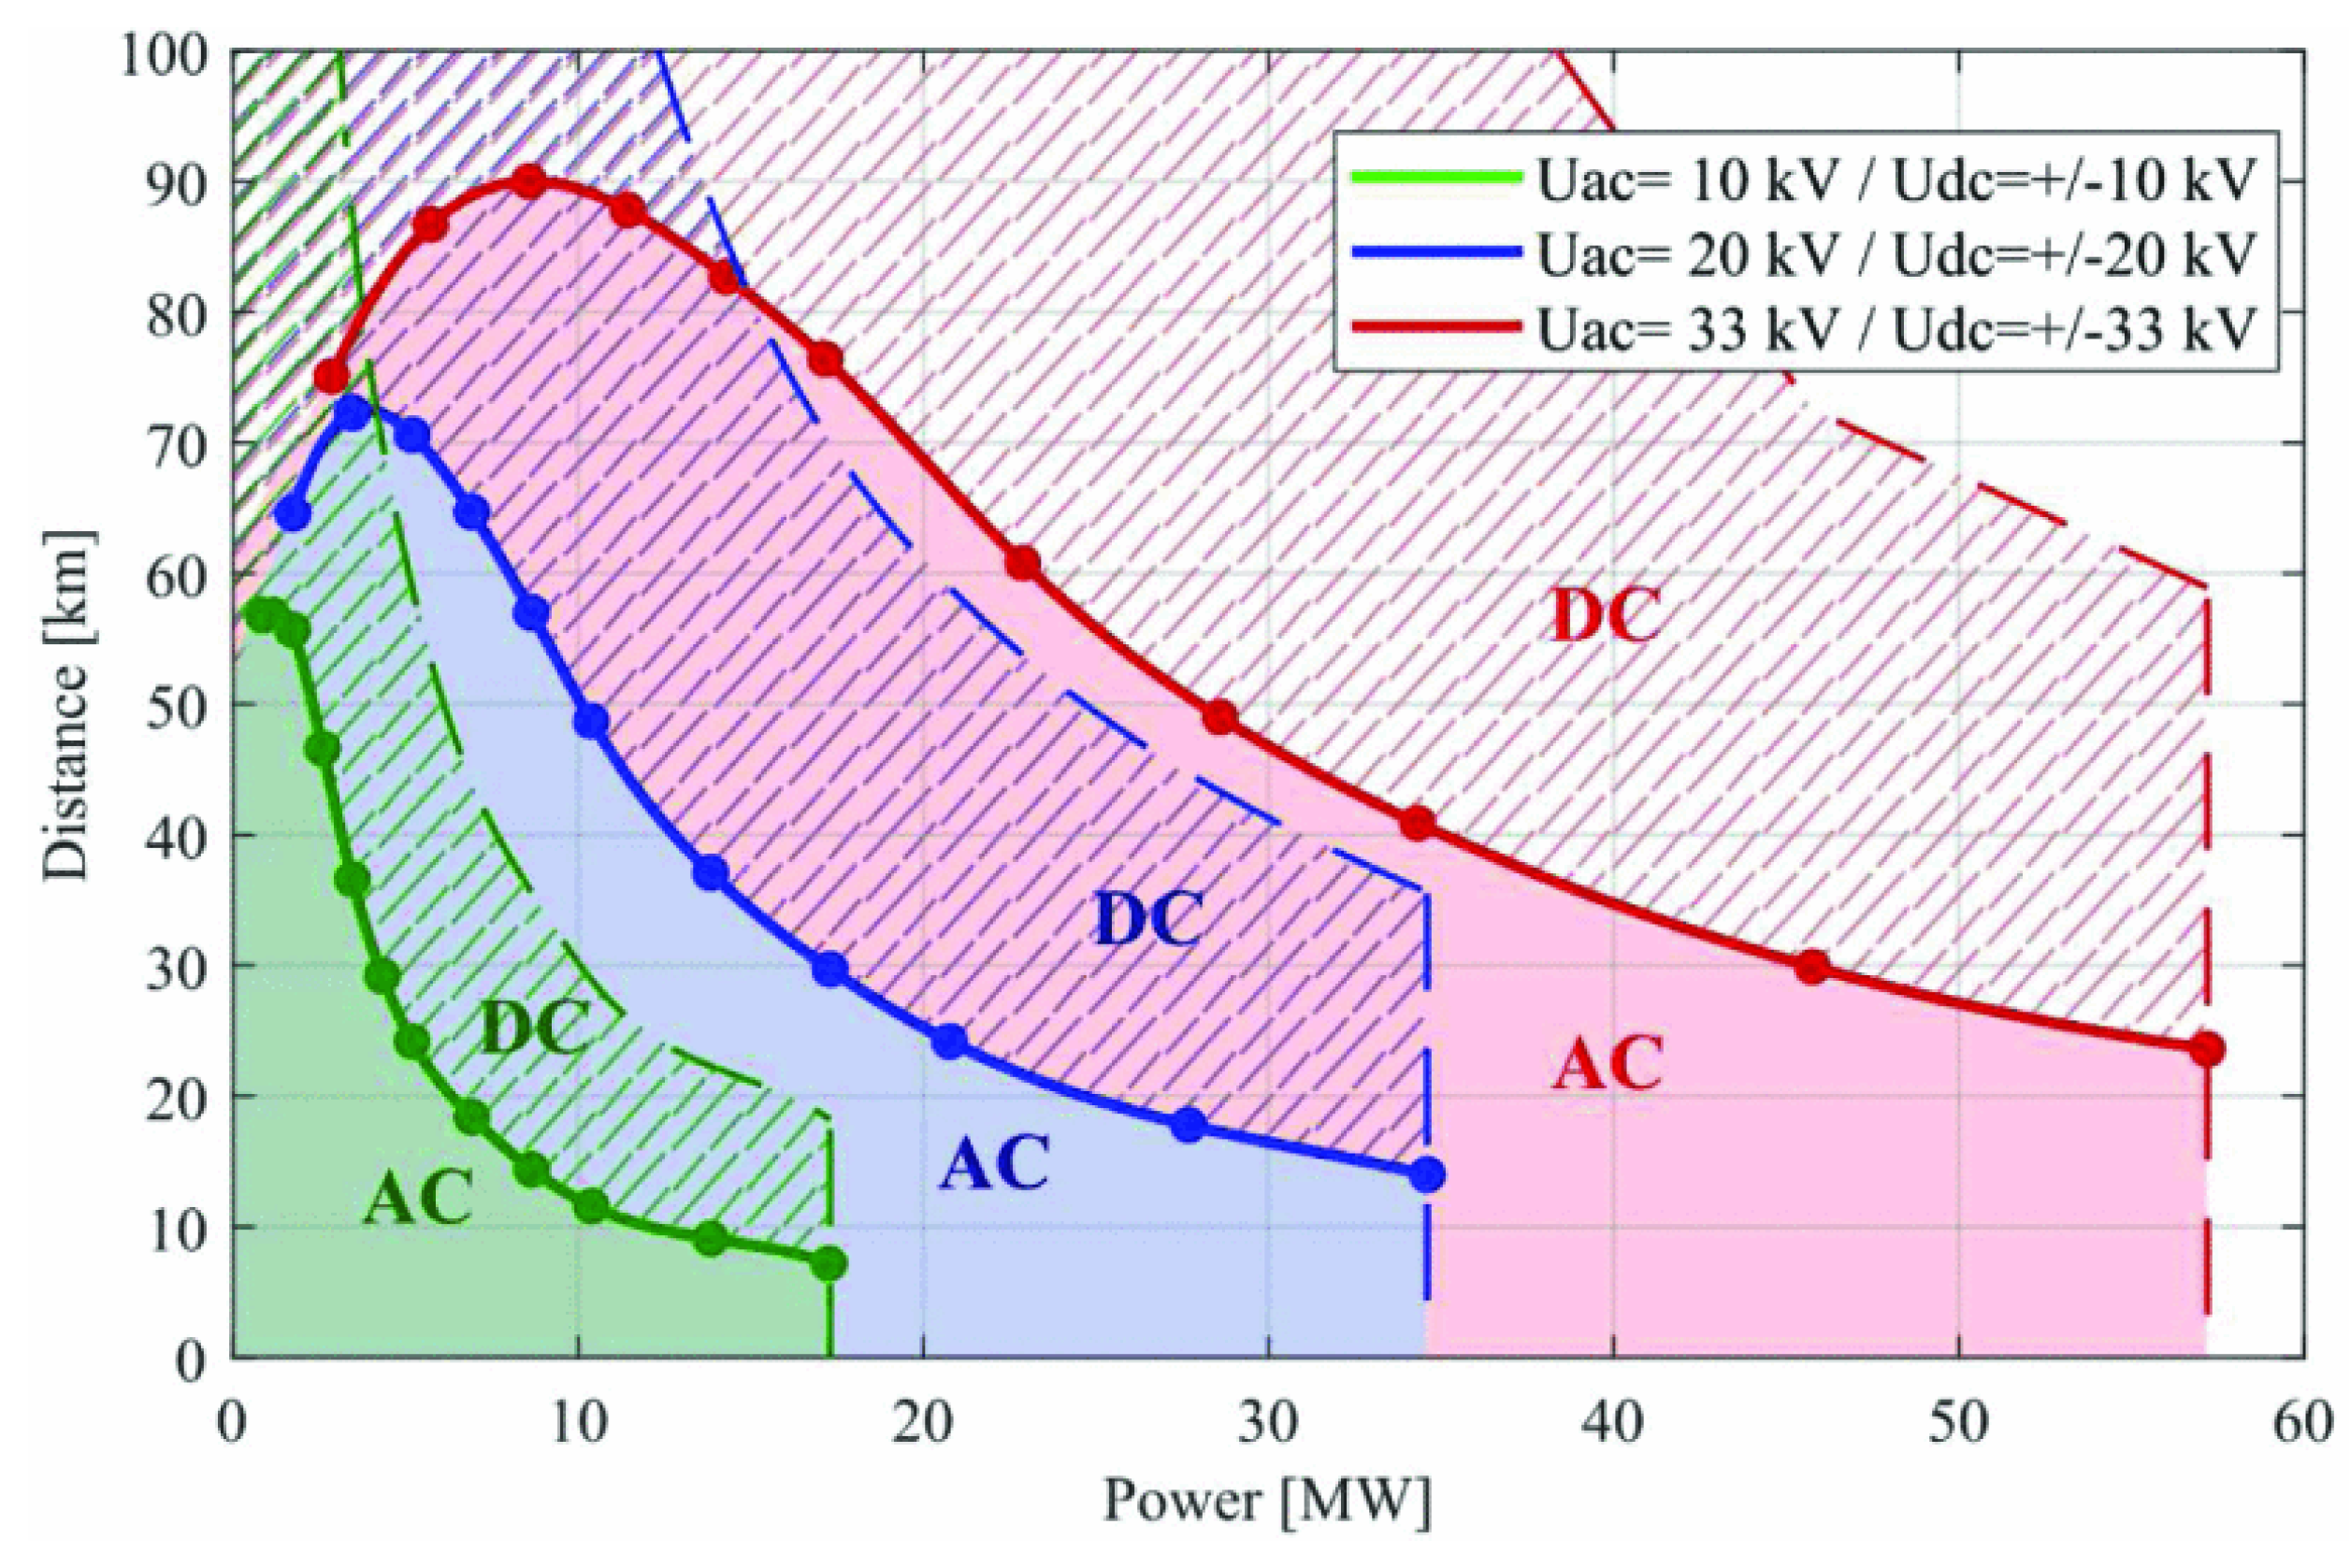
5.2. Case 2: MVAC Distribution Network vs. MVDC Distribution Network

MV-level power networks are a more feasible approach while integrating the MW-level FCS load profiles. Recent advances in HVDC networks have led to advancements in DC-DC converter topology, which have in-turn also supported MVDC networks. However, for larger distances, HVDC is already an undebatable option from an efficiency viewpoint. MV and LVDC power networks with relevant proliferation in the field have yet to emerge. Several MVDC test projects are already operational, such as Angle-DC link in UK [74], the Suzhou Industrial Park Pilot Project [75], the Guizhou University Demonstration Project [76], and many more. The Electrification of Railway corridors in Europe is also based on an MVDC grid for reducing losses [77]. However, most of the control efforts are directed towards easy integration of MVDC systems into an existing AC system. For DC generation and dynamic load peaks of charging EVs, these conversions should be pushed to HV levels for minimal losses, ultimately culminating into a complete end-to-end DC network.
A detailed study by the CIGRE Working Committee in reference [78] highlights the benefits of MVDC networks and available converter design. The different types of MVDC distribution topologies studied are point-to-point, radial, ring-shaped, and meshed. A radial network is the most common urban distribution topology and was thereby adopted in this work. For analysis, a radial 33 kV MV distribution network was chosen, as illustrated in Figure 10. Reference [79] highlights the MVDC operational distance with varying power levels which is typical from a PV farm. However, the authors of [79] assumed similar converter losses in terms of transformers, inverters, and DC-DC converters, which is not valid, as power electronics and smart control make it easier to have better DC-DC converter control than the traditional AC counterparts. For this reason, a similar analysis as in [79] for MV cables to calculate voltage drop and power losses was performed. The power equations described in the previous section are also valid and were used in the MV network comparison. Appendix B states various conversion-loss values for MVAC and MVDC, and Appendix C highlights the MV cables’ specifications.
The losses were evaluated by assuming nominal voltage and current ratings of ±33 kV and 2–2.5 kA, respectively. Bidirectional power flows from PV farms integrated in either the transmission or distribution network are possible. The distance for the MVDC distribution bus was fixed between 30 and 50 km (kms). As is evident in Figure 11, at distances above 50 km, the power-carrying capacity of the 33 kV MVDC is the most efficient. It can be observed that as the transmitted power capacity decreases, the DC’s potential power-transmission distance becomes longer. The capacity current in AC systems at low power and long distances degrades the efficiency noticeably [79]. Additionally, the MVAC distribution efficiency ranges from 91.6% to 94.7%, and the DC transmission efficiency ranges from 97.4% to 98.6%. These numbers were taken from the worst-case scenario of maximum daily load profile, as modelled in Section 4. The total combined maximum FCS load was 516 MW/day for the annual load profile generated. The power-flow calculations and the line loss between different buses with respect to individual loads were based on this maximum load day. A combined total value from all buses was utilized to identify power savings. The total power saved in MVAC vs. MVDC for the worst-case load is outlined at the end of the section.

5.3. Case 3: HVAC Transmission Network vs. HVDC Transmission Network

Various topologies for HVDC systems prevalent today—namely, multipolar, bipolar, back-to-back, multiterminal, etc.—either use LCC or VSC converters. The HVDC transmission topology proposed in this paper is based on point-to-point VSC converter station design but does not involve traditional AC connections. It rather involves DC networks at both ends and improved SiC power transistors and high-frequency transformer (HFT) stages. This eliminates the approach of bulky AC-DC and DC-AC converter stations needed for existing HVDC practices, and instead proposes a concept for a direct MVDC-HVDC-MVDC model. At the time of writing, the market for such a technology is non-existent. The primary focus at present is using HVDC to either replace old HVAC lines in AC, long-haul submarine transmissions, or to interconnect multiple large-area AC load networks. The focus and urge of this paper is to deploy HVDC networks for efficiently transmitting DC-generated PV and wind power from remote areas to meet newer industrial and commercial load centers. Major researchers and utilities are currently focused on developing MVDC integration into points in the traditional AC grid. However, a more efficient technique would be to push these points to higher voltage levels, thereby resulting in a complete end-to-end DC network. The HVAC transmission operating at 230 and 345 to 765 kV voltage ranges suffers from corona losses, skin-effect losses, and magnetizing induction losses. The electric-field discharge resulting in the ionization of air surrounding the HV conductor in atmospheric conditions is termed corona loss. The skin-effect losses arise due to changes in resistance of high frequency currents travelling at or near the surfaces of the cables resulting in small cross-sectional areas. The HVDC power cables are not severely impacted by these losses as their HVAC counterparts. The HVAC network’s power losses are summarized in the equations below [80]:
Ploss corona = 242.2 f + 25 δ r d ( V V c ) 2 10 5 kW / km / phase
Ploss skin - depth = 1 2 I 2 R A C   where R A C = ( 1 + Δ s + Δ p ) R D C and R DC = ρ L D Δ s   and   Δ s = 2 ρ ω μ o μ r
where f is frequency in Hz, V is the phase-neutral voltage (RMS), Vc is disruptive voltage (RMS) per phase, r is the radius, d is the distance between conductors, and δ is the air-density factor, which is assumed to be one in ideal conditions. In Equation (21), Δ s and Δ p are skin effect and proximity coefficients, ρ is conductor resistivity, ω is the angular frequency (ω = 2π × f), and µ = µ0µr is the magnetic permeability.
Since HVDC systems have no frequency component, the corona loss is almost three times lower than in HVAC systems, and the skin-effect losses do not exist. The efficiency of HVAC power networks is estimated to be around 92–94%, and that of traditional HVDC networks is around 93–97% [81,82,83]. The majority of these HVDC losses arise due to converter stations and account for up to 70% to 80% at both ends for various power-carrying capacities and distances [82]. As power electronics and SST technologies improve and newer DC-DC converter station designs (as proposed in Figure 5) are developed, the HVDC losses can be further minimized.
Table 5 below summarizes the findings for loss numbers for different DC networks and compares them with their respective AC counterparts. The power savings were calculated based on the total deliverable power saved in the DC case with respect to the traditional business-as-usual (BAU) AC case. The evaluations for the power loss incorporated different peak hourly loads based on three different charging types and various distances of EV load centers from PV-farm generation. Various system-level loss numbers are included in Appendix B.
Based on the comparative loss analysis, the DC networks clearly outperform the AC grid. The total system-level power savings of about 17% for MV networks and 25% for the HV network was achieved with the end-to-end DC case as compared to the BAU traditional AC transmission and distribution networks. To efficiently manage the forthcoming MW-level fast charging station demand, a complete DC based network is the only possible energy-saving solution.

6. Conclusions

In addition to the blackouts caused by weather-related issues, the power industry is facing challenges to meet the demand of increasing loads due to the electrification of transportation. As demonstrated in the paper, integrating the MW-scale fast charging station’s load with the traditional AC power grid requires costly upgrades and policy reforms. Due to the increased renewable energy penetration, the aging AC transmission and distribution grids are already operating near stability boundaries and cannot sustain the newly added EV load centers. For this reason, a complete out-of-the-box solution based on end-to-end DC network is proposed in this paper. The designed novel architecture based on HVDC grid, as its backbone, interconnects remote PV farms with densely populated EV charging load centers. Wherever possible, the local low-voltage DC networks are employed for minimal losses. If a local DC is not a feasible option, then the MVDC distribution and long-haul HVDC power transmission are employed. A thorough power-saving analysis of all these three cases was carried out in the paper.
First, a realistic EV-load model was generated based on the user statistics observed at the existing gas stations (or gas refueling pumps). To ensure that our designed system replicates sporadic and diverse EV loads, three different variations in the EV charging station profiles were incorporated in the load model. For each of the synthetically generated EV charging stations, i.e., for light-duty and medium-duty passenger EVs or heavy-duty fleets, a randomized hourly variability was introduced to replicate a real-world EV load scenario. Daily time-step variability for every day of the month was also incorporated in the design. The 24 h designed system load for each type of EV charging station was extrapolated to generate the average annual load proliferation to replicate charging demands in a dense urban neighborhood. Finally, seasonal variability in the annual load model created the net charging station load demand for the system.
Then, the generated load profile was met by a grid-independent PV and battery storage (BESS) generation. The PV-farm generation was optimally sized to ensure hourly generation–load balance for the annual EV load profiles. BESSs play an important role of mitigating demand charges by supplying low-loss DC power during peak charging events. The role of BESS is crucial for our system design, as it acts as an independent power source for 16–18 h during no-sunlight periods. BESS are also responsible for managing voltage levels by providing state-of-charge regulation at different buses in the proposed DC network.
Lastly, the main findings of the paper can be summarized as the total system loss calculations for the DC power networks at low, medium, and high voltage levels. These DC system losses were then compared to traditional AC grid power losses. The mathematical evaluation resulted in about 17–25% total end-to-end power savings in our proposed DC model, as compared to the business-as-usual AC case. Nearly 15 MW of power was saved in the end-to-end DC case as compared to the AC counterpart. The comparison clearly indicates tremendous power savings and DC power benefits. DC power networks proposed in the design can utilize the same AC conductors by retrofitting. Thus, no major cabling upgrades are necessary. It was also demonstrated in the paper that by switching to DC networks, the power-carrying capacity increases fourfold. To summarize, transitioning to DC networks can reduce losses, increase the amount of power transmitted, and ensure better power savings for the newer extreme fast charging EV loads.
In conclusion, for the highest-energy-efficiency and ultra-low-cost scenario, an end-to-end DC architecture is essential for sustaining an EV fast charging station’s demand. It is imperative that under-developed and developing countries, where the AC transmission and distribution infrastructure is still in the nascent stages, should realize the advantages of green electrified transportation using the DC power networks outlined in this paper. Both for existing loads and new loads, the new electricity infrastructure should be based on low loss end-to-end HVDC transmission. Advancements in battery technology and silicon carbide-based power electronic equipment are the enablers of this concept and should be high priorities for research and development. For real-time implementation, advanced protection and optimization of infrastructure resources are future work for this study. Further research should be carried out considering techno-economical evaluations for this suggested EV charging methodology.

Author Contributions

Conceptualization, R.S. and V.P.; methodology, V.P.; software, V.P.; validation, R.S. and V.P.; formal analysis, R.S. and V.P.; resources, R.S.; data curation, V.P.; investigation, V.P. and R.S.; writing—original draft preparation, V.P.; writing—review and editing, R.S. and V.P.; supervision, R.S. All authors have read and agreed to the published version of the manuscript.

Funding

This research received no external funding.

Institutional Review Board Statement

Not applicable.

Informed Consent Statement

Not applicable.

Data Availability Statement

The data presented in this study are available on request from the corresponding author.

Acknowledgments

The authors would like to thank Prahaladh Paniyil, Electrical Engineer II at Milwaukee Tool, for contributing to the design of Figure 5 in the manuscript.

Conflicts of Interest

The authors declare no conflict of interest.

Abbreviations

LVDCLow Voltage Direct Current
MVDCMedium Voltage Direct Current
HVDCHigh Voltage Direct Current
DCFCDirect Current Fast Charging
FCSFast Charging Station
XFCExtreme Fast Charging
CPCharging Point
CSCharging Station
LEVLight-duty Electric Vehicle
MEVMedium-Duty Electric Vehicle
HEVHeavy-Duty Electric Vehicle
DNIDirect Normal Irradiation
DHIDiffused Horizontal Irradiation
GHIGlobal Horizontal Irradiation
SOCState of Charge
MPPTMaximum Power Point Tracking

Appendix A

  • The EV charging-load profiles for four different vehicle types are curves fitted in MATLAB to determine a time-varying function of charging power that is acceptable by the drivetrain.
  • The arrival frequency of EVs at the charging station is as shown in Figure A1 and based on the gas-station model’s mean [54] of arrival times. A scaled average of 1000 sessions were estimated every day with a variability factor. The seasonal variations of 30% were included in load profile, and a boxplot depicting these is shown in Figure A2.
Figure A1. Percentage distribution of EV Arrival Rates at a charging station in a day.
Batteries 09 00169 g0a1
Figure A2. Charging profile with seasonal variations with different months of the year.
Batteries 09 00169 g0a2

Appendix B

The system loss percentages for AC transmission and distribution from PV farm generation to XFC EV charging station loads are calculated as follows:
  • PV-inverter loss: Inverters either in central or string arrangements of PV panels in the farm have improved efficiencies in the range of 94–98% [84,85] for various rated loading factors. However, at utility-scale PV farms, inverter clipping losses and DC/AC ratios inhibit maximum PV utilization. To account for these losses as well, a nominal efficiency rating of 95% was assumed, as per current industry standards [85].
  • HVAC substations and pad mounted distribution transformer loss: HVAC substations’ losses of about 1–2% were utilized, according to [86]. Similarly, a 1–2% loss value was considered for a 1 MVA + dry/liquid-immersed MV distribution transformer [87]. These included the on-load core losses at 85 °C and a portion of no-load losses. The tap settings and VAR optimizers were ignored.
  • HVAC/MVAC/LVAC cable losses: The HVAC cable loss was taken from [88] and re-evaluated with respect to corona and skin-effect losses. For standard operating conditions, a transmission loss of 6–8% per 1000 km was considered in the model [88]. For MVAC and LVAC, a loss value was calculated for varying length of lines and a value of 3–7% and 2–5% is considered up to 50 km and 500 m respectively.
  • The system loss percentages for DC power networks from PV-farm generation to XFC EV charging station loads were calculated as follows:
  • DC-DC converter losses: The proposed design considers state-of-the-art DC-DC converters with efficiency ratings of 98%, as demonstrated in reference [89]. An additional 1–2% intermediate stage loss for MVDC to HVDC conversion is considered, as per reference [90]. Advanced wide-bandgap (WBG) semiconductors can further reduce these losses. However, for industrial practicality, a 2% value for MV/LV networks and a 3% value for HV networks were finalized.
  • HVDC/MVDC/LVDC cable losses: The comparable DC losses for a 500 kV HVDC transmission line are 3% per 1000 km [88]. HVDC transmission lines considering the HVDC lines can go up to 800 kV for 2.3% losses [88]. For a MVDC network, the losses are evaluated per bus for varying distances, and 2–4% is considered. Corresponding LVDC losses of around 1–3% were calculated.
  • The HVDC converter station losses of either the voltage source converter (VSC) or the traditional line commutated converter (LCC) are estimated to be around 0.7–1% per converter end [35]. Idealistically, with the implementation of WBG in VSC designs, operating power losses per converter end are assumed to be 1% for up to 500 kV. As mentioned in [82], the HVDC converter’s losses and the cable losses together constitute 5% of power losses, as compared to about 19% for the HVAC transformer and cable system’s power losses.
  • Charging-point losses: A 250 kW Tesla supercharger and 350 kW ABB Terra HP are claimed to demonstrate charging efficiencies of 96% and 94%, respectively, when tied to an AC input [91,92]. For an efficient DC-tied grid (no inverter loss), we assume this loss to be 2%. Thus, charging connector losses of 4% and 2%, respectively, for all AC and DC power networks, respectively, were assumed.

Appendix C

Different industry-grade cables were surveyed, and the cable ratings incorporated in the design are as indicated in Table A1. For the LV case, 3-core polyethylene (XLPE) type XHHW-2 cables with higher than usual conductor areas are chosen [93]. This is to incorporate a kW-level maximum EV charging-load profile with parallel cable runs. For the MV/HV case, the cable ratings of 33 and 500 kV were chosen. The MV cable selected is the standard single-core armored XLPE Stranded Copper Conductor cable [94]. The DC resistance of cables is usually rated at 20 °C. To maintain uniformity in AC and DC operations, a 90 °C resistance for DC operation was calculated as given in Equation (A1).
RDC = Ro [1 + α(TT0)]
where RDC is the nominal DC resistance at 90 °C, Ro is the nominal DC resistance at 20 °C, α is the temperature coefficient of resistivity for copper (0.00393 per °C), T is the operational temperature of the cable, and T0 is the rated 20 °C temperature value.
Table A1. Specifications for different cable parameters used in the MV/LV design [93,94].
Type of NetworkNetwork Nominal VoltageConductor SizeDC Resistance @90 °CAC Resistance @90 °CAC Reactance @90 °CRated Ampacity
LVAC LVDC600 V/1000 V1000 mm20.0140 ohm/km0.05577 ohm/km0.0820 ohm/km615 Amps @ 90 °C
MVACMVDC19/33 kV max. of 36 kV1000 mm20.018 ohm/km0.03 ohm/km0.094 ohm/km1030 Amps @ 90 °C

References

  1. Kharas, H.; Fengler, W.; Sheoraj, R.; Vashold, L.; Yankov, T. Tracking Emissions by Country and Sector. Available online: https://www.brookings.edu/blog/future-development/2022/11/29/tracking-emissions-by-country-and-sector/ (accessed on 28 January 2023).
  2. Lavelle, M. Whatever His Motives, Putin’s War in Ukraine Is Fueled by Oil and Gas. Available online: https://insideclimatenews.org/news/06032022/putin-russia-ukraine-oil-gas-petrostate/ (accessed on 28 January 2023).
  3. Vetter, D. Fossil Fuels Are ‘Weapons of Mass Destruction’ Preventing Economic Development, New Report Finds. Available online: https://www.forbes.com/sites/davidrvetter/2022/06/01/fossil-fuels-are-weapons-of-mass-destruction-preventing-economic-development-new-report-finds/ (accessed on 28 January 2023).
  4. Singh, R.; Alapatt, G.F.; Bedi, G. Why and How PV Will Provide the Cheapest Energy in the 21st Century. Facta Univ. Ser. Electron. Energetics 2014, 27, 275–298. [Google Scholar] [CrossRef]
  5. Shahan, Z. Solar and Wind Power = 71% Of New US Power in 2022 (January–July). Available online: https://cleantechnica.com/2022/09/19/solar-wind-power-71-of-new-us-power-in-2022-january-july/ (accessed on 28 January 2023).
  6. Jaganmohan, M. Global Cumulative Installed Solar PV Capacity 2000–2021. Available online: https://www.statista.com/statistics/280220/global-cumulative-installed-solar-pv-capacity/ (accessed on 28 January 2023).
  7. Global Wind Capacities Increased by 94 GW in 2021 to 837 GW. Available online: https://www.enerdata.net/publications/daily-energy-news/global-wind-capacities-increased-94-gw-2021-837-gw.html (accessed on 28 January 2023).
  8. Global Cumulative PV Capacity Exceeds 1 TW. Available online: https://taiyangnews.info/business/global-cumulative-pv-capacity-exceeds-1-tw/ (accessed on 28 January 2023).
  9. Powar, V.; Singh, R. Stand-Alone Direct Current Power Network Based on Photovoltaics and Lithium-Ion Batteries for Reverse Osmosis Desalination Plant. Energies 2021, 14, 2772. [Google Scholar] [CrossRef]
  10. Singh, R.; Paniyil, P.; Zhang, Z. Transformative role of Power Electronics: In solving climate emergency. IEEE Power Electron. Mag. 2022, 9, 39–47. [Google Scholar] [CrossRef]
  11. Battery Pack Prices Fall to an Average of $132/kWh but Rising Commodity Prices Start to Bite. Available online: https://about.bnef.com/blog/battery-pack-prices-fall-to-an-average-of-132-kwh-but-rising-commodity-prices-start-to-bite (accessed on 28 January 2023).
  12. Paniyil, P.; Singh, R.; Powar, V.; Deb, N.; Zhang, J.; Bai, K.; Dubey, A. Batteries and Free Fuel based Photovoltaics and Complimentary Wind Energy based DC Power Networks as 100% Source of Electric Power around the Globe. In Proceedings of the 2021 IEEE 48th Photovoltaic Specialists Conference (PVSC), Fort Lauderdale, FL, USA, 26 August 2021; pp. 1821–1828. [Google Scholar] [CrossRef]
  13. Masson, G. International Energy Agency- Photovoltaic Power Systems Programme Task 1. Snapshot of Global PV Markets 2022. Available online: https://iea-pvps.org/wp-content/uploads/2022/04/IEA_PVPS_Snapshot_2022-vF.pdf (accessed on 28 January 2023).
  14. Kane, M. Battery Electric vs. Hydrogen Fuel Cell: Efficiency Comparison. Available online: https://insideevs.com/news/406676/battery-electric-hydrogen-fuel-cell-efficiency-comparison/ (accessed on 28 January 2023).
  15. Shirouzu, N.; Lienert, P. Exclusive: Tesla’s Secret Batteries Aim to Rework the Math for Electric Cars and the Grid. Available online: https://www.reuters.com/article/us-autos-tesla-batteries-exclusive/exclusive-teslas-secret-batteries-aim-to-rework-the-math-for-electric-cars-and-the-grid-idUSKBN22Q1WC (accessed on 28 January 2023).
  16. Crosby, J. EVs May Shift from 400 to 800 Volt Systems By 2025—Meaning Faster Charging Speeds for Everyone. Available online: https://getjerry.com/electric-vehicles/evs-shift-400-to-800-volt-systems-by-2025-faster-charging#what-are-the-benefits-of-800-volt-systems (accessed on 28 January 2023).
  17. Dror, M.B.; Gupta, A.; Schaufuss, P. 3 challenges Enroute to Electric Vehicle Batteries Driving the Circular Economy. Available online: https://www.weforum.org/agenda/2022/12/electric-vehicle-battery-circular-economy/ (accessed on 28 January 2023).
  18. Neaimeh, M.; Salisbury, S.D.; Hill, G.A.; Blythe, P.T.; Scoffield, D.R.; Francfort, J.E. Analysing the usage and evidencing the importance of fast chargers for the adoption of battery electric vehicles. Energy Policy 2017, 108, 474–486. [Google Scholar] [CrossRef]
  19. Wolbertus, R.; Van den Hoed, R. Electric Vehicle Fast Charging Needs in Cities and along Corridors. World Electr. Veh. J. 2019, 10, 45. [Google Scholar] [CrossRef] [Green Version]
  20. Srdic, S.; Lukic, S. Toward Extreme Fast Charging: Challenges and Opportunities in Directly Connecting to Medium-Voltage Line. IEEE Electrif. Mag. 2019, 7, 22–31. [Google Scholar] [CrossRef]
  21. Dubey, A.; Santoso, S. Electric Vehicle Charging on Residential Distribution Systems: Impacts and Mitigations. IEEE Access 2015, 3, 1871–1893. [Google Scholar] [CrossRef]
  22. González, L.G.; Siavichay, E.; Espinoza, J.L. Impact of EV fast charging stations on the power distribution network of a Latin American intermediate city. Renew. Sustain. Energy Rev. 2019, 107, 309–318. [Google Scholar] [CrossRef] [Green Version]
  23. Mahfouz, M.M.; Iravani, M.R. Grid-integration of battery-enabled DC fast charging station for electric vehicles. IEEE Trans. Energy Convers. 2020, 35, 375–385. [Google Scholar] [CrossRef]
  24. Jayasekara, N.; Masoum, M.A.S.; Wolfs, P.J. Optimal Operation of Distributed Energy Storage Systems to Improve Distribution Network Load and Generation Hosting Capability. IEEE Trans. Sustain. Energy 2016, 7, 250–261. [Google Scholar] [CrossRef]
  25. Electric Highways: Accelerating and Optimizing Fast-Charging Deployment for Carbon-Free Transportation. Available online: https://www.nationalgrid.com/document/148616/download (accessed on 28 January 2023).
  26. Borlaug, B.; Muratori, M.; Gilleran, M.; Woody, D.; Muston, W.; Canada, T.; Ingram, A.; Gresham, H.; McQueen, C. Heavy-duty truck electrification and the impacts of depot charging on electricity distribution systems. Nat. Energy 2021, 6, 673–682. [Google Scholar] [CrossRef]
  27. Nelder, C.; Rogers, E. Reducing EV Charging Infrastructure Costs. Available online: https://rmi.org/ev-charging-costs (accessed on 28 January 2023).
  28. Lambert, F. Tesla’s Supercharger Cost Revealed to be Just One-Fifth of the Competition in Losing Home State Bid. Available online: https://electrek.co/2022/04/15/tesla-cost-deploy-superchargers-revealed-one-fifth-competition/ (accessed on 28 January 2023).
  29. Kampshoff, P.; Kumar, A.; Peloquin, S.; Sahdev, S. Building the Electric Vehicle Charging Infrastructure America Needs. Available online: https://www.mckinsey.com/industries/public-and-social-sector/our-insights/building-the-electric-vehicle-charging-infrastructure-america-needs (accessed on 28 January 2023).
  30. Rand, J.; Wiser, R.; Gorman, W.; Millstein, D.; Seel, J.; Jeong, S.; Robson, D. Queued up: Characteristics of Power Plants Seeking Transmission Interconnection as of the End of 2021. Lawrence Berkeley National Laboratory. Available online: https://emp.lbl.gov/sites/default/files/queued_up_2021_04-13-2022.pdf (accessed on 28 January 2023).
  31. Penrod, E. Why the Energy Transition Broke the U.S. Interconnection System. Available online: https://www.utilitydive.com/news/energy-transition-interconnection-reform-ferc-qcells/628822/ (accessed on 28 January 2023).
  32. Malik, N.S. Negative Power Prices? Blame the US Grid for Stranding Renewable Energy. Available online: https://www.bloomberg.com/news/articles/2022-08-30/trapped-renewable-energy-sends-us-power-prices-below-zero (accessed on 28 January 2023).
  33. Bolinger, M.; Seel, J.; Warner, C.; Robson, D. Utility-Scale Solar, 2022 Edition: Empirical Trends in Deployment, Technology, Cost, Performance, PP Pricing, and Value in United States. Lawrence Berkeley National Laboratory. Available online: https://escholarship.org/uc/item/7496x1pc (accessed on 28 January 2023).
  34. Singh, R.; Shenai, K. DC Microgrids and the Virtues of Local Electricity. IEEE Spectrum Online. 2014. Available online: http://spectrum.ieee.org/green-tech/buildings/dc-microgrids-and-the-virtues-of-local-electricity (accessed on 28 January 2023).
  35. Paniyil, P.; Powar, V.; Singh, R. Sustainable Intelligent Charging Infrastructure for Electrification of Transportation. Energies 2021, 14, 5258. [Google Scholar] [CrossRef]
  36. Bowen, T.; Chernyakhovskiy, I.; Denholm, P. Grid-Scale Battery Storage: Frequently Asked Questions. National Renewable Energy Laboratory. Available online: https://www.nrel.gov/docs/fy19osti/74426.pdf (accessed on 28 January 2023).
  37. McFarlane, D.; Prorok, M.; Jordan, B.; Kemabonta, T. Great Plains Institute. Analytical White Paper: Overcoming Barriers to Expanding Fast Charging Infrastructure in the Midcontinent Region. Available online: https://betterenergy.org/wp-content/uploads/2019/08/GPI_DCFC-Analysis.pdf (accessed on 28 January 2023).
  38. Reed, L.; Morgan, M.G.; Vaishnav, P.; Armanios, E.D. Converting existing transmission corridors to HVDC is an overlooked option for increasing transmission capacity. Proc. Natl. Acad. Sci. USA 2019, 116, 13879–13884. [Google Scholar] [CrossRef] [PubMed] [Green Version]
  39. Flammini, M.G.; Prettico, G.; Julea, A.; Fulli, G.; Mazza, A.; Chicco, G. Statistical characterisation of the real transaction data gathered from electric vehicle charging stations. Electr. Power Syst. Res. 2019, 166, 136–150. [Google Scholar] [CrossRef]
  40. Mies, J.J.; Helmus, J.R.; Van den Hoed, R. Estimating the charging profile of individual charge sessions of Electric Vehicles in The Netherlands. World Electr. Veh. J. 2018, 9, 17. [Google Scholar] [CrossRef] [Green Version]
  41. Hecht, C.; Das, S.; Bussar, C.; Sauer, D.U. Representative, empirical, real-world charging station usage characteristics and data in Germany. eTransportation 2020, 6, 100079. [Google Scholar] [CrossRef]
  42. Ivarsøy, E.; Torsæter, B.N.; Korpås, M. Stochastic Load Modeling of High-Power Electric Vehicle Charging—A Norwegian Case Study. In Proceedings of the 2020 International Conference on Smart Energy Systems and Technologies (SEST), Istanbul, Turkey, 7–9 September 2020; pp. 1–6. [Google Scholar] [CrossRef]
  43. Vijayenthiran, V. Nio Rolls Out 500-kw Charger, Automated Battery Swap Station. Available online: https://www.kron4.com/automotive/internet-brands/nio-rolls-out-500-kw-charger-automated-battery-swap-station/ (accessed on 28 January 2023).
  44. Introducing V3 Supercharging. Available online: https://www.tesla.com/blog/introducing-v3-supercharging (accessed on 28 January 2023).
  45. EVgo and General Motors Unveil First Fast Charging Stations from Landmark EV Charging Infrastructure Collaboration. Available online: https://www.evgo.com/press-release/evgo-general-motors-unveil-first-fast-charging-stations-from-landmark-ev-charging-infrastructure-collaboration/ (accessed on 28 January 2023).
  46. MW+ Multiport EV Charging Industry Work Group Meeting. Argonne National Laboratory. Available online: https://anl.app.box.com/s/webuku4bbbfbrbryqx62rr44fr8zrlck (accessed on 28 January 2023).
  47. California Energy Commission. New ZEV Sales in California Dashboard. Available online: https://www.energy.ca.gov/data-reports/energy-insights/zero-emission-vehicle-and-infrastructure-statistics/new-zev-sales (accessed on 28 January 2023).
  48. How Fast Does A 2021 Tesla Model 3 Charge? We Find out. Available online: https://insideevs.com/news/506520/tesla-model-3-supercharger-test/ (accessed on 28 January 2023).
  49. Porsche Tycan Fast Charging Analysis. Available online: https://insideevs.com/news/512344/porsche-taycan-fast-charging-analysis/ (accessed on 28 January 2023).
  50. Mercedes-Benz Unveils EQS Specs: Up to 478 Miles of Range on Big 108 kWh Battery Pack. Available online: https://electrek.co/2021/04/05/mercedes-benz-eqs-specs-range-battery-pack/ (accessed on 28 January 2023).
  51. Tesla Model 3 LR, vs. Hyundai Ioniq 5: Fast Charging Comparison. Available online: https://insideevs.com/news/506759/tesla-model3-hyundai-ioniq5-charging/ (accessed on 28 January 2023).
  52. Meintz, A.; Zhang, J.; Vijayagopal, R.; Kreutzer, C.; Ahmed, S.; Bloom, I.; Burnham, A.; Carlson, R.B.; Dias, F.; Dufek, E.J.; et al. Enabling fast charging–Vehicle considerations. J. Power Sources 2017, 367, 216–227. [Google Scholar] [CrossRef]
  53. Hackmann, M. Charging Index—Comparison of the Fast-Charging Capability of Electric Vehicles. Available online: https://www.p3-group.com/en/p3-charging-index-comparison-of-the-fast-charging-capability-of-various-electric-vehicles-from-a-users-perspective-update-2021/ (accessed on 28 January 2023).
  54. National Association of Convenience Stores (NACS). Consumer Behavior at the Pump. Available online: https://www.convenience.org/Topics/Fuels/Documents/How-Consumers-React-to-Gas-Prices.pdf (accessed on 28 January 2023).
  55. CharIN. CharIN’s View on Adapters within the Combined Charging System V08. Available online: https://www.charin.global/media/pages/technology/knowledge-base/d5b6b3c40a-1615552587/charins_view_on_adaptors_within_the_combined_charging_system_v08.pdf (accessed on 28 January 2023).
  56. Electric Vehicles and the Charging Infrastructure: A New Mindset? Available online: https://www.pwc.com/us/en/industries/industrial-products/library/electric-vehicles-charging-infrastructure.html (accessed on 28 January 2023).
  57. Electrifying US Long Haul Trucks will Require 504 TWh a Year. But That Won’t Be the Hardest Part. Available online: https://www.utilitydive.com/news/electrifying-us-long-haul-trucks-will-require-504-twh-a-year-but-that-won/636684/ (accessed on 28 January 2023).
  58. Tong, F.; Wolfson, D.; Jenn, A.; Scown, C.D.; Auffhammer, M. Energy consumption and charging load profiles from long-haul truck electrification in the United States. Environ. Res. Infrastruct. Sustain. 2021, 1, 025007. Available online: https://iopscience.iop.org/article/10.1088/2634-4505/ac186a (accessed on 28 January 2023). [CrossRef]
  59. Crisostomo, N. Medium and Heavy-Duty Vehicle Load Shapes. Fuels and Transportation Division, California Energy Commission. Demand Analysis Working Group Meeting. 2021. Available online: https://www.energy.ca.gov/sites/default/files/2021-09/5%20LBNL-FTD-EAD-HEVI-LOAD%20Medium-%20and%20Heavy-Duty%20Load%20Shapes_ADA.pdf (accessed on 28 January 2023).
  60. Mishra, P.; Miller, E.; Santhanagopalan, S.; Bennion, K.; Meintz, A. A Framework to Analyze the Requirements of a Multiport Megawatt-Level Charging Station for Heavy-Duty Electric Vehicles. Energies 2022, 15, 3788. [Google Scholar] [CrossRef]
  61. Zhu, X.; Mishra, P.; Mather, B.; Zhang, M.; Meintz, A. Grid Impact Analysis and Mitigation of En-Route Charging Stations for Heavy-Duty Electric Vehicles. IEEE Open Access J. Power Energy 2023, 10, 141–150. [Google Scholar] [CrossRef]
  62. Electric Trucks Could Handle Millions of Short-Haul Routes Across North America. Available online: https://www.canarymedia.com/articles/electric-vehicles/electric-trucks-could-handle-millions-of-short-haul-routes-across-north-america (accessed on 28 January 2023).
  63. Borlaug, B.; Muratori, M.; Gilleran, M.; Woody, D.; Muston, W.; Canada, T.; Ingram, A.; Gresham, H.; McQueen, C. Heavy-Duty Electric Fleet Depot Charging Load Profiles & Substation Load Integration Assessment Results. Available online: https://data.nrel.gov/submissions/162 (accessed on 13 March 2023).
  64. Moloughney, T. How Long Does It Take to Charge the Rivian R1T: We Find out. Available online: https://insideevs.com/news/586886/how-long-to-charge-rivian-r1t/ (accessed on 28 January 2023).
  65. Smirnov, A. Video: The New GMC Hummer EV Has a Very Fast Charging Speed, but Is it Fast Enough? Available online: https://tfltruck.com/2022/09/video-the-new-gmc-hummer-ev-has-a-very-fast-charging-speed-but-is-it-fast-enough/ (accessed on 28 January 2023).
  66. Avantus. Development—Industry-Leading Pipeline of Smart Power Plants. Available online: https://avantus.com/development (accessed on 28 January 2023).
  67. Notice of Preparation (NOP) of a Supplemental Environmental Impact Report (EIR or SEIR) and Scoping Meeting. Available online: https://tularecounty.ca.gov/rma/planning-building/environmental-planning/environmental-impact-reports/rexford-2-solar-farm-project-psp-22-006/notice-of-preparation-for-the-rexford-2-solar-farm-psp-22-006-project/ (accessed on 28 January 2023).
  68. NREL’s NSRDB Data Viewer. Available online: https://maps.nrel.gov/nsrdb-viewer/ (accessed on 28 January 2023).
  69. SunPower’s MAXEON 6 SPR-MAX6-475COM Solar Panel Datasheet. Available online: https://sunpower.maxeon.com/int/sites/default/files/2022-04/sp_max6_72c_com_evo2_1.5kv_dc_ds_en_a4_544409A.pdf (accessed on 28 January 2023).
  70. King, D. Simple Sandia Sky Diffuse Model. Available online: https://pvpmc.sandia.gov/modeling-steps/1-weather-design-inputs/plane-of-array-poa-irradiance/calculating-poa-irradiance/poa-sky-diffuse/simple-sandia-sky-diffuse-model/ (accessed on 28 January 2023).
  71. Tesla Megapack Datasheet. Available online: https://docs.planning.org.uk/20210319/202/QPV6H7SOJ8900/zisuxgvois9byi3q.pdf (accessed on 29 January 2023).
  72. da Silva, L.N.; Djambolakdjian, G.S.; de Andrade, B.A.; Krenn, C.S.; Hansen, L.A.; da Silva Gazzana, D.; Ferraz, R.G.; Vidor, F.F. Line Losses and Power Capacity in Low Voltage AC and DC Distribution Systems: A Numerical Comparative Study. In Proceedings of the 2021 IEEE International Conference on Environment and Electrical Engineering and 2021 IEEE Industrial and Commercial Power Systems Europe (EEEIC/I&CPS Europe), Bari, Italy, 7–10 September 2021; pp. 1–6. [Google Scholar]
  73. Eaton & Cooper Bussmann. Voltage Drop Calculations. Available online: https://www.eaton.com/content/dam/eaton/products/electrical-circuit-protection/fuses/solution-center/bus-ele-tech-lib-voltage-drop-calculations.pdf (accessed on 28 January 2023).
  74. Angle DC Fact Card. Available online: https://www.spenergynetworks.co.uk/userfiles/file/Angle-DC_Fact_Card_Visual_Version.pdf (accessed on 28 January 2023).
  75. Liang, C.; Mengmeng, J.; Qiang, H.; Xiaodong, Y.; Fei, L. Engineering Simulation Analysis and Demonstration Application of Multi-terminal DC Distribution System. In Proceedings of the 2018 International Conference on Power System Technology (POWERCON), Guangzhou, China, 6–9 November 2018; pp. 2343–2349. [Google Scholar]
  76. First Five-Terminal Flexible DC Power Distribution Demonstration Project. Available online: http://www.sgcio.com/news/zbcg/97234.html (accessed on 28 January 2023).
  77. Verdicchio, A.; Ladoux, P.; Caron, H.; Courtois, C. New Medium-Voltage DC Railway Electrification System. IEEE Trans. Transp. Electrif. 2018, 4, 591–604. [Google Scholar] [CrossRef]
  78. CIGRE-Joint Working Group (JWG) C6/B4.37. Medium Voltage DC Distribution Systems. Available online: https://www.spenergynetworks.co.uk/userfiles/file/Medium%20Voltage%20DC%20Technical%20Brochure%2C%20CIGRE.pdf (accessed on 28 January 2023).
  79. Métayer, P.L.; Paez, J.; Touré, S.; Buttay, C.; Dujic, D.; Lamard, E.; Dworakowski, P. Break-even distance for MVDC electricity networks according to power loss criteria. In Proceedings of the 23rd European Conference on Power Electronics and Applications (EPE’21 ECCE Europe), Ghent, Belgium, 6–10 September 2021; pp. 1–9. [Google Scholar] [CrossRef]
  80. AC Transmission Line Losses. Available online: http://large.stanford.edu/courses/2010/ph240/harting1/ (accessed on 28 January 2023).
  81. Worku, E. Study to Upgrade Existing HVAC Transmission line to HVDC: EPP’s Case of HV Transmission Lines. Master’s Thesis, Addis Ababa University, Addis Ababa, Ethiopia, May 2015. Available online: http://etd.aau.edu.et/bitstream/handle/123456789/6819/Ekrame%20Worku.pdf?sequence=1&isAllowed=y (accessed on 28 January 2023).
  82. May, T.W.; Yeap, Y.M.; Ukil, A. Comparative evaluation of power loss in HVAC and HVDC transmission systems. In Proceedings of the 2016 IEEE Region 10 Conference (TENCON), Singapore, 22–25 November 2016; pp. 637–641. [Google Scholar] [CrossRef]
  83. Ludin, G.A.; Nakadomari, A.; Yona, A.; Mikkili, S.; Rangarajan, S.S.; Collins, E.R.; Senjyu, T. Technical and Economic Analysis of an HVDC Transmission System for Renewable Energy Connection in Afghanistan. Sustainability 2022, 14, 1468. [Google Scholar] [CrossRef]
  84. Solar Edge. Three Phase Inverters for the 277/480V Grid for North America—Datasheet. Available online: https://www.solaredge.com/sites/default/files/se-three-phase-us-inverter-277-480V-setapp-datasheet.pdf (accessed on 29 January 2023).
  85. Aurora: Inverter Efficiency Curves. Available online: https://help.aurorasolar.com/hc/en-us/articles/115001389928-Inverter-Efficiency-Curves (accessed on 29 January 2023).
  86. Oak Ridge National Laboratory. Opportunities for Energy Efficiency Improvements in the U.S. Electricity Transmission and Distribution System. Available online: https://www.energy.gov/sites/prod/files/2015/04/f22/QER%20Analysis%20-%20Opportunities%20for%20Energy%20Efficiency%20Improvements%20in%20the%20US%20Electricity%20Transmission%20and%20Distribution%20System_0.pdf (accessed on 29 January 2023).
  87. Clark Public Utilities Technical Specifications Three-Phase Pad-mounted Transformers. Available online: https://www.clarkpublicutilities.com/wp-content/uploads/2019/01/2021-Nov-3Ph-Padmount-Transformer.pdf (accessed on 29 January 2023).
  88. K. Vaillancourt-IEA ETSAP Technology Brief E12. Electricity Transmission and Distribution. Available online: https://iea-etsap.org/E-TechDS/PDF/E12_el-t&d_KV_Apr2014_GSOK.pdf (accessed on 28 January 2023).
  89. Vicor: High Energy, High Density, DC-to-DC Converters. Available online: http://www.vicorpower.com/high-density-high-efficiency-dc-dc-converters (accessed on 29 January 2023).
  90. Agamy, M.; Harfman-Todorovic, M.; Elasser, A.; Steigerwald, R.; Sabate, J.; Chi, S.; McCann, A.; Zhang, L.; Mueller, F. A High Efficiency DC-DC Converter Topology Suitable for Distributed Large Commercial and Utility Scale PV Systems. Available online: https://www.osti.gov/servlets/purl/1059296 (accessed on 29 January 2023).
  91. Cleantechnica. Tesla Upgrading Its Supercharging Network to V3 for Next-Generation Speeds. Available online: https://cleantechnica.com/2019/03/04/tesla-upgrading-its-supercharging-network-to-v3-for-next-generation-speeds/ (accessed on 29 January 2023).
  92. ABB’s Terra High Power Gen III Charger Datasheet. Available online: https://library.e.abb.com/public/8c15c3389eff4d7da307d2d18a1b0261/9AKK107991A8620-RevB%20RevBABB_Infographic_Terra_HP_Gen%203.pdf?x-sign=eNiRxlDHs4GVTx+8APbVc6zga6syEi74JWm1oZ1CV7krF7Ewq/Z68Bda2VG8HZK1 (accessed on 29 January 2023).
  93. Southwire. Cable Ratings Datasheet for 1/C CU 1000V XLPE XHHW-2 Power Cable. Available online: http://media.industrial.southwire.com/spec/spec45000/SPEC45001.pdf (accessed on 29 January 2023).
  94. Caledonian. Medium Voltage Cable Specification. Available online: https://www.caledonian-cables.com/files/download/MV/Medium%20Voltage%20Cables.pdf (accessed on 29 January 2023).
Figure 1. Trends in photovoltaic and electric vehicle sales bolstering interdependency [13].
Batteries 09 00169 g001
Figure 2. Interconnection queues for capacity generation from different energy sources. (a) Expected yearly distribution for capacity to become online. * Also includes co-located/hybrid storage capacity for some projects. (b) Total capacity in different stages of queues as of 2021 where IA = interconnection agreement [30].
Batteries 09 00169 g002
Figure 3. Proposed end-to-end DC fast charging EV infrastructure.
Batteries 09 00169 g003
Figure 4. Role of lithium-ion-based battery energy storage systems in existing AC grid infrastructure vs. proposed DC power networks.
Batteries 09 00169 g004
Figure 5. Existing HVDC transmission systems with the AC grid vs. proposed HVDC network with high-efficiency DC-DC converters.
Batteries 09 00169 g005
Figure 7. Modelled charging load profiles for light-duty passenger EVs (LEV), medium-duty passenger EVs (MEV), and heavy-duty truck fleet EVs (HEV) for a random week in February 2029.
Batteries 09 00169 g007
Figure 8. PV farms’ irradiation profiles for different days of sunshine. (a) For the ID#2 HVDC-connected Rexford 1 and 2 farm; (b) for the ID #1 MVDC-connected Mount Signal 1, 2, 3 farm.
Batteries 09 00169 g008
Figure 9. Three-phase LVAC vs. bipolar LVDC distribution losses with respect to cable distance for maximum Type #1 charging station hourly EV load profile.
Batteries 09 00169 g009
Figure 10. Modified 5-bus radial MVDC distribution system.
Batteries 09 00169 g010
Figure 11. Losses for different MVAC and MVDC voltages, with shaded regions indicating the power and distance range, where DC transmission results in lower losses. The dotted lines represent the limits of the transmission scheme (maximal current or maximal losses) [79].
Batteries 09 00169 g011
Table 1. Summary of distribution upgrades needed for fast charging stations [26,27,28].
CategoryUpgrade NeededCause for UpgradeCost of Upgrade 1Timeline for Upgrade (Months) 1
Customer on-site150 kWDCFCUSD 75,000–100,000 per plug 33–10
250 kW 2Tesla V3 SuperchargerUSD 30,000–50,000 per plug 2,3
350 kWXFCUSD 128,000–150,000 per plug 3
MeterRequirement for
dedicated metering
USD 1200–5000
Utility on-siteDedicated Distribution transformer200+ kW load/
150–1000+ kVA
Procurement, USD 12,000–175,0003–8
Distribution feederInstall dedicated
feeder circuits
5+ MW loadUSD 2–12 million3–12
Distribution substationAdd feeder breakers5+ MW load~USD 400,0006–12
Substation upgrades3–10+ MW loadUSD 3–5 million12–18
New substation installations3–10+ MW loadUSD 4–35 million24–48
1 Cost and timeline estimates are project-specific and vary greatly. 2 Tesla V3 superchargers [28]. 3 Procurement costs from 2019 [26].
Table 2. Specifications of different types of XFC charging stations considered in the system design.
Type of Charging StationDescriptionRated Specifications for Each ChargerNo. of CP’sTotal Power DemandUtilization RateRef.
Type #1XFC based on Tesla’s V3 Superchargers400 V, 625 A
250 KW
10025 MW20–30%[44]
Type #2GM & EVGo MD XFC800 V, 438 A
350 KW
5017.5 MW20–30%[45]
Type #3MW + Multi-Port Heavy-Duty chargers1500 V, 3000 A
4.5 MW
1045 MW10–50%[46]
Table 4. Specifications of PV farms incorporated in the model [66,67].
IDSolar PV Farm Geographical
Coordinates
DC Rated Max.
Capacity
Power Network Distance from FCS Site
1.Mount Signal 1, 2, and 3
Imperial County, CA, USA
32°40′24.0″ N 115°38′23.0″ W794 MWMVDC~150 km
2.Rexford 1 and 2
Tulare County, CA, USA
35°53′58.8″ N 119°03′30.1″ W700 MW + 500 MWHVDC~400 km
Table 5. Total system power savings by a DC network as compared to an AC network.
Type of Network ComparisonPV + Battery Power Generation from SourcePower Delivered to Load in Case of AC NetworkPower Delivered
to Load in Case of
DC Network
Power Savings by DC Network (in %)
LVAC vs. LVDC
(500 m)
864 kWh/h742.09 kWh/h819.76 kWh/h10.46%
MVAC vs. MVDC
(30–50 kms)
85.4 MWh/h65.758 MWh/h76.86 MWh/h16.883%
HVAC vs. HVDC
(150–500 kms)
91.4 MWh/h62.152 MWh/h77.69 MWh/h25%
Disclaimer/Publisher’s Note: The statements, opinions and data contained in all publications are solely those of the individual author(s) and contributor(s) and not of MDPI and/or the editor(s). MDPI and/or the editor(s) disclaim responsibility for any injury to people or property resulting from any ideas, methods, instructions or products referred to in the content.

