Article

A Study of Li3.8Ge0.9S0.1O4 Solid Electrolyte Stability Relative to Electrode Materials of Lithium Power Sources

by
Mariya Shchelkanova
*,
Georgiy Shekhtman
and
Svetlana Pershina
Institute of High Temperature Electrochemistry, Ural Branch, Russian Academy of Sciences, 20 Akademicheskaya St., 620990 Ekaterinburg, Russia
*
Author to whom correspondence should be addressed.
Batteries 2023, 9(2), 66; https://doi.org/10.3390/batteries9020066
Submission received: 1 November 2022 / Revised: 10 January 2023 / Accepted: 10 January 2023 / Published: 17 January 2023
(This article belongs to the Special Issue Solid-State Electrolytes for Safe Batteries)

Abstract

:
The stability of Li3.8Ge0.9S0.1O4 lithium-conducting solid electrolyte versus lithium metal and Li–V bronze Li1.3V3O8 is studied in the present research. Isothermal heat treatment and thermal analysis of the mixtures of Li1.3V3O8 and Li3.8Ge0.9S0.1O4 powders indicate that there is no interaction between them below 300–350 °C. Moreover, Li3.8Ge0.9S0.1O4 solid electrolyte is stable versus lithium at 100 °C for 240 h. A model of a lithium-ion power source with a Li1.3V3O8-based cathode and a lithium metal anode is assembled and tested. The data obtained show that Li3.8Ge0.9S0.1O4 can be used in all-solid-state medium-temperature lithium and lithium-ion batteries.

1. Introduction

High-energy Li and Li-ion powersources have established themselves among the key power sources for consumer electronics due to high values of specific energy, largest voltage, low self-discharge [1,2,3]. However, despite these advantages, the devices in question share a common drawback. The overwhelming majority of Li and Li-ion batteries nowadays use electrolytes containing organic liquids, which creates problems associated with the probable electrolyte leakage or overheating and boiling of the solvent during operation. In addition, in many cases, organic solvents are flammable, and the use of such power sources under certain conditions may result in combustion and explosion [3,4,5]. One possible way of addressing this issue is a transition to all-solid-state lithium batteries [6,7], in which both electrode materials and the electrolyte are solids. Thus, designing all-solid-sate lithium and lithium-ion power sources is among crucial tasks of solid state electrochemistry. This is confirmed by a constantly growing number of publications on this topic, e.g., [8,9].
While essentiallythe same materials can be used as electrodes in traditional lithium batteries with a liquid electrolyte and in all-solid-state power sources, designing all-solid-state power sources involves the usage of solid electrolytes that should meet certain requirements that considerably limit the number of suitable compounds [10,11,12,13]. The main requirement is a high ionic conductivity. In the case of Li and Li-ion power sources, these should have alithium–cation conductivity not less than 10−6 S∙cm−1 at ambient temperature. Moreover, the electronic conductivity should be as low as possible in order to prevent self-discharge.
Various solid electrolytes satisfying such requirements have been reported, e.g., electrolytes with a garnet-type structure [14,15,16], NASICON-like [17,18,19], perovskite [20,21], glass–ceramic Li1.6Al0.6Ge1.4(PO4)3 electrolytes [21], and also LISICON-structured phases [22]. The latter type of solid electrolytes has long been known and is well-investigated [21,23,24]. The type includes a lot of varieties, but derivatives of lithium orthosilicate and orthogermanate (Li4SiO4 and Li4GeO4, respectively) offer the highest conductivity and are, therefore, the most suitable option for all-solid-state power sources. Solid solutions of Li4SiO4–Li3PO4 system have until recently been the most common LISICON-structured solid electrolytes for Li batteries [25,26,27,28], since they have a rather high lithium–cation conductivity (about 10−6 S∙cm−1) with a satisfactory stability versus metallic Li at temperatures close to ambient [29]. However, nowadays, we also find works reporting on solid solutions based on lithium orthogermanate in a Li4GeO4–Li2SO4 system that are used as solid electrolytes for lithium power sources [30,31]. Solid solutions in a Li4GeO4–Li2SO4 system have a slightly higher conductivity than the solid electrolytes of a Li4SiO4–Li3PO4 system [32], which should compensate for the higher cost of germanium compared to silicon. In addition, when subjected to a special treatment, Li4-2xGe1−xSxO4 solid electrolytes form a glass–ceramic material offering a high lithium–cation conductivity and also formability, which makes it possible to decrease the contact resistance at the electrode–electrolyte interface [30].
In addition toa high ionic conductivity, solid electrolytes for all-solid-state batteries should be characterized by stability in contact with electrode materials during operation. The interaction of most solid electrolytes with lithium metal is the major challenge presented by lithium power sources. Since there are very few compounds thermodynamically stable versus Li, the solid electrolytes should at least possess kinetic stability at the duration and temperatures of the supposed power source operation. The work presented in [31] studies the power source with a Li3.6Ge0.8S0.2O4 solid electrolyte, lithium anode and LiNi1/3Mn1/3Co1/3O2 used as cathode; however, since in the above-mentioned work lithium was separated from the electrolyte using a polyethylene oxide film, one cannot draw conclusions about the reaction of Li3.6Ge0.8S0.2O4 with metallic lithium on the basis of the data from this paper.
Vanadium oxides and lithium vanadates, in particular, Li1+xV3O8 lithium–vanadium bronzes, are currently viewed as promising cathode materials for lithium and lithium-ion power sources [33,34,35]. Lithium–vanadium oxide LiV3O8 was previously shown not to react with Li3.4Si0.4P0.6O4 phosphate–silicate solid electrolyte below 300 °C [29]. There are no data on the chemical interaction of lithium–vanadium bronzes with Li4GeO4-based solid solutions in the available literature.
The purpose of this work is studying the stability of lithium-conducting solid electrolyte based on lithium orthogermanate of a Li4GeO4–Li2SO4 system in contact with Li metal and Li1+xV3O8 vanadium bronze.

2. Materials and Methods

2.1. Preparation of Samples

Highly conductive composition in a Li4GeO4–Li2SO4 system, containing 90 mol.% Li4GeO4 and 10 mol.% Li2SO4, which can also be written as Li3.8Ge1.9S0.1O4, was chosen as the solid electrolyte. Li2CO3 (reagent grade), GeO2 (extra pure grade) and Li2SO4 (reagent grade) obtained from VEKTON, Russia were used as the starting reagents for the preparation of the solid electrolyte. The components were dried at 300 °C, and the required amounts were weighed within the accuracy of ± 10−4 g (FX-40CJ analytical balance, Tokyo, Japan, BMI Surplus), mixed in a jasper mortar and sintered in alundum crucibles as follows: 750 °C/4 h→900 °C/8 h→1000 °C/8 h→1000 °C/8 h. After each heat treatment stage, the reaction mixture was reground and sieved to 0.1 mm mesh size. The material thus obtained was then ground to fine powder (particle size below 0.05 mm) and pressed into round tablets measuring ~ 10 mm in diameter and 1–1.5 mm height and bars~5 mm width, 6 mm thickness, 2–3 mm heightin a stainless steel die at 2–3 t/cm2. The samples were sintered on a platinum sheet for 8 h at 1080 °C, the density of the tablets thus produced was ~95% of the theoretical.
Lithium–vanadium oxide of Li1.3V3O8 composition was used as cathode material. The oxide was produced by the reaction of NH4VO3 (analytical grade)and Li2CO3 (reagent grade) taken in a 6:1.3 mole ratio in a distilled water solution and subsequent heat treatment at 400 °C for 4 h [29].

2.2. Samples Characterization

The completeness of the LiV3O8 and Li3.8Ge0.9S0.1O4 synthesis, as well as the phase composition of the samples after the tests, were controlled through X-ray powder diffraction (XRD).
Study of the chemical stability of Li3.8Ge0.9S0.1O4 in contact with the Li1.3V3O8 bronze was performed. To do this, a mixture of bronze and solid electrolyte powders was prepared in a weight ratio of 1:2. The mixture was kept for 5 h at 300 °C and then was studied by XRD. In addition, the thermal behavior of these mixtures was studied by the DSC in the range of 25–600 °C.
XRD was performed using a Rigaku DMAX-2200 diffractometer (RIGAKU, Tokyo, Japan) in filtered CuКα-radiation (λ = 1.54178 Å) 2θ = 15–70° generated at 40 kW, 30 mA in step mode with the step of 0.02° and 0.3 s counting time. The unit cell parameters were calculated using the Jade 6.5 software. The error in determining the cell parameters did not exceed 0.02%.
DSC 204 F1 Phoenix unit (NETZSCH, Germany) was used for thermal analysis. The measurement was carried out in the temperature range of 30–600 °C in Pt crucibles in air with the heating rate of 10 °C/min.The results obtained were processed using the NETZSCH Proteus software.
The Raman spectra were obtained using U-1000 microscope-spectrometer (RENISHAW, Stonehouse, UK) (Ar+-radiation, λ = 514 nm) at 100–4000 cm−1.
The morphology of the synthesized material and the shape and distribution of its particles were studied using a MIRA 3 LMU scanning electron microscope (TESCAN, Brno, Czech Republic).
The EPR spectrum of the Li1.3V3O8 bronze was recorded at room temperature on an X-band Adani CMS 8400 spectrometer.

2.3. Conductivity Measurement

Sintered round tablets were used to measure the conductivity of Li3.8Ge0.9S0.1O4 solid electrolyte and to study its stability against Li.
The total conductivity was measured using platinum electrodes painted on the both sides of the bars through vacuum evaporation. The electrical conductivity was measured by impedance spectroscopy on a P-40X potentiostat-galvanostat (Elins, Zelenograd, Russia) with FRA-24M module for electrochemical impedance measurements in the frequency range 1–500 kHz. In addition, the electronic conductivity was determined using DC with Pt electrodes at 20–40 mV. The sample with Pt electrodes was sandwiched between the silver current leads using springs, which provided good electrical contact. Stainless steel screens served to reduce thermal convective flows and contributed to better isothermality of the cell. The measuring cell was placed in a quartz tube and together with the latter in an electric furnace. The experiments involved several parallel measurements both during heating and cooling. The heating and cooling rate was 2 °C/min. The measurement temperature was controlled with a Pt-Pt/Rh thermocouple to an accuracy of ±0.5 °C. Isothermal exposure was carried out at each measurement temperature. The values of electrical conductivity obtained during cooling and heating practically coincided.
A Li│Li3.8Ge0.9S0.1O4│Li electrochemical cell was assembled to study the stability of Li3.8Ge0.9S0.1O4 against metallic Li. In the process of isothermal exposure, the electrical resistance of the cell was measured. A chemical reaction of the electrolyte and lithium is expected to change the resistance due to the formation of reaction products at the Li|electrolyte interface. The conductivity measurements were carried out by impedance spectroscopy in the AC frequency range of 1–500 kHz and galvanostatic pulse technique.
A Li|Li3.8Ge0.9S0.1O4|Li1.3V3O8 electrochemical cell was assembled to evaluate the suitability of lithium–vanadium oxide Li1.3V3O8 as a cathode of an all-solid-state battery. A layer of Li1.3V3O8 was painted on the pellet of Li3.8Ge0.9S0.1O4 solid electrolyte by rubbing it into the surface of the pellet; the coating quality was controlled using an optical microscope. The geometrical dimensions of the electrochemical cell were: height 1 mm, diameter 10 mm. The mass of the Li1.3V3O8 on the pellet surface was 0.0016 g. The electrochemical characteristics of the all-solid-state battery were determined using potentiostat–galvanostat P-40X.Impedance spectra were taken in the frequency range 1–500 kHz. Cyclic voltammetry (CV) was carried out in the range of ± 3 V from the initial potential with a scanning speed of 1mV/s. The cell charge/discharge was performed in a galvanostatic mode at a current density of 13 μA/cm2. Galvanostatic pulse technique was performed with two pairs of pulses of ±100 µA at a base value of 0 µA with time resolution of 2ms.
All experiments using lithium metal were performed in an argon atmosphere.

3. Results and Discussion

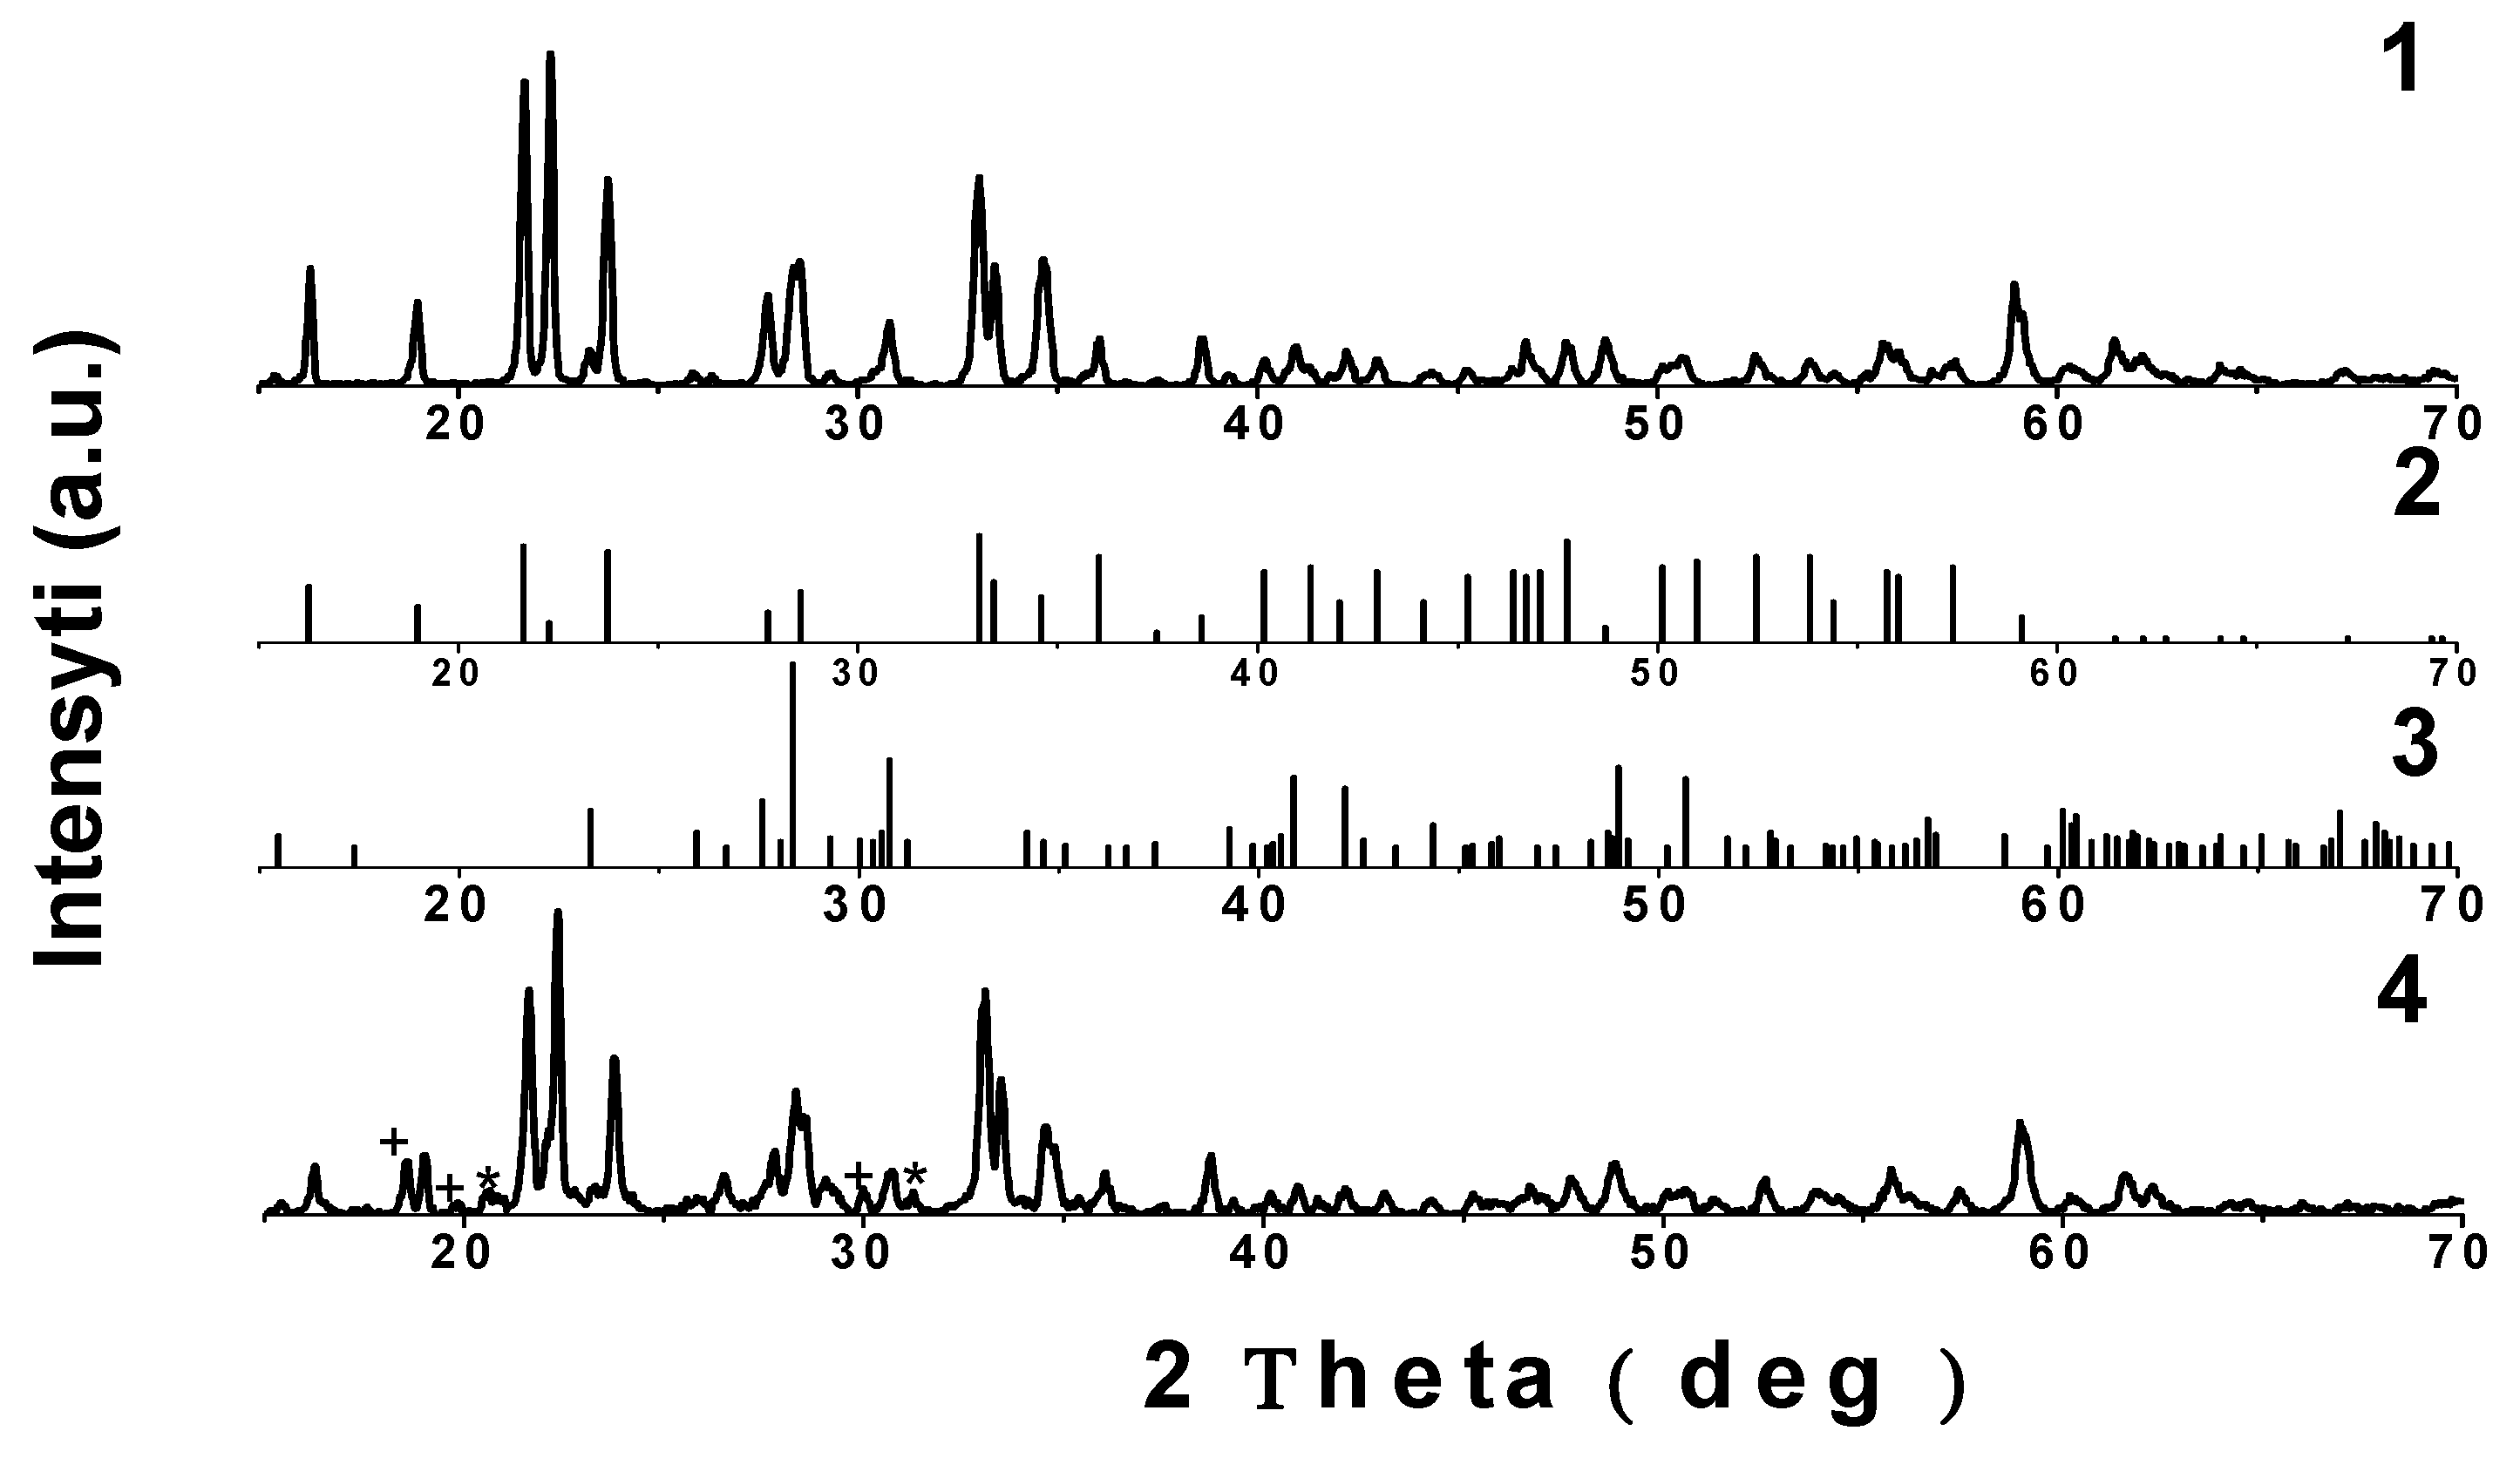
3.1. Characterization of Li3.8Ge0.9S0.1O4

The XRD pattern of Li3.8Ge0.9S0.1O4 sample is presented in Figure 1. All the diffraction peaks observed practically coincide with the reflections given in the literature for the sample close in composition, i.e., Li3.6Ge0.8S0.2O4 (PDF-2, No. 44-0337) and correspond to the orthorhombic cell, Pnma, with parameters: a = 10.7987 Å, b = 6.2221 Å, c = 5.1282 Å.
The Raman spectrum for Li3.8Ge0.9S0.1O4 correlates with the literature data [30] for this type of compounds (Figure 2). The band at 762 cm−1 and two bands at 990 and 1100 cm−1(Figure 2(1)) can be attributedto the vibrations of the isolated tetrahedra of GeO44− [36] and SO42− [37], respectively. The bands’ characteristic of Li2CO3 and other possible products of the reaction between the sample and air humidity and CO2, which are registered in the range of high wavenumbers [38], were not found on the Raman spectrum (Figure 2(2)).

3.2. Characterization of Li1.3V3O8 and Determination of V4+ Content

The XRD pattern of the lithium vanadate produced in this work corresponds to the line diagram of powder pattern for LiV3O8 standard in PDF-2 database, No. 72-1193 (Figure 3a). Li1.3V3O8 has a monoclinic cell with parameters: a = 6.68 Å, b = 3.6 Å, c = 12.03 Å, β = 107.83 °, Vol = 275.40 Å3, Z = 2 and space group P21/m (11) [39]. The microstructure of Li1.3V3O8 prepared throughsolid state reaction is shown in Figure 3b. One can see that the grain size of the resulting powder is about 100 nm.
Part of vanadium atoms in Li1.3V3O8 bronze exist in +4 oxidation state [40]; therefore, its formula can be written as Li1+x Vx4+V3−x5+O8. The electronic conductivity of the bronze depends on the ratio of vanadium in different oxidation states. The presence of uncompensated ion spins in the material can be established using electron paramagnetic resonance (EPR).
An asymmetric singlet with g||=1.94, g= 1.97 was registered on the EPR spectrum (Figure 4). Such a signal is characteristic of V4+ ions [41]. Integral intensities of both spectra were calculated in order to determine the number of paramagnetic centers. The integral intensity is proportional to the number of unpaired spins. The number of paramagnetic centers was found by comparing with the reference sample—non-aqueous CrCl3. The calculation indicated that the amount of V4+ in the Li1.3V3O8 sample is 4%. Thus, one can see that Li1.3V3O8 contains mixed-valence vanadium ions, which results in mixed electronic-ionic conductivity, which is necessary for the cathode material to operate efficiently.

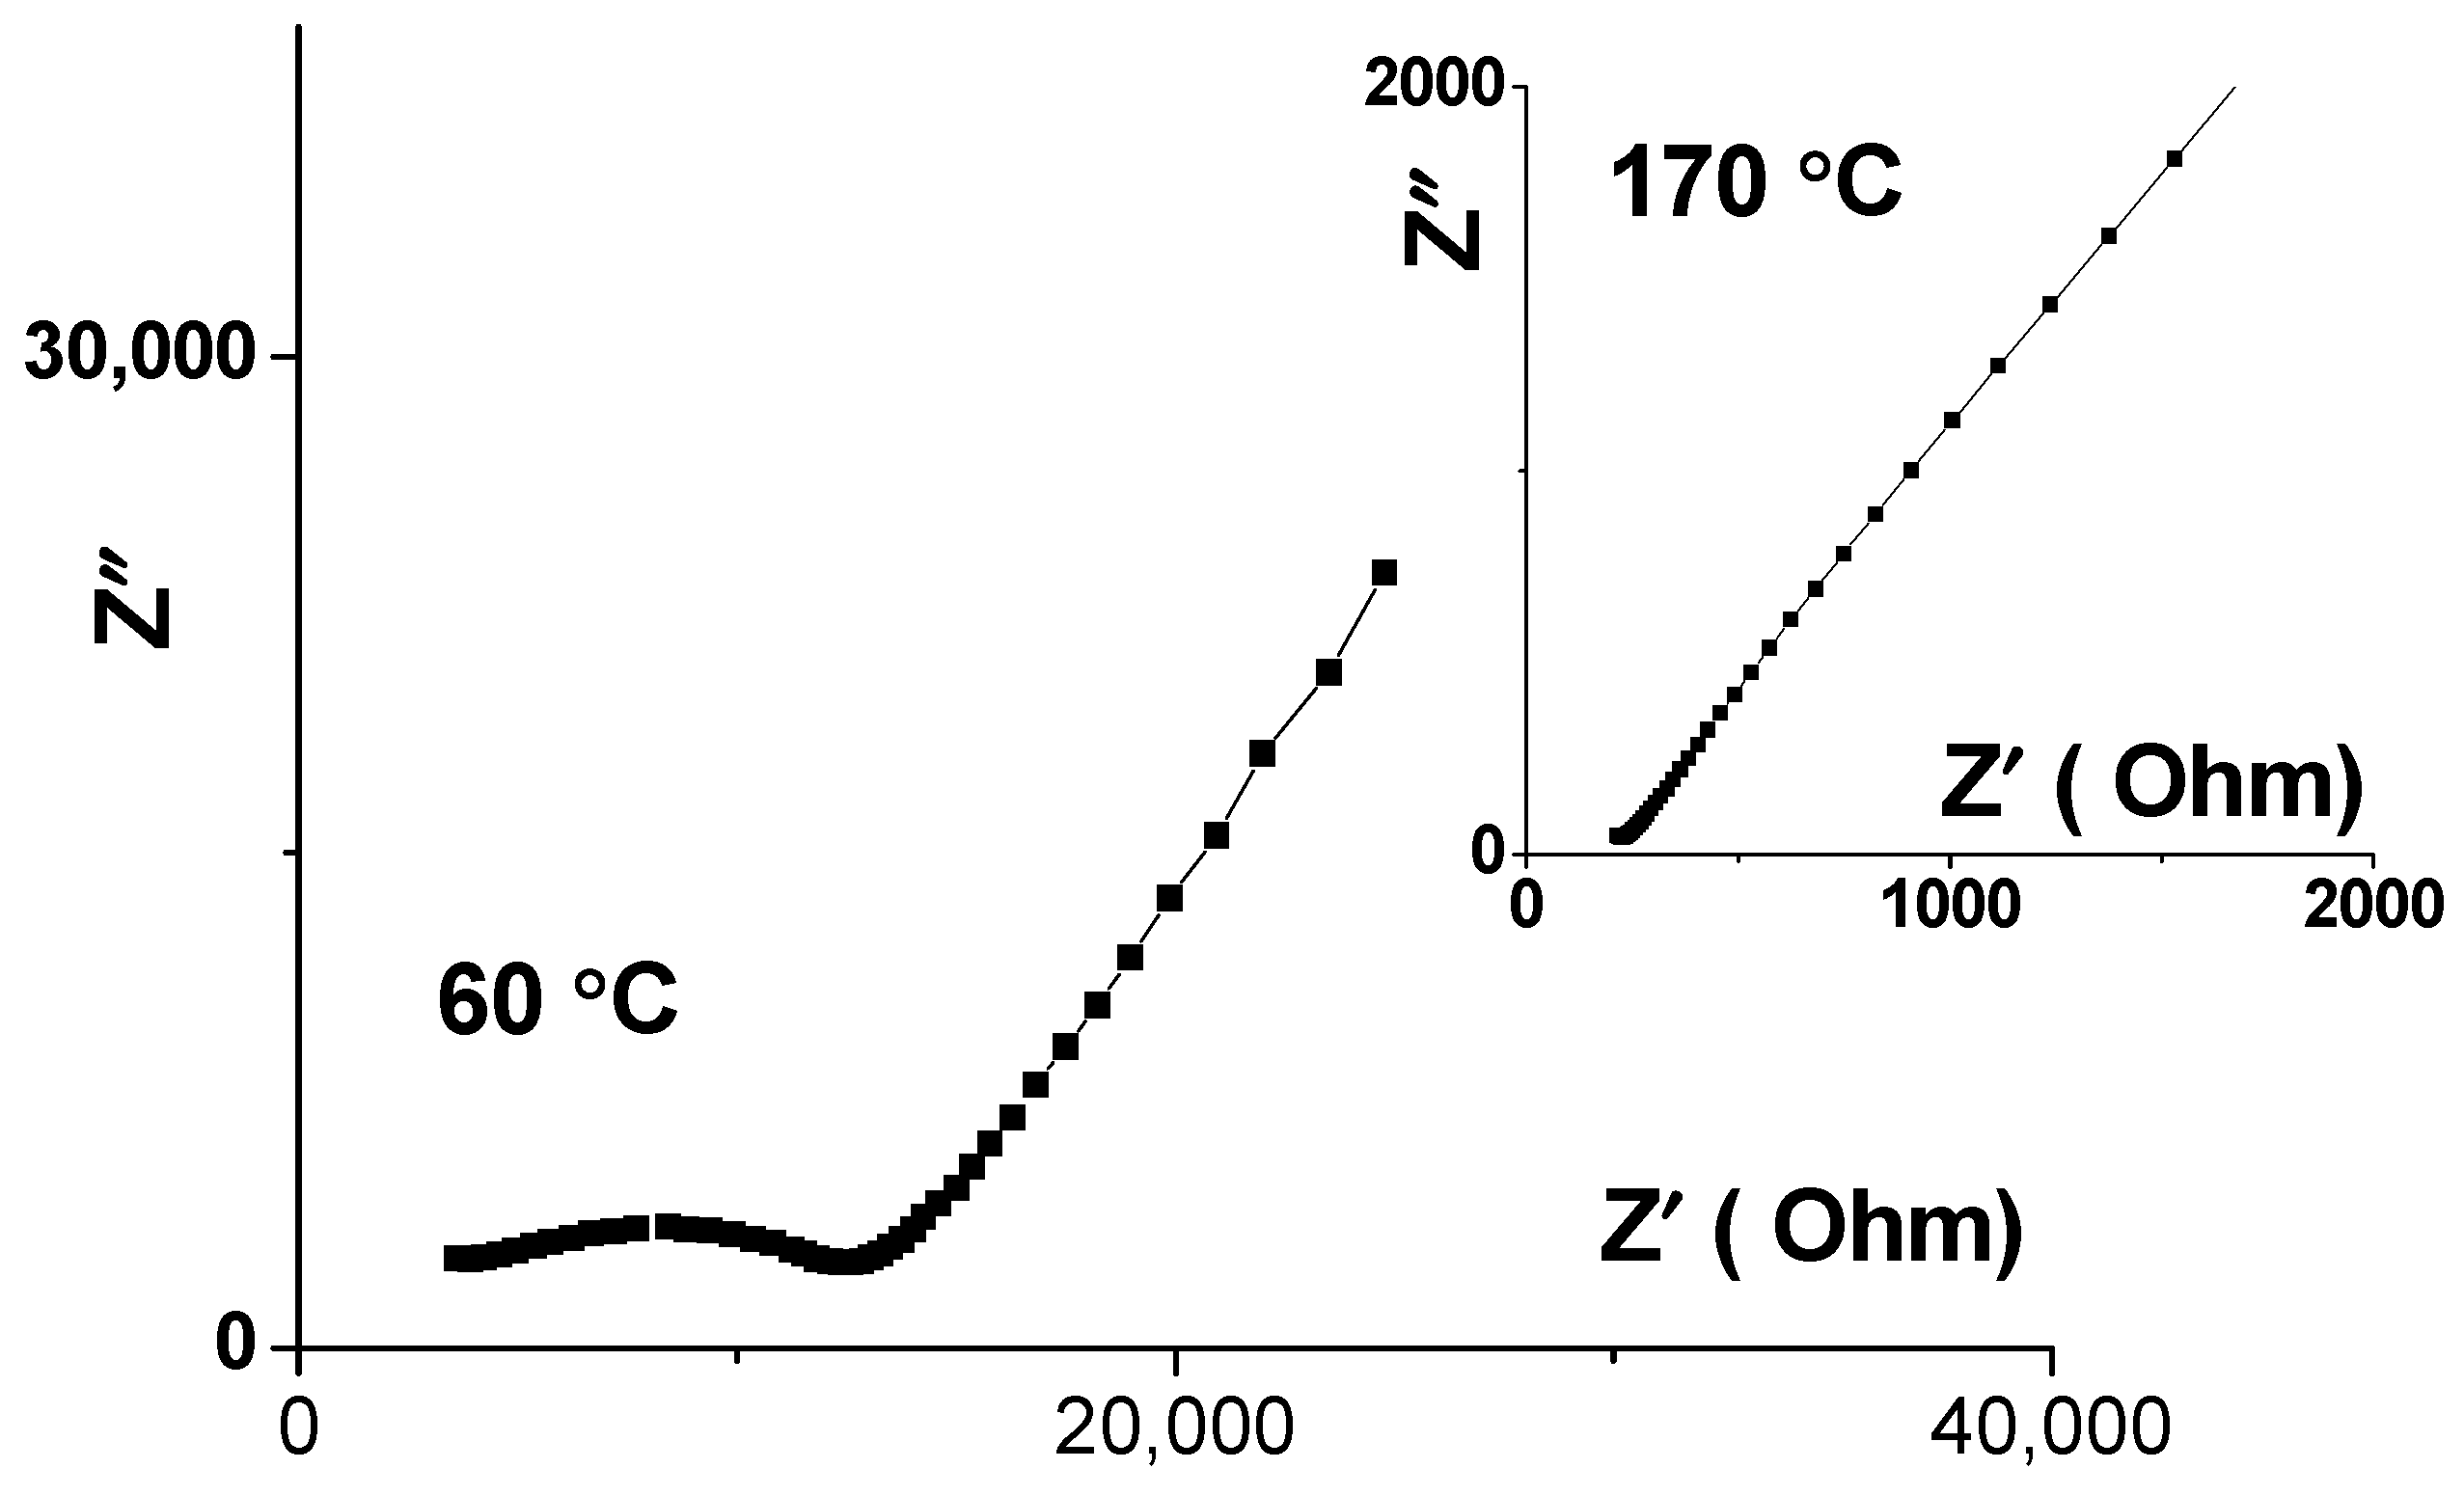
3.3. The Conductivity of Li3.8Ge0.9S0.1O4

The conductivity of Li3.8Ge0.9S0.1O4 was determined using impedance spectroscopy in the temperature range of 20–350 °C. Some of the impedance plots are shown in Figure 5. They consist of a semicircular arc with a considerably shifted center point and a low-frequency tail. The total resistance of the sample was found as the interception point of the semicircular arc and the real axis. Above 150 °C, the plots contain only the electrode tail (Figure 5, insert); in this case, the resistance was found through the extrapolation of the low-frequency tail onto the Z’axis.
The temperature dependences of electronic and total conductivity for Li3.8Ge0.9S0.1O4 are shown in Figure 6. At 25 °C, conductivity of Li3.8Ge0.9S0.1O4 is 5 × 10 −6 S/cm. Activation energy is ~50 kJ/mol. The total conductivity value is close to the one given in [32]. The electronic component of conductivity for Li3.8Ge0.9S0.1O4 was found to be less than 0.1% across the whole temperature range studied (Figure 6, curve 2).
The values of the specific electrical conductivity of Li3.8Ge0.9S0.1O4 solid electrolyte for a number of temperatures are presented in Table 1.

3.4. Stability of Li3.8Ge0.9S0.1O4in Contact with Lithium-Vanadium Oxide Li1.3V3O8

The available literature reports on the application of solid electrolytes of Li4GeO4–Li2SO4 system in all-solid-state power sources operating at ambient temperature and at elevated temperatures. Thus, in [31], it is shown that a Li│Li3,6Ge0,8S0,2O4│LiNi1/3Mn1/3Co1/3O2 power source delivers good performance at 60 °C. In view of this, a tentative study into the chemical resistance of the chosen solid electrolyte in relation to Li1.3V3O8 cathode material was undertaken.For this purpose, the thermal behavior of a mixture of Li1.3V3O8 and Li3.8Ge0.9S0.1O4 powders was analyzedwith DSC across the temperature range of 20–600 °C. No anomalies were found on the TG and DSC curves below 355 °C (Figure 7). In the range of 350–410 °C, a slight weight loss is registered on the TG curve, while the DSC curve contains a diffuse endothermic heat effect of low intensity at the same temperatures. At 530–560 °C, an intense exothermic peak can be seen on the DSC curve, while the XRD pattern for the mixture of Li1.3V3O8 and Li3.8Ge0.9S0.1O4 powders held at 560 °C for 5 h contains lines of Li3VO4 (indicated *) and Li2Ge4O9(indicated +)alongside the reflections of the solid electrolyte (Figure 8 XRD pattern 4), which indicates that Li3.8Ge0.9S0.1O4 and the bronze enter into a chemical reaction at ~530 °C. At the same time, the XRD pattern for the mixture of these materials collected after a five-hour heat treatment at 300 °C contains only the lines of Li1.3V3O8 and Li3.8Ge0.9S0.1O4 (Figure 8.XRD pattern 1).Thus, both the thermal analysis for the mixture of solid electrolyte and lithium–vanadium oxide powders, and the isothermal exposure demonstrate that no reaction of Li1.3V3O8 and Li3.8Ge0.9S0.1O4 can be observed below 300–350 °C.

3.5. Stability of Li3.8Ge0.9S0.1O4in Contact with Metallic Lithium

The interaction between Li3.8Ge0.9S0.1O4 solid electrolyte and metallic lithium was evaluated based on determining the change in the resistance of Li│Li3.8Ge0.9S0.1O4│Li symmetrical cell. The cell was held at 100 °C for 240 h. During the isothermal exposure, the cell was periodically cycled (−4 V… +4 V, 20 mV/s). Measurements of the electrical resistance of the cell performed by the pulse method as well as by the impedance spectroscopy method after isothermal exposure (Figure 9) showed that the conductivity of Li|Li3.8Ge0.9S0.1O4|Li cell did not change within the uncertainty of the experiment. After the experiment, the solid electrolyte sample was weighed and examined under the microscope. The weight and the color of the sample did not change. The results of the conductivity measurement suggest that no observable interaction between Li3.8Ge0.9S0.1O4 and metallic lithium takes place under the conditions of the experiment.

3.6. Testing the Li|Li3.8Ge0.9S0.1O4|Li1.3V3O8 Cell Model

A Li|Li3.8Ge0.9S0.1O4|Li1.3V3O8 electrochemical cell with Li anode and lithium–vanadium bronze as cathode was assembled. Lithium–vanadium oxide has good adhesion to the solid electrolyte and has high electronic conductivity; therefore, binders and additives that increase the electrical conductivity of the active mass of the cathode were not used in this work. The cell is schematically shown in Figure 10a. The height of the cell model was 1 mm and its diameter was 10 mm. As one can see from the micrograph of the fractured surface of the cell (Figure 10b), the average thickness of the cathodic layer was 25 μm. The mass of the cathodic material on the surface of the electrolyte tablet was 0.0016 g.
The resistance of the solid state cell was measured using galvanostatic pulse technique and impedance spectroscopy across the temperature range of 20–100 °C. The impedance plots presented in Figure 11. The resistance values determined from the impedance plots coincided with the values produced by the pulse method.
The Arrhenius plot for the reciprocal of the internal specific resistance of Li|Li3.8Ge0.9S0.1O4|Li1.3V3O8 cell is linear (Figure 12). However, its value is slightly lower compared to Li3.8Ge0.9S0.1O4 due to the additional contribution of the contact resistance at the electrode|solid electrolyte interface. The effective activation energy is 53 kJ/mol, which is close to the value for the solid state electrolyte (50 kJ/mol).
The voltametric study of the Li|Li3.8Ge0.9S0.1O4|Li1.3V3O8 cell was conducted across the 1.5–4.5 V potential range at the scanning rate of 1 mV/s at 100 °C. The current–voltage curve for the 3rd cycle of potential sweep is presented in Figure 13.
The cathode part of the current–voltage curves for the lithium power sources with a liquid electrolyte and Li1+xV3O8 as cathode material contains several peaks at the potential of 3.17–3.57 V. The peaks are related to the insertion of lithium cations into different sites of the LiV3O8 lattice. In our case, these peaks do not separate, which is the result of large polarization, and the I-E curve contains one broad peak with the maximum at ~3.5 V. In the anodic part of the curve, the peaks corresponding to the extraction of Li+ cations from different sites of Li1V3O8 crystal lattice do not separate either (Figure 13).
The charge and discharge cycling of the solid state cell was performed galvanostatically with a two-electrode setup at the current of ±10 μA for 2 h. Figure 14a contains charge/discharge curves of Li|Li3.8Ge0.9S0.1O4 Li1.3V3O8 cell for 40 cycles. In the 40th cycle, the charge capacity and discharge capacity were found to be 22 mAh/g and 19 mAh/g, respectively. There is no capacity loss during 40 charge/discharge cycles, and, consequently, there is no degradation of the electrode/electrolyte interface. At the temperature of 100 °C, the cell voltage is about 3.6 and 1.5 V in the charged and discharged state, respectively. The relatively low value for the capacity of the power source must be chiefly related to the high contact resistance at the electrode/electrolyte boundary and should be minimized in future experiments in order to enhance the characteristics. Moreover, 99.4 % of Coulombic efficiency was maintained after 40 cycles (Figure 14b).

4. Conclusions

Lithium–cation solid electrolyte Li3.8Ge0.9S0.1O4 with LISICON-type structure and lithium–vanadium oxide Li1.3V3O8 containing 4% vanadium ions in 4+ oxidation state have been synthesized. The stability of Li3.8Ge0.9S0.1O4 in relation to Li1.3V3O8 was studied using DSC/TG and isothermal heat treatment followed by XRD. The isothermal heat treatment and thermalanalysis of the mixture of Li1.3V3O8 and Li3.8Ge0.9S0.1O4 powders demonstrated that no reaction between them takes place below 300–350 °C. A 240-h isothermal exposure of Li│Li3.8Ge0.9S0.1O4│Li cell did not reveal any observable interaction between the solid state electrolyte and lithium. A model of a lithium-ion power source with a Li1.3V3O8-based cathode and a Li anode was assembled and tested. The all-solid-state Li|Li3.8Ge0.9S0.1O4|Li1.3V3O8 electrochemical cell is safe and relatively simple to produce. At the temperature of 100 °C, the cell voltage was found to be about 3.6 and 1.5 V in the charged and discharged state, respectively. There is no capacity loss during 40 charge/discharge cycles, and, consequently, there is no degradation of the electrode/electrolyte boundary. In the 40th cycle, the charge capacity and discharge capacity were found to be 22 mAh/g and 19 mAh/g, respectively. The relatively low value of the capacity of the power source must be chiefly related to the high contact resistance at the interface between the electrode and electrolyte, which should be minimized in future experiments in order to enhance the characteristics.
Thus, the present study confirms the promising outlook of the Li3.8Ge0.9S0.1O4 solid electrolyte and lithium–vanadium bronze Li1.3V3O8-based cathode for all-solid-state medium-temperature batteries with a Li anode.

Author Contributions

Conceptualization, M.S. and G.S.; data curation, M.S. and G.S.; formal analysis, S.P.; investigation, M.S. and S.P.; methodology, M.S. and G.S.; software, M.S. and S.P.; visualization, M.S. and S.P.; writing—original draft, M.S. and G.S.; writing—review and editing, M.S. and G.S. All authors have read and agreed to the published version of the manuscript.

Funding

This work was funded by the Russian Academy of Sciences, Ural Branch, Russia [No. 122020100210-9 (IHTE UB RAS)].

Data Availability Statement

Not applicable.

Acknowledgments

This study was performed using the equipment of the Shared Access Center Composition of Compounds, Institute of High Temperature Electrochemistry, Ural Branch, Russian Academy of Sciences, Ekaterinburg, Russian Federation.The authors are grateful to E.V. Zabolotskayafor collecting the EPR spectrum.

Conflicts of Interest

The authors declare that they have no conflict of interest.

References

  1. Zubi, G.; Dufo-Lopez, R.; Carvalho, M.; Pasaoglu, G. The lithium-ion battery: State of art and future perspectives. Renew. Sustain. Energy Rev. 2018, 89, 292–308. [Google Scholar] [CrossRef]
  2. Yang, Y.; Okonkwo, E.G.; Huang, G.; Hu, S.; Sun, W.; He, Y. On the sustainability of lithium ion battery industry—A review and perspective. Energy Storage Mater. 2020, 36, 182–212. [Google Scholar] [CrossRef]
  3. Wang, Q.; Mao, B.; Stoliarov, S.I.; Sun, J. A review of lithium ion battery failure mechanisms and fire prevention strategies. Prog. Energy Combust. Sci. 2019, 73, 95–131. [Google Scholar] [CrossRef]
  4. Luy, P.; Liu, X.; Qu, J.; Zhao, J.; Huo, Y.; Qu, Z.; Rao, Z. Recent advances on thermal safety of lithium ion battery for energy storage. Energy Storage Mater. 2020, 31, 195–220. [Google Scholar] [CrossRef]
  5. Liu, K.; Liu, Y.; Lin, D.; Pei, A.; Cui, Y. Materials for lithium ion battery safety. Sci. Adv. 2018, 4, 9820. [Google Scholar] [CrossRef] [PubMed] [Green Version]
  6. Nam, Y.J.; Oh, D.Y.; Jung, S.H.; Jung, Y.S. Towards practical all-solid-state lithium-ion batteries with high energy density and safety: Comparative study for electrodes fabricated by dry- and slurry-mixing processes. J. Power Sources 2018, 375, 93–101. [Google Scholar] [CrossRef]
  7. Ferraresi, G.; El Kazzi, M.; Czornomaz, L.; Tsai, C.-L.; Uhlenbruck, S.; Villevielle, C. Electrochemical Performance of All-Solid-State Li-Ion Batteries Based on Garnet Electrolyte Using Silicon as Model Electrode. ACS Energy. Lett. 2018, 3, 1006–1012. [Google Scholar] [CrossRef]
  8. Sun, C.; Liu, J.; Gong, J.; Wilkinson, D.P.; Zhang, J. Recent advances in all-solid-state rechargeable lithium batteries. Nano Energy. 2017, 33, 363–386. [Google Scholar] [CrossRef] [Green Version]
  9. Schnell, J.; Gunther, T.; Knoche, T.; Vieider, C.; Kohler, L.; Just, A.; Keller, M.; Passerini, S.; Reinhart, G. All-solid-state lithium-ion and lithium-meal batteries–paving the way to large-scale production. J. Power Sources 2018, 382, 160–175. [Google Scholar] [CrossRef]
  10. Kammampata, S.P.; Thangadurai, V. Cruising in ceramics–discovering new structures for all-solid-state batteries–fundamentals, materials and performances. Ionics 2018, 24, 639–660. [Google Scholar] [CrossRef]
  11. Cao, Z.; Sun, H.; Fu, L.; Ye, F.; Zhang, Y.; Luo, W.; Huang, Y. Promises, Challenges, and Recent Progress of Inorganic Solid-State Electrolytes for All-Solid-State Lithium Batteries. Adv. Mater. 2018, 30, 1705702. [Google Scholar] [CrossRef]
  12. Zheng, F.; Kotobuki, S.; Song, M.; Lai, M.O.; Lu, l. Review on solid electrolytes for all-solid-state lithium-ion batteries. J. Power Sources 2018, 389, 198–213. [Google Scholar] [CrossRef]
  13. Wu, Z.; Xie, Z.; Yoshida, A.; Wang, Z.; Xao, X.; Abudula, A.; Guan, G. Utmost limits of various solid electrolytes in all-solid-state lithium batteries: A critical review. Renew. Sustain. Energy Rev. 2019, 109, 367–385. [Google Scholar] [CrossRef]
  14. Shoji, M.; Munakata, H.; Kanamura, K. Fabrication of All-Solid-State Lithium-Ion Cells using Three-Dimensionally Structured Solid Electrolyte Li7La3Zr2O12 Pellets. Front. Energy. Res. 2016, 4, 32. [Google Scholar] [CrossRef] [Green Version]
  15. Liu, Q.; Geng, Z.; Han, C.; Fu, Y.; Li, S.; He, Y.-B.; Kang, F.; Li, B. Challenges and perspectives of garnet solid electrolytes for all-solid-state lithium batteries. J. Power Sources 2018, 389, 120–134. [Google Scholar] [CrossRef]
  16. Thangadurai, V.; Narayanan, S.; Pinzaru, D. Garnet-type solid-state fast Li ion conductors for Li batteries: Critical review. Chem. Soc. Rev. 2014, 43, 4714. [Google Scholar] [CrossRef]
  17. Feng, J.K.; Yan, B.J.; Liu, J.S.; Lai, M.O.; Li, L. All solid state lithium ion rechargeable batteries using NASICON structured electrolyte. Mater. Technol. 2013, 28, 276–279. [Google Scholar] [CrossRef]
  18. Hou, M.; Liang, F.; Chen, K.; Dai, Y.; Xue, D. Challenges and perspectives of NASICON-type solid electrolytes for all-solid-sates lithium batteries. Nanotechnology 2020, 31, 132003. [Google Scholar] [CrossRef]
  19. Anantharamulu, N.; Rao, K.K.; Rambabu, G.; Kumar, B.V.; Radha, V.; Vihal, M. A wide-ranging review on NASICON type materials. J. Mater. Sci. 2011, 46, 2821–2837. [Google Scholar] [CrossRef]
  20. Lu, J.; Li, Y. Perovskite-type Li-ion solid electrolytes: A review. J. Mater. Sci. Mater. Electron. 2021, 32, 9736–9754. [Google Scholar] [CrossRef]
  21. Cao, C.; Li, Z.-B.; Wang, X.-L.; Zhao, X.-B.; Han, W.-Q. Recent advances in inorganic solid electrolytes for lithium batteries. Front. Energy Res. 2014, 2, 25. [Google Scholar] [CrossRef] [Green Version]
  22. Hong, H.Y.-P. Crystal structure and ionic conductivity of Li14Zn(GeO4)4 and other new Li+ superionic conductors. Mat. Res. Bull. 1978, 13, 117–124. [Google Scholar] [CrossRef]
  23. Bachman, J.K.; Muy, S.; Grimaud, A.; Chang, H.H.; Pour, N.; Lux, S.F.; Paschos, O.; Maglia, F.; Lupart, S.; Lamp, P.; et al. Inorganic Solid-Sate Electrolytes for Lithium Batteries: Mechanisms and Properties Governing Ion Conduction. Chem. Rev. 2016, 116, 140–162. [Google Scholar] [CrossRef] [PubMed]
  24. Ke, X.; Wang, Y.; Ren, G.; Yuan, C. Towards rational mechanical design of inorganic solid electrolytes for all-solid-state lithium ion batteries. Energy Storage Mater. 2020, 26, 313–324. [Google Scholar] [CrossRef]
  25. Whitacre, J.; West, W.C. Crystalline Li4SiO4/Li3PO4 solid solutions as an electrolyte for film batteries using sputtered cathode layers. Solid State Ion. 2004, 175, 251–255. [Google Scholar] [CrossRef]
  26. Deng, Y.; Eames, C.; Chotard, J.-N.; Larele, F.; Seznec, V.; Emge, S.; Pecher, O.; Grey, C.P.; Masquelier, C.; Islam, M.S. Structural and Mechanistic Insights into Fast Lithium-Ion Conduction in Li4SiO4–Li3PO4 Solid Electrolytes. J. Am. Chem. Soc. 2015, 137, 9136–9145. [Google Scholar] [CrossRef] [Green Version]
  27. Choi, J.-W.; Lee, J.-W. Improved Li-ion conductivity of 0.7Li4SiO4-0.3Li3PO4 by aluminium doping. Solid State Ion. 2016, 289, 173–179. [Google Scholar] [CrossRef]
  28. Mahreen, A.; Kong, X.Y. A lithium ion conductor in Li4SiO4-Li3PO4-LiBO2 ternary system. Solid State Ion. 2016, 293, 72–76. [Google Scholar] [CrossRef]
  29. Shchelkanova, M.S.; Shekhman, G.S.; Druzhinin, K.V.; Pankratov, A.A.; Pryakhina, V.I. The study of lithium vanadium oxide LiV3O8 as electrode material for all-solid-state lithium-ion batteries with solid electrolyte Li3.4Si0.4P0.6O4. Electrochim. Acta 2019, 320, 134570. [Google Scholar] [CrossRef]
  30. Yoneda, Y.; Shigeno, M.; Kimura, T.; Nagao, K.; Hotehama, C.; Sakuda, A.; Tatsumisago, M.; Hayashi, A. Preparation and characterization of hexagonal Li4GeO4-based glass-ceramic electrolytes. Solid State Ion. 2011, 363, 115605. [Google Scholar] [CrossRef]
  31. Taminato, S.; Okumura, T.; Takeuchi, T.; Kobayashi, H. Fabrication and charge-discharge reaction of all solid-state lithium battery using Li4−2xGe1−xSxO4 electrolyte. Solid State Ion. 2018, 326, 52–57. [Google Scholar] [CrossRef]
  32. Dissanayake, M.A.K.L.; Gunavardane, R.P.; West, A.R.; Senadeera, G.K.R.; Bandaranayke, P.W.S.K.; Careem, M.A. Lithium ion conducting Li4−2xGe1−xSxO4 solid electrolytes. Solid State Ion. 1993, 62, 217–223. [Google Scholar] [CrossRef]
  33. West, K.; Zachau-Christiansen, B.; Ostergard, M.J.L.; Jacobsen, T. Vanadium oxides as electrode materials for rechargeable lithium cells. J. Power Sources 1987, 20, 165–172. [Google Scholar] [CrossRef]
  34. West, K.; Zachau-Christiansen, B.; Skaarup, S.; Saidi, Y.; Barker, J.; Olsen, I.I.; Pynenburg, R.; Koksbang, R. Comparison of LiV3O8 Cathode Materials Prepared by Different Methods. J. Electrochem. Soc. 1996, 143, 820–824. [Google Scholar] [CrossRef] [Green Version]
  35. Bensalah, N.; Dawood, H. Review on Synthesis, Characterization and Electrochemical Properties of Cathode Materials for Lithium Ion Batteries. J. Material Sci. Eng. 2016, 5, 1000258. [Google Scholar] [CrossRef] [Green Version]
  36. Fomichev, V.V.; Proskuryakova, E.V. Vibrational spectra and energy characteristics of the superionics Li4SiO4 and Li4GeO4. J. Solid State Chem. 1997, 232–237. [Google Scholar] [CrossRef]
  37. Nakamoto, K. Infrared and Raman Spectra of Inorganic and Coordination Compounds, 3rd ed.; Wiley: New York, NY, USA, 1978. [Google Scholar]
  38. Brooker, M.H.; Bates, J.B. Raman and Infrared Spectral Studies of Anhydrous Li2CO3 and Na2CO3. J. Chem. Phys. 1971, 54, 4788. [Google Scholar] [CrossRef]
  39. Wadsley, A.D. Crystal chemistry of non-stoichiometric pentavalent vandadium oxides: Crystal structure of Li1+xV3O8. J. Acta Crystallogr. 1957, 10, 261. [Google Scholar] [CrossRef]
  40. Kera, Y. Infrared study of alkali tri-and hexavanadates as formed from their melts. J. Solid State Chem. 1984, 51, 205–211. [Google Scholar] [CrossRef]
  41. Magon, C.J.; Lima, J.F.; Donoso, J.P.; Lavayen, V.; Benavenete, E.; Navas, D.; Gonzales, G. Deconvolution of the EPR spectra of vanadium oxide nanotubes. J. Magn. Reson. 2012, 222, 26–33. [Google Scholar] [CrossRef]
Figure 1. (1) XRD pattern of Li3.8Ge0.9S0.1O4 and (2) line diagrams of powder pattern for Li3.6Ge0.8S0.2O4 (PDF2, No. 44-0337).
Batteries 09 00066 g001
Figure 2. Raman spectrum for Li3.8Ge0.9S0.1O4across the wavenumber range of 50–1200 cm−1 (1) and 50–4000 cm−1 (2).
Batteries 09 00066 g002
Figure 3. (a)-(1) XRD pattern of Li1.3V3O8 synthesized in this work and (2) line diagram of powder pattern for LiV3O8 standard in PDF-2 database, No. 72-1193. (b) SEM image of Li1.3V3O8 sample.
Batteries 09 00066 g003
Figure 4. EPR spectrum for Li1.3V3O8.
Batteries 09 00066 g004
Figure 5. Impedance plots for Pt│Li3.8Ge0.9S0.1O4│Pt electrochemical cell at 60 and 170 °C.
Batteries 09 00066 g005
Figure 6. Total (1) and electronic (2) conductivity vs. reciprocal temperature for Li3.8Ge0.9S0.1O4 solid electrolyte.
Batteries 09 00066 g006
Figure 7. DSC (black line) and TG (blue line) curves for Li1.3V3O8 and Li3.8Ge0.9S0.1O4 solid electrolyte powders (mass ratio 1:2).
Batteries 09 00066 g007
Figure 8. (1) XRD pattern for the mixture of Li1.3V3O8 and Li3.8Ge0.9S0.1O4 powders after heat treatment at 300 °C for 5 h, (2) line diagram of Li3.6Ge0.8S0.2O4 (PDF-2, No. 44-0337), (3) line diagram of LiV3O8 standard (PDF-2, No. 72-1193), (4) XRD pattern for the mixture of Li1.3V3O8 and Li3.8Ge0.9S0.1O4 powders after heat treatment at 560 °C for 5 h.
Batteries 09 00066 g008
Figure 9. Impedance plots for Li│Li3.8Ge0.9S0.1O4│Li cell before and after isothermal exposure at 100 °C for 240 h.
Batteries 09 00066 g009
Figure 10. (a)—cross-sectional schematic of Li|Li3.8Ge0.9S0.1O4| Li1.3V3O8 cell and (b)—micrograph of the fractured surface of the cell from the side of the cathode.
Batteries 09 00066 g010
Figure 11. Impedance plot for Li|Li3.8Ge0.9S0.1O4|Li1.3V3O8 cell at 100 °C.
Batteries 09 00066 g011
Figure 12. Temperature dependenciesfor the electrical conductivity of Li3.8Ge0.9S0.1O4 solid electrolyte (1) andLi|Li3.8Ge0.9S0.1O4|Li1.3V3O8 electrochemical cell (2).
Batteries 09 00066 g012
Figure 13. Current–voltage curve (3rd cycle of potential sweep) for Li|Li3.8Ge0.9S0.1O4|Li1.3V3O8 electrochemical cell at 100 °C.
Batteries 09 00066 g013
Figure 14. (a)-Galvanostatic charge/discharge curves (a) for Li|Li3.8Ge0.9S0.1O4|Li1.3V3O8 cell (1st, 10th, 30th and 40th cycles) and Coulombic efficiency curve (b). 13 μA/sm2, 100 °C.
Batteries 09 00066 g014
Table 1. Specific electrical conductivity of a solid electrolyte Li3.8Ge0.9S0.1O4.
Li3.8Ge0.9S0.1O4
t, °Cσ, S/cm
255 × 10 −6
606 × 10 −5
1704 × 10 −3
3904 × 10 −1
Disclaimer/Publisher’s Note: The statements, opinions and data contained in all publications are solely those of the individual author(s) and contributor(s) and not of MDPI and/or the editor(s). MDPI and/or the editor(s) disclaim responsibility for any injury to people or property resulting from any ideas, methods, instructions or products referred to in the content.

