
Renewable Electricity for Decarbonisation of Road Transport: Batteries or E-Fuels?


Abstract
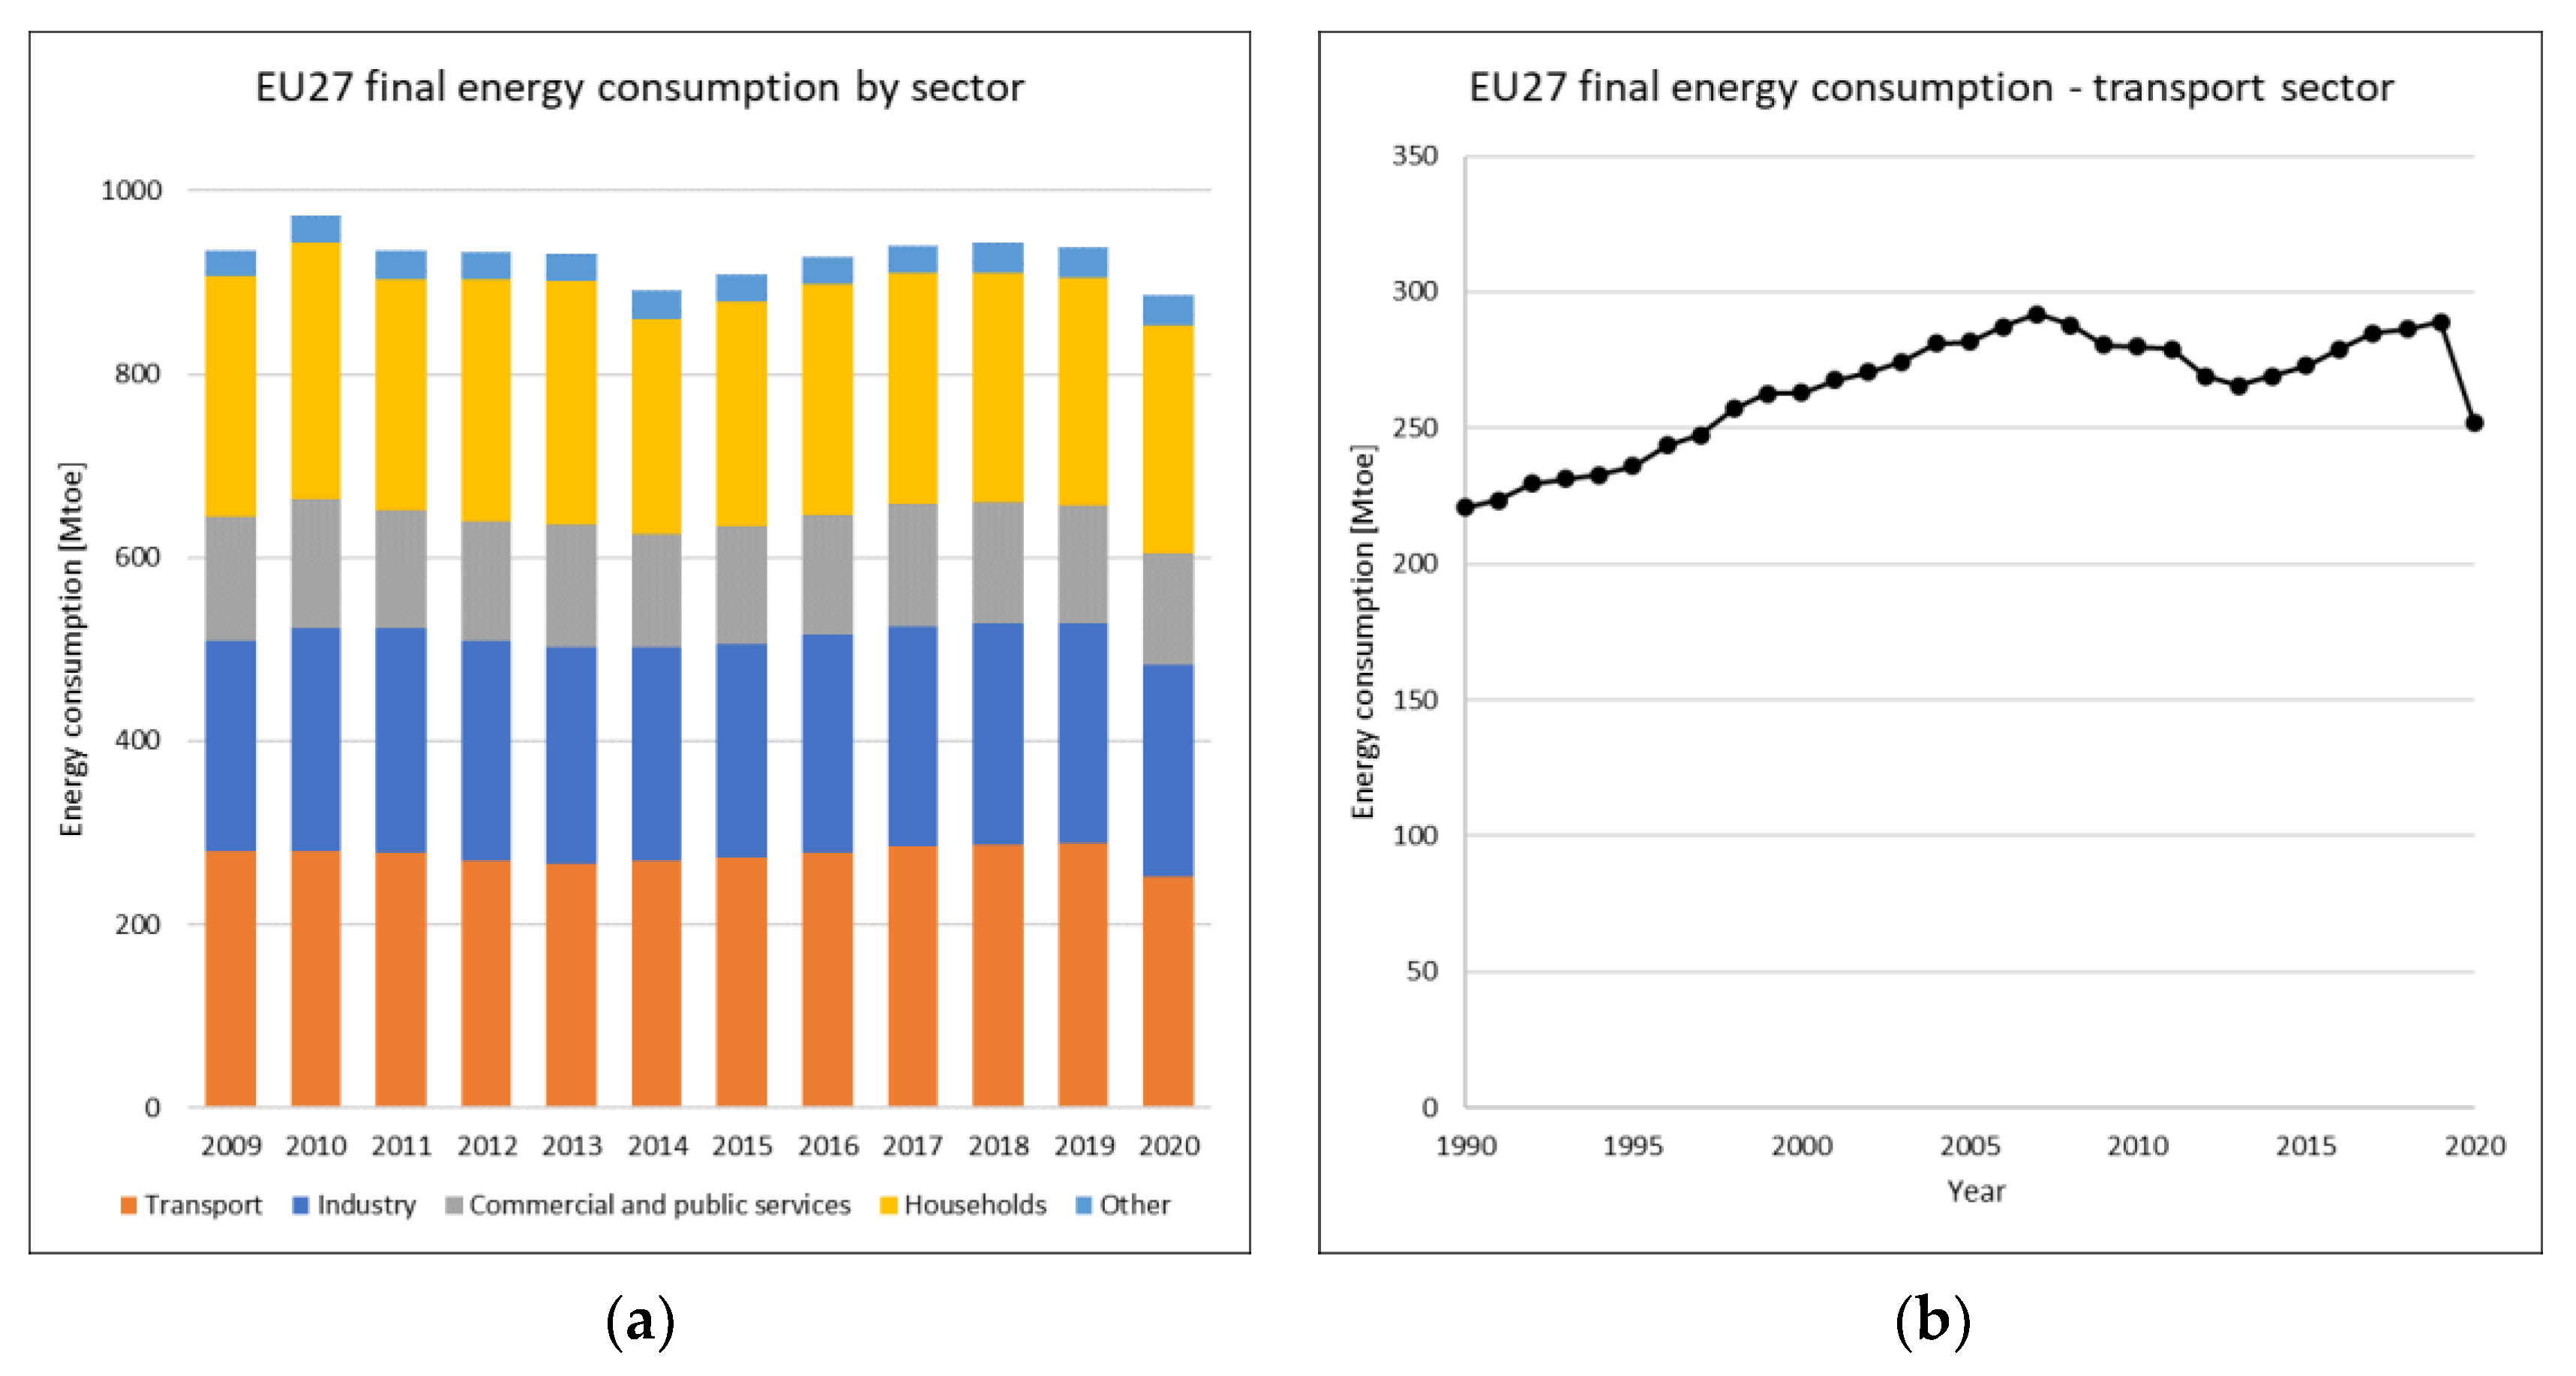
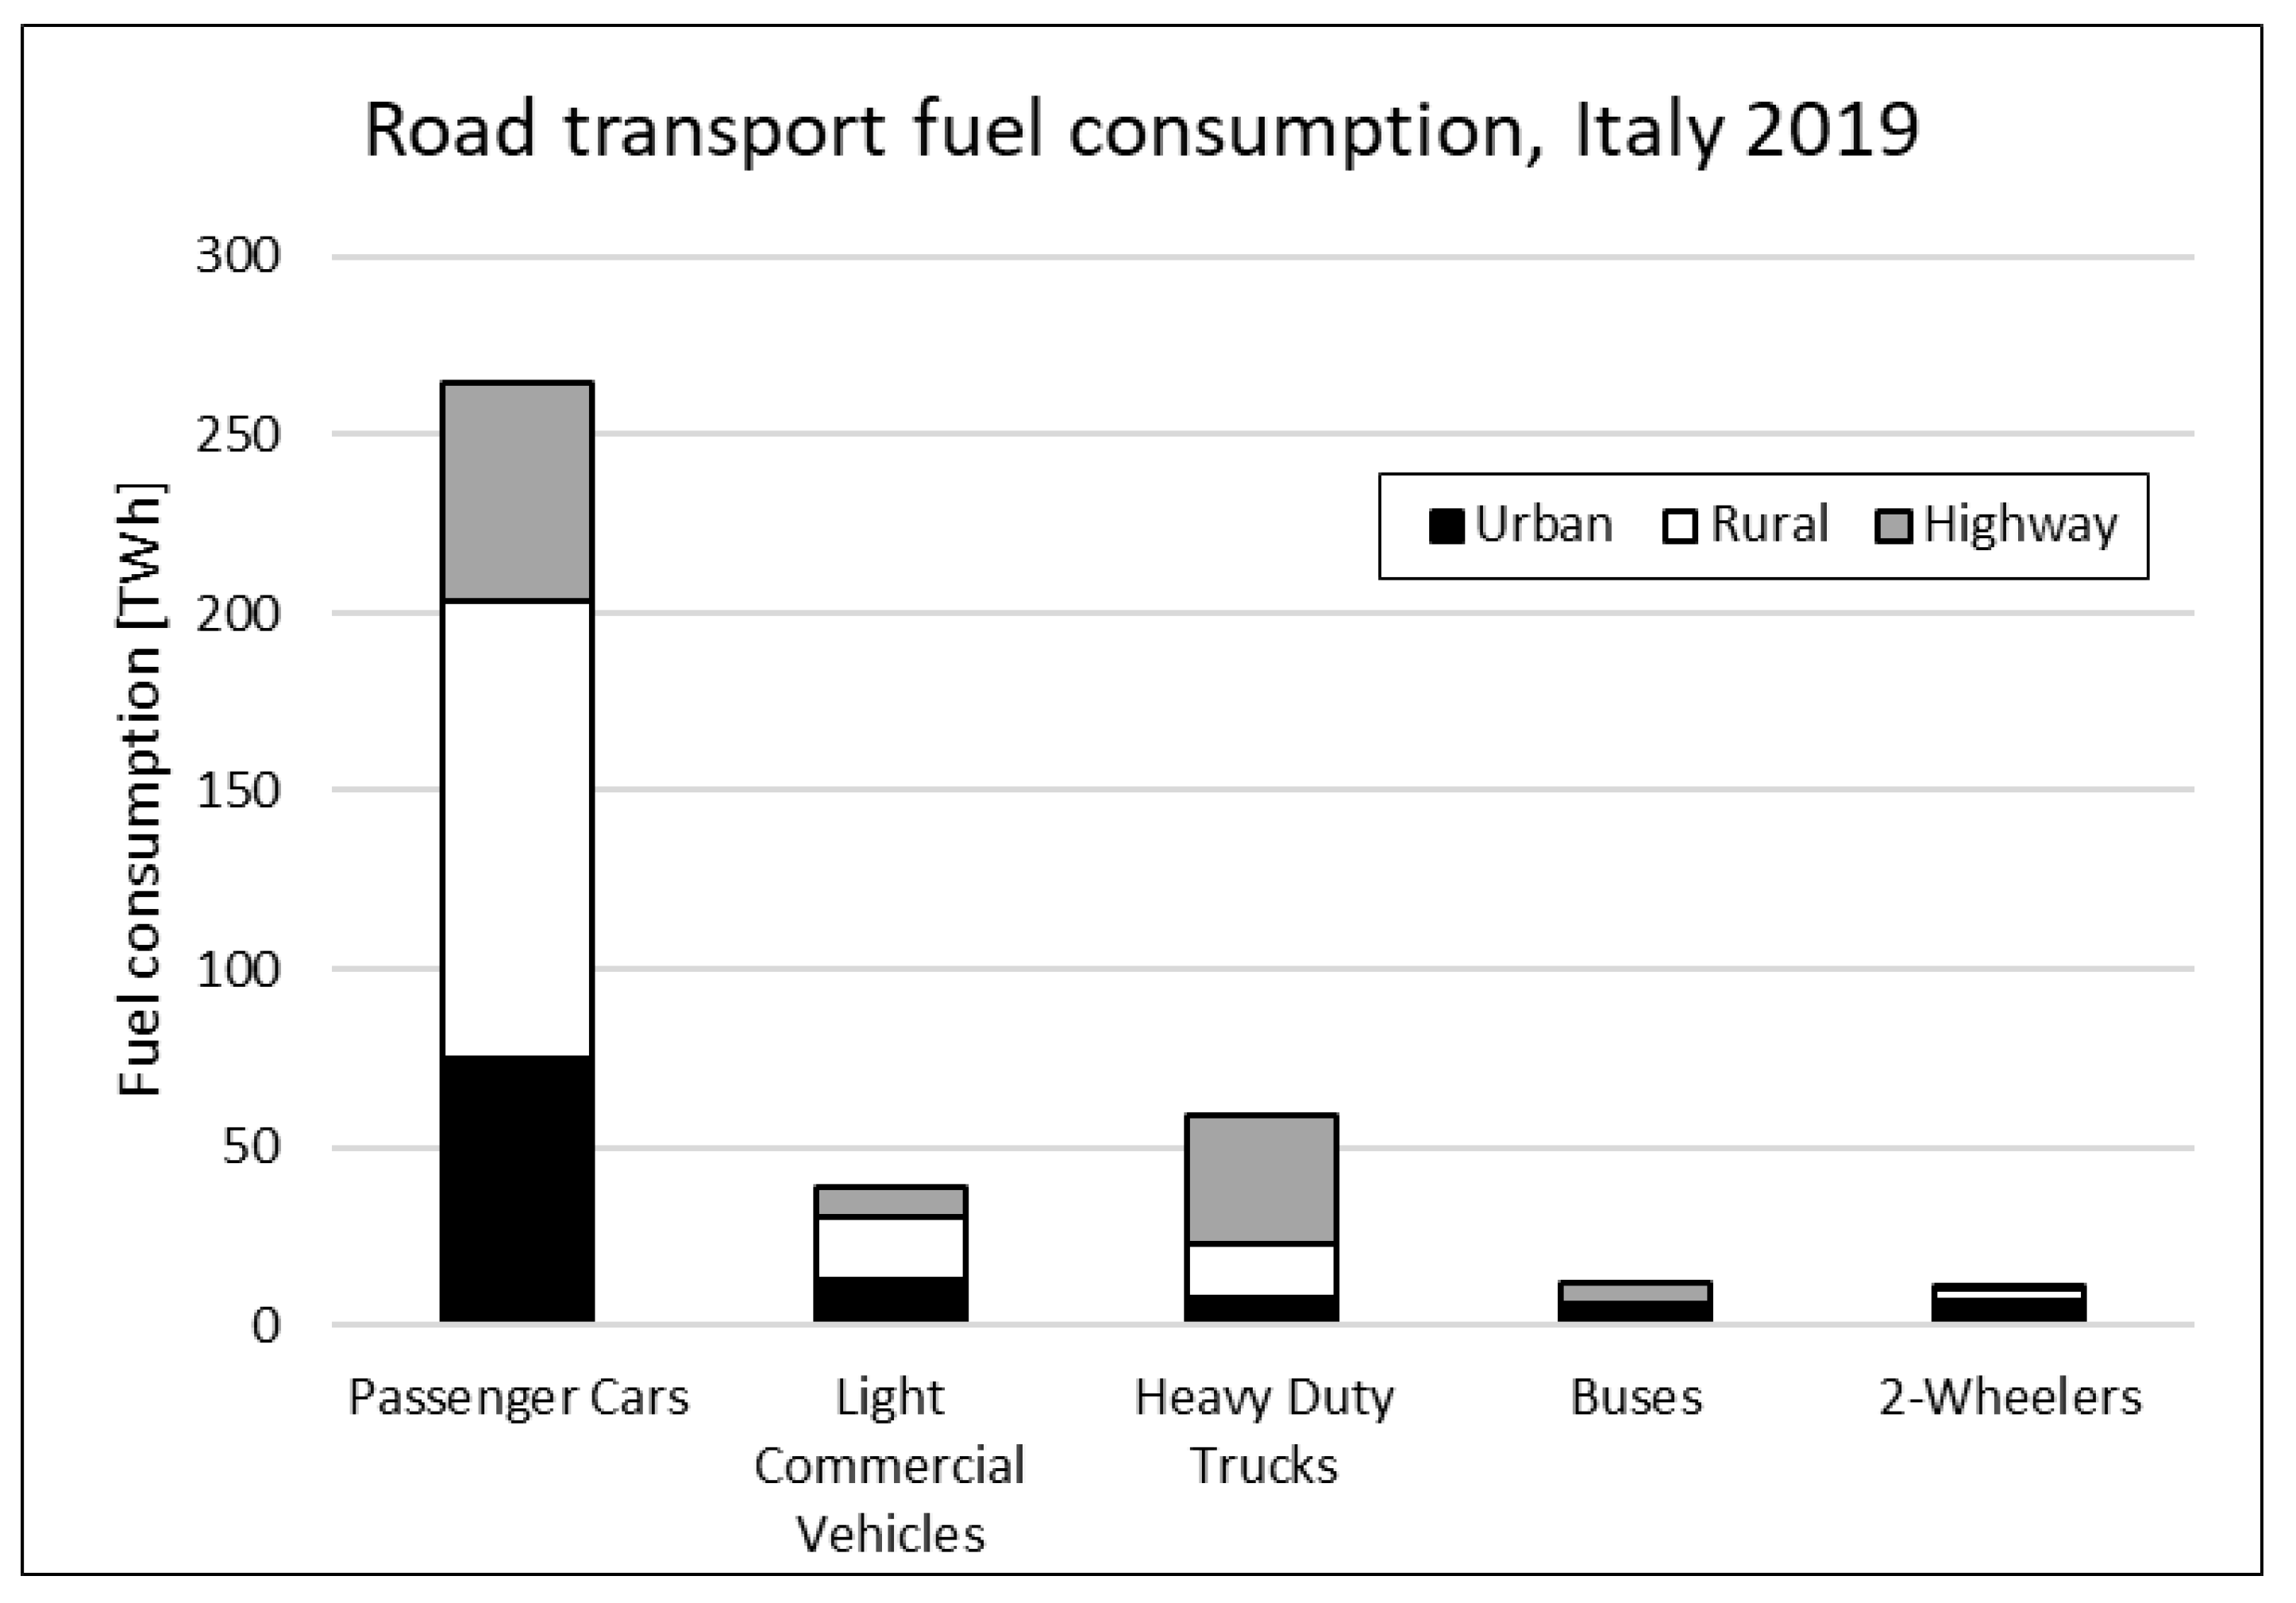
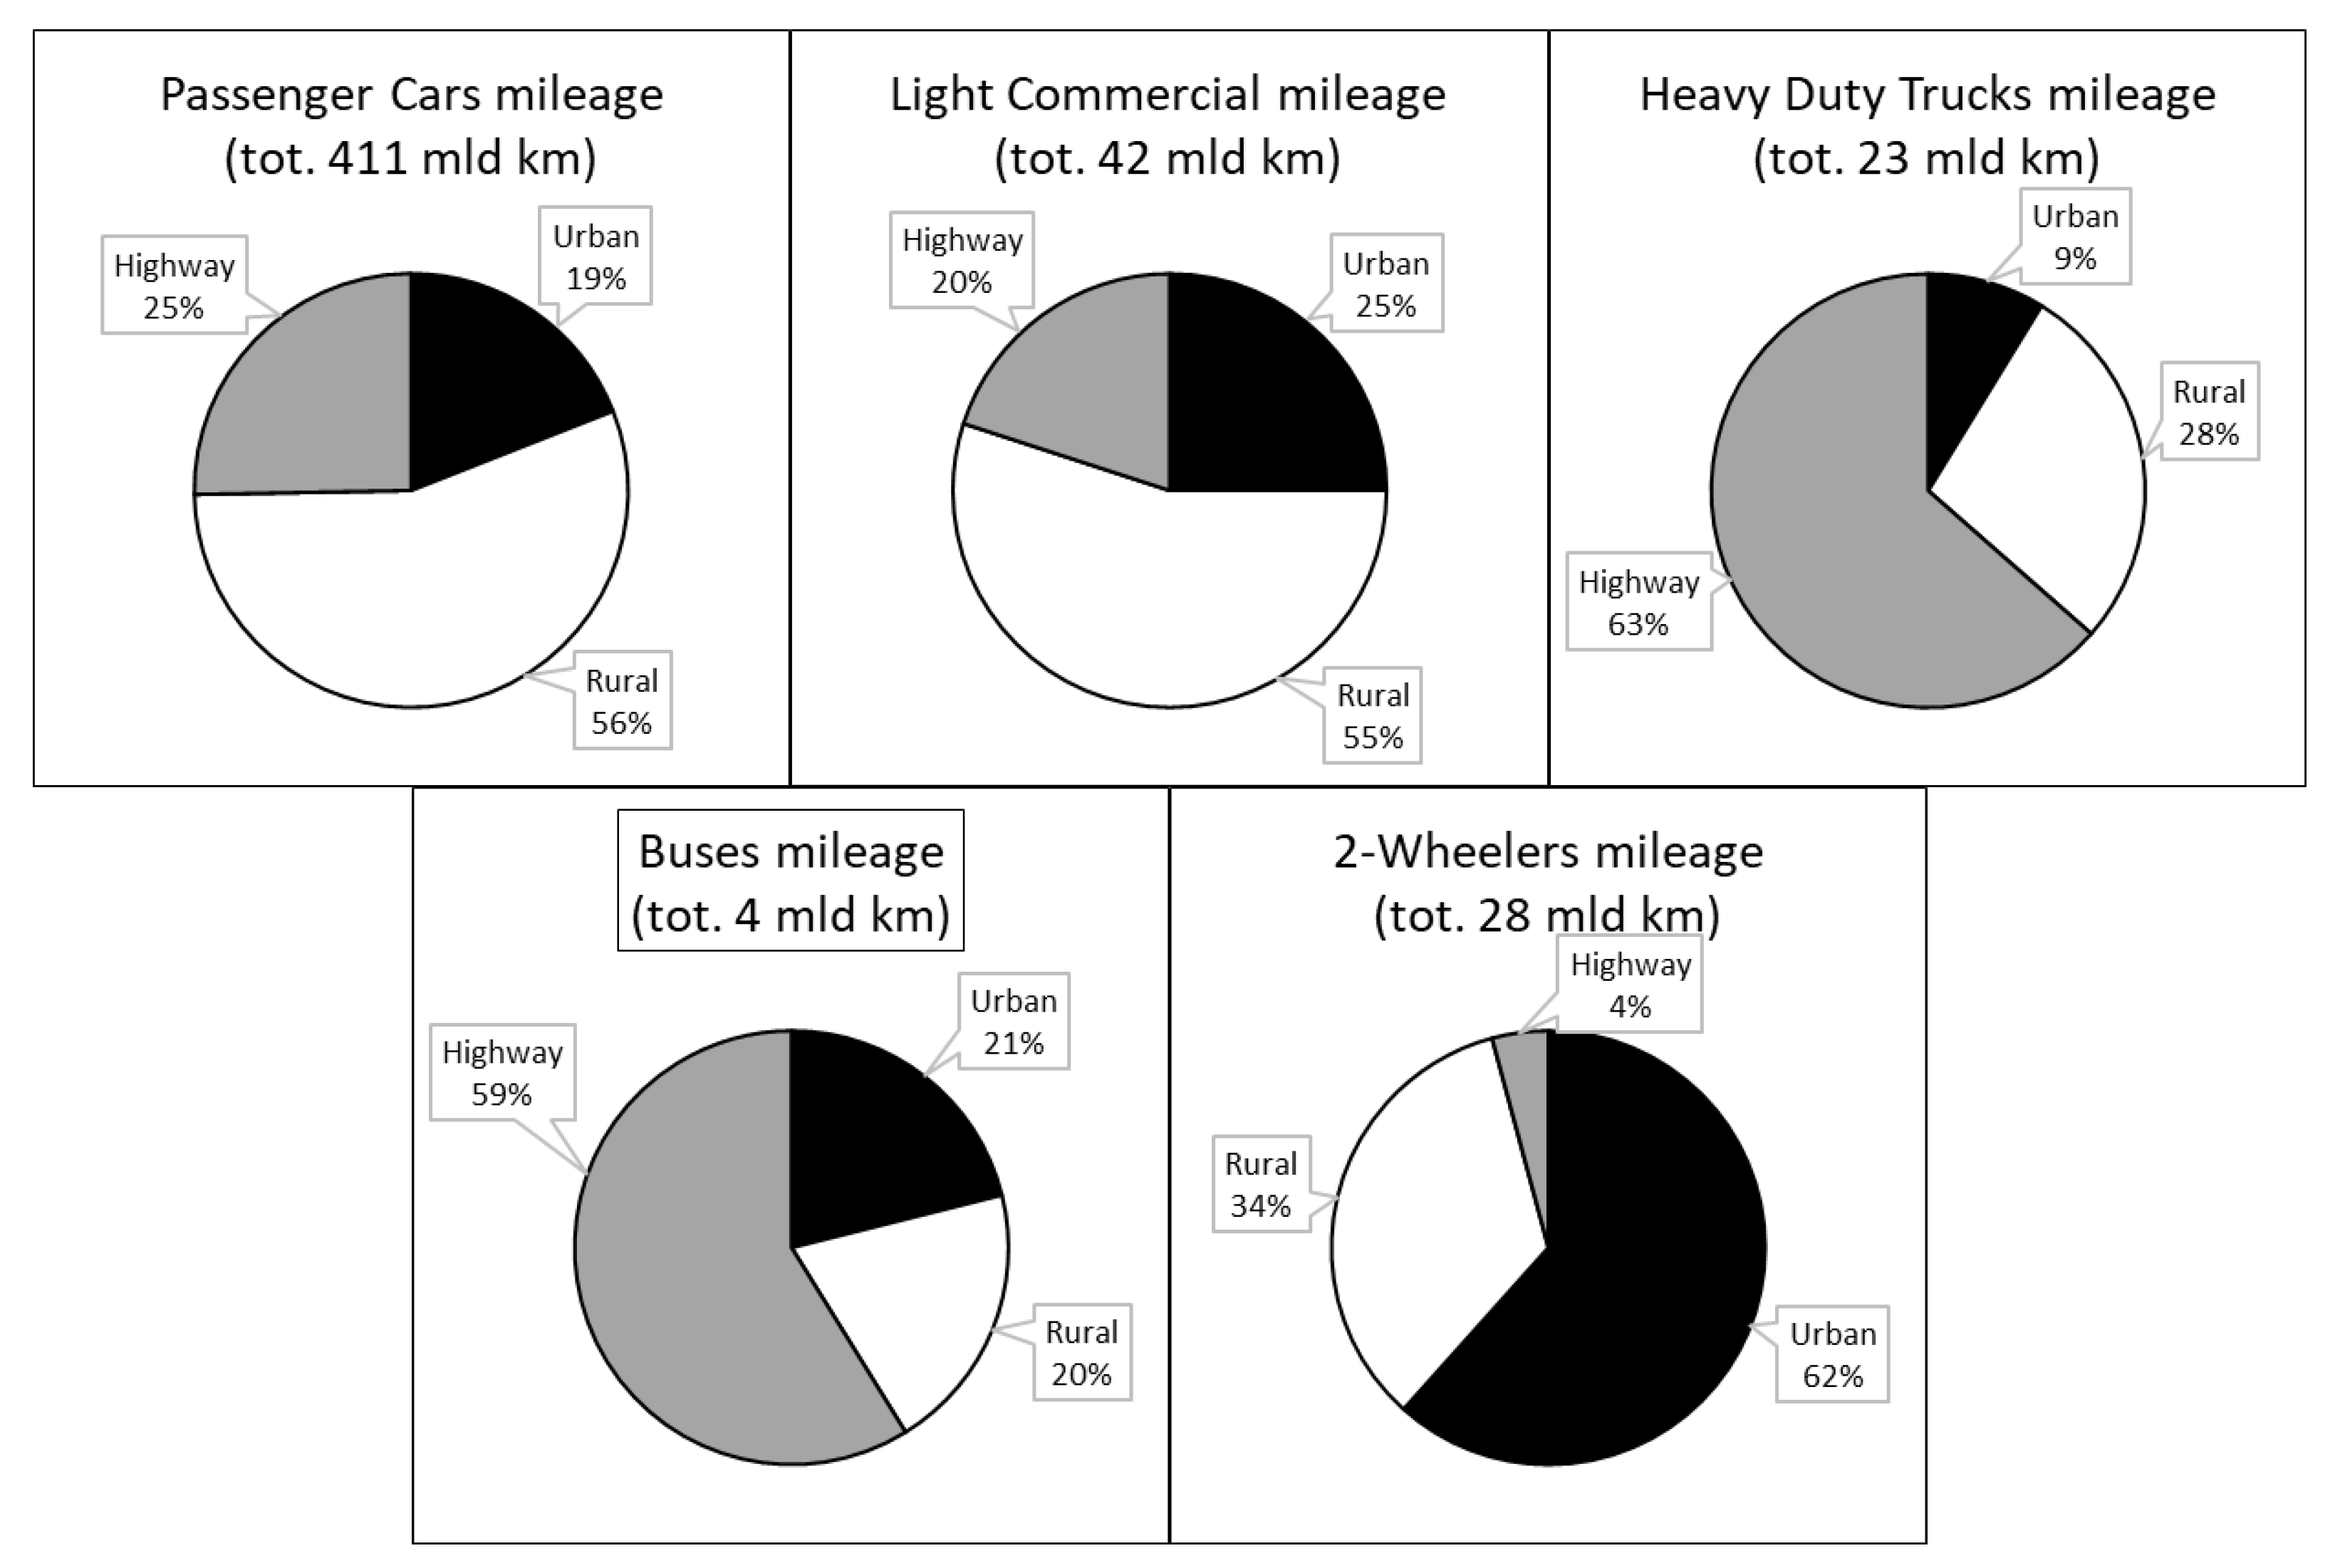
:1. Introduction
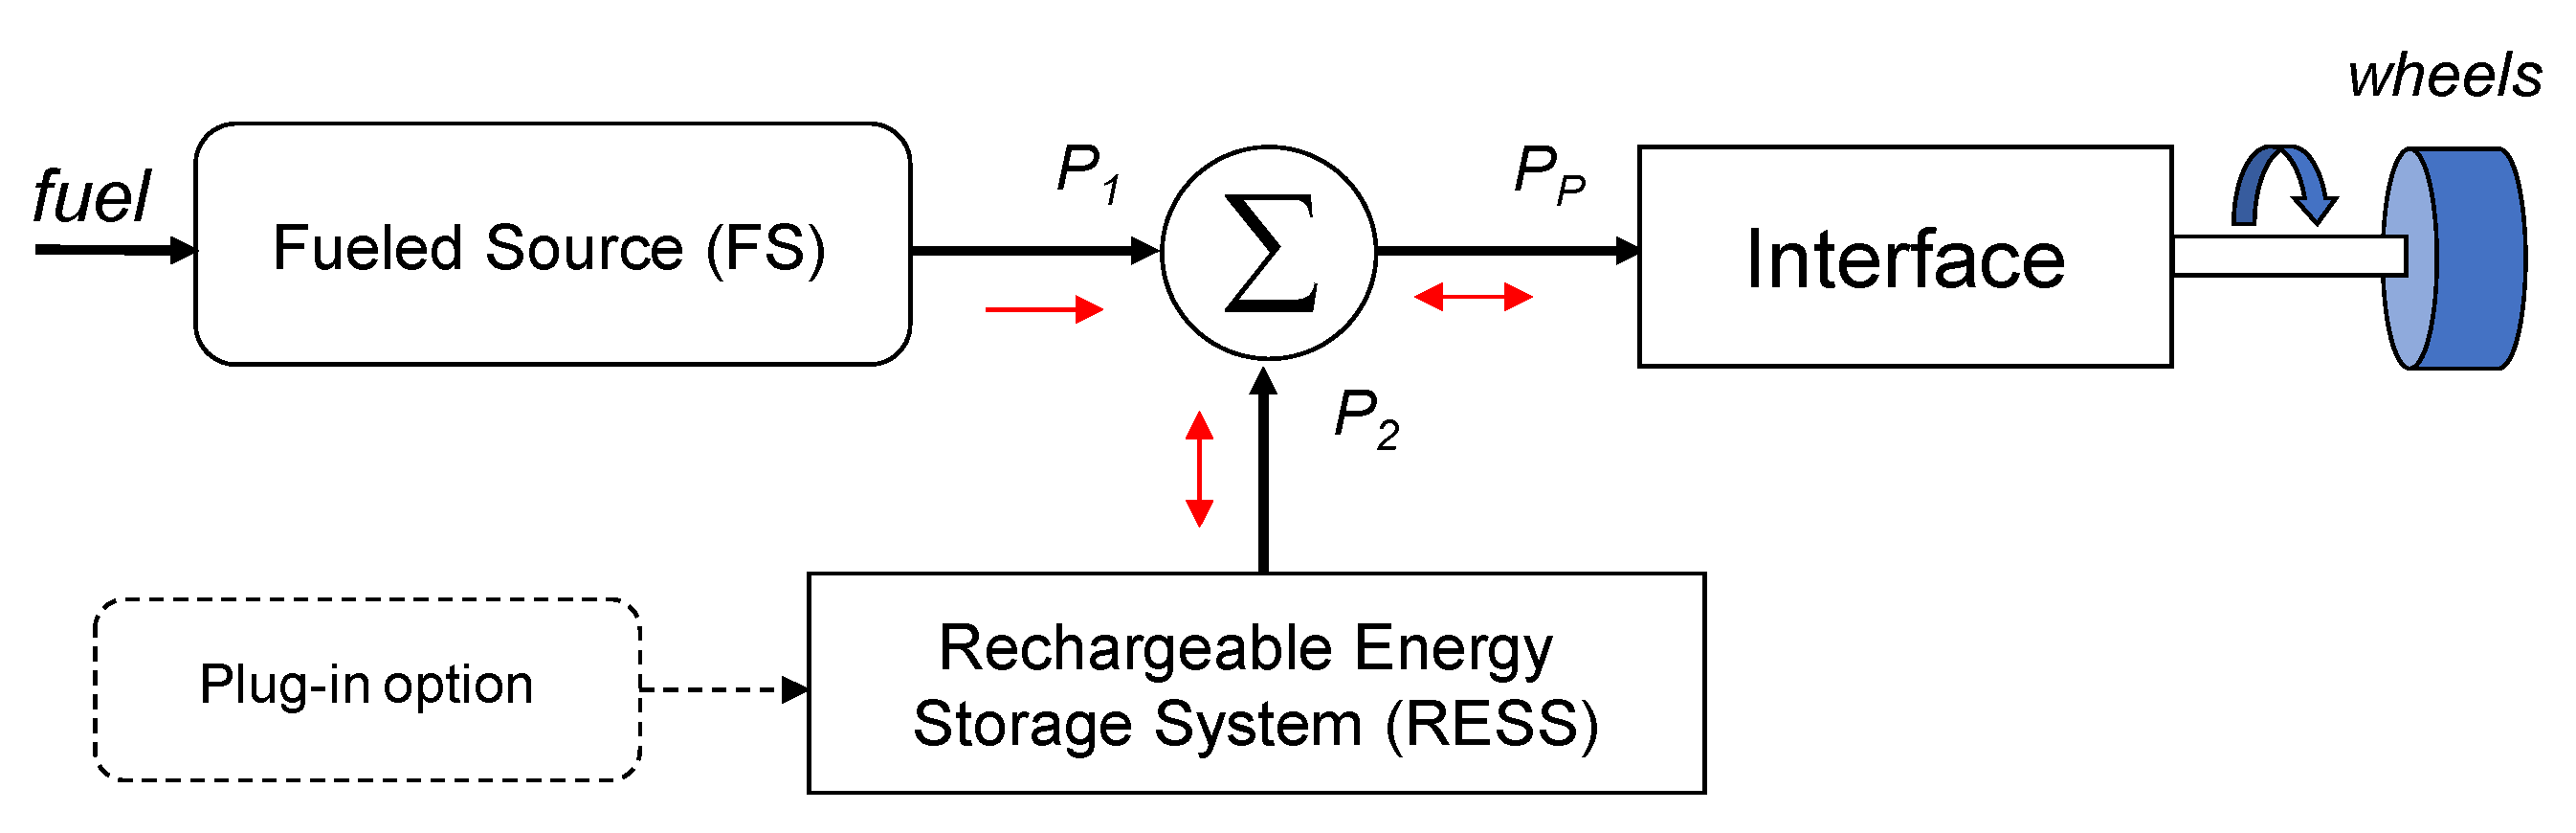
2. Powertrain Architectures
- Two onboard energy sources.
- The source that generates energy (mechanical or electric) from fuel (gasoline, natural gas, or hydrogen), here called ‘fuelled source’ (FS), has a single-direction energy flow (depicted in the figure as a one-way red arrow below P1).
- The additional source is one rechargeable energy storage system (RESS) that can deliver or store energy. The available energy is typically much lower than that coming from the fuelled source, and the power flow is necessarily bidirectional (depicted in the picture as two-way red arrows near the black lines).
3. Batteries
3.1. Economic Investments
3.2. Lithium Batteries
3.3. Metal–Air Batteries
- Mg-air: Mg-air systems are attractive because of the uniform deposition of Mg metal; however, this type of device suffers regarding electrochemical instability. In addition, the corrosion of the Mg electrode severely restricts the use of aqueous electrolytes [37].
- Al-air: Aluminium-air-based batteries turn out to have promising chemistry. Firstly, aluminium is abundant in nature and relatively safe to handle. Furthermore, this type of chemistry is characterised by a high theoretical energy density and high specific energy values [38].
- Na-air: The great abundance in nature and the lithium-like characteristics have promoted the research of this type of chemistry. However, the development of these systems is still in its early stage [37].
- Si-air: Silicon is the second most abundant element in the earth’s crust, and its semiconductor characteristics make it an attractive candidate for electronic applications [39]. Si-air batteries have a high theoretical energy density; however, they have problems with efficiency, reversibility, and corrosion. In particular, the reversibility of the system has not yet been demonstrated due to the stability of the silicon oxide (SiO2) and silicate compounds in alkaline solutions. Moreover, silicon is corroded during the discharge phase, especially in alkaline solutions [37,39].
- Li-air: They appear to be the most promising of the metal–air systems currently studied. A lithium metal electrode is expected to reach high energy densities since it is a very electropositive (−3.04 V) and light (0.53 g/cm3) material that is also characterised by a high specific capacity (3860 Ah/kg). Unfortunately, however, the contact of metallic lithium with a liquid electrolyte is extremely problematic due to the high reactivity of lithium both with solvents and with the salts contained in the electrolyte. The surface of the lithium in contact with the electrolyte forms the so-called solid electrolyte interphase (SEI), i.e., it transforms into a porous mosaic structure of insoluble lithium compounds with a consequent loss of the lithium available for the electrochemical reaction and a reduction of the life of the cell with the risk of the formation of dendrites, which remains a crucial point for the optimal functioning of lithium–air batteries [40]. Despite the difficulties, this type of battery looks promising [37].
- Zn-air: Zn-air rechargeable batteries are promising energy sources using inexpensive and environmentally friendly materials [40]. Zinc-air batteries (ZABs) are the only developed metal–air system today available, and they have been successfully marketed as primary cells for many decades [37]. One of the advantages of this system, unlike other chemicals such as lithium-based ones, is its stability in water. Their lifespan and electrical rechargeability, on the other hand, are significantly limited [37]. Current research attempts to increase the lifespan of these devices and improve their effectiveness.
- Fe-air: Fe-air batteries have been mainly studied as a rechargeable power supply system for electric vehicles. The theoretical specific energy is 1000 Wh/kg using oxygen present in the air as a positive electrode; unfortunately, at present, the specific energy that can be obtained is about 10% of the expected value [38]. Currently, other research aims to reduce the self-discharge problems of these systems in an alkaline environment, improve the reversibility of discharge products, and improve general performance [39].
3.4. Sodium-Ion (Na-Ion) Batteries
3.5. Solid-State Batteries
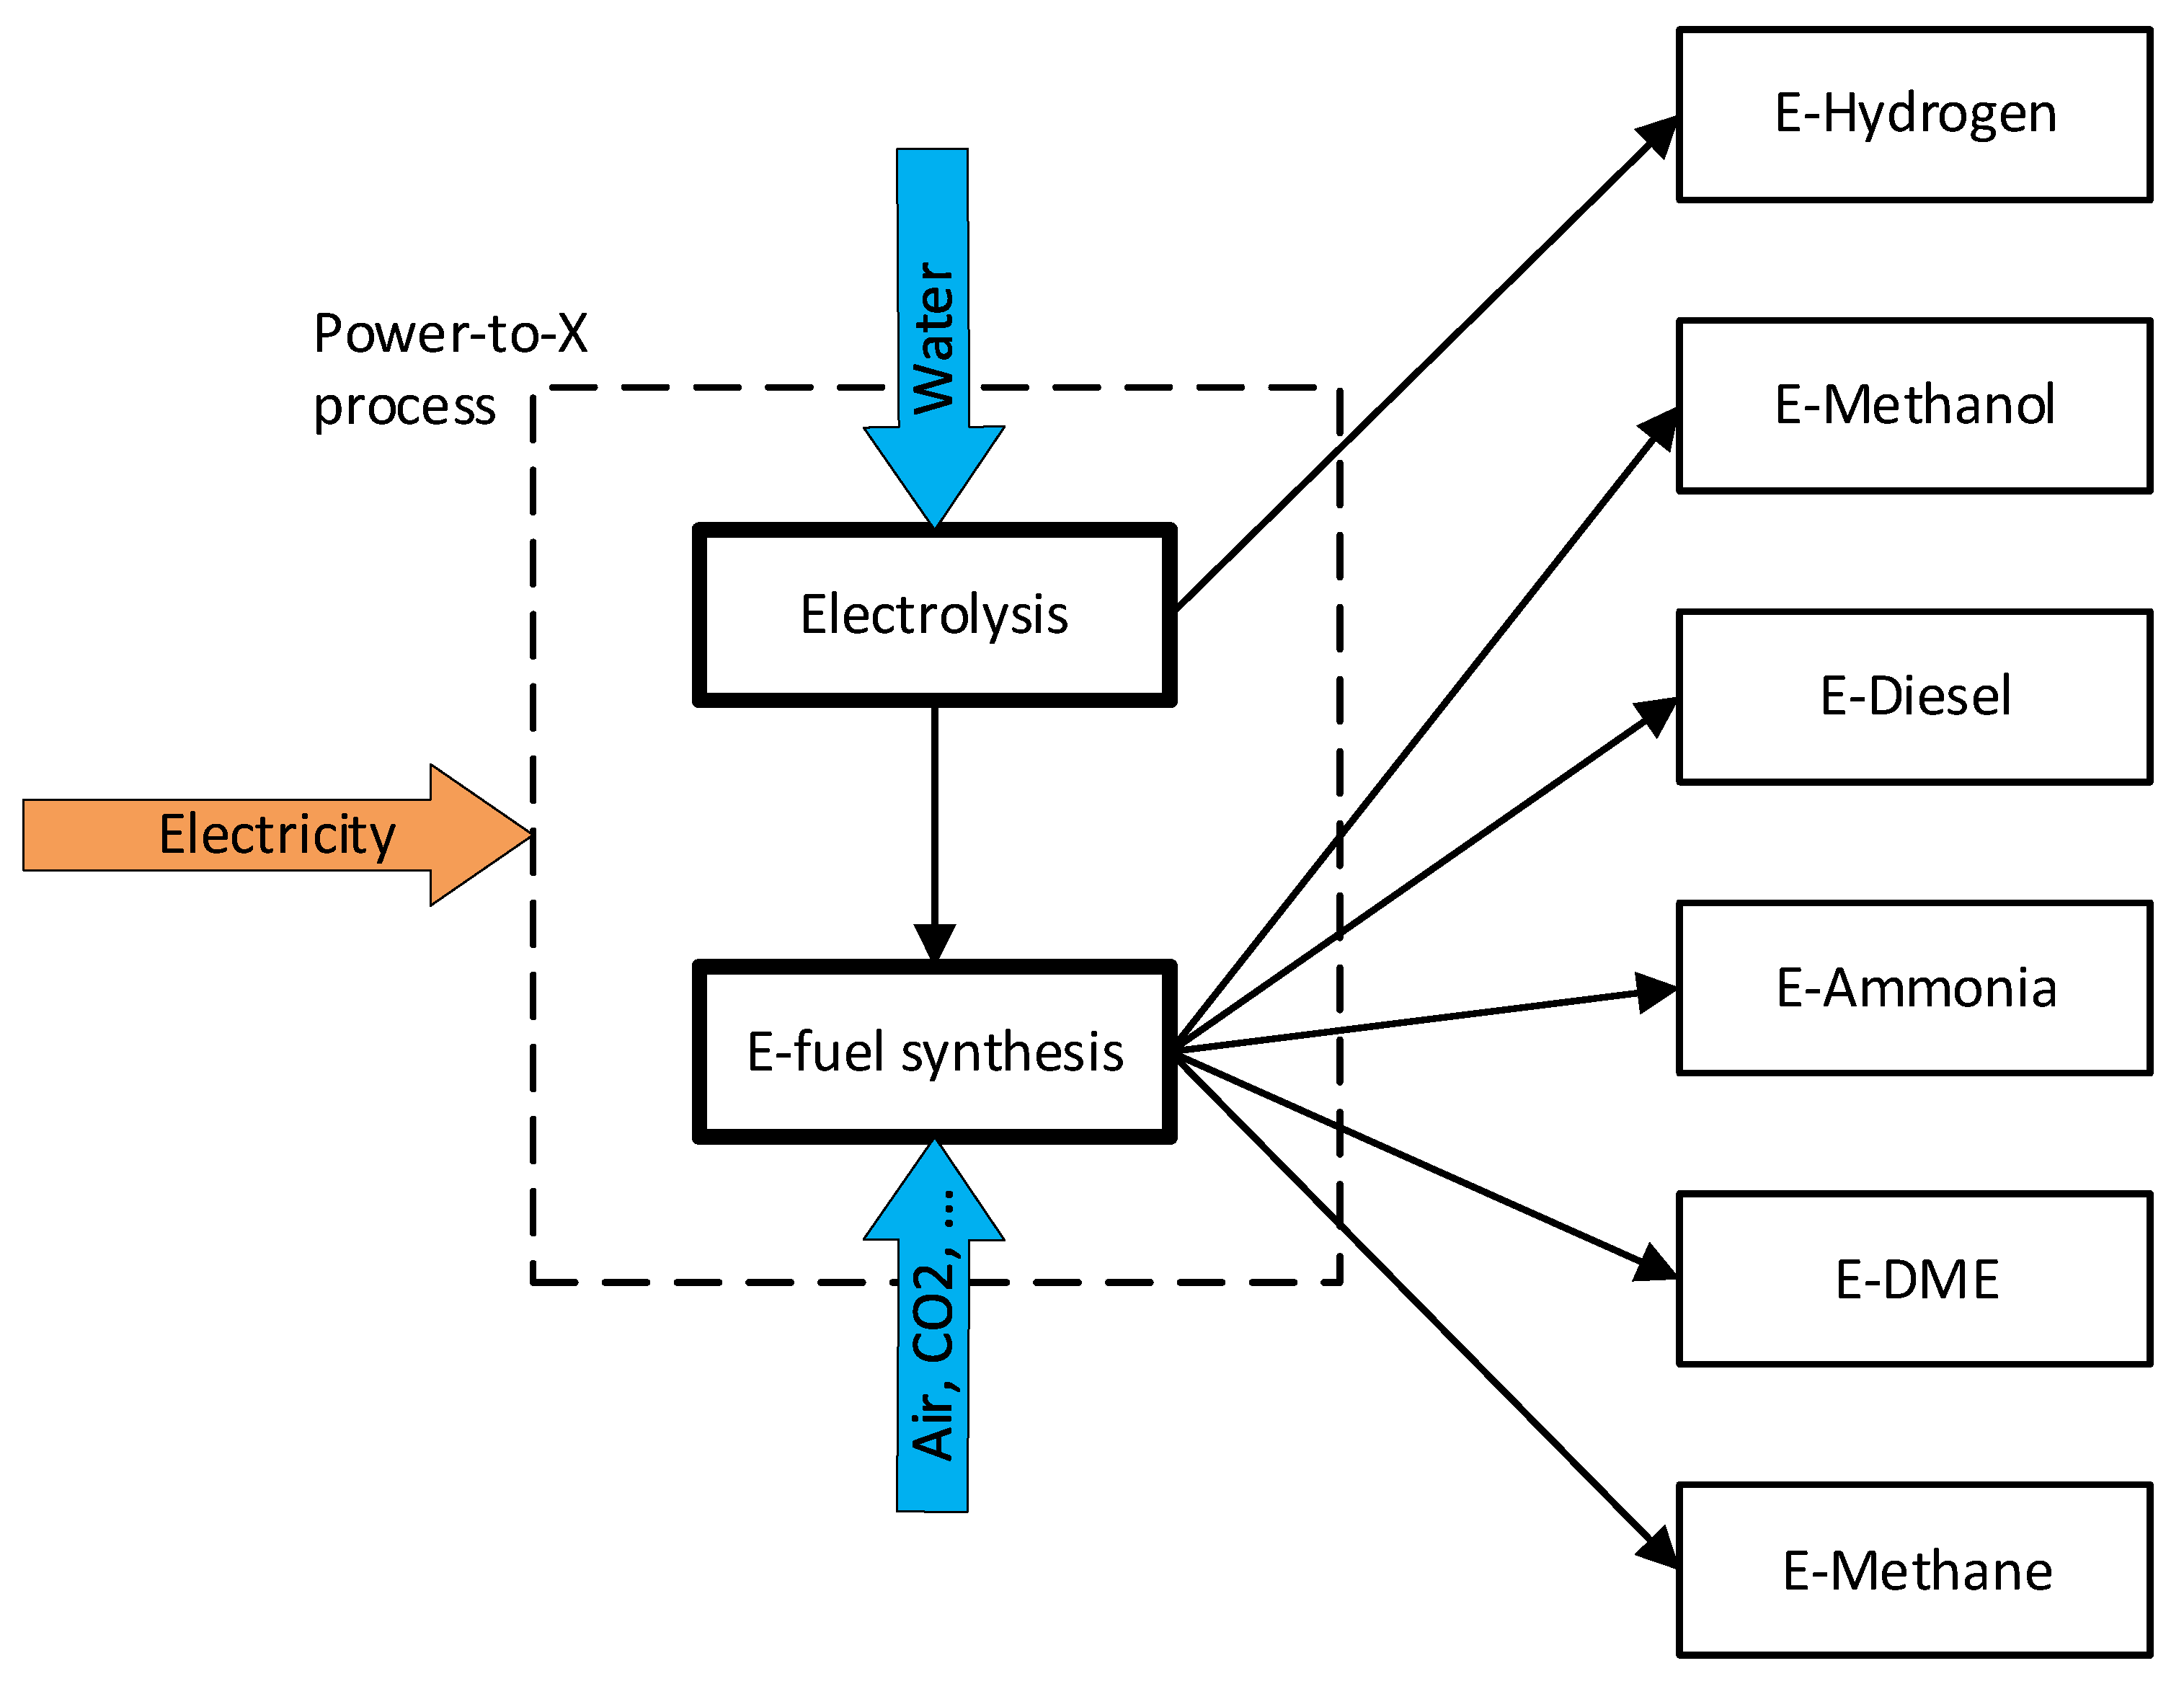
4. E-Fuels
- Methane compression to 220 bar 0.15 kWh/kg (1% of LHV) and liquefaction 0.3–0.6 kWh/kg (2–4% of LHV) [59].
4.1. E-Hydrogen
4.2. E-Methanol
4.3. E-Diesel
4.4. E-Ammonia
4.5. E-DME
4.6. E-Methane
5. Discussion
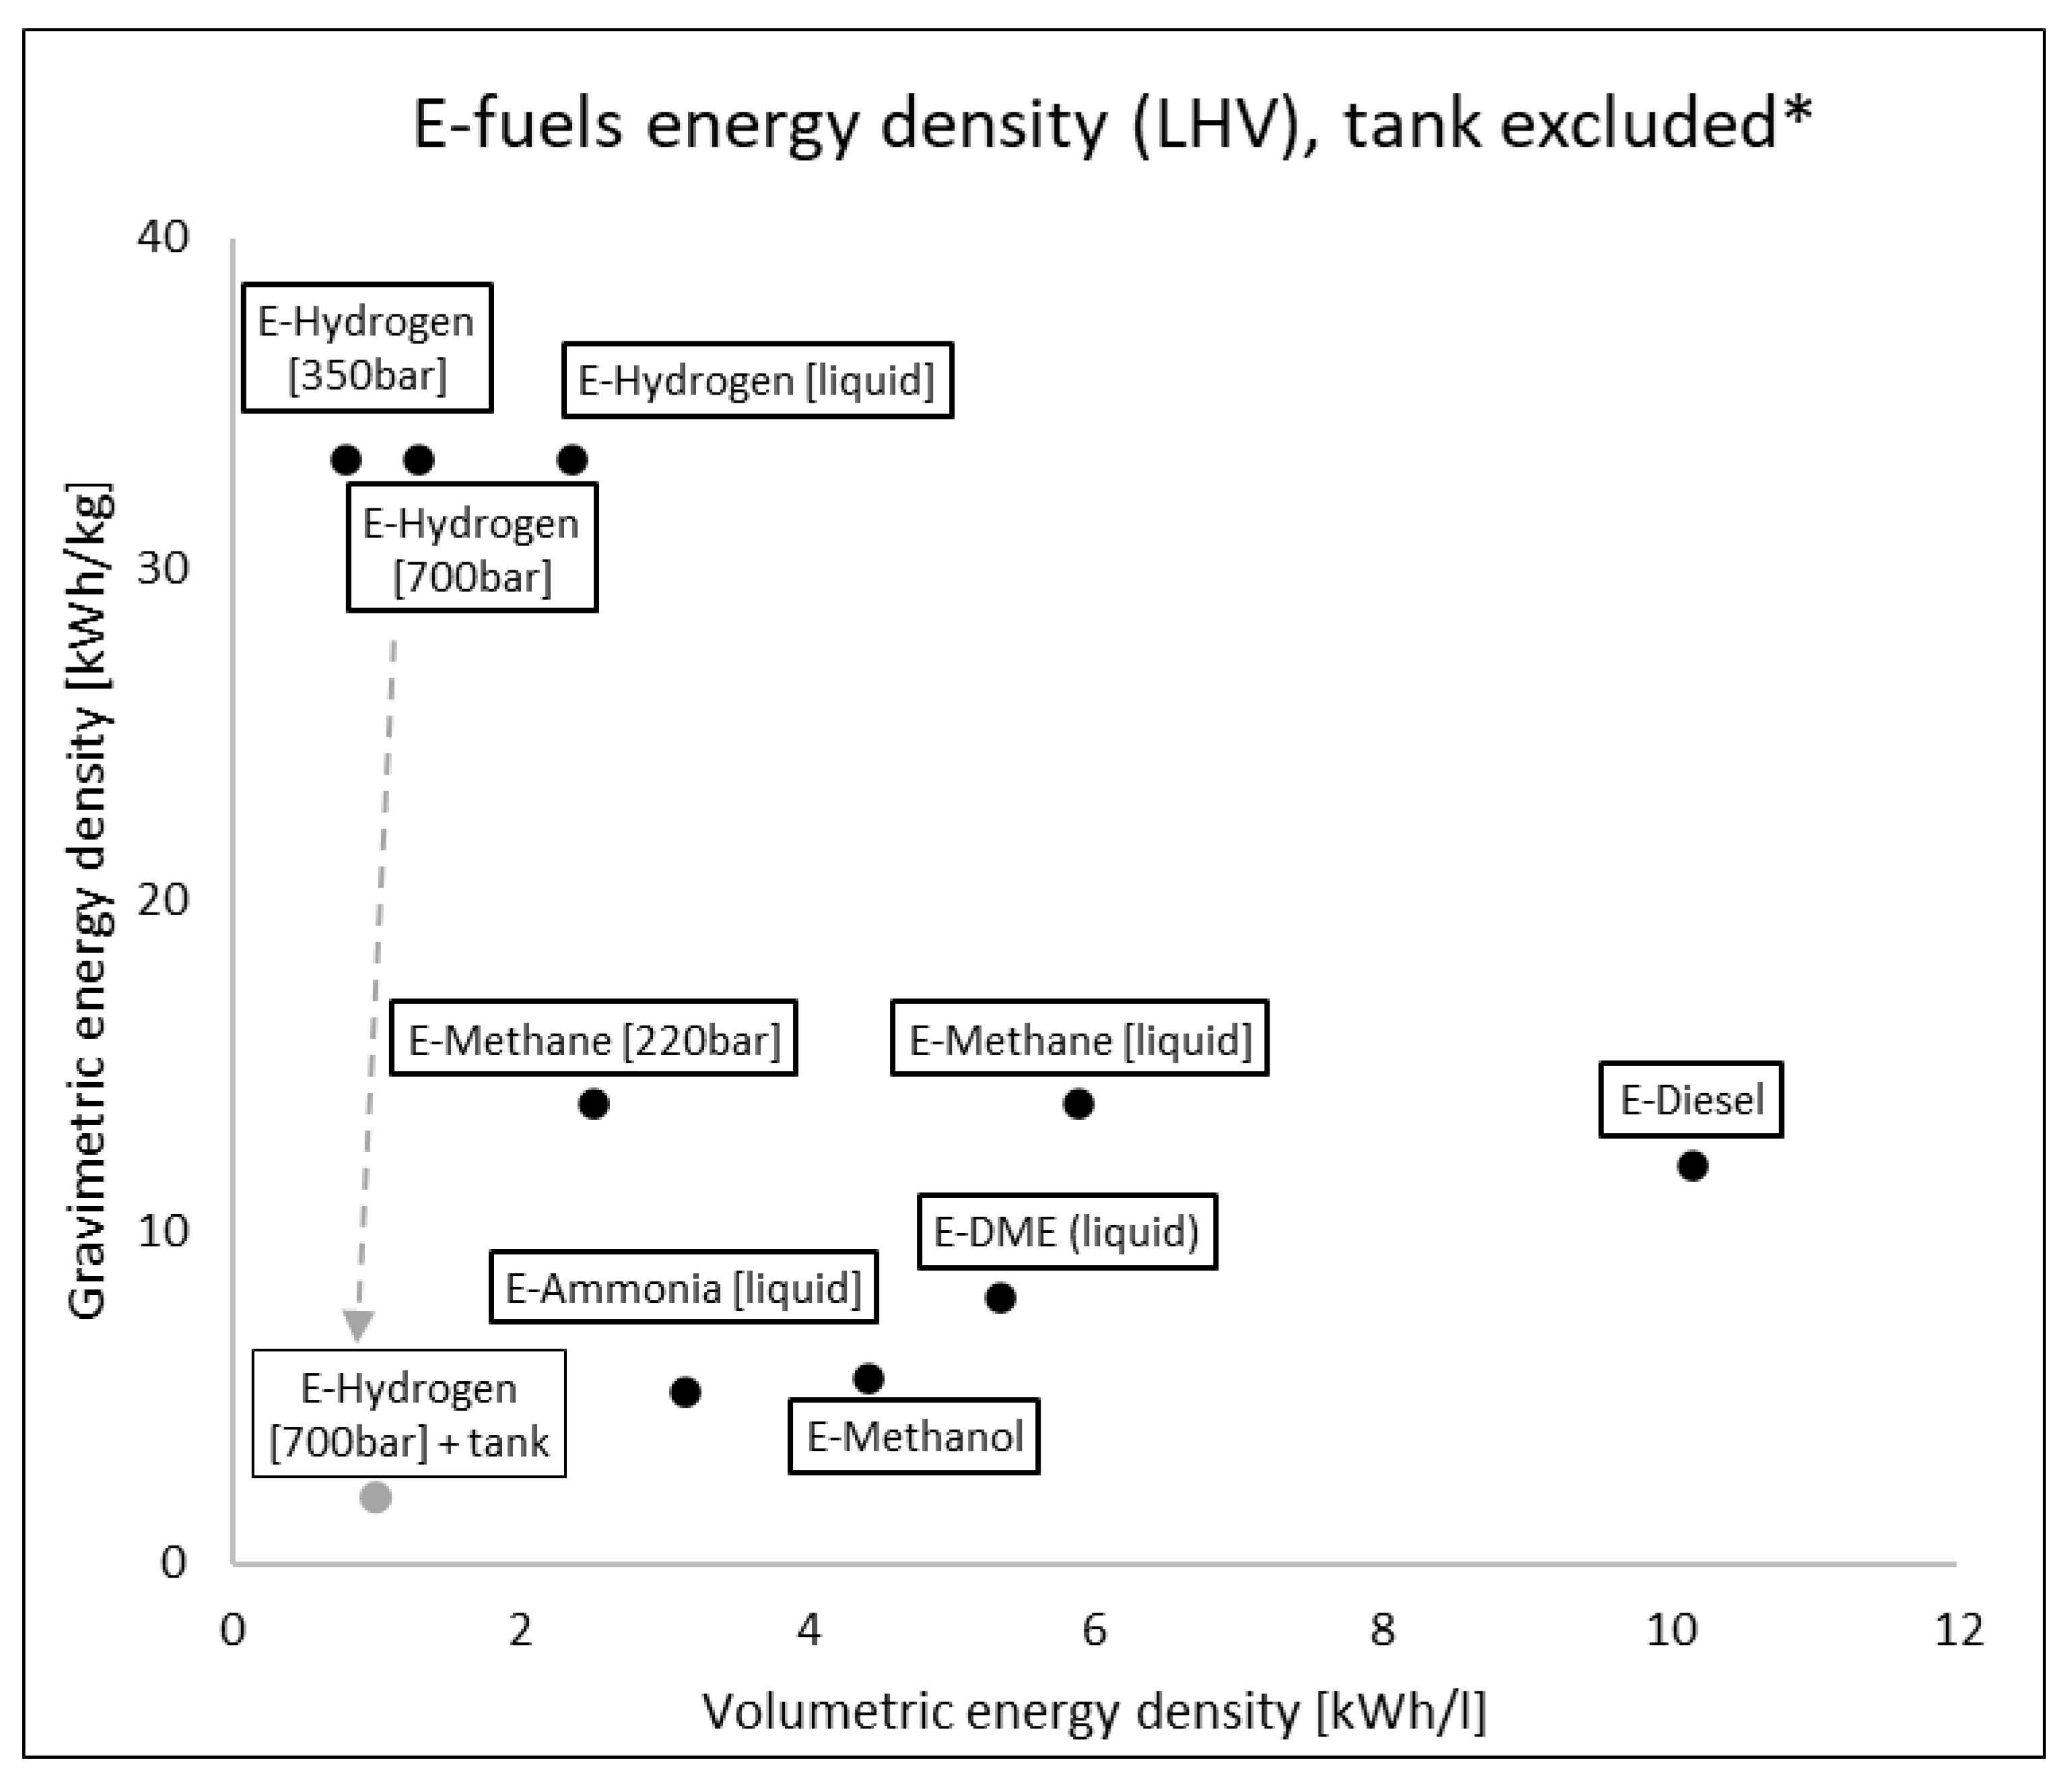
- Regarding volumetric energy density, e-hydrogen is the most difficult e-fuel to store onboard due to its lower density even at extreme cryogenic conditions. Compressed hydrogen requires tanks with a remarkable mass, drastically reducing the gravimetric energy density (from 33.3 kWh/kg to 2 kWh/kg, Figure 6). E-methane seems more feasible looking at existing vehicles fuelled with fossil natural gas (compressed for PCs and LCVs, liquid for HDTs). Other liquid e-fuels are more easily storable onboard, albeit with differences among them and for safety/hazard reasons. E-diesel showed the best energy density and substitutability with current fossil fuels.
- Almost all e-fuel pathways rely on water electrolysis to produce hydrogen (the simplest e-fuel) and then on its conversion to other molecules using CO2 or N2 as side reactants. Water electrolysis, particularly with AEL, is a market-ready technology, while plants for hydrogen conversion to other chemicals are still immature with only a few pilot plants. However, a huge carry-over from existing synthesis technology of the same molecules is possible, especially for methanol and ammonia. All e-fuel pathways, from input electricity to vehicle tanks, are energy-consuming processes with efficiency ranging between 0.44–0.55.
- Onboard use of e-fuel is possible both with ICEs and FCs. The internal combustion engine is a well-known device deeply developed in the last century, and many studies have been carried out with all considered e-fuels proving at least their feasibility. Hydrogen fuel cells reached a decent technology maturity with PEMFC, but many improvements are still possible. Instead, other FCs for direct use of different e-fuels are much more immature or not suitable for road transport (high-temperature FCs). It is important to remember that other pollutants (CO, NOx, PM, NH3, …) may be locally emitted with e-fuels, especially if burned in ICEs.
Author Contributions
Funding
Data Availability Statement
Conflicts of Interest
Nomenclature
| AEL | Alkaline Electrolyser |
| BEV | Battery Electric Vehicle |
| C-HEV | Complex Hybrid Electric Vehicle |
| CI | Compression Ignition |
| CNG | Compressed Natural Gas |
| DAC | Direct Air Capture |
| DME | Dimethyl Ether |
| DMFC | Direct Methanol Fuel Cell |
| EGR | Exhaust Gas Recirculation |
| FC-HEV | Fuel Cell Electric Vehicle |
| FCV | Fuel Cell Vehicle |
| FCS | Fuel Cell System |
| FT | Fischer–Tropsch |
| GHG | Greenhouse Gases |
| HDT | Heavy-duty Truck |
| HEV | Hybrid Electric Vehicle |
| LCV | Light Commercial Vehicle |
| LHV | Lower Heating Value |
| LPG | Liquefied Petroleum Gas |
| NG | Natural Gas |
| PC | Passenger Car |
| PEMEL | Proton Exchange Membrane Electrolyser |
| P-HEV | Parallel Hybrid Electric Vehicle |
| PHEV | Plug-in Hybrid Electric Vehicle |
| PM | Particulate Matter |
| PtL | Power to Liquid |
| PtX | Power to X |
| RESS | Rechargeable Energy Storage System |
| RON | Research Octane Number |
| RWGS | Reverse Water Gas Shift |
| S-HEV | Series Hybrid Electric Vehicle |
| SI | Spark Ignition |
| SNG | Synthetic Natural Gas |
| SOEL | Solid Oxide Electrolyser |
| TCO | Total Cost of Ownership |
| TRL | Technology Readiness Level |
| TTW | Tank-to-Wheels |
| WLTP | Worldwide Harmonised Light Vehicles Test Procedure |
| WTT | Well-to-Tank |
| WTW | Well-to-Wheels |
References
- United Nations. Day of 8 Billion. Available online: https://www.un.org/en/dayof8billion (accessed on 2 December 2022).
- United Nations. Climate Action COP27. Available online: https://www.un.org/en/climatechange/cop27 (accessed on 2 December 2022).
- United Nations Climate Change. Paris Agreement at COP21. Available online: https://unfccc.int/process-and-meetings/the-paris-agreement/the-paris-agreement (accessed on 2 December 2022).
- DNV. Energy Transition Outlook 2022. 2022. Available online: https://www.dnv.com/Publications/energy-transition-outlook-2022-232649 (accessed on 2 December 2022).
- Eurostat. European Statistical Dashboard. 2022. Available online: https://ec.europa.eu/eurostat/data/database (accessed on 2 December 2022).
- Istituto Superiore per la Protezione e la Ricerca Ambientale. National Inventory Report 2021. In Italian Greenhouse Gas Inventory 1990–2019; ISPRA: Bologna, Italy, 2021; Rapporti 341/21; ISBN 978-88-448-1046-7. [Google Scholar]
- JEC Tank-To-Wheels Report v5. Available online: https://publications.jrc.ec.europa.eu/repository/handle/JRC117560 (accessed on 2 December 2022).
- World Resources Institute. World Greenhouse Gas Emissions in 2018 (Sector End Use|Gas). 2021. Available online: https://www.wri.org/data/world-greenhouse-gas-emissions-2018 (accessed on 2 December 2022).
- IEA. Transport Sector CO2 Emissions by Mode in the Sustainable Development Scenario, 2000–2030, IEA, Paris. Available online: https://www.iea.org/data-and-statistics/charts/transport-sector-co2-emissions-by-mode-in-the-sustainable-development-scenario-2000-2030 (accessed on 1 February 2023).
- European Automobile Manufacturers’ Association. Vehicles in Use in Europe 2022; ACEA: Brussels, Belgium, 2022. [Google Scholar]
- European Environment Agency. New Registrations of Electric Vehicles in Europe, EEA. 2022. Available online: https://www.eea.europa.eu/ims/new-registrations-of-electric-vehicles (accessed on 2 December 2022).
- European Union. Regulation 2021/1119 of the European Parliament and of the Council of 30 June 2021; 2021. Available online: https://eur-lex.europa.eu/legal-content/EN/TXT/HTML/?uri=CELEX:32021R1119&from=EN (accessed on 1 February 2023).
- Fit for 55. Available online: https://www.consilium.europa.eu/en/policies/green-deal/eu-plan-for-a-green-transition (accessed on 2 December 2022).
- European Commission—Press Release. Proposal for a Regulation on Type-Approval of Motor Vehicles with Respect to Their Emissions and Battery Durability (Euro 7); Brussels, 10 November 2022. Available online: https://eur-lex.europa.eu/legal-content/EN/TXT/HTML/?uri=CELEX:52022PC0586&from=EN (accessed on 1 February 2023).
- Sun, C.; Zhang, H. Review of the development of first-generation redox flow batteries: Iron-chromium system. ChemSusChem 2021, 15, e202101798. [Google Scholar] [CrossRef] [PubMed]
- ISO/TR 8713; Electrically Propelled Road Vehicles—Vocabulary. Available online: https://www.iso.org/home.html (accessed on 2 December 2022).
- Wang, Y.; Moura, S.J.; Advani, S.G.; Prasad, A.K. Power management system for a fuel cell/battery hybrid vehicle incorporating fuel cell and battery degradation. Int. J. Hydrog. Energy 2019, 44, 8479–8492. [Google Scholar] [CrossRef]
- IEA. Global EV Outlook 2022; IEA: Paris, France, 2022. [Google Scholar]
- Samsung Cylindrical LCO Cell Datasheet. Available online: https://docs-emea.rs-online.com/webdocs/15d2/0900766b815d2388.pdf (accessed on 1 February 2023).
- E-one Moli Energy Cylindrical LCO Cell Datasheet. Available online: http://www.molicel.com/wp-content/uploads/DM_ICR18650M-V3-80072.pdf (accessed on 1 February 2023).
- Envinsion AESC LMO Cell Datasheet. Available online: https://pushevs.com/2017/09/08/lg-chem-will-introduce-ncm-811-battery-cells-evs-next-year/ (accessed on 1 February 2023).
- GS Yuasa LMO Battery Datasheet. Available online: http://www.gsyuasa-lp.com/SpecSheets/LIM50EN_Data_Sheet.pdf (accessed on 1 February 2023).
- Kokam Official Site, High Power Pouch NMC Cell. Available online: http://kokam.com/wp-content/uploads/2016/03/SLPB-Cell-Brochure.pdf (accessed on 1 February 2023).
- Kokam Official Site, High Energy Pouch NMC Cell. Available online: https://kokam.com/uploaded/filebox/7/cell_brochure.pdf (accessed on 1 February 2023).
- LG Cylindrical NMC Cell Datasheet. Available online: https://cdn.shopify.com/s/files/1/0674/3651/files/lg-hg2-spec-sheet.pdf (accessed on 1 February 2023).
- Samsung Cylindrical NMC Cell Datasheet. Available online: https://docs.rs-online.com/84c8/0900766b812fdd47.pdf (accessed on 1 February 2023).
- Samsung Prismatic NMC Cell Datasheet. Available online: https://files.gwl.eu/inc/_doc/attach/StoItem/7213/30118_Introduction%20of%20SDI%20EV%2094Ah%20cell_V9-2.pdf (accessed on 1 February 2023).
- Panasonic Cylindrical NCM 21700. Available online: https://www.batemo.de/products/batemo-cell-library/panasonic-tesla-model-3/ (accessed on 1 February 2023).
- Panasonic Official Site, High Energy Prismatic NCA Cell. Available online: https://industrial.panasonic.com/ww/products/batteries/secondary-batteries/lithium-ion/prismatic-type/NCA103450 (accessed on 1 February 2023).
- Samsung Official Site, NCA Cell. Available online: https://www.powerstream.com/p/INR18650-25R-datasheet.pdf (accessed on 1 February 2023).
- Winston Official Site, Prismatic LFP Cell. Available online: http://en.winston-battery.com/index.php/products/power-battery/category/lithium-ion-power-battery (accessed on 1 February 2023).
- A123 Nanophosphate High Power Cylindrical LFP Cell Datasheet. Available online: https://www.batteryspace.com/prod-specs/6610.pdf (accessed on 1 February 2023).
- GWL Prismatic LFP Datasheet. Available online: https://files.gwl.eu/inc/_doc/attach/StoItem/4091/ZG-LFP060AHA_datasheet.pdf (accessed on 1 February 2023).
- CATL Prismatic LFP Datasheet. Available online: https://www.lifepo4-battery.com/Products/CATL-Battery/CATL-161Ah-battery.html (accessed on 1 February 2023).
- Toshiba Official Site, High Power Prismatic LTO Cell. Available online: https://www.scib.jp/en/product/cell.htm (accessed on 1 February 2023).
- GWL Cylindrical LTO Cell Datasheet. Available online: https://files.ev-power.eu/inc/_doc/attach/StoItem/7015/GWL_LTO1865_Rechargeable.pdf (accessed on 1 February 2023).
- Olabi, A.G.; Sayed, E.T.; Wilberforce, T.; Jamal, A.; Alami, A.H.; Elsaid, K.; Rahman, S.M.A.; Shah, S.K.; Abdelkareem, M.A. Metal-Air Batteries—A Review. Energies 2021, 14, 7373. [Google Scholar] [CrossRef]
- Gelman, D.; Shartsev, B.; Ein-Eli, Y. Aluminum-Air Battery Based on an Ionic Liquid Electrolyte. J. Mater. Chem. 2014, 2, 20237–20242. [Google Scholar] [CrossRef]
- Weinrich, H.; Durmus, Y.E.; Tempel, H.; Kungl, H.; Eichel, R.A. Silicon and Iron as Resource-Efficient Anode. Materials 2019, 12, 2134. [Google Scholar] [CrossRef] [PubMed]
- Montanino, M.; Prosolini, P.P. Batterie Metallo Aria: Stato Dell’arte e Prospettive; ENEA: Rome, Italy, 2013. [Google Scholar]
- Great River Energy Official Site. Available online: https://greatriverenergy.com/company-news/battery-project-includes-minnesota-flair/ (accessed on 1 February 2023).
- Wang, C.; Yu, Y.; Niu, J.; Liu, Y.; Bridges, D.; Liu, X.; Pooran, J.; Zhang, Y.; Hu, A. Recent Progress of Metal–Air Batteries—A Mini Review. Appl. Sci. 2019, 9, 2787. [Google Scholar] [CrossRef]
- CATL Official Site. Available online: https://www.catl.com/en/news/665.html (accessed on 9 December 2022).
- He, M.; Davis, R.; Chartouni, D.; Johnson, M.; Abplanalp, M.; Troendle, P.; Suetterlin, R.P. Assessment of the first commercial Prussian blue based sodium-ion battery. J. Power Sources 2022, 548, 232036. [Google Scholar] [CrossRef]
- Boaretto, N.; Garbayo, I.; Valiyaveettil-SobhanRaj, S.; Quintela, A.; Li, C.; Casas-Cabanas, M.; Aguesse, F. Lithium solid-state batteries: State-of-the-art and challenges for materials. J. Power Sources 2021, 502, 229919. [Google Scholar] [CrossRef]
- Randau, S.; Weber, D.A.; Kötz, O.; Koerver, R.; Braun, P.; Weber, A.; Ivers-Tiffée, E.; Adermann, T.; Kulisch, J.; Zeier, W.G.; et al. Benchmarking the performance of all-solid-state. Nat. Energy 2020, 5, 259–270. [Google Scholar] [CrossRef]
- Nam, Y.J.; Oh, D.Y.; Jung, S.H.; Jung, Y.S. Toward practical all-solid-state lithium-ion batteries with high energy density and safety: Comparative study for electrodes fabricated by dry- and slurry-mixing processes. J. Power Sources 2018, 375, 93–101. [Google Scholar] [CrossRef]
- Saurabh, D.; Yerukola, P. Solid State Battery Market Report; 2022; p. 230; report code: A00398. Available online: https://www.alliedmarketresearch.com/solid-state-batteries-market (accessed on 1 February 2023).
- Bandyopadhyay, S.; Nandan, B. A review on design of cathode, anode and solid electrolyte for true all-solid-state lithium sulfur batteries. Mater. Today Energy 2023, 31, 101201. [Google Scholar] [CrossRef]
- European Union. Directive 2018/2001 of the European Parliament and of the Council of 11 December 2018 on the Promotion of the Use of Energy from Renewable Sources; Official Journal of the European Union, 21 December 2018. Available online: https://eur-lex.europa.eu/legal-content/EN/TXT/HTML/?uri=CELEX:32018L2001&from=EN (accessed on 1 February 2023).
- Liponi, A.; Pasini, G.; Baccioli, A.; Ferrari, L. Hydrogen from renewables: Is it always green? The Italian scenario. Energy Convers. Manag. 2023, 276, 116525. [Google Scholar] [CrossRef]
- Tremel, A. Electricity-Based Fuels; Springer International Publishing: Cham, Switzerland, 2018; pp. 39–41. [Google Scholar]
- Sundén, B. (Ed.) Hydrogen, Batteries and Fuel Cells. In Chapter 3-Hydrogen; Academic Press: New York, NY, USA, 2019; pp. 37–55. [Google Scholar]
- NOAA. CAMEO Chemicals Version 2.8.0 rev 1. Available online: https://cameochemicals.noaa.gov/ (accessed on 1 February 2023).
- DNV. White Paper: Ammonia as a Marine Fuel; DNV GL—Group Technology & Research 2020. Available online: https://www.dnv.com/Publications/ammonia-as-a-marine-fuel-191385 (accessed on 1 February 2023).
- Hyundai NEXO Tank Supplier. Available online: https://hyfindr.com/marketplace/components/hydrogen-tanks/hydrogen-type-4-cylinder-700-bar-103l/ (accessed on 9 December 2022).
- Sheeld, J.; Martin, K.; Folkson, R. Alternative Fuels and Advanced Vehicle Technologies for Improved Environmental Performance. In 5-Electricity and Hydrogen as Energy Vectors for Transportation Vehicles; Folkson, R., Ed.; Woodhead Publishing: Cambridge, UK, 2014; pp. 117–137. [Google Scholar]
- Kim, H.; Haider, J.; Qyyum, M.A.; Lim, H. Mixed refrigerant–based simplified hydrogen liquefaction process: Energy, Exergy, economic, and environmental analysis. J. Clean. Prod. 2022, 367, 132947. [Google Scholar] [CrossRef]
- Baccioli, A.; Bargiacchi, E.; Barsali, S.; Ciambellotti, A.; Fioriti, D.; Giglioli, R.; Pasini, G. Cost effective power-to-X plant using carbon dioxide from a geothermal plant to increase renewable energy penetration. Energy Convers. Manag. 2020, 226, 113494. [Google Scholar] [CrossRef]
- Hannula, I.; Kurkela, E. Liquid Transportation Fuels Via Large-Scale Fluidised-Bed Gasification of Lignocellulosic Biomass; VTT Technical Research Centre of Finland: Espoo, Finland, 2013. [Google Scholar]
- Prussi, M.; Yugo, M.; Padella, M.; Edwards, R.; Lonza, L.; De Prada, L. JEC Well-to-Tank Report v5: Annexes; Hamje, H., Ed.; EUR 30269 EN; Publications Office of the European Union: Luxembourg, 2020; ISBN 978-92-76-21707-7. [Google Scholar] [CrossRef]
- Shiva Kumar, S.; Lim, H. An overview of water electrolysis technologies for Green Hydrogen production. Energy Rep. 2022, 8, 13793–13813. [Google Scholar] [CrossRef]
- Buttler, A.; Spliethoff, H. Current status of water electrolysis for energy storage, grid balancing and sector coupling via power-to-gas and power-to-liquids: A Review. Renew. Sustain. Energy Rev. 2018, 82, 2440–2454. [Google Scholar] [CrossRef]
- Sebbahi, S.; Nabil, N.; Alaoui-Belghiti, A.; Laasri, S.; Rachidi, S.; Hajjaji, A. Assessment of the three most developed water electrolysis technologies: Alkaline water electrolysis, proton exchange membrane and solid-oxide electrolysis. Mater. Today Proc. 2022, 66, 140–145. [Google Scholar] [CrossRef]
- Bos, M.J.; Kersten, S.R.A.; Brilman, D.W.F. Wind power to methanol: Renewable methanol production using electricity, electrolysis of water and CO2 Air Capture. Appl. Energy 2020, 264, 114672. [Google Scholar] [CrossRef]
- MCPHY Technical Specification. Available online: https://mcphy.com/en/equipment-services/electrolyzers/ (accessed on 1 February 2023).
- IRENA. Green Hydrogen Cost Reduction: Scaling up Electrolysers to Meet the 1.5 °C Cimate Goal, Abu Dhabi. 2020. Available online: https://www.irena.org/publications/2020/Dec/Green-hydrogen-cost-reduction (accessed on 1 February 2023).
- Wallner, T.; Lohse-Busch, H.; Gurski, S.; Duoba, M.; Thiel, W.; Martin, D.; Korn, T. Fuel economy and emissions evaluation of bmw hydrogen 7 mono-fuel demonstration vehicles. Int. J. Hydrog. Energy 2008, 33, 7607–7618. [Google Scholar] [CrossRef]
- Bao, L.-Z.; Sun, B.-G.; Luo, Q.-H.; Li, J.-C.; Qian, D.-C.; Ma, H.-Y.; Guo, Y.-J. Development of a turbocharged direct-injection hydrogen engine to achieve clean, efficient, and high-power performance. Fuel 2022, 324, 124713. [Google Scholar] [CrossRef]
- DNV. Assessment of Selected Alternative Fuels and Technologies; DNV GL—Group Technology & Research. 2019. Available online: https://www.dnv.com/maritime/publications/alternative-fuel-assessment-download.html (accessed on 1 February 2023).
- Fan, L.; Tu, Z.; Chan, S.H. Recent development of hydrogen and Fuel Cell Technologies: A Review. Energy Rep. 2021, 7, 8421–8446. [Google Scholar] [CrossRef]
- Gherairi, S. Hybrid Electric Vehicle: Design and control of a hybrid system (fuel cell/battery/ultra-capacitor) supplied by Hydrogen. Energies 2019, 12, 1272. [Google Scholar] [CrossRef]
- IHS Chemicals. Global Methanol Weekly Report 23 March 2012, IHS Chemical Market Advisory Service Issue (2012); IHS Chemicals: London, UK, 2012; p. 1509. [Google Scholar]
- Goehna, H.; Konig, P. Producing methanol from CO2. Chemtech 1994, 24, 36–39. [Google Scholar]
- Dieterich, V.; Buttler, A.; Hanel, A.; Spliethoff, H.; Fendt, S. Power-to-liquid via synthesis of methanol, DME or Fischer–Tropsch-fuels: A Review. Energy Environ. Sci. 2020, 13, 3207–3252. [Google Scholar] [CrossRef]
- Kauw, M.; Benders, R.M.J.; Visser, C. Green methanol from hydrogen and carbon dioxide using geothermal energy and/or hydropower in Iceland or excess renewable electricity in Germany. Energy 2015, 90, 208–217. [Google Scholar] [CrossRef]
- Hong, W.Y. A techno-economic review on carbon capture, utilisation and storage systems for achieving a net-zero CO2 emissions future. Carbon Capture Sci. Technol. 2022, 3, 100044. [Google Scholar] [CrossRef]
- Verhelst, S.; Turner, J.W.G.; Sileghem, L.; Vancoillie, J. Methanol as a fuel for internal combustion engines. Prog. Energy Combust. Sci. 2019, 70, 43–88. [Google Scholar] [CrossRef]
- Ramli, Z.A.; Shaari, N.; Saharuddin, T.S. Progress and major barriers of nanocatalyst development in direct methanol fuel cell: A Review. Int. J. Hydrog. Energy 2022, 47, 22114–22146. [Google Scholar] [CrossRef]
- EBTP-SABS, Biomass to Liquids (BtL). 2016. Available online: http://www.biofuelstp.eu/btl.html (accessed on 1 February 2023).
- Riedel, T.; Schaub, G.; Jun, K.-W.; Lee, K.-W. Kinetics of CO2 Hydrogenation on a K-Promoted Fe Catalyst. Ind. Eng. Chem. Res. 2001, 40, 1355–1363. [Google Scholar] [CrossRef]
- Zhang, C.; Jun, K.-W.; Ha, K.-S.; Lee, Y.-J.; Kang, S.C. Efficient utilization of greenhouse gases in a gas-to-liquids process combined with CO2/steam-mixed reforming and Fe-based Fischer-Tropsch synthesis. Environ. Sci. Technol. 2014, 48, 8251–8257. [Google Scholar] [CrossRef]
- Nordic Electro Fuel—Produce Sustainable Aviation Fuel. Available online: https://nordicelectrofuel.no/ (accessed on 1 February 2023).
- Sunfire-Synlink Factsheet. Available online: https://www.sunfire.de/files/sunfire/images/content/Produkte_Technologie/factsheets/Sunfire-SynLink_FactSheet.pdf (accessed on 1 February 2023).
- Rouwenhorst, K.H.R.; Van der Ham, A.G.J.; Mul, G.; Kersten, S.R.A. Islanded Ammonia Power Systems: Technology Review & Conceptual Process Design. Renew. Sustain. Energy Rev. 2019, 114, 109339. [Google Scholar] [CrossRef]
- Zhang, H.; Wang, L.; Van herle, J.; Maréchal, F.; Desideri, U. Techno-economic comparison of green ammonia production processes. Appl. Energy 2020, 259, 114135. [Google Scholar] [CrossRef]
- Thomas, L. Hardenburger, Matthew Ennis. In Nitrogen; John Wiley & Sons, Ltd: London, UK, 2005. [Google Scholar]
- Sánchez, A.; Martín, M. Scale up and scale down issues of renewable ammonia plants: Towards modular design. Sustain. Prod. Consum. 2018, 16, 176–192. [Google Scholar] [CrossRef]
- Chiong, M.-C.; Chong, C.T.; Ng, J.-H.; Mashruk, S.; Chong, W.W.; Samiran, N.A.; Mong, G.R.; Valera-Medina, A. Advancements of combustion technologies in the ammonia-fuelled engines. Energy Convers. Manag. 2021, 244, 114460. [Google Scholar] [CrossRef]
- Dimitriou, P.; Javaid, R. A review of ammonia as a compression ignition engine fuel. Int. J. Hydrog. Energy 2020, 45, 7098–7118. [Google Scholar] [CrossRef]
- Frigo, S.; Gentili, R. Analysis of the behaviour of a 4-stroke SI engine fuelled with ammonia and hydrogen. Int. J. Hydrog. Energy 2013, 38, 1607–1615. [Google Scholar] [CrossRef]
- Wang, B.; Li, T.; Gong, F.; Othman, M.H.; Xiao, R. Ammonia as a green energy carrier: Electrochemical synthesis and direct ammonia fuel cell—A comprehensive review. Fuel Process. Technol. 2022, 235, 107380. [Google Scholar] [CrossRef]
- An, X.; Zuo, Y.-Z.; Zhang, Q.; Wang, D.-z.; Wang, J.-F. Dimethyl ether synthesis from CO2 hydrogenation on a CuO−ZnO−Al2O3−ZrO2/HZSM-5 bifunctional catalyst. Ind. Eng. Chem. Res. 2008, 47, 6547–6554. [Google Scholar] [CrossRef]
- Catizzone, E.; Bonura, G.; Migliori, M.; Frusteri, F.; Giordano, G. CO2 recycling to dimethyl ether: State-of-the-art and Perspectives. Molecules 2017, 23, 31. [Google Scholar] [CrossRef]
- Arcoumanis, C.; Bae, C.; Crookes, R.; Kinoshita, E. The potential of di-methyl ether (DME) as an alternative fuel for compression-ignition engines: A Review. Fuel 2008, 87, 1014–1030. [Google Scholar] [CrossRef]
- Park, S.H.; Lee, C.S. Applicability of dimethyl ether (DME) in a compression ignition engine as an alternative fuel. Energy Convers. Manag. 2014, 86, 848–863. [Google Scholar] [CrossRef]
- Im, J.-Y.; Kim, B.-S.; Choi, H.-G.; Cho, S.M. Effect of pressure for direct fuel cells using DME-based fuels. J. Power Sources 2008, 179, 301–304. [Google Scholar] [CrossRef]
- Kupecki, J. Off-design analysis of a micro-CHP unit with solid oxide fuel cells fed by DME. Int. J. Hydrog. Energy 2015, 40, 12009–12022. [Google Scholar] [CrossRef]
- Zhang, T.; Ou, K.; Jung, S.; Choi, B.; Kim, Y.-B. Dynamic analysis of a PEM fuel cell hybrid system with an on-board dimethyl ether (DME) steam reformer (SR). Int. J. Hydrog. Energy 2018, 43, 13521–13531. [Google Scholar] [CrossRef]
- Sun, D.; Simakov, D.S.A. Thermal management of a Sabatier reactor for CO2 conversion into CH4: Simulation-based analysis. J. CO2 Util. 2017, 21, 368–382. [Google Scholar] [CrossRef]
- Pasini, G.; Baccioli, A.; Ferrari, L.; Antonelli, M.; Frigo, S.; Desideri, U. Biomethane grid injection or biomethane liquefaction: A technical-economic analysis. Biomass Bioenergy 2019, 127, 105264. [Google Scholar] [CrossRef]
- Transport & Environment. In Electrofuels? Yes, We can … if We’re Efficient, Annex II; Brussels, Belgium, 2020; Available online: https://www.transportenvironment.org/wp-content/uploads/2020/12/2020_12_Briefing_feasibility_study_renewables_decarbonisation.pdf (accessed on 1 February 2023).
- Ash, N.; Davies, A.; Newton, C. Ricardo Report. In Renewable Electricity Requirements to Decarbonise Transport in Europe with Electric Vehicles, Hydrogen and Electrofuels; 2020; p. 4; Ref: ED 13966 Ricardo plc, Shoreham Technical Centre, Old Shoreham Road, Shoreham-by-Sea, West Sussex, BN43 5FG, UK. Available online: https://www.transportenvironment.org/wp-content/uploads/2021/07/2020_Report_RES_to_decarbonise_transport_in_EU.pdf (accessed on 1 February 2023).
- Moore, C.; Brown, S.; MacDonald, P.; Ewen, M.; Broadbent, H. European Electricity Review 2022; Ember: London, UK, 2022. [Google Scholar]


| Fuel Consumption [L/100 km] | Fuel Consumption [kWhfuel/100 km] | CO2 Emission [gCO2/km] | ||||
|---|---|---|---|---|---|---|
| Urban | Rural | Highway | Total | |||
| Passenger Cars SI | 10.58 | 5.63 | 6.26 | 6.90 | 65.6 | 161 |
| Passenger Cars CI | 8.41 | 5.43 | 5.48 | 5.93 | 63.6 | 155 |
| Light Commercial Vehicles SI | 18.28 | 7.71 | 7.44 | 10.30 | 97.8 | 241 |
| Light Commercial Vehicles CI | 11.40 | 7.05 | 9.22 | 8.57 | 91.9 | 224 |
| Heavy Duty Trucks CI | 33.95 | 21.71 | 22.73 | 23.43 | 251.2 | 611 |
| Buses SI | 56.98 | 38.21 | - | 55.12 | 523.7 | 1290 |
| Buses CI | 38.37 | 24.79 | 20.91 | 24.79 | 265.8 | 647 |
| 2-wheelers SI | 4.14 | 3.58 | 4.66 | 3.97 | 37.7 | 93 |
| Chemistry Type | “+” Pin Material | “-” Pin Material | Specific Energy (Wh/kg) | Energy Density (Wh/L) | Specific Power (W/kg) | Power Density (W/L) |
|---|---|---|---|---|---|---|
| Li-Co Oxide (LCO) | LiCoO2 | Graphite | 200 [19] 222 [20] | 580 [19] 631 [20] | 400 [19] - | 1100 [19] - |
| Li-Mn Oxide (LMO) | LiMn2O4 | Graphite | 157 [21] 78 [22] | 317 [21] 114 [22] | - 480 [22] | - 700 [22] |
| Li-Ni-Mn-Co Oxide (NMC) | LiNiMnCoO2 | Graphite | 146 [23] 192 [24] 230 [25] 160 [26] 165 [27] 250 [28] | 270 [23] 410 [24] 650 [25] 436 [26] 356 [27] 707 [28] | 560 [24] 1500 [25] 2100 [23] 1777 [26] 1666 [27] 943 [28] | 1200 [24] 3800 [23] 4400 [25] 4850 [26] 3608 [27] 2660 [28] |
| Li-Ni-Co-Al Oxide (NCA) | LiNiCoAlO2 | Graphite | 200 [29] 207 [30] | 460 [29] 545 [30] | - 1500 [30] | - 4000 [30] |
| Li-Fe Phosphate (LFP) | LiFePO4 | Graphite | 86 [31] 108 [32] 124 [33] 166 [34] | 140 [31] 240 [32] 240 [33] 362 [34] | 860 [31] 2600 [32] 340 [33] 500 [34] | 1400 [31] 5700 [32] 660 [33] 1088 [34] |
| Li-Ti Oxide (LTO) | - | Li4Ti5O12 | 46 [35] 80 [36] | 82 [35] 190 [36] | 1600 [36] 2800 [35] | 3600 [36] 4900 [35] |
| Chemistry Type | Specific Energy (Wh/kg) | Energy Density (Wh/L) | Specific Power (W/kg) | Cycles |
|---|---|---|---|---|
| Al-air | 300–500 [37] 500 [38] 925 [38] | 1350 [38] 1692 [38] | - | - |
| Li-air | 362 [38] 1700 [37] | 194 [38] | - | 75 [42] >250 [37] |
| Zn-air | 90–120 [18] 300 [38] 350–500 [37] | 2150 [38] | - | >75 [37] |
| Na-air | 1600 [37] | - | 300 [37] | 40 [37] >20 [37] |
| Mg-air | 400–700 [37] 3900 [37] | 14,000 [37] | - | <10 [37] |
| Fe-air | 50–75 [37] 300–500 [39] | - | - | 3500 [37] |
| Si-air | 140 [39] 1600 [39] | - | - | - |
| Sn-air | 860 [37] | - | - | - |
| Chemistry Type | Specific Energy (Wh/kg) | Energy Density (Wh/L) | Specific Power (W/kg) | Power Density (W/L) | Cycles |
|---|---|---|---|---|---|
| Na-ion | 160 [43] 10 [44] 1 23 [44] 2 | - | 1250 | 350 | >40,000 |
| Solid Electrolyte | “+” Pin Material | “-” Pin Material | Specific Energy (Wh/kg) | Specific Power (W/kg) | Cycles |
|---|---|---|---|---|---|
| Li10SiP2S12 | NCM111 | Li | 14 | 1.8 | 75 |
| Li10GeP2S12 | LiCoO2 | Li | 20 | 20 | 500 |
| 75Li2S-25P2S5 | NCA | Li-C | 5 | 1.0 | 100 |
| Li7P2S8I | NCM622 | Li | 42 | 34 | 40 |
| Li6PS5Cl | NCM622 | Graphite | 190 | 7.9 | 25 |
| Li3PS4 glass | NCM111 | Graphite | 115 | 4.0 | 25 |
| 75Li2S–25P2S5 | NCM111 | Graphite | 155 | 9.2 | 30 |
| Li10GeP2S12 & Li9.6P3S12 | LiCoO2 | Graphite | 33 | 3745.0 | 25 |
| Li10GeP2S12 & LiI-Li2S–P2S5 | LiCoO2 | Graphite | 180 | 175.7 | 25 |
| 80Li2S–20P2S5 | NCA | Graphite | 39 | 42.6 | 25 |
| Li6PS5Cl | LiCoO2 | Graphite | 29 | 33.9 | 30 |
| Li6.6P0.4Ge0.6S5I | NCM622 | Li4Ti5O12 | 27 | 48.0 | 60 |
| Li10GeP2S12 | Co9S8 | Li | 17 | 64.9 | 25 |
| Li10GeP2S12 | NiS–CNT | Li | 22 | 28.8 | 25 |
| PEO–LiTFSI & Al-Li6.75La3Zr1.75Ta0.25O12 | LiFePO4 | Li | 288 | 7.1 | 60 |
| Li7La3Zr2O12 | LiCoO2 | Li | 141 | 278.8 | 50 |
| PEO–LiTFSI | LiFePO4 | Li | 282 | 100.3 | 70 |
| SI–PEO–LiTFSI | LiFePO4 | Li | 168 | 91.4 | 70 |
| SI–PEO–LiTFSI | LiFePO4 | Li | 120 | 153.6 | 80 |
| Chemical Formula | LHV [MJ/kg] | LHV [kWh/kg] | Density @15 °C, 1 atm [kg/m3] | LHV @15 °C, 1 atm [kWh/L] | Explosivity Range | Autoignition Temperature [°C] | |
|---|---|---|---|---|---|---|---|
| E-Hydrogen | H2 | 120.0 | 33.3 | 0.084 | 0.0028 | 4–75% | 560 |
| E-Methanol | CH₃OH | 20.1 | 5.6 | 791 | 4.4164 | 6–36.5% | 420 |
| E-Diesel | CnH2n+2 | 43.2 | 12.0 | 846 | 10.1520 | 1–6% | 225 |
| E-Ammonia | NH3 | 18.6 | 5.2 | 0.72 | 0.0037 | 16–25% | 630 |
| E-DME | CH3OCH3 | 28.9 | 8.0 | 1.96 | 5.3385 | 2–50% | 350 |
| E-Methane | CH4 | 49.9 | 13.8 | 0.671 | 0.0093 | 5–15% | 635 |
| Theoretical Conversion Efficiency from Hydrogen | Typical Plant Conversion Efficiency from Hydrogen | Thermophysical Conversion for Storage [kWh/kg] | Typical Overall PtX Efficiency | E-Fuel Transportation to Final User [kWh/kWhfuel] | WTT Efficiency | |
|---|---|---|---|---|---|---|
| E-Hydrogen (700 bar) | - | - | 5.5 | 0.60 | 0.09 | 0.55 |
| E-Hydrogen (liquid) | - | - | 11 | 0.54 | 0.1 | 0.49 |
| E-Methanol | 0.886 | 0.797 | - | 0.53 | 0.07 | 0.49 |
| E-Diesel | 0.834 | 0.693 | - | 0.46 | 0.05 | 0.44 |
| E-Ammonia | 0.870 | 0.783 | - | 0.52 | 0.07 | 0.48 |
| E-DME | 0.915 | 0.824 | - | 0.55 | 0.07 | 0.51 |
| E-Methane (220 bar) | 0.825 | 0.743 | 0.15 | 0.50 | 0.07 | 0.47 |
| E-Methane (liquid) | 0.825 | 0.743 | 0.5 | 0.49 | 0.07 | 0.46 |
| AEL | PEMEL | SOEL | |
|---|---|---|---|
| Temperature range [°C] | 60–90 | 50–90 | 500–1000 |
| Pressure range [barA] | 2–30 | 15–30 | <30 |
| Energy consumption [kWh/kgH2] | 50–73 | 50–73 | >42 |
| Lifetime of stack [h] | <90,000 | <20,000 | <40,000 |
| Lifetime of system [year] | 20–30 | 10–20 | - |
| Capital cost [€/kW] | 800–1500 | 900–2200 | <2000 |
| Technology readiness level [TRL] | 9 | 5–7 | 3–5 |
| CO2 Capture Technology | CO2 Removal Efficiency [%Vol] | Energy Consumption [kWh/kgCO2] |
|---|---|---|
| Industrial Separation | 90 | 1.38 |
| Postcombustion | 90 | 1.15 |
| Precombustion | 90 | 0.93 |
| Oxy-Fuel Combustion | >90 | 1.13 |
| Direct Air Capture (DAC) | 85–93 | 1.45 |
| Powertrain Type | ENERGY VECTOR | WTT Efficiency | TTW Efficiency | WTW Efficiency | Specific Electricity Consumption for Medium-Sized PCs in WLTP [kWh/100 km] |
|---|---|---|---|---|---|
| BEV | Electricity | 0.85 | 0.90 | 0.77 | 19.5 |
| ICE-HEV (plug-in excluded) | E-Hydrogen 700 bar | 0.55 | 0.35 | 0.19 | 78.5 |
| E-Hydrogen (liquid) | 0.49 | 0.35 | 0.17 | 88.2 | |
| E-Methanol | 0.49 | 0.35 | 0.17 | 86.9 | |
| E-Diesel | 0.44 | 0.35 | 0.15 | 98.1 | |
| E-Ammonia | 0.48 | 0.35 | 0.17 | 88.6 | |
| E-DME | 0.51 | 0.35 | 0.18 | 83.8 | |
| E-Methane 220 bar | 0.47 | 0.35 | 0.16 | 92.2 | |
| E-Methane liquid | 0.46 | 0.35 | 0.16 | 94.0 | |
| FC-HEV | E-Hydrogen 700 bar | 0.55 | 0.5 | 0.27 | 54.9 |
| E-Hydrogen (liquid) | 0.49 | 0.5 | 0.24 | 61.7 | |
| E-Methanol | 0.49 | 0.5 | 0.25 | 60.9 | |
| E-Ammonia | 0.48 | 0.5 | 0.24 | 62.0 |
Disclaimer/Publisher’s Note: The statements, opinions and data contained in all publications are solely those of the individual author(s) and contributor(s) and not of MDPI and/or the editor(s). MDPI and/or the editor(s) disclaim responsibility for any injury to people or property resulting from any ideas, methods, instructions or products referred to in the content. |
© 2023 by the authors. Licensee MDPI, Basel, Switzerland. This article is an open access article distributed under the terms and conditions of the Creative Commons Attribution (CC BY) license (https://creativecommons.org/licenses/by/4.0/).
Share and Cite
Pasini, G.; Lutzemberger, G.; Ferrari, L. Renewable Electricity for Decarbonisation of Road Transport: Batteries or E-Fuels? Batteries 2023, 9, 135. https://doi.org/10.3390/batteries9020135
Pasini G, Lutzemberger G, Ferrari L. Renewable Electricity for Decarbonisation of Road Transport: Batteries or E-Fuels? Batteries. 2023; 9(2):135. https://doi.org/10.3390/batteries9020135
Chicago/Turabian StylePasini, Gianluca, Giovanni Lutzemberger, and Lorenzo Ferrari. 2023. "Renewable Electricity for Decarbonisation of Road Transport: Batteries or E-Fuels?" Batteries 9, no. 2: 135. https://doi.org/10.3390/batteries9020135