Article

Research on Bionic Fish Scale Channel for Optimizing Thermal Performance of Liquid Cooling Battery Thermal Management System

1
International College of Engineering, Changsha University of Science & Technology, Changsha 410114, China
2
College of Automotive and Mechanical Engineering, Changsha University of Science & Technology, Changsha 410114, China
3
Hunan Key Laboratory of Smart Roadway and Cooperative Vehicle-Infrastructure Systems, Changsha 410114, China
*
Author to whom correspondence should be addressed.
Batteries 2023, 9(2), 134; https://doi.org/10.3390/batteries9020134
Submission received: 17 December 2022 / Revised: 7 February 2023 / Accepted: 11 February 2023 / Published: 14 February 2023
(This article belongs to the Special Issue Thermal Management System for Lithium-Ion Batteries)

Abstract

:
Liquid cooling battery thermal management systems (BTMSs) are prevalently used in electric vehicles (EVs). With the use of fast charging and high-power cells, there is an increasing demand on thermal performance. In this context, a bionic fish scale (BFS) channel structure optimization design method is proposed to optimize the thermal performance. The effects of different structural parameters of the liquid cooling plate in BTMS on its cooling performance, including BFS notch diameter (D), BFS notch depth (H), and BFS notch spacing (S), are investigated. To minimize the maximum temperature ( T m a x ) and the maximum temperature difference (Δ T m a x ) as optimization indicators, experimental tests and numerical calculations are performed for a battery pack consisting of 36 square cells. Sixteen sets of thermal performance are discussed for different structural parameters in the transient thermal fluid simulation by using orthogonal tests. Under the optimal structural parameters, T m a x decreases by 1.61 °C (10.8%) and Δ T m a x decreases by 0.43 °C (16.7%). In addition, the maximum increase in outlet flow velocity is 2.72% and the pressure is reduced by 4.98%. Therefore, the proposed BTMS will have effective cooling performance in high-power dissipation.

1. Introduction

In recent years, there is an increasing emphasis on the development and use of clean energy because of the rising C O 2 emissions. As the transportation industry with high emissions, EV is rapidly developing and rising due to their clean, emission-reducing and energy-efficient characteristics [1]. As the heart of EV, the working condition and performance of power battery largely determines the performance of EV. Compared with other batteries, lithium-ion batteries are widely used in EV today due to their high energy density [2], and the battery’s performance is closely associated with its temperature and temperature difference [3]. If battery temperature can be controlled at 20–50 °C and the temperature difference can be controlled below 5 °C [4], the battery will show good working performance and long service life. However, its internal violent chemical reaction makes the temperature difficult to control. Too high a temperature will trigger the side reactions in it, which will result in thermal runaway and explosion. Therefore, there is a need to develop an efficient BTMS for effective heat dissipation of the battery to ensure that it is maintained at an optimal operating condition temperature.
Nowadays, BTMS based on different cooling media have been developed, which are divided into four main categories: air cooling [5,6], liquid cooling [7,8], phase change material (PCM) cooling [9,10] and heat pipe cooling [11,12]. However, PCM and heat pipe technologies are not yet mature enough to be applied to BTMS due to thermal saturation [13] and heat transfer limit [14]. Air cooling has been developed earlier as well as applied to BTMS due to its simple structure and lower cost. Zhang et al. [15] proposed a Z-parallel air-cooling model with an infinite number of secondary outlets, and the effects of three parameters, namely the location, number and width of outlets, on the cooling performance of BTMS were investigated. However, due to the increasing thermal power density demand of the battery pack, the cooling efficiency of air cooling has difficulty in meeting its cooling requirements.
In contrast to the other cooling methods, liquid cooling has become a preferred option [16] and is widely used in industrial manufacturing. Pack thermal performance can be improved by optimizing cooling strategies and designing different liquid cooling plate configurations [17]. Kong et al. [18] proposed a method to control the flow channel inlet temperature and liquid flow velocity by using factors such as phase change material temperature. This method improved the ability of the battery pack to adapt to different ambient temperatures and reduced the power loss. Gao et al. [19] proposed a gradient channel flow channel design that can change the monotonic rise characteristics of temperature in the flow channel. The temperature difference in the gradient channel was reduced by 79.2% compared to the uniform large channel and by 60.2% compared to the uniform small channel. Wang et al. [20] improved the microchannel parameters and flow velocity. The T m a x of the optimized pack was reduced by 20%. Tang et al. [21] proposed a lightweight liquid cooling structure and investigated the cooling performance at different inlet velocities, discharge rates and flow channel inner diameters. The structure design was optimized based on the results of the study to reduce T m a x and Δ T m a x to 34.97 and 4.04 °C, respectively. Although these research results are excellent, they are not of high reference value for industrial manufacturing applications because they are models constructed under ideal parameters.
When optimizing liquid cooling in industrial manufacturing, people are often inspired by the clever construction of living organisms in nature to develop relevant bionic structures [22]. Liu et al. [23] proposed a flow channel structure with bionic leaf vein branching. The T m a x of BLVB channel with optimal parameters can be reduced by 0.23 °C compared to the unoptimized BLVB channel and 1.12 °C compared to the linear channel. Wen et al. [24] proposed a honeycomb cell BTMS, which included bionic microchannels and phase change materials. The T m a x of the battery pack was kept stable between 39.0 °C and 3.5 °C using the estimated values from the BP model. Wang et al. [25] proposed a bionic spider web channel. The structure utilizes the heat dissipation structure of a spider web and exhibits excellent thermal performance. An et al. [26], inspired by the growth pattern of kidney glomeruli, investigated the effects of outer diameter, number of layers of bionic microchannels, liquid flow velocity, and channel arrangement on the maximum cell discharge rate of 4C by simulations and physical experiments. The T m a x can be adjusted at 37.28 °C and 36.99 °C. The intercellular temperature differences are 4.06 °C and 4.21 °C for discharge ratios of 4C and 5C, respectively. These bionic designs can produce good thermal performance optimization while taking into account the possibility of practical industrial manufacturing applications. However, they are often difficult to apply as well due to the complexity of their structural processing.
Although there have been many previous studies and good results around liquid cooling [27,28], the actual engineering has put forward higher demands on the cooling performance of BTMS with the increasing energy density of the cores. The contemporary industrial manufacturing not only needs research methods to reduce the T m a x and Δ T m a x , but also needs these researches to fit and apply to the industrial manufacturing practice. However, the complex structure and theoretical experiments of many current BTMS studies with excellent results make it difficult to apply these studies in practice. Moreover, the trend in the field of thermal management is structural optimization and improved cooling efficiency [29]. Considering the excellent thermal performance of bionic structures and the possibility of practical industrial manufacturing processing, it is necessary to develop a liquid cooling structure optimization with simple structure and excellent results.
In this context, this study innovatively proposes an improvement of the liquid cooling plate structure based on the BFS structure. The coolant generates vortex flow in this structure, which increases the coolant flow velocity and reduces the flow pressure inside the liquid cooling plate. Unlike the complex theoretical model mentioned above, it can be processed directly by stamping method. In the study, orthogonal experiments are designed for three parameters of D, H and S of the BFS structure. The thermal performance of BTMS in orthogonal experiments with various structural parameters and the correlation between the parameters are analyzed using transient thermal fluid simulation to provide a reference for the design of structural parameters of liquid cooling plate with BFS channel. At last, the mechanism of action of BFS flow channel is studied and some validation is done.

2. Model Description

The optimized battery pack model based on the BFS structure is constructed, as shown in Figure 1a. The battery pack is composed of 36 lithium batteries with a capacity of 50 Ah in series. The electrodes on both sides of each cell are connected by series connection. The optimized liquid cooling plate is connected to the bottom of the cell by a heat-conducting pad. This liquid cooling plate consists of an inlet and an outlet. The flow channel is a serpentine flow channel [30], which is commonly used in industrial manufacturing today, and a BFS notch is added to it. The coolant in the liquid cooling plate is water, and its good specific heat capacity can effectively achieve the heat dissipation effect [31]. The coolant entering the liquid cooling plate is heat exchanged with the battery through the internal serpentine flow channel, and the heated coolant is discharged through the outlet. It is essential to note that the coolant flow shall enter from the blunt tip of the BFS notch as a way to ensure the effectiveness of this optimized structure, as shown in Figure 1b. Due to this structure, this liquid cooling system can reduce both the maximum pack temperature and the pack temperature inhomogeneity. It is also highly expandable, allowing for rapid modular design for different pack sizes. The entire battery pack is packaged using end caps and insulation pads to ensure the safety of the experiment. The dimensions and thermal properties of the core components of the pack are given in Table 1.
The channel width of the liquid cooling plate is different from the wide channel design in the previous study. The designed channel is considerably less in width and has some added thickness. The reduction in width reduces the heat dissipation area significantly, resulting in a decrease in heat dissipation efficiency. The increase in thickness resulted in a significant decrease in the flow velocity, leading to a decrease in the heat transfer efficiency. Therefore, it is clearly evident that the use of wide and flat channel design will produce better thermal performance results. However, the reason why the design is not so designed is to consider the actual design requirements of the project. Due to factors such as large flow pressures and vibration in industrial manufacturing, wide and flat channels are extremely susceptible to impact deformation. Both the safety of use and service life will be greatly reduced.

3. Results

To evaluate the effectiveness of the thermal performance optimization of the structure, transient thermal simulations are performed by using ANSYS FLUENT [32]. Detailed structural parameters and computational information are presented in this section.

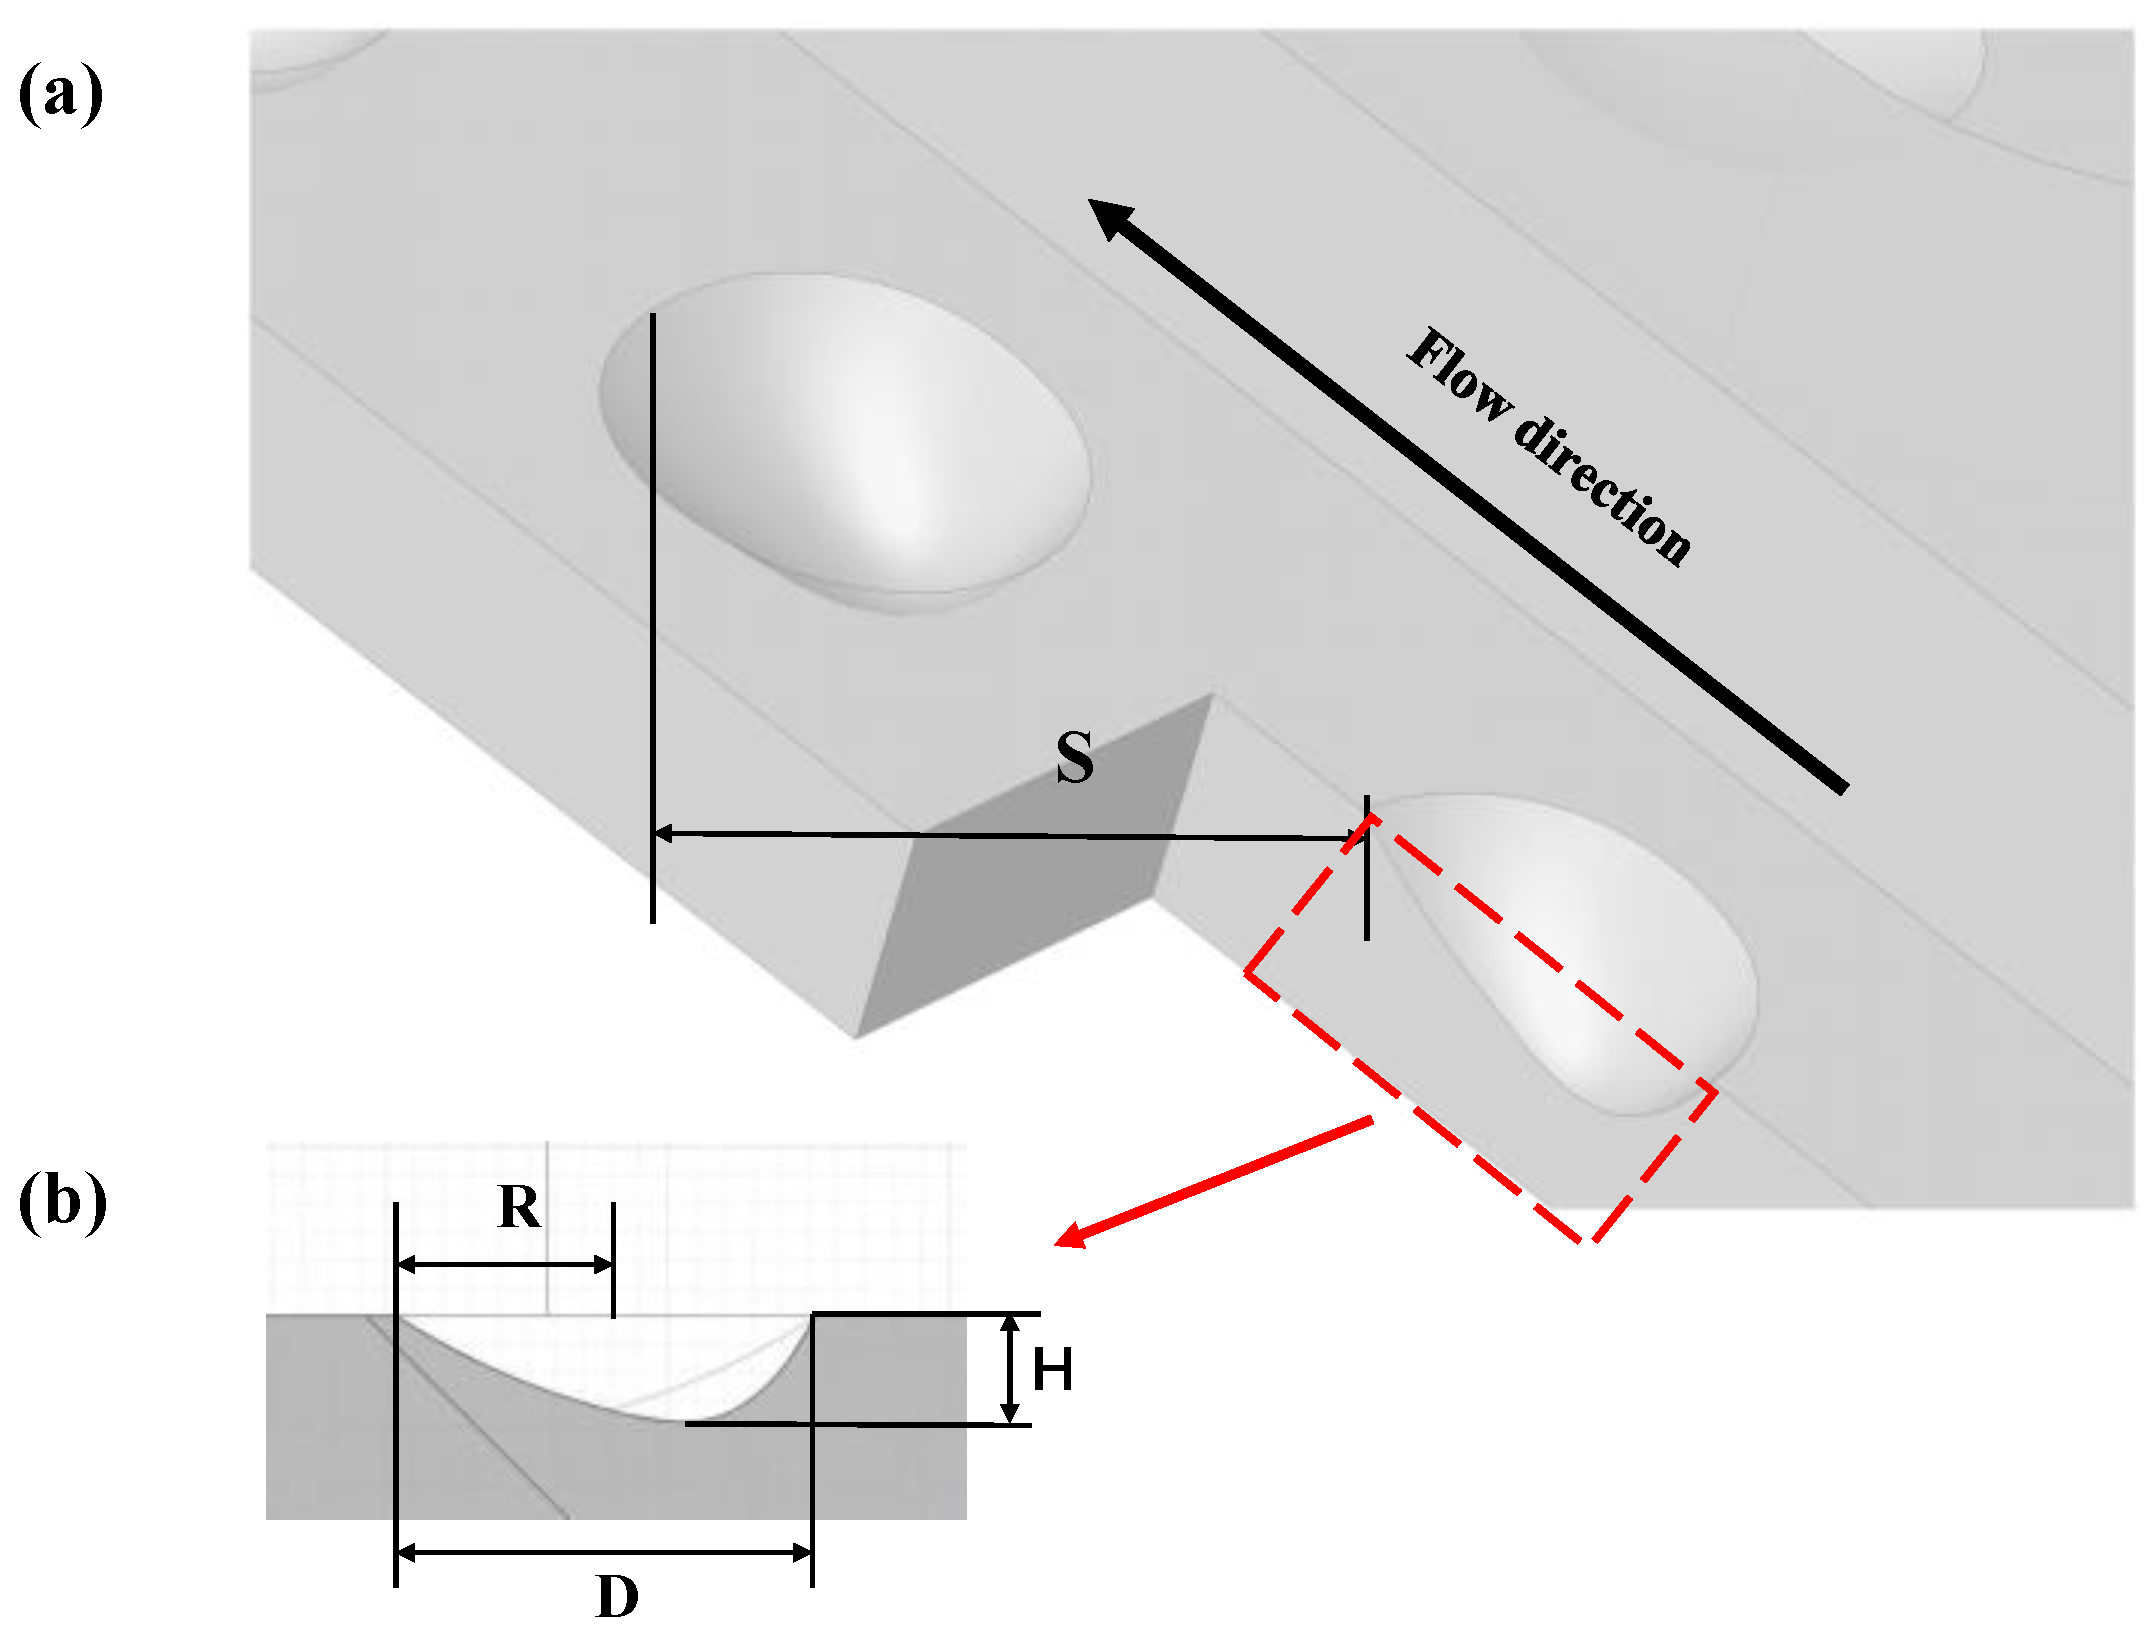
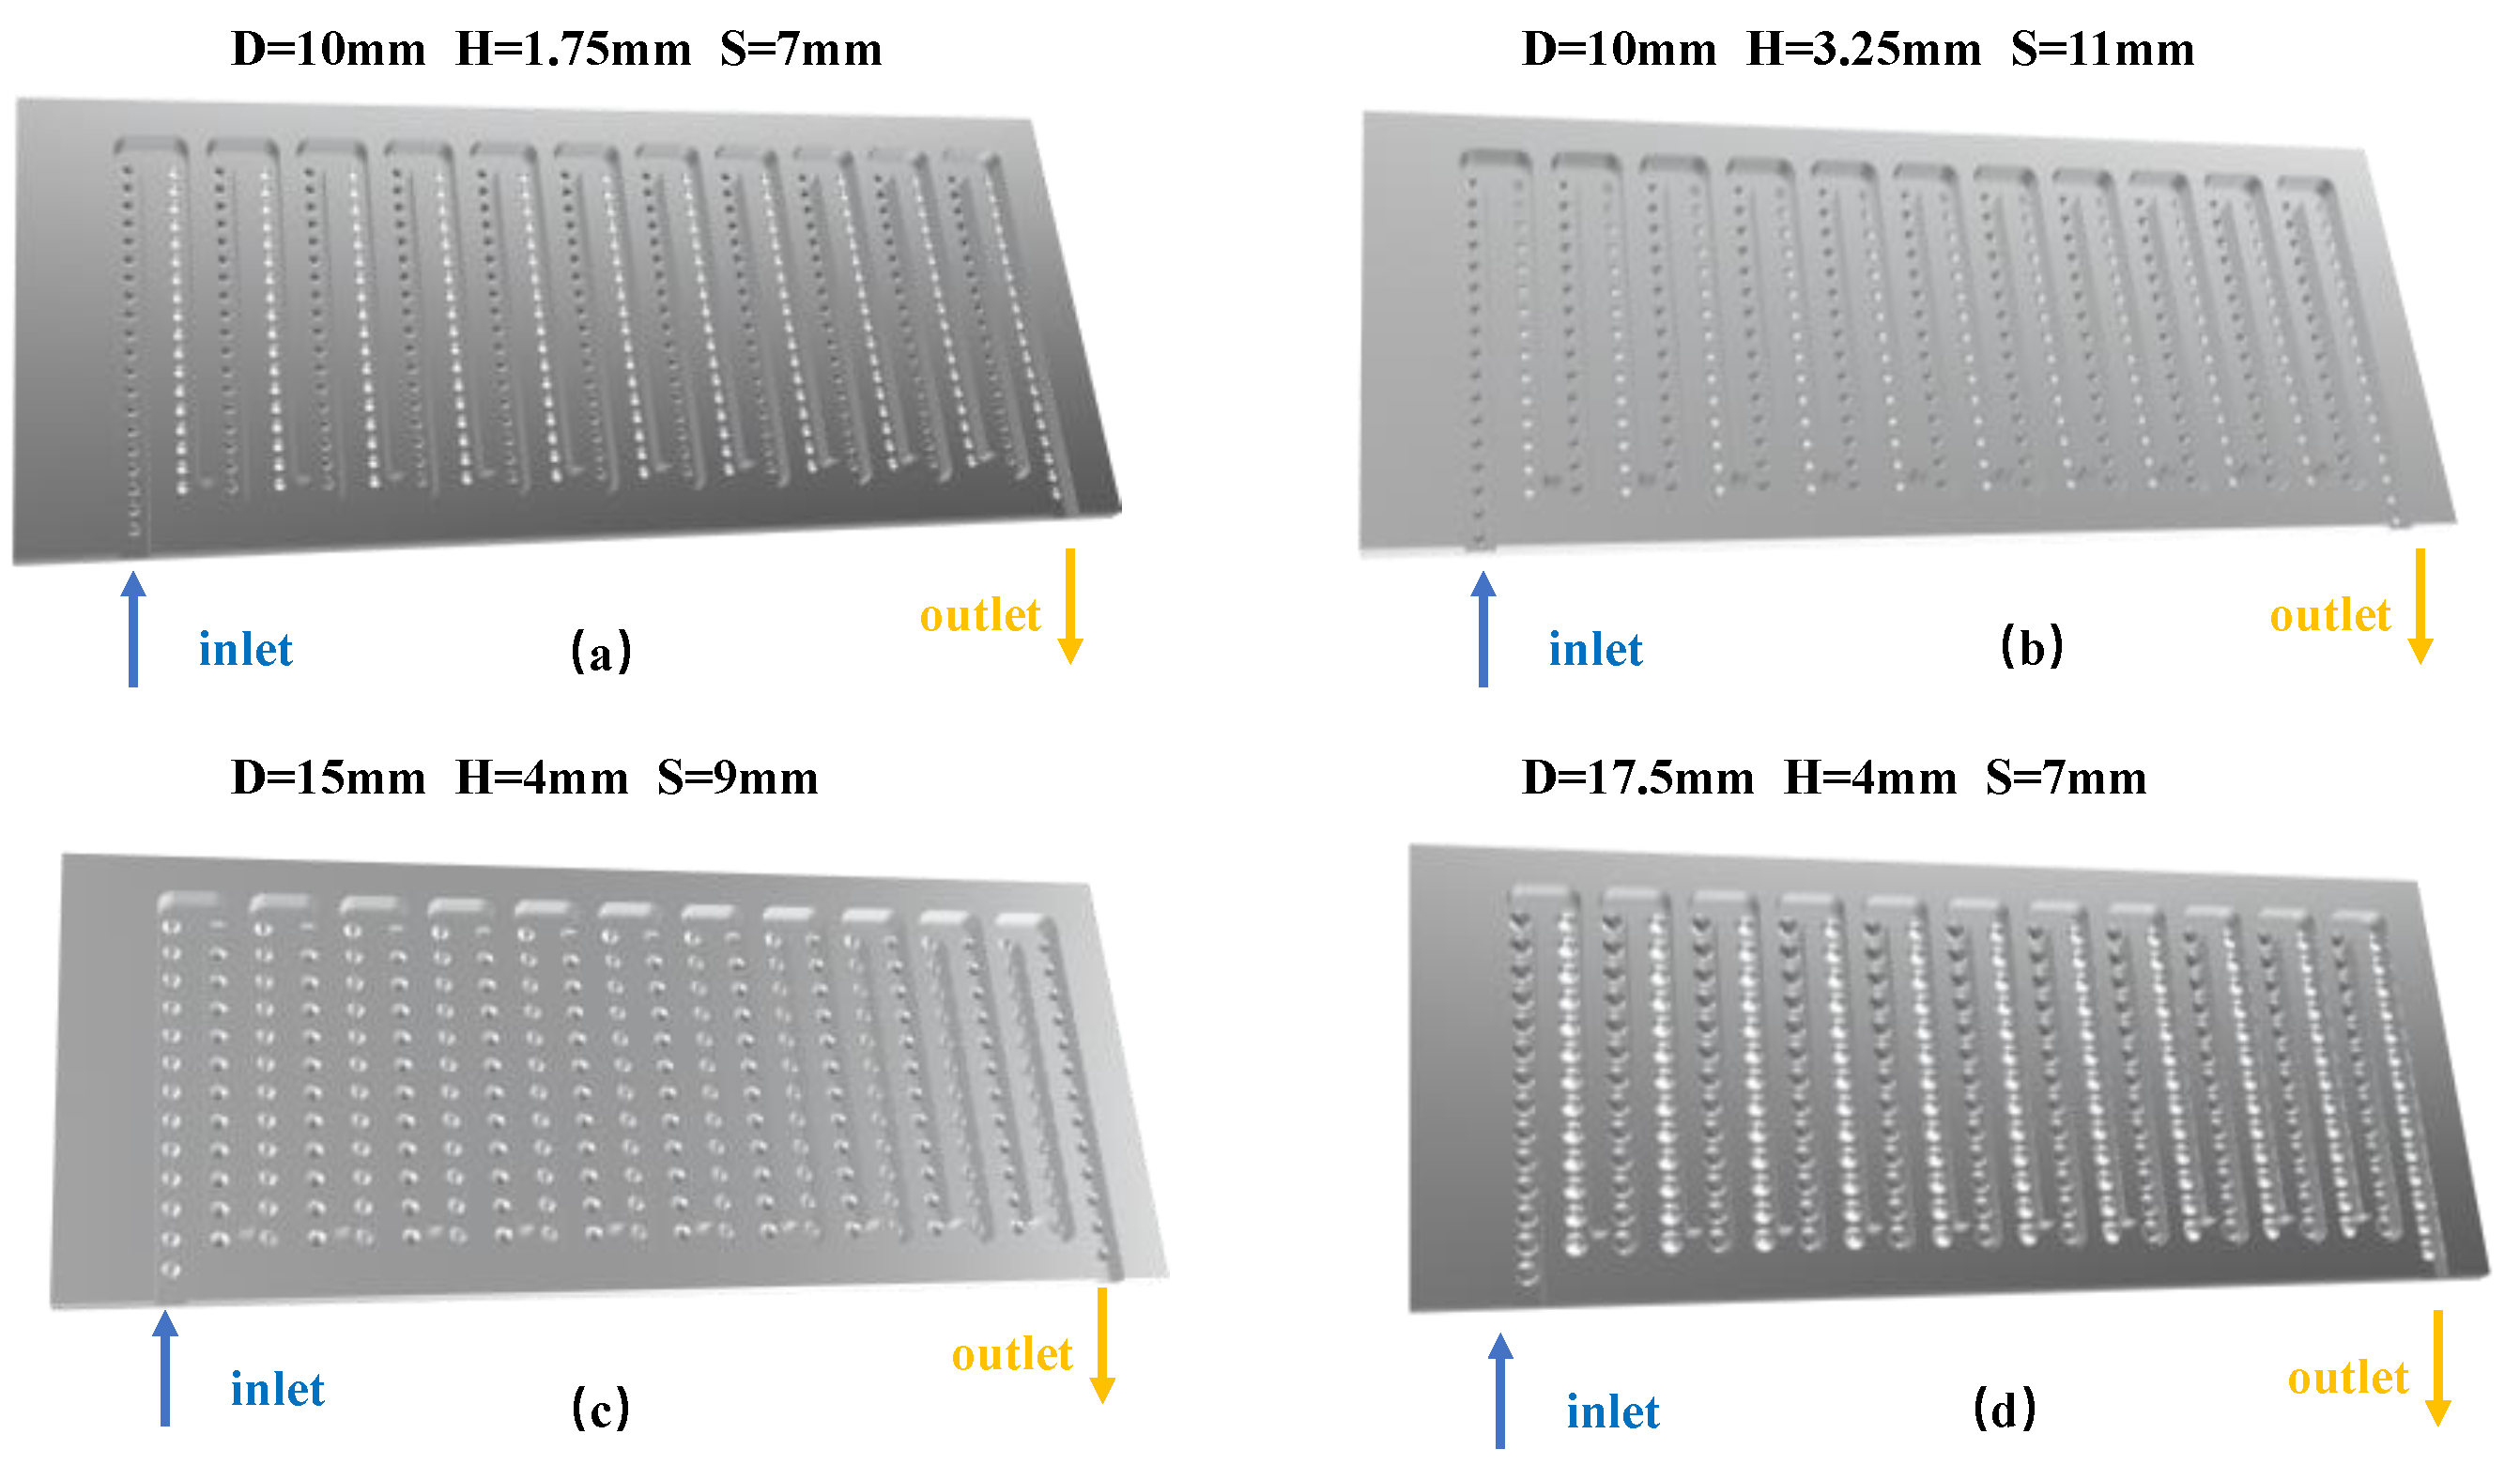
3.1. Bionic Model Design Parameters

By analyzing the erosion morphology of the fluid on the mechanical surface [33] and the principle of BFS construction [34], a BFS notch structure is established, as shown in Figure 2. The shape of the groove surface is the approximate circle of BFS. After considering the characteristics of erosion morphology, the lowest point of the semicircular groove is shifted backward by 1/2R to constitute the simplified structure of BFS in this paper, in which the important structural parameters are D, H and S. H is calculated by the laminar boundary layer condition in the following equation.
H = x R e x
R e x = v x ϑ
where H denotes the boundary layer thickness, and x denotes the flow direction displacement, and R e x denotes the corresponding Reynolds number at x, and v denotes the mean velocity of the fluid, and ϑ denotes the fluid kinematic viscosity.

3.2. Boundary Conditions

During the simulation, the ternary Lithium battery is discharged in the 1C state. Due to the large surface area of the cells, the thermal resistance between the cells and the side plates is neglected. The ambient temperature of the battery pack is set to 25 °C. The coolant inlet and outlet temperature is set to 25 °C, and the volume flow rate is set to 5.04 × 10⁻³ L/min. The end plate and the box are convection heat dissipation with the outside world, and the convection heat transfer coefficient is 3 W/(m2·K).

3.3. Control Equations

The simulation model consists of five domains: liquid cooling plate fluid domain, pack internal air domain, battery cell, pack solid components and thermally conductive materials. The simulation time interval is incremented from 0.01 s to 10 s.
The cell heat transfer and heat production equations are defined as follows [35]:
( ρ C p ) c e l l T t = k i n ( 2 T x 2 + 2 T y 2 ) + k t h 2 T z 2 + q g e n
where ρ , C p , k i n , k t h and T represent the density, specific heat capacity, in-plane thermal conductivity, through-plane thermal conductivity and temperature, respectively.
Based on Bernardi’s classical model, the battery heat is represented by the electrochemical reaction during discharge and the internal resistance as [36]:
q g e n = 1 V b ( I 2 R + I T b d U O C V d T ) #
where V b denotes volume, I denotes discharge current, R denotes internal resistance, T b denotes the thermal conductivity of the cell, and d U O C V d T denotes the entropy thermal coefficient.
The continuity, momentum and energy equations can be expressed as [37]:
ρ f t + ρ f U i x i = 0
ρ f U i t + x j ( ρ f U i U j ) = p x i + x j [ μ e f f ( U i x j + U j x i ) ]
t ( ρ f h t o t ) p t + x i ( ρ f U i h t o t ) = x i ( k f T x i ) + x i ( U i τ )
The transfer equations for the turbulent kinetic energy and energy dissipation rate are as follows, using the k- ε turbulence model.
t ( ρ f k ) + x i ( ρ f U i k ) = x i [ ( μ + μ t σ k ) k x i ] + P k ρ f ε + P k b
t ( ρ f ε ) + x i ( ρ f U i ε ) = x i [ ( μ + μ t σ ε ) ε x i ] + ε k ( C ε 1 P k C ε 2 ρ f ε + C ε 1 P k b ) #
where k and ε denote the turbulent kinetic energy and turbulent dissipation rate, respectively. The model constants C ε 1 = 1.44 , and C ε 2 = 1.92 .
Turbulent viscosity μ t and the production term P k of the solution equations can be described as:
μ e f f = μ t + μ
μ t = C μ ρ f k 2 ε
P k = μ t ( U j x i + U i x j ) U i x j

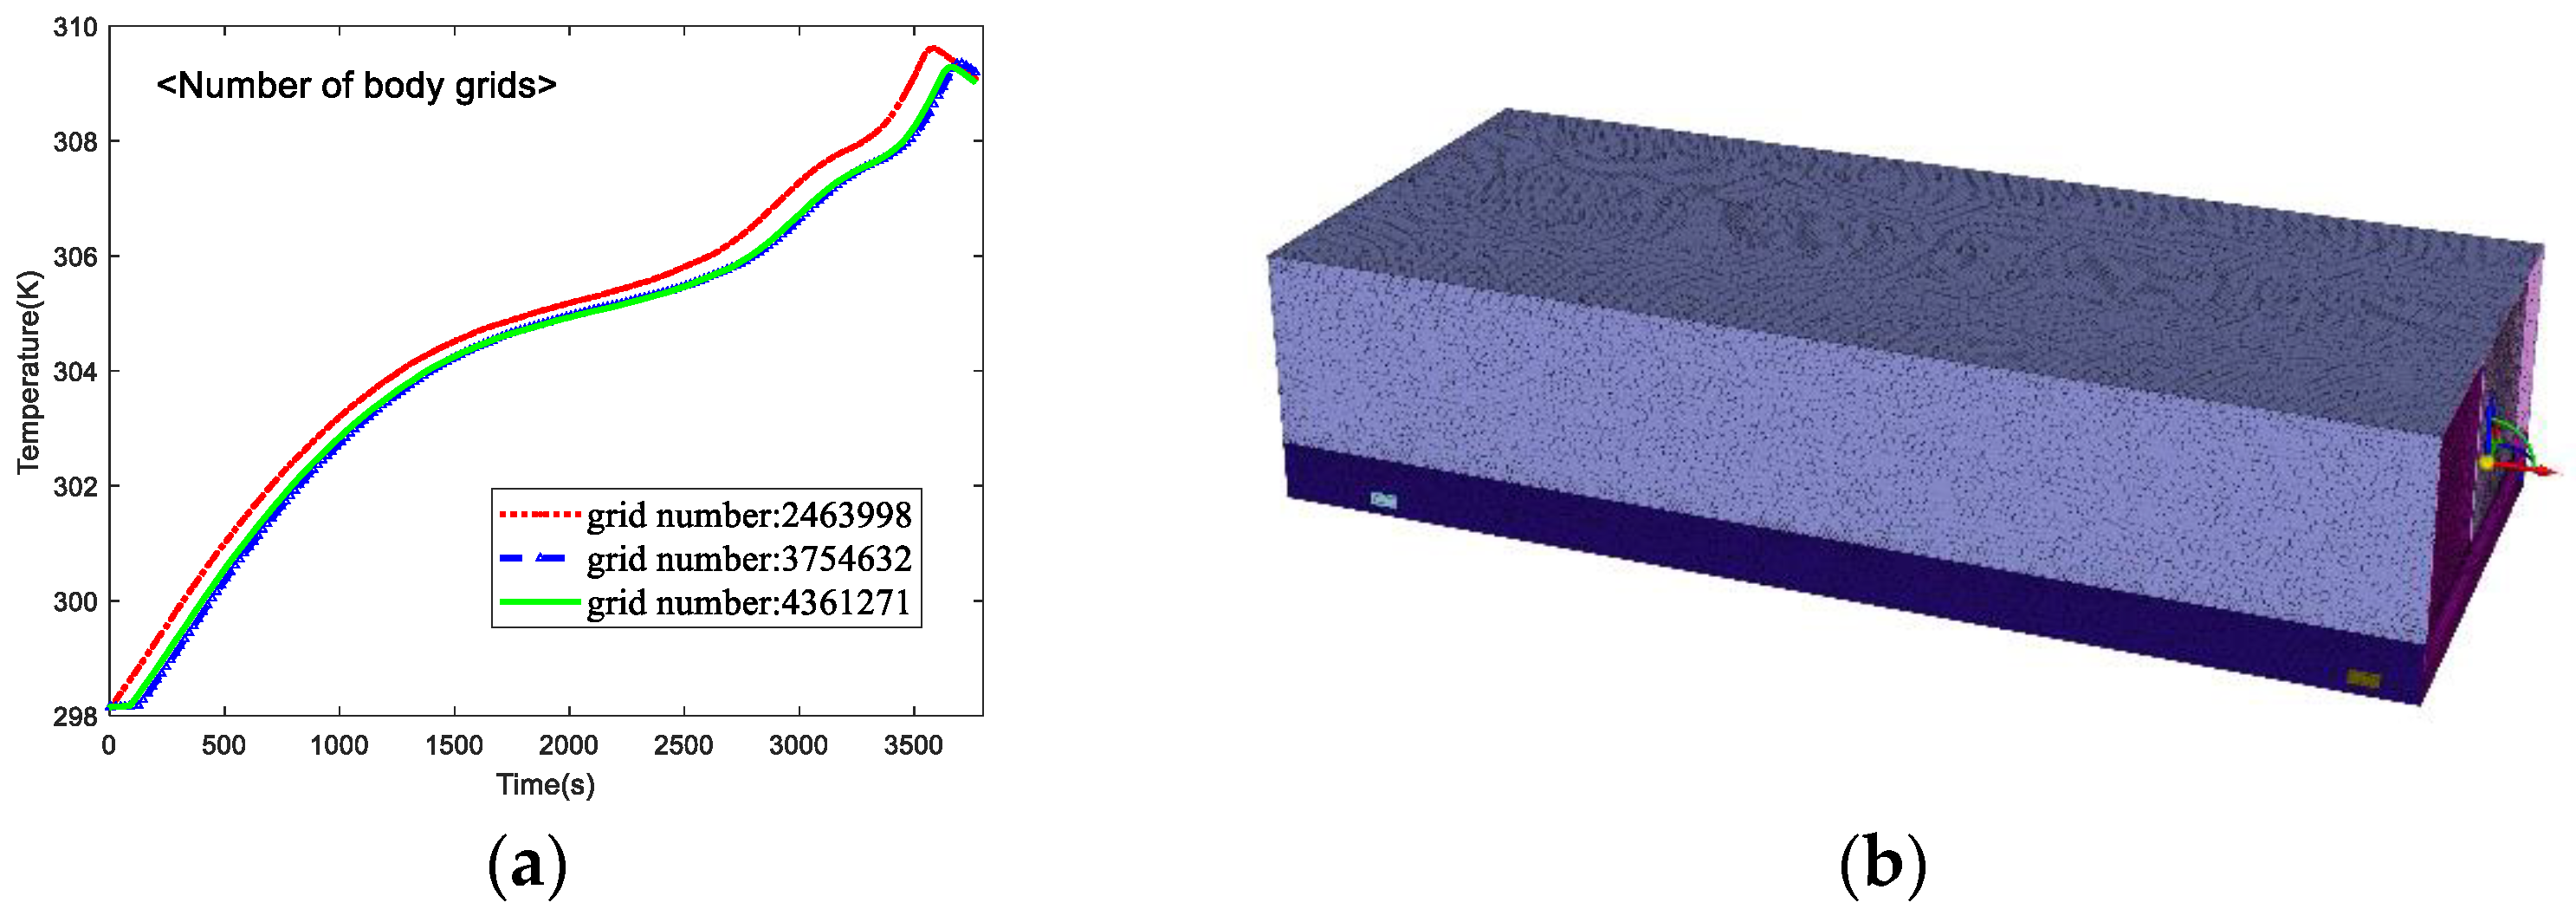
3.4. Grid Independence Analysis

In order to find the optimal number of meshes for the calculation, a sensitivity analysis is performed on the BTMS. Inappropriate number of meshes in Fluent may lead to poor mesh quality, which can cause the body mesh to fail in the calculation. Therefore, the number of bodies meshes is set between 1 million and 5 million. For a flow velocity of 0.3 m/s, the calculation results are shown in Figure 3a. There is some deviation in data when the grid number is low. When the grid number reaches 3.7 million or more, there is almost no difference in the temperature calculation results at different grid numbers. Therefore, in order to ensure the accuracy of the settlement results and the rapidity of the calculation, a grid number of 4 million is used for the calculation in this study. The face mesh parameters are 2.5 to 24.77 mm and the body mesh parameter is 20 mm. The grid structure of the battery pack is shown in Figure 3b.

4. Experimental Setup and Thermal Model Validation

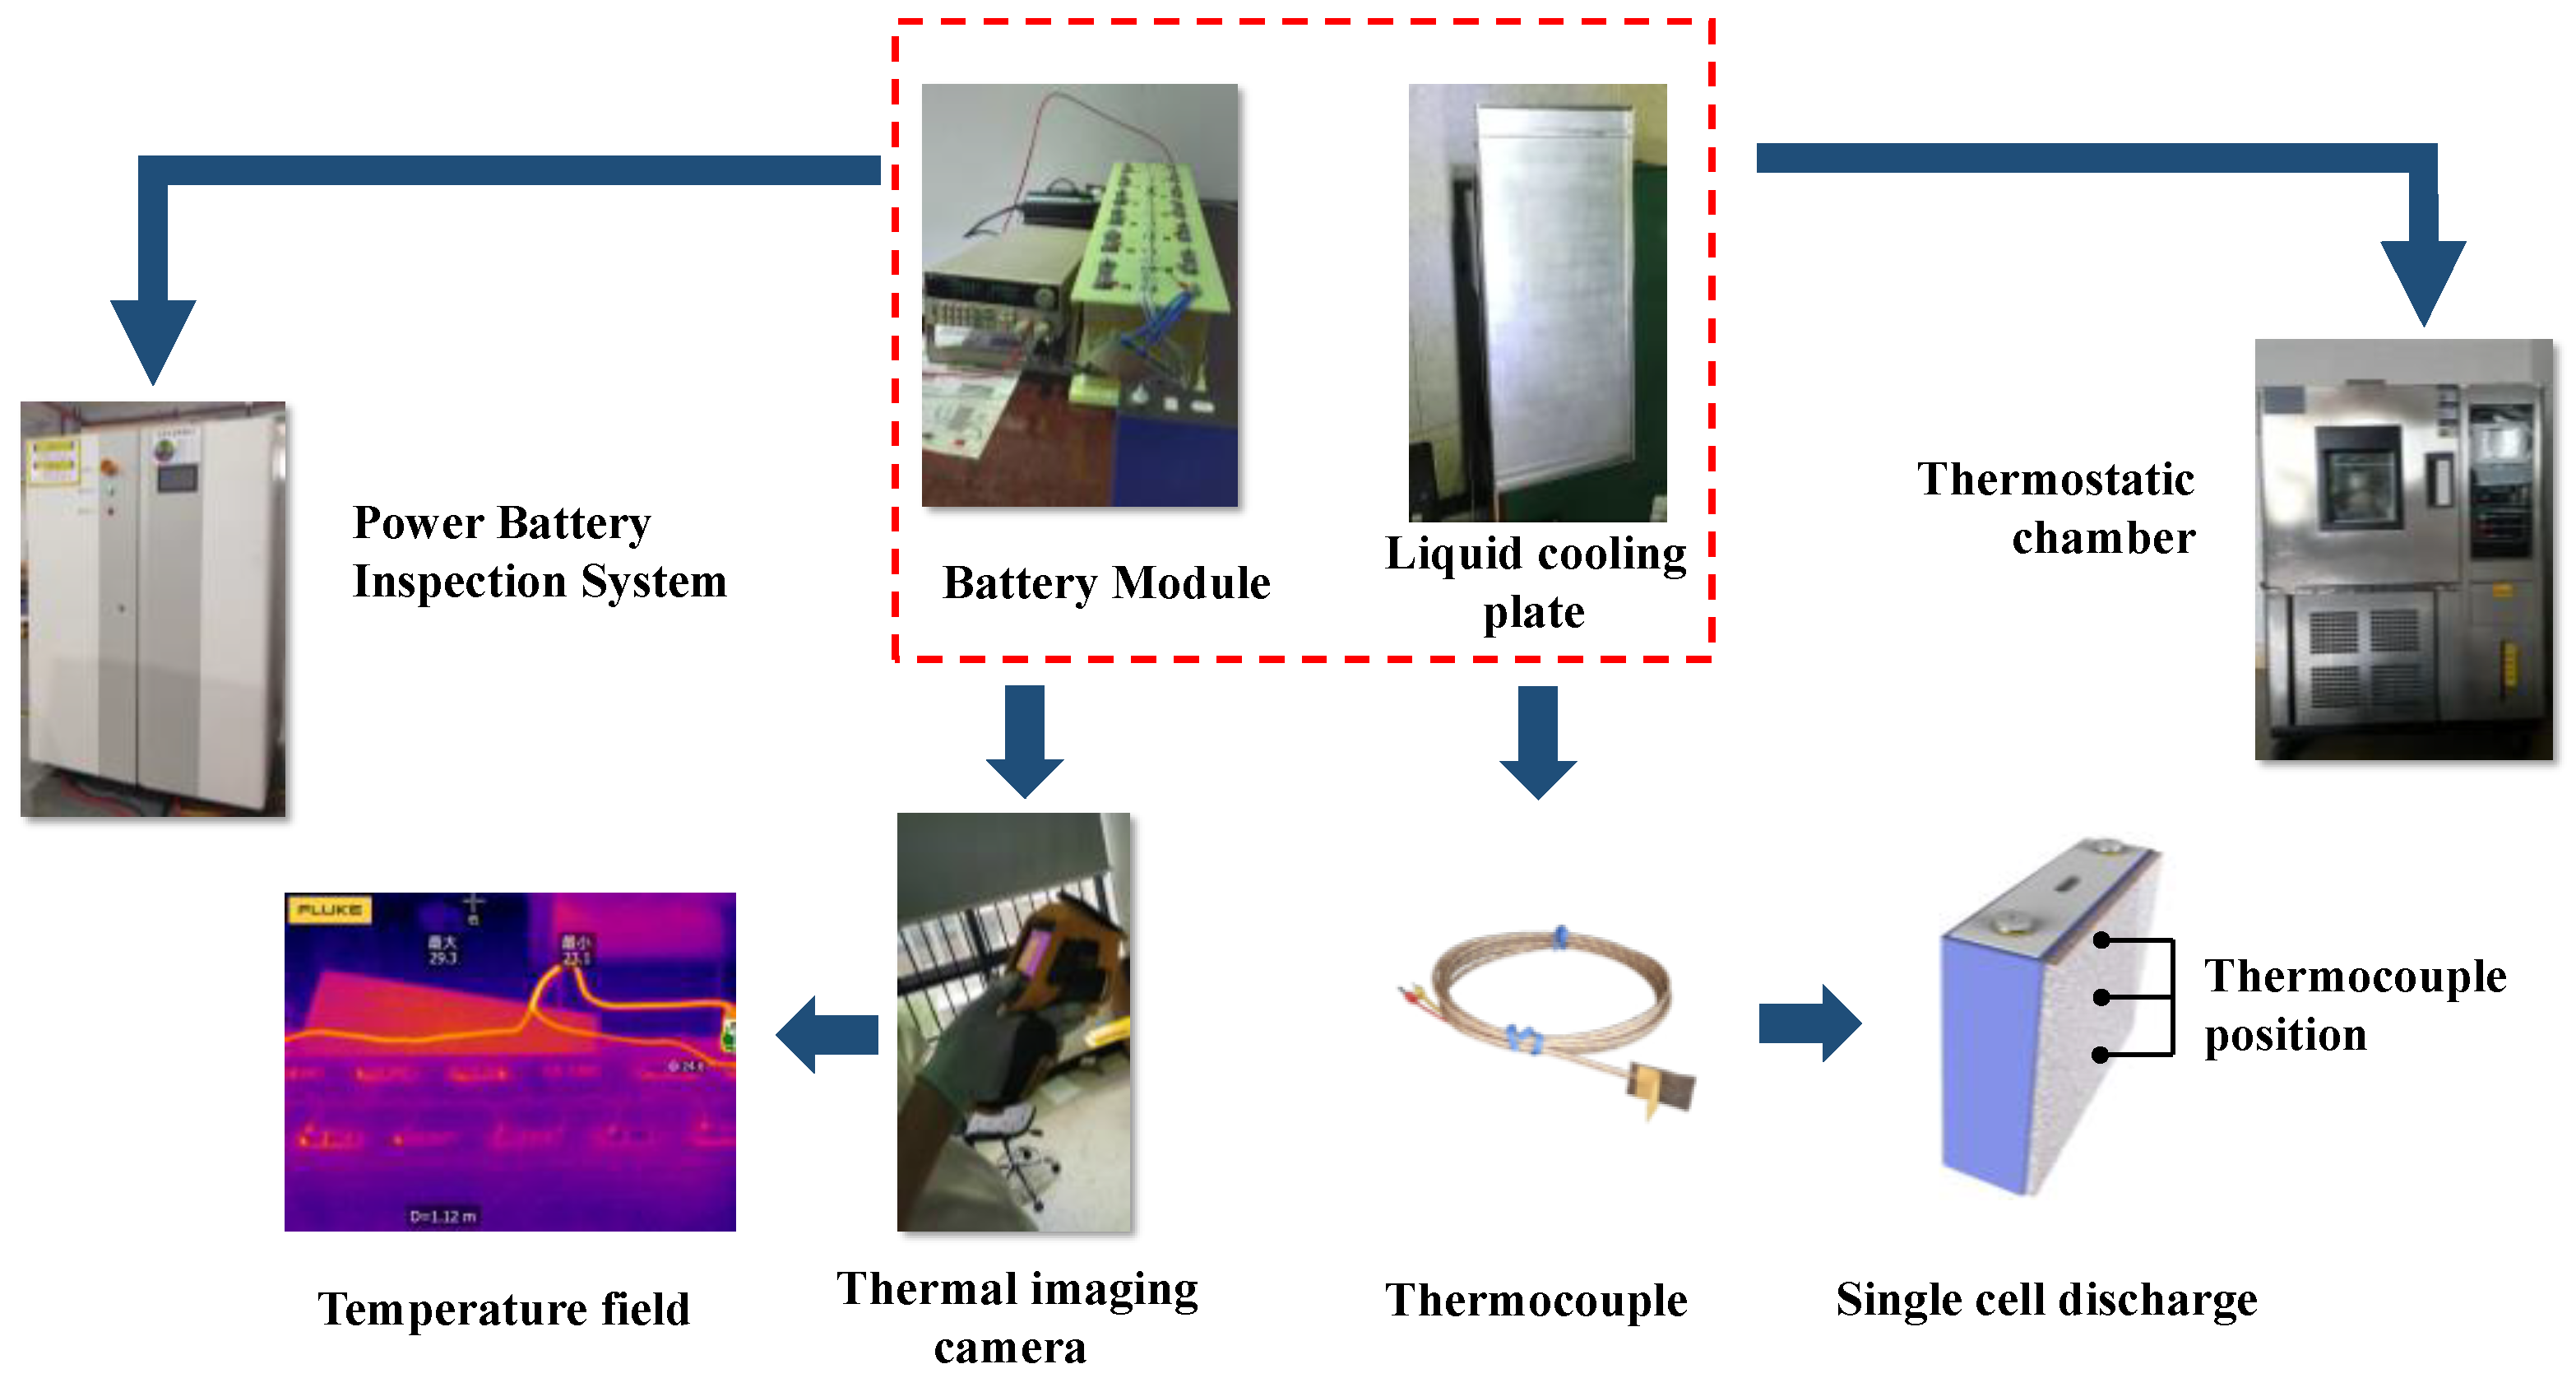
4.1. Experimental Setup

A total of 36 ternary Lithium batteries with a capacity of 50 Ah are used in series for the experiment. The basic parameters of the Lithium batteries are shown in Table 2. Compared with the batteries used in daily life, the rated capacity of 50 Ah has a discharge current of 50 A at 1C, which involves a lot of heat generation and also places a high demand on the BTMS for heat dissipation. Experiments are conducted using the power battery testing system, thermostatic chamber, as shown in Figure 4. The experiment starts with an initial temperature setting of 25 °C at room temperature and 1C discharge. The coolant uses water, and the pump flow velocity is set to 0.28 m/s. The temperature change of the conductive row of the battery module is recorded every 30 s during the discharge process using a thermal imaging camera. The experimental condition also continues to be used for experimental validation after subsequent replacement of the liquid cooling plate with BFS channel.

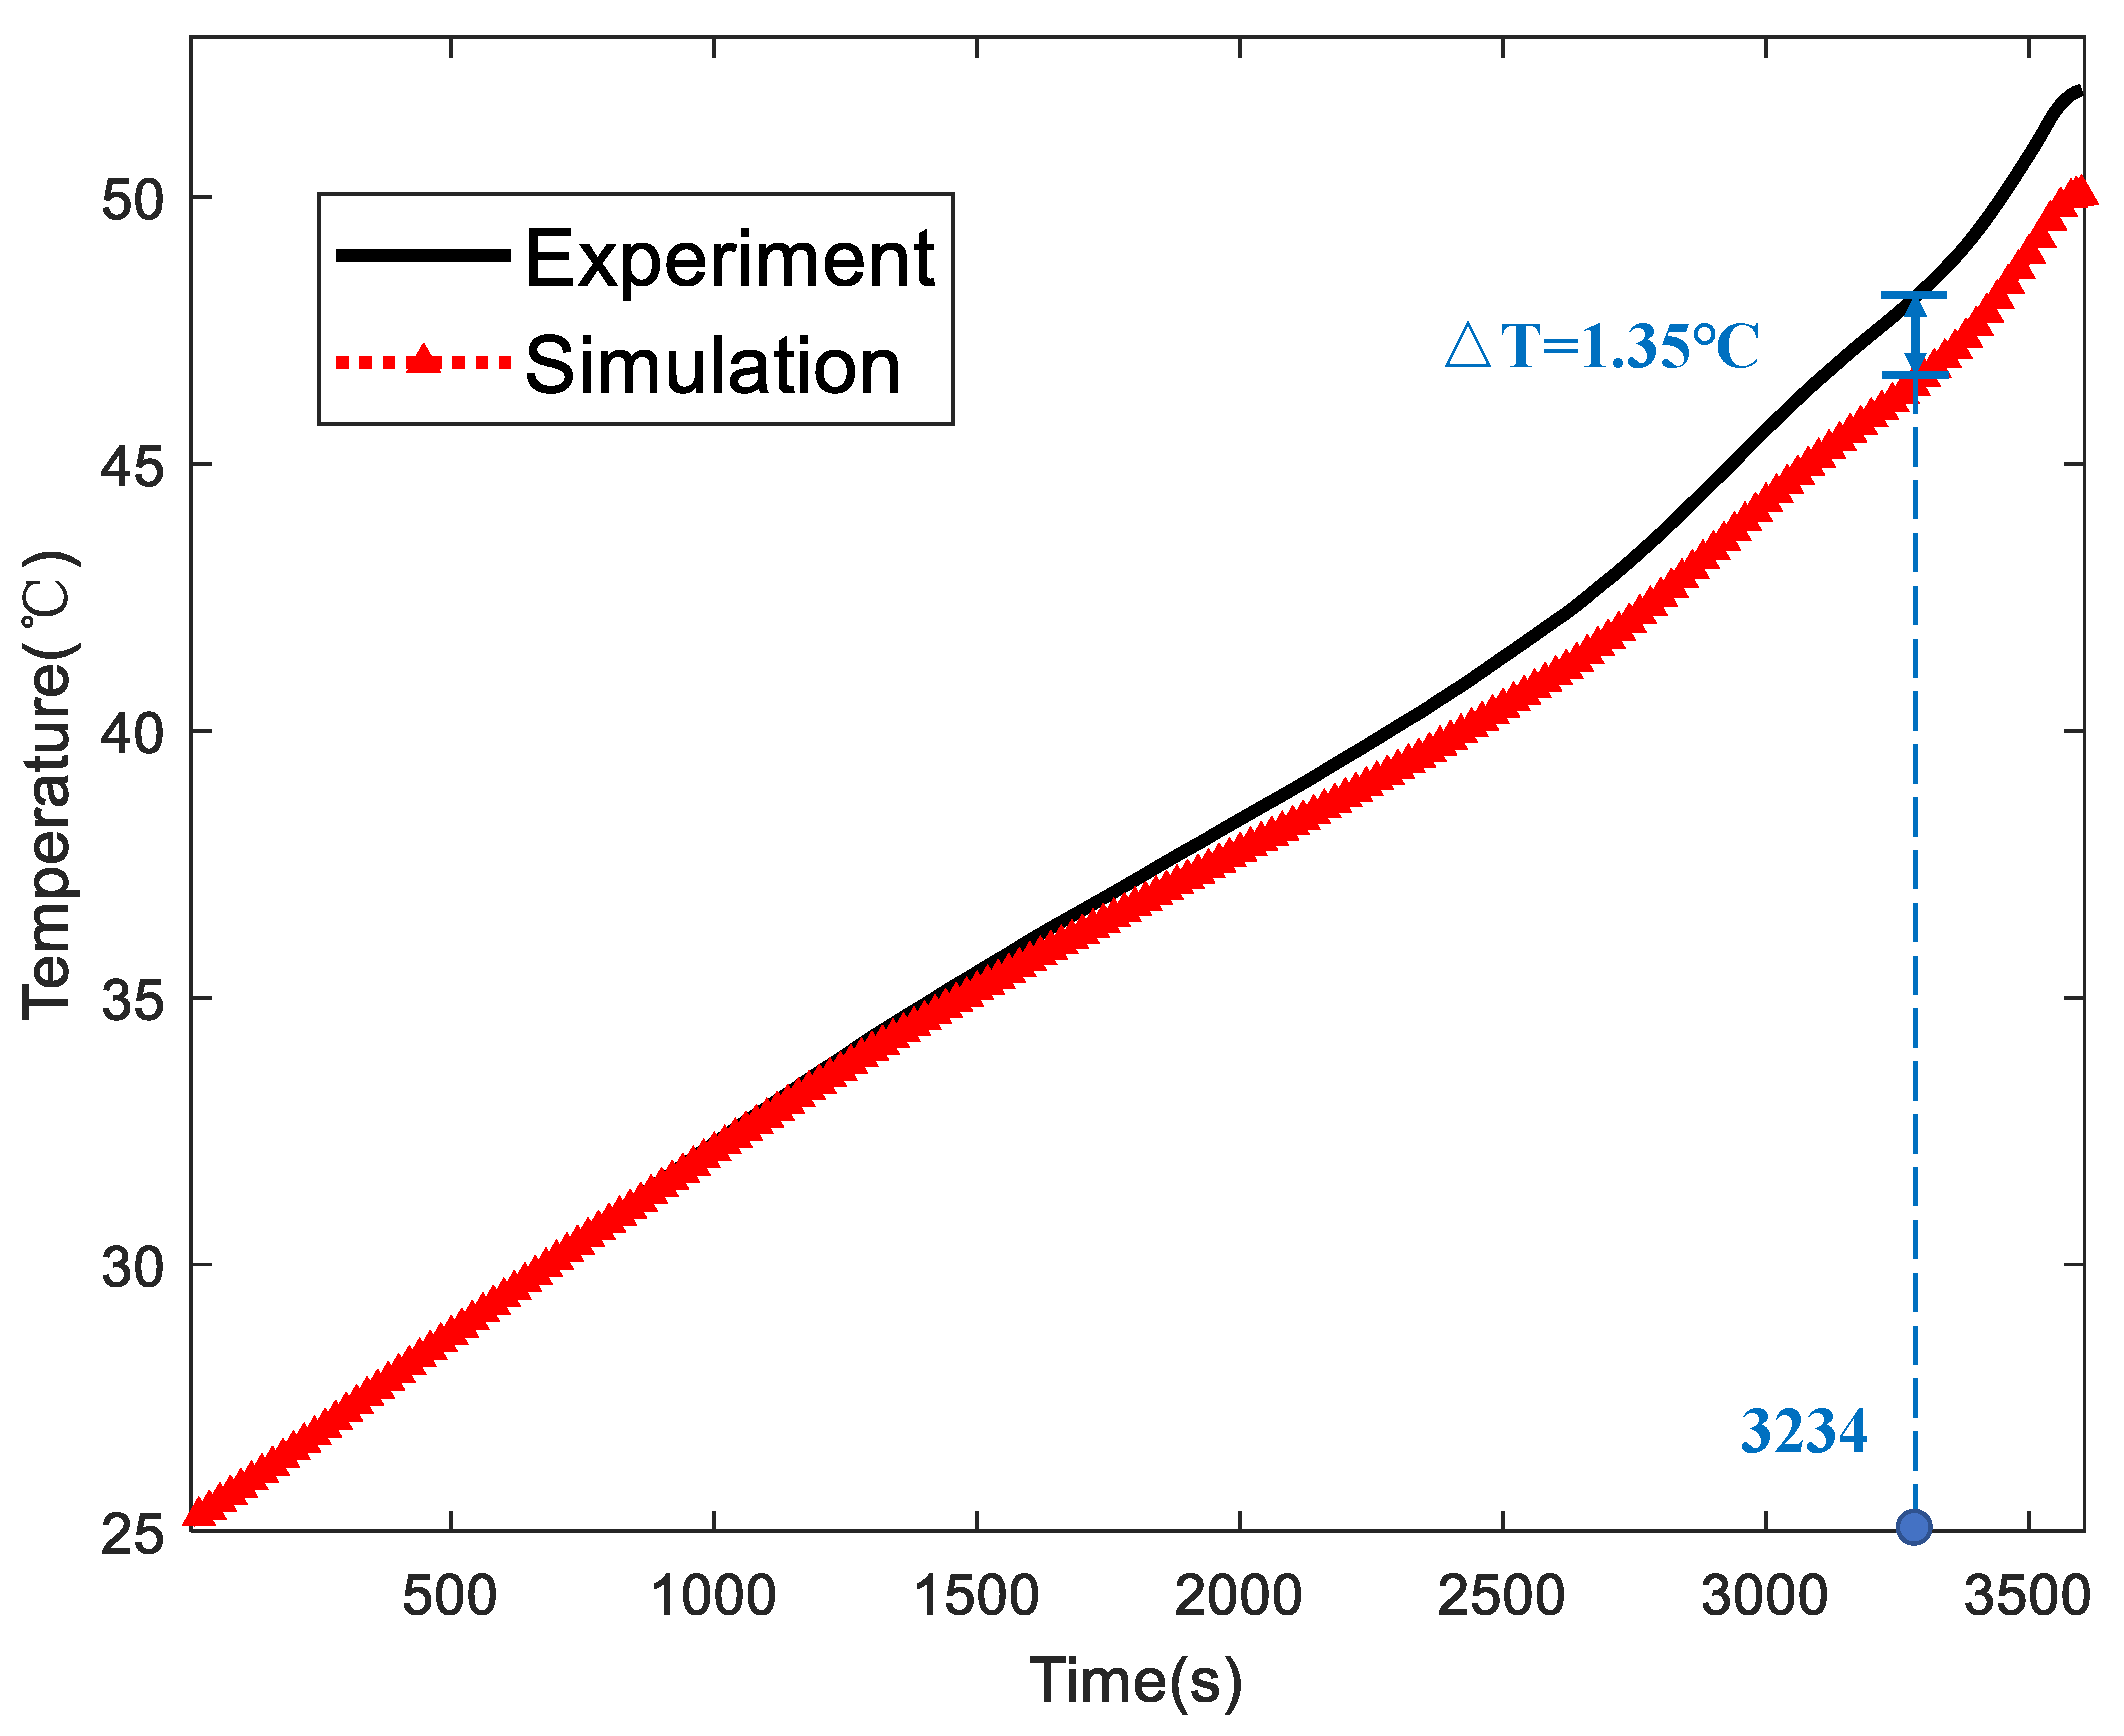
4.2. Thermal Model Validation

To verify the accuracy of the thermal model, CFD calculation is performed according to Table 3. In addition, three thermocouples are placed from top to bottom on the surface of the single cell for temperature acquisition with the experimental test setup described above. After 3600 s of 1C discharge, the average value of the three thermocouples was calculated as the experimental results. The comparison of the simulated temperature with the actual temperature is shown as Figure 5. Compared to the actual temperature, the simulated temperature shows a maximum error of 2.83% at the 3234th second, which is within acceptable limits. This indicates that the accuracy of the established cell thermal model can be used for thermal simulation calculations of liquid cooling BTMS.

5. Results and Discussion

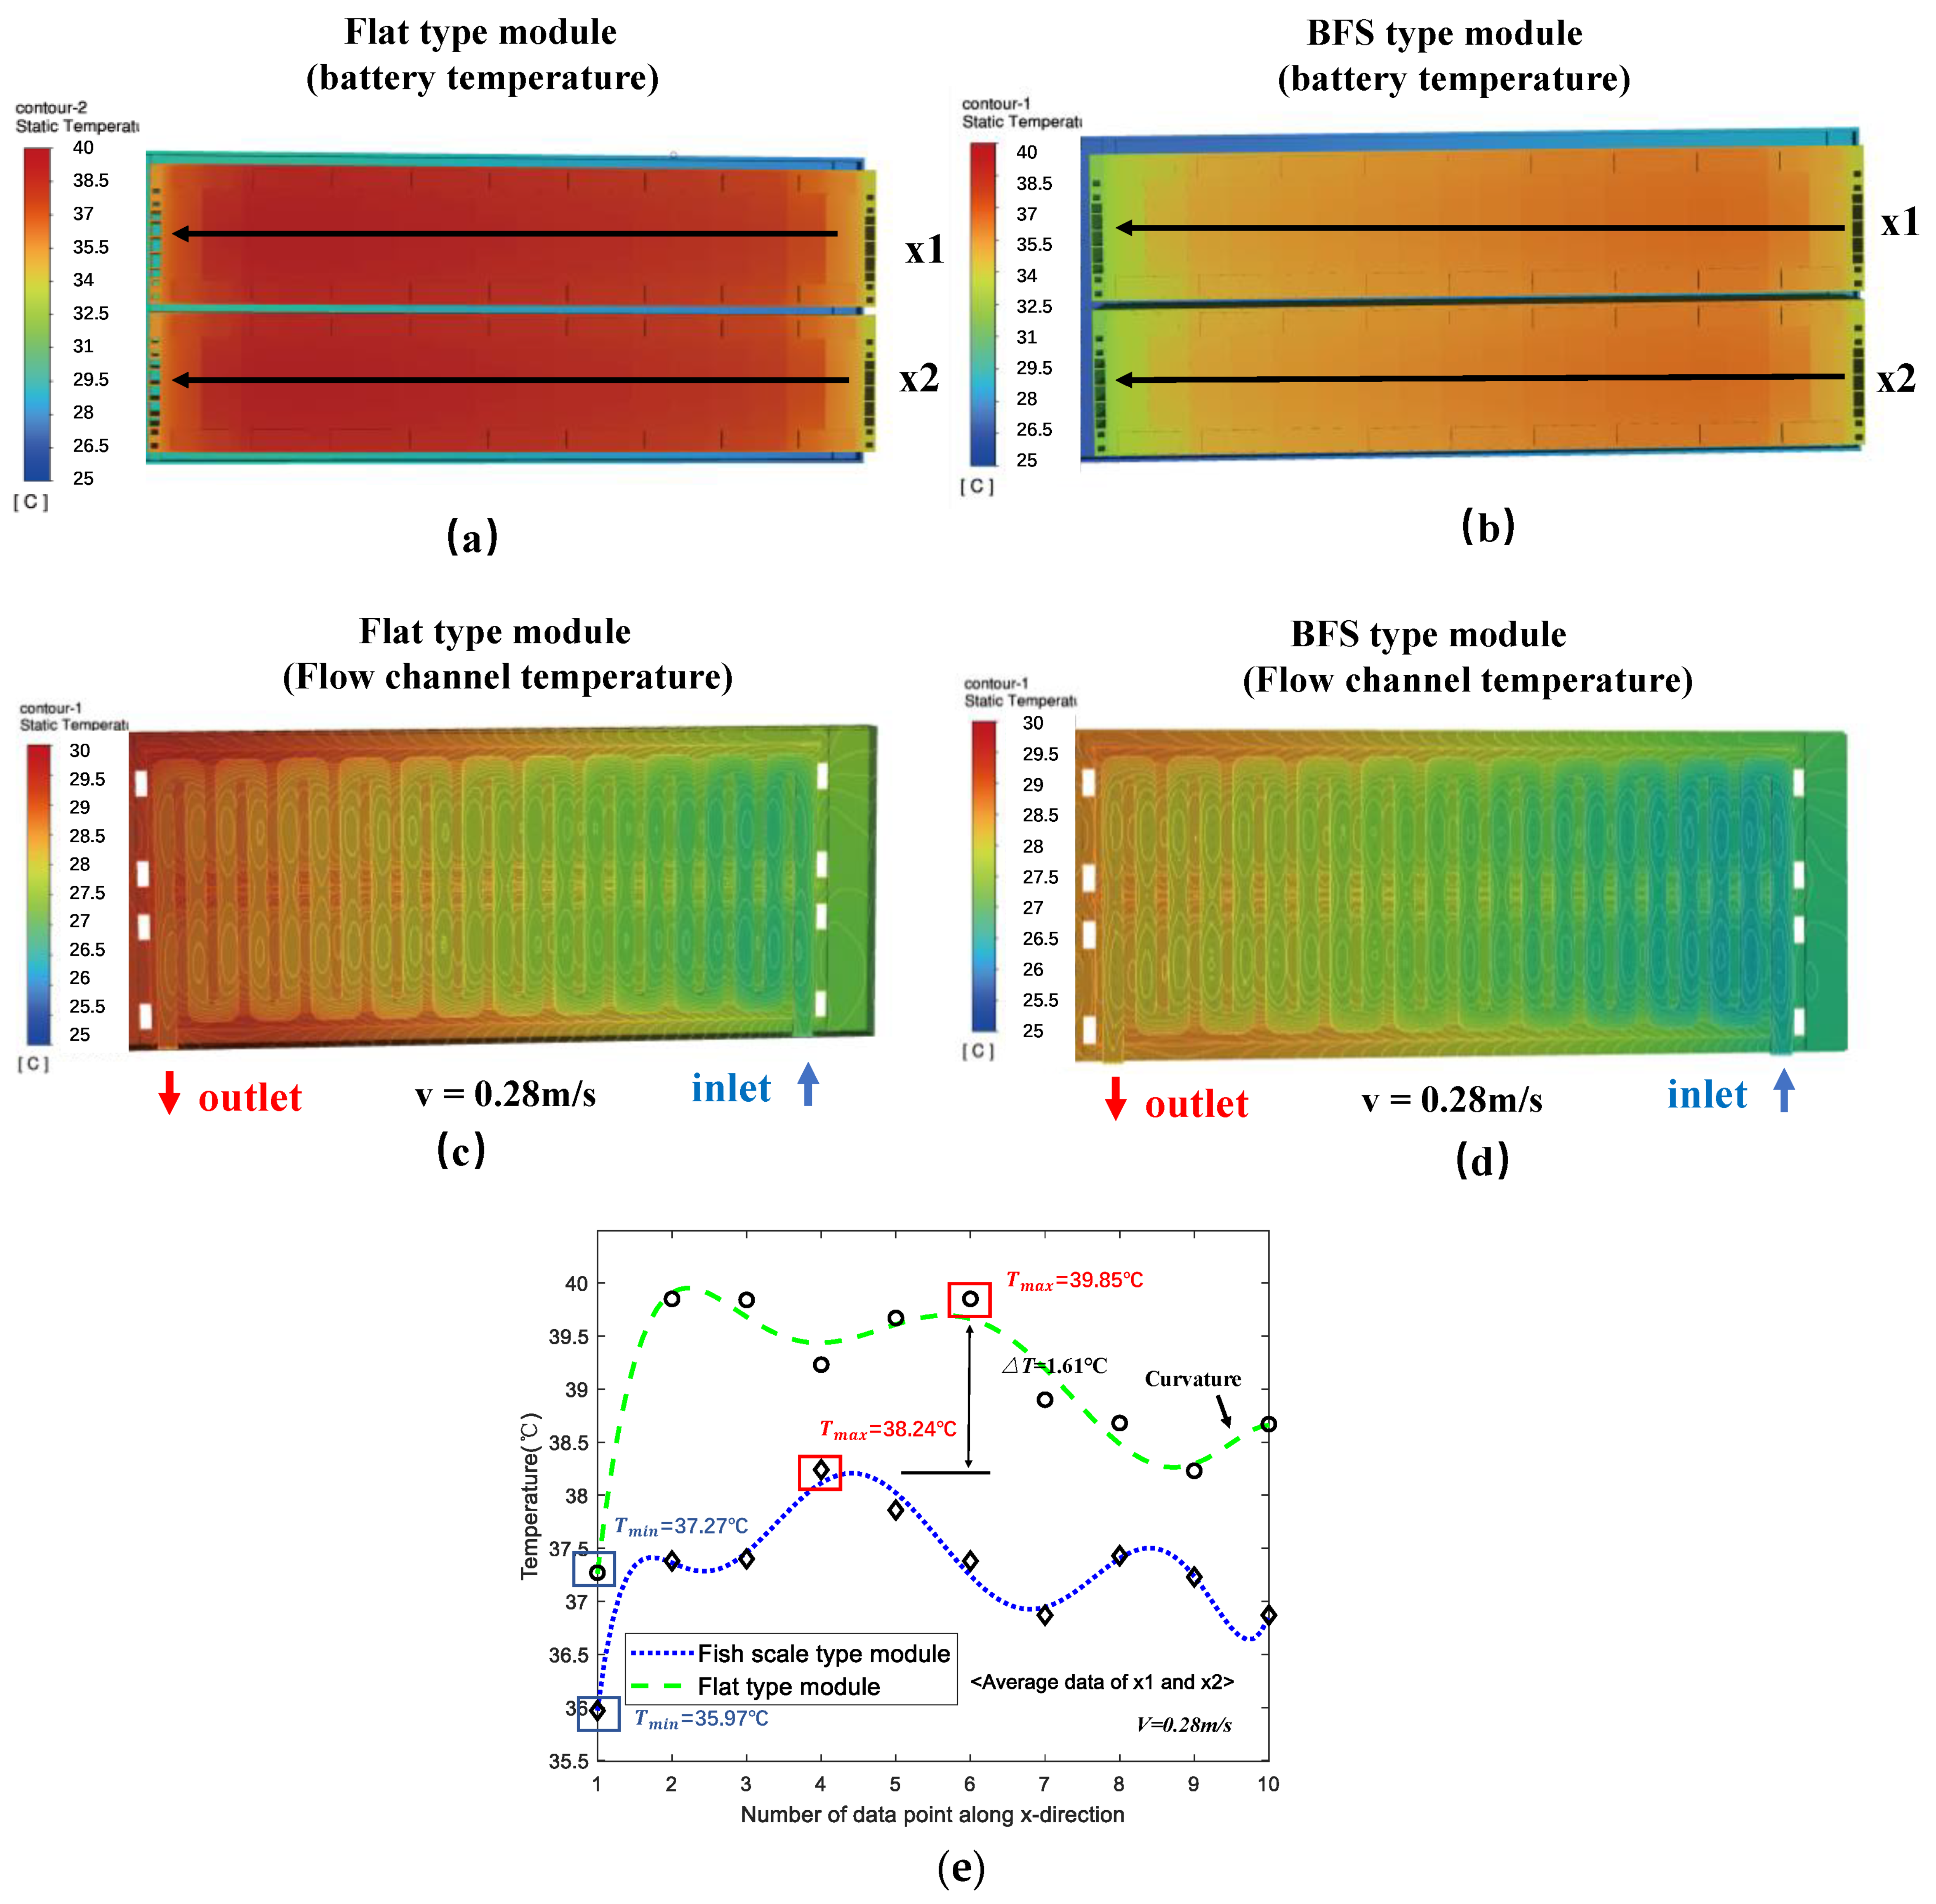
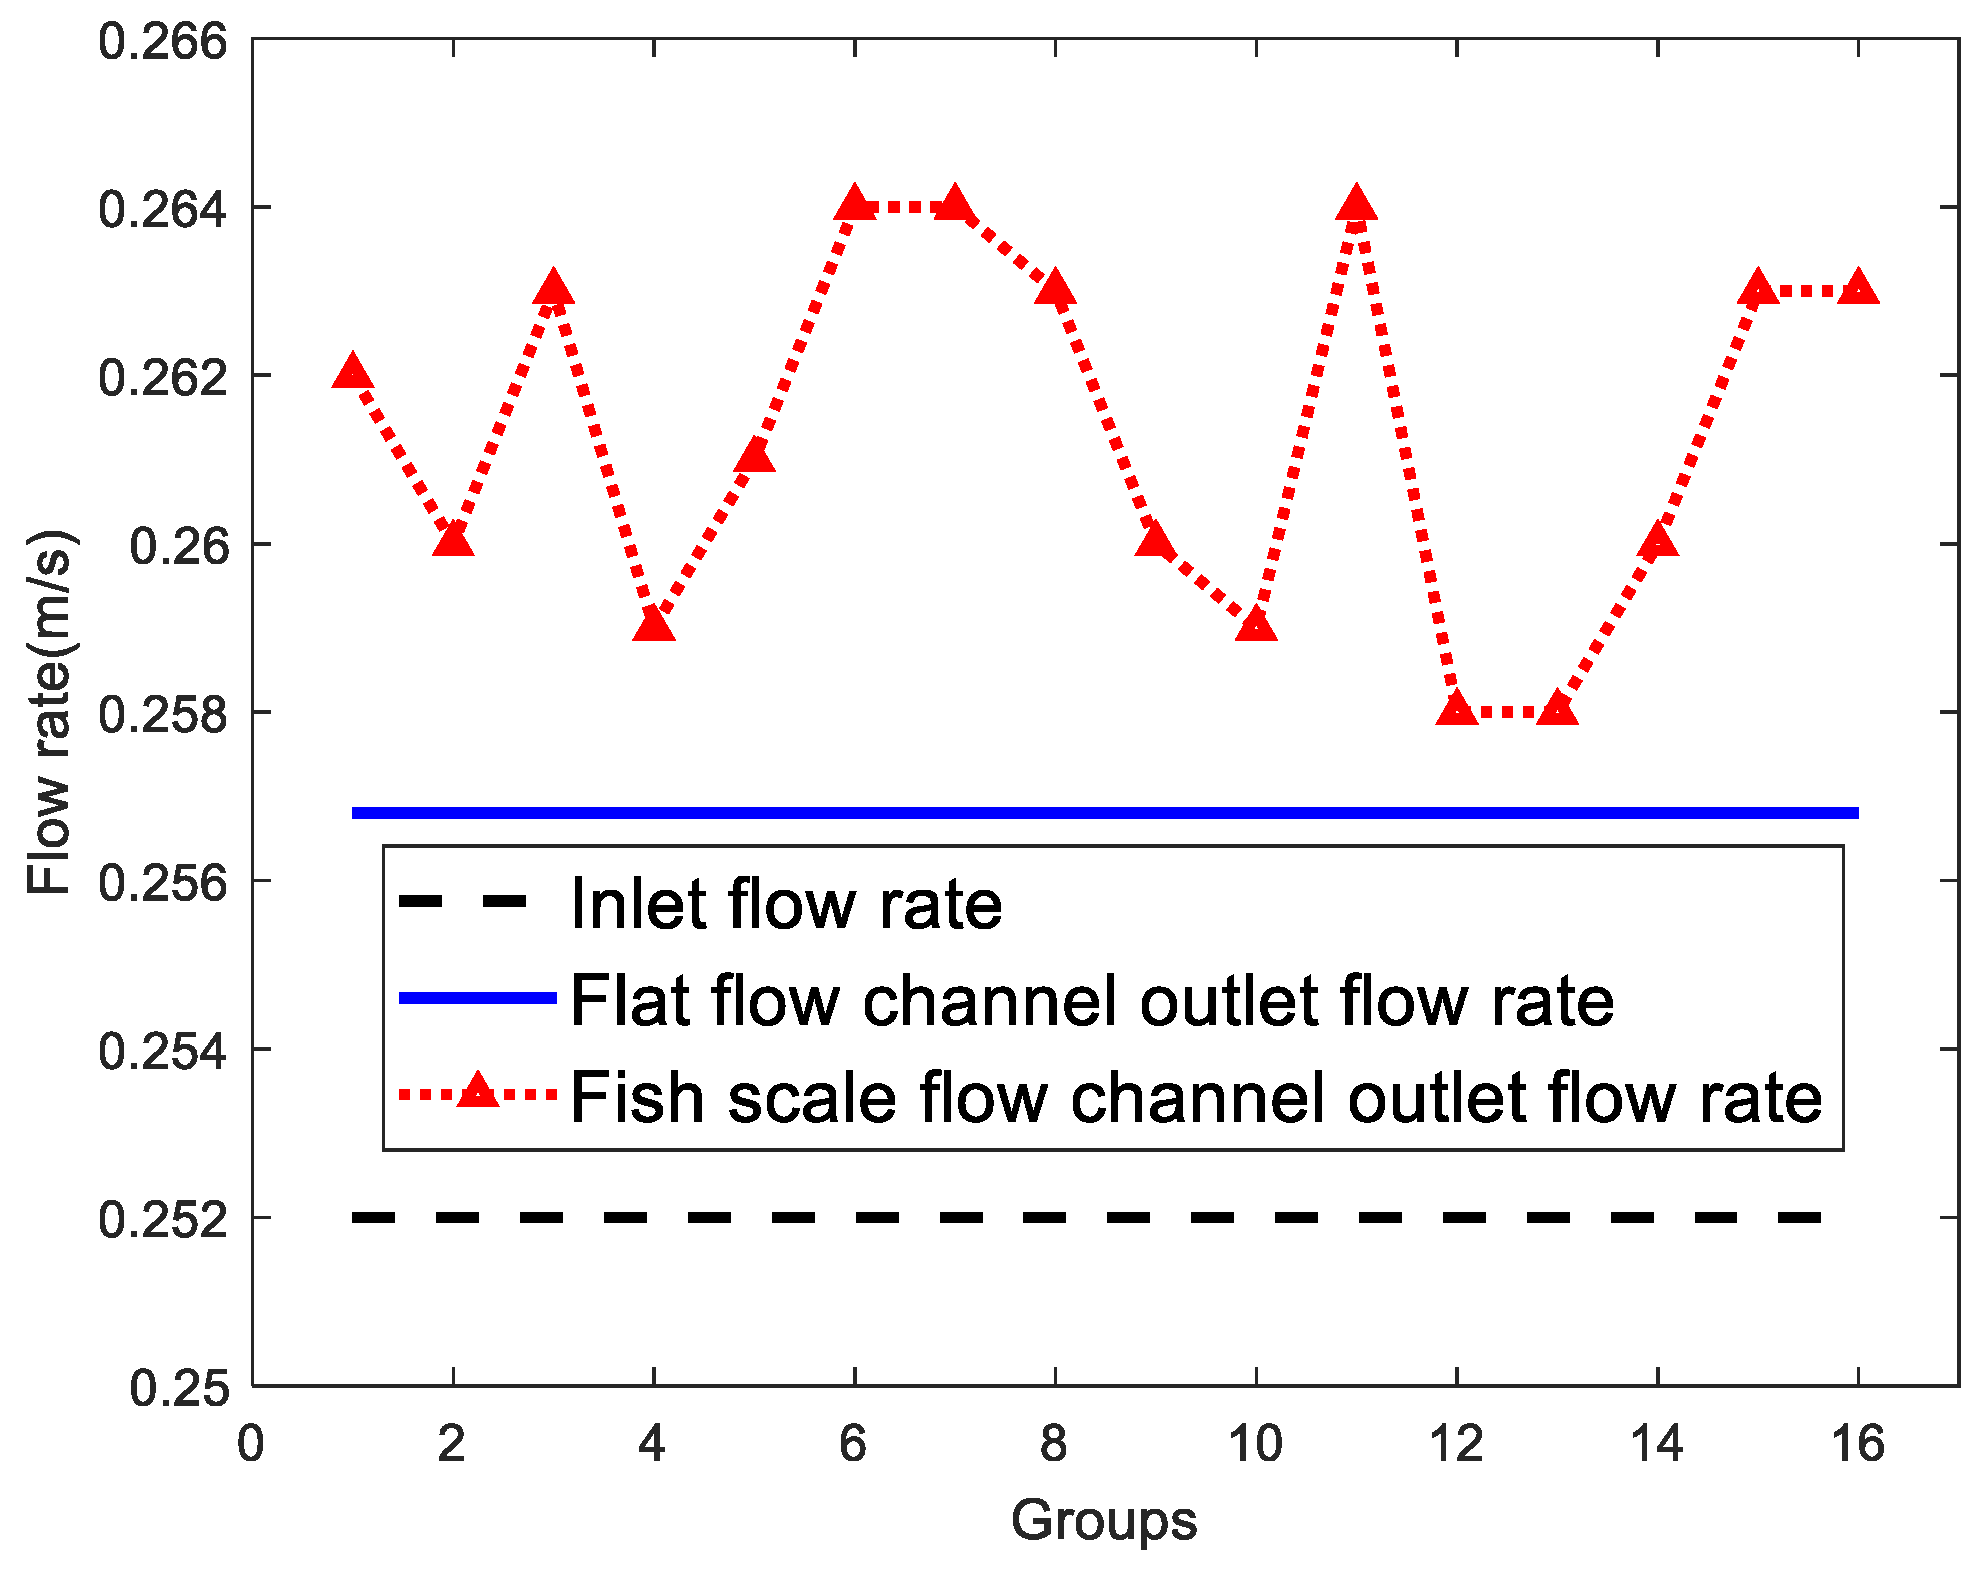
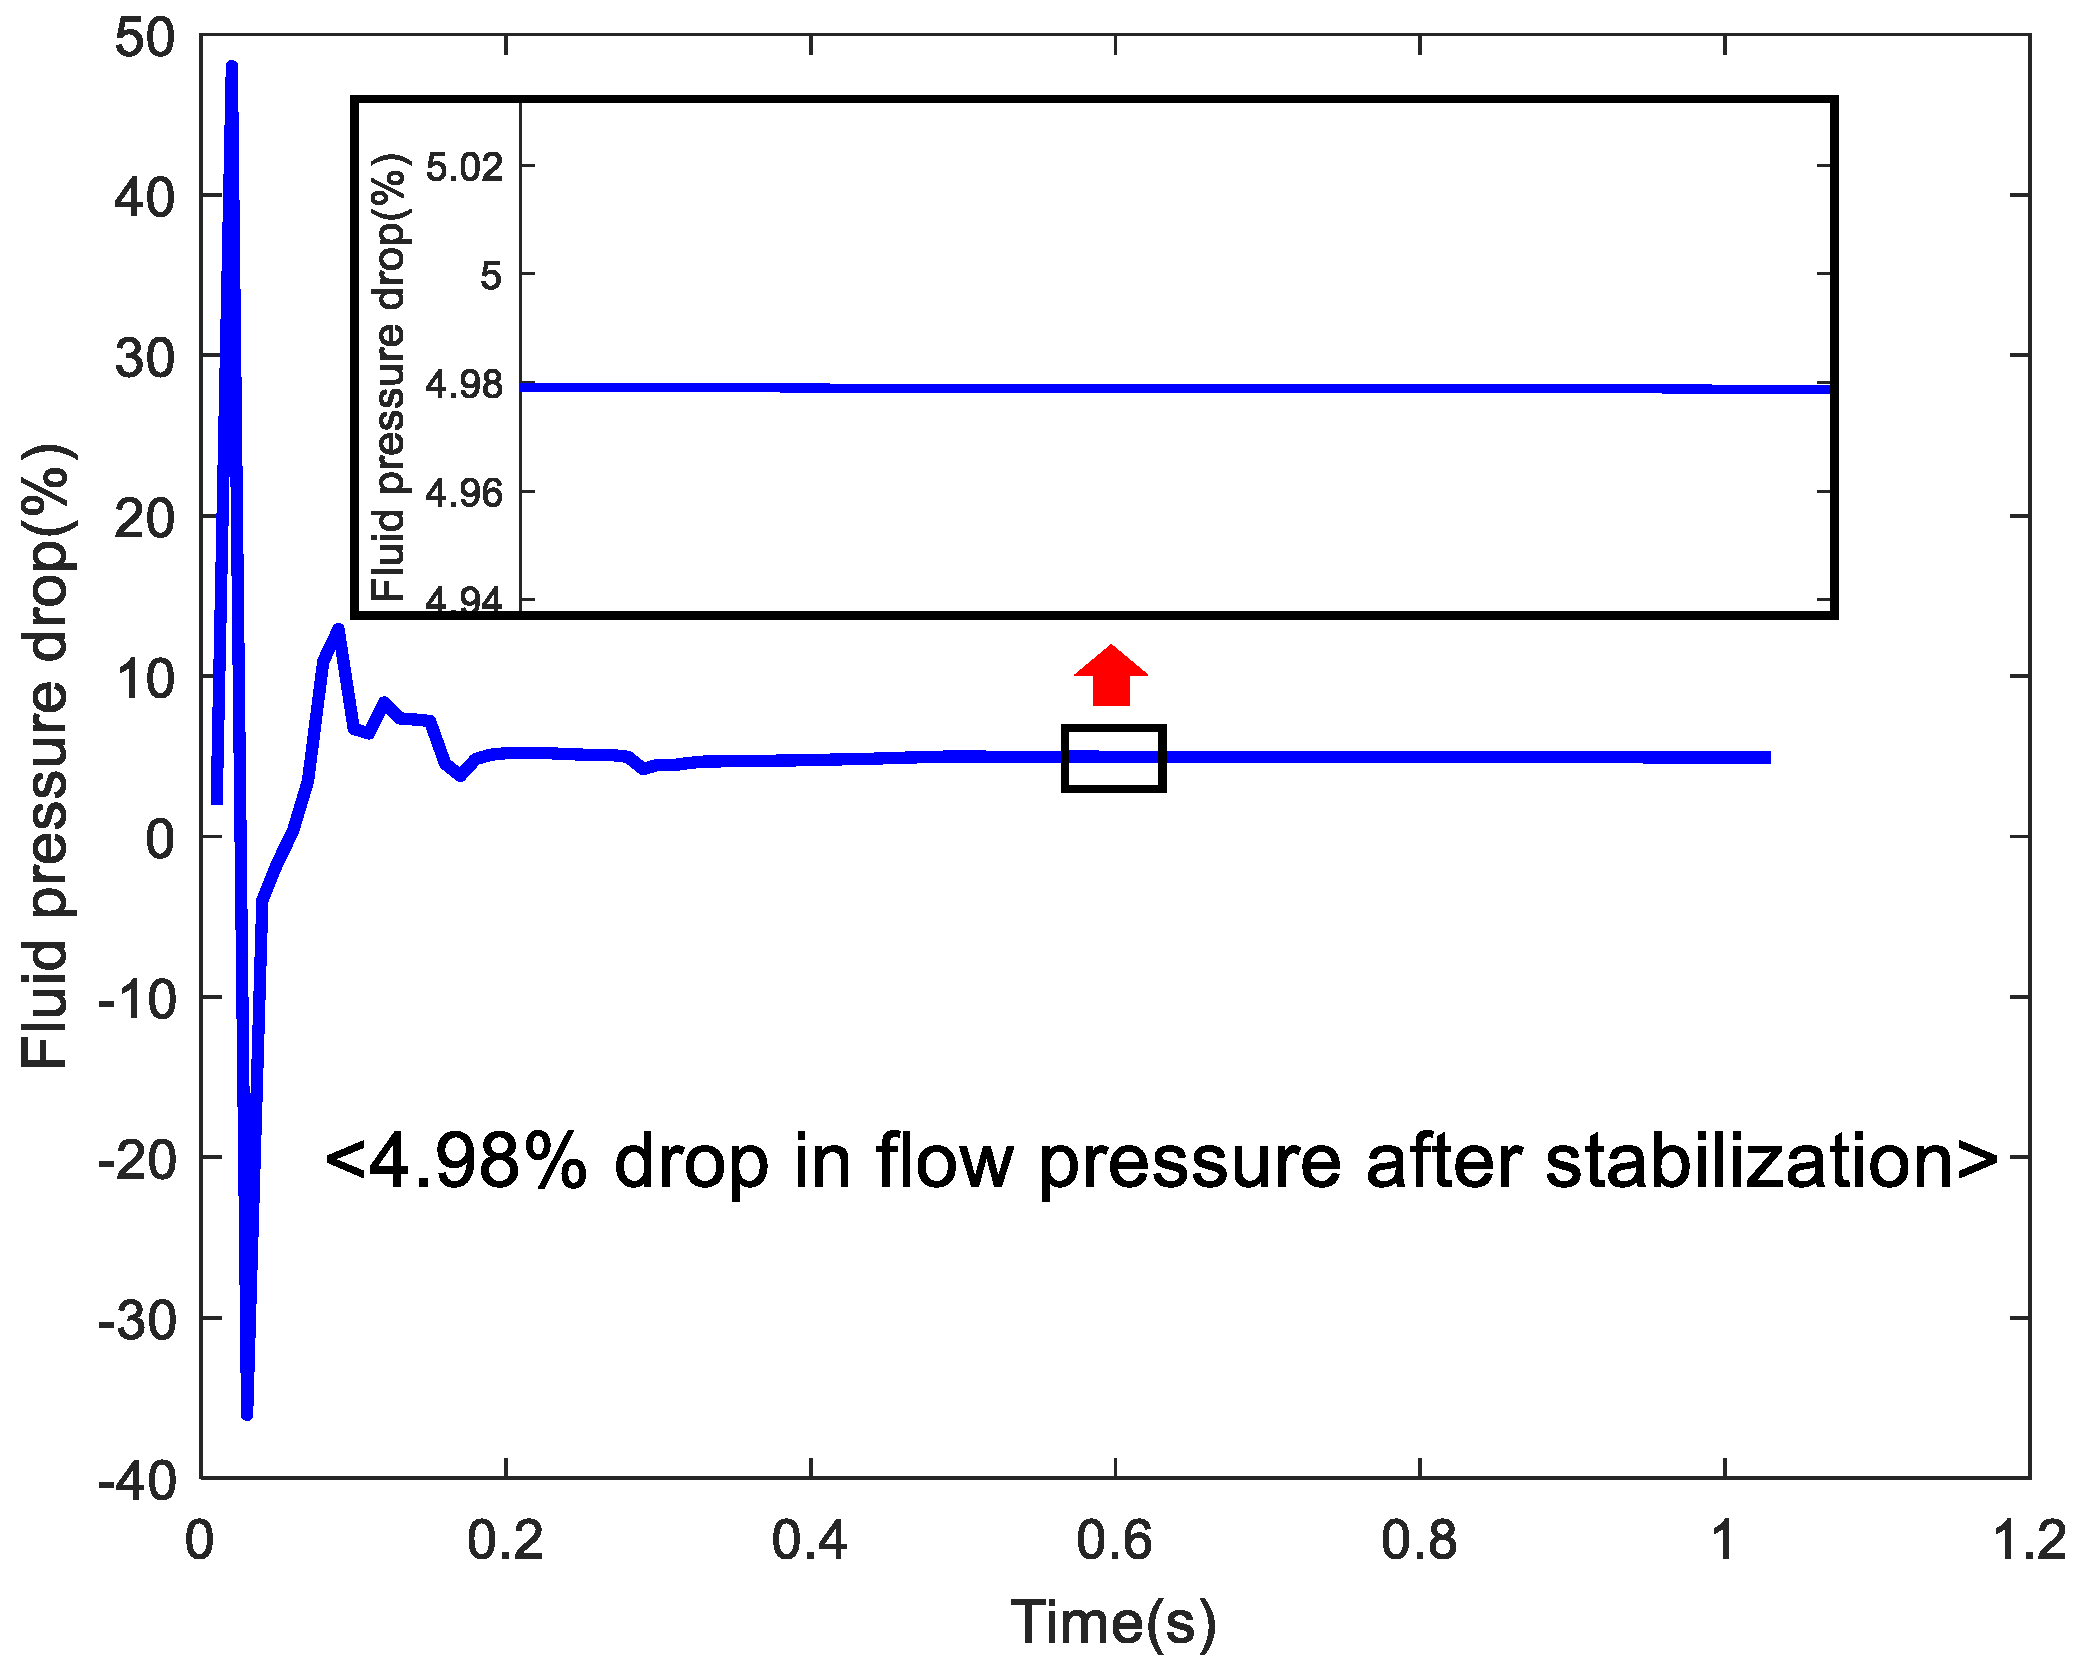
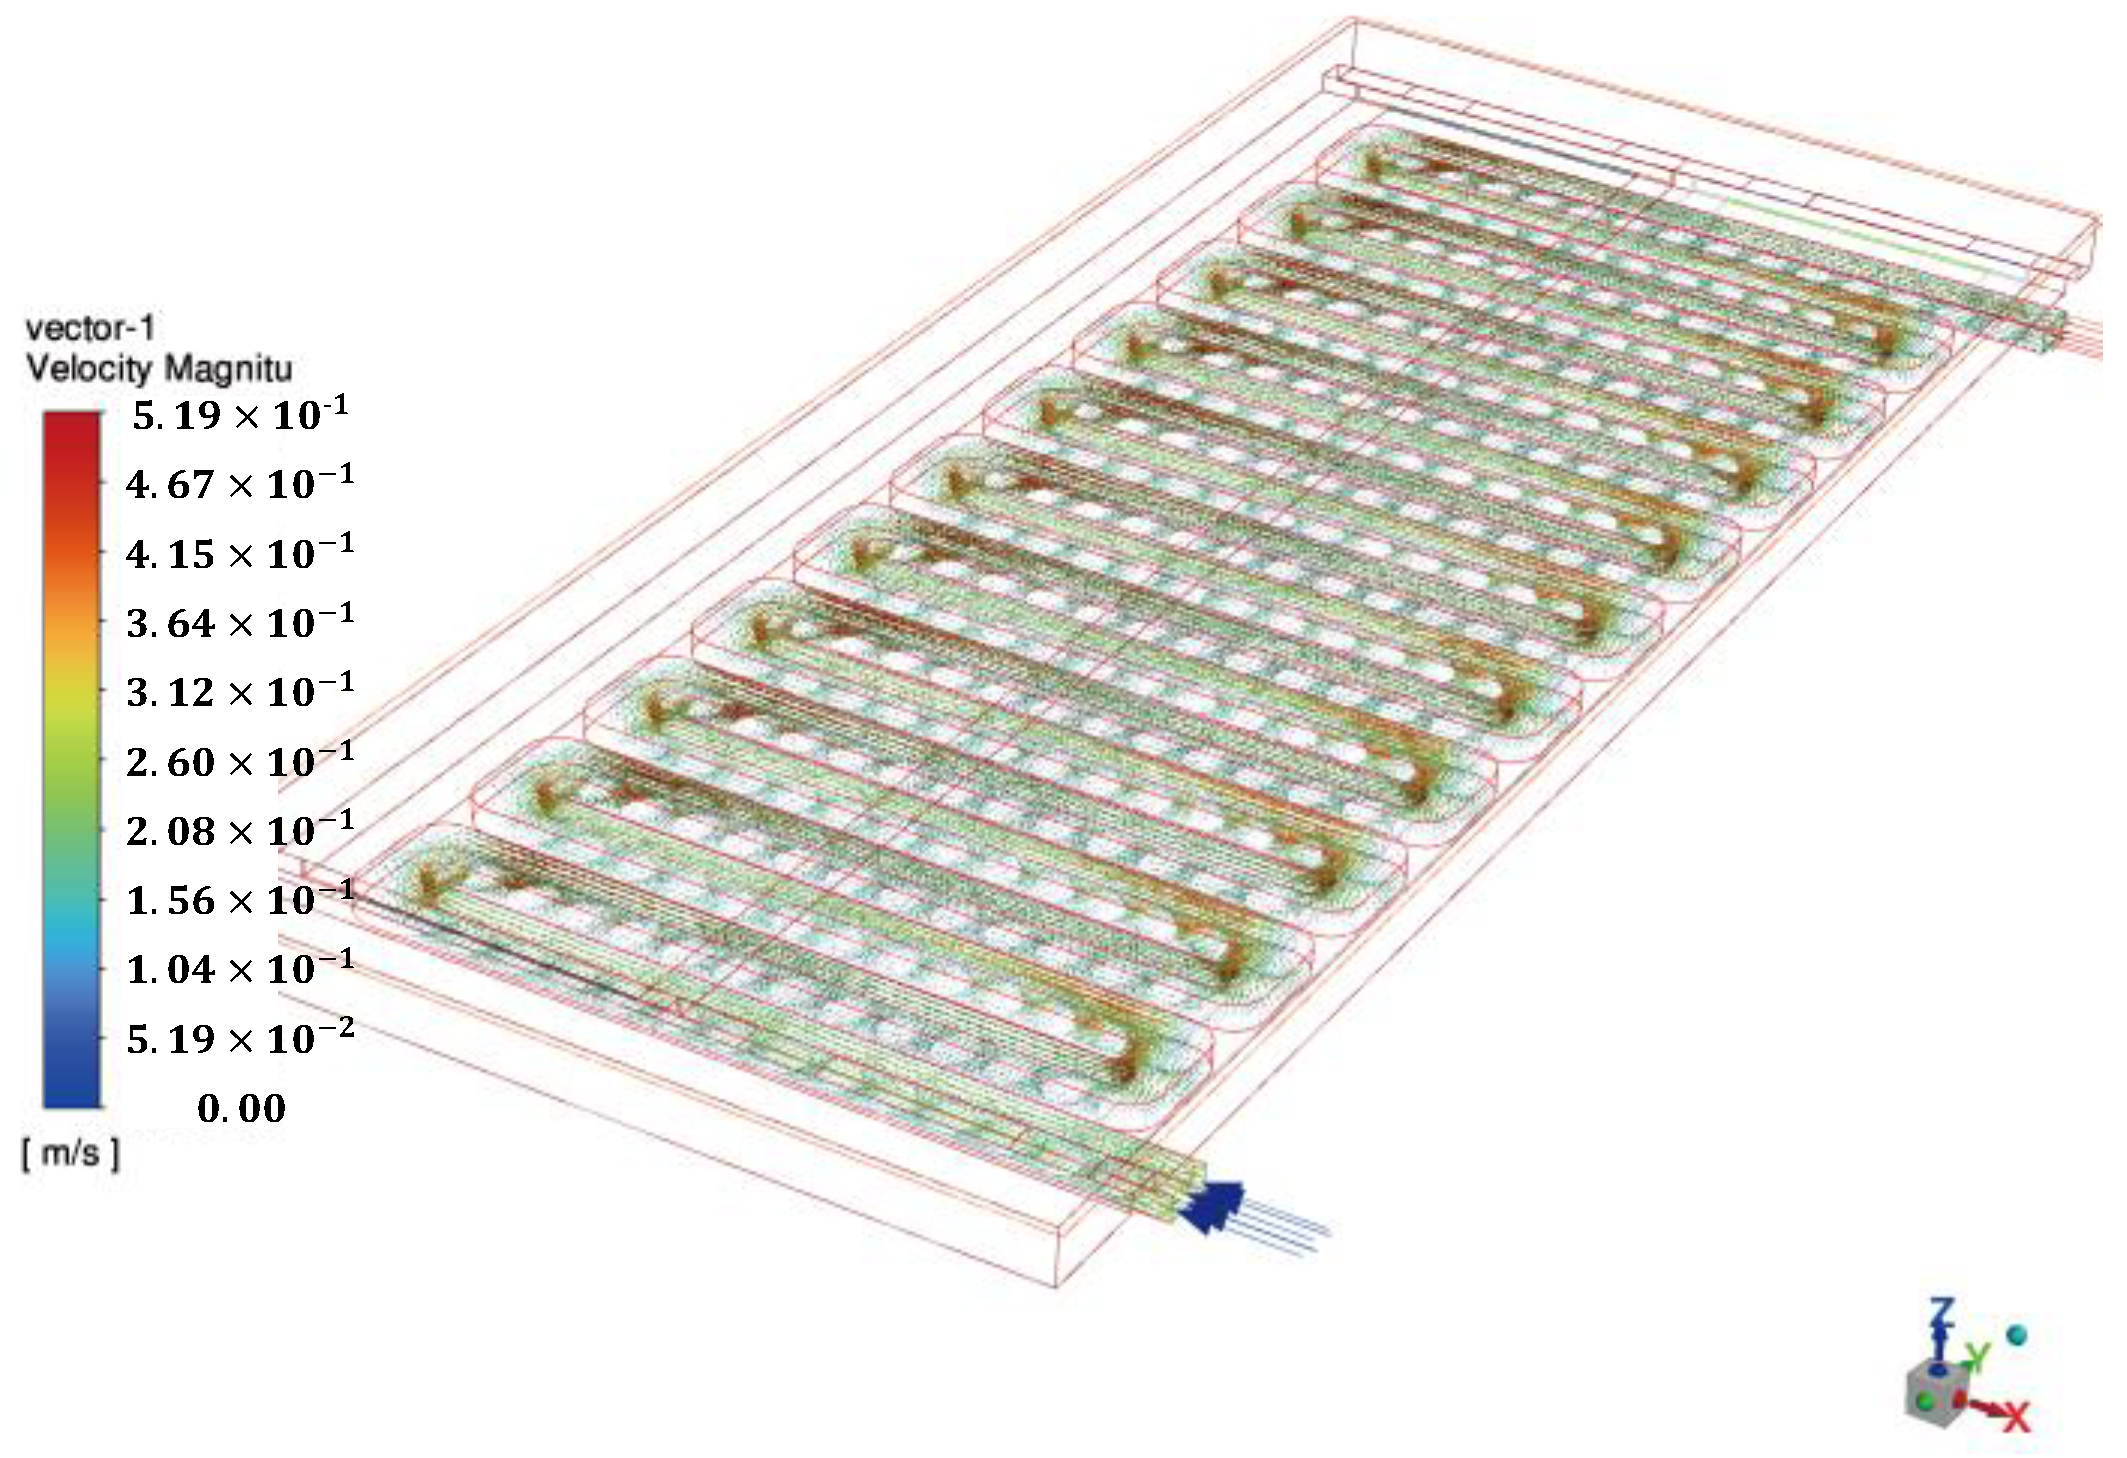
5.1. Performance Comparison of BFS Channel and Flat Type Channel

To evaluate the effect of this optimized structure relative to the original structure, the results are first compared with the flat-type channel.
The thermal cloud plots of the flat and BFS battery pack at the same flow velocity (0.28 m/s) are shown as Figure 6a,b. In order to clearly observe the difference between the two thermal clouds, the T m a x moment is taken for observation and the temperature interval is set from 25 °C to 40 °C. At this point, both structures show a distribution of increasing and then decreasing temperatures in the lateral direction. In contrast, the BFS channel produces a significant cooling effect through structural optimization. The T m a x in Figure 6a appears at the left of center and reaches close to 40 °C. However, the T m a x of Figure 6b appears on the right side and is only about 38 °C. In addition, to evaluate the temperature distribution of the 36 battery cells, two lines (x1, x2) are defined on the two battery modules. The measured positions are averaged between the positions of two conductive rows on each module. There are a total of 18 cells along the x-direction, and the conductive rows connect the cells two by two. The eight data points above plus the two data points at each end make a total of ten data points.
The temperature field distribution of the liquid cooling plate for both structures are shown as Figure 6c,d. In comparison, the BFS liquid cooling plate in Figure 6d exhibits a lower temperature field distribution on average. It can be seen that the temperature field of the pack shifts somewhat towards the outlet side and produces better cooling in the second half of the liquid cooling. The channel temperature on the inlet side is closer to the initial temperature, and this effect continues until after the sixth bend. Preliminary analysis suggests that this structure may have had some lifting effect on the flow field flow velocity to produce this temperature field backward shift. In addition, the uniformity of the temperature field of the liquid cooling plate is significantly improved after the structural optimization. Compared to the T m a x of 30 °C on the outlet side of the flat plate type, the T m a x on the outlet side is about 29 °C, and the area of the temperature field occupied by the high temperature is reduced by about 1/4.
The temperature profile along the x-direction is shown as Figure 6e. For each pack, the average of x1 and x2 in both modules is taken as comparative data. The equation of the fitted curve is as follows.
y f l a t = 4.2 × 10 5 x 7 + 7 × 10 4 x 6 + 0.0085 x 5 0.28 x 4 + 2.58 x 3 10.76 x 2 + 20.84 x + 24.88
y f i s h = 5.96 × 10 4 x 7 0.0233 x 6 + 0.3685 x 5 3 x 4 + 13.7 x 3 34.13 x 2 + 43 x + 16
where R f l a t 2 = 0.9631 , R f i s h 2 = 0.9788 .
For the flat panel type channel, the T m a x is 39.85 °C. There are multiple high temperature fluctuations in the x-direction with a maximum curvature of 2.58 (data points one and two). The Δ T m a x is 2.58 °C, showing a significant temperature inhomogeneity. In contrast, the optimized model has a maximum curvature of 1.41, and a flat fluctuation in the x-direction, with a Δ T m a x of only 2.27 °C. Moreover, its maximum temperature point undergoes a certain shift left, which is consistent with the previous findings. This also shows that it has better thermal performance results.

5.2. Orthogonal Experiments

There are three parameters that affect the thermal performance of the battery pack. The orthogonal test method can effectively obtain balanced samples of multiple factors by selecting representative cases. It can also reduce the number of tests for the experiment. In this experiment, four levels are set for each parameter in order to understand the effect of each parameter. The parameters are BFS notch diameter (D), BFS notch depth (H), and BFS notch spacing (S). The study indicators are T m a x and Δ T m a x . The values of the different parameters are given in Table 4.
In order to analyze the effect of the parameters of this structure on the thermal performance, 16 different parameters of the lower channel structure are designed. Some of the design drawings are shown in Figure 7.
Each set of orthogonal experiments is started at an initial temperature of 25 °C, and the parameter settings and results are shown in Table 5. T m a x represents the maximum temperature of the 36 cells in the pack during discharge in the BFS flow channel. Δ T m a x represents the maximum value of the difference between the maximum and minimum temperature of the 36 cells during discharge in the BFS flow channel. Δ T represents the difference between the maximum temperature of the 36 cells in the flat-type channel and the BFS channel. The results show that BFS channel produces some thermal performance optimization at different parameters compared to the T m a x of 39.85 °C and Δ T m a x of 2.58 °C under the flat-type channel. The T m a x and Δ T m a x of battery pack are optimized up to 10.8% and 16.7%, which occur in group 5 and group 2 respectively. The optimization effect of this structure is a result of a multi-parameter combination, and the optimization effect of different parameters for T m a x and Δ T m a x have different optimization effects, as shown in Figure 8. Therefore, it is necessary to analyze the effect of the three parameters on the two indicators so that the appropriate combination of parameters can be selected later according to the specific needs, and the best indicator optimization effect has been achieved.

5.3. Analysis of Experimental Results

In order to obtain the best combination of parameters, a computational analysis using an orthogonal table is performed to discriminate between primary and secondary factors. Therefore, the influence parameter Q is set, which is calculated as follows.
Q = M a x { K 1 , K 2 , K 3 , K 4 } M i n { K 1 , K 2 , K 3 , K 4 } #
where K i represents the average of the indicators corresponding to one parameter.
The results of the calculations are shown in Table 6. For the T m a x , S has the maximum Q, followed by D, and finally H. For Δ T m a x , the influence size is ranked as H > D > S. The analysis shows that the influence size of the parameters is different for different indicators. Therefore, the combination of parameters needs to be fully considered in the structural design to achieve the best thermal performance optimization.
Further, the influence between the structural parameters under each indicator is analyzed. The correlation between the three parameters is shown as Figure 9. For T m a x , there is a strong correlation between D and S, with a correlation coefficient of 0.8949, while there is almost no correlation between D and H, with a correlation coefficient of −0.01946. Therefore, the strong correlation between S and D should be fully considered for the optimal structural design of T m a x , and the parameter designs of S and D are relatively independent compared to H which means the correlation between them can be ignored. For Δ T m a x , the correlation between the parameters is not strong. The correlation coefficient between D and H is 0.7529, while the correlation coefficients of the other two parameters are about 0.5. It is indicated that the selection and adjustment of the three parameters should be adjusted in a small range to optimize the structural design of Δ T m a x . Therefore, the parameter design of Δ T m a x is more difficult than that of T m a x , which indicates that the temperature difference is more important in BTMS and more difficult to regulate.
In addition, the effect of different levels of a single parameter on battery cooling is analyzed. Obviously, the increase in D produces a larger heat exchange area. However, when D increases from 13 mm to 17.5 mm, T m a x has a slight increase of 0.055 °C rather than a decrease as shown in Figure 10a. Moreover, a larger increase of 0.052 °C in Δ T m a x occurs during this process. As D increases, T m a x and Δ T m a x produce a decrease in the overall trend, but with some degree of upward fluctuation.
T m a x reaches the best temperature of 38.72 °C at H = 2.5 mm, and subsequently shows an increasing trend again as shown in Figure 10b. Δ T m a x is positively related to H in the whole, while the worst uniformity of 2.28 °C occurs at H = 2.5 mm. This result shows a clear opposing relationship with T m a x . Therefore, the H should be appropriately increased to 3.25 mm to balance T m a x and Δ T m a x under comprehensive consideration.
Both T m a x and Δ T m a x show a trend of decreasing and then increasing with the increase of S as shown in in Figure 10c. Δ T m a x reaches the peak and valley value of 2.2375 °C one grade before T m a x . T m a x reaches the optimum value of 38.625 °C at the third grade S = 11 mm, but the Δ T m a x at this time has a large increase in value and the thermal uniformity is reduced. Therefore, the value around the second grade S = 9 mm should be selected to achieve the optimal thermal performance.

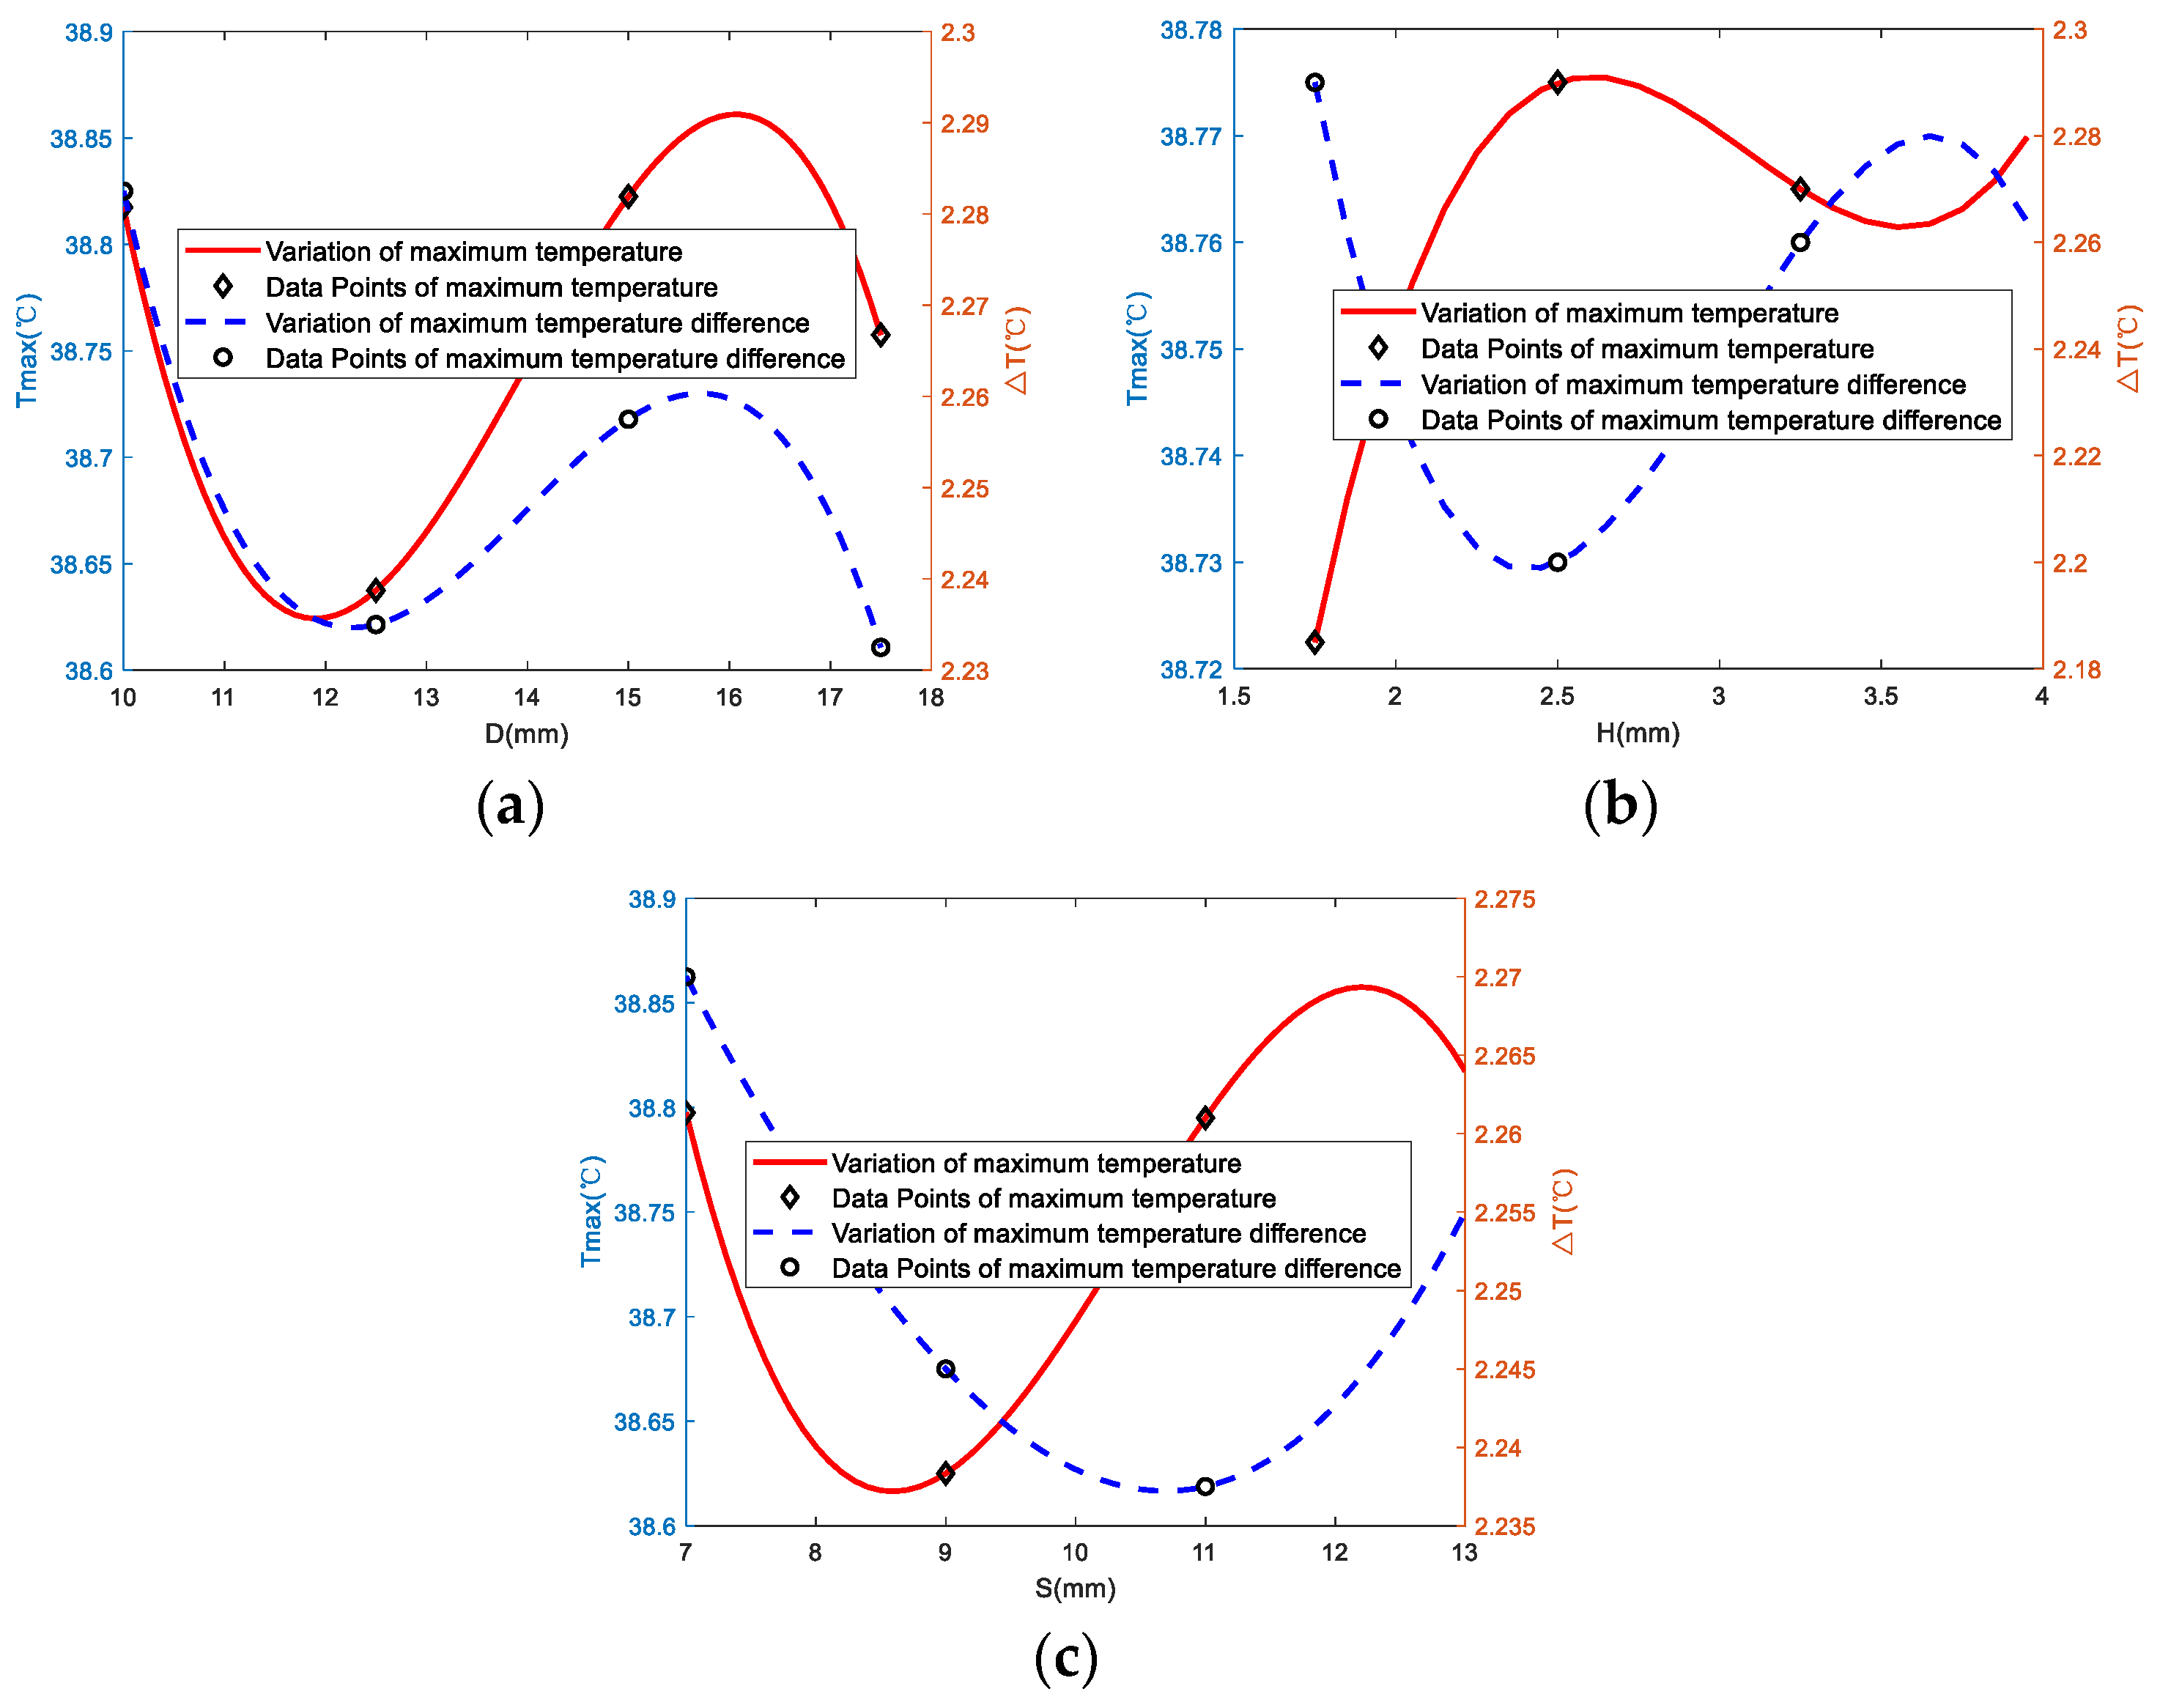
5.4. Analysis of BFS Structure Design Principles

The original intention of the structure design is to achieve a drag reduction effect using this bionic structure. Therefore, in order to observe the drag reduction effect of the BFS structure, the inlet and outlet flow velocity as well as the pressure are counted in the simulation as shown in Figure 11 and Figure 12.
Since the set initial flow rate of 0.28 m/s is the flow velocity in the water pump and the coolant is buffered somewhat before it enters the liquid cooling plate. Therefore, the flow velocity in the liquid cooling plate will be somewhat lower than the flow velocity in the water pump. After the steady state, the outlet flow velocities all have different degrees of increase from 0.258 m/s to 0.264 m/s compared to the flow velocity of 0.257 m/s at the outlet of the flat plate type flow channel, as shown in Figure 11. In addition, the flow channel pressure under this structure is reduced by 4.98%, as shown in Figure 12. In summary, this bionic notch structure can enhance the flow velocity by a maximum of 2.72% and reduce the flow pressure by 4.98%.
In order to investigate the principle of drag reduction in this structure, the fluid vector diagram of the liquid cooling plate flow channel is analyzed, as shown in Figure 13. It can be seen that a vortex of fluid is generated in the BFS groove microstructure as shown in Figure 14. The fluid vector diagram shows that this structure acts as a “mechanical gear” to push the coolant forward, greatly reducing the friction of the coolant and allowing the fluid to flow through the flow path efficiently. The tiny vortex formed in this structure creates a convection flow with the main flow direction of the coolant, which avoids direct collision between the coolant and the liquid cooling plate. As a result, the friction between the water and the liquid cooling plate becomes a water-to-water friction, reducing the friction during travel and acting as a drag reduction.
According to the previous statement, the coolant must flow from the blunt tip of the structure, which is essential for the structure to function. Figure 15 shows a vector diagram of the flow in the BFS notch when flowing from the tip. It can be seen that no previous reflux is generated in the BFS notch. Therefore, it also does not produce the previous thermal performance optimization effect and may even be counterproductive.

5.5. Heat Transfer Rate Analysis between Cell and Liquid Cooling Plate

To further verify the effectiveness of the above structure, the maximum heat transfer quantity between the liquid cooling plate and the battery module is counted, as shown in Figure 16. With the different parameters of the BFS structure, the drag reduction effect is different. The resulting flow velocity at different drag reduction effect also leads to a change in the heat transfer quantity. It can be seen that the distribution of the maximum heat transfer quantity between the cell and the liquid cooling plate is approximately the same as the flow velocity distribution in Section 4.2. The maximum heat transfer quantity of 503.41 W is reached at the third set. Its corresponding flow velocity is 0.263 m/s, which is second only to the maximum flow velocity of 0.264 m/s.

6. Conclusions

(1) In this study, a novel BTMS with a BFS structure is proposed with the aim of providing a solution for optimizing the thermal performance of battery packs with serpentine flow channels in industrial manufacturing.
(2) In this paper, the performance effects of the proposed BTMS are analyzed for different parameters, and the battery pack T m a x and Δ T m a x are optimized up to 10.8% and 16.7%, respectively. The effects of three parameters, D, H and S, are analyzed by the transient fluid thermal simulation results under 16 sets of orthogonal experiments, which provide references for the selection of subsequent design.
(3) The mechanism of action of the structure is also deeply explored in this study. It is found that vortex flow is generated in the microstructure, which reduces the friction of coolant and increases the flow velocity. This mechanism of action avoids the collision of coolant with the flow channel and increases the flow velocity by a maximum of 2.72% and reduces the flow pressure by 4.98%. Further research ideas are provided for BTMS using high viscosity with high density coolant.

Author Contributions

Formal analysis, P.L.; resources, D.M.; writing—original draft preparation, Y.M.; writing—review and editing, K.G.; supervision, H.C.; project administration, R.D. All authors have read and agreed to the published version of the manuscript.

Funding

This research received no external funding.

Data Availability Statement

The data presented in this study are available on request from the corresponding author. The data are not publicly available due to privacy.

Conflicts of Interest

The authors declare no conflict of interest.

References

  1. Hu, L.; Tian, Q.; Zou, C.; Huang, J.; Ye, Y.; Wu, X. A study on energy distribution strategy of electric vehicle hybrid energy storage system considering driving style based on real urban driving data. J. Renew. Sustain. Energy Rev. 2022, 162, 112416. [Google Scholar] [CrossRef]
  2. Wu, Y.; Huang, Z.; Zheng, Y.; Liu, Y.; Li, H.; Che, Y.; Peng, J.; Teodorescu, R. Spatial–temporal data-driven full driving cycle prediction for optimal energy management of battery/supercapacitor electric vehicles. J. Energy Convers. Manag. 2023, 277, 116619. [Google Scholar] [CrossRef]
  3. Fuhao, M.O.; Tian, Y.; Zhao, S.; Xiao, Z.; Zhiling, M.A. Working Temperature Effects on Mechanical Integrity of Cylindrical Lithium-ion Batteries. Eng. Fail. Anal. 2022, 137, 106399. [Google Scholar]
  4. Mali, V.; Saxena, R.; Kumar, K.; Kalam, A.; Tripathi, B. Review on battery thermal management systems for energy-efficient electric vehicles. Renew. Sustain. Energy Rev. 2021, 151, 111611. [Google Scholar] [CrossRef]
  5. Zhao, G.; Wang, X.; Negnevitsky, M.; Zhang, H. A review of air-cooling battery thermal management systems for electric and hybrid electric vehicles. J. Power Sources 2021, 501, 230001. [Google Scholar] [CrossRef]
  6. Lee, J.; Abidi, A.; Sajadi, S.M.; El-Shafay, A.S.; Degani, M.; Sharifpur, M. Study of the effect of the aspect ratio of a cylindrical lithium-ion battery enclosure in an air-cooled thermal management system. J. Energy Storage 2022, 45, 103684. [Google Scholar] [CrossRef]
  7. Chung, Y.; Kim, M.S. Thermal analysis and pack level design of battery thermal management system with liquid cooling for electric vehicles. Energy Convers. Manag. 2019, 196, 105–116. [Google Scholar] [CrossRef]
  8. Wu, W.; Wang, S.; Wu, W.; Chen, K.; Hong, S.; Lai, Y. A critical review of battery thermal performance and liquid based battery thermal management. Energy Convers. Manag. 2019, 182, 262–281. [Google Scholar] [CrossRef]
  9. Wu, W.; Liu, J.; Liu, M.; Rao, Z.; Deng, H.; Wang, Q.; Wang, S. An innovative battery thermal management with thermally induced flexible phase change material. Energy Convers. Manag. 2020, 221, 113145. [Google Scholar] [CrossRef]
  10. Zhang, J.; Li, X.; Zhang, G.; Wang, Y.; Guo, J.; Wang, Y.; Zhong, Z. Characterization and experimental investigation of aluminum nitride-based composite phase change materials for battery thermal management. Energy Convers. Manag. 2020, 204, 112319. [Google Scholar] [CrossRef]
  11. Liang, J.; Gan, Y.; Li, Y. Investigation on the thermal performance of a battery thermal management system using heat pipe under different ambient temperatures. Energy Convers. Manag. 2018, 155, 1–9. [Google Scholar] [CrossRef]
  12. Ren, R.; Zhao, Y.; Diao, Y.; Liang, L. Experimental study on preheating thermal management system for lithium-ion battery based on U-shaped micro heat pipe array. Energy 2022, 253, 124178. [Google Scholar] [CrossRef]
  13. Murali, G.; Sravya, G.S.N.; Jaya, J.; Vamsi, V.N. A review on hybrid thermal management of battery packs and it’s cooling performance by enhanced PCM. Renew. Sustain. Energy Rev. 2021, 150, 111513. [Google Scholar] [CrossRef]
  14. Wan, Z.; Wang, X.; Feng, C. Heat transfer performances of the capillary loop pulsating heat pipes with spring-loaded check valve. Appl. Therm. Eng. 2020, 167, 114803. [Google Scholar] [CrossRef]
  15. Zhang, F.; Liu, P.; He, Y.; Li, S. Cooling performance optimization of air cooling lithium-ion battery thermal management system based on multiple secondary outlets and baffle. J. Energy Storage 2022, 52, 104678. [Google Scholar] [CrossRef]
  16. Akbarzadeh, M.; Kalogiannis, T.; Jaguemont, J.; Jin, L.; Behi, H.; Karimi, D.; Berecibar, M. A comparative study between air cooling and liquid cooling thermal management systems for a high-energy lithium-ion battery module. Appl. Therm. Eng. 2021, 198, 117503. [Google Scholar] [CrossRef]
  17. Olabi, A.G.; Maghrabie, H.M.; Adhari, O.H.K.; Sayed, E.T.; Yousef, B.A.; Salamah, T.; Abdelkareem, M.A. Battery thermal management systems: Recent progress and challenges. Int. J. Thermofluids 2022, 15, 100171. [Google Scholar] [CrossRef]
  18. Kong, D.; Peng, R.; Ping, P.; Du, J.; Chen, G.; Wen, J. A novel battery thermal management system coupling with PCM and optimized controllable liquid cooling for different ambient temperatures. Energy Convers. Manag. 2020, 204, 112280. [Google Scholar] [CrossRef]
  19. Gao, R.; Fan, Z.; Liu, S. A gradient channel-based novel design of liquid cooling battery thermal management system for thermal uniformity improvement. J. Energy Storage 2022, 48, 104014. [Google Scholar] [CrossRef]
  20. Wang, N.; Li, C.; Li, W.; Chen, X.; Li, Y.; Qi, D. Heat dissipation optimization for a serpentine liquid cooling battery thermal management system: An application of surrogate assisted approach. J. Energy Storage 2021, 40, 102771. [Google Scholar] [CrossRef]
  21. Tang, Z.; Liu, Z.; Li, J.; Cheng, J. A lightweight liquid cooling thermal management structure for prismatic batteries. J. Energy Storage 2021, 42, 103078. [Google Scholar] [CrossRef]
  22. Yang, W.; Zhou, F.; Chen, X.; Li, K.; Shen, J. Thermal performance of honeycomb-type cylindrical lithium-ion battery pack with air distribution plate and bionic heat sinks. Appl. Therm. Eng. 2023, 218, 119299. [Google Scholar] [CrossRef]
  23. Liu, F.; Chen, Y.; Qin, W.; Li, J. Optimal design of liquid cooling structure with bionic leaf vein branch channel for power battery. Appl. Therm. Eng. 2023, 218, 119283. [Google Scholar] [CrossRef]
  24. Yang, W.; Zhou, F.; Liu, Y.; Xu, S.; Chen, X. Thermal performance of honeycomb-like battery thermal management system with bionic liquid mini-channel and phase change materials for cylindrical lithium-ion battery. Appl. Therm. Eng. 2021, 188, 116649. [Google Scholar] [CrossRef]
  25. Wang, J.; Liu, X.; Liu, F.; Liu, Y.; Wang, F.; Yang, N. Numerical optimization of the cooling effect of the bionic spider-web channel cold plate on a pouch lithium-ion battery. Case Stud. Therm. Eng. 2021, 26, 101124. [Google Scholar] [CrossRef]
  26. An, Z.; Zhang, C.; Gao, Z.; Luo, Y.; Dong, Y. Heat dissipation performance of hybrid lithium battery thermal management system using bionic nephrolepis micro-channel. Appl. Therm. Eng. 2022, 217, 119127. [Google Scholar] [CrossRef]
  27. Liu, H.; Gao, X.; Zhao, J.; Yu, M.; Niu, D.; Ji, Y. Liquid-based battery thermal management system performance improvement with intersected serpentine channels. Renew. Energy 2022, 199, 640–652. [Google Scholar] [CrossRef]
  28. Yin, B.; Zuo, S.; Xu, Y.; Chen, S. Performance of liquid cooling battery thermal management system in vibration environment. J. Energy Storage 2022, 53, 105232. [Google Scholar] [CrossRef]
  29. Cabeza, L.F.; Frazzica, A.; Chàfer, M.; Vérez, D.; Palomba, V. Research trends and perspectives of thermal management of electric batteries: Bibliometric analysis. J. Energy Storage 2020, 32, 101976. [Google Scholar] [CrossRef]
  30. Zichen, W.; Changqing, D. A comprehensive review on thermal management systems for power lithium-ion batteries. Renew. Sustain. Energy Rev. 2021, 139, 110685. [Google Scholar] [CrossRef]
  31. Jithin, K.V.; Rajesh, P.K. Numerical analysis of single-phase liquid immersion cooling for lithium-ion battery thermal management using different dielectric fluids. Int. J. Heat Mass Transf. 2022, 188, 122608. [Google Scholar] [CrossRef]
  32. You, Y.; Wang, S.; Lv, W.; Chen, Y.; Gross, U. A CFD model of frost formation based on dynamic meshes technique via secondary development of ANSYS fluent. Int. J. Heat Fluid Flow 2021, 89, 108807. [Google Scholar] [CrossRef]
  33. Bellwald, B.; Planke, S.; Lebedeva-Ivanova, N.; Piasecka, E.D.; Andreassen, K. High-resolution landform assemblage along a buried glacio-erosive surface in the SW Barents Sea revealed by P-Cable 3D seismic data. Geomorphology 2019, 332, 33–50. [Google Scholar] [CrossRef]
  34. Dai, W.; Zhang, W.; Zheng, Z.; Li, J. Investigation of micron-sized fish-scale surface structures on tool steel surfaces using laser galvanometer scanning. Appl. Surf. Sci. 2019, 470, 1111–1121. [Google Scholar] [CrossRef]
  35. Park, S.; Jang, D.S.; Lee, D.; Hong, S.H.; Kim, Y. Simulation on cooling performance characteristics of a refrigerant-cooled active thermal management system for lithium ion batteries. Int. J. Heat Mass Transf. 2019, 135, 131–141. [Google Scholar] [CrossRef]
  36. Wu, W.; Wu, W.; Wang, S. Thermal management optimization of a prismatic battery with shape-stabilized phase change material. Int. J. Heat Mass Transf. 2018, 121, 967–977. [Google Scholar] [CrossRef]
  37. Yun, S.; Kwon, J.; Cho, W.; Lee, D.; Kim, Y. Performance improvement of hot stamping die for patchwork blank using mixed cooling channel designs with straight and conformal channels. Appl. Therm. Eng. 2020, 165, 114562. [Google Scholar] [CrossRef]
Figure 1. (a) Battery pack structure (b) Side view of liquid cooling plate.
Batteries 09 00134 g001
Figure 2. (a) BFS notch profile (b) Schematic diagram of the flow path of the liquid cooling plate with the BFS structure.
Batteries 09 00134 g002
Figure 3. (a) Calculation results using different number of grids in the same time period. (b) Schematic of the grid structure of the cell envelope.
Batteries 09 00134 g003
Figure 4. Experimental operation process diagram.
Batteries 09 00134 g004
Figure 5. Comparison between simulated temperature data and actual temperature data for 1C discharge.
Batteries 09 00134 g005
Figure 6. (a) Thermal cloud of cell pack at T m a x of flat type channel (b) Thermal cloud of cell pack at T m a x of BFS type channel (c) Thermal cloud of liquid cooling plate at T m a x of flat type channel (d) Thermal cloud of liquid cooling plate at T m a x of BFS type channel (e) Comparison of average values of temperature along x1 and x2 for both structures.
Batteries 09 00134 g006
Figure 7. (a) Flow channel design drawings for groups I (b) Flow channel design drawings for group III (c) Flow channel design drawings for group XII (d) Flow channel design drawings for group XVI.
Batteries 09 00134 g007
Figure 8. (a) Temperature cloud of the battery pack for group I (b) Temperature cloud of the battery pack for group III (c) Temperature cloud of the battery pack for group XII (d) Temperature cloud of the battery pack for group XVI.
Batteries 09 00134 g008aBatteries 09 00134 g008b
Figure 9. Thermal diagram of the correlation of each parameter at T m a x and Δ T m a x .
Batteries 09 00134 g009
Figure 10. (a) Curve of the effect of D on T m a x and Δ T m a x (b) Curve of the effect of H on T m a x and Δ T m a x (c) Curve of the effect of S on T m a x and Δ T m a x .
Batteries 09 00134 g010
Figure 11. Comparison of the inlet and outlet flow velocity of 16 groups of BFS channels and the inlet and outlet flow velocity of flat flow channels.
Batteries 09 00134 g011
Figure 12. Comparison of the pressure of BFS channel and flat type channel.
Batteries 09 00134 g012
Figure 13. Liquid cooling plate flow channel fluid vector diagram.
Batteries 09 00134 g013
Figure 14. Vector diagram of the “gear” return flow direction formed in the BFS structure.
Batteries 09 00134 g014
Figure 15. Flow vector diagram for the counterflow case in the BFS structure.
Batteries 09 00134 g015
Figure 16. Heat transfer quantity between cell and liquid cooling plate in group 16.
Batteries 09 00134 g016
Table 1. Battery pack structure parameters.
SpecificationsValue
Battery pack864 × 174 × 159 mm
Insulation layer1 × 174 × 168 mm
Liquid cooling plate991 × 411 × 51 mm
End plate912 × 177 × 159 mm
Box cover991 × 411 × 169 mm
Conductive row72 × 26 × 2 mm
Nominal voltage133.2 V
Energy (Cell measurement value calculation)18 kWh
Table 2. Lithium battery parameters.
SpecificationsValue
Cell Length148 mm
Cell width27 mm
Cell height97 mm
Weight0.88 kg
AC internal resistance≤0.1 mΩ
Nominal capacity50 Ah
Nominal Voltage3.7 V
Life cycle≥2000
Maximum allowable charging temperature range0–55 °C
Table 3. CFD calculation parameters.
Specific Heat
(J/kg·K)
Density
(kg/m3)
Thermal Conductivity
(W/m·K)
Dynamic Density
(Pa·s)
Battery pack1033221817.4, 5.3, 23
Thermal pad180020001.8
Epoxy plate158118000.2
Insulated board126011500.2
Aerogel11802300.025
Conductive row9002700243
Cabinet9002700209
Coolant (25/30/35/40 °C)328110730.380.00394
330010710.3840.00339
339910660.3910.00256
335810630.3940.00226
Insulation layer1700650.034
Heating film113018401.2
Table 4. Factor level parameters.
Level1234
D1012.51517.5
H1.752.53.254
S791113
Table 5. Parameter settings and results of 16 sets of orthogonal experiments.
GroupsCaliber (mm)Breadth (mm)Density (mm) Δ T   ( ° C ) T m a x   ( ° C ) Δ T m a x   ( ° C )
1101.7570.9438.912.37
2102.591.138.752.15
3103.25111.0438.812.28
4104131.0538.802.33
512.51.7591.6138.242.27
612.52.571.0738.782.24
712.53.25131.0938.762.19
812.54111.0838.772.24
9151.7511138.852.25
10152.5131.0338.822.23
11153.2571.0538.802.28
1215491.0338.822.27
1317.51.75130.9638.892.27
1417.52.5111.138.752.18
1517.53.2591.1638.692.29
1617.5471.1538.702.19
Table 6. Results of orthogonal experimental analysis.
Indicators Parameters
DHS
T m a x K 1 38.817538.722538.7975
K 2 38.637538.77538.625
K 3 38.822538.76538.795
K 4 38.757537.772538.8175
Q0.18500.05250.1925
Δ T m a x K 1 2.28252.292.27
K 2 2.2352.22.245
K 3 2.25752.262.2375
K 4 2.23252.25752.255
Q0.050.090.0325
Disclaimer/Publisher’s Note: The statements, opinions and data contained in all publications are solely those of the individual author(s) and contributor(s) and not of MDPI and/or the editor(s). MDPI and/or the editor(s) disclaim responsibility for any injury to people or property resulting from any ideas, methods, instructions or products referred to in the content.

