Article

Analysis of Peukert Generalized Equations Use for Estimation of Remaining Capacity of Automotive-Grade Lithium-Ion Batteries

by
Nataliya N. Yazvinskaya
1,*,
Mikhail S. Lipkin
2,
Nikolay E. Galushkin
3 and
Dmitriy N. Galushkin
3
1
Department of Cybersecurity of Information Systems, Don State Technical University, Rostov-on-Don 344000, Russia
2
Department of Chemical Technologies, Platov South-Russian State Polytechnic University, Novocherkassk 346428, Russia
3
Laboratory of Electrochemical and Hydrogen Energy, Don State Technical University, Shakhty 346500, Russia
*
Author to whom correspondence should be addressed.
Batteries 2022, 8(9), 118; https://doi.org/10.3390/batteries8090118
Submission received: 25 July 2022 / Revised: 17 August 2022 / Accepted: 1 September 2022 / Published: 7 September 2022
(This article belongs to the Special Issue Feature Papers to Celebrate the First Impact Factor of Batteries)

Abstract

:
In this paper, it is shown that the Peukert generalized equations C = Cm/(1 + (i/i0)n), C = 0.522Cmtanh((i/i0)n/0.522)/(i/i0)n and C = Cmerfc((i/ik − 1)/(1/n))/erfc(−n) are applicable for capacity estimation of the automotive-grade lithium-ion batteries within the discharge current range, from 0 to 10 Cn. Additionally, it is shown here that all the parameters (Cm, n, i0 and ik) in the Peukert generalized equations under study have a clear physical meaning, unlike in the classical Peukert equation, in which all the parameters are just empirical constants. In addition, it is shown that, in the case of lithium-ion batteries, the dependence of their released capacity on the discharge current reflects the phase transition statistical pattern in the electrodes’ active substance, which follows the normal distribution law. As the Peukert equation is used in many analytical models, the better electrochemical and physical meaning and understanding of this equation and its clarification are of great practical importance.

1. Introduction

Currently, environmentally friendly vehicles are being developed intensively, including hybrid-electric vehicles (HEVs), battery-electric vehicles (BEVs) and plug-in hybrid-electric vehicles (PHEVs) [1,2,3,4,5]. In electric vehicles of all kinds (xEV), large-format lithium-ion batteries are used.
When lithium-ion batteries are used in electric vehicles, one of the problems is the exact estimation of the remaining capacity of these batteries. Electrochemical models of batteries built on the basis of fundamental chemical and physical laws are the most accurate [6,7,8]. However, Hausmann, in his paper [9], showed that for practical use, the electrochemical models of batteries are unsuitable. Firstly, electrochemical models cannot be calculated by on-board computers of electric vehicles due to their great complexity. Secondly, when batteries in electric vehicles are replaced with batteries of other types or from other manufacturers, the used electrochemical models require some complex calibration. Thirdly, many customers require that the parameters of battery models be determined without disassembling those batteries.
That is why, usually in practice, in order to determine various parameters of batteries, analytical models are used [9,10,11,12], as well as nonlinear structural models [13,14,15] that are not too complex and can be calculated by the on-board computers of the electric vehicles. The analytical models were constructed using empirical equations, whose parameters were found from the experimental data.
In our opinion, the Hausmann analytical model [9] is the most promising analytical model for determining a battery’s remaining capacity. The Hausmann model [9] is based on the empirical Peukert equation and on the empirical dependence of the battery’s capacity on temperature. This model makes it possible to estimate the battery’s remaining capacity with a relative error of no more than 5% [9].
Additionally, it should be noted that analytical models are used when the investigated processes are poorly understood, so it is impossible to build an electrochemical model of these processes. For example, this is true for the case of modeling thermal runaway in batteries [16,17] or the same for hydrogen accumulation in electrodes during the batteries’ operation [18,19,20], etc.
Of course, there have been a lot of other developed models and methods for estimating a battery’s remaining capacity. One of the earliest methods was the estimation of the battery’s remaining capacity based on the open circuit voltage [21]. However, in the conditions of the dynamic operation of a battery, this method is inaccurate, since it allows for an error of up to 20% [22]. In addition, this method is inapplicable at all for the lithium-iron-phosphate batteries (LiFePO4), distinguished by their flat discharge curves [23]. Among other models for a battery’s remaining capacity estimation, there are many analytical models based on the Kalman filter and the fuzzy logic [24,25,26,27,28]. These models provide more accurate estimates of a battery’s remaining capacity [24]. Nevertheless, our experiments have shown that in the case of a battery’s dynamic operation, the use of those models is associated with a possible error of up to 10% [29].
Currently, most often for a battery’s remaining capacity estimation, a combination of the two following methods is used. The first one is counting the ampere-hours spent by a battery in a particular discharge cycle and subtracting the resultant value from the number of the ampere-hours spent by the battery in its previous full discharge cycle. The second method consists of a voltage profile use. This method has a number of disadvantages noted in [1], as well.
This research is aimed at analyzing the most well-known Peukert generalized equations and selecting an equation, which corresponds most accurately to the available experimental data for automotive-grade lithium-ion batteries. The achievement of the aforementioned goals will provide a more accurate estimation of the remaining capacities of those batteries.

2. Theory

In electric vehicles, lithium-ion batteries work in dynamic mode. In this case, the discharge currents of the batteries change a lot. The Hausmann analytical model [9] was developed, specially, for estimating the remaining capacities of batteries during their function in the dynamic mode. The model is as follows.
C t = C m i = 0 t I e f f ( i i , T i ) Δ t ,   I e f f ( i t , T t ) = f 1 ( i t ) f 2 ( T t ) = γ ( i t ) α ( T r e f T t ) β
where ∆t is the time-step; it, Tt and Ct are the current, temperature, and remaining capacity of a battery at time t, respectively; α, β and γ are empirical constants; Cm is the battery’s top capacity; Tref is the reference temperature for the tested battery (298 °K).
In the Hausmann Model (1), the entire battery discharge time range is divided into very small time intervals, ∆t = 1 s. As the intervals ∆t are very small, the temperature and the current inside of those small intervals of time can be considered to be constant. Hence, in every time interval ∆t, it is possible to use empirical equations expressing dependencies of the released capacity on current and temperature, experimentally found at constant currents and temperatures. In the Hausmann Model (1), for the dependence calculation of the released capacity on the discharge current, the classical Peukert equation [30] is used, which is written often in the following form [9,10]:
C = A i n
where C is the battery discharge capacity, i is the discharge current, and A and n are empirical constants.
In [10], it is proven that in the Hausmann Model (1), the function Ieff (i,T) is related to the dependence C(i,T) of capacity on the discharge current and temperature by the following ratio:
C ( i , t ) = C m I e f f ( i , T ) / i
From Equations (1) and (3), we obtain that in the Hausmann Model (1), at every time interval ∆t, the battery released capacity is related to the discharge current and temperature by the following empiric equation:
C ( i , T ) = C m γ i n ( T T r e f ) β ,   n = α 1
The first factor in Equation (4) is the classical Peukert Equation (2). The second factor determines the dependence of the battery’s released capacity on the temperature C(T).
C ( T ) = C m r e f ( T T r e f ) β ,   C m = C mref ,   A = K / γ
where Cmref is the battery’s top capacity at temperature Tref.
However, Equation (5) can be used in battery models only in a small temperature range because it contains a number of contradictions. Firstly, in Equation (5), C(T) = 0 at T = 0, whereas, in fact, C(T) = 0 in the battery at temperatures not close to zero but to the freezing point of the electrolyte. Secondly, in Equation (5), with the temperature growth, the battery’s release capacity C(T) grows constantly, as well. However, in a battery, C(T) cannot grow indefinitely because it is limited by the capacity, which is obtained by the battery when the battery is charged up.
In paper [10], the equation for the dependence C(T) is proposed, which is devoid of these disadvantages. It is presented as such:
C ( T ) = C m r e f K ( T T k T r e f T k ) β ( K 1 ) + ( T T k T r e f T k ) β
where Tk is the temperature, at which C(T) = 0, i.e., the temperature close to the electrolyte freezing point; Cmref is the top capacity released by a battery at temperature Tref as C(Tref) = Cmref; and K is an empiric constant.
When T → ∞ then C(T)→CmrefK. Therefore, the physical meaning of the parameter K is as follows: it indicates how many times (theoretically) the battery’s capacity in Equation (6) can be increased with the temperature growth of the battery as compared to the capacity Cmref.
Additionally, the classical Peukert Equation (2) cannot be used in battery models at any discharge current. Indeed, according to the classical Peukert Equation (2), when the discharge current decreases, the battery’s released capacity tends to go to infinity, which is devoid of any physical meaning. In addition, the classical Peukert Equation (2) always has a concave dependence C(i) for n > 0, while the experimental curve C(i) for lithium-ion batteries has both concave and convex sections. Now there are generalizations of the Peukert Equation (2) that do not contain the noted drawback [10]:
C = A 1 + B i n
C = A i n tanh ( i n B )
where A, B and n are empiric constants.
Additionally, there exist some other equations and methods for calculating the battery’s released capacity [31,32]. However, our studies have shown [33] that Equations (7) and (8) correspond most accurately to the experimental data for the small-format lithium-ion batteries. Here, we investigate the applicability of these equations for the large-format automotive-grade lithium-ion batteries.
During the battery discharge process, the phase transition takes place of the active substance of the electrodes. This phase transition occurs from the phases of the active substance corresponding to the battery’s full charge to the phases corresponding to the battery’s full discharge. However, often the phase transitions are described by the complementary error function [34]:
C ( i ) = A 2 e r f c ( i i k 2 σ )
where σ is the standard deviation and ik is the average of the statistical variable i.
Therefore, let us analyze Equation (9).
For making comparison between the experimental data and Equations (7)–(9), we will rewrite the latter in a more convenient and more understandable form:
C = C m 1 + ( i i 0 ) n
C = 0.522 C m ( i i 0 ) n tanh ( ( i i 0 ) n 1 0.522 )
C = C m e r f c ( n ) e r f c ( i / i k 1 1 / n )
For all Equations (10)–(12), if i→0, CCm. Due to each of Equations (10)–(12), the battery capacity C grows with the current decrease (at n > 0), and Cm is the battery’s top capacity.
In Equations (10) and (11), C(i0) = Cm/2 and, subsequently, the parameter i0 are equal to a current, at which the battery’s released capacity C is twice less than its top capacity. For Equation (12), C(ik) = Cm/erfc(−n) and, subsequently, the parameter ik are equal to the current, at which the battery’s released capacity C is erfc(−n) times less than its top capacity.
For batteries of diverse capacity, it is convenient to compare Equations (10)–(12) in the standardized coordinates (C/Cm, i/i0 (or i/ik)) and not in the ordinary coordinates (C, i). In the standardized coordinates, the curves of the capacity dependence on the discharge currents will not depend on the battery’s top capacity.
In order to understand clearly the physical meaning of the parameter n in the Equations (10)–(12), let us consider the following equations:
lim i i 0 d ( C ( i ) / C m ) d ( i / i 0 ) = n 4         ( for   Equation   ( 10 ) )
lim i i 0 d ( C ( i ) / C m ) d ( i / i 0 ) = 0.583 n       ( for   Equation   ( 11 ) )
lim i i k d ( C ( i ) / C m ) d ( i / i k ) = 2 n e r f c ( n ) π = funl ( n )     ( for   Equation   ( 12 ) )
Figure 1 shows the comparison between the function fun1(n) and the function fun2(n) in the following form:
fun2 ( n ) = n π
In Equation (12), n > 1.5, in this case, fun1(n) ≈ fun2(n).
Hence, in Equations (10)–(12), the parameter n at the point i = i0 (or i = ik) determines (accurately up to the constant) the decrease rate of the battery’s release capacity (13)–(15).
Thus, all the parameters (Cm,i0, ik and n) in Equations (10)–(12) have a clear physical meaning: Cm is the battery’s top capacity; i0 (for Equations (10) and (11)) is the current at which the released battery capacity is twice less than its top capacity, since C(i0) = Cm/2; ik (for Equation (12)) is the current, at which the released capacity of the battery is erfc(−n) times less than its top capacity, since C(ik) = Cm/erfc(−n); n (accurately up to the constant) is the rate of decrease in the released battery capacity at the point i = i0 (or i = ik) in coordinates (C/Cm, i/i0 (or i/ik)) (13)–(15), while the parameters (A, B and n) in Equations (7)–(9) are just empirical coefficients.
It should be noted that in our previous paper [33], it was experimentally shown that Equations (10)–(12) correspond very well to experimental data for small-format lithium-ion batteries with cathodes: LiMn2O4, LiCoO2 and LiNiMnCoO2. Moreover, the average relative error of experimental data approximation by Equations (10)–(12) decreased in the following sequence of Equations (10)–(12). Thus, Equation (12) corresponded best to the experimental data. This statement is also true for the large-format batteries that we studied in this paper.

3. Experimental Methodology

For cycling in our experiments, we used commercial automotive-grade lithium-ion batteries, whose parameters are shown in Table 1.
Charging of the lithium-ion batteries was performed with the use of an electrochemical workstation ZENNIUM and the potentiostat PP242. Charging was conducted in the mode of constant current and constant voltage (CC/CV) according to the parameters given in Table 1. This workstation makes it possible to charge batteries with the highest working current of 40 A.
For a discharging battery, the electronic load ITECH IT8945-150-2500 was used. This electronic load makes it possible to discharge batteries with the highest working current of 2500 A. Discharging was conducted in the mode of constant current (CC).
The batteries’ temperatures were controlled by four LM35 temperature sensors fastened at different points on each battery.
For parameter measurements, the batteries were placed into the climatic chamber Binder MK240 at a temperature appropriate for a specific measurement session. Before the parameters’ measurements, each battery was kept in the climatic chamber for five hours so that the entire battery could acquire the required temperature measurements. In addition, in order to strengthen the heat exchange and the batteries’ cooling down when the batteries were discharged with large currents, a number of heat sinks were attached to them using special clamps and a heat-conducting paste. The experiments used heat sinks that cool processors in computers. Those precautions did not let the temperature of the batteries rise above 50 °C at any discharge current.
In fact, in our experiments, these measures stabilized the temperature of the batteries near the temperature set in the climatic chamber. In addition, Section 4.1 experimentally proves that the relative deviation of the capacity from the average value, in the temperature range from 25 to 55 °C makes less than 1%. Therefore, in this temperature range, it is possible to check the corresponding Equations (10)–(12) with the experimental data without taking into account the effects of temperature. In the case of a real operating state of the batteries, the temperature factor must be taken into account in the form of Equation (6). With the purpose of the statistical data volumes increasing, simultaneously, experiments were conducted with three batteries of each type (Table 1) at a certain discharge current and a certain temperature.
Each experiment included the following stages:
Firstly, preliminary experiments using new batteries under study (Table 1) showed that in the first 6–7 charge–discharge cycles, the battery’s parameters changed. Then the battery’s parameters stabilized. Changing the battery’s parameters (in particular, the capacity realized by the batteries) is associated with the formation of the SEI layer. This phenomenon is typical for all lithium-ion batteries [33]. Therefore, for the purpose of the SEI layer stabilization in the electrodes of new batteries, nine training cycles were performed in accordance with the parameters given in Table 1. However, if the capacity of the three batteries under study in the last three cycles differed by more than 5%, some additional training cycles were performed (Table 1), or the troublesome battery was replaced with another, more stable battery.
Secondly, the charging of the batteries was performed according to the parameters given in Table 1. Discharging of the batteries was performed at a current range from 0.2 Cn to approximately 10 Cn (Cn is the battery rated capacity).
Thirdly, the measurements were taken for three batteries of each type at each discharging current and at each temperature. However, in these three measurements, the capacity differed by more than 5%. Then additional training cycles were carried out to stabilize the capacity of the batteries. If the additional training cycles did not fix the problem, one or several troublesome batteries were replaced with other, more stable batteries.
Fourthly, before changing each of the discharging currents or the temperature of the batteries, three training cycles were fulfilled (Table 1). This method allowed for the exclusion of the mutual influence of some measuring discharge cycles on other discharge cycles. However, if the measured capacity of the batteries in these three training cycles differed by more than 5%, some additional training cycles were performed.
Fifthly, the tables below show the average values of three measurements for three batteries of the same type at a certain discharge current or a certain temperature.
It should be noted that a value of a measured capacity of batteries of the same type at the same discharge current and the same temperature is influenced by many random factors related to both the batteries’ manufacturing processes and the process of their discharge. Upon that, the difference in the measured released capacity between the same batteries (for batteries of various electrochemical systems) can reach 1–2% and sometimes even more. For lithium-ion batteries, this unavoidable statistical dispersion is typically well below 1%, unless the batteries differ greatly in the number of charge–discharge cycles. That is why, it is important to study the experimental curves in the standardized coordinates (C/Cm, i/Cm) and not in the ordinary coordinates (C, i); the noted random factors will be eliminated to a large extent. This is associated with the fact that also the top capacities Cm are found experimentally for each specific battery. To use this method, it is possible to find experimental curves that are more reliable.

4. Results

A battery’s released capacity depends on two parameters: a discharging current and a battery temperature [9,10].

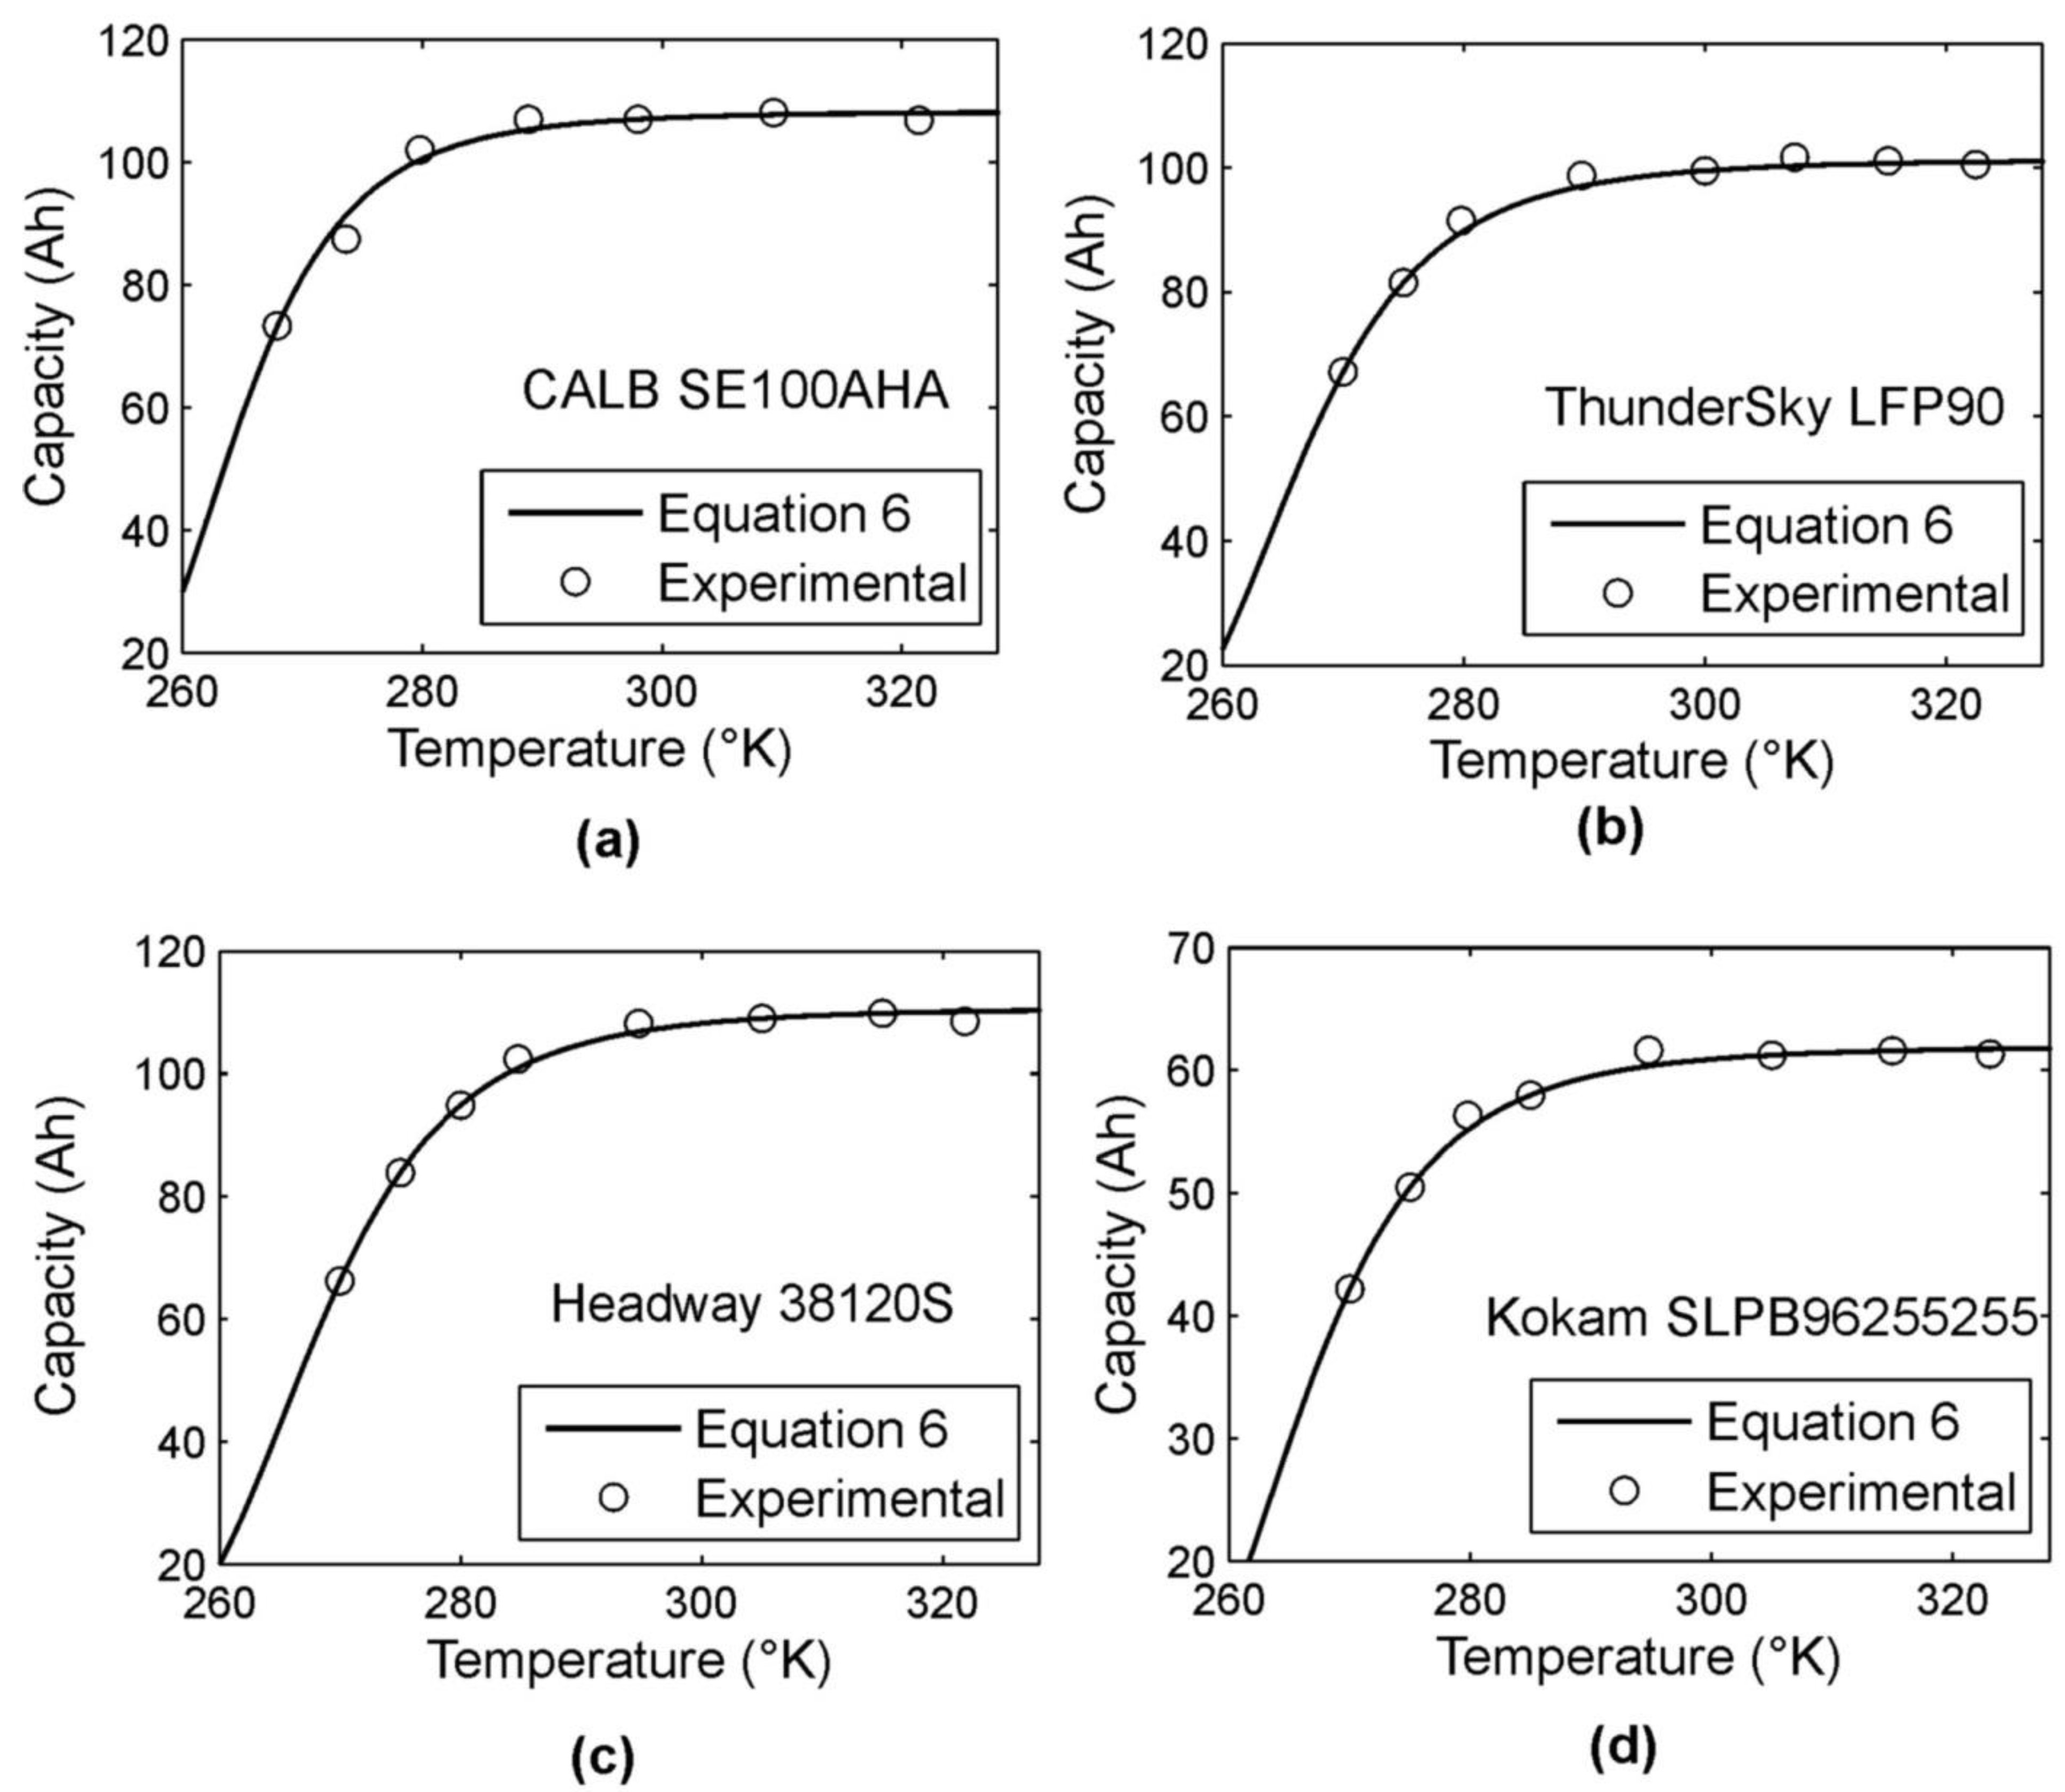
4.1. Studying of Dependence of Released Capacity on a Battery’s Temperature

For batteries cycling at different temperatures, the climatic chamber Binder MK240 was used (Binder GmbH, Tuttlingen, Germany). Before each measurement, a battery was kept in the climatic chamber for five hours so that the entire battery’s temperature reached the required temperature measurement. The measurements were conducted at discharging currents according to Table 1. The obtained experimental results are represented in Figure 2.
For finding the optimal parameters of Equation (6) according to the experimental data obtained, the least square method was used as well as the Levenberg–Marquardt optimization procedure. The obtained optimal values of the parameters of Equation (6) are given in Table 2.
From Figure 2, it can be seen that the relative deviation of the capacity from the average value in the temperature range from 25 °C to 55 °C is less than 1%. Hence, when studying the battery’s released capacity dependence on the discharge current in this temperature range, the temperature influence can be ignored.

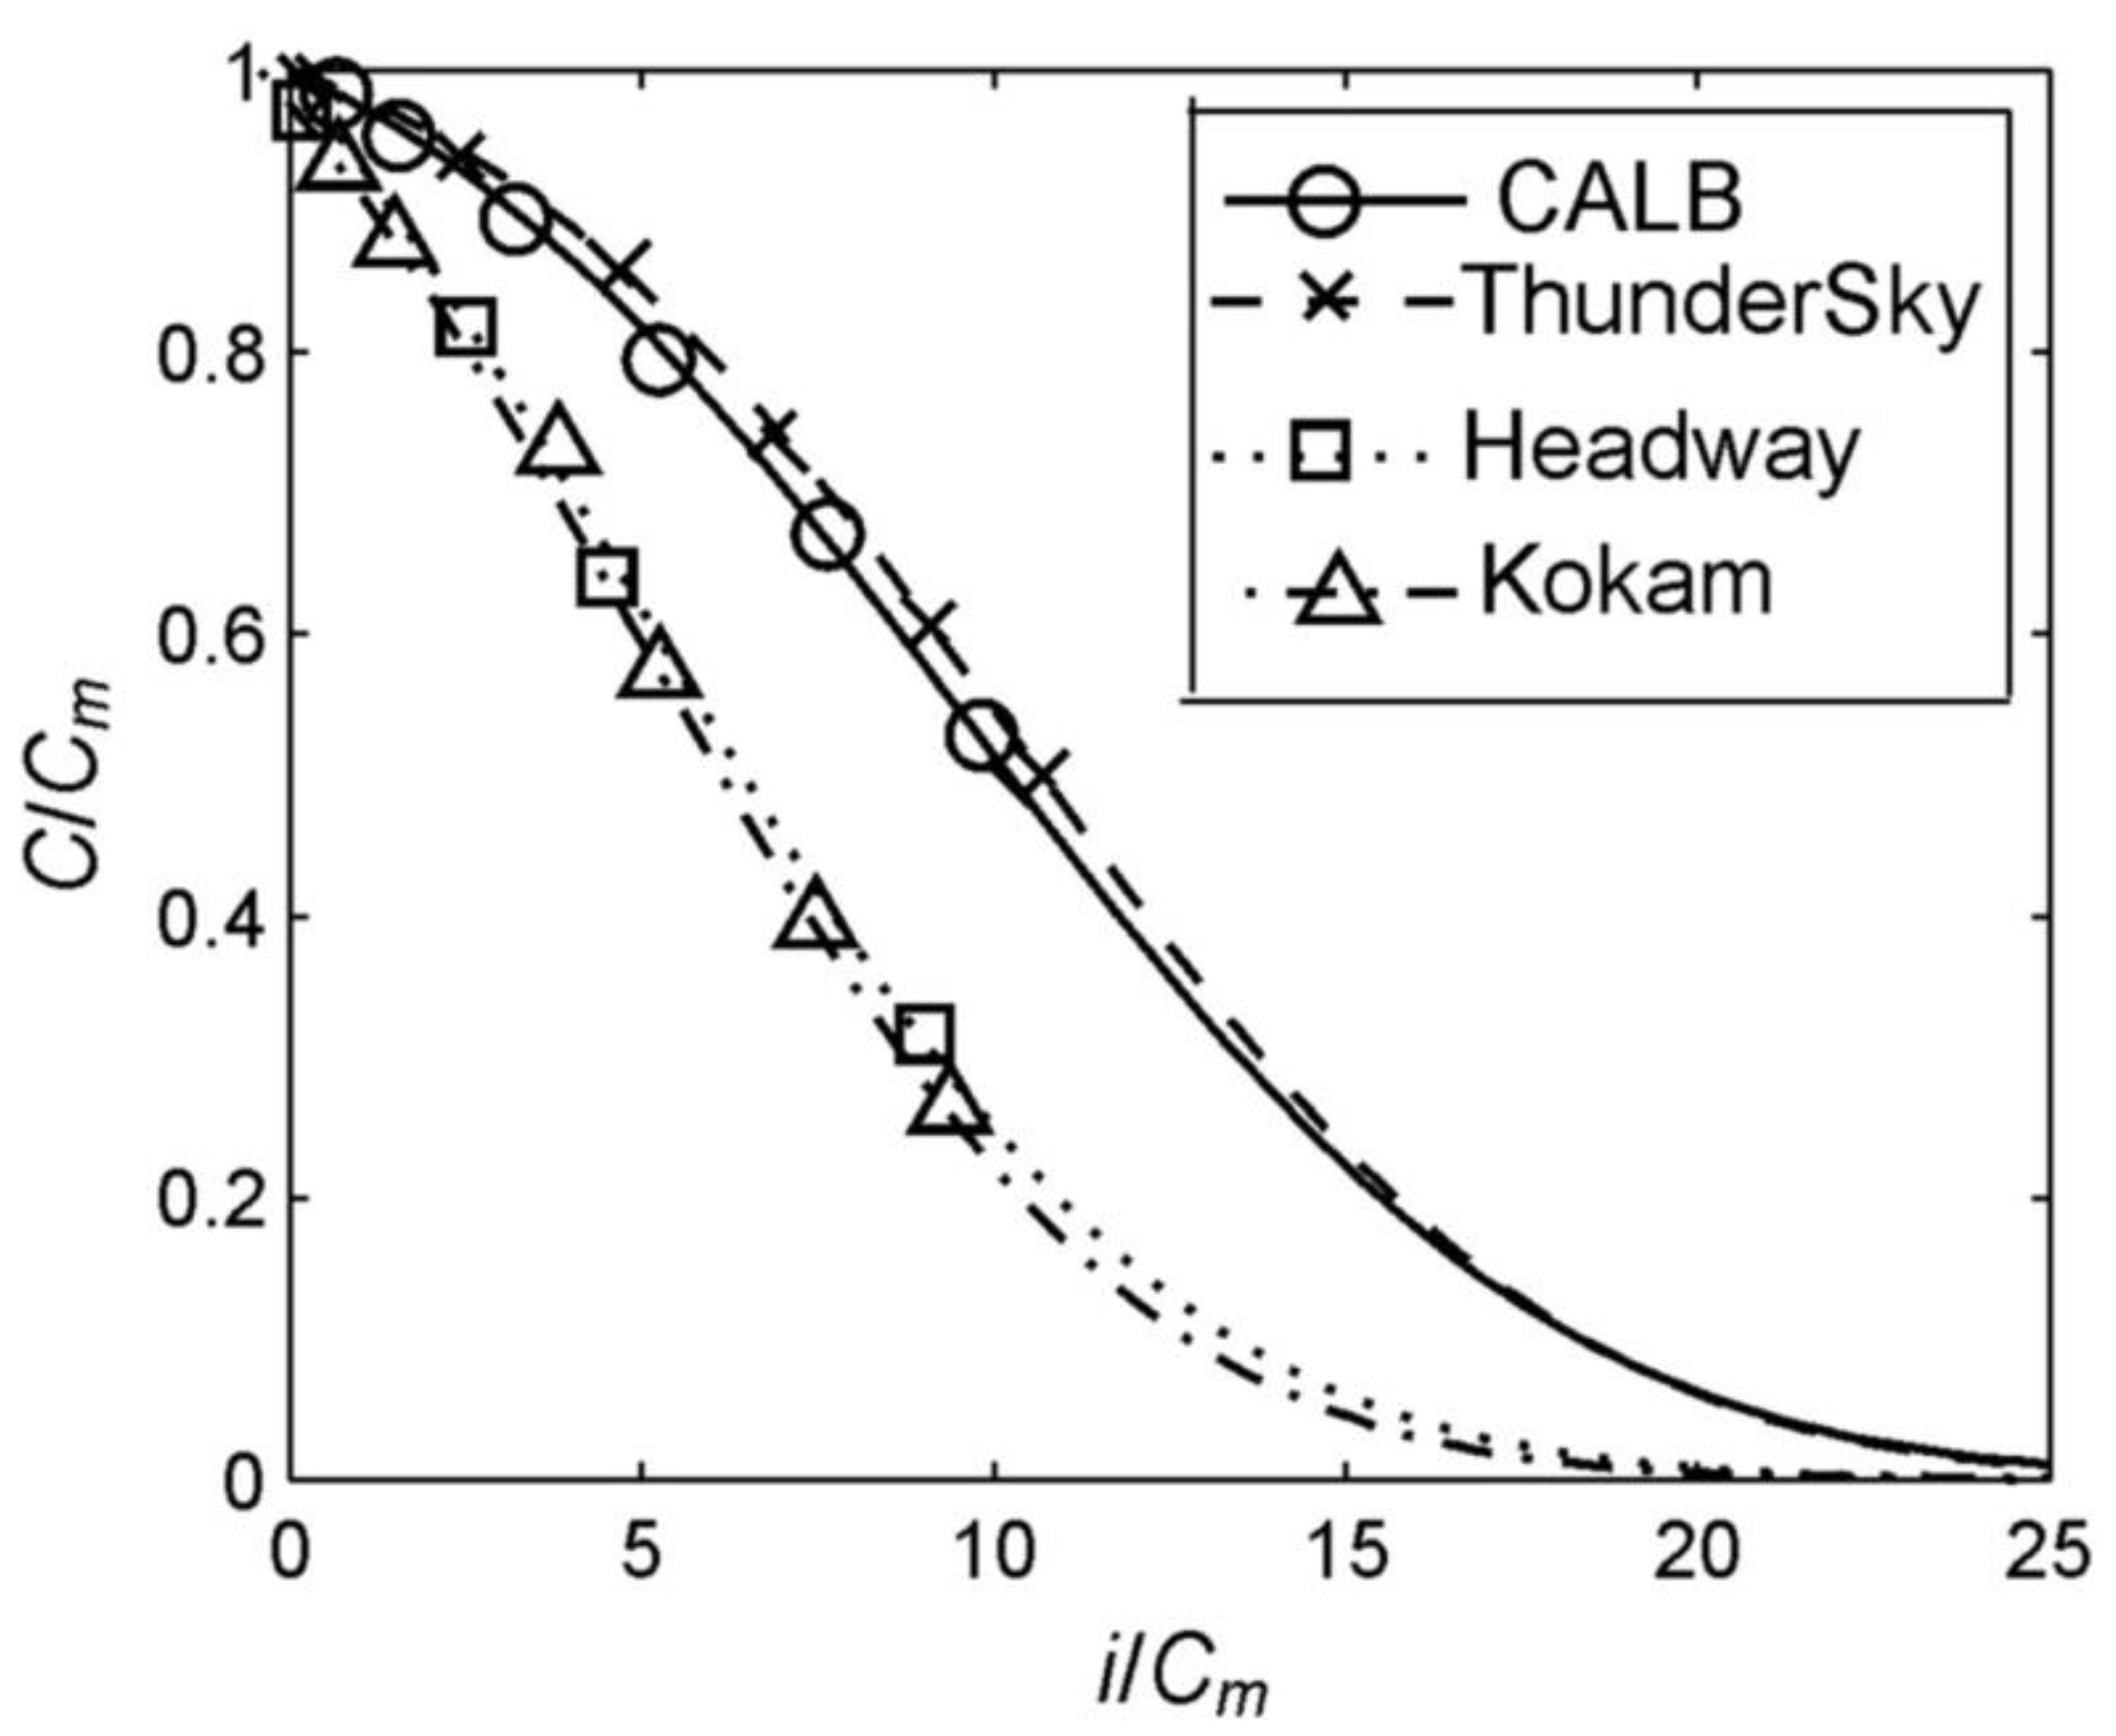
4.2. Studying of Dependence of Batteries’ Released Capacity on Discharging Current

The batteries were cycled at the temperature of T = 25 °C inside of the climatic chamber Binder MK240 (BINDER GmbH, Tuttlingen, Germany). In addition, in order to strengthen the heat exchange and the batteries’ cooling down, some heat sinks were attached to the batteries from all sides. The heat sinks were attached with the use of special clamps and the heat-conducting paste MX-2 (ARTIC). As a result, in all our experiments, the battery’s temperature was lower than 50 °C. It was possible to discharge the batteries at high currents as the batteries had no protection.
The batteries were discharged by the currents from 0.2 Cn to 10 Cn. The results of our experimental studies are represented in Figure 3 in standardized coordinates (C/Cm, i/Cm). The parameter Cm is taken from Table 3.
The optimal parameters for Equations (10)–(12) were found using the least square method and the Levenberg–Marquardt optimization procedure. The optimal parameters found are represented in Table 3.
In Figure 3, the experimental data is approximated by Equation (12) as this equation has the smallest approximation error (Table 3).

5. Discussion

From the obtained results (Table 3), it follows that Equations (10)–(12) can be used in analytical models of batteries because these equations approximate any experimental data with a relative error of less than 5%. As a rule, in practical estimations of batteries’ remaining capacity, such an error is acceptable [9]. However, it should be noted that, among others, Equation (12) has the smallest approximation error of the experimental data, i.e., it corresponds to the experimental data best of all. Additionally, Equation (12) has a statistical basis, while Equations (10) and (11) are just empirical equations.
Any process of batteries discharging is a phase transition of the active substance of the electrodes; this phase transition goes from the phases corresponding to the charged state of the batteries to the phases corresponding to the discharged state of the batteries. Often, however, the phase transitions [34] are described by the complementary error function (9), which is based on the normal distribution law.
Undoubtedly, the phase transition at the level of molecules and ions is a statistical process because the discharge process, which takes place at the boundary between the active substance of the electrodes and the electrolyte, is described by the Butler–Volmer statistical function with an exchange current j0. That is why it is not surprising that the generalized Peukert equation is described perfectly by a statistical function (namely, by the complementary error Function (9)).
The conducted research shows that the Hausmann analytical Model (1) can be improved significantly by taking into account the Peukert statistical Equation (12) and Equation (6). Indeed, in this case, instead of Equation (4), we obtain the following equation, well-grounded by experiments:
C ( i , T ) = ( C m r e f e r f c ( n ) e r f c ( i / i k 1 1 / n ) ) K γ ( T T k T r e f T k ) β ( K 1 ) + ( T T k T r e f T k ) β
Now, considering Equation (3), for the effective current Ieff(i,T) (1) in the Hausmann model [9], we obtain the following improved equation:
I e f f ( i , T ) = i γ e r f c ( n ) e r f c ( i / i k 1 1 / n ) ( 1 + ( T r e f T k T T k ) β ( K 1 ) ) ,   C m = C mref K
It should be noted that direct testing of the Hausmann Model (1) using both the classical Peukert equation (taking into account temperature) (4) and the generalized Peukert equation, proposed by us (taking into account temperature) (17), requires the same time for calculation, since Equations (4) and (17) are simple analytic functions. The calculation of any analytical function does not lead to an increase in the calculation time, in contrast to the time of solving the partial differential equations in electrochemical models of batteries [6,7,8].

6. Conclusions

Equations (10)–(12) have a number of advantages over the classical Peukert Equation (2).
Firstly, these equations (for the automotive-grade lithium-ion batteries) are true for discharge currents from 0 to 10 Cn, while the classical Peukert Equation (2) is true only in the range of discharge currents from 0.2 Cn to 2 Cn [35].
Secondly, all the parameters (Cm, n, i0 or ik) in Equations (10)–(12) have a clear physical meaning, whereas in the classical Peukert Equation (2), the parameters (A, n) are just empirical constants.
Thirdly, Equation (12) has a clear statistical meaning, whereas Equations (1), (10) and (11) are just empirical equations.
The Peukert Equation (2) is used in many analytical models [9,10,23,36,37,38], and that is why it is better to understand the electrochemical meaning of this equation, and its refinement is of great practical importance.

Author Contributions

Conceptualization, N.N.Y.; methodology, N.E.G.; software, M.S.L.; validation, N.N.Y.; formal analysis, M.S.L.; data curation, D.N.G.; visualization, N.N.Y.; supervision, D.N.G.; project administration, D.N.G. All authors have read and agreed to the published version of the manuscript.

Funding

This research received no external funding.

Institutional Review Board Statement

Not applicable.

Informed Consent Statement

Not applicable.

Data Availability Statement

Not applicable.

Conflicts of Interest

The authors declare no conflict of interest.

References

  1. Blomgren, G.E. The Development and Future of Lithium Ion Batteries. J. Electrochem. Soc. 2017, 164, A5019–A5025. [Google Scholar] [CrossRef]
  2. Zubi, G.; Dufo-López, R.; Carvalho, M.; Pasaoglu, G. The lithium-ion battery: State of the art and future perspectives. Renew. Sustain. Energy Rev. 2018, 89, 292–308. [Google Scholar] [CrossRef]
  3. Lipu, M.S.H.; Hannan, M.A.; Hussain, A.; Hoque, M.M.; Ker, P.J.; Saad, M.H.M.; Ayob, A. A review of state of health and remaining useful life estimation methods for lithium-ion battery in electric vehicles: Challenges and recommendations. J. Clean. Prod. 2018, 205, 115–133. [Google Scholar] [CrossRef]
  4. Kim, S.U.; Albertus, P.; Cook, D.; Monroe, C.W.; Christensen, J. Thermoelectrochemical simulations of performance and abuse in 50-Ah automotive cells. J. Power Sources 2014, 268, 625–633. [Google Scholar] [CrossRef]
  5. Hannan, M.A.; Lipu, M.S.H.; Hussain, A.; Mohamed, A. A review of lithium-ion battery state of charge estimation and management system in electric vehicle applications: Challenges and recommendations. Renew. Sustain. Energy Rev. 2017, 78, 834–854. [Google Scholar] [CrossRef]
  6. Arunachalam, H.; Onori, S.; Battiato, I. On Veracity of Macroscopic Lithium-Ion Battery Models. J. Electrochem. Soc. 2015, 162, A1940–A1951. [Google Scholar] [CrossRef]
  7. Fan, G.; Pan, K.; Canova, M.; Marcicki, J.; Yang, X.G. Modeling of Li-Ion cells for fast simulation of high C-rate and low temperature operations. J. Electrochem. Soc. 2016, 163, A666–A676. [Google Scholar] [CrossRef]
  8. Cugnet, M.; Laruelle, S.; Grugeon, S.; Sahut, B.; Sabatier, J.; Tarascon, J.-M.; Oustaloup, A. A mathematical model for the simulation of new and aged automotive lead-acid batteries. J. Electrochem. Soc. 2009, 156, A974–A985. [Google Scholar] [CrossRef]
  9. Hausmann, A.; Depcik, C. Expanding the Peukert equation for battery capacity modeling through inclusion of a temperature dependency. J. Power Sources 2013, 235, 148–158. [Google Scholar] [CrossRef]
  10. Galushkin, N.E.; Yazvinskaya, N.N.; Galushkin, D.N. Generalized analytical model for capacity evaluation of automotive-grade lithium batteries. J. Electrochem. Soc. 2015, 162, A308–A314. [Google Scholar] [CrossRef]
  11. Feng, F.; Lu, R.; Wei, G.; Zhu, C. Online estimation of model parameters and state of charge of LiFePO4 batteries using a novel open-circuit voltage at various ambient temperatures. Energies 2015, 8, 2950–2976. [Google Scholar] [CrossRef]
  12. Tremblay, O.; Dessaint, L.A. Experimental validation of a battery dynamic model for EV applications. World Electr. Veh. J. 2009, 3, 289–298. [Google Scholar] [CrossRef]
  13. Chen, M.; Rincon-Mora, G.A. Accurate electrical battery model capable of predicting runtime and I-V performance. IEEE Trans. Energy Convers. 2006, 21, 504–511. [Google Scholar] [CrossRef]
  14. Perez, H.E.; Hu, X.; Dey, S.; Moura, S.J. Optimal charging of Li-ion batteries with coupled electro-thermal-aging dynamics. IEEE Trans. Power Electron. 2017, 66, 7761–7770. [Google Scholar] [CrossRef]
  15. Zou, Y.; Hu, X.; Ma, H.; Li, S.E. Combined State of Charge and State of Health estimation over lithium-ion battery cell cycle lifespan for electric vehicles. J. Power Sources 2015, 273, 793–803. [Google Scholar] [CrossRef]
  16. Kong, D.; Wang, G.; Ping, P.; Wen, J. A coupled conjugate heat transfer and CFD model for the thermal runaway evolution and jet fire of 18650 lithium-ion battery under thermal abuse. eTransportation 2022, 12, 100157. [Google Scholar] [CrossRef]
  17. Golubkov, A.W.; Fuchs, D.; Wagner, J.; Wiltsche, H.; Stangl, C.; Fauler, G.; Voitic, G.; Thalera, A.; Hackere, V. Thermal-runaway experiments on consumer Li-ion batteries with metal-oxide and olivin-type cathodes. RSC Adv. 2014, 4, 3633–3642. [Google Scholar] [CrossRef]
  18. Cheng, Q.; Sun, D.; Yu, X. Metal hydrides for lithium-ion battery application: A review. J. Alloys Compd. 2018, 769, 167–185. [Google Scholar] [CrossRef]
  19. Oumellal, Y.; Rougier, A.; Nazri, G.A.; Tarascon, J.-M.; Aymard, L. Metal hydrides for lithium-ion batteries. Nat. Mater. 2008, 7, 916–921. [Google Scholar] [CrossRef]
  20. Ponrouch, A.; Bitenc, J.; Dominko, R.; Lindahl, N.; Johansson, P.; Palacin, M.R. Multivalent rechargeable batteries. Energy Storage Mater. 2019, 20, 253–262. [Google Scholar] [CrossRef]
  21. Coleman, M.; Lee, C.K.; Zhu, C.; Hurley, W.G. State-of-charge determination from EMF voltage estimation: Using impedance, terminal voltage, and current for lead-acid and lithium-ion batteries. IEEE Trans. Ind. Electron. 2007, 54, 2550–2557. [Google Scholar] [CrossRef]
  22. Rakhmatov, D.; Vrudhula, S.; Wallach, D.A. A model for battery lifetime analysis for organizing applications on a pocket computer. IEEE Trans. Very Large Scale Integr. (VLSI) Syst. 2003, 11, 1019–1030. [Google Scholar] [CrossRef]
  23. Omar, N.; Daowd, M.; Van den Bossche, P.; Hegazy, O.; Smekens, J.; Coosemans, T.; van Mierlo, J. Rechargeable energy storage systems for plug-in hybrid electric vehicles—Assessment of electrical characteristics. Energies 2012, 5, 2952–2988. [Google Scholar] [CrossRef]
  24. He, W.; Williard, N.; Chen, C.; Pecht, M. State of charge estimation for electric vehicles batteries using unscented Kalman filtering. Microelectron. Reliab. 2013, 53, 840–847. [Google Scholar] [CrossRef]
  25. Han, J.; Kim, D.; Sunwoo, M. State-of-charge estimation of lead-acid batteries using an adaptive extended Kalman filter. J. Power Sources 2009, 188, 606–612. [Google Scholar] [CrossRef]
  26. He, H.; Zhang, X.; Xiong, R.; Xu, Y.; Guo, H. Online model-based estimation of state-of-charge and open-circuit voltage of lithium-ion batteries in electric vehicles. Energy 2012, 39, 310–318. [Google Scholar] [CrossRef]
  27. He, Y.; Liu, X.T.; Zhang, C.B.; Chen, Z.H. A new model for State-of-Charge (SOC) estimation for high-power Li-ion batteries. Appl. Energy 2013, 101, 808–814. [Google Scholar] [CrossRef]
  28. Buchmann, I. Batteries in a Portable World; Cadex Electronics Inc.: Richmond, BC, Canada, 2016. [Google Scholar]
  29. Galushkin, N.E.; Yazvinskaya, N.N.; Ruslyakov, D.V.; Galushkin, D.N. Analysis of Peukert and Liebenow Equations Use for Evaluation of Capacity Released by Lithium-Ion Batteries. Processes 2021, 9, 1753–1763. [Google Scholar]
  30. Peukert, W. About the dependence of the capacity of the discharge current magnitude and lead acid batterie. Elektrotech. Z. 1897, 20, 287–288. [Google Scholar]
  31. Pilatowicz, G.; Budde-Meiwes, H.; Schulte, D.; Kowal, J.; Zhang, Y.; Du, X.; Salman, M.; Gonzales, D.; Alden, J.; Sauer, D.U. Simulation of SLI lead-acid batteries for SoC, aging and cranking capability prediction in automotive applications. J. Electrochem. Soc. 2012, 159, A1410–A1419. [Google Scholar] [CrossRef]
  32. Herstedt, M.; Abraham, D.P.; Kerr, J.B.; Edstrom, K. X-ray photoelectron spectroscopy of negative electrodes from high-power lithium-ion cells showing various levels of power fade. Electrochim. Acta 2004, 49, 5097–5110. [Google Scholar] [CrossRef]
  33. Galushkin, N.E.; Yazvinskaya, N.N.; Galushkin, D.N. Analysis of generalized Peukert’s equations for capacity calculation of lithium-ion cells. J. Electrochem. Soc. 2020, 167, 013535. [Google Scholar] [CrossRef]
  34. Pitaevskii, L.P.; Lifshitz, E.M. Physical Kinetics; Pergamon Press: Oxford, UK, 1981; Volume 10, pp. 522–527. [Google Scholar]
  35. Yazvinskaya, N.N.; Lipkin, M.S.; Galushkin, N.E.; Galushkin, D.N. Peukert Generalized Equations Applicability with Due Consideration of Internal Resistance of Automotive-Grade Lithium-Ion Batteries for Their Capacity Evaluation. Energies 2022, 15, 2825. [Google Scholar] [CrossRef]
  36. Cugnet, M.G.; Dubarry, M.; Liaw, B.Y. Peukert’s Law of a Lead-Acid Battery Simulated by a Mathematical Model. ECS Trans. 2010, 25, 223–233. [Google Scholar] [CrossRef]
  37. Doerffel, D.; Sharkh, S.A. A critical review of using the Peukert equation for determining the remaining capacity of lead-acid and lithium-ion batteries. J. Power Sources 2006, 155, 395–400. [Google Scholar] [CrossRef]
  38. Omar, N.; van den Bossche, P.; Coosemans, T.; Mierlo, J.V. Peukert Revisited—Critical Appraisal and Need for Modification for Lithium-Ion Batteries. Energies 2013, 6, 5625–5641. [Google Scholar] [CrossRef]
Figure 1. Comparison of curves for functions fun1(n) and fun2(n).
Batteries 08 00118 g001
Figure 2. Comparison between Equation (6) and the experimental data for automotive-grade lithium-ion batteries: (a) batteries CALB SE100AHA; (b) batteries ThunderSky LFP90; (c) batteries Headway 38120S; (d) batteries Kokam SLPB96255255.
Batteries 08 00118 g002
Figure 3. Comparison between experimental data for automotive-grade lithium-ion batteries and Equation (12). Value Cm is taken from Table 3 for each battery.
Batteries 08 00118 g003
Table 1. Parameters of automotive-grade lithium-ion batteries used in the experiments.
ModelSE100AHALFP9038120SSLPB96255255
ManufacturerCALBThunderSkyHeadwayKokam
Cathode materialLiFePO4LiFePO4LiFePO4LiCoO2
Structureprismatic
battery
prismatic
battery
cylindrical battery package (1S10P)pouch
battery
Nominal capacity (Ah)1009010060
Charge current (A)40404030
Upper cutoff (V)3.604.253.654.20
End current (A)2.52.252.51.5
Lower cutoff (V)2.502.502.002.70
Discharge current (for training cycles) (A)20182012
Table 2. Optimal values of parameters for Equation (6).
ParametersCALB
LiFePO4
ThunderSky
LiFePO4
Headway
LiFePO4
Kokam LiCoO2
Cn (Ah)1009010060
Cmref (Ah)107.0599.18107.7460.72
Tref (°K)298298298298
Tk (°K)240239238237
β5.104.955.115.13
K1.0101.0211.0271.020
δ (%) 11.81.81.71.9
1 Relative error of experimental data approximation with Equation (6) in Figure 2.
Table 3. Optimal values of parameters of Equations (10)–(12).
ParametersCALB
LiFePO4
ThunderSky
LiFePO4
Headway
LiFePO4
Kokam LiCoO2
Equation (10)
Cn (Ah)1009010060
Cm (Ah)106.95104.59107.8259.42
i0or ik (A)1107.821088.23692.93396.04
n1.8671.8721.9822.130
δ (%) 12.32.22.42.3
Equation (11)
Cm (Ah)106.85104.55107.2059.06
i0or ik (A)1140.231075.35683.30392.61
n1.0030.9981.171.255
δ (%) 13.23.43.33.4
Equation (12)
Cm (Ah)107.88105.05110.7461.285
i0 or ik (A)1039.261084.57524.67321.90
n1.0371.1870.5470.653
δ (%) 11.71.81.91.8
1 Relative error of experimental data approximation with Equation (12) in Figure 3.
Publisher’s Note: MDPI stays neutral with regard to jurisdictional claims in published maps and institutional affiliations.

